Article

Evaluation of High-Loaded Ni-Based Catalysts for Upgrading Fast Pyrolysis Bio-Oil

1
Institute of Catalysis Research and Technology (IKFT), Karlsruhe Institute of Technology (KIT), 76344 Eggenstein-Leopoldshafen, Germany
2
Institute for Chemical Technology and Polymer Chemistry (ITCP), Karlsruhe Institute of Technology (KIT), 76131 Karlsruhe, Germany
*
Author to whom correspondence should be addressed.
Catalysts 2019, 9(9), 784; https://doi.org/10.3390/catal9090784
Submission received: 19 August 2019 / Revised: 11 September 2019 / Accepted: 12 September 2019 / Published: 19 September 2019
(This article belongs to the Special Issue Catalytic Fast Pyrolysis)

Abstract

:
The catalytic activity of high-loaded Ni-based catalysts for beech wood fast-pyrolysis bio-oil hydrotreatment is compared to Ru/C. The influence of promoter, temperature, reaction time, and consecutive upgrading is investigated. The catalytic activity is addressed in terms of elemental composition, pH value, H2 consumption, and water content, while the selectivity is based on the GC-MS/FID results. The catalysts showed similar deoxygenation activity, while the highest hydrogenation activity and the highest upgraded oil yields were obtained with Ni-based catalysts. The elemental composition of upgraded oils was comparable for 2 and 4 h of reaction, and the temperature showed a positive effect for reactions with Ni–Cr and Ru/C. Ni–Cr showed superior activity for the conversion of organic acids, sugars and ketones, being selected for the 2-step upgrading reaction. The highest activity correlates to the strength of the acid sites promoted by Cr2O3. Consecutive upgrading reduced the content of oxygen by 64.8% and the water content by 90%, whereas the higher heating value increased by 90.1%. While more than 96% of the organic acid content was converted, the discrepancy of aromatic compounds quantified by 1H-NMR and GC-MS/FID may indicate polymerization of aromatics taking place during the second upgrading step.

1. Introduction

Biomass is the only renewable carbon carrier and may contribute to sustainable fuels and chemical production even on relatively short terms. Lignocellulosic biomass provides by far the largest mass potential of bio-feedstock for conversion into chemical, fuels, and energy within a biorefinery [1,2].
Principally, two strategies can be applied to lignocellulosic material depending on the specific feedstock applied and products desired. It can be split into its main constituents (cellulose, hemicellulose, and lignin) and then converted separately. The high yields of carbohydrates suggest their use in biotechnological or fine chemical applications, while lignin can be used energetically or may be converted to derive bio-aromatics. Alternatively, the whole lignocellulosic feedstock may be decomposed thermally either to liquids at temperatures typically between 350 and 500 °C by fast pyrolysis, hydrothermal liquefaction, and hydrosolvolysis or to synthesized gas at temperatures of 800 °C or above. From syngas, clean fuels and chemical can be produced, which are therefore often referred to as indirect liquefaction [3,4].
Among the direct thermal liquefaction processes, fast pyrolysis is the most developed one. The process is conducted in an anoxic atmosphere, typically at temperatures around 500 °C. The specific feature to yield high amounts of liquid condensate(s) is rapid heating up of the biomass ground to mm-size, short reaction time, and instant cooling down of the products at an overall residence of a few seconds only [5]. Fast pyrolysis can be considered state-of-the art today, with commercially operated plants in USA, Canada, the Netherland, and Finland. However, they all have in common the use of wood as feedstock while bio-oil is applied as the heating oil. Recent developments aim at the extension of the feedstock range, including ash-rich materials, which are more difficult to process, and new applications, e.g., as co-feed in a crude oil refinery or for gasification. In all cases, the produced bio-oil needs to be conditioned or requires catalytic upgrading to meet the specifications for downstream processing.
Fast pyrolysis bio-oil (FPBO) is a mixture of hundreds of oxygenated organic compounds including ketones, aldehydes, carboxylic acids, carbohydrates, and phenolic derivative compounds and contains considerable amounts of water, ca. 15–35 wt.% [6,7]. The presence of oligomers, high concentration of water, and carboxylic acids are the main points to be improved [8].
Analogous to the hydrotreatment performed in petroleum refineries, where heteroatoms such as sulfur and nitrogen are removed by catalytic conversion, FPBO can also be subjected to hydrotreatment [8]. However, due to the significant differences in petroleum and FPBO composition, the reaction conditions applied in petroleum refineries cannot be simply transferred to FPBO upgrading [9]. Different conditions of temperature, pressure, and especially catalyst resistance to high water concentration and high acidity are required [10]. Furthermore, in the case of FBPO, oxygen is the main heteroatom to be removed, usually corresponding to 35 to 50 wt.% of the pyrolysis oil composition [9]. Sulfur and nitrogen are also constituents of FPBO but in smaller amounts, usually in the range of 0.02 wt.% to 0.3 wt.% for sulfur [8,11,12] and around 0.1 wt.% to 1.2 wt.% for nitrogen [9,11,12], depending of the biomass pyrolyzed.
During hydrotreatment, FBPO is reacted at temperatures usually between 170 °C and 400 °C [12] and hydrogen pressure is in the range of 80–200 bar [9,13] in the presence of supported heterogeneous metallic catalysts [14]. Throughout the hydrotreatment, desired and undesired reactions take place. Reactive compounds such as ketones, aldehydes, furans, and sugars are hydrodeoxygenated, and the oxygen is removed in the form of water and carbon dioxide; double bonds are hydrogenated, and oligomers are fragmented [10]. Upgraded oil typically shows reduced concentrations of oxygen, lower viscosity due to the cracking of oligomers, higher pH value due to conversion of carboxylic acids, and greater stability due to the conversion of reactive functional groups [15].
However, undesired reactions may occur, e.g., polymerization of fragments formed by pyrolysis [16] and methane formation due to hydrocracking and methanation [7,17]. In addition, coke deposition on the spent catalyst due to polycondensation and polymerization has been observed [8]. Consequently, the selection or development of appropriate catalysts must minimize undesired reactions, whereas desired pathways need to be accelerated.
Due to the increased interest in catalytic upgrading of fast pyrolysis bio-oils, a variety of catalysts have been evaluated in the last years. Noble metal catalysts such as ruthenium [18,19,20,21,22], palladium [16,23,24,25,26], and platinum [27,28] were used in the early studies, whereas newer studies apply lower cost transition metal catalysts. The selection of the catalyst is a crucial step, considering that the catalyst should be resistant to water, stable in an acid environment, resistant to poisons, and active to hydrodeoxygenation with minimum consumption of hydrogen [29]. Moreover, the catalyst should be resistant to coke deposition and stable in consecutive reuses [7,13].
Among a variety of metallic catalysts available, Ni-based ones are interesting in terms of high activity versus relatively low cost [30,31]. Additionally, high hydrodeoxygenation activity with low hydrogen consumption is attributed to Ni-based catalysts [32]. If the right support material is selected, high resistance to water is also obtained. For example, supports such as γ-Al2O3 can be converted to boehmite due to the high concentration of H2O in the pyrolysis oil, resulting in loss of surface area [33]. Some of the previous studies have used Ni-based catalysts with different metal loadings [34,35], different solid support materials [6,13,31,32,36], as well as different feedstocks [11,37]. In terms of metal loading, Boscagli et al. [32] observed higher yields of upgraded oil and lower gas formation using Ni-based catalysts with Ni loading in the range of 20–22 wt.% in comparison to catalysts with Ni loading in the range of 3.2–5.8 wt.%. Ardiyanti et al. [38] reported that Ni-based catalysts with 58 wt.% of Ni loading and with Pd and Cu as promoters showed superior performance compared to catalysts with lower concentrations of Ni (29–37 wt.%). The Ni-based catalyst with 58 wt.% of Ni loading promoted by 0.7 wt.% of Pd showed the highest activity, lowest oxygen content, and lowest char formation tendency and resulted in solubility of the upgraded oil in hydrocarbons. Furthermore, both high-loading Ni-based catalysts (58 wt.%) with Cu and Pd as promoters resulted in the highest H/C ratios of upgraded oils, considered a parameter as important as the O/C ratio for hydrotreatment reactions. Jahromi and Agblevor [35] observed a significant increase in the liquid yields from 26.1% to 68.6%, a reduction in the coke yield from 34.5% to 4.2%, and lower gas yields from 35.2% to 16.4% by increasing the Ni loading from 10 wt.% to 40 wt.% in red-mud-supported catalyst formulation. In addition, the hydrogen content in the upgraded oil was increased to 15.83 wt.% with 40 wt.% of Ni in contrast to 9.56 wt.% with 10 wt.% of Ni, while the oxygen was reduced from 19.72 wt.% to 1.35 wt.%, respectively.
However, the biggest challenges already reported using an Ni-based catalyst are related to the degree of deoxygenation achievable as well as to deactivation due to poisonous substances such as sulfur [11], coke deposition [31], and active metal leaching [39].
In order to overcome these limitations, the addition of promoters and the sequential hydrotreatment applying different catalysts, each one with a specific purpose [7,10,16,40], can be adopted. Promoters included in the catalyst formulation are reported to play a role in hydrodeoxygenation [7] as well as in increasing the resistance to poisonous substances [41]. Copper, iron, molybdenum, tungsten, and phosphorous [6,7,32] are some of the promoters added to Ni-based catalysts in order to improve H2 spillover (Cu) and C–O activation while C–C cleavage is inhibited (Cu and Fe), to reduce coke formation (Cu), to suppress sintering and activate oxygenated compounds (Mo), as well as to facilitate the C–O bond cleavage (P) [7,30,42,43].
Also, the inclusion of promoters in catalyst formulation in order to increase the resistance of Ni-based catalysts in relation to sulfur should be addressed. As previously presented, sulfur deactivates Ni-based catalysts even in low concentrations [37]. Although the application of sulfided NiMo catalysts is usually considered a possibility to avoid sulfur deactivation, it requires an external source of sulfur, increasing the complexity and cost of the treatment [31,35].
One alternative is the addition of chromium promoters. Gómez-Cazalilla et al. [41] reported increased sulfur tolerance and catalytic activity during hydrotreatment of tetralin in the presence of dibenzothiophene. Additionally, Cr2O3 has been reported as a structural promoter, preventing sintering [44,45], and has been used in catalyst formulations for hydrogenation of carbonyl groups [46], usually attributed to bio-oil instability [14].
Another attractive possibility is sequential upgrading, which has been found to reduce the formation of coke [47], responsible for clogging the reactor during the upgrading reaction in continuously operated reactors. Additionally, higher deoxygenation degrees during 2-step upgrading compared to during 1-step upgrading has been observed. Usually, in this 2-step hydrotreatment, the first step is conducted at lower temperatures [14,40,48,49], aiming at the conversion of reactive compounds, whereas the second step is performed at higher temperatures to hydrodeoxygenate the bio-oil [47]. The first step is referred to as the stabilization step, where compounds related to bio-oil instability are converted, whereas in the second step, a deep hydrodeoxygenation is performed [8,43,50]. Different catalysts and temperatures are usually used. For example, French et al. [47] suggested that the application of a ruthenium-based catalyst in the first step followed by nickel or platinum may result is reduced formation of coke and higher degrees of deoxygenation in the final product.
Therefore, in the present work, two catalysts with high loading of nickel are evaluated for upgrading of fast pyrolysis bio-oil. Previous studies have reported higher yields of liquid products and minimized production of coke and gas with high-loading Ni-based catalysts, motivating the current study. The influence of Cr2O3 as a promoter and its influence on selectivity and activity are addressed and compared to the Ru/C catalyst. Additionally, the beneficial role of 2-step upgrading with respect to the quality of the final upgraded oil is investigated and compared to 1-step upgrading.

2. Results

In this section, the results of the upgrading of beech wood fast pyrolysis bio-oil (BWBO, see Section 3.1) with Ru/C, an Ni catalyst, and an Ni–Cr catalyst (See Section 3.2) are presented. The performance of the catalysts in terms of upgraded oil yield; carbon, hydrogen, and oxygen concentration; as well as reaction pathways and chemical composition of upgraded products is discussed. The influence of temperature (175 °C and 225 °C) and the reaction times of 2 and 4 h are evaluated. The attempt to reach deep levels of deoxygenation is presented by performing 2-step upgradings using a previously upgraded pyrolysis oil (UBWBO). This oil is the same BWBO which underwent a first hydrodeoxygenation step over Ni/SiO2 with 7.9 wt.% Ni loading, 8 MPa of H2, and 325 °C for 2 h (details given in Section 3.1 and in the Supplementary Material Section S.1). In addition, the composition of gas and upgraded aqueous phase is discussed while Ni-based catalysts are characterized before and after the upgrading reactions.

2.1. Hydrotreatment Reactions: Catalytic Performance

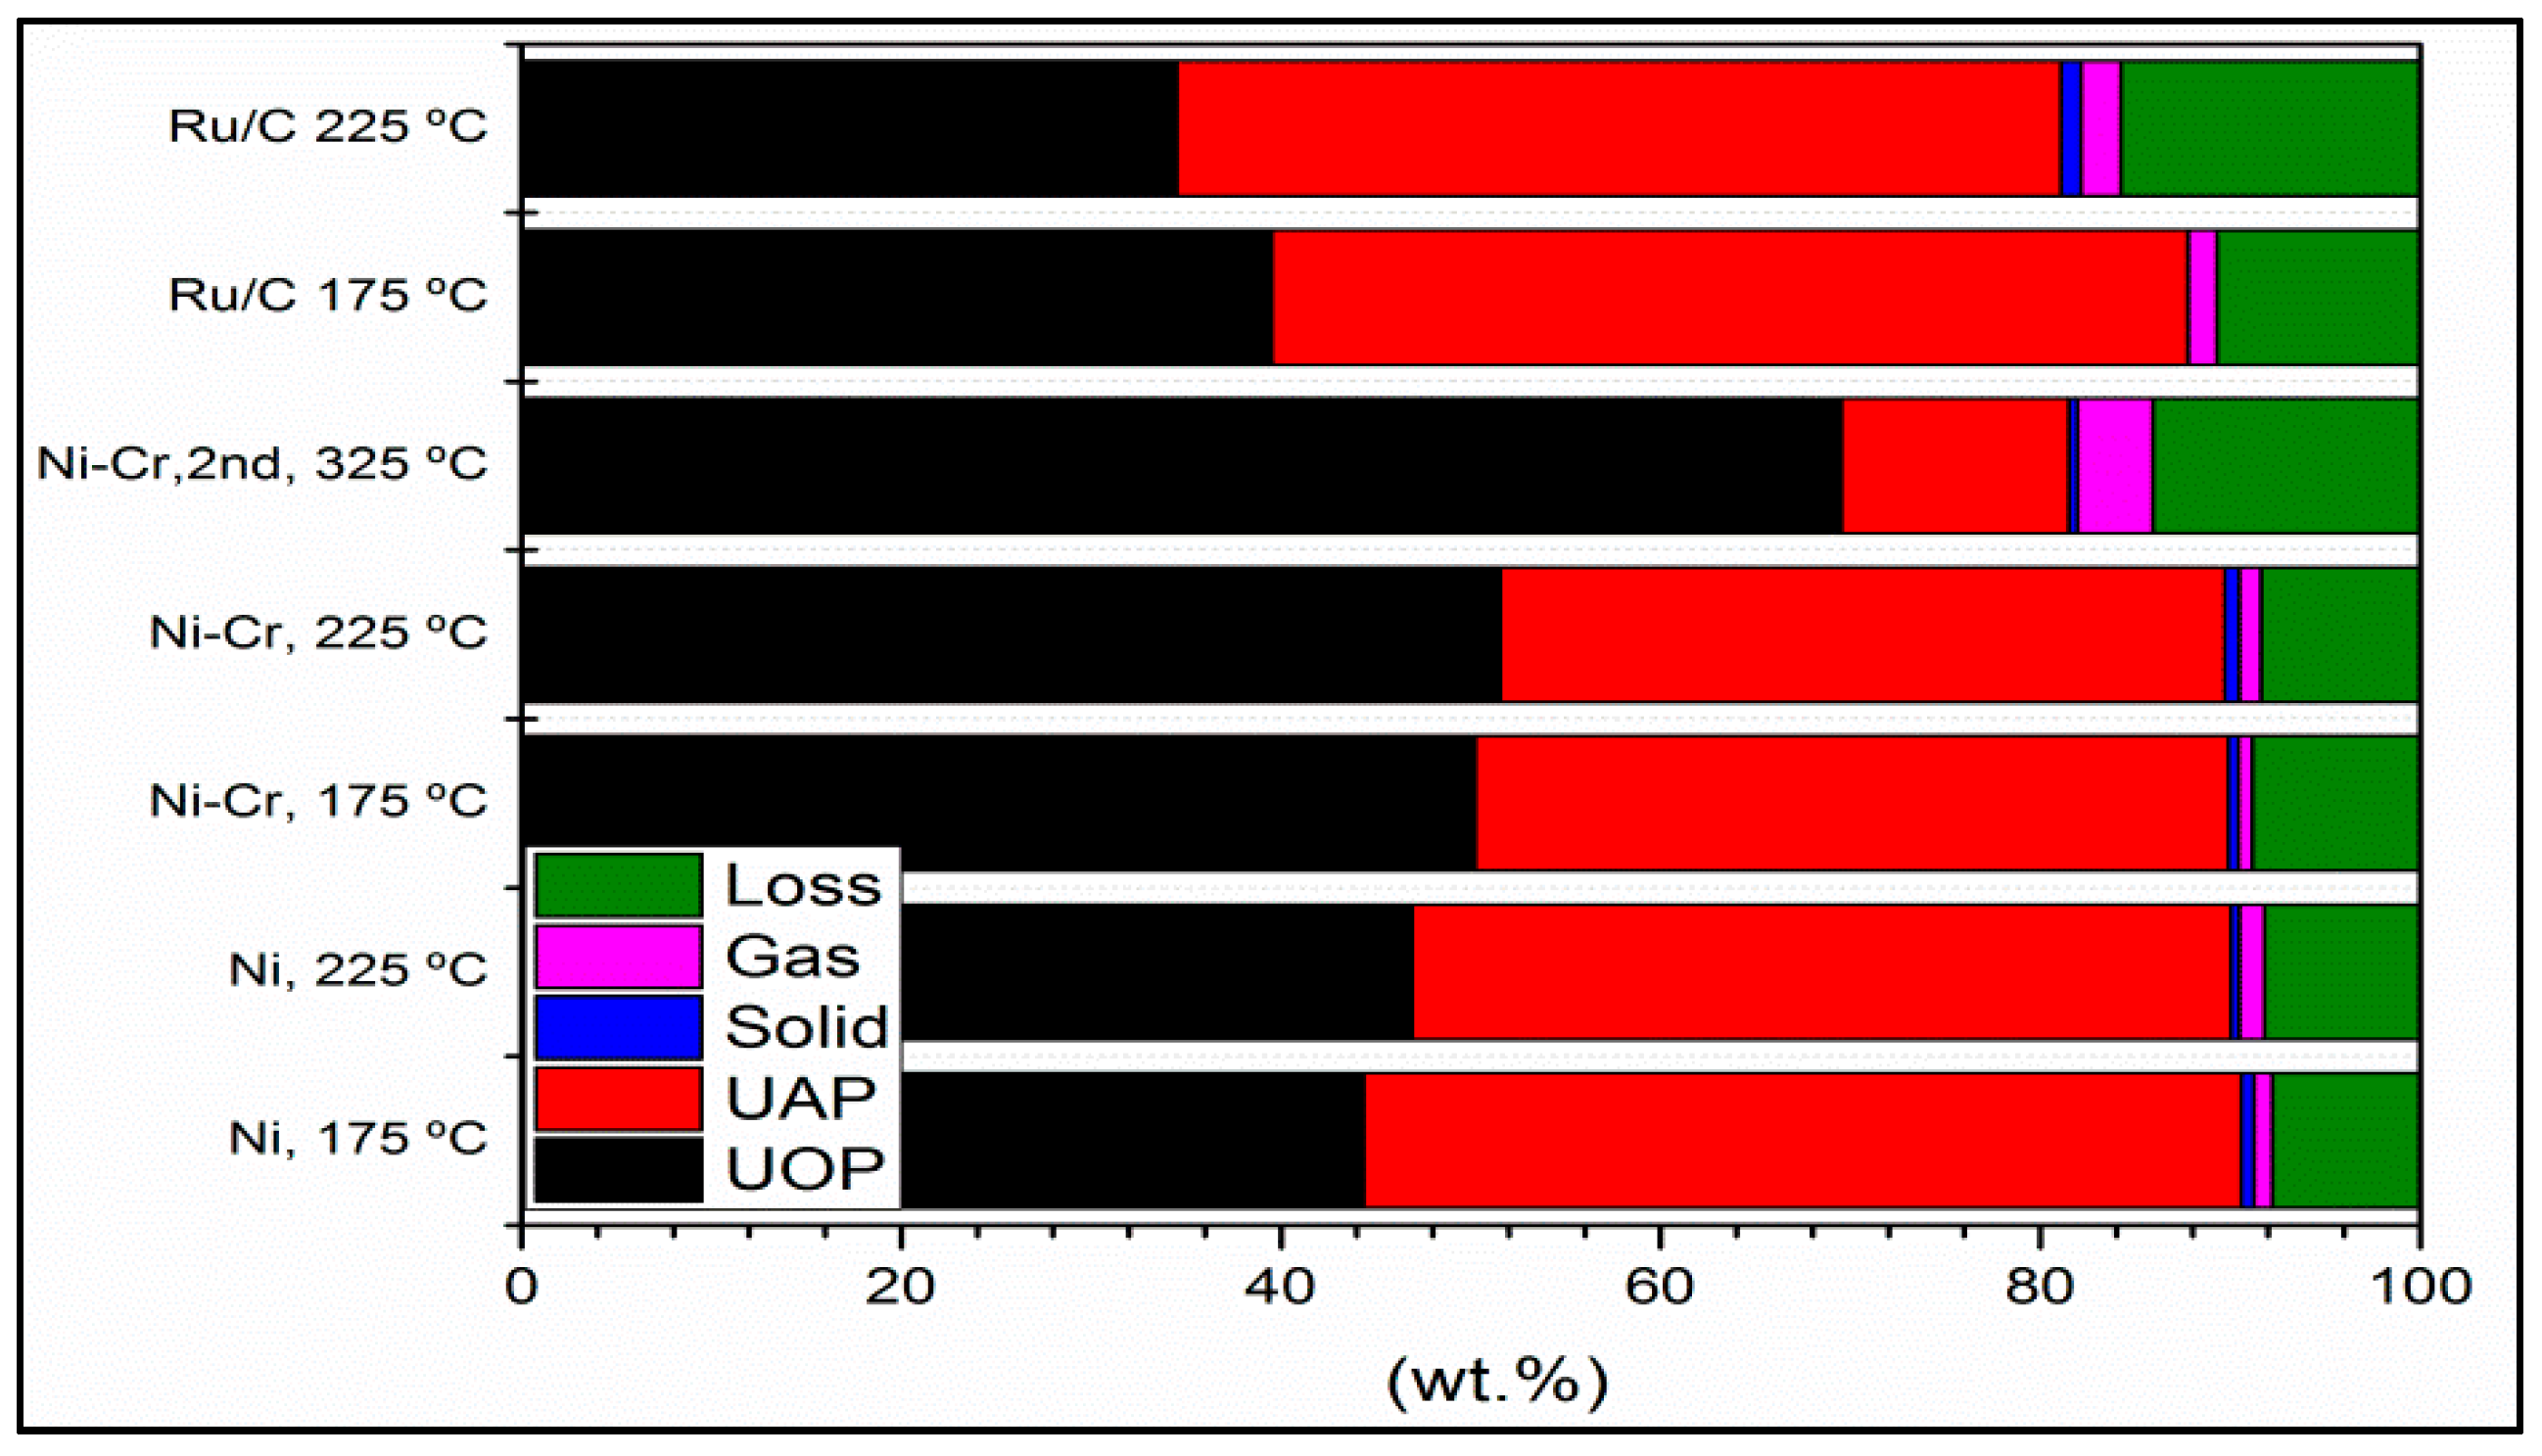
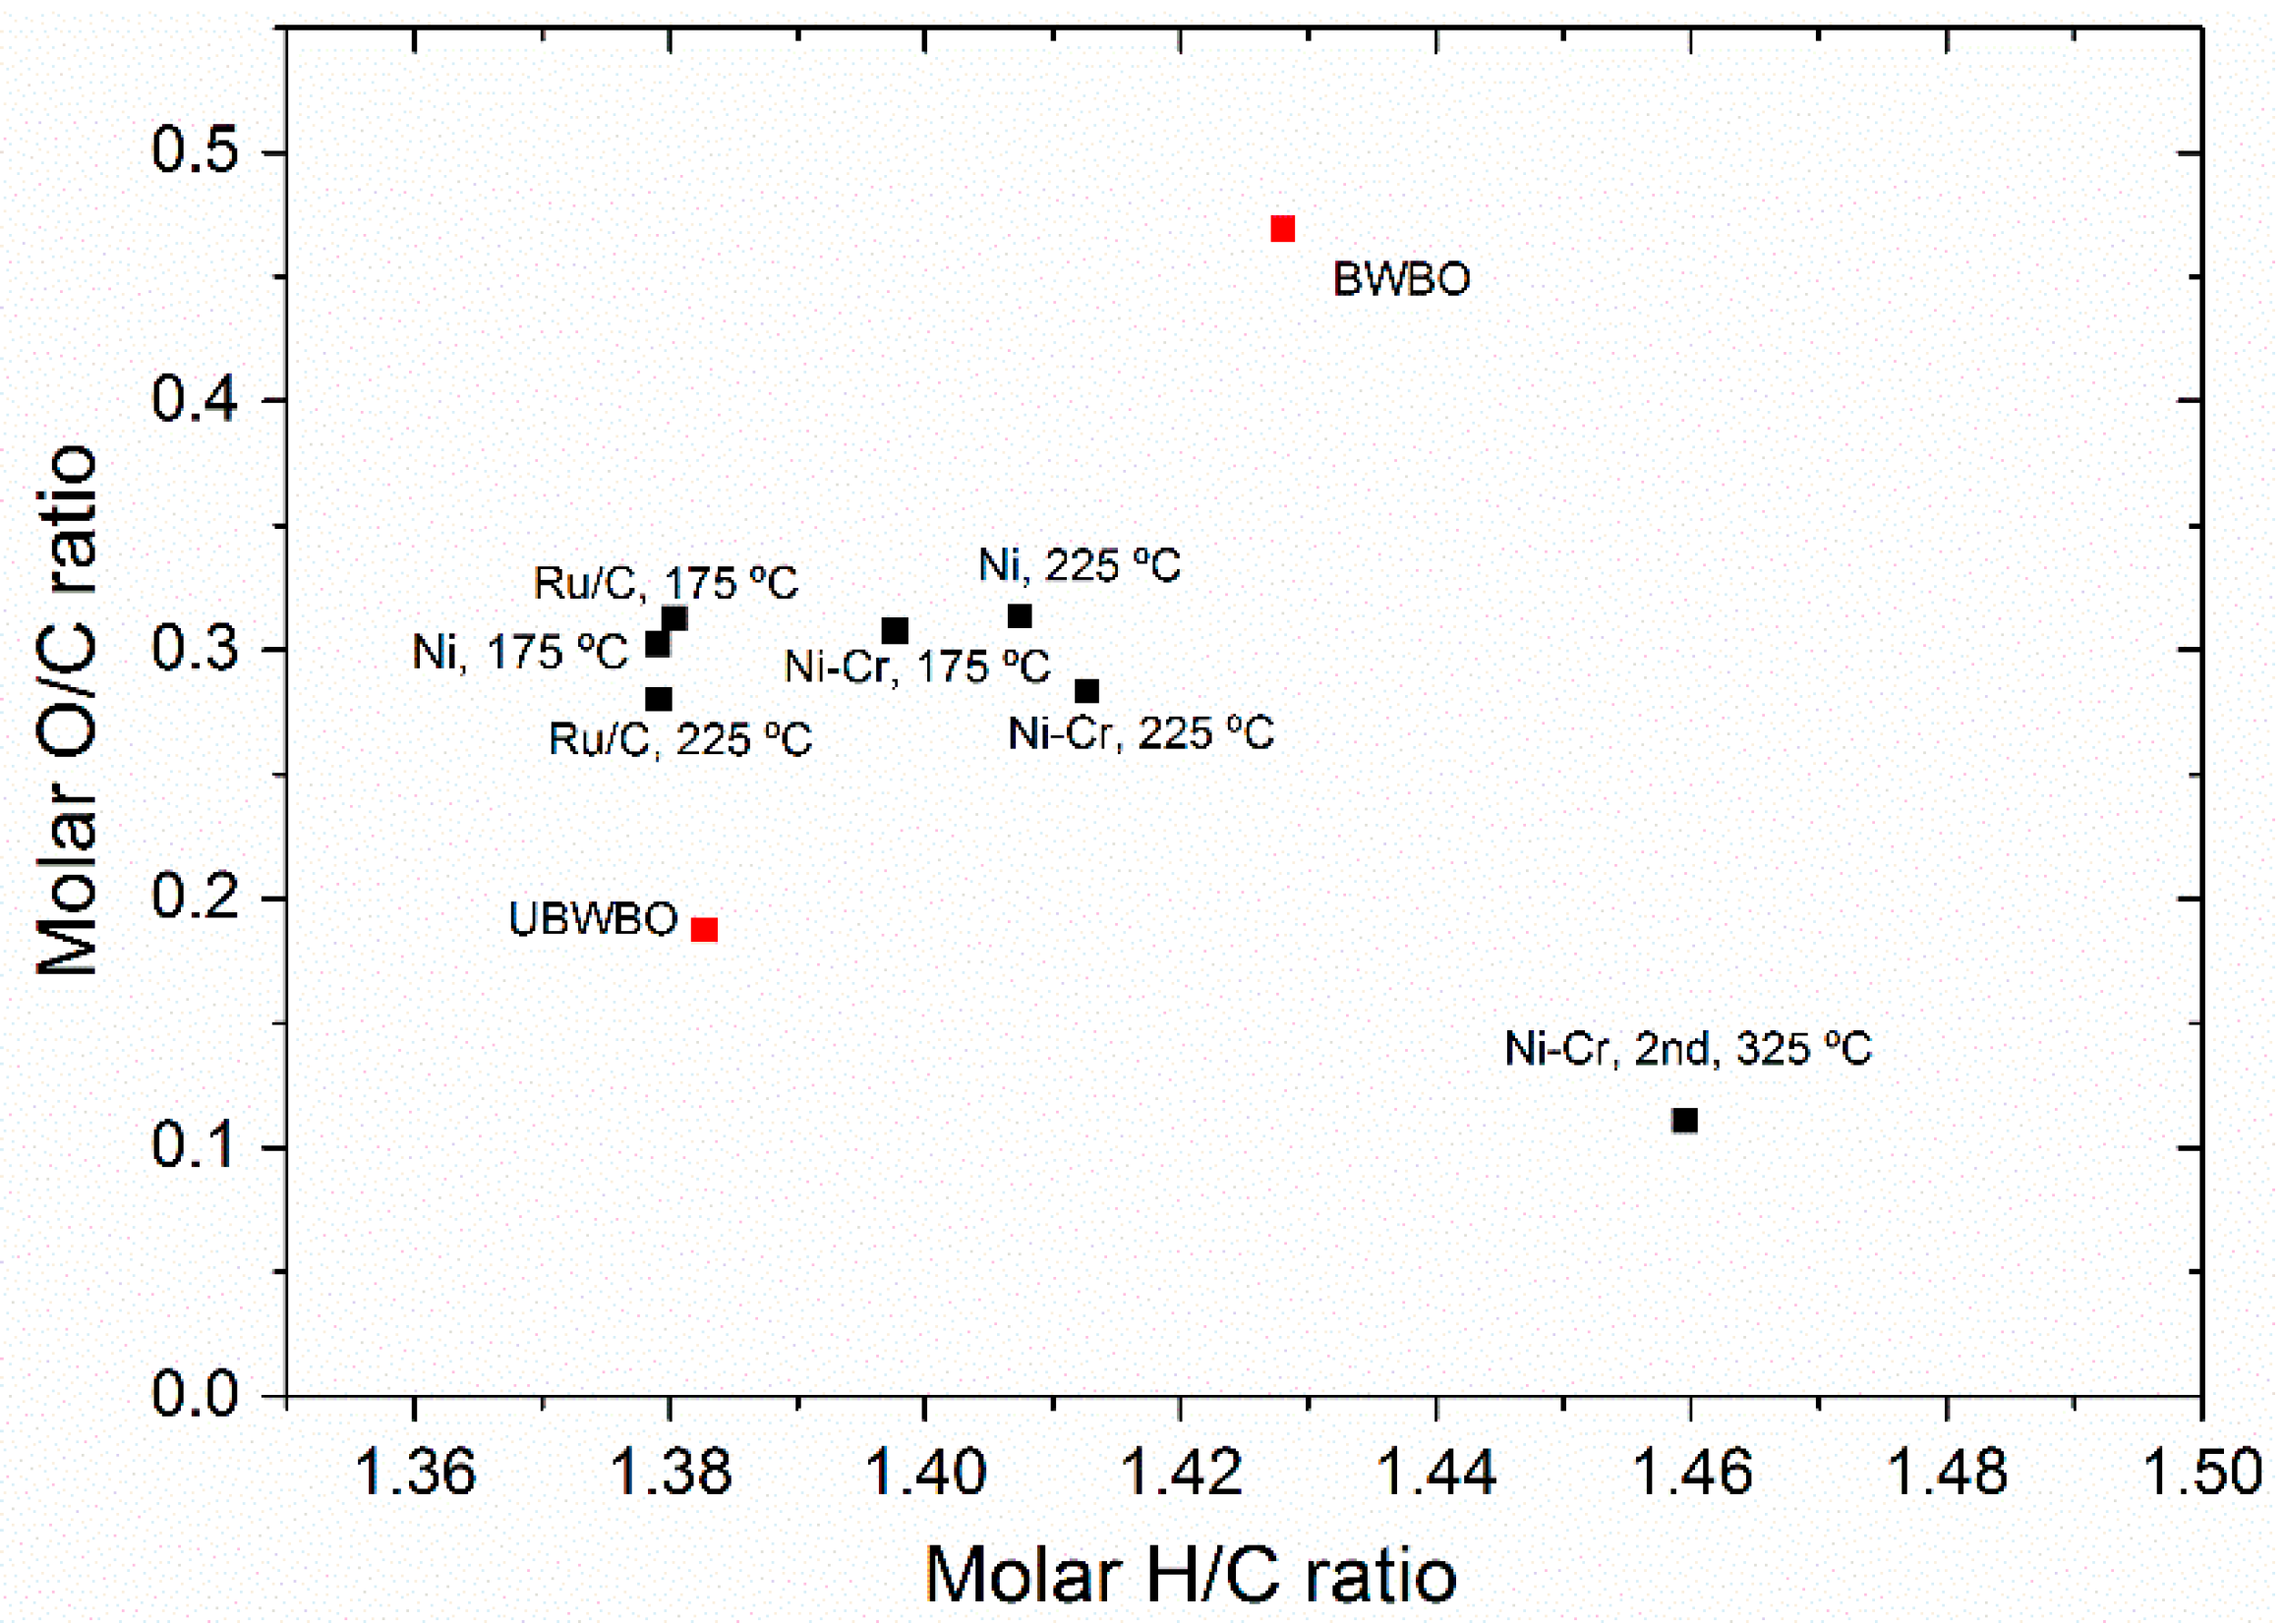
2.1.1. Products Distribution, Elemental Analysis, and Physicochemical Properties

The product distribution after the upgrading reactions is depicted in Figure 1. In all cases, the main products are an upgraded oil phase (UOP) and upgraded aqueous phase (UAP) with minor formation of gaseous and solid products. At higher temperatures, the UOP yield is reduced with the Ru/C catalyst (39.5 wt.% at 175 °C and 34.5 wt.% at 225 °C), whereas the opposite behavior is observed for both Ni-based catalysts. Ni–Cr showed slightly higher UOP yields in comparison to the Ni catalyst for both temperatures evaluated. At 175 °C, the UOP fraction obtained with Ni was 44.3 wt.%, whereas with Ni–Cr, 50.2 wt.% of UOP was formed. At 225 °C, 46.9 wt.% of UOP is obtained with Ni, while 51.5 wt.% of UOP is obtained with Ni–Cr. The highest UOP yield was observed for the 2-step upgrading conducted with Ni–Cr, with 69.5 wt.% of UOP formed. It can be explained by the lower water concentration of the UBWBO (5.1 wt.%), which resulted in low UAP (11.9 wt.%) after the reaction, as observed. The amount of solid formed increased as the temperature increased, except for the Ni catalyst. In this specific case, a reduction from 0.7 wt.% to 0.4 wt.% was observed. In general, the solid yields were below 1 wt.%.
The influence of reaction time was also investigated, and the results are presented in the Supplementary Material (2 h and 4 h) for reactions using the Ni catalyst. At longer reaction times, slightly lower amounts of solid and higher UOP yields are found. The latter is in agreement with previous observations [51], although with a different catalyst. The 2-step upgrading conducted with Ni–Cr for two hours resulted in a concentration of solids corresponding to 0.47 wt.% of the products. This concentration is 15% lower compared to the 1-step reaction at 175 °C and 38% lower at 225 °C and comparable to the 1-step upgrading (0.44 wt.%) of BWBO at the same experimental conditions, as previously reported [52].
The gas product yield was lower for Ni-based catalysts in comparison to the Ru/C catalyst, with Ni–Cr showing the lowest gas production at 175 °C and 225 °C. At 325 °C, the 2-step upgrading of UBWBO produced the highest yield of gaseous products; approximately 4% of gas was produced, an indication of cracking reactions. Comparable gas yields were observed for both reactions times of 2 and 4 h. Further discussion regarding the composition of the gas fractions is available in Section 2.1.4. Losses due to the viscosity of the upgraded oils and the difficulty to completely recover the products from the autoclave were in the range of 8–15 wt.%.
Analysis of the liquid fractions by elemental analysis (Table 1) showed a high carbon content (65.1–67.0 wt.% on dry basis) of upgraded oils from BWBO for all catalysts and temperatures tested. A slightly higher carbon content was observed at 225 °C for Ni–Cr (66.8 wt.%) and Ru/C (67.0 wt.%). In comparison to the feedstock (BWBO), the carbon content was increased by around 8–11.5 %. The 2-step upgrading reaction conducted with UBWBO increased the carbon content from 72.9 wt.% to 78.6 wt.%. When the initial carbon content is taken into account (from BWBO to UOP2nd,Ni–Cr,325 °C), an increase of 31.22% is observed. The hydrogen content also increased in the upgraded oils from BWBO. In this case, a positive effect of the temperature in the hydrogen concentration is observed for all catalysts tested. The highest hydrogen concentration was obtained by the Ni–Cr catalyst at 225 °C (7.9 wt.%) in contrast to 6.8 wt.% in the feed. The UBWBO, initially with 8.4 wt.% of hydrogen content, showed a value of 9.6 wt.% after upgrading. Carbon and hydrogen were comparable at reactions conducted at 2 and 4 h. Nitrogen and sulfur concentrations were below the detection limit; for that reason, no clear trends could be detected.
Lower oxygen contents were observed in the upgraded oils in contrast to the feedstocks. At 225 °C, Ni–Cr and Ru/C reduced the oxygen content from 33 wt.% to 25.3 wt.% and 25.0 wt.%, respectively. UBWBO, composed of 44.8% less oxygen in comparison to BWBO, was further deoxygenated to 11.62 wt.%. Hence, the 2-step upgrading resulted in an UOP2nd,Ni–Cr,325 °C with 64.8% less oxygen in comparison to the initial BWBO. Similar to carbon and hydrogen, the concentration of oxygen was comparable for reactions conducted for 2 and 4 h.
The water content in the upgraded oil was also significantly reduced. The BWBO contained 23 wt.% of H2O, reduced to 10.1 wt.% with Ni–Cr at 225 °C (best performance observed for BWBO upgrading reactions). A slightly higher concentration of H2O was observed at reactions conducted for 2 h (11.6 wt.%) in comparison to 4 h. The UBWBO, initially with very low H2O concentrations (5.1 wt.%), showed a reduction of 54.9%, resulting in 2-step upgraded oil with 2.3 wt.% of H2O. From the initial water concentration of BWBO, 90% could be removed by the 2-step upgrading. The high carbon and high hydrogen contents as well as the lower water concentration and lower oxygen content resulted in higher heating values (HHV). That of the upgraded oils in comparison to BWBO was increased by 40.6% with Ni–Cr at 225 °C and 37.5% with Ru/C at the same temperature. The slightly lower HHV (26.12 MJ/Kg) obtained for the reaction conducted for 2 h is in agreement with the higher water (11.6 wt.%) concentration compared to the 4 h reaction. The UBWBO already showed an HHV that was 59% higher compared to the BWBO; after the second upgrading, the HHV of UOP2nd,Ni–Cr,325 °C reached 36.93 MJ/Kg, 19.3% higher compared to UBWBO and 90.1% higher compared to BWBO.
The pH value increased in the upgraded oils in comparison to the feedstocks. The highest pH value of 4.9 was obtained after the 2-step upgrading, correlating to the gas chromatography-mass spectroscopy/flame ionization detector (GC-MS/FID) results (Section 2.1.2).
A smaller content of carbon was observed in the upgraded aqueous phases (Table S3). The higher the temperature, the lower the carbon content in the UAP of BWBO. Ideally, the highest recovery of carbon should be observed in the upgraded oil [50], as observed. H2O concentration in the upgraded aqueous phases was in the range of 42.6–52.0 wt.% for the upgrading reactions using BWBO. The upgrading of UBWBO resulted in a colorless aqueous phase nearly free of carbon ([C] = 1.6 wt.%) and with 97.0 wt.% of water (Figure S4).
The transformations occurred during the hydrotreatment in terms of C, H, and O content are visualized in a Van Kravelen diagram (Figure 2). The reduction of the O/C ratio indicates hydrodeoxygenation, whereas an increase in the H/C ratio may indicate hydrogenation of the upgraded oils [8,14]. The upgrading reactions reduced the O/C ratio of BWBO from 0.47 to the range of 0.28–0.31. The lowest O/C ratios for these reactions were observed for Ni–Cr and Ru/C, both resulting in O/C of 0.28. The H/C ratios were reduced in comparison to BWBO, especially at low temperatures (175 °C), while higher temperatures (225 °C) seem to promote hydrogenation for both Ni-based catalysts [53].
The UBWBO showed an O/C ratio of 0.19, which is much lower compared to the BWBO and to all the upgraded products obtained with all catalysts at 175 °C and 225 °C. The high hydrodeoxygenation activity of the Ni/SiO2 catalyst used in the first upgrading reaction has been previously reported elsewhere [13]. After the reaction, the O/C ratio was further reduced to 0.11 whereas the H/C ratio increased considerably from 1.38 to 1.46. This observation indicates that the catalyst was able to further hydrodeoxygenate and mainly hydrogenate the upgraded oil. A qualitative solubility test (1:100 in volume) with the 2-step upgraded oil showed slight solubility in a nonpolar solvent (n-hexane), while it easily solubilized in a polar solvent (tetrahydrofuran) in agreement with the observations of Ardiyinati et al. [6]. Hence, if co-feeding with refinery streams is intended, H/C ratios should be at least in the crude-oil range of 1.5 to 2.0 while O/C ratios should be below 0.05 [14].

2.1.2. Detailed Chemical Composition of Liquid Products and Feedstocks by 1H-NMR and GC-MS/FID

Characterization of Upgraded Liquid Products and Feedstocks by 1H-NMR
An overview of the main functional groups in the upgraded liquid products (UOP and UAP) was obtained by 1H-NMR (Table 2). Considering that the BWBO was composed of two phases, the comparison among the upgraded oils and feedstock is performed by taking into account the HPBWBO. In the case of the upgraded aqueous phase, the comparison will consider the LPBWBO.
The mmol of protons in the alkanes region (0.5–1.5 ppm) increased in all upgraded oils. Initially, the concentration of protons of HPBWBO was 8.20 mmol⋅g−1 while the upgraded products of the 1-step upgrading reaction were in the range of 13.4–21.55 mmol⋅g−1. The temperature increased the concentration of protons for all catalysts tested, especially for Ni–Cr, which produced the UOP with the highest concentration of protons in this region (21.55 mmol⋅g−1) for 1-step reactions. The concentration of protons of the UBWBO (after the 2-step upgrading almost doubled) increases from 22.0 mmol⋅g−1 to 41.80 mmol⋅g−1. In the UAPs, the integration values remained in the range of 4.90–7.47 mmol⋅g−1 for the upgrading conducted with BWBO, which was slightly higher compared to the initial LPBWBO (3.0 mmol⋅g−1). The lowest value (0.75 mmol⋅g−1) was obtained in the aqueous phase obtained after the second upgrading of UBWBO. In the protons in the integration region corresponding to α proton to carboxylic acid or keto-groups, α proton to unsaturated groups (1.5–3.0 ppm) also increased in the upgraded oils in comparison to HPBWBO, especially at 225 °C. While HPBWBO was 17.8 mmol⋅g−1, the upgraded products were in the range of 20.3–25.94 mmol⋅g−1. A slight decrease from 39.2 mmol⋅g−1 to 36.5 mmol⋅g−1 was observed after the second upgrading of UBWBO. These observations correlated to the GC/MS-FID results and will later be discussed. UAP in general showed a much lower concentration of protons in this range in comparison to UOPs; lowest concentrations were obtained with Ru/C at 225 °C (4.27 mmol⋅g−1) and with Ni–Cr at 325 °C (4.3 mmol⋅g−1) using UBWBO.
Upgraded oils with the Ni catalyst at 175 °C and 225 °C showed similar integration values to BWBO in the region of ethers, alkenes, and alcohols (3.0–4.3 ppm). The same was observed for Ru/C at 225 °C, while slightly higher integration values were obtained for this catalyst at 175 °C. Ni–Cr showed higher integration values, especially at 175 °C (16.45 mmol⋅g−1). The UBWBO already showed lower integration values (11.5 mmol⋅g−1), which was further reduced to 5.9 mmol.g−1 after the second upgrading. A correlation between GC/MS-FID and 1H-NMR was observed for the upgrading reactions conducted with BWBO. However, in the case of the 2-step upgrading, the same tendency regarding the reduction in alcohol concentration could not be clearly observed. Considering that only a small fraction of GC-detectable substances can be quantified [54], discrepancies between both techniques may occur. The UAPs showed higher values in comparison to UOPs in this range, correlating to the results of alcohols given by GC/MS-FID (Table 3). Especially with the second upgrading, a very low concentration of protons is observed in the UAP2nd,Ni–Cr,325°C (0.5 mmol⋅g−1), which agrees with the very low amount of alcohols observed by gas chromatography.
In the range of carbohydrate, H2O, and OH exchange groups (4.3–6.0 ppm), the upgraded oils showed lower integration values in contrast to the UAP; due to the lower concentration of water in comparison to the feedstock, most of the water is concentrated in the UAP, reflecting the high mmol of proton per g of the sample, as observed. In agreement with the very low water content (2.3 wt.%), the product of the 2-step upgrading showed the lowest integration values for this range (6.3 mmol⋅g−1); on the contrary, the UAP, mainly composed of water (97 wt.%), showed the highest integration range, approximately 8 times higher compared to UBWBO.
The range corresponding to (hetero-)aromatic compounds (6.0–8.5 ppm) slightly reduced after the upgrading reactions, indicating low activity towards aromatic conversion, even in the case of UBWBO. UAPs were almost absent of protons belonging to this range (<0.1 mmol⋅g−1).

2.1.3. Characterization of Upgraded Liquid Products and Feedstocks by GC-MS/FID

The samples upgraded with Ni-based catalysts at 225 °C and after the 2-step upgrading as well as BWBO and UBWBO were further analyzed by GC-MS/FID (Table 3). A detailed list with the quantification of GC-detectable compounds is available in the Supplementary Material (Table S4).
Eight different organic acids were identified in the BWBO. Acetic acid was in the highest concentration (7.2 wt.% dry basis). After upgrading BWBO, only acetic acid, propionic acid, and butyric acid were observed in the products with both catalysts. Slightly higher amounts of total organic acids was observed in UOPNi,225 °C in contrast to UOPNi–Cr,225 °C, while more than double the acids were observed in the UAPNi,225 °C in comparison to UAPNi–Cr,225 °C.
Considering the amount of acetic acid initially loaded into the autoclave (considering the amount of BWBO used in each reaction) and the amount of acetic acid after upgrading (considering the weight of UAP and UOP and their respective concentrations), nearly the same concentration of acetic acid was observed in the products obtained with the Ni catalyst (sum of UAPNi,225 °C and UOPNi,225 °C). On the other hand, around 12.92% of acetic acid was converted with Ni–Cr at 225 °C. In the case of the Ni catalyst, it may indicate that, even with some possible conversion of acetic acid to products such as methane [23] as a result of dehydrogenation to acetate followed by decarboxylation [55] or even esterification to products such as 2 hydroxyethyl acetate (higher concentration in the upgraded products in comparison to BWBO), some acetic acid is also formed, resulting in nearly the same amount before and after upgrading. It is known that the conversion of compounds such as levoglucosan results in the formation of acetic acid [56]. As most of this compound was converted, it can be assumed that some acetic acid could be formed from this route. The higher methane formation observed for Ni–Cr (Section 2.2), on the other hand, is in agreement with the higher acetic acid conversion [23] and may indicate higher activity of Ni–Cr for this reaction pathway.
In the case of consecutive reactions, a conversion of 97% of the acetic acid was obtained in the second upgrading reaction and was only detected in the UAP2nd,Ni–Cr,325 °C. Due to the high volume of methane produced, possibly this route was also favored as previously observed in the 1-step upgrading with the Ni–Cr catalyst. Hence, the Cr2O3 in the catalyst formulation might play a role in this case, considering its reported activity to aliphatic acid conversion [57].
The concentration of propionic acid, the second most abundant acid in the BWBO (0.55 g), increased in the upgraded products, especially with Ni (2.19 g) in comparison to Ni–Cr (0.88 g) at 225 °C. The opposite behavior was obtained with UBWBO: approximately 96.7% of the initial propionic acid in UBWBO was converted after the second upgrading and detected only in the UAP2nd,Ni–Cr,325 °C. We assume that, while propionic acid is formed from the conversion of hemicellulose derivatives [58] under upgrading conditions, it is further converted to compounds such as 1-propanol and propane [7,59], especially with Ni–Cr. This assumption explains the lowest concentration of propionic acid in the 1-step upgrading with the Ni–Cr catalyst as well as agrees with the high conversion observed in the second upgrading. In this case, propionic acid is possibly not formed, as most of the hemicellulose derivatives were converted in the first upgrading, resulting only in propionic acid conversion.
Esters observed in the BWBO were completely converted after upgrading, while new compounds were formed. The concentration of acetic acid 2-hydroxyethyl ester increased in the upgrading products with both catalysts (concentrations of 3.6 times higher with Ni and of 2.1 times higher with Ni–Cr at 225 °C). This indicates that conversion of acetic acid is taking place with the Ni catalyst although at nearly equal concentrations of acetic acid before and after upgrading as discussed previously. Hence, the Ni catalyst seems to be more selective towards esterification in comparison to Ni–Cr. The only ester observed in UBWBO (methyl ester propionic acid) was completely converted after the second upgrading.
The number and concentration of alcohols in the upgraded fraction increased significantly after the upgrading of BWBO. Initially, only four alcohols were identified in the BWBO, with ethylene glycol having the highest concentration (2.81 wt.% dry basis). After upgrading, 24 different alcohols were formed with the Ni catalyst and 29 alcohols were formed with Ni–Cr at 225 °C. The most abundant alcohols were ethylene and propylene glycol in both cases. The ethylene glycol concentration increased from 0.97 g in the feed to 3.77 g with Ni and to 3.25 g with Ni–Cr. Propylene glycol was formed with both Ni and Ni–Cr, resulting in 0.72 g and 0.64 g, respectively, mostly concentrated in the upgraded aqueous phases. In agreement with our previous finding and other investigations, the formation of propylene glycol is attributed to the hydrogenation of acetol [13,60]. Moreover, its hydrodeoxygenation may lead to the formation of 1-propanol, a compound only identified in the upgraded fractions. Further hydrodeoxygenation of 1-propanol could result in the formation of propane, observed in upgrading reactions conducted with Ni–Cr. Ethylene glycol formation, on the other hand, has been reportedly attributed to hydrogenation of hydroxyacetaldehyde [28,61]. UBWBO was almost free of alcohol, with minor concentrations of 2,4-dimethylcyclopentanol, a product of hydrogenation of 2,4-dimethyl cyclopentanone.
Aldehydes are very reactive at very mild conditions and can be easily converted [26,29]; consequently, they were completely converted after upgrading. The concentration of ketones was reduced from 3.04 g in the BWBO to 0.43 g and 0.12 g with Ni and Ni–Cr, respectively. Hydroxypropanone or acetol (5.8 wt.% dry basis) and 1-hydroxy-2-butanone (0.52 wt.% dry basis) were the compounds with the highest concentrations in the BWBO and were possibly converted to propylene glycol and 1,2-butanediol, both identified in the products.
The UBWBO initially showed 22 non-aromatic ketones with 2-methylcyclopentanone having the highest concentration (1.22 wt.% dry basis). The highest conversion of ketones with the Ni–Cr catalyst during the 1-step upgrading was one of the motivating criteria adopted for selection of this catalyst for the 2-step upgrading reaction. After the second upgrading reaction, only 8 ketone compounds were observed in the upgraded products, most of them initially observed in the UBWBO, indicating only partial conversion. From the initial 1.16 g in the UBWBO, the 2-step upgraded oil was composed of 0.65 g of ketones.
Non-aromatic hydrocarbons were absent in the feedstocks as well as in the upgraded products using BWBO. However, cyclic hydrocarbons, such as methylcyclohexane (0.62 wt.% dry basis), cyclohexane (0.54 wt.% dry basis), and ethylcyclohexane (0.36 wt.% dry basis), were the hydrocarbons with the highest concentrations identified in the UOP2nd,Ni–Cr,325 °C. Long-chain aliphatic compounds such as n-pentadecane (0.03 wt.% dry basis) and n-heptadecane (0.11 wt.% dry basis) were also formed after upgrading.
Analogous to the observation for ketones, most of the furans in the BWBO (around 1.0 g) were converted with upgrading, while new furans were formed after 1-step upgrading. The final concentrations in UOPNi,225 °C (0.91 g) and UOPNi–Cr,225 °C (0.87 g) were in a similar range as BWBO, despite the conversions observed. The second upgrading of UBWBO reduced the concentration of furans in the UOP2nd,Ni–Cr, 325 °C nearly by half.
The BWBO was composed of 5.81 wt.% dry basis aromatic compounds, meaning 2.23 g of aromatics in total. The conversion with the Ni catalyst resulted in 1.97 g of aromatics in the upgraded products whereas the upgrading with Ni–Cr resulted in 1.43 g of aromatics. With respect to the 2-step upgrading, 1.39 g of GC-detectable aromatics initially in the UBWBO were reduced to 0.42 g in the UOP2nd,Ni–Cr,325 °C. These findings contradict the 1H-NMR observation, in which the concentration of aromatics remained nearly in the same range for all the reactions. Hence, as just a small fraction of the sample is quantified by GC-MS/FID in the range of 23% for the 1-step upgrading and only 7.6% for UOP2nd,Ni–Cr,325 °C, it may indicate that the aromatics underwent polymerization during the upgrading treatment as the 1H-NMR analyzes the complete liquid sample. Further characterization to support this hypothesis was not performed due to the limited amount of samples available and the priority given to other analytical techniques. However, it was visually possible to observe higher viscosities of the 2-step upgraded oil in comparison to the feedstock.
The total amount of compounds belonging to the benzene group remained nearly in the same range after 1-step upgrading with Ni–Cr (around 0.02 g in the feed and products), whereas nearly 40% less was observed in the products obtained with the Ni catalyst (0.013 g). The products obtained after the second upgrading, on the other hand, showed a total amount of benzene around 5.6 times higher compared to UBWBO.
Although very low, the concentration of toluene increased after the 1-step upgrading (feed: 0.003 g, Ni–Cr: 0.006 g; and Ni: 0.005 g). Initially absent of toluene, the 2-step upgraded oil was composed of 0.017 g of toluene. It was previously reported that it is among the plausible products of guaiacol conversion [62,63], in agreement with the lower guaiacol concentration in the upgraded products in comparison to the feed. The concentration of benzene also increased in the UOP2nd,Ni-Cr,325 °C from 0.006 g to 0.0181 g. Another six compounds belonging to the benzene group were observed in the 2-step upgraded oil with 1-methyl-naphtalene, the heterocyclic aromatic compound with the highest concentration (0.038 g), as evidence of aromatic condensation taking place.
Most of the lignin-derived phenols were converted, with nearly the same compounds observed mostly in the UOPs for both Ni-based catalysts. Among the products, phenol was observed in higher concentrations in the UOPNi,225 °C (0.114 wt.% dry basis) in comparison to the UOP2nd,Ni–Cr,325 °C (0.022 wt.% dry basis). The highest concentration of cyclohexanol in the products obtained with Ni-Cr may be an indication of the aromatic ring hydrogenation of phenol as a possible reaction pathway [32]. This assumption can be extrapolated to UOP2nd,Ni–Cr,325 °C, considering the absence of phenol and high concentration of cyclohexanol (0.469 wt.% dry basis). Furthermore, o-cresol was not observed in the upgraded products with Ni, whereas it was among the most abundant lignin-derived phenols in the UOP2nd,Ni–Cr,325 °C (0.11 wt.% dry basis). Most of the studies have reported toluene and methylcyclohexane as the main products obtained from o-cresol [63].
A number of 24 compounds belonging to the guaiacol group were identified in the BWBO, with guaiacol (0.621 wt.% dry basis), 4-methyl-guaiacol (0.683 wt.% dry basis), eugenol (0.22 wt.% dry basis), cis-isoeugenol (0.32 wt.% dry basis), vanillin (0.47 wt.% dry basis), and acetoguaiacone (0.34 wt.% dry basis) among the main compounds. Eugenol and isoeugenol were hydrogenated to 4-propylguaiacol, as previously reported [13,61]. The concentration of guaiacol reduced slightly to 0.18 g with Ni and to 0.17 g with Ni–Cr. The concentration of acetoguaiacone in the products obtained with the Ni catalyst increased to 0.20 g, while they were completely converted with Ni–Cr. It can be an evidence of lignin depolymerization [4] with the Ni catalyst, whereas further conversion probably took place with Ni–Cr. Only three compounds belonging to the guaiacol group were identified in the UOP2nd, Ni–Cr,325 °C, resulting in 0.68 wt.% on a dry basis.
The number of syringol-belonging compounds was reduced from 8 in the BWBO to 5 and 3 compounds with the Ni and Ni–Cr catalysts, respectively. The initial concentration of 0.10 g increased to 0.22 g with Ni, mainly due to the formation of dihydrosinapyl alcohol (0.18 g), in this case, attributed to further depolymerization of lignin oligomers [64,65], whereas the concentration of syringols was reduced to 0.03 g with Ni–Cr. Compounds belonging to the syringol group were absent in the UBWBO as well as in the 2-step upgraded products.
The carbohydrate fraction of BWBO was mainly composed of sugars (9.96 wt.% dry basis, 3.4 g). Levoglucosan was the main sugar compound and was completely converted with both catalysts. A complex reaction pathway is attributed to levoglucosan conversion, leading to CO2; alcohols such as ethyleneglycol, propyleneglycol, 1,2-butanediol, acetic acid; as well as polymerization products [9,28,43]. After the upgrading, 0.313 g still remained in the UAPNi,225 °C whereas 0.049 g remained unconverted with Ni–Cr, in both cases mostly unknown sugars. Hence, Ni–Cr is more active for sugar conversion in comparison to Ni. By analogy to glucose conversion previously observed [66], the higher conversion of sugars with the Ni–Cr catalyst may be attributed to Cr2O3 in catalyst formulation In this case, the adsorption of molecules is preferentially done through oxygen adsorption to Cr3+ by the oxygen lone pairs of electrons [9,66,67,68]. Further discussion is given is Section 2.2.

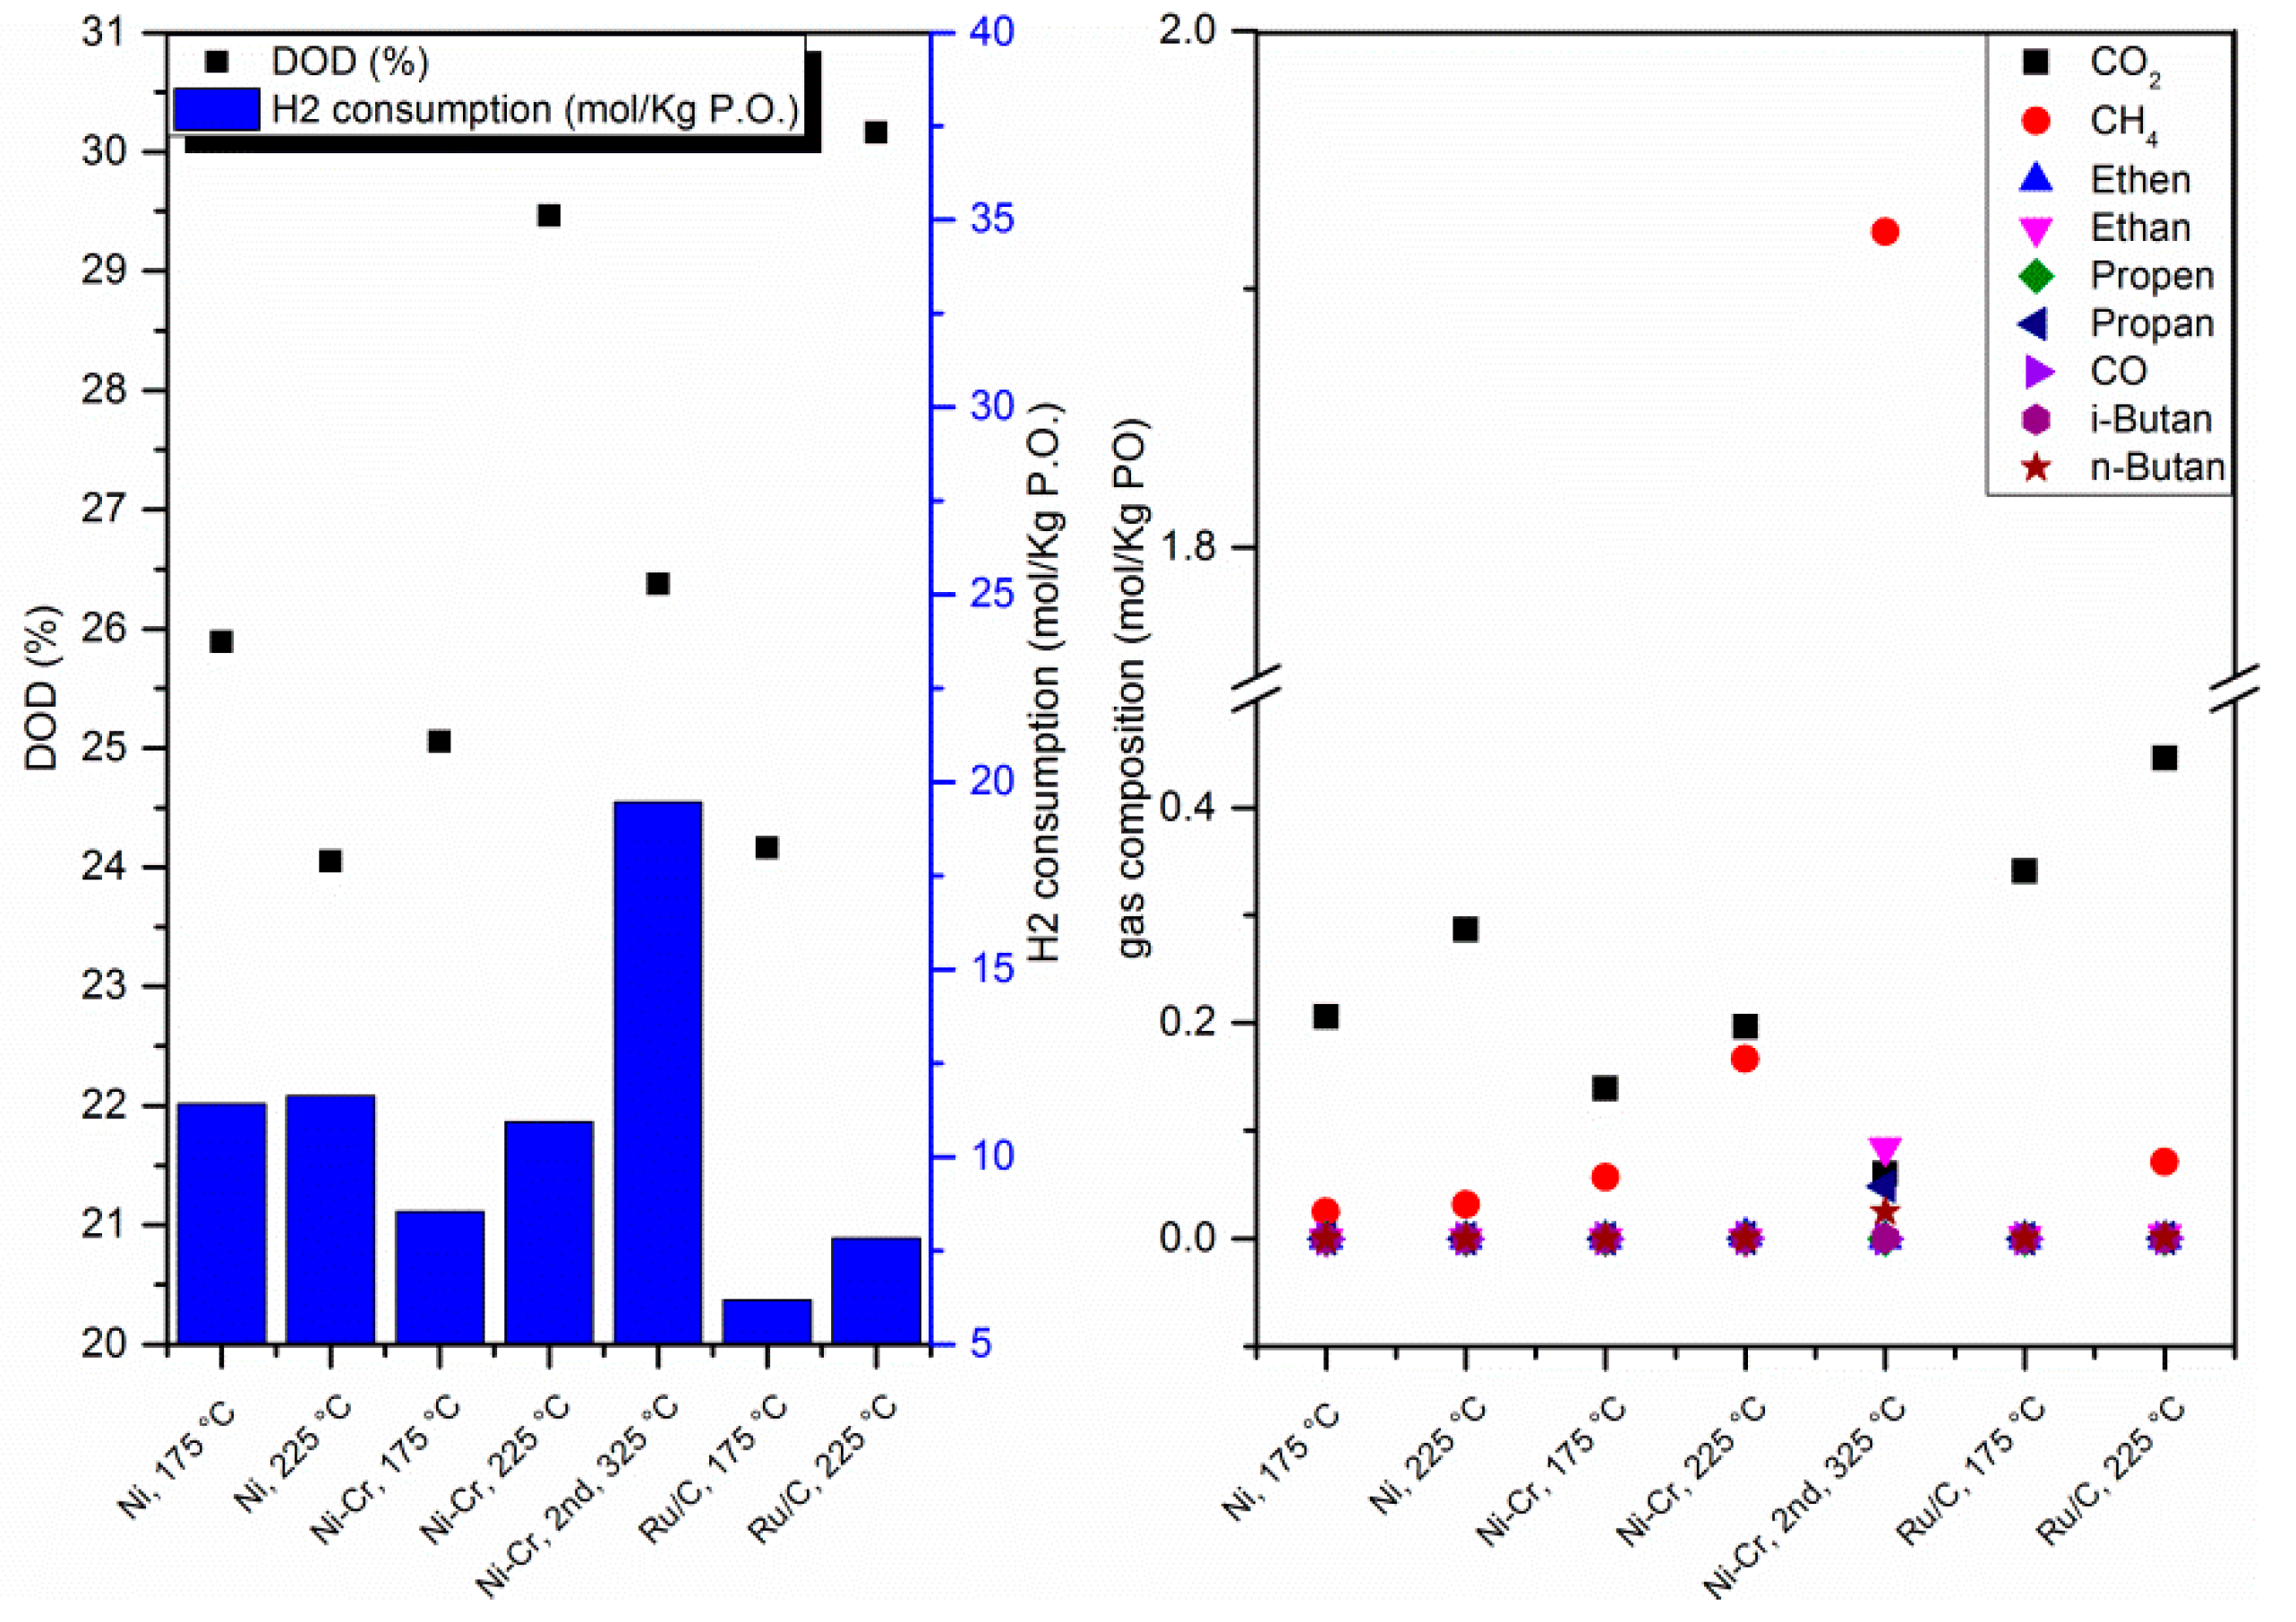
2.1.4. Degree of Deoxygenation (DOD), H2 Consumption, and Gaseous Products of Upgrading Reactions

The hydrogen consumption and the degree of deoxygenation (DOD) were correlated in Figure 3. The DOD ranged from 24% with Ni at 225 °C to 30.2% with Ru/C at 225 °C. The experimental deviation was considered ±1.2 estimated from four measurements (Supplementary Material). The highest DOD were obtained with Ni–Cr and Ru/C at 225 °C. In the case of Ru/C, it can be partly attributed to the highest amount of CO2 production among all the reactions, combined with the highest yield of gas for the 1-step reaction (2.1%). The amount of gas formed in this case was circa 60% higher in comparison to the Ni catalyst and 85% higher in relation to Ni–Cr, whereas the amount of CO2 produced was 55.6% higher compared to Ni and 126% higher compared to the Ni–Cr catalyst at 225 °C. The influence of temperature over the DOD can be noticed for the 1-step reaction with both the Ni–Cr and Ru/C catalysts whereas no clear tendency was observed with the Ni catalyst. In this case, the DOD and hydrogen consumption (considering an experimental deviation of ±0.35) are considered the same in both temperatures. A similar observation of higher oxygen concentrations obtained at higher temperatures was reported elsewhere, although over different hydrotreatment conditions [69]. Overall, the highest DOD for 1-step reactions and Ni-based catalysts was obtained with Ni–Cr at 225 °C, reaching 29.5% of oxygen removed.
Ni-based catalysts showed higher hydrogen uptake in comparison to Ru/C, especially the Ni catalyst, which was attributed to the higher metal loading [35] (see Section 3.2 methodology) as well as the highest amount of NiO. The comparable H2 at 175 °C and 225 °C agrees with the DOD observed. In the 1-step reactions with Ni–Cr and Ru/C, the highest consumption was observed at 225 °C, as usually higher consumptions of hydrogen are observed at higher temperatures [18,37,51].
The consumption of hydrogen in the 2-step reaction was significantly higher compared to the 1-step reaction. The highest hydrogen uptake correlated to the H/C ratio given in the Van Krevelen plot (Figure 2). However, the higher hydrogen consumption not necessarily influenced the DOD (26.4%). In this case, the catalytic reaction seems to prefer other reaction pathways, considering the significant amount of CH4 formed. Ethane, propane, n-butane, and i-butane were also produced in higher concentrations in comparison to 1-step reactions, whereas CO2 was minimized in comparison to 1-step reactions, in agreement with previous studies [69]. The highest cracking activity observed for the Ni–Cr catalyst may be attributed to strong acid sites, reported to be very active for cracking reactions [41].
Some assumptions arise with regard to the high amount of gaseous hydrocarbon formed; the high temperature is reportedly attributed to the increase in yields of gaseous products [37], which is in agreement to the highest gas yield (3.9%) at 325 °C among all reactions. However, not only the temperature but also the bio-oil composition play roles in gas formation, considering that reactive species were stabilized in the UBWBO [9] and competitive reactions might be minimized. For example, the high conversion of acetic acid in the 2-step upgrading (97% converted; See Section 2.1) can be one of the reaction pathways leading to CH4 formation [23]. High reaction temperature and lower concentration of water in the UBWBO compared to BWBO may act synergistically, contributing to the decarboxylation of acetic acid and leading to CH4 and CO2 formation, as reported elsewhere [47]. Cracking reactions most probably also contributed to the high concentration of CH4 and C2–C4 gaseous compounds. The lowest concentration of CO2 in the gas phase in contrast to the highest consumption of hydrogen may be correlated to methanation reaction [17,38]. Furthermore, CO may also contribute to methane formation, as CO undergoes methanation easily compared to CO2 [70].

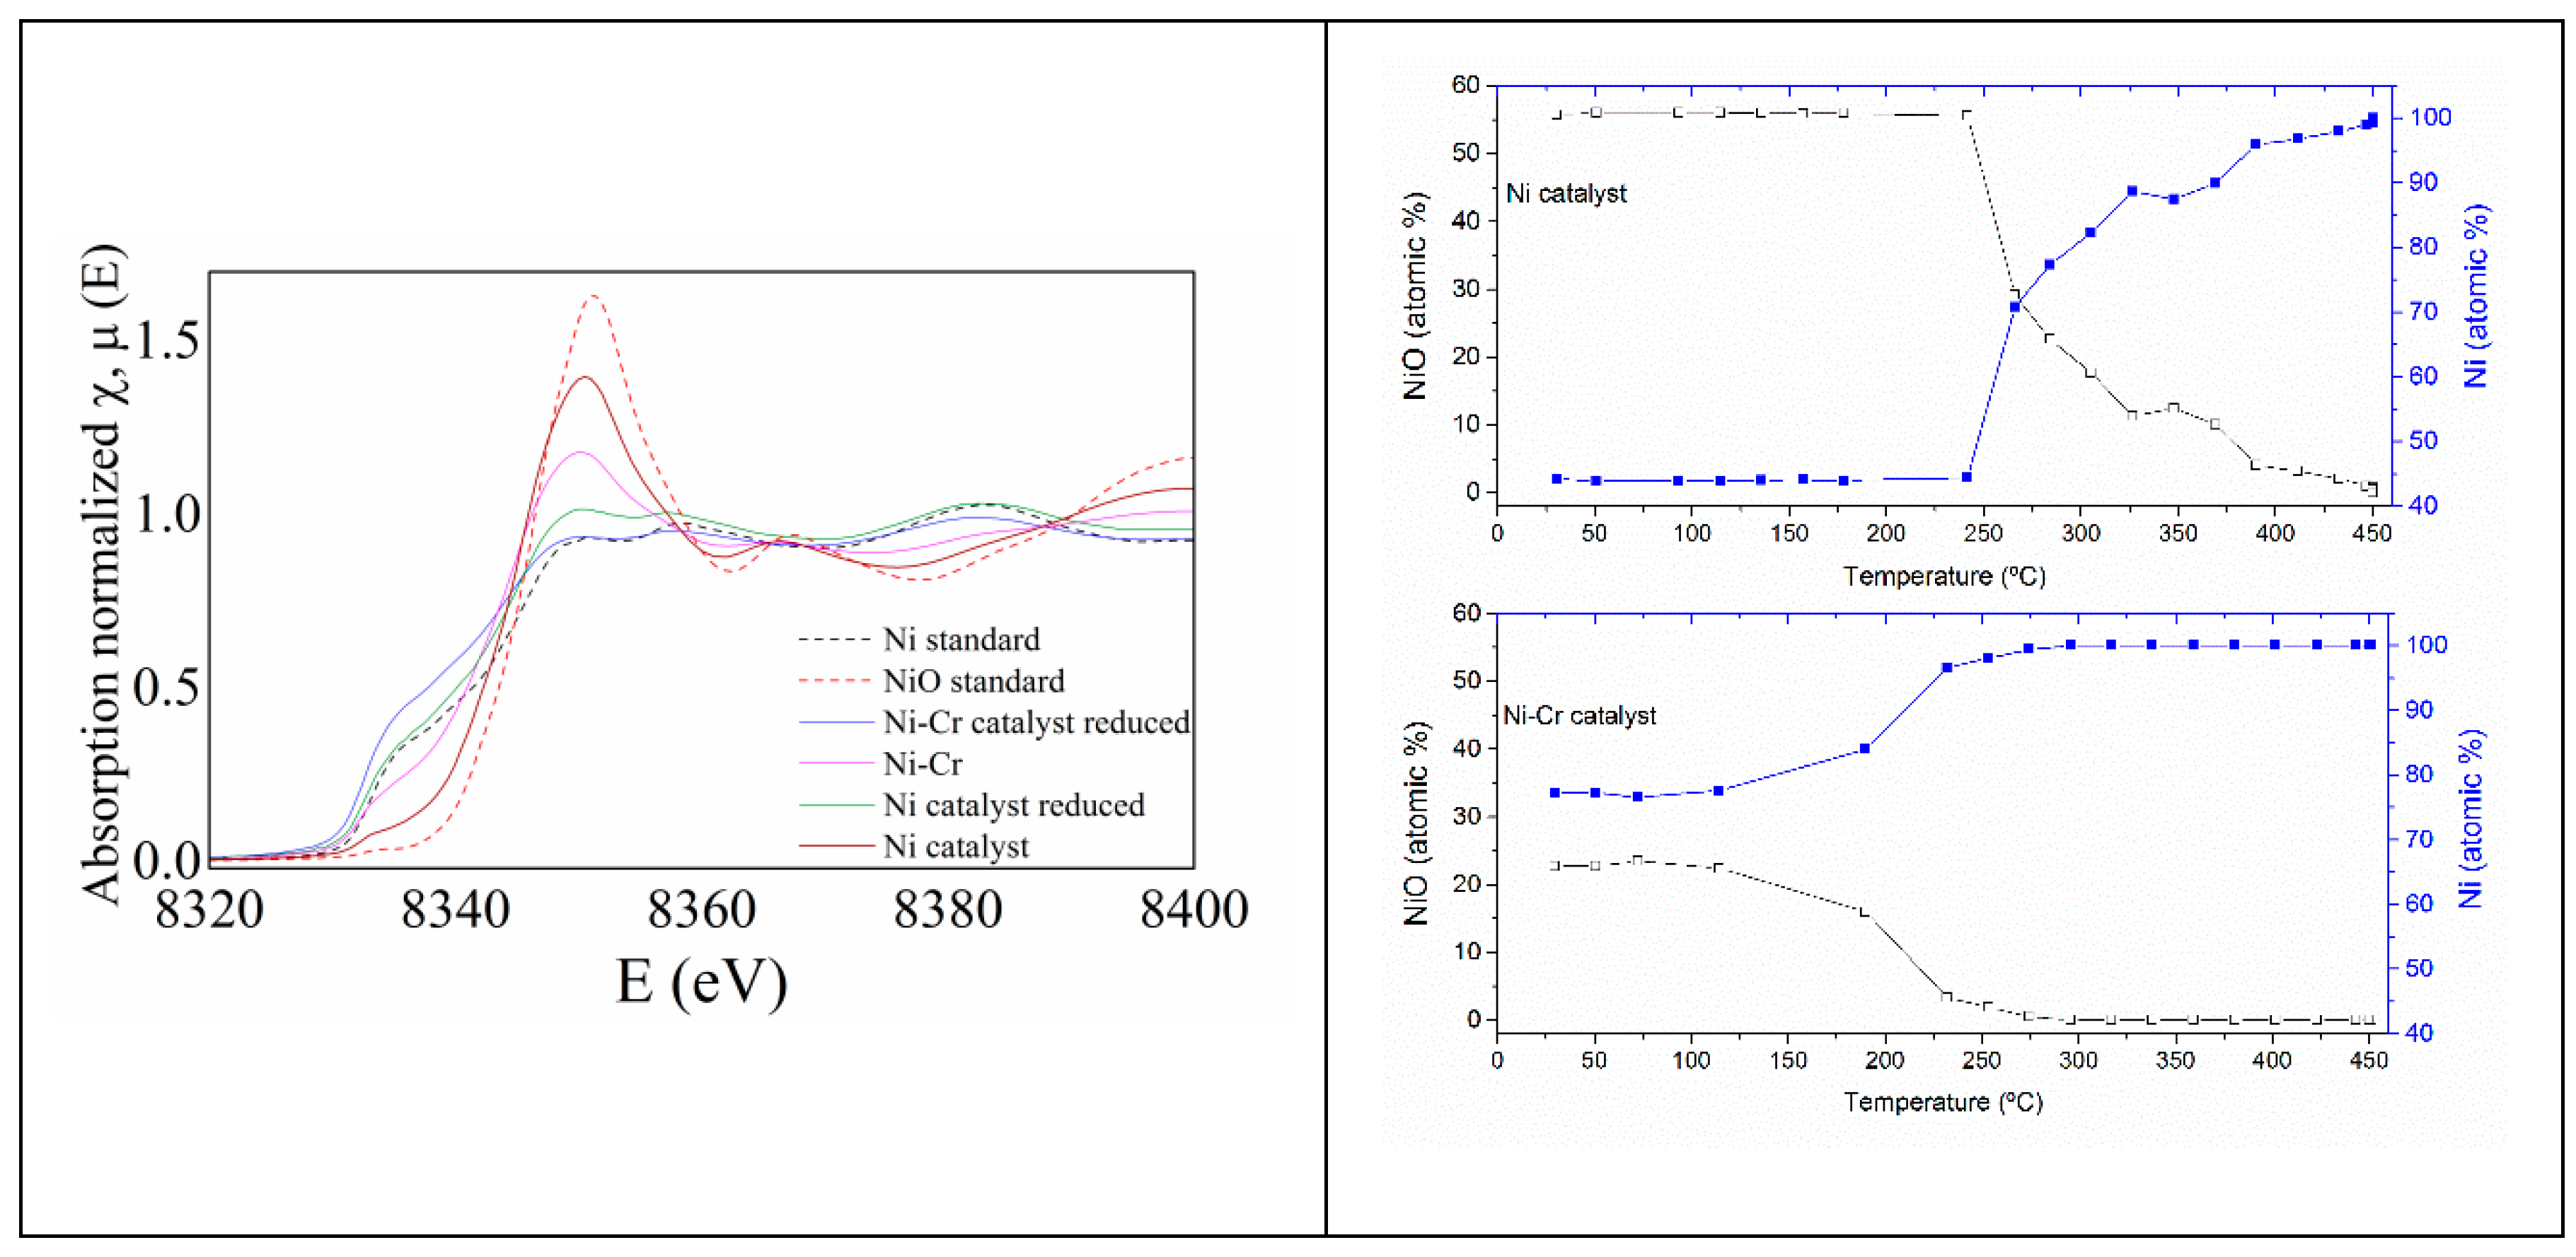
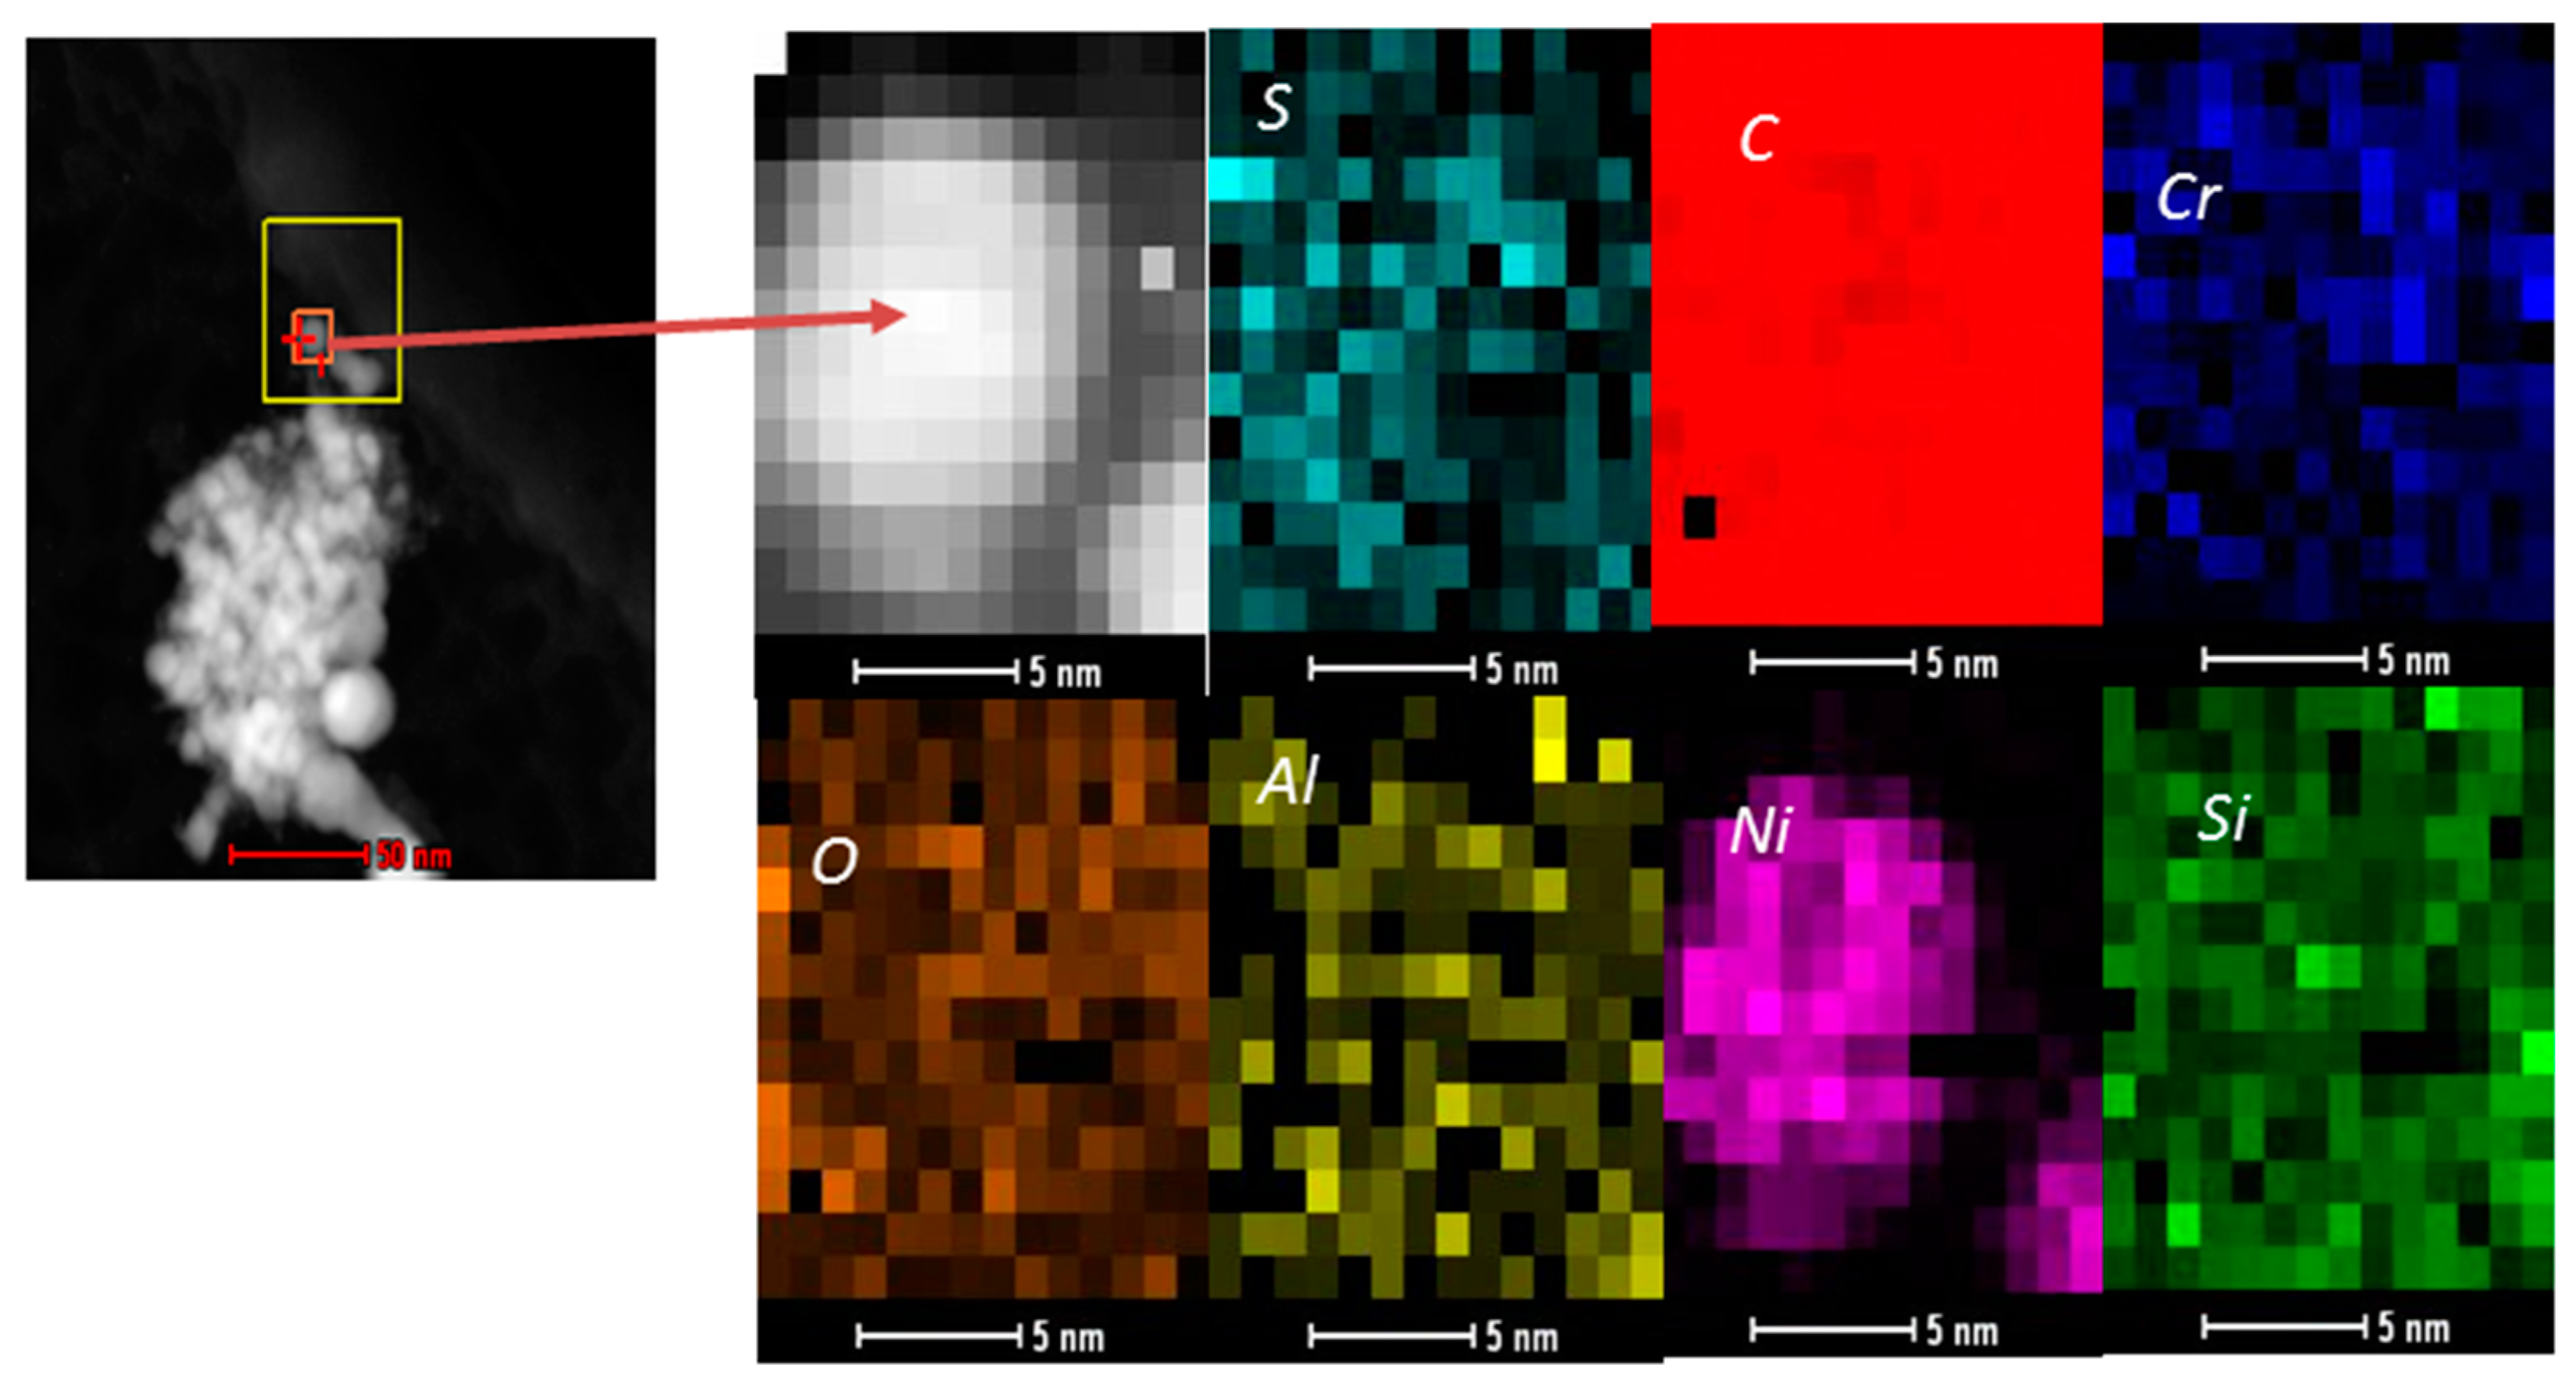
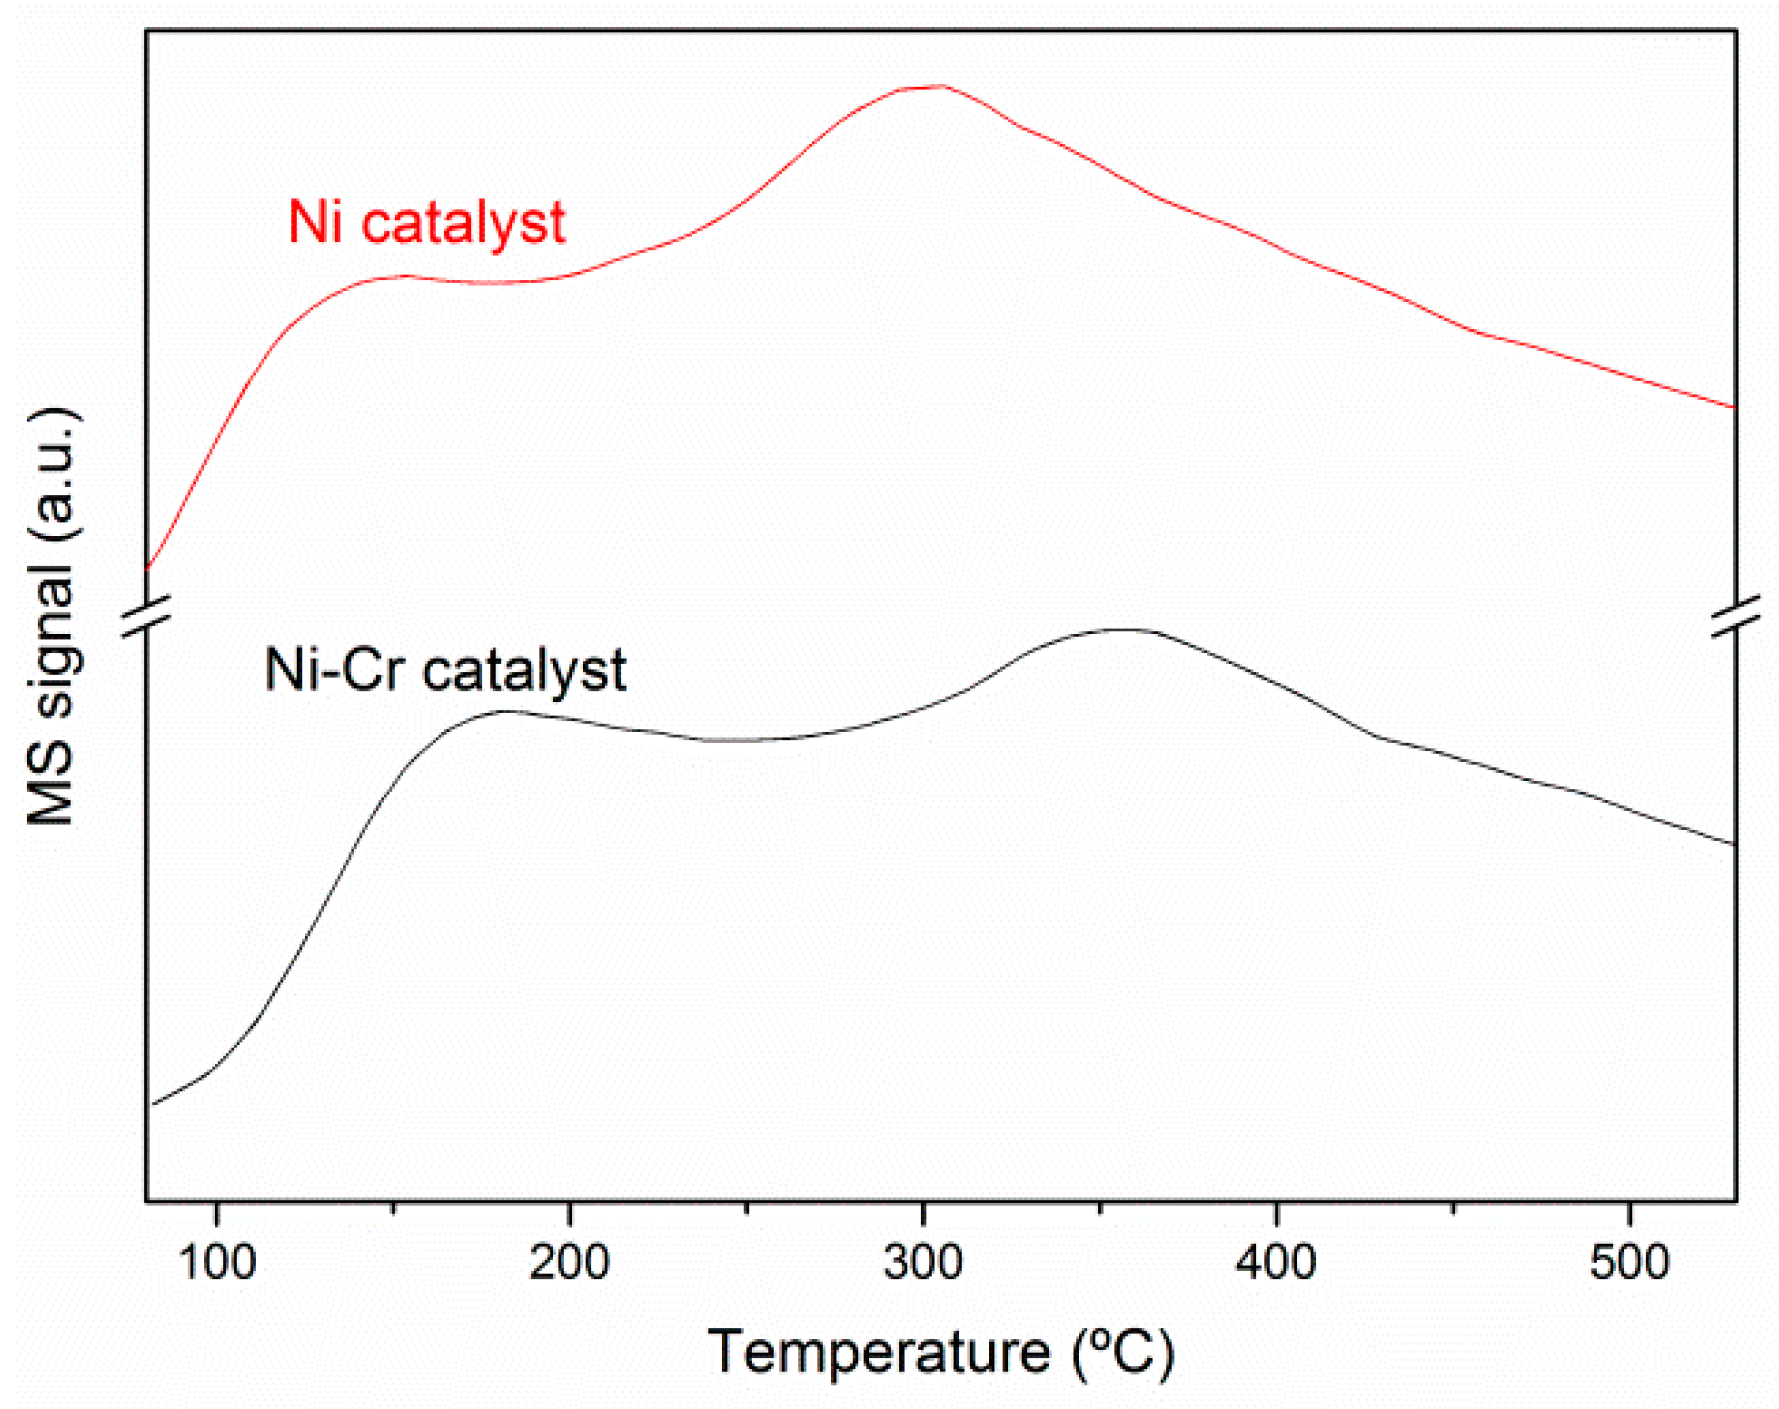
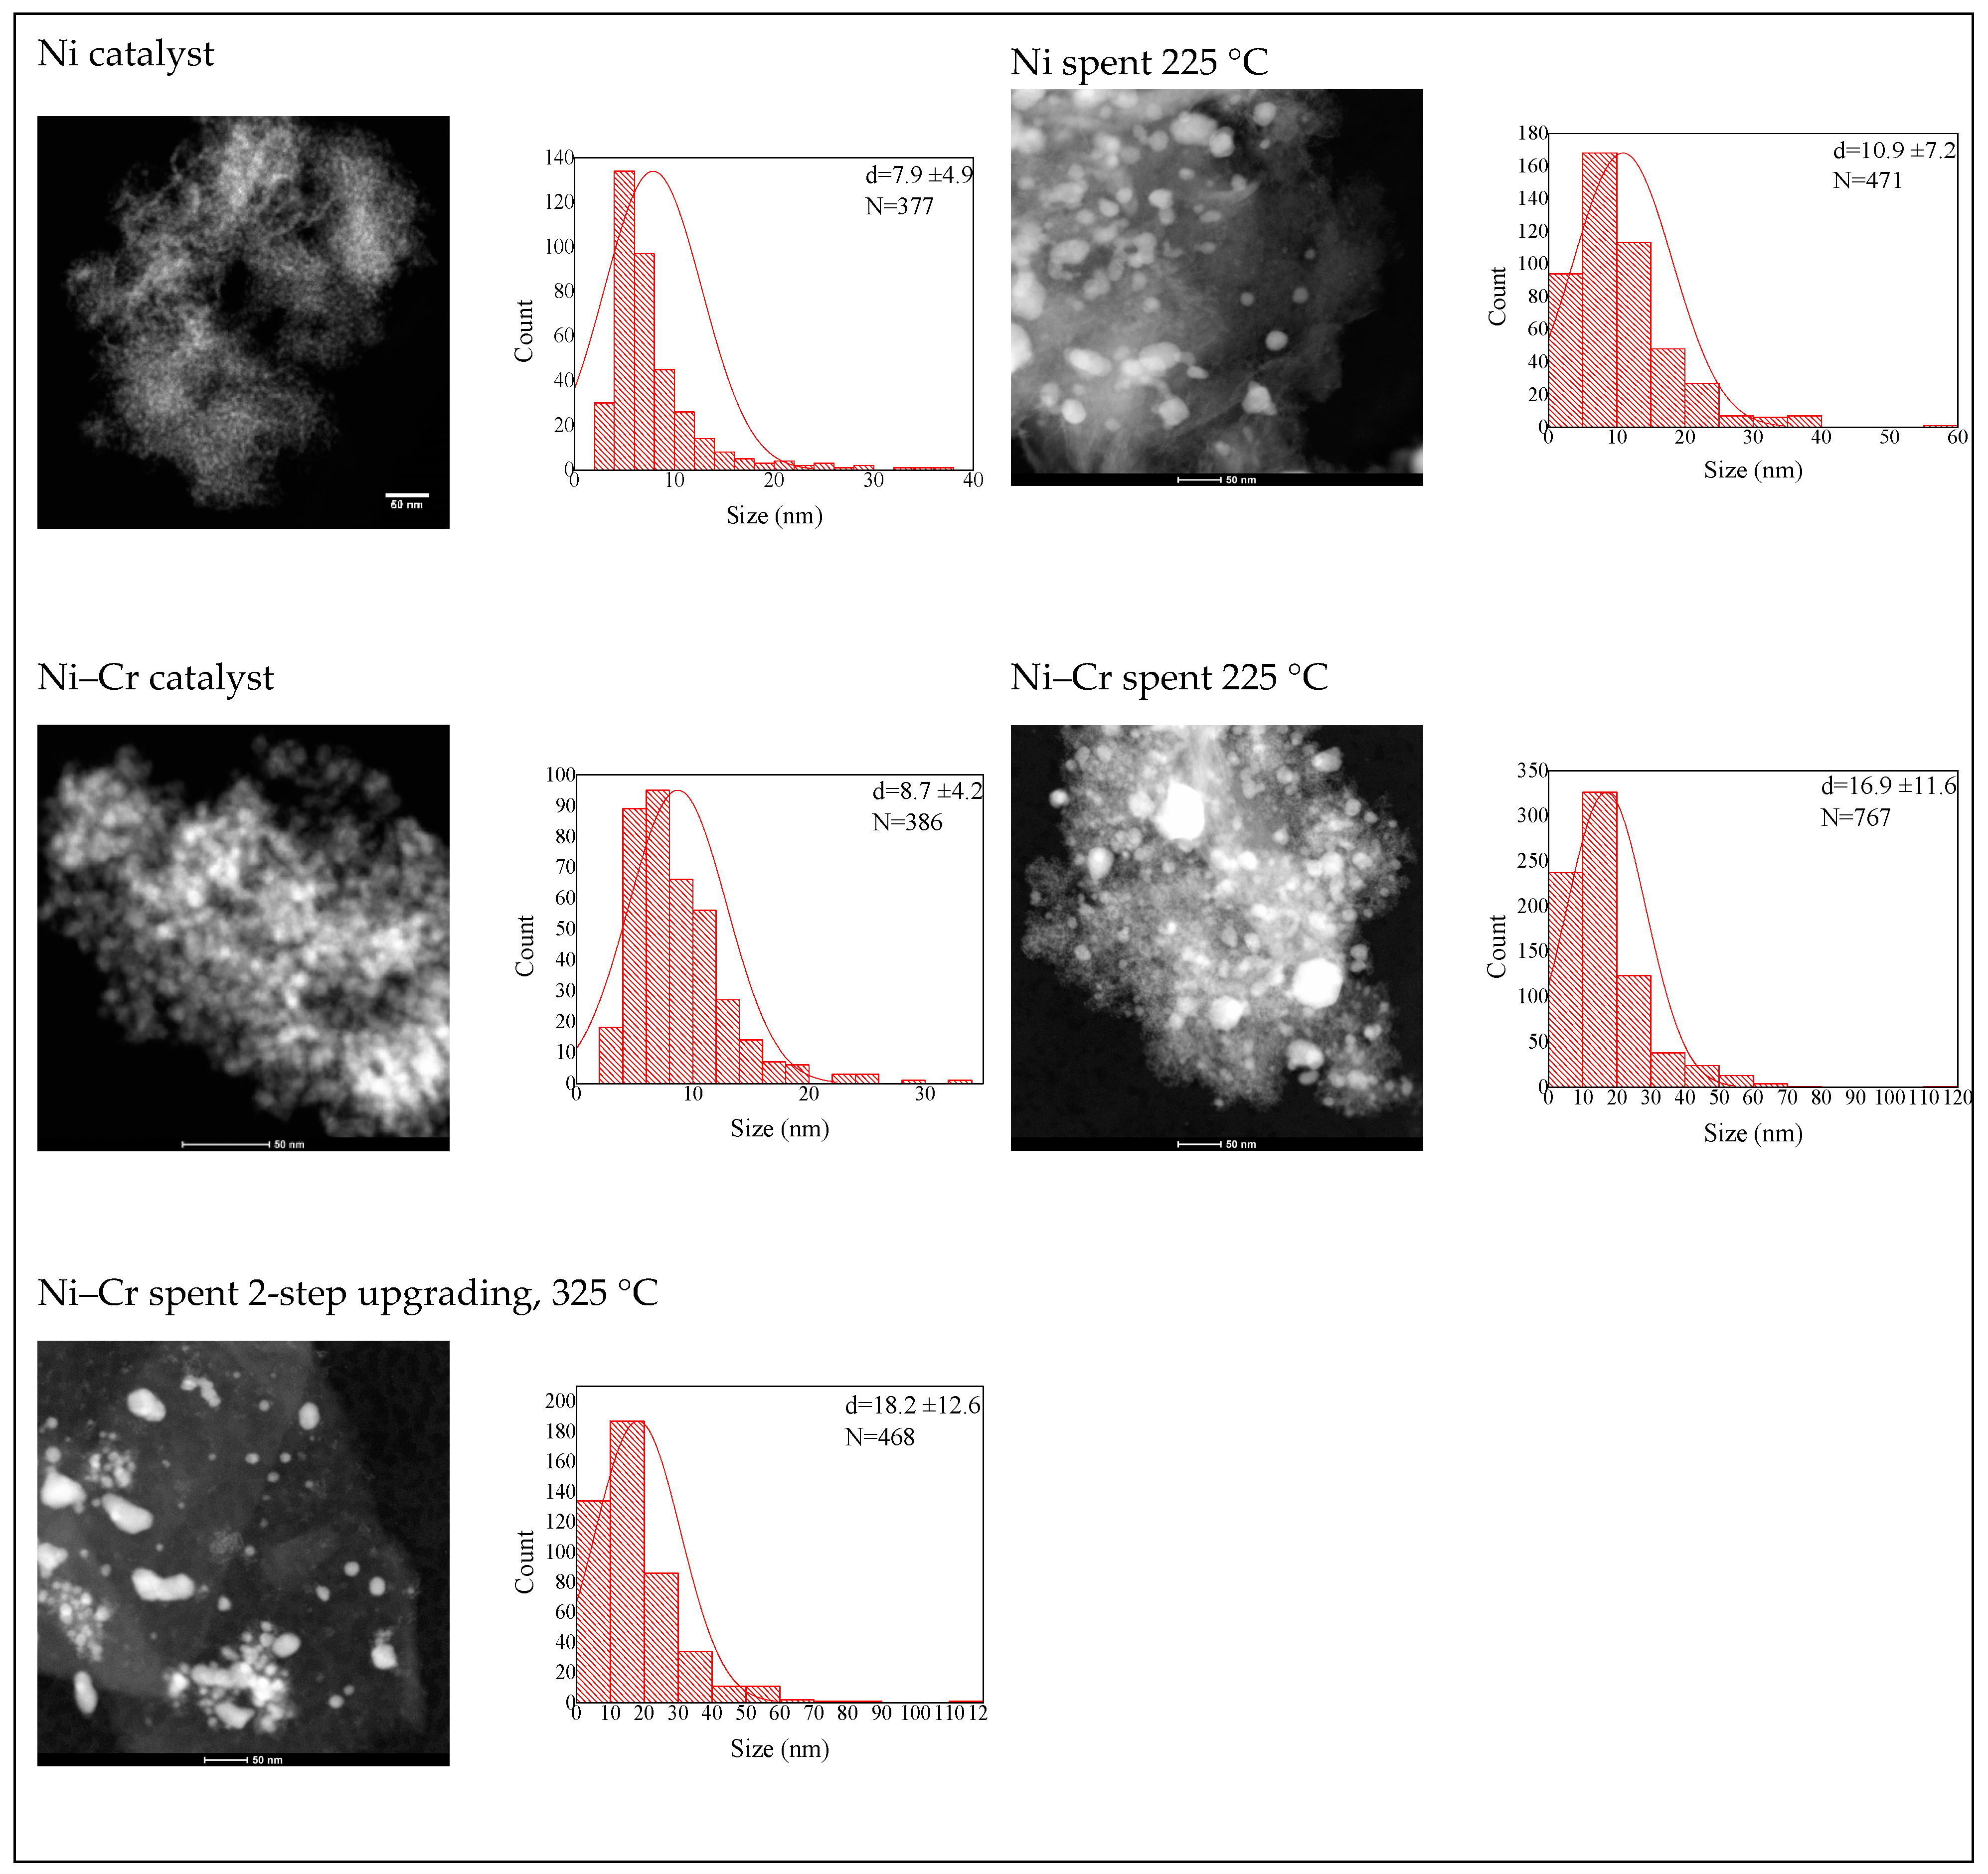
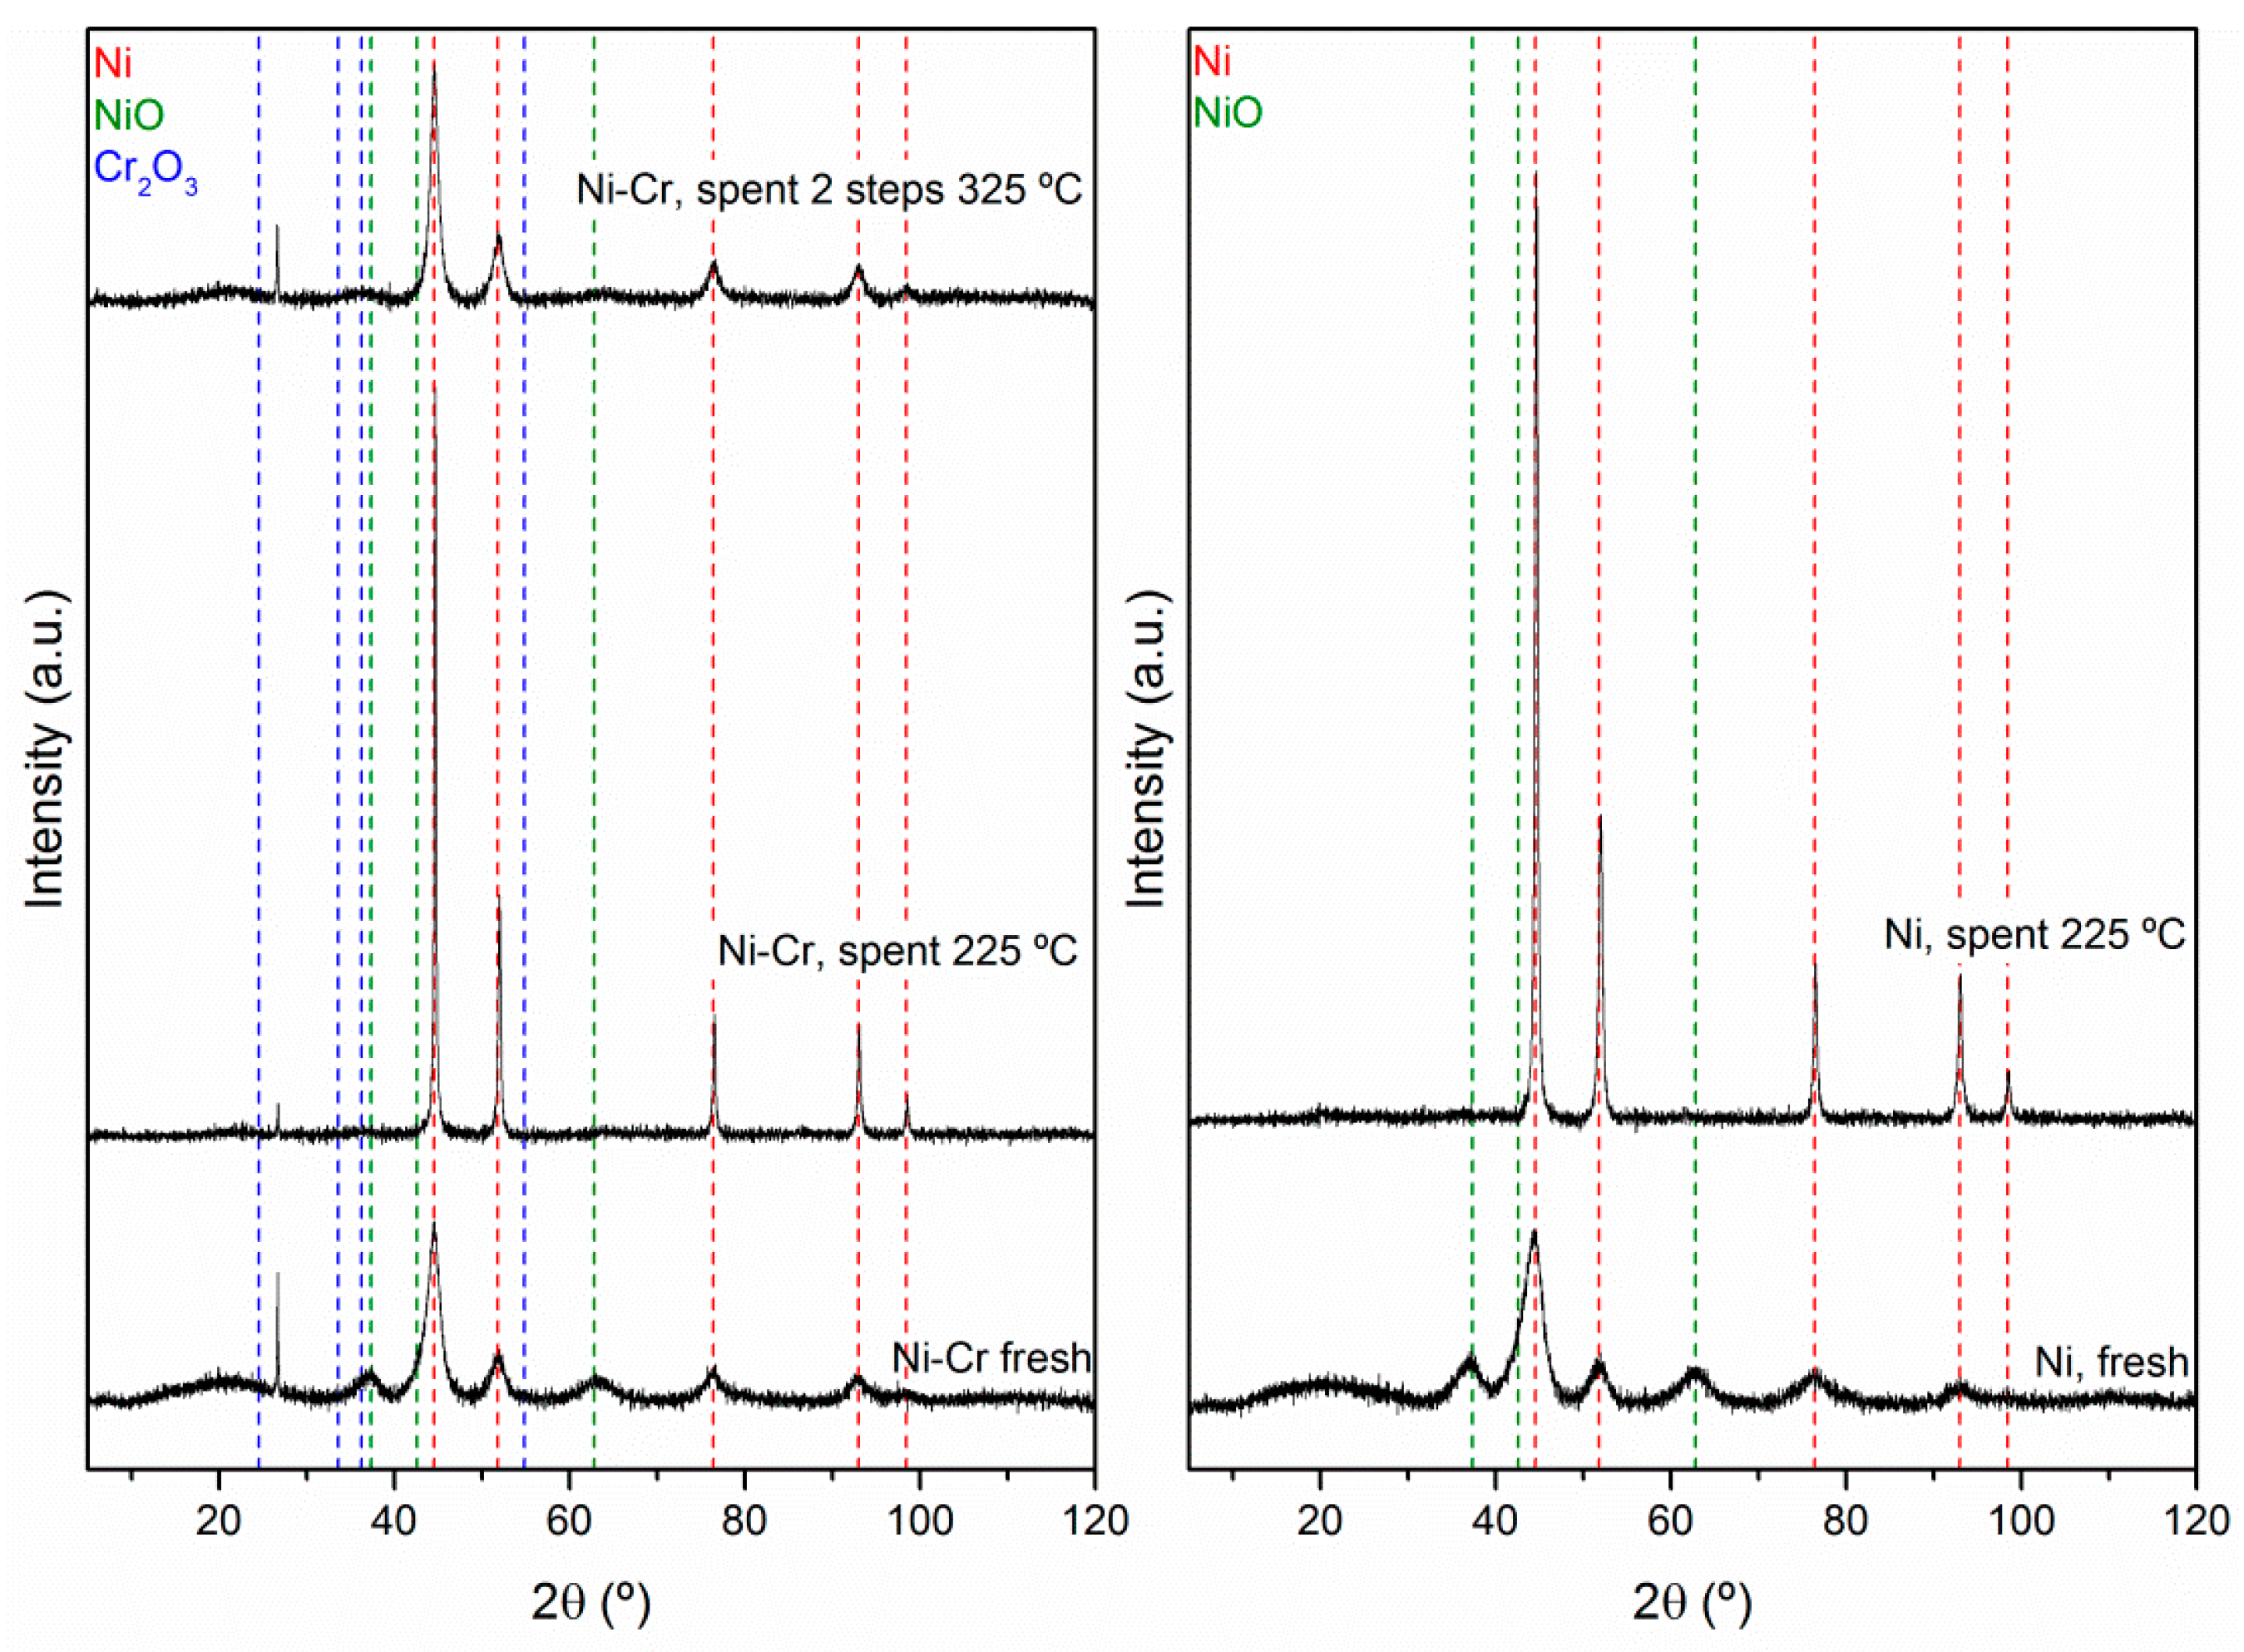
2.2. Catalysts Characterization

The Ni-based catalysts were characterized in detail by a variety of analytical techniques in order to correlate the catalytic activity and their characteristics. Considering that both Ni-based catalysts consist of metallic nickel and nickel oxide, the oxidation state transformation over reductive atmosphere was followed by in-situ X-ray absorption spectroscopy (XAS), as depicted in Figure 4. The analysis of the chemical state of the Ni ions in the fresh Ni catalyst revealed the composition of 55 at.% of NiO and 44 at.% of Ni, whereas for Ni-Cr catalyst 23 at.% of NiO and 77 at.% of Ni. Under the reductive atmosphere, the reduction of NiO in the Ni catalyst started at around 250 °C, close to bulk NiO [38], whereas the reduction of the NiO present in the Ni–Cr catalyst was observed already at around 100 °C. The complete reduction of NiO in both the Ni and Ni–Cr catalysts was reached at 450 °C and 275 °C, respectively. This observation may only partially explain the highest consumption of H2 observed in the Ni catalyst during hydrotreatment reactions, as a small amount of H2 was possibly consumed for the reduction of NiO to Ni. Moreover, the lowest temperature required for complete reduction of NiO in the Ni–Cr catalyst may be attributed to the higher metallic nickel loading, lowering the reduction temperature [35,71], whereas the small amount of Al2O3 in the catalyst formulation may interact with nickel, retarding the reduction in the Ni catalyst [72] in addition to the highest NiO concentration. Surface properties possibly also play a role in this case.
The strength and density of acid sites were obtained by temperature-programmed desorption with ammonia NH3-TPD (Figure 5). For both fresh catalysts, two desorption peaks were observed. For the Ni catalyst, the first desorption peak was around 150 °C and the second desorption peak around 300 °C. In the case of Ni–Cr, the low temperature desorption peak was observed at around 180 °C, whereas the high temperature desorption peak was observed around 355 °C. The amount of NH3 desorbed in both low and high temperature peaks is given in Table 4. The peaks at lower temperatures (up to 205 °C) are attributed to weak acid sites while the peaks at higher temperatures are attributed to moderate (250–350 °C) to strong acid sites (higher than 350 °C) [73,74].
Although higher amounts of NH3 desorbed at low and high temperatures were observed for the Ni catalyst, the broader peak observed for Ni–Cr at higher temperatures is an indication of sites with stronger acidity and is similar to the observations of Yang et al. [75] for Ni/γ-Al2O3 and Ni/CeO2 catalysts. Hence, it may indicate the presence of stronger acid sites in this catalyst, in comparison to the Ni catalyst. The presence of chromium is reported to increase the acidity of Ni-based [41] due to strong acid sites of Cr2O3 [76], which are essential for hydrodeoxygenation (HDO) reactions [8], although also related to coke formation and deactivation mechanisms. Although having different BET surface areas, the density of acid sites is nearly the same for both catalysts.
The particle size distribution of Ni-based catalysts (Figure 6) was obtained by scanning transmission electron microscopy (STEM), with at least 377 particles measured. The fresh Ni catalyst showed an average particle size of 7.9 ± 4.9 nm, reaching 10.9 ± 7.2 nm after upgrading; on the other hand, the average particle size of Ni–Cr increased from 8.7 ± 4.2 nm to 16.9 ± 11.6 nm after the reaction at 225 °C and reached 18.2 ± 12.6 nm after the 2-step upgrading at 325 °C. Both catalysts showed high heterogeneity of particle sizes after the upgrading reactions, revealing that sintering and agglomeration took place.
A similar concentration of carbon determined by elemental analysis was deposited over the spent Ni–Cr catalyst, in the range of 11 wt.%, whereas around 7.4 wt% of carbon was deposited over the spent Ni catalyst. The concentration of sulfur, on the other hand, was below the quantification limit (<0.5 wt.%) in all catalysts used in the first step upgrading, except Ni–Cr after the second upgrading, with a sulfur concentration of 0.2 wt.%. This observation agrees with the higher concentration of sulfur in the UBWBO (0.225 wt.% wet basis) in comparison to BWBO (0.011 wt.% wet basis). As previously stated that Cr2O3 may act as a trap for sulfur molecules [42], a STEM-EDX (Scanning Transmission Electron Microscopy-Energy Dispersive X-Ray Analysis) of the spent Ni–Cr catalyst at 325 °C was performed (Figure 7 and Table 5). Considering that chromium is homogeneously distributed over the particle analyzed and its surroundings, no clear preference for sulfur adsorption is observed. Additionally, carbon deposition is also homogeneously distributed over the spent catalyst particle.
The X-ray powder diffraction for fresh and spent catalysts is depicted in Figure 8. The broad reflections attributed to highly dispersed NiO disappeared after the upgrading reaction for both catalysts at 225 °C, indicating reduction to metallic nickel under H2 atmosphere. The sharper diffractions observed after the 1-step upgrading reaction indicate bigger crystallite sizes of metallic nickel in the catalysts [71]. Reflections attributed to crystalline chromium oxide were absent in the fresh and spent Ni-Cr catalysts due to the high dispersion and indicates an amorphous phase. Broader peaks are observed in the spent Ni-Cr catalyst after the 2-step upgrading; it may indicate high dispersion of metallic nickel, whereas the very low diffraction peaks of NiO may indicate oxidation of metallic nickel. The crystallite size of the Ni catalyst increased from 3.5 nm to 29.2 nm, whereas Ni–Cr increased from 4.4 nm to 61.3 nm after the 1-step reaction and to 7.6 nm after the 2-step upgrading.
In terms of leaching, less than 0.7 wt.% of Ni was leached from both catalysts to the upgraded aqueous phase at 175 °C and 225 °C. The lowest concentration of nickel leached was observed at the second step upgrading, with 0.1 wt.% of Ni leached at 325 °C. It can be attributed to the low concentration of water of UBWBO and to the highest pH in comparison to BWBO. For all reactions, chromium was below the quantification limit of 0.011 wt.% in the upgraded aqueous phase, meaning that the amount of chromium leached was below 0.2 wt.% of the total chromium added to the autoclave.

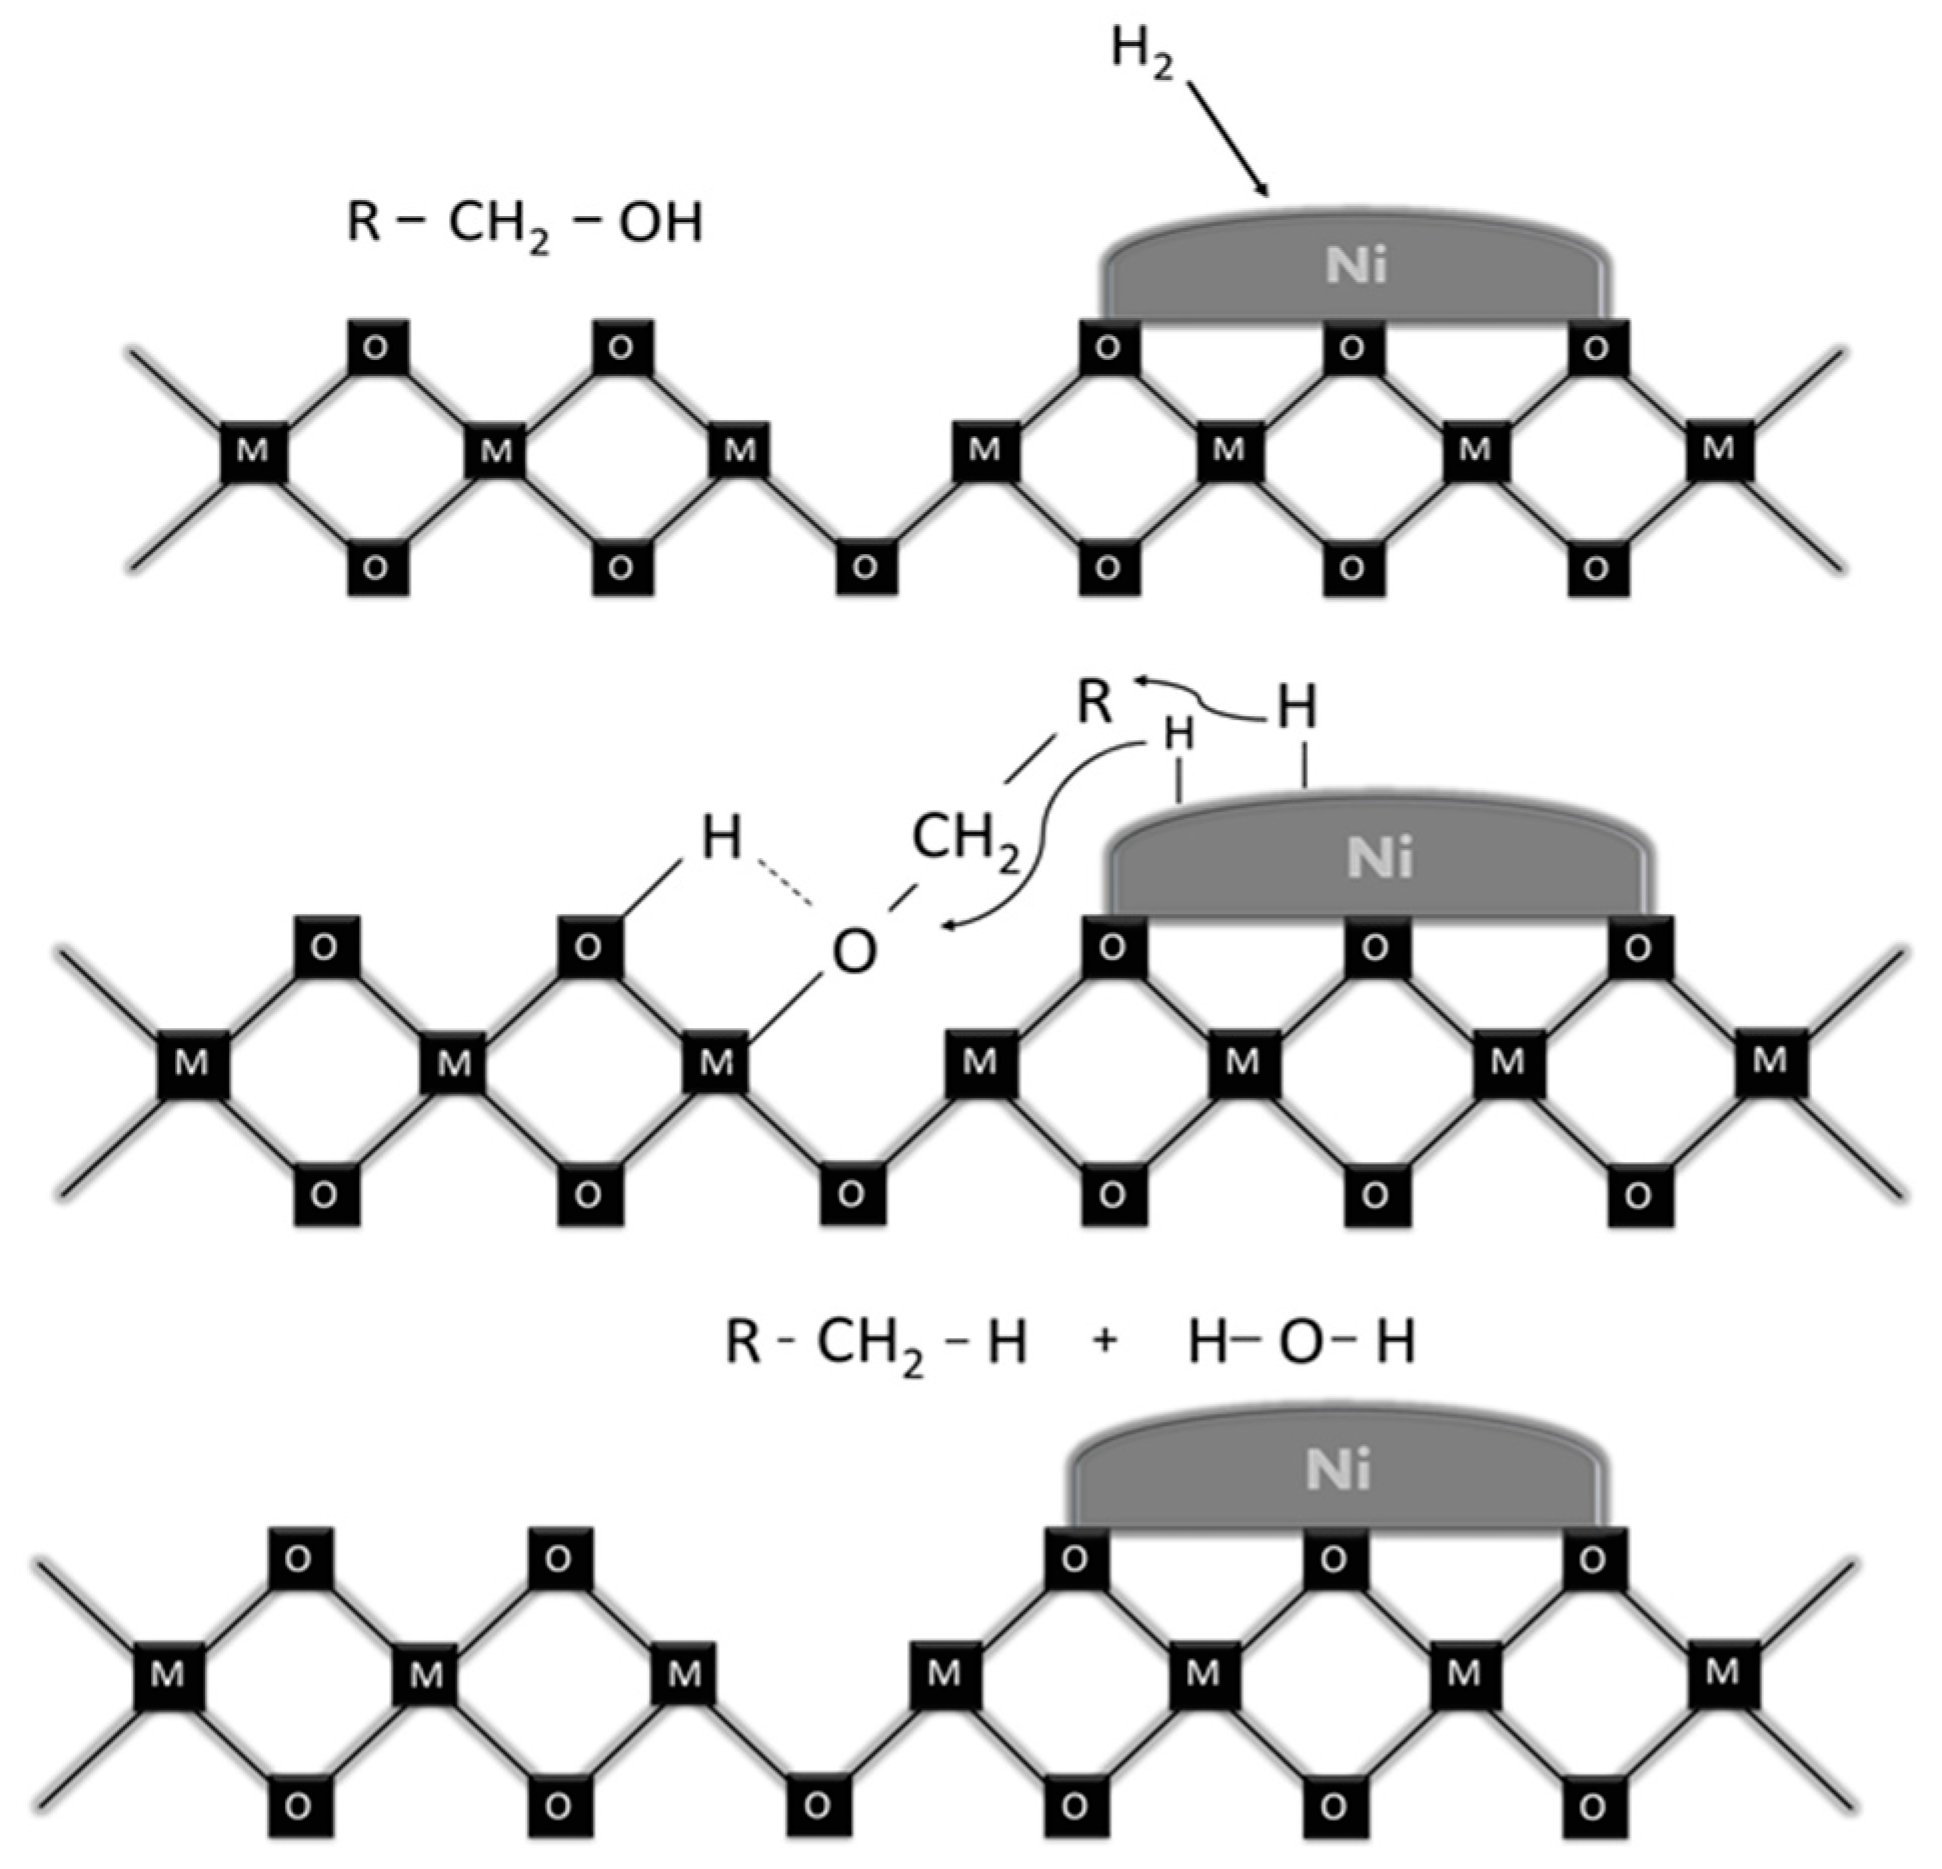
Correlation of Catalytic Performance vs. Properties of Ni-Based Catalysts

The highest catalytic activity of Ni–Cr catalyst, especially at 225 °C, may be explained not only by the strongest acid sites observed by NH3-TPD, considering that the density of acid sites was nearly the same for both catalysts (Table 4), but also in terms of metal oxygen bonding, as suggested by Mortensen et al. [72]. According to the authors, the lower the oxygen–metal bond strength, the higher the hydrogenation activity of oxides due to the facility to generate oxygen vacancy in the support and/or in the promoters. In the current study, the oxygen–metal bond strength of the oxides in both Ni-based catalyst formulation decreases in the following order [77]: SiO2 > Al2O3 > Cr2O3. Hence, the lower the oxygen–metal bond strength, the higher the propensity to form strong acid sites, and more oxygen vacancies are available there, with increasing not only the hydrogenation activity as reported by previous authors but also, in our case, the hydrodeoxygenation activity. This assumption agrees with the observations for the Ni–Cr catalyst due to the promoter effect of Cr2O3.
Additionally, the presence of NiO in both Ni-based catalysts also plays a role in the catalytic activity. NiO acts synergistically with metallic Ni and the support, contributing a higher extent to hydrogenation as well as to hydrodeoxygenation pathways due to oxygen vacancies [78]. However, due to the reductive atmosphere, NiO is reduced to being metallic along the hydrotreatment reaction, confirmed by XRD results, and its contribution is reduced as the reaction time increases. The metallic Ni originally in the catalyst composition as well as that formed after NiO reduction promotes the dissociation of H2, which will further hydrogenate the molecules adsorbed over the catalyst surface [79]. The highest atomic percentage of metallic nickel available at the Ni–Cr catalyst in contrast to the Ni catalyst may result in higher availability of dissociated H2, also contributing to the highest hydrogenation activity observed for this catalyst.
Hence, the reaction pathways including hydrogenation and hydrodeoxygenation in both Ni-based catalysts involves a complex system, in which support and promoters acid sites and metallic centers are involved. The hydrodeoxygenation simplified in Figure 9 is reported to be initiated by the adsorption of oxygen containing compounds over the catalyst support surface, while the hydrogen is adsorbed and dissociated over the reduced metal. The adsorption of oxy compounds is facilitated by the oxygen vacancy in the oxide surface, and the new oxygen vacancies are generated after the elimination of water formed due to the H2 atmosphere [9,72]. The cleavage of the C–O bond occurs then due to electron donation. The hydrodeoxygenated molecule is desorbed, and the active acid site is restored. The differences in selectivity observed are then correlated to the composition of both Ni-based catalysts [9].
Other characteristics of the catalysts are also correlated with the catalytic activity. The metallic particle size is considered to play a role during the hydrotreatment, by the cleavage of C–O bonds in the step and corner sites [80] as well as by promoting the hydrogenation pathway [81]. However, the similar particle sizes for both Ni-based catalysts leads to the assumption that other parameters such as chemical composition and strength of acid sites contributed to the differences observed in terms of selectivity, H2 consumption, and other parameters discussed previously in Section 2.1.

3. Materials and Methods

3.1. Fast Pyrolysis Bio-Oils

The reactions were performed using beech wood fast pyrolysis bio-oil produced in a rotating cone reactor that was provided by BTG Biomass Technology Group BV, the Netherlands. The oil was composed of one denser phase, a denominated heavy phase (HP), and a light phase (LP), concentrated in the top layer. The phase separation was initiated by intentional ageing at 80 °C for 24 h. The phases were stored separately and mixed again prior to the reactions in the same proportion as that found in the original oil (41 wt.% HP and 59 wt.% LP). This bio-oil is referred to as BWBO; further information can be found elsewhere [82]. Additionally, we have recently reported the evaluation of Ni-based catalysts synthesized by wet impregnation for hydrotreatment of FBPO [13]; the best performance obtained with Ni/SiO2 with 7.9 wt.% of Ni loading at 8 MPa of H2 and 325 °C for 2 h resulted in upgraded oil with reduced oxygen content, although deep deoxygenation levels were not achieved. Furthermore, ketones were formed after upgrading. Then, in order to achieve deeper deoxygenation levels, the previously upgraded FPBO was further upgraded in this study and referred to as UBWBO (upgraded beech wood bio-oil). More information about the upgrading conditions of UBWBO is given in the Supplementary Materials (see Section S.1). The composition of both pyrolysis oils used in this study are given in Table 1.

3.2. Catalysts

The upgrading reactions were conducted with three catalysts: Ru/C (Sigma Aldrich) with 5 wt.% of metal loading and a specific surface area of 870 m2 was selected as the standard catalyst, considering the application of this catalyst in previous studies [11,18,21,32,37] and its higher activity for hydrodeoxygenation compared to other noble metals [72]. Additionally, two commercial catalysts with high loading of nickel were evaluated. The first Ni-based catalyst is composed of 50 wt.% of Ni (30 wt.% metallic nickel and 26 wt.% NiO), 15 wt.% of Cr2O3, and 1.5 wt.% of graphite in diatomaceous earth support (27 wt.%, mainly silica; see Reference [52]). The catalyst shows a specific surface area of 94 m2. The catalyst is referred to as Ni–Cr within the manuscript. The second Ni-based catalyst is composed of 60 wt.% of nickel, from which around ≤25–<50 wt.% are present as NiO, along with smaller concentrations of ZrO2 (≤1–<3 wt.%) and Al2O3 (≤3–<5 wt.%) in diatomaceous earth support. The catalyst shows a specific surface area of 190 m2 and is referred to as the Ni catalyst within the manuscript. The pre-reduced catalysts were used in the upgrading reactions as received from the supplier.

3.3. Methodology

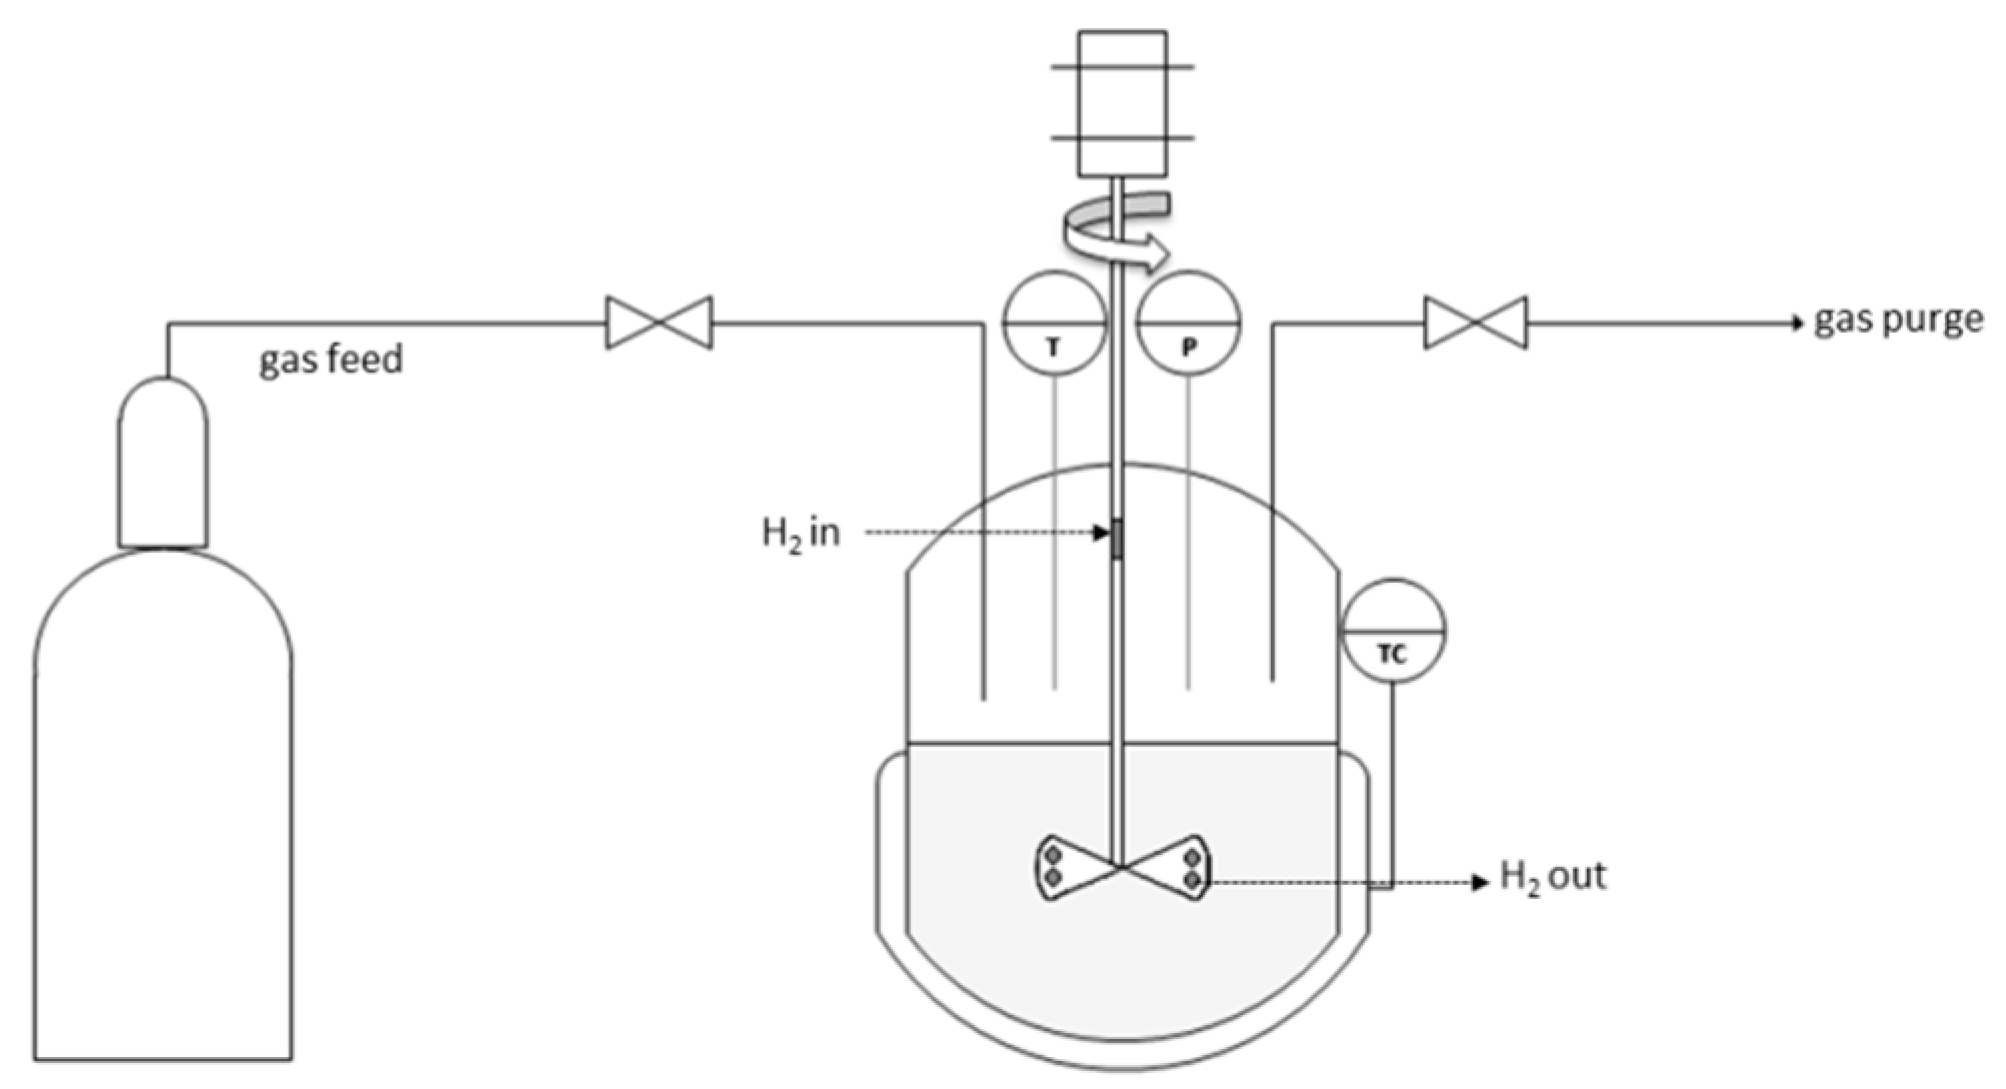
3.3.1. Reaction Conditions

The reactions were conducted in a batch autoclave (200 mL, Tmax: 400 °C, pmax: 36 MPa). Approximately 50 g of the bio-oil to be upgraded was transferred to the autoclave with the addition of 2.5 g of the catalyst to be tested. After purging with an inert gas (N2 Air Liquide 6.0), the autoclave was pressurized with H2 high purity (Air Liquide 6.0) to 8 MPa at ambient pressure and closed. The gas supply was then disconnected from the autoclave before the reaction. The magnetic gas injection stirrer (torque 80 Ncm, Premex AG) was adjusted to 1000 rpm in order to improve the hydrogen transfer to the reaction mixture (Figure 10) and possibly to improve the hydrogenation pathway [51], reducing polymerization [50]. The reactor was heated by cartridges in a brass mantle. The temperature difference between the heating cartridge and the temperature inside the reactor was 10 °C.
The influence of the reaction time was investigated, and the upgrading experiments were conducted for total times of 2 h and 4 h (including the heating ramp). The reactions were mainly conducted at the temperatures of 175 °C and 225 °C; however, based on our preliminary investigation [13,52], a temperature of 325 °C was selected for the second upgrading of UBWBO, aiming a higher deoxygenation degree. The second upgrading step was conducted with the Ni–Cr catalyst. The catalyst was selected for the 2-step upgrading based on the parameters of hydrogen consumption, degree of deoxygenation, pyrolysis oil yield, and reaction pathways observed in the 1-step upgrading. For the conditions of temperature and reaction time, the set point was reached at a rate of 5 °C·min−1. Once the reaction is completed, the reactor is rapidly cooled to approximately 40–30 °C by pressurized air flow and then further cooled to 20–23 °C with an ice bath. At this point, the reactor is depressurized and the gas is collected for further composition analysis (See Section 3.3.3). The initial and final pressures were recorded for calculation of the hydrogen consumed (mol of H2·Kg−1 of pyrolysis oil) during the reaction (Equation S1).

3.3.2. Liquid Products and Feedstock Characterization

The liquid products and feedstock characterization were performed using a variety of analytical techniques. Carbon, hydrogen, and nitrogen contents were determined by elemental analysis using a CHN analyzer 628 Leco. When very low amounts of the sample were available, the elemental analysis was performed by a Vario El cube micro-elemental analyzer. In both cases, the oxygen content was obtained by the difference and the concentration used for determination of the degree of deoxygenation (Equation (S6)).
The pH value was determined using a pH-meter 691, and the water content was determined by Karl Fischer Tritando 841. The calorific value was determined by calorimeter IKA C5000. Sulfur and metal content (leached after the reactions) were obtained by inductively coupled plasma optical emission spectrometer Agilent, 725. For this measurement, the upgraded aqueous phase samples were filtrated using a 0.2-µm polytetrafluoroethylene filter.
The distribution of functional groups in the products as well as in the feedstock were obtained by proton NMR (1H-NMR). The samples were prepared by diluting 0.1 g of sample (after centrifugation for solid removal for 3 min; neoLab mini centrifuge D-6015) with 0.7 g of deuterated methanol (Sigma Aldrich, 99.8 at.% D) containing 2 g of sodium 3-trimethylsilyl-2-2′,3,3′-tetradeuteropropionate in 1 L of solution as the internal standard. The spectrum treatment was performed using the software MestReNova by integration of the spectra in pre-defined regions.
Further quantitative and qualitative investigations of the liquid fractions were performed by GC-MS/FID at Thünen Institute in Hamburg, Germany. One μL of sample diluted in acetone with fluoranthene as the internal standard was injected at 250 °C into a HP 6890 gas chromatograph. The instrument was equipped with a cyanopropyl-phenyl-methylpolysiloxane column (60 m × 0.25 mm × 0.25 μm), and the heating ramp was programmed as follows: the program started at 45 °C, was kept for 4 min, was heated to 280 °C at 4 °C·min−1, was and kept at this temperature for 20 min. Eluted compounds were analyzed by a mass spectrometry detector (HP 5972 ms) and a flame ionization detector (FID). The compounds were analysed, qualitatively comparing the spectra with a NIST and an in-house developed library.

3.3.3. Gas Product Characterization

The gaseous components after the upgrading reactions were analyzed by gas chromatography. After collection, 100 µL of the sample was injected into the gas chromatograph (Agilent 7890A) at the following conditions: injector temperature of 250 °C, oven set at initial temperature of 50 °C (10 min), heated at 3 °C·min−1 to 90 °C and then at 20 °C.min−1 until 150 °C (16 min), and finally heated at a rate of 50 °C.min−1 (10 min). Separation of the compounds was performed by two columns: Molsieve 5A and Hayesep 57096, Restek, and the compounds were detected by thermal conductivity (TCD) and flame ionization (FID) detectors.

3.3.4. Characterization of Ni-Based Catalysts

The catalyst structure was analyzed by complementary analytical techniques before (as received) and after the upgrading reactions. The Ni-based catalysts were analyzed in-situ by X-ray absorption spectroscopy (XAS) at the CAT-ACT beamline and at the synchrotron radiation source at KIT (Karlsruhe, Germany) [83]. The samples were finely sieved in the range of 90–200 μm (SIEVE machine details: Pias lab, 10 min) and diluted with SiO2 sieved in the same range. The Ni catalyst was diluted 1:2, whereas the Ni–Cr catalyst was diluted 1:8. The temperature programmed reduction (TPR) were conducted with 50 mL·min-1 of 5% H2 in Helium, with the heating rate of 5 °C·min-1 up to 450 °C. The measurement at Ni K edge (8333 eV) was performed in transmission mode. The software Athena was used for analysis of the spectra. The linear combination fitting was performed using Ni and NiO standards.
Temperature-programmed desorption with ammonia (NH3-TPD) was used in order to evaluate the acidity of the nickel catalysts. The measurement was performed at Ruhr University Bochum in a BELCAT II (fully automated TPD set up, BEL Japan), coupled with online QMS detector (GAM 400 quadrupole mass spectrometer, Balzers Germany). An amount of 100 mg of the sample was pretreated by flushing with Helium (Nml/min) for 30 min at 40 °C and for 30 min with 3.5% H2/Ar (50 Nml/min) at 40 °C. The sample was then heated to 250 °C at a rate of 5 K·min−1 and reduced for 120 min at this temperature. In the sequence, the sample was flushed with He (50 Nml·min−1) at 250 °C for 30 min and cooled down to 100 °C. The NH3 adsorption was conducted at 100 °C using a mixture of 10% NH3/He for 60 min. The residual NH3 adsorbed in internal piping was removed by flushing the system for 60 min with 50 Nml·min−1 of He. The measurement was then performed, heating the sample from 100 °C to 600 °C at a rate of 5 K·min−1 in He (30 Nml·min−1), and the desorbed compounds were detected by the online QMS detector.
X-ray diffractions of the catalysts before and after the reaction were measured in a diffractometer X’Pert PRO MPD PANalytical equipped with a copper anode (Cu Kα 1.54060 Å). The measurements were performed from 5° to 120° (step size of 0.017°) in a 2θ range. The total measurement time was 60 min. The Scherrer equation was used to calculate the average crystallite size (shape factor K = 0.9), considering the reflection with the highest intensity. The instrument line broadening was corrected before the calculation. The software X’PertHighscore Plus was used for data analysis.
The solid deposition on the spent Ni-based catalyst was determined by a Vario El cube micro-elemental analyzer, considering that the solid deposition was mainly composed of carbon, with negligible concentration of oxygen [13]. The difference between the carbon concentration in the fresh and spent catalysts was used for the calculation. In the case of Ru/C, the solid was determined by the difference in weight of fresh catalyst loaded in the batch autoclave and the weight after the upgrading. The moisture content, determined by thermogravimetric analysis (TGA), was discounted for the calculation. This measurement was performed in a TGA analyzer Netzsch STA 409, heating the sample at 10 °C·min−1 from 20 °C to 105 °C at air flow of 70 mL·min−1. The sample remained at 105 °C for an hour, and the moisture was obtained by the mass loss recorded.
Further characterization of the catalysts before and after the reaction was performed by transmission electron microscopy (TEM). The measurements were performed at the Institute of Nanotechnology at KIT, with a Titan 80–300 (FEI, USA) transmission electron microscope with an acceleration voltage of 300 kV. Samples were prepared by depositing a small amount of powder on a carbon-coated copper grid. The software TIA was used for analysis to visualize the morphology and to map the elemental distribution. Particle size distribution was derived with the support of the FIJI software.

4. Conclusions

The hydrotreatment of a beech wood fast pyrolysis bio-oil applying two Ni-based catalysts with high loading of Ni was evaluated in comparison to the Ru/C catalyst. The influences of promoter, temperature, and reaction time were correlated with the composition and yields of upgraded products. The evaluation of 2-step upgrading for deep deoxygenation level was also investigated.
The upgraded oil yields achieved at 1-step upgrading were higher with Ni-based catalysts in comparison to Ru/C. The highest upgraded oil yield of 51.5 wt.% with Ni–Cr catalysts contrasted to 34.5 wt.% with Ru/C at 225 °C. The lowest yield in this case correlates to the highest gas production with the noble metal catalyst. Comparable deoxygenation values and carbon and hydrogen contents were observed in the upgraded oils with Ni–Cr and Ru/C. However, the highest H/C ratios for the oils upgraded with Ni-based catalysts agree with the highest hydrogenation activity in comparison to Ru/C, especially Ni–Cr at 225 °C. Hence, the increase in the temperature showed a positive effect over 1-step upgraded oil.
Both Ni-based catalysts reduced significantly the concentration of ketones and showed activity towards alcohols formation. The highest conversion of ketones, organic acids, and sugars and the highest amount of alcohols in the upgraded liquid products with Ni–Cr in contrast to the Ni catalyst is attributed to the difference in formulation as well as to the strength of acid sites promoted by Cr2O3.
The influence of reaction time showed that the longer the reaction time is, the higher the oil yield, solid yield, and hydrogen consumption while the water content is reduced. The chemical composition of upgraded oils in terms of elemental analysis, gas production, and gas composition are comparable at 2 and 4 h of the reaction.
Particularly interesting is 2-step upgrading. The upgraded oil after 2-step upgrading showed 90% less water, 64.8% less oxygen, and a higher heating value of 90.1% higher compared to the original beech wood fast pyrolysis oil. The increase in methane formation in comparison to a 1-step reaction may correlate to a nearly total conversion of acetic acid, considering that only 3% remained in the 2-step upgraded liquids. On the other hand, the discrepancy of aromatic compounds quantified by 1H-NMR and GC-MS/FID may indicate that polymerization of aromatics took place during the second upgrading step.
The solid formation for the 1-step and 2-step reactions was below 1% and was evenly distributed over the catalysts used for 1-step reactions. Carbon and sulfur were observed to be homogeneously distributed over the 2-step spent Ni–Cr catalyst surface.
Thus, both high-loading Ni-based catalysts produce high yields of upgraded oils with properties comparable to oil upgraded with Ru/C. However, further investigation should address the optimization of 2-step upgrading to reach deeper levels of hydrodeoxygenation while the resistance of both Ni-based catalysts to sulfur poisoning should be investigated, considering especially the influence of Cr2O3. For this investigation, a continuously operated experimental-setup is proposed.

Supplementary Materials

The following are available online at https://www.mdpi.com/2073-4344/9/9/784/s1. Figure S1: Autoclave used during the experiments, Figure S2: Detailed of the upgraded products after the centrifugation step, Figure S3: Upgraded products separated after centrifugation. From the left to the right: spent catalyst after filtration; upgraded aqueous phase and the two last samples in the right side are the upgraded oil, Figure S4: Products obtained after the second upgrading performed with UBWBO. From the left: upgraded aqueous phase and two bottles containing the upgraded oil, Figure S5: NH3-TPD of fresh nickel-based catalysts. Left: Ni catalyst; Right: Ni-Cr catalyst, Table S1: Characterization of upgraded beech wood fast pyrolysis bio-oils obtained with Ni/SiO2, Table S2: Comparison of reactions conducted with Ni catalyst at 225 °C for 2 h and 4 h, wet basis, Table S3: Elemental analysis and physicochemical properties of upgraded aqueous phase upgraded with Ni, Ni-Cr and Ru/C catalysts, Table S4: Single compounds identified by GC-MS/FID in the upgraded oils and feedstocks.

Author Contributions

C.C.S. designed and performed the experiments, analyzed the data, and wrote the manuscript; A.Z. contributed with the X-ray absorption spectroscopy; Y.F. contributed to the transmission electron microscopy; K.R., J-D.G., and N.D. reviewed the manuscript, contributed to the discussion, and supervised the work.

Funding

This research received no external funding.

Acknowledgments

The authors acknowledge the Brazilian National Council of Science and Technology and the Bioeconomy Graduate Program—BBW Forwerts for the financial support. The authors are grateful to Volker Hagen for the NH3-TPD measurements and to Wang Wu for the support with TEM measurements. The work (of STEM/EDX measurements) was carried out with the support of the Karlsruhe Nano Micro Facility, a Helmholtz Research Infrastructure at Karlsruhe Institute of Technology. We also thank Armin Lautenbach, Pia Griesheimer, Melany Frank, Jessica Heinrich, and Petra Janke for the support with samples characterization. We would like to thank the Institute for Beam Physics and Technology (IBPT) for the operation of the storage ring, the Karlsruhe Research Accelerator (KARA). We acknowledge the KIT light source for provision of instruments at the CAT-ACT beamline of the Institute of Catalysis Research and Technology (IKFT), in particular Dr. Tim Prüßmann (IKFT) for his help and technical support during experiments.

Conflicts of Interest

The authors declare no conflict of interest.

Abbreviations

BWBOBeech wood fast pyrolysis bio-oil
UBWBOUpgraded beech wood bio-oil
LPLight Phase
HPHeavy Phase
UAPUpgraded aqueous phase
UOPUpgraded oil phase
LPBWBOLight phase of beech wood fast pyrolysis bio-oil
HPBWBOHeavy phase of beech wood fast pyrolysis bio-oil
UAPNi, 225 °CUpgraded aqueous phase with Ni catalyst at 225 °C
UOPNi, 225 °CUpgraded oil phase with Ni catalyst at 225 °C
UAPNi–Cr, 225 °CUpgraded aqueous phase with Ni–Cr catalyst at 225 °C
UOPNi–Cr, 225 °CUpgraded oil phase with Ni–Cr catalyst at 225 °C
UAP2nd, Ni–Cr, 325 °C2-step upgraded aqueous phase with Ni–Cr catalyst at 325 °C
UOP2nd, Ni–Cr, 325 °C2-step upgraded oil phase with Ni–Cr catalyst at 325 °C

References

  1. Anwar, Z.; Gulfraz, M.; Irshad, M. Agro-industrial lignocellulosic biomass a key to unlock the future bio-energy: A brief review. J. Radiat. Res. Appl. Sci. 2014, 7, 163–173. [Google Scholar] [CrossRef]
  2. Dahmen, N.; Lewandowski, I.; Zibek, S.; Weidtmann, A. Integrated lignocellulosic value chains in a growing bioeconomy: Status quo and perspectives. GCB Bioenergy 2019, 11, 107–117. [Google Scholar] [CrossRef]
  3. Xiu, S.; Shahbazi, A. Bio-oil production and upgrading research: A review. Renew. Sustain. Energy Rev. 2012, 16, 4406–4414. [Google Scholar] [CrossRef]
  4. Bozell, J.J.; Holladay, J.E.; Johnson, D.; White, J.F. Top Value-Added Chemicals from Biomass Volume II—Results of Screening for Potential Candidates from Biorefinery Lignin; U.S. Department of Energy: Washington, DC, USA, 2007; Volume II.
  5. Kan, T.; Strezov, V.; Evans, T.J. Lignocellulosic biomass pyrolysis: A review of product properties and effects of pyrolysis parameters. Renew. Sustain. Energy Rev. 2016, 57, 126–1140. [Google Scholar] [CrossRef]
  6. Ardiyanti, A.R.; Khromova, S.A.; Venderbosch, R.H.; Yakovlev, V.A.; Melián-Cabrera, I.V.; Heeres, H.J. Catalytic hydrotreatment of fast pyrolysis oil using bimetallic Ni-Cu catalysts on various supports. Appl. Catal. A Gen. 2012, 449, 121–130. [Google Scholar] [CrossRef]
  7. He, Z.; Wang, X. Hydrodeoxygenation of model compounds and catalytic systems for pyrolysis bio-oils upgrading. Catal. Sustain. Energy 2012, 1, 28–52. [Google Scholar] [CrossRef]
  8. Mortensen, P.M.; Grunwaldt, J.D.; Jensen, P.A.; Knudsen, K.G.; Jensen, A.D. A review of catalytic upgrading of bio-oil to engine fuels. Appl. Catal. A Gen. 2011, 407, 1–19. [Google Scholar] [CrossRef]
  9. Dabros, T.M.H.; Stummann, M.Z.; Høj, M.; Jensen, P.A.; Grunwaldt, J.-D.; Gabrielsen, J.; Mortensen, P.M.; Jensen, A.D. Transportation fuels from biomass fast pyrolysis, catalytic hydrodeoxygenation, and catalytic fast hydropyrolysis. Prog. Energy Combust. Sci. 2018, 68, 268–309. [Google Scholar] [CrossRef]
  10. Saidi, M.; Samimi, F.; Karimipourfard, D.; Nimmanwudipong, T.; Gates, B.C.; Rahimpour, M.R. Upgrading of lignin-derived bio-oils by catalytic hydrodeoxygenation. Energy Environ. Sci. 2014, 7, 103–129. [Google Scholar] [CrossRef]
  11. Boscagli, C.; Yang, C.; Welle, A.; Wang, W.; Behrens, S.; Raffelt, K.; Grunwaldt, J.D. Effect of pyrolysis oil components on the activity and selectivity of nickel-based catalysts during hydrotreatment. Appl. Catal. A Gen. 2017, 544, 161–172. [Google Scholar] [CrossRef]
  12. Elliott, D.C.; Hart, T.R.; Neuenschwander, G.G.; Rotness, L.J.; Olarte, M.V.; Zacher, A.H.; Solantausta, Y. Catalytic hydroprocessing of fast pyrolysis bio-oil from pine sawdust. Energy Fuels 2012, 26, 3891–3896. [Google Scholar] [CrossRef]
  13. Schmitt, C.C.; Reolon, M.G.; Zimmermann, M.; Raffelt, K.; Grunwaldt, J.-D.; Dahmen, N. Synthesis and Regeneration of Nickel-Based Catalysts for Hydrodeoxygenation of Beech Wood Fast Pyrolysis Bio-Oil. Catalysts 2018, 8, 449. [Google Scholar] [CrossRef]
  14. Venderbosch, R.H.; Ardiyanti, A.R.; Wildschut, J.; Oasmaa, A.; Heeres, H.J. Stabilization of biomass-derived pyrolysis oils. J. Chem. Technol. Biotechnol. 2010, 85, 674–686. [Google Scholar] [CrossRef]
  15. French, R.J.; Stunkel, J.; Baldwin, R.M. Mild hydrotreating of bio-oil: Effect of reaction severity and fate of oxygenated species. Energy Fuels 2011, 25, 3266–3274. [Google Scholar] [CrossRef]
  16. Gholizadeh, M.; Gunawan, R.; Hu, X.; De Miguel Mercader, F.; Westerhof, R.; Chaitwat, W.; Hasan, M.M.; Mourant, D.; Li, C.Z. Effects of temperature on the hydrotreatment behaviour of pyrolysis bio-oil and coke formation in a continuous hydrotreatment reactor. Fuel Process. Technol. 2016, 148, 175–183. [Google Scholar] [CrossRef]
  17. Phimsen, S.; Kiatkittipong, W.; Yamada, H.; Tagawa, T.; Kiatkittipong, K.; Laosiripojana, N.; Assabumrungrat, S. Nickel sulfide, nickel phosphide and nickel carbide catalysts for bio-hydrotreated fuel production. Energy Convers. Manag. 2017, 151, 324–333. [Google Scholar] [CrossRef]
  18. Boscagli, C.; Raffelt, K.; Grunwaldt, J.D. Reactivity of platform molecules in pyrolysis oil and in water during hydrotreatment over nickel and ruthenium catalysts. Biomass Bioenergy 2017, 106, 63–73. [Google Scholar] [CrossRef]
  19. Wildschut, J.; Iqbal, M.; Mahfud, F.H.; Cabrera, I.M.; Venderbosch, R.H.; Heeres, H.J. Insights in the hydrotreatment of fast pyrolysis oil using a ruthenium on carbon catalyst. Energy Environ. Sci. 2010, 3, 962. [Google Scholar] [CrossRef]
  20. De Wild, P.J.; Huijgen, W.J.J.; Kloekhorst, A.; Chowdari, R.K.; Heeres, H.J. Bioresource Technology Biobased alkylphenols from lignins via a two-step pyrolysis – Hydrodeoxygenation approach. Bioresour. Technol. 2017, 229, 160–168. [Google Scholar] [CrossRef] [PubMed]
  21. Ardiyani, A.R.; Khromova, S.A.; Venderbosch, R.H.; Yakovlev, V.A.; Heeres, H.J. Catalytic hydrotreatment of fast-pyrolysis oil using non-sulfided bimetallic Ni-Cu catalysts on a δ-Al2O3 support. Appl. Catal. B Environ. 2012, 117–118, 105–117. [Google Scholar] [CrossRef]
  22. Mercader, F.D.M.; Koehorst, P.J.J.; Heeres, H.J.; Kersten, S.R.A.; Hogendoorn, J.A. Competition Between Hydrotreating and Polymerization Reactions During Pyrolysis Oil Hydrodeoxygenation. Aiche J. 2011, 55, 3160–3170. [Google Scholar] [CrossRef]
  23. Elliott, D.C.; Hart, T.R. Catalytic hydroprocessing of chemical models for bio-oil. Energy Fuels 2009, 23, 631–637. [Google Scholar] [CrossRef]
  24. Li, X.; Gunawan, R.; Wang, Y.; Chaiwat, W.; Hu, X.; Gholizadeh, M.; Mourant, D.; Bromly, J.; Li, C.-Z. Upgrading of bio-oil into advanced biofuels and chemicals. Part III. Changes in aromatic structure and coke forming propensity during the catalytic hydrotreatment of a fast pyrolysis bio-oil with Pd/C catalyst. Fuel 2014, 116, 642–649. [Google Scholar] [CrossRef]
  25. Chaiwat, W.; Gunawan, R.; Gholizadeh, M.; Li, X.; Lievens, C.; Hu, X.; Wang, Y.; Mourant, D.; Rossiter, A.; Bromly, J.; et al. Upgrading of bio-oil into advanced biofuels and chemicals. Part II. Importance of holdup of heavy species during the hydrotreatment of bio-oil in a continuous packed-bed catalytic reactor. Fuel 2013, 112, 302–310. [Google Scholar] [CrossRef]
  26. Gunawan, R.; Li, X.; Lievens, C.; Gholizadeh, M.; Chaiwat, W.; Hu, X.; Mourant, D.; Bromly, J.; Li, C.Z. Upgrading of bio-oil into advanced biofuels and chemicals. Part I. Transformation of GC-detectable light species during the hydrotreatment of bio-oil using Pd/C catalyst. Fuel 2013, 111, 709–717. [Google Scholar] [CrossRef]
  27. Lee, H.; Kim, H.; Yu, M.J.; Ko, C.H.; Jeon, J.K.; Jae, J.; Park, S.H.; Jung, S.C.; Park, Y.K. Catalytic Hydrodeoxygenation of Bio-oil Model Compounds over Pt/HY Catalyst. Sci. Rep. 2016, 6, 1–8. [Google Scholar] [CrossRef] [PubMed]
  28. Sanna, A.; Vispute, T.P.; Huber, G.W. Hydrodeoxygenation of the aqueous fraction of bio-oil with Ru/C and Pt/C catalysts. Appl. Catal. B Environ. 2015, 165, 446–456. [Google Scholar] [CrossRef] [Green Version]
  29. Elliott, D.C. Historical developments in hydroprocessing bio-oils. Energy Fuels 2007, 21, 1792–1815. [Google Scholar] [CrossRef]
  30. Jin, W.; Pastor-Pérez, L.; Shen, D.; Sepúlveda-Escribano, A.; Gu, S.; Ramirez Reina, T. Catalytic upgrading of biomass model compounds: Novel approaches and lessons learnt from traditional hydrodeoxygenation—A review. ChemCatChem 2019, 11, 924–960. [Google Scholar] [CrossRef]
  31. Oh, S.; Choi, H.S.; Choi, I.-G.; Choi, J.W. Evaluation of hydrodeoxygenation reactivity of pyrolysis bio-oil with various Ni-based catalysts for improvement of fuel properties. RSC Adv. 2017, 7, 15116–15126. [Google Scholar] [CrossRef] [Green Version]
  32. Boscagli, C.; Raffelt, K.; Zevaco, T.A.; Olbrich, W.; Otto, T.N.; Sauer, J.; Grunwaldt, J.D. Mild hydrotreatment of the light fraction of fast-pyrolysis oil produced from straw over nickel-based catalysts. Biomass Bioenergy 2015, 83, 525–538. [Google Scholar] [CrossRef] [Green Version]
  33. Furimsky, E. Deactivation of hydroprocessing catalysts. Catal. Today 2002, 52, 381–495. [Google Scholar] [CrossRef]
  34. Dongil, A.B.; Ghampson, I.T.; García, R.; Fierro, J.L.G.; Escalona, N. Hydrodeoxygenation of guaiacol over Ni/carbon catalysts: Effect of the support and Ni loading. RSC Adv. 2016, 6, 2611–2623. [Google Scholar] [CrossRef]
  35. Jahromi, H.; Agblevor, F.A. Hydrodeoxygenation of pinyon-juniper catalytic pyrolysis oil using red mud-supported nickel catalysts. Appl. Catal. B Environ. 2018, 236, 1–12. [Google Scholar] [CrossRef]
  36. Sápi, A.; Rémiás, R.; Kónya, Z.; Kukovecz, Á.; Kordás, K.; Kiricsi, I. Synthesis and characterization of nickel catalysts supported on different carbon materials. React. Kinet. Catal. Lett. 2009, 96, 379–389. [Google Scholar] [CrossRef]
  37. Boscagli, C.; Tomasi Morgano, M.; Raffelt, K.; Leibold, H.; Grunwaldt, J.-D. Influence of feedstock, catalyst, pyrolysis and hydrotreatment temperature on the composition of upgraded oils from intermediate pyrolysis. Biomass Bioenergy 2018, 116, 236–248. [Google Scholar] [CrossRef]
  38. Ardiyanti, A.R.; Bykova, M.V.; Khromova, S.A.; Yin, W.; Venderbosch, R.H.; Yakovlev, V.A.; Heeres, H.J. Ni-Based Catalysts for the Hydrotreatment of Fast Pyrolysis Oil. Energy Fuels 2016, 30, 1544–1554. [Google Scholar] [CrossRef]
  39. Huynh, T.M.; Armbruster, U.; Nguyen, L.H.; Nguyen, D.A. Hydrodeoxygenation of Bio-Oil on Bimetallic Catalysts: From Model Compound to Real Feed. J. Sustain. Bioenergy Syst. 2015, 5, 151–160. [Google Scholar] [CrossRef] [Green Version]
  40. Olarte, M.V.; Zacher, A.H.; Padmaperuma, A.B.; Burton, S.D.; Job, H.M.; Lemmon, T.L.; Swita, M.S.; Rotness, L.J.; Neuenschwander, G.N.; Frye, J.G.; et al. Stabilization of Softwood-Derived Pyrolysis Oils for Continuous Bio-oil Hydroprocessing. Top. Catal. 2016, 59, 55–64. [Google Scholar] [CrossRef]
  41. Gómez-Cazalilla, M.; Infantes-Molina, A.; Mérida-Robles, J.; Rodríguez-Castellón, E.; Jiménez-López, A. Chromium species as captors of sulfur molecules on nickel-based hydrotreating catalysts. Energy Fuels 2009, 23, 101–110. [Google Scholar] [CrossRef]
  42. Bartholomew, C.H. Mechanisms of catalyst deactivation. Appl. Catal. A Gen. 2001, 212, 17–60. [Google Scholar] [CrossRef]
  43. Yin, W.; Venderbosch, R.H.; Alekseeva, M.V.; Figueirêdo, M.B.; Heeres, H.; Khromova, S.A.; Yakovlev, V.A.; Cannilla, C.; Bonura, G.; Frusteri, F.; et al. Hydrotreatment of the carbohydrate-rich fraction of pyrolysis liquids using bimetallic Ni based catalyst: Catalyst activity and product property relations. Fuel Process. Technol. 2018, 169, 258–268. [Google Scholar] [CrossRef]
  44. Huazhang, L. Ammonia Synthesis Catalysts: Innovation and Practice; World Scientific: Singapore, 2013; ISBN 978-981-4355-78-0. [Google Scholar]
  45. Thi, Q.; Bui, P.; Kim, Y.; Pil, S.; Han, J.; Chul, H.; Woo, S.; Won, C. Steam reforming of simulated biogas over plate Ni Cr catalysts: Influence of pre-oxidation on catalytic activity. Appl. Catal. B Environ. 2015, 166–167, 335–344. [Google Scholar]
  46. Deutschmann, O.; Knözinger, H.; Kochloefl, K.; Turek, T. Heterogeneous Catalysis and Solid Catalysts, 3. Industrial Applications. Ullmann’s Encycl. Ind. Chem. 2011. [Google Scholar] [CrossRef]
  47. French, R.J.; Stunkel, J.; Black, S.; Myers, M.; Yung, M.M.; Iisa, K. Evaluate impact of catalyst type on oil yield and hydrogen consumption from mild hydrotreating. Energy Fuels 2014, 28, 3086–3095. [Google Scholar] [CrossRef]
  48. Rover, M.R.; Hall, P.H.; Johnston, P.A.; Smith, R.G.; Brown, R.C. Stabilization of bio-oils using low temperature, low pressure hydrogenation. Fuel 2015, 153, 224–230. [Google Scholar] [CrossRef]
  49. Pucher, H.; Schwaiger, N.; Feiner, R.; Ellmaier, L.; Pucher, P.; Chernev, B.S.; Siebenhofer, M. Biofuels from liquid phase pyrolysis oil: A two-step hydrodeoxygenation (HDO) process. Green Chem. 2015, 17, 1291–1298. [Google Scholar] [CrossRef]
  50. Mercader, F.D.M. Pyrolysis oil Upgrading for Co-Processing in Standard Refinery Units. Ph.D. Thesis, University of Twente, Enschede, The Netherlands, 2010. [Google Scholar]
  51. Venderbosch, R.; Heeres, H. Stabilisation of Biomass derived Pyrolysis Oils by Catalytic Hydrotreatment. Biocoup.Com. 2010, 85, 1–28. [Google Scholar]
  52. Schmitt, C.C.; Raffelt, K.; Zimina, A.; Krause, B.; Otto, T.; Rapp, M.; Grunwaldt, J.D.; Dahmen, N. Hydrotreatment of Fast Pyrolysis Bio-oil Fractions Over Nickel-Based Catalyst. Top. Catal. 2018. [Google Scholar] [CrossRef]
  53. Oasmaa, A.; Kuoppala, E.; Ardiyanti, A.; Venderbosch, R.H.; Heeres, H.J. Characterization of hydrotreated fast pyrolysis liquids. Energy Fuels 2010, 24, 5264–5272. [Google Scholar] [CrossRef]
  54. Stankovikj, F.; McDonald, A.G.; Helms, G.L.; Garcia-Perez, M. Quantification of Bio-Oil Functional Groups and Evidences of the Presence of Pyrolytic Humins. Energy Fuels 2016, 30, 6505–6524. [Google Scholar] [CrossRef]
  55. Wan, H.; Chaudhari, R.V.; Subramaniam, B. Aqueous phase hydrogenation of acetic acid and its promotional effect on p-cresol hydrodeoxygenation. Energy Fuels 2013, 27, 487–493. [Google Scholar] [CrossRef]
  56. Zhang, X.-S.; Yang, G.-X.; Jiang, H.; Liu, W.-J.; Ding, H.-S. Mass production of chemicals from biomass-derived oil by directly atmospheric distillation coupled with co-pyrolysis. Sci. Rep. 2013, 3, 1120. [Google Scholar] [CrossRef] [PubMed]
  57. Yokoyama, T.; Fujita, N. Hydrogenation of aliphatic carboxylic acids to corresponding aldehydes over Cr2O3-based catalysts. Appl. Catal. A Gen. 2004, 276, 179–185. [Google Scholar] [CrossRef]
  58. Martínez, J.D.; Veses, A.; Mastral, A.M.; Murillo, R.; Navarro, M.V.; Puy, N.; Artigues, A.; Bartrolí, J.; García, T. Co-pyrolysis of biomass with waste tyres: Upgrading of liquid bio-fuel. Fuel Process. Technol. 2014, 119, 263–271. [Google Scholar] [CrossRef]
  59. Elliott, D.C. Biofuel from fast pyrolysis and catalytic hydrodeoxygenation. Curr. Opin. Chem. Eng. 2015, 9, 59–65. [Google Scholar] [CrossRef] [Green Version]
  60. Alonso, D.M.; Wettstein, S.G.; Dumesic, J.A. Bimetallic catalysts for upgrading of biomass to fuels and chemicals. Chem. Soc. Rev. 2012, 41, 8075–8098. [Google Scholar] [CrossRef] [PubMed]
  61. Schmitt, C.C.; Moreira, R.; Cruz, R.; Richter, D.; Funke, A.; Raffelt, K.; Grunwaldt, J.; Dahmen, N. From agriculture residue to upgraded product: The thermochemical conversion of sugarcane bagasse for fuel and chemical products. Fuel Process. Technol. 2020, 197, 106199. [Google Scholar] [CrossRef]
  62. Dongil, A.B.; Bachiller-Baeza, B.; Rodriguez-Ramos, I.; Fierro, J.L.G.; Escalona, N. Effect of Cu loading on Ni/carbon nanotubes catalyst for hydrodeoxygenation of guaiacol. Rsc Adv. 2016, 3, 26658–26667. [Google Scholar] [CrossRef]
  63. Mäki-Arvela, P.; Murzin, D. Hydrodeoxygenation of Lignin-Derived Phenols: From Fundamental Studies towards Industrial Applications. Catalysts 2017, 7, 265. [Google Scholar] [CrossRef]
  64. Mu, W.; Ben, H.; Ragauskas, A.; Deng, Y. Lignin Pyrolysis Components and Upgrading-Technology Review. Bioenergy Res. 2013, 6, 1183–1204. [Google Scholar] [CrossRef]
  65. Rencoret, J.; Del Río, J.C.; Nierop, K.G.J.; Gutiérrez, A.; Ralph, J. Rapid Py-GC/MS assessment of the structural alterations of lignins in genetically modified plants. J. Anal. Appl. Pyrolysis 2016, 121, 155–164. [Google Scholar] [CrossRef] [Green Version]
  66. Haibing, G.; Hexing, L.; Yeping, X.; Minghui, W. Liquid phase glucose hydrogenation over Cr-promoted Ru-B amorphous alloy catalysts. Mater. Lett. 2002, 57, 392–398. [Google Scholar]
  67. Li, H.; Li, H.; Wang, M. Glucose hydrogenation over promoted Co-B amorphous alloy catalysts. Appl. Catal. A Gen. 2001, 207, 129–137. [Google Scholar] [CrossRef]
  68. Li, H.; Li, H.; Deng, J.F. Glucose hydrogenation over Ni-B/SiO2 amorphous alloy catalyst and the promoting effect of metal dopants. Catal. Today 2002, 74, 53–63. [Google Scholar] [CrossRef]
  69. Elliott, D.C.; Hart, T.R.; Neuenschwander, G.G.; Rotness, L.J.; Zacker, A.H. Catalytic Hydroprocessing of Biomass Fast Pyrolysis Bio-oil to Produce Hydrocarbon Products. Environ. Prog. Sustain. Energy 2009, 28, 441–449. [Google Scholar] [CrossRef]
  70. Gao, J.; Wang, Y.; Ping, Y.; Hu, D.; Xu, G.; Gu, F.; Su, F. A thermodynamic analysis of methanation reactions of carbon oxides for the production of synthetic natural gas. RSC Adv. 2012, 2, 2358–2368. [Google Scholar] [CrossRef]
  71. Li, X.; Cheng, H.; Liang, G.; He, L.; Lin, W.; Yu, Y.; Zhao, F. Effect of Phosphine Doping and the Surface Metal State of Ni on the Catalytic Performance of Ni/Al2O3 Catalyst. Catalysts 2015, 5, 759–773. [Google Scholar] [CrossRef] [Green Version]
  72. Mortensen, P.M.; Grunwaldt, J.D.; Jensen, P.A.; Jensen, A.D. Screening of catalysts for hydrodeoxygenation of phenol as a model compound for bio-oil. ACS Catal. 2013, 3, 1774–1785. [Google Scholar] [CrossRef]
  73. Kathiraser, Y.; Wang, Z.; Ang, M.L.; Mo, L.; Li, Z.; Oemar, U.; Kawi, S. Highly active and coke resistant Ni/SiO2 catalysts for oxidative reforming of model biogas: Effect of low ceria loading. J. CO2 Util. 2017, 19, 284–295. [Google Scholar] [CrossRef]
  74. Kirumakki, S.R.; Shpeizer, B.G.; Sagar, G.V.; Chary, K.V.R.; Clearfield, A. Hydrogenation of Naphthalene over NiO/SiO2-Al2O3 catalysts: Structure-activity correlation. J. Catal. 2006, 242, 319–331. [Google Scholar] [CrossRef]
  75. Yang, Y.; Ochoa-Hernández, C.; de la Peña O’Shea, V.A.; Pizarro, P.; Coronado, J.M.; Serrano, D.P. Effect of metal-support interaction on the selective hydrodeoxygenation of anisole to aromatics over Ni-based catalysts. Appl. Catal. B Environ. 2014, 145, 91–100. [Google Scholar] [CrossRef]
  76. Gervasini, A. Microcalorimetric Study of the Acidity and Basicity. J. Phys. Chem. 1990, 94, 6371–6379. [Google Scholar]
  77. Aksel, S.; Eder, D. Catalytic effect of metal oxides on the oxidation resistance in carbon nanotube-inorganic hybrids. J. Mater. Chem. 2010, 20, 9149–9154. [Google Scholar] [CrossRef]
  78. Li, Y.; Zhao, Y.; Chen, B.; Wang, W. Synergetic Catalysis of Nickel Oxides with Oxygen Vacancies and Nickel Phosphide for the Highly Efficient Hydrodeoxygenation of Phenolic Compounds. ChemCatChem 2018, 10, 2612–2619. [Google Scholar] [CrossRef]
  79. Zhao, L.; Zhao, J.; Wu, T.; Zhao, M.; Yan, W.; Zhang, Y.; Li, H.; Wang, Y.; Xiao, T.; Zhao, Y. Synergistic Effect of Oxygen Vacancies and Ni Species on Tuning Selectivity of Ni/ZrO2 Catalyst for Hydrogenation of Maleic Anhydride into Succinic Anhydride and γ-Butyrolacetone. Nanomaterials 2019, 9, 406. [Google Scholar] [CrossRef] [PubMed]
  80. Mortensen, P.M.; Grunwaldt, J.D.; Jensen, P.A.; Jensen, A.D. Influence on nickel particle size on the hydrodeoxygenation of phenol over Ni/SiO2. Catal. Today 2016, 259, 277–284. [Google Scholar] [CrossRef]
  81. Ermakova, M.A.; Ermakov, D.Y. High-loaded nickel–silica catalysts for hydrogenation, prepared by sol–gel. Appl. Catal. A Gen. 2003, 245, 277–288. [Google Scholar] [CrossRef]
  82. Schmitt, C.C.; Boscagli, C.; Rapp, M.; Raffelt, R.; Dahmen, N. Characterization of light and heavy phase of pyrolysis-oil from distinct biomass for further upgrading reactions. Proc. Eur. Biomass Conf. Exhib. 2017, 12–15. [Google Scholar]
  83. Zimina, A.; Dardenne, K.; Denecke, M.A.; Doronkin, D.E.; Huttel, E.; Lichtenberg, H.; Mangold, S.; Pruessmann, T.; Rothe, J.; Spangenberg, T.; et al. CAT-ACT—A new highly versatile x-ray spectroscopy beamline for catalysis and radionuclide science at the KIT synchrotron light facility ANKA. Rev. Sci. Instrum. 2017, 88, 113113. [Google Scholar] [CrossRef]
Figure 1. Product distribution after the first upgrading of beech wood fast pyrolysis bio-oil (BWBO) at 175 °C and 225 °C with Ni, Ni–Cr, and Ru/C catalysts. The second upgrading of a previously upgraded beech wood fast pyrolysis bio-oil (UBWBO) is presented and referred to as Ni–Cr,2nd,325 °C, considering the upgrading temperature of 325 °C with the Ni–Cr catalyst. Upgraded aqueous phase is referred to as UAP and upgraded oil phase is referred to as UOP.
Catalysts 09 00784 g001
Figure 2. Van Krevelen diagram of the upgraded oils in comparison to the feed (dry basis).
Catalysts 09 00784 g002
Figure 3. Degree of deoxygenation vs. hydrogen consumption (left) and gas composition (right) for the upgrading reactions conducted with BWBO and UBWBO.
Catalysts 09 00784 g003
Figure 4. Ni K XANES of both Ni-based catalysts before and after in-situ temperature programmed reduction (TPR). Ni and NiO standards are shown for comparision (left). The results of the linear combination analysis of the XANES data taking during the TPR (right).
Catalysts 09 00784 g004
Figure 5. NH3-TPD of Ni and Ni–Cr catalysts. m/e = 17.
Catalysts 09 00784 g005
Figure 6. STEM image and particle-size distribution of the catalysts before and after reactions. d = average diameter; N = number of particles.
Catalysts 09 00784 g006
Figure 7. STEM image of the spent Ni–Cr catalyst after the second upgrading at 325 °C.
Catalysts 09 00784 g007
Figure 8. XRD powder diffraction of fresh and spent Ni-based catalysts.
Catalysts 09 00784 g008
Figure 9. Simplified representation of hydrodeoxygenation over Ni-based catalysts: R–CH2–OH represents the molecules to be hydrodeoxygenated, and M-O represents the support material (SiO2 and SiO2-ZrO2-Al2O3), NiO, and Cr2O3. NiO is reduced during the hydrotreatment reaction. The particle sizes of Cr2O3 are smaller compared to metallic nickel (not represented in the Figure), but the mechanism of hydrodeoxygenation is assumed to be the same as the support material.
Catalysts 09 00784 g009
Figure 10. Schematic diagram of the experimental device used for the experiments: Autoclave picture is available in the Supplementary Material.
Catalysts 09 00784 g010
Table 1. Chemical composition of upgraded oils at different reaction conditions.
Ni,
175 °C
1-step UR
Ni,
225 °C
1-step UR
Ni–Cr,
175 °C
1-step UR
Ni–Cr,
225 °C
1-step UR
Ru/C,
175 °C
1-step UR
Ru/C,
225 °C
1-step UR
Ni–Cr,
325 °C
2-step UR 1
BWBO 2UBWBO 3
Upgraded oils and feedstocks - wet basis (wb) and dry basis (bd)
wbbdWbbdwbbdwbbdwbbdwbbdwbbdwbdbwbdb
C (wt.%)57.965.958.365.158.565.560.166.857.665.259.967.076.878.646.159.969.172.9
H (wt.%)8.07.68.07.68.07.68.27.97.97.58.17.79.69.67.86.88.58.4
O (wt.%)34.126.533.727.233.526.831.725.334.427.231.825.013.411.646.033.021.818.2
N (wt.%)<0.1-<1.0-<1.0-<1.0-<0.2-<0.2-<0.2<0.2<0.2<0.20.30.3
S (wt.%)<0.005 <0.005 <0.005 <0.005 <0.005 <0.005 <0.005 0.0110.0150.2250.264
pH value3.6-4.1-3.2-3.3-3.3-3.6-4.9-3LP; 2.7HP-3.0-
H2O (wt.%)12.1-10.5-10.7-10.1-11.7-10.6-2.3-23.0-5.1-
HHV 4 (MJ/Kg)26.3-26.3-26.2-27.3-25.5-26.7-36.9-19.41-30.93-
1 UR: Upgrading reaction. 2 Value calculated considering the mixture of 41 wt.% Heavy Phase (HP) and 59 wt.% Light Phase (LP) analyzed separately; 3 Value obtained as an average of four upgrading reactions. For more information, see the Supplementary Material; 4 Higher Heating Value.
Table 2. 1H-NMR of upgraded oil and feedstock.
Integration Range (ppm) 1Ni, 1-step
175 °C
mmol⋅g−1
Ni, 1-step
225 °C
mmol⋅g−1
Ni–Cr 1-step
175 °C
mmol⋅g−1
Ni–Cr 1-step
225 °C
mmol⋅g−1
Ni–Cr 2-step
325 °C
mmol⋅g−1
Ru/C 1-step
175 °C
mmol⋅g−1
Ru/C 1-step
225 °C
mmol⋅g−1
UBWBO
mmol⋅g−1
BWBO
mmol⋅g−1
UOPUAPUOPUAPUOPUAPUOPUAPUOPUAPUOPUAPUOPUAPUOPHPLP
0.5–1.516.667.0517.397.4716.796.5421.555.8541.800.7513.405.7416.304.9022.08.203.0
1.5–3.021.569.4523.229.9421.386.9225.946.0936.504.3020.308.3021.904.2739.2017.8011.0
3.0–4.313.9620.7613.6619.8116.4518.1815.5514.005.900.5014.4016.1013.3011.411.5013.2013.90
4.3–6.022.1164.0021.7668.9927.7460.2622.7853.626.30111.729.9064.3024.8077.513.5028.5050.20
6.0–8.56.070.676.040.795.210.826.010.505.800.105.900.554.800.407.508.143.20
9.5–10.10.000.000.000.000.040.000.000.000.00.00.00.00.00.00.00.010.06
1 Integration range of 0.5–1.5 ppm corresponds to alkanes; 1.5–3.0 ppm to α proton to carboxylic acid or keto-groups and α proton to unsaturated groups; 3.0–4.3 ppm corresponds to ethers, alkenes, and alcohols; 4.3–6.0 ppm corresponds to water, O–H exchanging groups, and carbohydrates; 6.0–8.5 ppm corresponds to (hetero-)aromatics; and 9.5–10.1 ppm corresponds to aldehydes.
Table 3. Quantification of GC-MS/FID detectable compounds in the feedstock and upgraded liquid products.
CompoundsBWBO 1UBWBONi, 225 °C, 1-step URNi–Cr, 225 °C, 1-step URNi–Cr, 325 °C, 2-step UR
wb 2
(wt.%)
db 3 (wt.%)wb 2
(wt.%)
db 3 (wt.%)UOP
wb 2 (wt.%)
UOP
db 3 (wt.%)
UAP
wb 2 (wt.%)
UAP
db 3 (wt.%)
UOP
wb 2 (wt.%)
UOP
db 3 (wt.%)
UAP
wb 2 (wt.%)
UAP
db 3 (wt.%)
UOP
wb 2 (wt.%)
UOP
db 3 (wt.%)
UAP
wb 2 (wt.%)
UAP
db 3 (wt.%)
Nonaromatic compounds17.4124.7413.6914.6115.0016.9128.7055.6813.1514.6420.7241.575.135.282.9680.99
Acids5.567.879.7110.378.649.7310.0219.457.968.864.559.14--2.7374.72
Nonaromatic Esters0.330.470.080.080.590.660.791.530.270.310.581.16----
Nonaromatic Alcohols1.962.890.180.194.164.6917.5133.974.344.8315.5431.170.460.470.113.12
Nonaromatic Aldehydes3.494.99--------------
Nonaromatic Ketones6.058.513.723.981.571.770.380.730.580.650.050.101.841.890.123.15
Hydrocarbons----0.040.05------2.842.92--
Heterocyclic compounds2.393.300.700.752.412.721.883.662.522.801.853.710.340.350.164.44
Furans2.193.040.700.752.232.511.763.422.272.531.703.410.340.350.164.44
Pyrans0.190.27--0.180.200.120.240.250.270.150.29----
Aromatic Compounds4.465.8134.474.777.278.21.542.986.256.950.931.871.941.99-0.09
Benzenes0.050.050.070.080.060.06--0.100.11--0.600.62--
Aromatic Alcohols------0.050.11--------
Aromatic Aldehydes0.030.04----- --------
Aromatic Ketones0.010.01----- --------
Aromatic Esters------0.050.100.080.09------
Lignin Derived Phenols0.50.640.860.910.700.790.060.110.710.790.030.070.680.70--
Guaiacols3.684.813.543.785.536.231.372.675.215.800.901.800.660.68--
Syringols0.190.25--0.230.26--0.150.17------
Carbohydrate6.799.96----1.312.54--0.190.39----
Sugars6.799.96----1.312.54--0.190.39--
Other organic compounds 40.680.030.070.070.450.510.651.260.200.220.561.110.200.210.010.16
Total (wt.%) 534.61LP
28.14HP
53.66LP
32.83HP
18.9320.2134.0866.1225.1428.3324.2548.6622.1224.623.1485.687.617.84
1 Value obtained from the mixture of LP and HP as described in Section 3.1; 2 wb: wet basis; 3 db: dry basis; 4 Unknown compounds, N-compounds, acetates, and terpenes. 5 Total of the sample quantified by GC-MS/FID. The total quantified HP and LP from BWBO are presented separately.
Table 4. NH3 desorption at low and high temperatures.
SampleLow Temperature NH3 Desorption (mol.g−1)High Temperature NH3 Desorption (mol.g−1)Density of Acid Site (μmol/m2) 1
Ni3.32 × 10−41.00 × 10−37.01
Ni–Cr1.92 × 10−44.65 × 10−46.99
1 Sum of mols of NH3 desorbed at low and high temperatures/BET surface area.
Table 5. STEM-EDX spent Ni–Cr catalyst after the second upgrading at 325 °C.
ElementCOAlSiNiCrS
at.%88.465.490.371.102.630.600.50

