Article

Rapid Microwave-Assisted Polyol Synthesis of TiO2-Supported Ruthenium Catalysts for Levulinic Acid Hydrogenation

School of Chemistry, Cardiff University, Main Building, Park Place, Cardiff CF10 3AT, UK
*
Author to whom correspondence should be addressed.
Catalysts 2019, 9(9), 748; https://doi.org/10.3390/catal9090748
Submission received: 7 August 2019 / Revised: 23 August 2019 / Accepted: 28 August 2019 / Published: 5 September 2019
(This article belongs to the Special Issue Microwave-Assisted Catalysis)

Abstract

:
One wt% Ru/TiO2 catalysts prepared by a one-pot microwave-assisted polyol method have been shown to be highly active for Levulinic acid hydrogenation to γ-Valerolactone. Preparation temperature, microwave irradiation time and choice of Ru precursor were found to have a significant effect on catalyst activity. In the case of Ru(acac)3-derived catalysts, increasing temperature and longer irradiation times increased catalyst activity to a maximum LA conversion of 69%. Conversely, for catalysts prepared using RuCl3, shorter preparation times and lower temperatures yielded more active catalysts, with a maximum LA conversion of 67%. Catalysts prepared using either precursor were found to contain highly dispersed nanoparticles <3 nm in diameter. XPS analysis of the most and least active catalysts shows that the catalyst surface is covered in a layer of insoluble carbon with surface concentrations exceeding 40% in some cases. This can be attributed to the formation of large condensation oligomers from the reaction between the solvent, ethylene glycol and its oxidation products, as evidenced by the presence of C-O and C = O functionality on the catalyst surface.

1. Introduction

Biomass-derived feedstocks currently show potential as environmentally benign alternatives to fossil fuel derived chemicals, either directly as a fuel or as an intermediate for incorporation into existing commodity scale chemical processes [1]. The conversion of bulk biomass into useful chemicals has been extensively explored over the past decade, with an emphasis on utilization of lignocellulosic biomass [2]. Cellulose, a major (35–50%) component of such biomass, is readily hydrolyzed under acidic conditions to Levulinic acid (LA). LA was identified by the U.S. Department of Energy in 2004 as a bio-derived platform chemical capable of incorporation into traditionally petroleum derived value chains [3]. The application of Levulinic acid derived species and the prerequisite chemical transformations have been thoroughly explored [4]. One such transformation is the hydrogenation of LA to γ-Valerolactone (GVL), schematically presented in Figure 1, with GVL itself also being considered a viable platform molecule for the production of fuels or fuel additives [5].
The production of GVL from LA has been long known to occur readily in both the gas and liquid phase, the former having been investigated by the Quaker Oats Company as early as the 1950s, and the latter having been reported to occur over PtO2 in 1930 [6,7]. Over the subsequent decades, further work sought to develop catalysts which retained high activity at lower temperatures and pressures, initially using bulk materials, such as Raney Nickel and later on the application of nanomaterials [8,9]. More recently, supported precious metal catalysts have been exhaustively explored for levulinic acid hydrogenation, showing promising potential for commercialization of the process. Early work by Manzer et al. found that carbon-supported Ir, Rh, Pt, Pd, Re, Ni and Ru nanoparticle catalysts were active for LA hydrogenation. Supported Pt, Re and Ni catalysts were found to be relatively inactive, exhibiting conversions below 20%, whereas the analogous Ir, Rh and Pd catalysts displayed conversions up to 40%. The 5 wt% Ru/C in particular exhibited both a LA conversion of 80% and a 91% selectivity towards GVL [10]. At the same time, Yan and co-workers compared the activity of Ru/C and Pd/C catalysts to Raney and Urushibara nickel, showing that both the Pd/C and bulk nickel catalysts were considerably less selective towards GVL than the Ru/C analogue [11].
Later work by Upare and co-workers showed that the poor selectivity of supported Pt/C and Pd/C catalysts was due to their relative inactivity towards the hydrogenation of the unsaturated cyclic α-a ngelica lactone, an intermediate formed from the dehydration of LA which results in lower GVL yields. Critically, this work also showed that supported metal catalysts could also afford the further GVL hydrogenation product methyl-THF (MTHF), albeit with modest selectivities of a few percent [12]. Later work by Pinel et al. found that the addition of Re into carbon supported Pd, Pt and Ru catalysts resulted in the further ring opening hydrogenation pathway to yield 1,4-pentanediol [13]. Chia and co-workers further elaborated on the selectivity of RuRe and RuMo supported nanoparticle catalysts through a combination of experimental and computational study. The authors suggested that surface rhenium hydroxyl groups were sufficiently acidic to catalyse the ring opening hydrogenolysis of GVL, which then undergoes further hydrogenation to yield both the mono- and diol products in varying ratios [14].
Given the high activity and selectivity of supported ruthenium catalysts for levulinic acid hydrogenation, considerable work has explored the effect of catalyst preparation conditions on catalyst activity. Palkovits et al. investigated the effect of catalyst support on the activity of impregnation prepared 5 wt% Ru catalysts for LA hydrogenation, showing that the choice of Al2O3, SiO2, TiO2 or carbon support resulted in a range of LA conversions from 0% to >99%. Interestingly, activity was shown to differ considerably even between commercial support materials obtained from different suppliers. A 5 wt% Ru catalyst supported on a Tronox TiO2 was shown to be entirely inactive for LA hydrogenation, whilst the Degussa P25-supported analogue exhibited LA conversion and GVL selectivity in excess of 80% under the same conditions [15]. Catalyst support effects were further elucidated by Pan and co-workers, who undertook a similar study of impregnation prepared Ru catalysts supported on a broader range of metal oxides for the hydrogenation of Levulinic acid, including synthetic zeolites. The authors showed that the metal oxide-supported Ru catalysts were highly selective towards GVL, whilst the use of highly acidic zeolites yielded valerate esters as a result of concerted hydrogenation-esterification with the ethanol solvent [16].
A wide range of catalyst preparation techniques have been used to prepare Ru catalysts active for LA hydrogenation. Impregnation is the most commonly used technique, wherein solution phase metal precursors are adsorbed onto a support material which yields supported metal nanoparticles upon heat treatment. Preparation parameters, such as metal loadings, support materials choice and metal precursor choice have been shown by several groups to produce highly active catalysts. Regalbuto et al. compared the activity of carbon- and alumina-supported Ru catalysts prepared by conventional and selective electrostatic absorption (SEA) impregnation [17]. The SEA-prepared catalysts were shown to be considerably more active than the conventionally prepared analogues, and this was attributed to increased Ru dispersion and a decrease average nanoparticle diameter. The conventionally prepared impregnation catalysts were found to exhibit both a larger average particle diameter and a broader particle size distribution and therefore contained a variety of Ru nanoparticulate species with varying activity.
Colloidal catalyst preparation methods are known to produce highly dispersed metal nanoparticles with narrow particle size distributions [18,19]. Such an approach was used by Jones and co-workers in preparing Ru/C catalysts for LA hydrogenation. Aqueous colloidal Ru nanoparticles stabilized by polyvinyl alcohol (PVA) immobilized on activated carbon were shown to be highly active for LA hydrogenation to GVL, at comparatively mild conditions compared to previous work [20]. Whilst colloidal methods allow for good control of metal nanoparticle size/composition through the addition of stabilizers and chelators, preparations typically take place in highly dilute aqueous solutions to maximize colloidal stability, which generates large amounts of aqueous waste. Furthermore, polymeric stabilizers required during preparation to inhibit nanoparticle agglomeration have been shown to remain on the catalyst surface after preparation and limit reactant access to the active metal nanosurface [21].
The solvothermal decomposition of metal precursors is an alternative method that has shown great versatility in preparing supported metal nanoparticle catalysts. The ‘polyol’ method, so called due to the prolific use of di- and tri-ol solvents, has been used to prepare a plethora of both colloidal and supported metal nanoparticulate materials. The polyol method has been demonstrated to be highly versatile, having been previously used to prepare monometallic Ag, Au, Pd, Pt, Fe, Ni, Co and Sn nanoparticles just to name a few [22,23,24]. The universal applicability of this method is derived from the mechanism of nanoparticle formation. At elevated temperatures, the solvent forms a highly reductive species, which facilitates the decomposition and reduction of the metal precursors to yield nanoparticles. The reduction potential of these intermediates is sufficiently high to reduce a wide range of transition metal precursors, and the scope of this method can be expanded considerably through the addition of stronger reductants to yield not only metallic nanoparticles but also metal oxides and chalcogenides [25]. Furthermore, the chelating nature of the polyol solvent ensures good solubility of a wide range of precursor compounds and additionally, sterically stabilizes the resultant nanoparticles, minimizing agglomeration.
Typically, polyol syntheses take place at temperatures above 150 °C to afford rapid nanoparticle formation, with preparation temperature depending on the choice of solvent. Traditionally, the required high temperature conditions have been achieved using conduction heating, realized on the laboratory scale using a hotplate. Conduction heating is inefficient and slow, leading to long temperature ramping to reach target temperatures whilst being susceptible to the formation of temperature gradients across reactant mixtures. Microwave heating is an alternative that has emerged over the past two decades in the field of nanomaterials and chemical transformations that offers many benefits over conventional thermal treatments, principally very high temperature ramping rates and minimal thermal gradients [26,27,28].
Furthermore, microwave heating has been shown to decrease nanoparticle preparation time from hours, in the case of conventional heating, to minutes, and additionally, enables access to highly faceted and crystalline nanomaterials [29]. We have previously shown that AuPd/TiO2 catalysts could be readily prepared using a microwave assisted solvothermal method in as little as 15 min, allowing for rapid screening of bimetallic nanoparticle catalysts. In this study, we explored the effect of microwave treatment time, temperature and metal precursor on the activity of Ru/TiO2 catalysts for the hydrogenation of Levulinic acid.

2. Results & Discussion

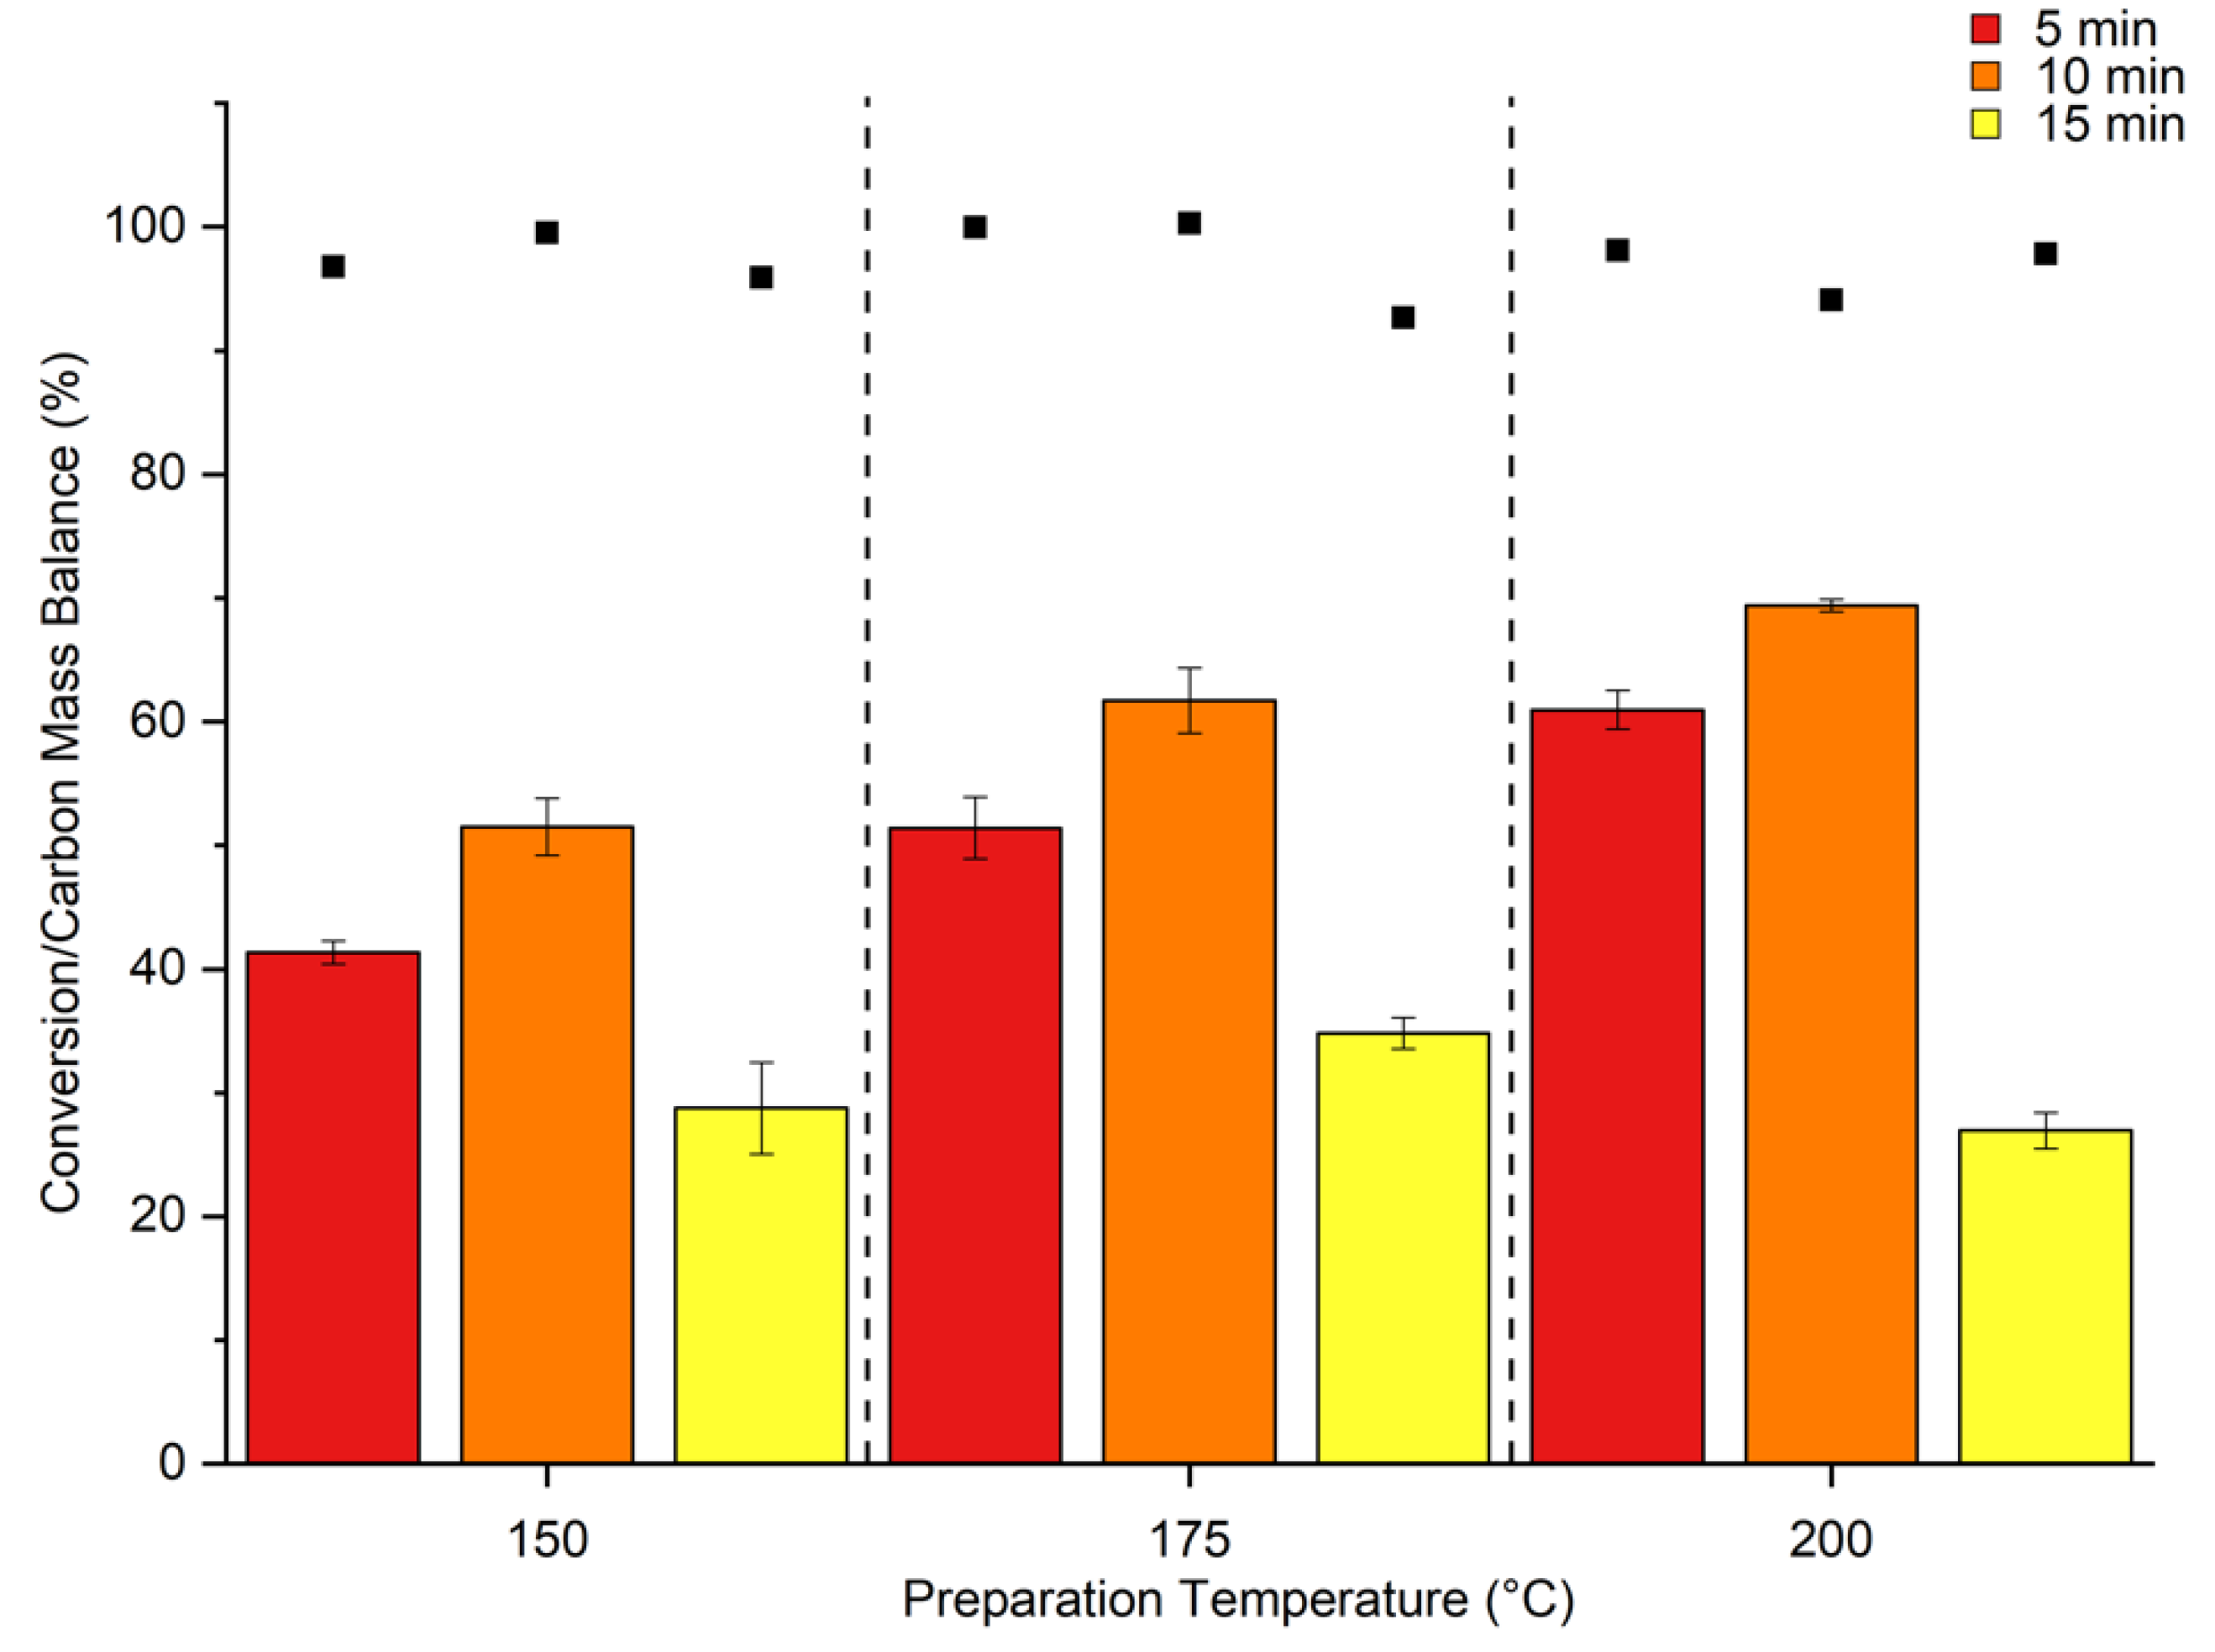
Catalytic Activity of MW Prepared Ru/TiO2

Initially, a series of Ru/TiO2 catalysts was prepared from Ru(acac)3 at 150, 175 and 200 °C to assess the effect of preparation temperature and time on catalyst activity for LA hydrogenation. The catalysts were denoted in the manuscript using the following nomenclature: reductant-preparation temperature (°C)-preparation time, e.g., Acac-200-10 was prepared using Ru(acac)3, at 200 °C for 10 min.
The LA hydrogenation activity of the catalysts is presented in Figure 2. For all the catalysts, the sole product observed was γ-valerolactone. It was found that for a given processing time, increasing preparation temperature resulted in an increase in catalyst activity. In the case of the catalysts prepared with 5 min processing time, LA conversion increased from 41% in the case of Acac-150-5 to 51% and 61% for Acac-175-5 and Acac-200-5, respectively. A similar trend was also observed when the preparation time was increased to 10 min, with these catalysts showing higher activity than the 5-min prepared analogues.
The longest processing time, 15 min, was found to yield catalysts with relatively poor activity; increasing preparation time from 10 to 15 min resulted in a decrease in LA conversion from 69.4% to only 27% for Acac-200 series. The activities of the catalysts are comparable to previously published 1 wt%Ru/TiO2 prepared by an aqueous colloidal method [20]. Given the similar catalyst activities, the principle benefit of a microwave assisted solvothermal method is the rapid preparation of highly active catalysts using a minimal amount of solvent, and therefore, highly concentrated metal precursors. For comparison, preparation of the previously reported sol immobilization 1 wt%Ru/TiO2 catalysts required over 30 times the solvent volume of the analogous microwave prepared catalyst on a per gram basis, principally to avoid colloidal agglomeration.
The weight loading of the catalysts was measured using MP-AES. Due to the insolubility of Ru species in aqua regia, the most commonly used laboratory acid digestion matrix for AES, the weight loadings were instead determined by comparison between the initial concentration of the dissolved Ru precursors pre-preparation and comparing this to Ru concentration measured in the supernatant solvent post catalyst preparation. The results in Table 1 show that the 1 wt% denotation of metal loading was very close to the measured weight loading and that almost all of the metal in the precursor solution was deposited on to the support.
To better understand the relationship between catalyst preparation parameters and activity, the most and least active Ru(acac)3-derived catalysts were investigated by TEM, displayed in Figure 3. The catalysts Acac-200-10 and Acac-200-15 were found to contain highly dispersed Ru nanoparticles, with the former exhibiting a mean particle diameter of 2.35 nm versus 2.55 nm for the latter. The increase in mean particle size could be a result of the sintering of formed nanoparticles or alternatively, surface-induced growth from increased precursor nucleation on the formed nanoparticles. Previous work by Regalbuto et al. investigated the effect of particle size on the activity of alumina and carbon supported Ru nanoparticle catalysts prepared by selective electrostatic adsorption (SEA) for Levulinic acid hydrogenation [17]. The authors showed that the activity of the catalysts correlated with Ru nanoparticle size, yielding a volcano trend with a maximum around 1.5 nm average particle diameter. This contrasts to the structure-activity relationship observed in this work, wherein a modest increase in average particle size of only 0.2 nm between the acac-200-10 and acac-200-15 catalysts was accompanied by a 61% decrease in LA conversion, suggesting that the broad range of catalyst activities presented cannot be ascribed to particle size effects alone.
The two catalysts, Acac-200-10 and Acac-200-15, were further studied by x-ray photoelectron spectroscopy (XPS) to determine whether their respective catalytic activities were a consequence of Ru surface oxidation state variations. The Ru3d/C1s and O1s narrow scan spectra are presented in Figure 4. In the case of the catalyst Acac-200-10, fitting of the Ru3d/C1s spectrum suggests the presence of both a metallic and oxide Ru species with Ru3d5/2 binding energies of 279.5 and 280.4 eV respectively [30]. These binding energies are similar to those reported by Okal and co-workers for analogous Ru/Al2O3 catalysts, with the presence of oxidic Ru species being attributed to surface oxidation between preparation and analysis [31]. The Ru 3d/C1s region also shows that both catalysts contained significant amounts of carbonaceous material, likely a consequence of the preparation method. The XPS derived atomic surface composition, presented in Table 1. shows that both the most and least active Ru(acac)3-derived catalysts exhibit similar surface carbon concentrations, 48.22 and 42.06 at% respectively, suggesting that the formation of carbonaceous deposits is not detrimental to catalyst activity. Research by Skrabalak and co-workers found that in the case of polyol prepared Ag nanoparticles, both the precursor salts and resultant nanoparticles were highly active for not only the oxidation of the ethylene glycol solvent, but also the oxidation by-products of nanoparticle formation, such as glycolaldehyde [32]. Similarly, Feldmann et al. reported that colloidal Zn3(PO4)2 nanoparticles prepared by the polyol method exhibited unusual fluorescence activity, which was determined to be due to the dehydration and carbonization of the solvent yielding 3–5-nm carbon dots in addition to the desired metal phosphate nanoparticles [33]. It can therefore be suggested that the high carbon content of the catalysts prepared in this work is a result of either complete carbonization of the solvent and resultant oxidation products during catalyst preparation, or alternatively, due to the formation of large oligomeric condensation products as a result of the condensation reaction also between the solvent and associated oxidation products.
The presence of complex carbonaceous species on the surface of the catalyst is consistent with the C1s XPS contributions at 284.7, 286.2 and 288.6 eV, corresponding to aliphatic C, C-O and C = O environments, respectively [34,35,36]. Whilst the aliphatic C and C-O components could be indicative of latent ethylene glycol from the preparation procedure, the presence of C = O contributions and high overall carbon surface concentration is indicative of the formation of carbonaceous deposits resulting from the oxidation of the solvent during catalyst preparation. Similarly, the relative contributions of the three carbon environments and their overall surface concentrations are inconsistent with the previously reported spectrum of solid Ru(acac)3, supporting the hypothesis that the high surface carbon content is due to the formation of insoluble carbonaceous deposits, rather than an incomplete decomposition of the Ru precursor [30]. Fitting of the O1s XP spectrum similarly indicates the presence of three oxygen environments at 529.7, 531.8 and 533.32 eV, consistent with Ti-O, C-O and C = O species, providing further evidence for the formation of oxygenated carbonaceous deposits.
Given that the XP spectrum of the Acac-200-10 catalyst shows high bulk carbon concentrations, SEM-EDX was undertaken to determine the dispersion of the carbon layer on the catalytic material, as shown in Figure 5. Consistent with the TEM presented in Figure 3, low resolution SEM-EDX mapping of a representative catalyst particle shows that the Ru was well dispersed across the support surface, with a complete absence of larger nanoparticles agglomerates. The EDX C Lα map agreed with the XPS spectra, showing an even distribution of carbon across the surface of the catalyst particle.
A series of further catalysts were prepared using RuCl3 with a range of preparation temperatures and processing times, given the large variation in activity of the Ru(acac)3-derived Ru/TiO2 catalysts. The LA hydrogenation activity of the catalysts are presented in Figure 6. Unlike the catalysts prepared using Ru(acac)3, the most active RuCl3 catalysts were formed at low temperatures and short processing times. Indeed, the catalyst Cl-150-5, prepared at the mildest temperature for the shortest time was the most active catalyst of the series with an LA conversion of 67%. Increasing the microwave irradiation time at 150 °C to 10 or 15 min yielded less active catalysts with LA conversions of 28% and 37% respectively. Likewise, the catalysts prepared at either 175 or 200 °C showed much reduced activity compared to those prepared at 150 °C, with catalyst activity also decreasing with increasing microwave processing time.
The catalysts Cl-150-5 and Cl-150-10 were further studied by TEM, shown in Figure 7. Similar to the Ru(acac)3 derived catalysts, increasing the processing time resulted in an increase in average particle size from 1.87 to 2.26 nm, suggesting that lower temperatures and short processing times may be employed favorably to yield small well-dispersed supported nanoparticles. In the case of the Cl-150-10 catalyst, the particle size distribution was found to be skewed towards smaller particle diameters (<2 nm), whilst larger (>5 nm) particles, which were not found in other samples, were readily observed for this catalyst. This suggests that the decreased activity of the catalysts prepared with long processing times can be attributed to some extent to sintering of the active Ru nanoparticles.
XPS Ru 3d/C1s and O1s narrow scans of the RuCl3 derived catalysts Cl-150-5 and Cl-150-10 are presented in Figure 8 and surface elemental compositions in Table 2. Consistent with the Ru(acac)3 derived analogues, the catalysts Cl-150-5 and Cl-150-10 also exhibit very high surface carbon concentrations, suggesting that the formation of insoluble carbon species is independent of the choice of Ru precursor. In addition, peak fitting of the Ru 3d region is consistent with the presence of both Ru(0) and Ru(IV), likely due to the formation of a RuO2 shell in the case of both catalysts.
Given that both the RuCl3- and Ru(acac)3-derived catalysts were found to contain significant surface carbon concentrations by both XPS and SEM-EDX analysis, a series of catalysts was further investigated by thermogravimetric analysis (TGA) under oxidising conditions in an attempt to quantify the amount of carbon present. The results are shown in Figure 9. The mass loss from the catalyst was found to vary between 2.4% and 4.5% for the Acac-200 and Cl-150 catalyst series, and no clear correlation is observed linking catalyst preparation conditions/carbon concentration and catalytic activity. This finding is consistent with the XPS derived atomic surface concentrations presented in Table 2, which shows the presence of high carbon surface concentrations in every catalyst analysed. The surface area of the catalysts was measured to determine whether the contribution of the carbon over layer had an effect on the surface area of the catalyst. The results (Table 3) clearly show that no increase in total surface area was observed, and the total surface area of the catalyst remained close to the measured area of the P25 support. Coupled with the SEM results, this suggests that the carbon over layer formed on the surface of the support material was relatively thin. BET surface area measurements (Table 3) indicate no increase in measures surface area of these catalysts, again indicating that the amount of carbon present is minor compared to the bulk.

3. Materials and Methods

3.1. Catalyst Preparation

An amount of 1 wt% Ru/TiO2 (1wt% of the total catalyst mass is Ru, 99 wt% TiO2) catalysts was prepared in a CEM Discover SP microwave reactor using a 35 mL quartz reaction vessel equipped with a magnetic stirrer and sealed with a Teflon lined silicone cap. Stock solutions of Ru(acac)3 (STREM, Cambs UK) and RuCl3.xH2O were prepared in ethylene glycol, yielding solution concentrations of 10 mg Ru/mL. A typical preparation procedure is outlined below.
Briefly, 0.99 g TiO2 (P25, Degussa, Brussels) and 10 mL ethylene glycol (ACROS Organics, UK) were added to the reaction vessel and homogenized with magnetic stirring. An amount of 10 mL Ru stock solution was then added with further stirring. The vessel was then capped and subjected to microwave treatment at 150, 170 or 200 °C for 5, 10 or 15 min. The microwave reactor was operated isothermally, with microwave power output varying dynamically between 0‒200 W. After the allotted time, the reaction vessel was cooled and the catalyst slurry filtered and washed using 200 mL distilled H2O. The catalyst was then air dried at 110 °C for 16 h before use.
The catalysts were denoted in the manuscript using the following nomenclature: reductant-preparation temperature (°C)-preparation time, e.g., Acac-200-10 was prepared using Ru(acac)3, at 200 °C for 10 min.

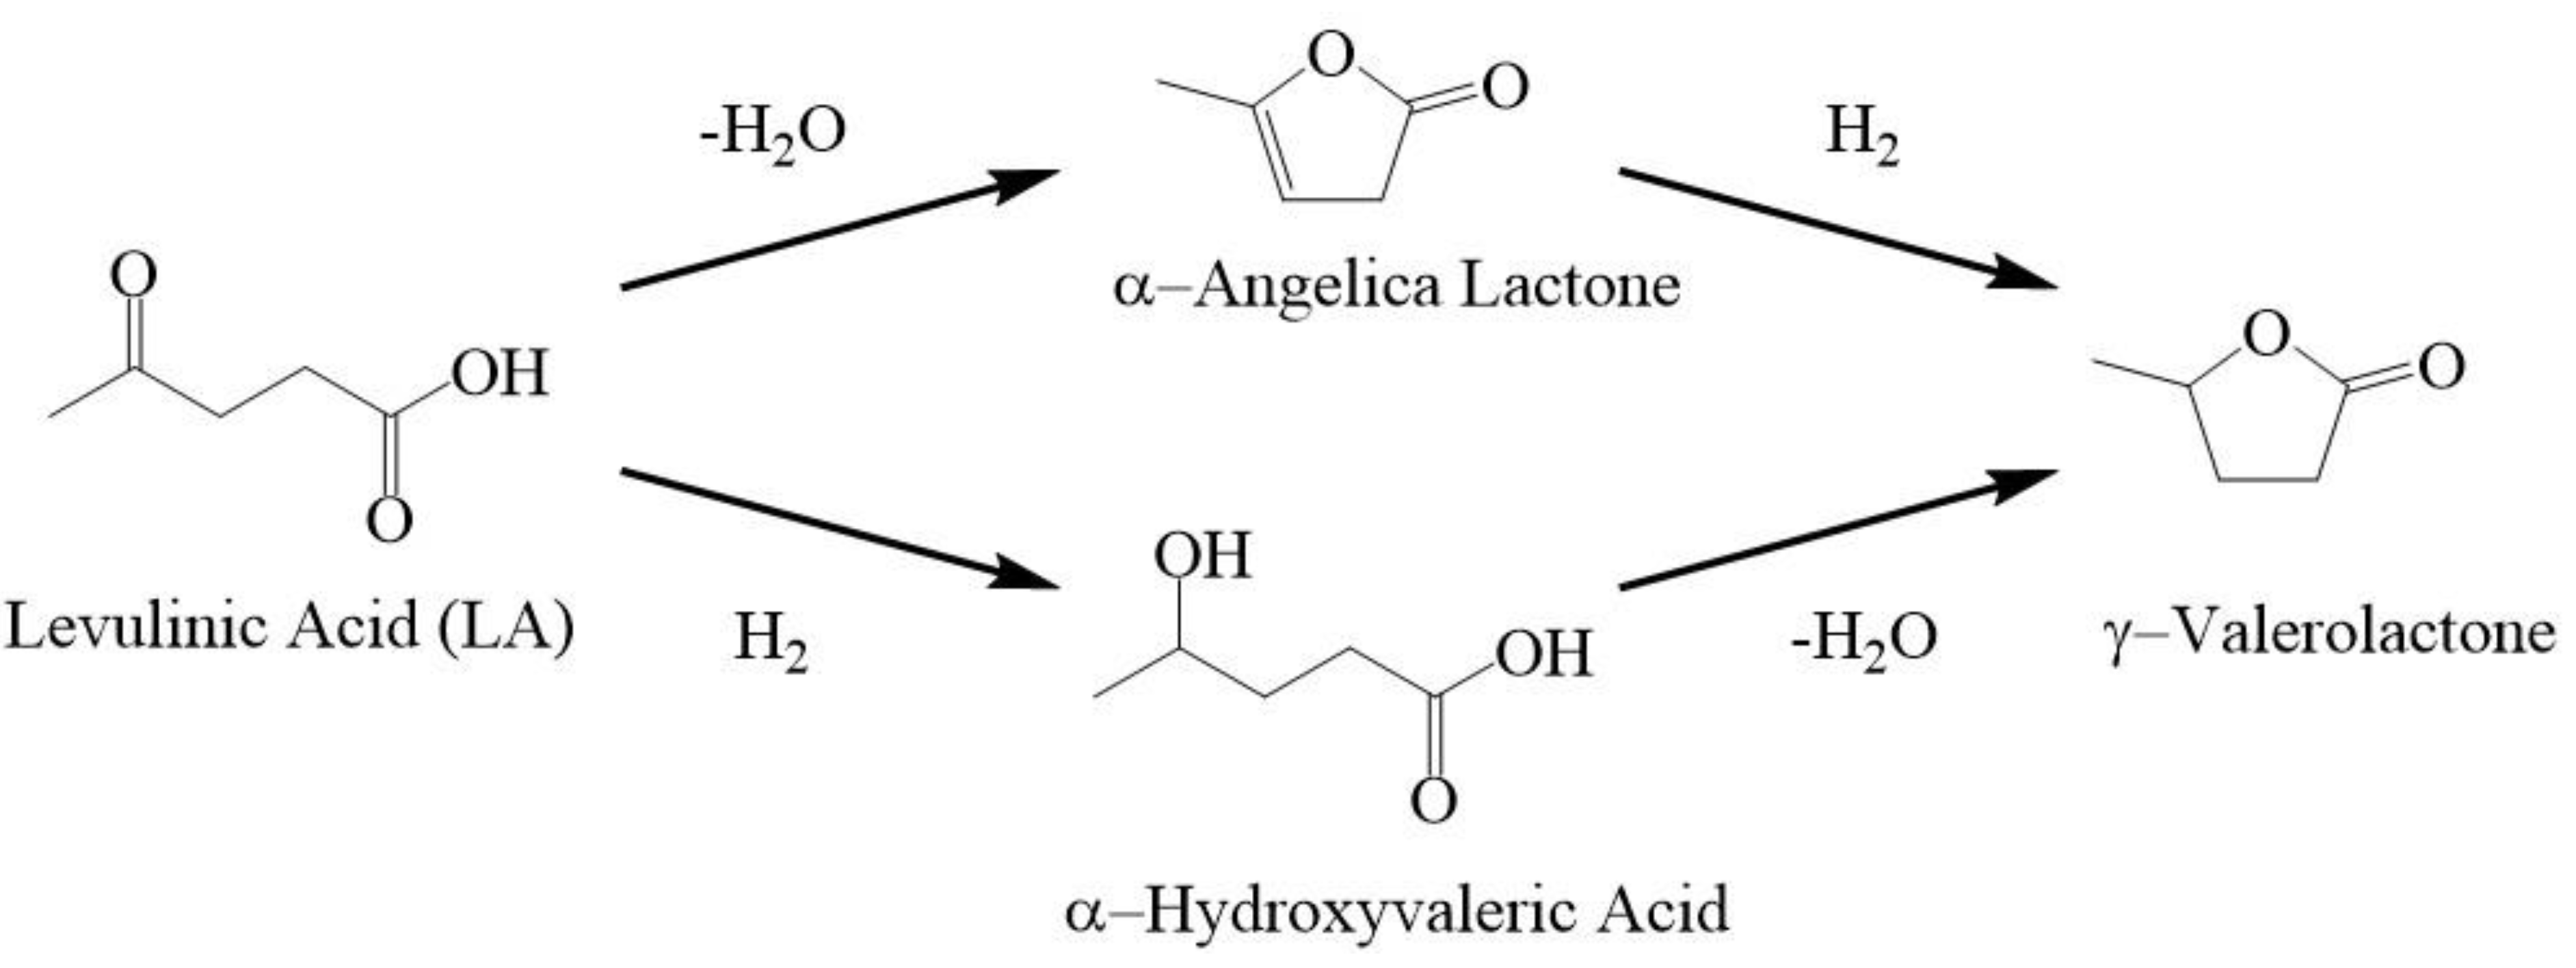
3.2. Levulinic Acid Hydrogenation

The Levulinic acid hydrogenation activity of the catalysts was evaluated in a 50 mL stainless steel autoclave (Parr) equipped with a PTFE liner. The liner was charged with 0.5 g Levulinic acid (Alfa Aesar, Lancs UK), 10 mL H2O (HPLC grade, Fisher Sci.) and 50 mg catalyst. The reactor was then pressurized with 10 barg H2 and heated to the desired temperature, with the reaction initiating with the stirring of the reactor at 1200 rpm. After 1 h, the stirring was ceased, and the reactor cooled with an ice bath. The reactor head space was depressurized with the reactor temperature below 30 °C before the liquid phase was filtered.
The resultant solutions were analyzed using a GC (Varian, Crawley, UK) equipped with a CP-Sil 5CB column (Agilent, UK) and FID detector. The composition of the reaction solutions was determined by calibration against Levulinic Acid and γ-Valerolactone (Alfa Aesar, Lancs UK) standard solutions, in both cases r2 > 0.998.

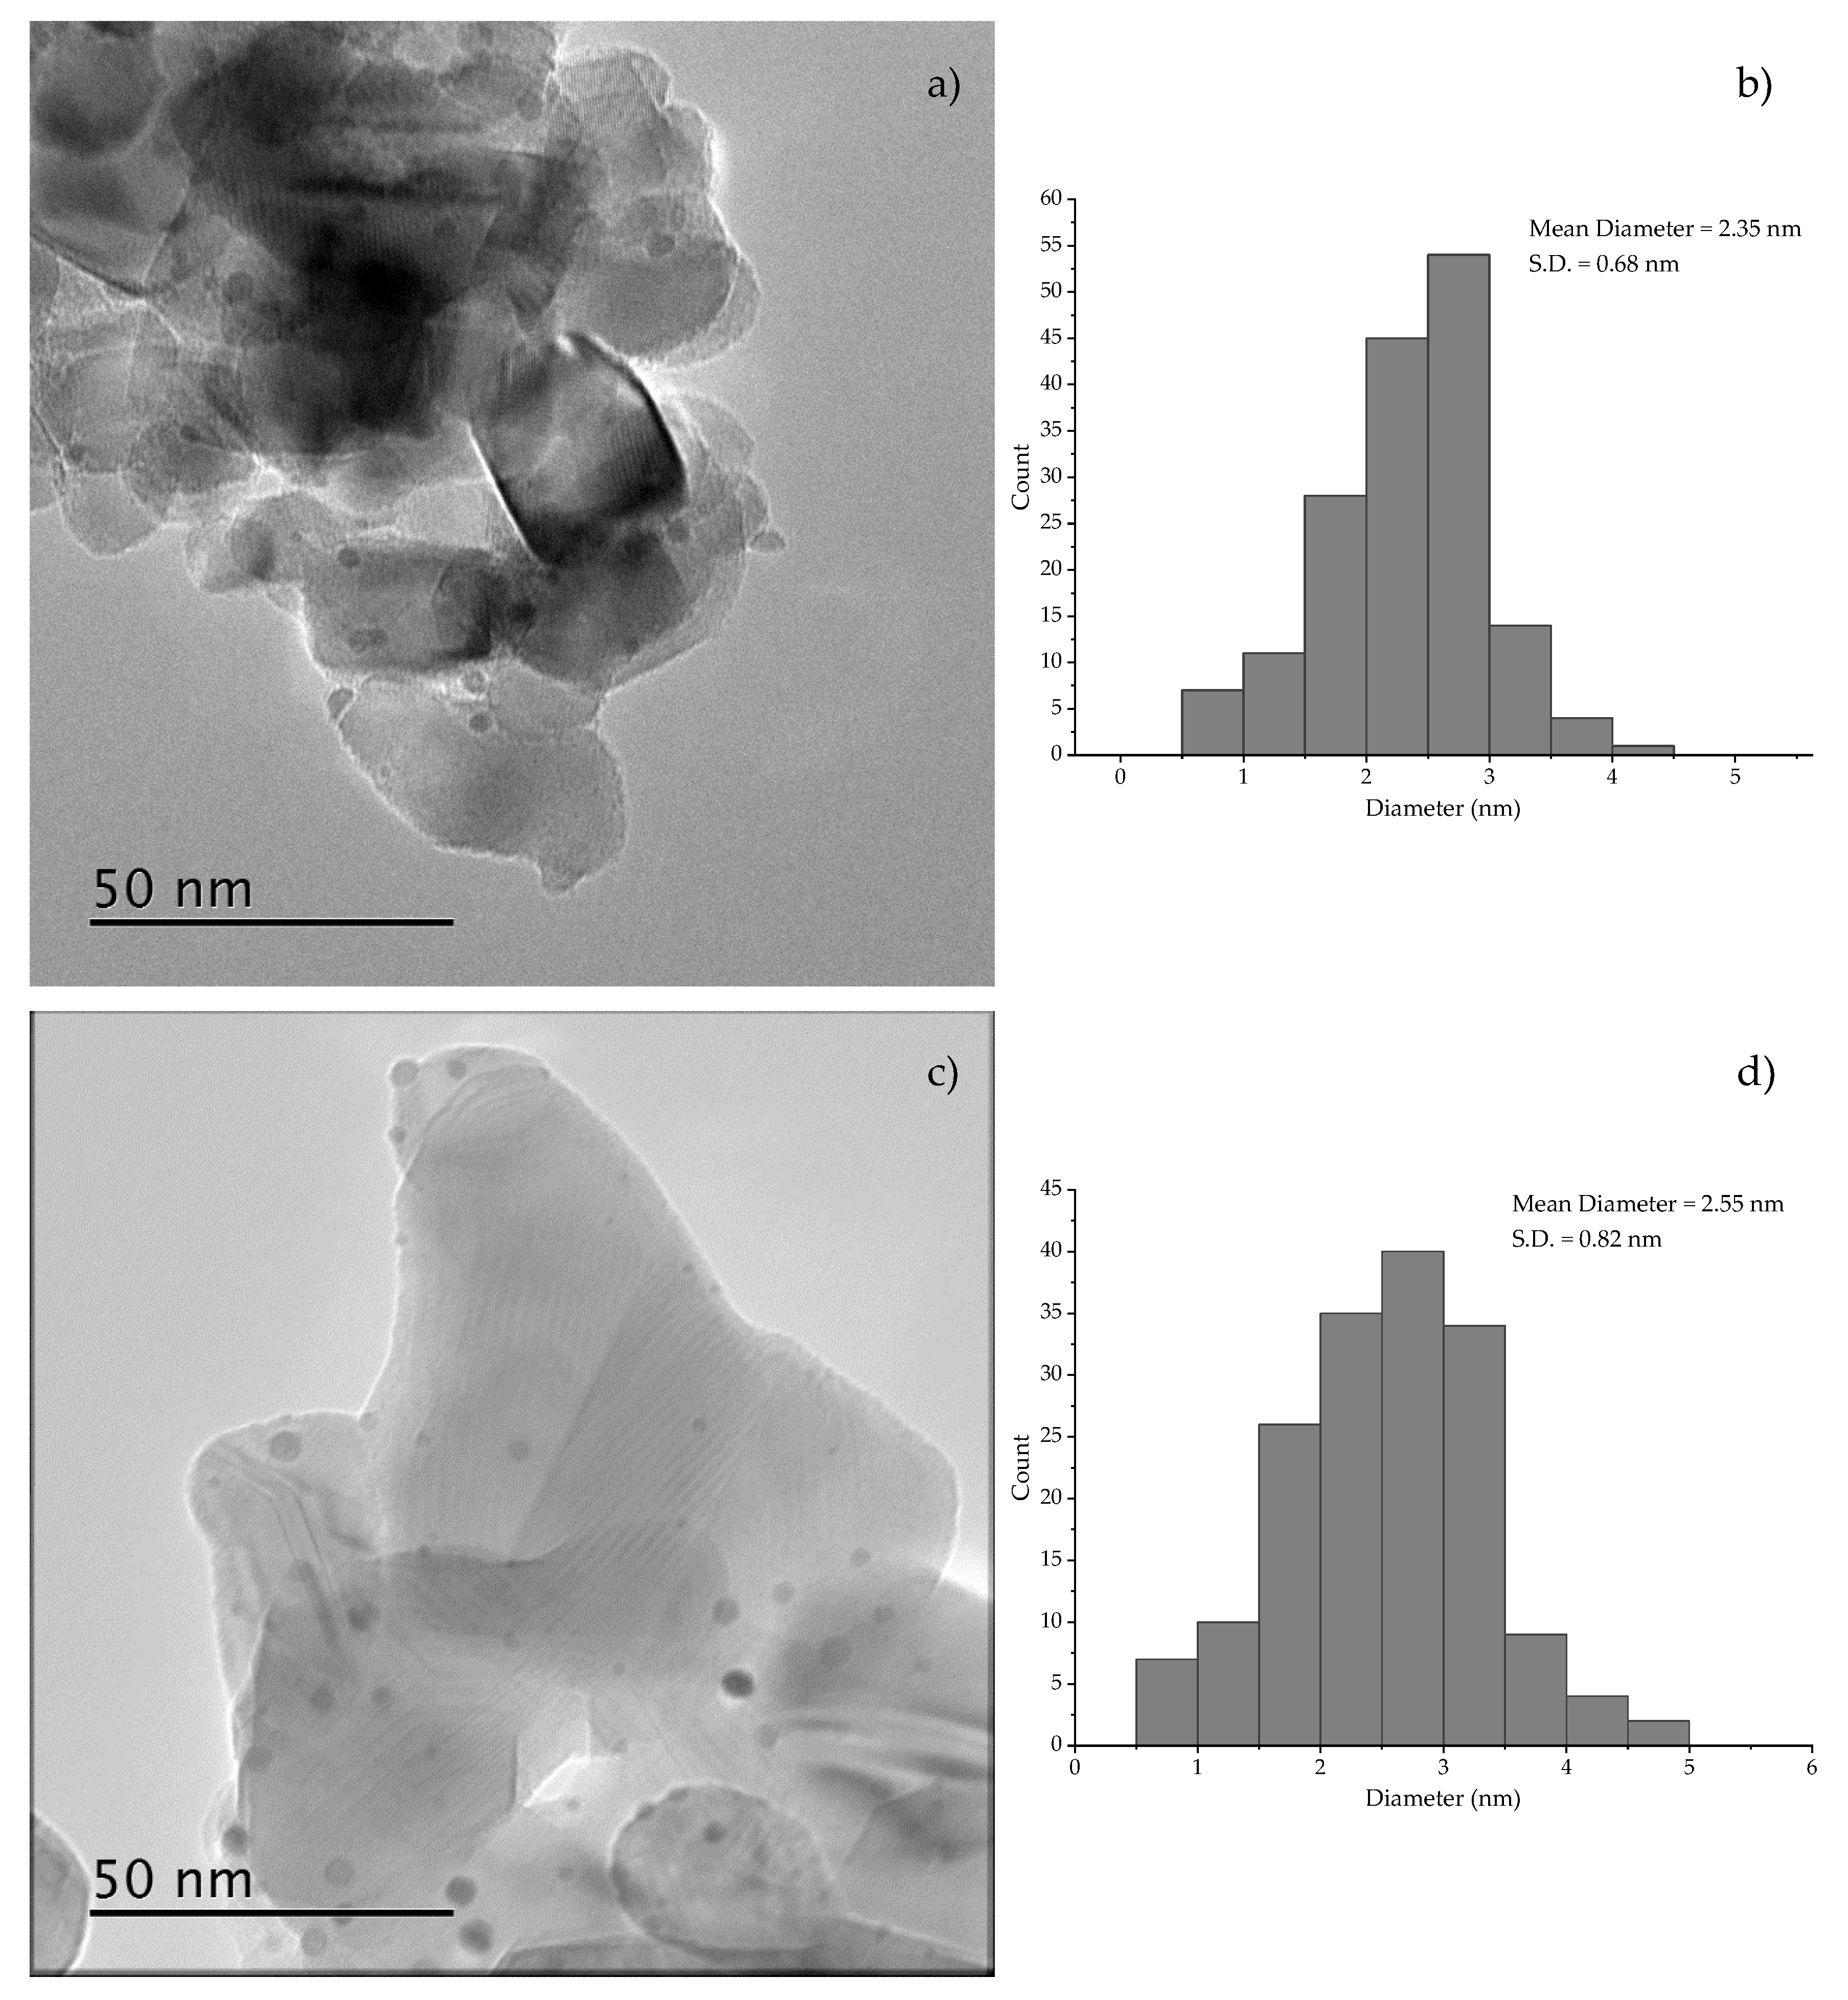
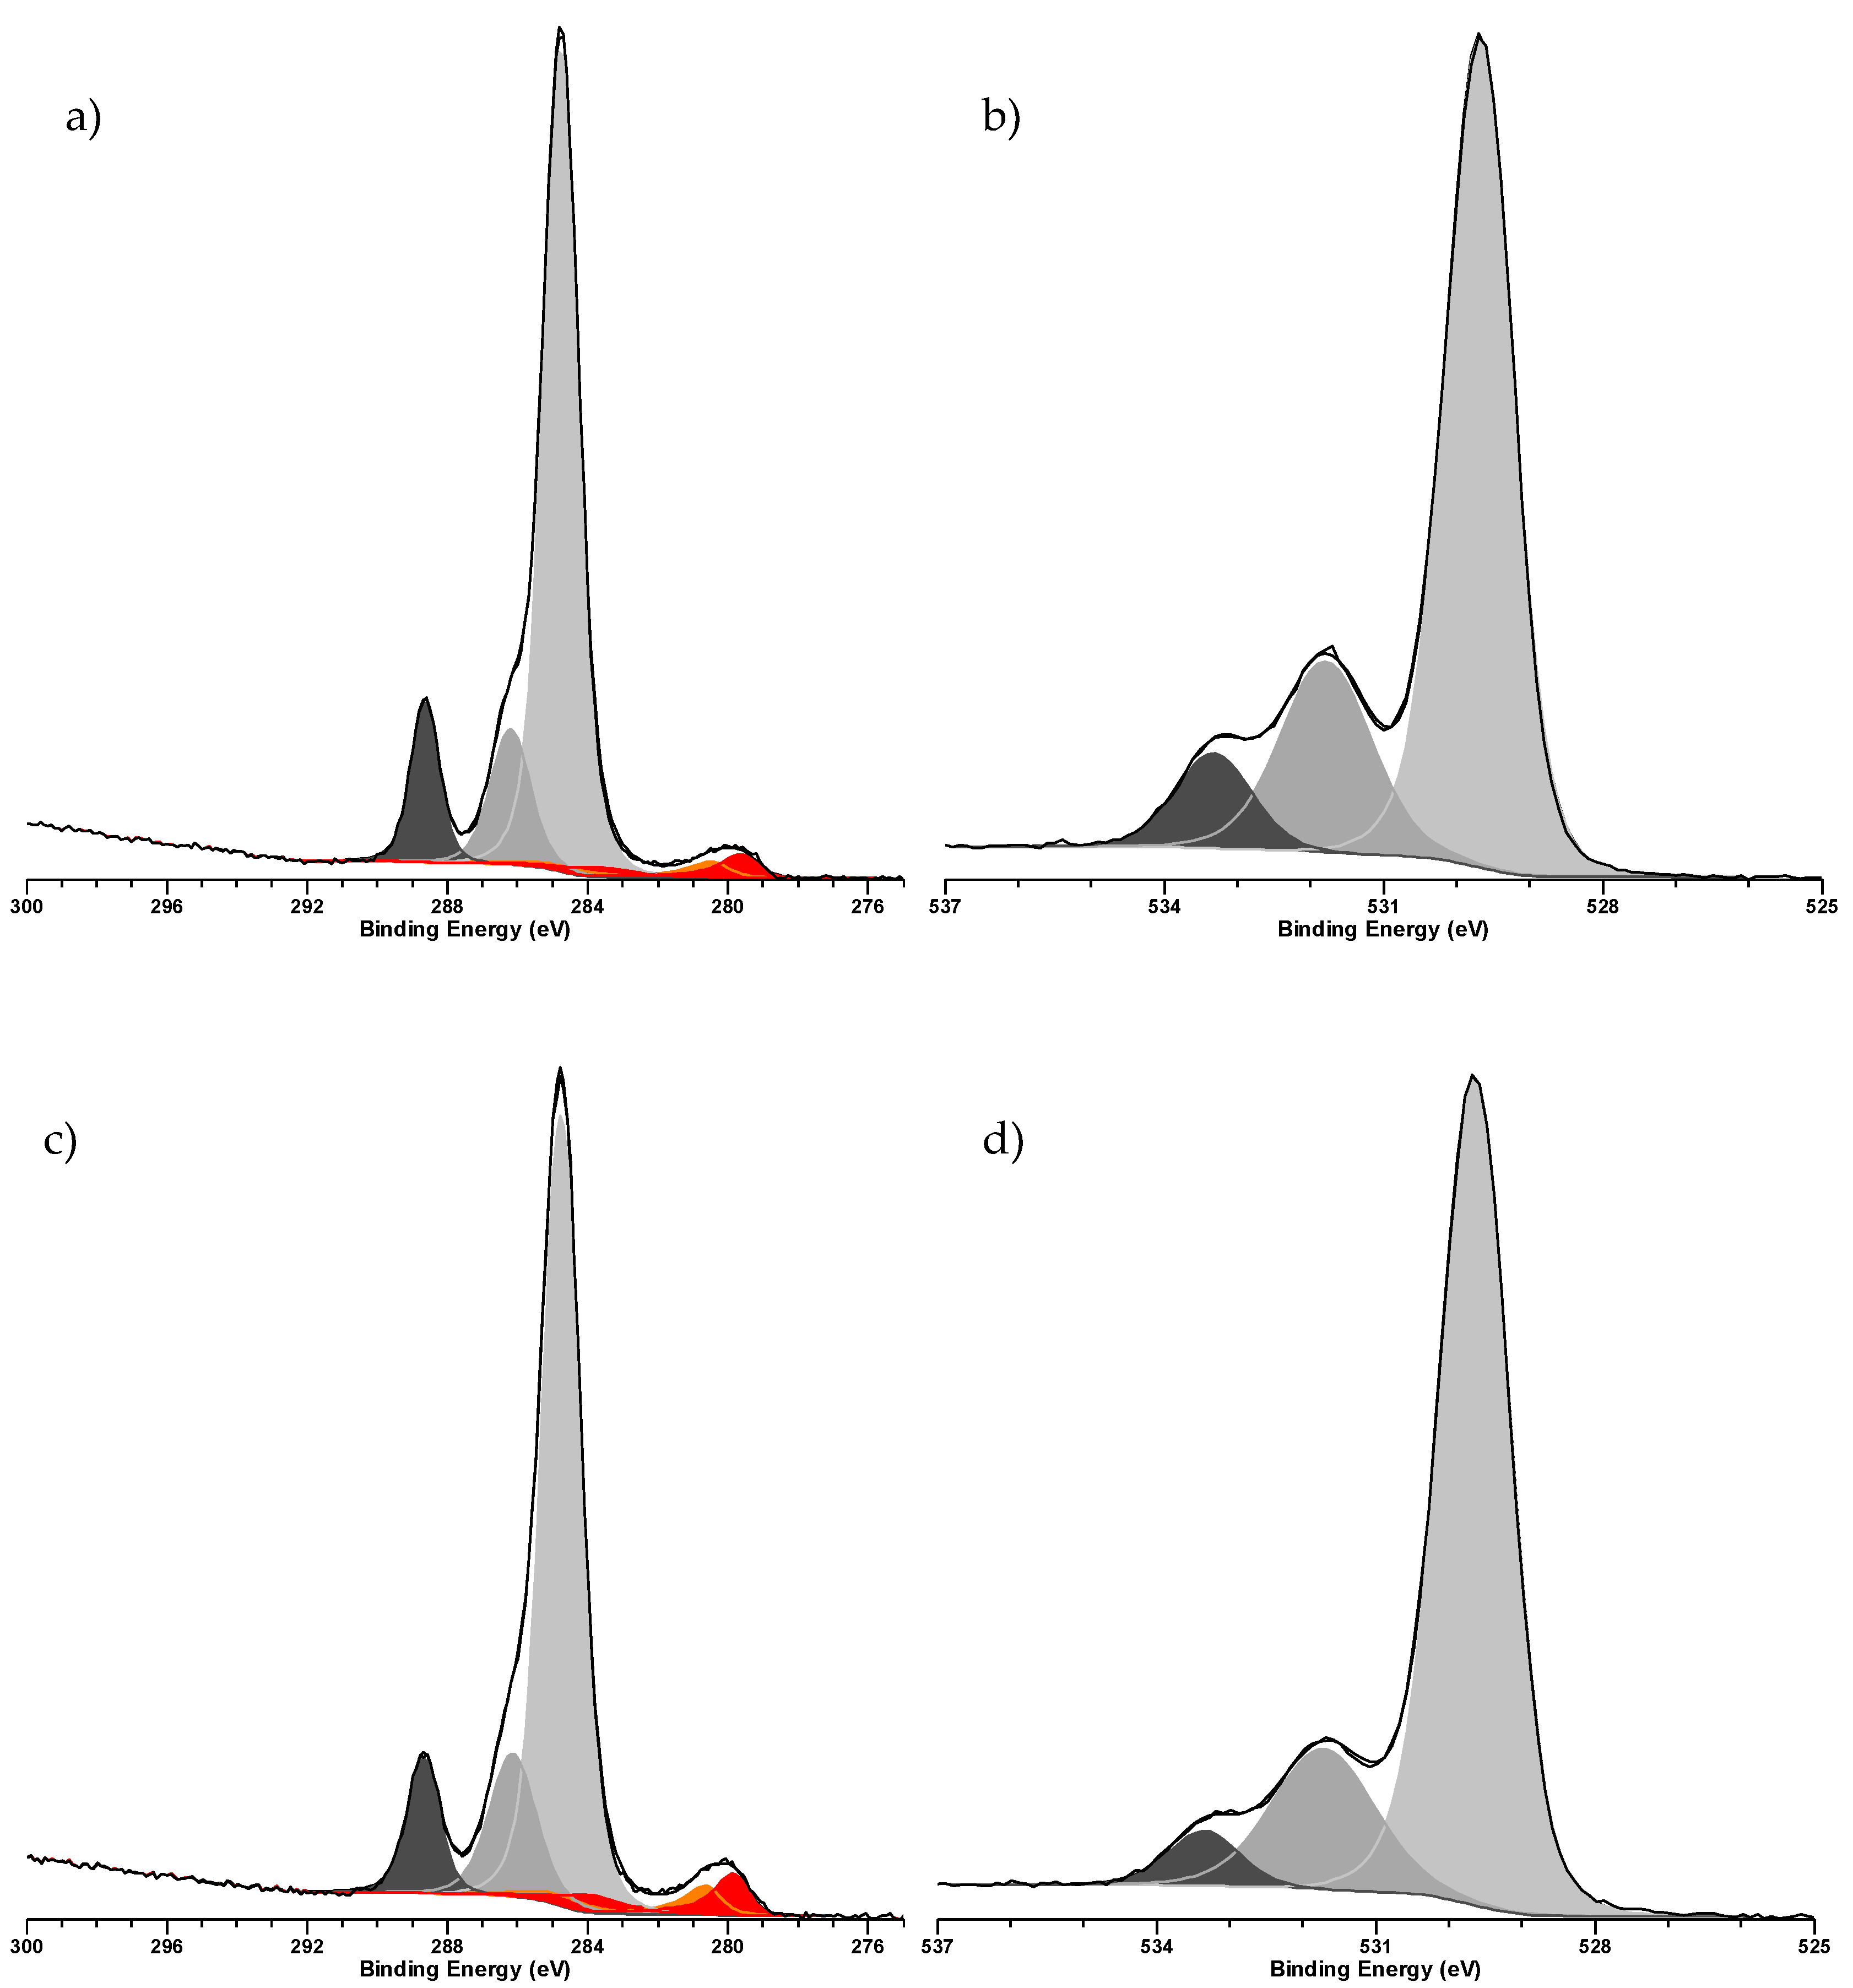
3.3. Characterization

Scanning electron microscopy was performed on a Tescan (Cambridge, UK) Maia3 field emission gun scanning electron microscope (FEG-SEM) fitted with an Oxford Instruments XMAXN 80 energy dispersive X-ray detector (EDX). Images were acquired using the secondary electron and backscattered electron detectors. Samples were dispersed as a powder onto 300 mesh copper grids coated with holey carbon film.
Transmission electron microscopy (TEM) and scanning transmission electron microscopy (STEM) were performed on a JEOL (Welwyn Garden City, UK) JEM-2100 operating at 200 kV.
X-ray photoelectron spectroscopy (XPS) data was collected on a Kratos (Manchester, UK) Axis Ultra DLD X-ray photoelectron spectrometer using a monochromatic Al Kα X-ray source operating at 140 W (10 mA x 12 kV). Survey scans and high-resolution scans were acquired at a pass energy of 160eV and 20eV respectively. Charge neutralization was achieved using an electron source and spectra subsequently calibrated to the lowest energy C(1s) peak of the adventitious carbon, assigned a binding energy of 284.8 eV; experimental binding energies are quoted ±0.2 eV. Data was processed using CasaXPS (v2.3.23rev 1.0G) using a Shirley background and modified Wagner sensitivity factors as supplied by the manufacturer.
Catalyst metal loading was determined by microwave plasma atomic emission spectroscopy (MP-AES) using an Agilent (UK) MP4100 MP-AES. Briefly, a small aliquot (100 μL) of the pre- and post-preparation solutions was sampled and diluted in 10 wt% aqueous HCl (9.9 mL) prior to analysis. Quantification of the Ru concentration was determined by emission intensity at 372.8 and 349.9 nm, with the emission intensity calibrated using a certified Ru reference standard solution (Agilent).
Brunauer–Emmett–Teller (BET) surface area measurements were performed on a Quantachrome (Hook, UK) Nova 2200 using a multipoint N2 adsorption method. Prior to the analysis, samples were degassed for 24 h at 200 °C under vacuum.
Thermogravimetric Analysis (TGA) of the prepared catalysts was performed using a Perkin Elmer (Pontyclun, UK) TGA4000. The experiments were performed in a synthetic air atmosphere from 30 to 900 °C with a ramp rate of 5 °C/min.

4. Conclusions

In summary, we investigated the effect of catalyst preparation parameters, such as metal precursor, temperature and processing time, on the microwave-assisted one pot polyol synthesis of TiO2-supported Ru nanoparticles. We found that both the temperature and preparation time are critical to producing catalysts active for Levulinic Acid hydrogenation and that even with irradiation times as short as 5 min, the resulting catalysts were found to contain highly dispersed Ru nanoparticles <3 nm in diameter. In each case, the targeted 1 wt% metal loading was achieved and quantified using MP-AES. Interestingly, catalysts prepared with this method were found to exhibit carbon surface concentrations in excess of 40%, which can be attributed to the formation of insoluble species from the solvent during nanoparticle synthesis. Bulk characterization (SEM-EDX, BET) of the catalysts suggested that the surface carbon over layer was comparatively thin and likely spread across the entire catalyst surface. Processing of the catalyst post synthesis to remove this carbonaceous layer, further and exposing the surface of the Ru nanoparticles, could result in even greater activity.

Author Contributions

Conceptualization J.K.E.; methodology, J.K.E., R.M., A.G.R.H., D.J.M.; formal analysis J.K.E., A.G.R.H., D.J.M. investigation, A.G.R.H., R.M.; resources, J.K.E., D.J.M.; data curation, A.G.R.H.; writing—original draft preparation, J.K.E., A.G.R.H.; writing—review and editing, J.K.E.; visualization J.K.E. supervision, J.K.E.; project administration J.K.E.; funding acquisition, J.K.E., D.J.M.

Funding

The authors would like to thank the UK Engineering and Physical Sciences Research Council EPSRC (EP/K031635/1) for financial support. XPS data collection and analysis was performed at the EPSRC National Facility for XPS (‘HarwellXPS’), operated by Cardiff University and UCL, under contract No. PR16195.

Conflicts of Interest

The authors declare no conflict of interest.

Data Statement

Information on the data underpinning the results presented here, including how to access them, can be found in the Cardiff University data catalogue at http://doi.org/10.17035/d.2019.0082332629.

References

  1. Bozell, J.J.; Petersen, G.R. Technology development for the production of biobased products from biorefinery carbohydrates—The US Department of Energy’s “Top 10” revisited. Green Chem. 2010, 12, 539. [Google Scholar] [CrossRef]
  2. Besson, M.; Gallezot, P.; Pinel, C. Conversion of biomass into chemicals over metal catalysts. Chem. Rev. 2014, 114, 1827–1870. [Google Scholar] [CrossRef]
  3. Werpy, T.; Petersen, G. Top Value Added Chemicals from Biomass Volume I Results of Screening for Potential Candidates from Sugars and Synthesis Gas; National Renewable Energy Lab.: Lakewood, CO, USA, 2004. [Google Scholar]
  4. Corma Canos, A.; Iborra, S.; Velty, A. Chemical routes for the transformation of biomass into chemicals. Chem. Rev. 2007, 107, 2411–2502. [Google Scholar] [CrossRef]
  5. Alonso, D.M.; Wettstein, S.G.; Dumesic, J.A. Gamma-valerolactone, a sustainable platform molecule derived from lignocellulosic biomass. Green Chem. 2013, 15, 584–595. [Google Scholar] [CrossRef]
  6. Dunlop, A.P.; Madden, J.W.; Quaker Oats Co. Process of Preparing Gammavalerolactone. U.S. Patent 2,786,852, 26 March 1957. [Google Scholar]
  7. Schuette, H.A.; Thomas, R.W. Normal valerolactone. III Its preparation by the Catalytic reduction of levulinic acid with hydrogen in the presence of platinum oxide. J. Am. Chem. Soc. 1930, 52, 3010–3012. [Google Scholar] [CrossRef]
  8. Obregón, I.; Corro, E.; Izquierdo, U.; Requies, J.; Arias, P.L. Levulinic acid hydrogenolysis on Al2O3-based Ni-Cu bimetallic catalysts. Chin. J. Catal. 2014, 35, 656–662. [Google Scholar] [CrossRef]
  9. Christian, R.V.; Brown, H.D.; Hixon, R.M. Derivatives of γ-Valerolactone, 1,4-Pentanediol and 1,4-Di-(β-cyanoethoxy)-pentane 1. J. Am. Chem. Soc. 1947, 69, 1961–1963. [Google Scholar] [CrossRef]
  10. Manzer, L.E. Catalytic synthesis of α-methylene-γ-valerolactone: A biomass-derived acrylic monomer. Appl. Catal. A Gen. 2004, 272, 249–256. [Google Scholar] [CrossRef]
  11. Al-Shaal, M.G.; Wright, W.R.H.; Palkovits, R. Exploring the ruthenium catalysed synthesis of γ-valerolactone in alcohols and utilisation of mild solvent-free reaction conditions. Green Chem. 2012, 14, 1260–1263. [Google Scholar] [CrossRef]
  12. Upare, P.P.; Lee, J.-M.; Hwang, D.W.; Halligudi, S.B.; Hwang, Y.K.; Chang, J.-S. Selective hydrogenation of levulinic acid to γ-valerolactone over carbon-supported noble metal catalysts. J. Ind. Eng. Chem. 2011, 17, 287–292. [Google Scholar] [CrossRef]
  13. Corbel-Demailly, L.; Ly, B.-K.; Minh, D.-P.; Tapin, B.; Especel, C.; Epron, F.; Cabiac, A.; Guillon, E.; Besson, M.; Pinel, C. Heterogeneous Catalytic Hydrogenation of Biobased Levulinic and Succinic Acids in Aqueous Solutions. ChemSusChem 2013, 6, 2388–2395. [Google Scholar] [CrossRef]
  14. Chia, M.; Pagán-Torres, Y.J.; Hibbitts, D.; Tan, Q.; Pham, H.N.; Datye, A.K.; Neurock, M.; Davis, R.J.; Dumesic, J.A. Selective hydrogenolysis of polyols and cyclic ethers over bifunctional surface sites on rhodium-rhenium catalysts. J. Am. Chem. Soc. 2011, 133, 12675–12689. [Google Scholar] [CrossRef]
  15. Yan, L.; Yao, Q.; Fu, Y. Conversion of levulinic acid and alkyl levulinates into biofuels and high-value chemicals. Green. Chem. 2017, 235, 5527–5547. [Google Scholar] [CrossRef]
  16. Pan, T.; Deng, J.; Xu, Q.; Xu, Y.; Guo, Q.X.; Fu, Y. Catalytic conversion of biomass-derived levulinic acid to valerate esters as oxygenated fuels using supported ruthenium catalysts. Green Chem. 2013, 15, 2967–2974. [Google Scholar] [CrossRef]
  17. Cao, S.; Monnier, J.R.; Williams, C.T.; Diao, W.; Regalbuto, J.R. Rational nanoparticle synthesis to determine the effects of size, support, and K dopant on Ru activity for levulinic acid hydrogenation to γ-valerolactone. J. Catal. 2015, 326, 69–81. [Google Scholar] [CrossRef]
  18. Dimitratos, N.; Porta, F.; Prati, L. Au, Pd (mono and bimetallic) catalysts supported on graphite using the immobilisation method. Appl. Catal. A Gen. 2005, 291, 210–214. [Google Scholar] [CrossRef]
  19. Lopez-Sanchez, J.A.; Dimitratos, N.; Miedziak, P.; Ntainjua, E.; Edwards, J.K.; Morgan, D.; Carley, A.F.; Tiruvalam, R.; Kiely, C.J.; Hutchings, G.J. Au–Pd supported nanocrystals prepared by a sol immobilisation technique as catalysts for selective chemical synthesis. Phys. Chem. Chem. Phys. 2008, 10, 1921. [Google Scholar] [CrossRef]
  20. Jones, D.R.; Iqbal, S.; Miedziak, P.J.; Morgan, D.J.; Edwards, J.K.; He, Q.; Hutchings, G.J. Selective Hydrogenation of Levulinic Acid Using Ru/C Catalysts Prepared by Sol-Immobilisation. Top. Catal. 2018, 61, 833–843. [Google Scholar] [CrossRef] [Green Version]
  21. Villa, A.; Wang, D.; Veith, G.M.; Vindigni, F.; Prati, L. Sol immobilization technique: A delicate balance between activity, selectivity and stability of gold catalysts. Catal. Sci. Technol. 2013, 3, 3036. [Google Scholar] [CrossRef]
  22. Kurihara, L.K.; Chow, G.M.; Schoen, P.E. Nanocrystalline metallic powders and films produced by the polyol method. Nanostruct. Mater. 1995, 5, 607–613. [Google Scholar] [CrossRef]
  23. Varanda, L.C.; Jafelicci, M. Self-assembled FePt nanocrystals with large coercivity: Reduction of the fcc-to-L10 ordering temperature. J. Am. Chem. Soc. 2006, 128, 11062–11066. [Google Scholar] [CrossRef]
  24. Viau, G.; Fiévet-Vincent, F.; Fiévet, F. Nucleation and growth of bimetallic CoNi and FeNi monodisperse particles prepared in polyols. Solid State Ion. 1996, 84, 259–270. [Google Scholar] [CrossRef]
  25. Dong, H.; Chen, Y.-C.; Feldmann, C. Polyol synthesis of nanoparticles: Status and options regarding metals, oxides, chalcogenides, and non-metal elements. Green Chem. 2015, 17, 4107–4132. [Google Scholar] [CrossRef]
  26. Horikoshi, S.; Schiffmann, R.F.; Fukushima, J.; Serpone, N. Microwave Chemical and Materials Processing: A Tutorial; Springer: Berlin/Heidelberg, Germany, 2017; ISBN 9789811064661. [Google Scholar]
  27. Giancarlo, C.; Diego, C. Microwave Chemistry; Cravotto, G., Carnaroglio, D., Eds.; De Gruyter: Berlin, Germany, 2017; ISBN 9783110479935. [Google Scholar]
  28. Dąbrowska, S.; Chudoba, T.; Wojnarowicz, J.; Łojkowski, W. Current Trends in the Development of Microwave Reactors for the Synthesis of Nanomaterials in Laboratories and Industries: A Review. Crystals 2018, 8, 379. [Google Scholar] [CrossRef]
  29. Pastoriza-Santos, I.; Liz-Marzán, L.M. Formation of PVP-protected metal nanoparticles in DMF. Langmuir 2002, 18, 2888–2894. [Google Scholar] [CrossRef]
  30. Morgan, D.J. Resolving ruthenium: XPS studies of common ruthenium materials. Surf. Interface Anal. 2015, 47, 1072–1079. [Google Scholar] [CrossRef]
  31. Okal, J.; Zawadzki, M.; Tylus, W. Microstructure characterization and propane oxidation over supported Ru nanoparticles synthesized by the microwave-polyol method. Appl. Catal. B Environ. 2011, 101, 548–559. [Google Scholar] [CrossRef]
  32. Wiley, B.J.; Skrabalak, S.E.; Xia, Y.; Kim, M.; Formo, E.V. On the Polyol Synthesis of Silver Nanostructures: Glycolaldehyde as a Reducing Agent. Nano Lett. 2008, 8, 2077–2081. [Google Scholar]
  33. Matsumoto, T.; Takahashi, K.; Kitagishi, K.; Shinoda, K.; Cuya Huaman, J.L.; Piquemal, J.Y.; Jeyadevan, B. Dissolution and reduction of cobalt ions in the polyol process using ethylene glycol: Identification of the active species and its role. New J. Chem. 2015, 39, 5008–5018. [Google Scholar] [CrossRef]
  34. Desimoni, E.; Casella, G.I.; Salvi, A.M. XPS/XAES study of carbon fibres during thermal annealing under UHV conditions. Carbon 1992, 30, 521–526. [Google Scholar] [CrossRef]
  35. Zielke, U.; Hüttinger, K.J.; Hoffman, W.P. Surface-oxidized carbon fibers: I. Surface structure and chemistry. Carbon 1996, 34, 983–998. [Google Scholar] [CrossRef]
  36. Desimoni, E.; Casella, G.I.; Salvi, A.M.; Cataldi, T.R.I.; Morone, A. XPS investigation of ultra-high-vacuum storage effects on carbon fibre surfaces. Carbon 1992, 30, 527–531. [Google Scholar] [CrossRef]
Figure 1. Schematic transformation of Levulinic acid (LA) to γ-Valerolactone via dehydration-hydrogenation.
Catalysts 09 00748 g001
Figure 2. Levulinic acid hydrogenation activity of 1 wt% Ru/TiO2 catalysts prepared using Ru(acac)3 at different process times and temperatures. Reaction condtions: catalyst (25 mg), 5 wt% LA (10 mL), 100 °C, H2(5 bar), 1 h.
Catalysts 09 00748 g002
Figure 3. Representative BF-TEM and associated particle size distribution of (a,b) Acac-200-10 and (c,d) Acac-200-15.
Catalysts 09 00748 g003
Figure 4. XPS narrow scans of (a) acac-200-10 Ru3d/C1s region, (b) acac-200-10 O1s region, (c) acac-200-15 Ru3d/C1s region and (d) acac-200-15 O1s region. Ru3d/C1s region—carbon fitting contributions in greyscale, Ru contributions in red/orange.
Catalysts 09 00748 g004
Figure 5. FEG-SEM EDX Map of representative acac-200-10 particle (a) Ru Lα, (b) Ti Lα, (c) FEG-SEM image, (d) O Lα, (e) C Lα. Scale bar representative of 2 μm.
Catalysts 09 00748 g005
Figure 6. Levulinic acid hydrogenation activity of 1 wt% Ru/TiO2 catalysts prepared using RuCl3 at different process times and temperatures. Reaction condtions: catalyst (25 mg), 5 wt% LA (10 mL), 100 °C, H2(5 bar), 1 h.
Catalysts 09 00748 g006
Figure 7. Representative TEM and associated particle size distribution of (a,b) Cl-150-5 and (c,d) Cl-150-10.
Catalysts 09 00748 g007
Figure 8. XPS narrow scans of (a) Cl-150-5 Ru3d/C1s region, (b) Cl-150-5 O1s region, (c) Cl-150-10 Ru3d/C1s region and (d) Cl-150-10 O1s region. Ru3d/C1s region—carbon fitting contributions in greyscale, Ru contributions in red/orange.
Catalysts 09 00748 g008
Figure 9. Thermogravimetric analysis of Ru(acac)3- and RuCl3-derived 1 wt%Ru/TiO2 catalysts.
Catalysts 09 00748 g009
Table 1. Theoretical and actual ruthenium loading of Ru/TiO2 catalysts measured by MP-AES analysis of post synthesis supernatent solution.
Theoretical Ru Loading (wt%)Actual Ru Loading (wt%)
Acac-200-1011.08
Acac-200-1510.97
Cl-150-510.96
Cl-150-1011.02
Table 2. XPS Derived atomic surface concentrations of 1 wt% Ru/TiO2 catalysts prepared using Ru(acac)3 and RuCl3 at different process times and temperatures.
CatalystXPS Dervied Surface Concentration (at%)
OTiCRuClRu(0)/Ru(II)
Acac-200-1038.0213.4348.220.280.041.3
Acac-200-1541.1316.3442.060.370.111.4
Cl-150-544.1718.2437.160.360.092.6
Cl-150-1041.3116.1242.180.30.091.5
Table 3. BET surface areas of Ru catalysts and P25 support.
MaterialBET Surface Area (m2/g)
P25 TiO251.6
Acac-200-1052.1
Acac-200-1552.1
Cl-150-551.8
Cl-150-1051.9

