Article

On the Mechanism of Carbon Dioxide Reduction on Sn-Based Electrodes: Insights into the Role of Oxide Surfaces

by
Giane B. Damas
1,*,
Caetano R. Miranda
2,
Ricardo Sgarbi
3,
James M. Portela
3,
Mariana R. Camilo
3,
Fabio H. B. Lima
3,* and
C. Moyses Araujo
1,*
1
Materials Theory Division, Department of Physics and Astronomy, Uppsala University, 75120 Uppsala, Sweden
2
Institute of Physics, University of São Paulo, São Paulo 05508-090, Brazil
3
Institute of Chemistry, University of São Paulo, São Carlos 13560-970, Brazil
*
Authors to whom correspondence should be addressed.
Catalysts 2019, 9(8), 636; https://doi.org/10.3390/catal9080636
Submission received: 3 July 2019 / Revised: 20 July 2019 / Accepted: 22 July 2019 / Published: 25 July 2019
(This article belongs to the Section Electrocatalysis)

Abstract

:
The electrochemical reduction of carbon dioxide into carbon monoxide, hydrocarbons and formic acid has offered an interesting alternative for a sustainable energy scenario. In this context, Sn-based electrodes have attracted a great deal of attention because they present low price and toxicity, as well as high faradaic efficiency (FE) for formic acid (or formate) production at relatively low overpotentials. In this work, we investigate the role of tin oxide surfaces on Sn-based electrodes for carbon dioxide reduction into formate by means of experimental and theoretical methods. Cyclic voltammetry measurements of Sn-based electrodes, with different initial degree of oxidation, result in similar onset potentials for the CO2 reduction to formate, ca. −0.8 to −0.9 V vs. reversible hydrogen electrode (RHE), with faradaic efficiencies of about 90–92% at −1.25 V (vs. RHE). These results indicate that under in-situ conditions, the electrode surfaces might converge to very similar structures, with partially reduced or metastable Sn oxides, which serve as active sites for the CO2 reduction. The high faradaic efficiencies of the Sn electrodes brought by the etching/air exposition procedure is ascribed to the formation of a Sn oxide layer with optimized thickness, which is persistent under in situ conditions. Such oxide layer enables the CO2 “activation”, also favoring the electron transfer during the CO2 reduction reaction due to its better electric conductivity. In order to elucidate the reaction mechanism, we have performed density functional theory calculations on different slab models starting from the bulk SnO and Sn6O4(OH)4 compounds with focus on the formation of -OH groups at the water-oxide interface. We have found that the insertion of CO2 into the Sn-OH bond is thermodynamically favorable, leading to the stabilization of the tin-carbonate species, which is subsequently reduced to produce formic acid through a proton-coupled electron transfer process. The calculated potential for CO2 reduction (E = −1.09 V vs. RHE) displays good agreement with the experimental findings and, therefore, support the CO2 insertion onto Sn-oxide as a plausible mechanism for the CO2 reduction in the potential domain where metastable oxides are still present on the Sn surface. These results not only rationalize a number of literature divergent reports but also provide a guideline for the design of efficient CO2 reduction electrocatalysts.

1. Introduction

The increasing levels of carbon dioxide and other greenhouse gases in the atmosphere have been associated with a major problem, the so-called global warming, with roots in the use of coal and/or fossil fuels in energy power plants, transportation and cement industries, among others. In such a context, the current efforts to develop new alternatives for recycling CO2 into fuels and useful chemicals could generate great possibilities for the future generations, as well as a more environmental-friendly scenario [1,2]. Low-weight hydrocarbons, CO and formic acid have been obtained from carbon dioxide conversion with a particular interest for the last one, which is a chemical used in medicine, fuel cells and in the food and leather industries [3,4,5].
Converting carbon dioxide into organic fuels can be achieved by means of chemical reactions through either electrochemical or photoelectrochemical processes [6,7]. In the former route, metals with high hydrogen evolution overpotential such as In, Pb and Sn exhibit good selectivity to produce formic acid (or formate, depending on the pH) in aqueous electrolyte, but Hg, Cd and Bi have also shown electrocatalytic activity [3,5,8,9]. Materials with interesting results include alloys (e.g., Cu-Zn) [10], carbon nanotubes [11], metal oxides (e.g., Cu2O, Bi2O3 and In2O3) [12,13], and in special, the Sn-based materials have attracted the attention of several researchers due to its low cost and toxicity [2,8,14,15,16]. For instance, Prakash et al. [8] have found a faradaic efficiency of 70% in formate production at −1.60 V (vs. reversible hydrogen electrode (RHE)) by using Sn powder bound with Nafion polymer to a gas diffusion layer support. Nanostructured Sn-based catalysts have also been intensely studied [2,14,15,16]. Zhang et al. [14] carried out a comparative study employing SnO2 nanoparticles loaded on both carbon black and graphene in aqueous NaHCO3 electrolyte. At −1.60 V (vs. RHE), the carbon black has returned 86.2% in faradaic efficiency for the carbon dioxide reduction to formate whereas the system based on nano-SnO2/graphene raised this value to 93.6%. The same authors pointed out to a direct influence of the particle size over the reduction efficiency, reaching the optimum value with the 5 nm nanoparticle [14].
In recent years, several works have attempted to elucidate the mechanism of CO2 electrochemical reduction on Sn-based electrodes, but there is no consensus about this topic at the present. In general, the process of electrochemical reduction of carbon dioxide in metal-based electrodes may involve the adsorption/interaction of CO2 on the electrocatalyst surface as the initial step. This is followed by the breakage of C-O bonds and C-H bond formation, which leads to reorganization and desorption from the surface. As the high stability of carbon dioxide requires the application of high overpotentials to overcome the kinetic barrier of reaction, it is usually evoked that the reaction initiates by a single electron transfer to carbon dioxide to form CO2•− anion radical species (CO2 + e → CO2•− at −1.90 V vs. NHE at pH = 7) [17]. In aqueous medium, however, these species may not be formed or have a very short lifetime due to the high availability of water, i.e., the reaction may occur via a proton-coupled electron transfer as the water molecule works as a proton donor, leading to different reaction pathways. The direct hydrogenation of the carbon atom usually leads to the production of formic acid [18], whereas carbon monoxide can be formed upon hydrogenation of oxygen atoms [17,19]. In this sense, Feaster et al. [20] have found that the final product of CO2 reduction on polycrystalline Sn depends on the adsorption site interacting with the initial molecule, with carbon monoxide or formate being formed depending on whether the adsorption takes place through the carbon (*COOH) or oxygen atom, respectively. Additionally, metallic tin has presented an optimal *OCHO binding energy, being at the top of a volcane plot of activity vs. binding energy in comparison with other metals [20].
It has also been shown that carbon dioxide weakly binds to metallic tin, specifically on the Sn(112) surface, and, thus, it is not likely that the reduction takes place with adsorbed CO2 species on metallic Sn surface, but on a metallic Sn surface with H adsorbed adatoms [5]. Nevertheless, Cui et al [21] have shown that the CO2 adsorption on the SnO/Sn(112) surface is feasible [21], where a tin oxide film would rapidly grow after the exposition to ambient air [22,23]. In fact, in-situ Raman measurements show that superficial tin oxides are present (metastable) at the CO2 reduction onset potential, but the reaction still proceeds at lower potentials where metallic tin atoms are formed [24,25]. In another work, Chen and Kanan [16] have employed Sn foil and deposited Sn/SnOx thin-film electrodes as electrocatalysts, reporting that the current densities for the Sn foil with an exposed Sn0 surface is mainly related to the H2 evolution, whereas Sn/SnOx thin-film lead to higher faradaic efficiency for HCOO formation. Interestingly, this fact has also been observed for Pb electrodes [26]. Baruch et al. [2] have found that the in-situ reduction of SnO2 at low potentials may have meta-stabilized SnOx phases with hydroxylated structures at the interfaces. The electrocatalyzed reduction on nano-SnO2 and Sn6(O)4(OH)4 nanoparticles have been shown to display a similar product distribution at more negative potentials, and this has been attributed to a greater reduction of the tin oxide layer in nano-SnO2 into a Sn(II) oxyhydroxide compound [2,15]. Furthermore, the production of formate/formic acid takes place already before the complete stabilization of metallic Sn [2,24].
Based on experimental evidence and theoretical models, some additional mechanisms for the carbon dioxide conversion into formic acid/formate on SnOx surfaces have been proposed [2,14,21,27,28,29]. Herein, SnOx indicates the presence of different phases of Sn-oxides. In this context, the tin-carbonate species have been pointed out as an important intermediate step in the process whose formation at the solid–liquid interface has been supported by infrared spectroscopy measurements [2]. This species would be subsequently reduced through a proton-coupled electron transfer process, leading to formate release and regeneration of the catalyst. In general, H2 and CO are produced along with the formate, but H2 is the major product only at higher potentials (>−1.60 V vs. RHE) [2]. Therefore, in addition to the effect of suppressing the water electroreduction, metastable tin oxides may favor the CO2 reduction to formate/formic acid via chemical reaction with CO2 in a first step, followed by steps of proton-coupled electron transfer.
From a theoretical viewpoint, some research groups have built distinct models to represent the crystalline structure of SnOx. For instance, Wang et al. have modelled the SnOx surface states by cutting tin (II) oxide along the (101) direction and further considering the embedded –OH groups in the possible reaction pathways [29]. In a different strategy, Cui et al. [21] have used the metallic Sn(112) facet to model an interface system with a SnO monolayer, which has been achieved by substituting some Sn surface atoms for oxygen. They have found that water dissociation into hydroxyls are thermodynamically favorable at low potentials. In general, both carbon-coordinated (COOH, carboxylate) or oxygen-coordinated (OCHO, formate) species as well as adsorbed hydrogen have been evaluated as possible intermediates [21,29,30]. Oxygen vacancies are shown to be thermodynamically favorable, promoting stabilization of the oxygen-coordinated OCHO species in the lowest energy reaction pathways [29].
In summary, the aforementioned studies suggest that CO2 molecules can be reduced along different pathways depending on the electrode potential, which would explain some divergent results on metallic tin and various forms of tin-oxide derived electrodes with FE for formate production varying from 10–95%. In other words, the scattered values of the reported FE may arise from the fact that the electrocatalytic activity of tin strongly depends on the in-situ (or operational) conditions. Thus, it is likely that operando spectroscopic techniques can give a better insight into the structural and chemical changes that tin electrode undergoes as a function of the potential and, thus, it is appropriate to determine the reaction mechanism. Additionally, there is a distinct lack of information on the thermodynamics of the CO2 interaction with the hydroxylated interfaces to form the proposed tin-carbonate species and their subsequent electrochemical reductions. This is actually the focus of our study.
In this work, we have investigated the process of CO2 reduction to formate on tin foil electrodes by employing a combined theory-experiment approach. Two sets of Sn-based electrodes have been prepared with different exposures times to air after acid etching, which has led to different initial degrees of oxidation. The onset potentials of carbon dioxide electrochemical reduction on these two initial configurations were found to be ca. −0.8 to −0.9 V vs. RHE, showing maximum FE of 90–92% at a potential of ca. −1.25 V vs. RHE. Thus, under in-situ conditions the electrode surfaces converge to very similar structures, with partially reduced or metastable Sn oxides that serve as active sites for the CO2 reduction. In order to investigate the mechanism involved in such reaction, we have assessed the thermodynamics of CO2 insertion into the oxy-hydroxide layers to form the carbonate species and the subsequent electrochemical reduction through ab initio methodology. Two model systems have been built up, starting from the bulk structures of tin (II) oxide (SnO) and tin (II) oxyhydroxide (Sn6O4(OH)4), to develop a comparative study of different chemical environments. Our results indicate that indeed the carbonate formation is a thermodynamically favorable process with the reaction energy varying from −0.32 eV (isolated cluster) to −0.75 eV (interface reaction). Additionally, the first proton-coupled electron transfer takes place at a calculated potential of −1.65 V and −1.09 V (vs. RHE) for the layered-tin (II) oxyhydroxide and hydroxide-terminated tin oxide surface layer (SnOOH) systems, respectively, which fairly agrees with the value obtained experimentally. Thus, our findings suggest that the active layer in the experimental conditions is consistent with a hydroxide-terminated tin oxide surface layer (SnOOH). In summary, the high faradaic efficiencies of the Sn electrodes brought by the etching/air exposition procedure can be attributed to the formation of an optimized thickness of the tin oxide layer, allowing the presence of Sn oxides that are important for the CO2 “activation”, besides the presence of good electric conductivity that favors the electron transfer during the CO2 reduction reaction.

2. Results and Discussion

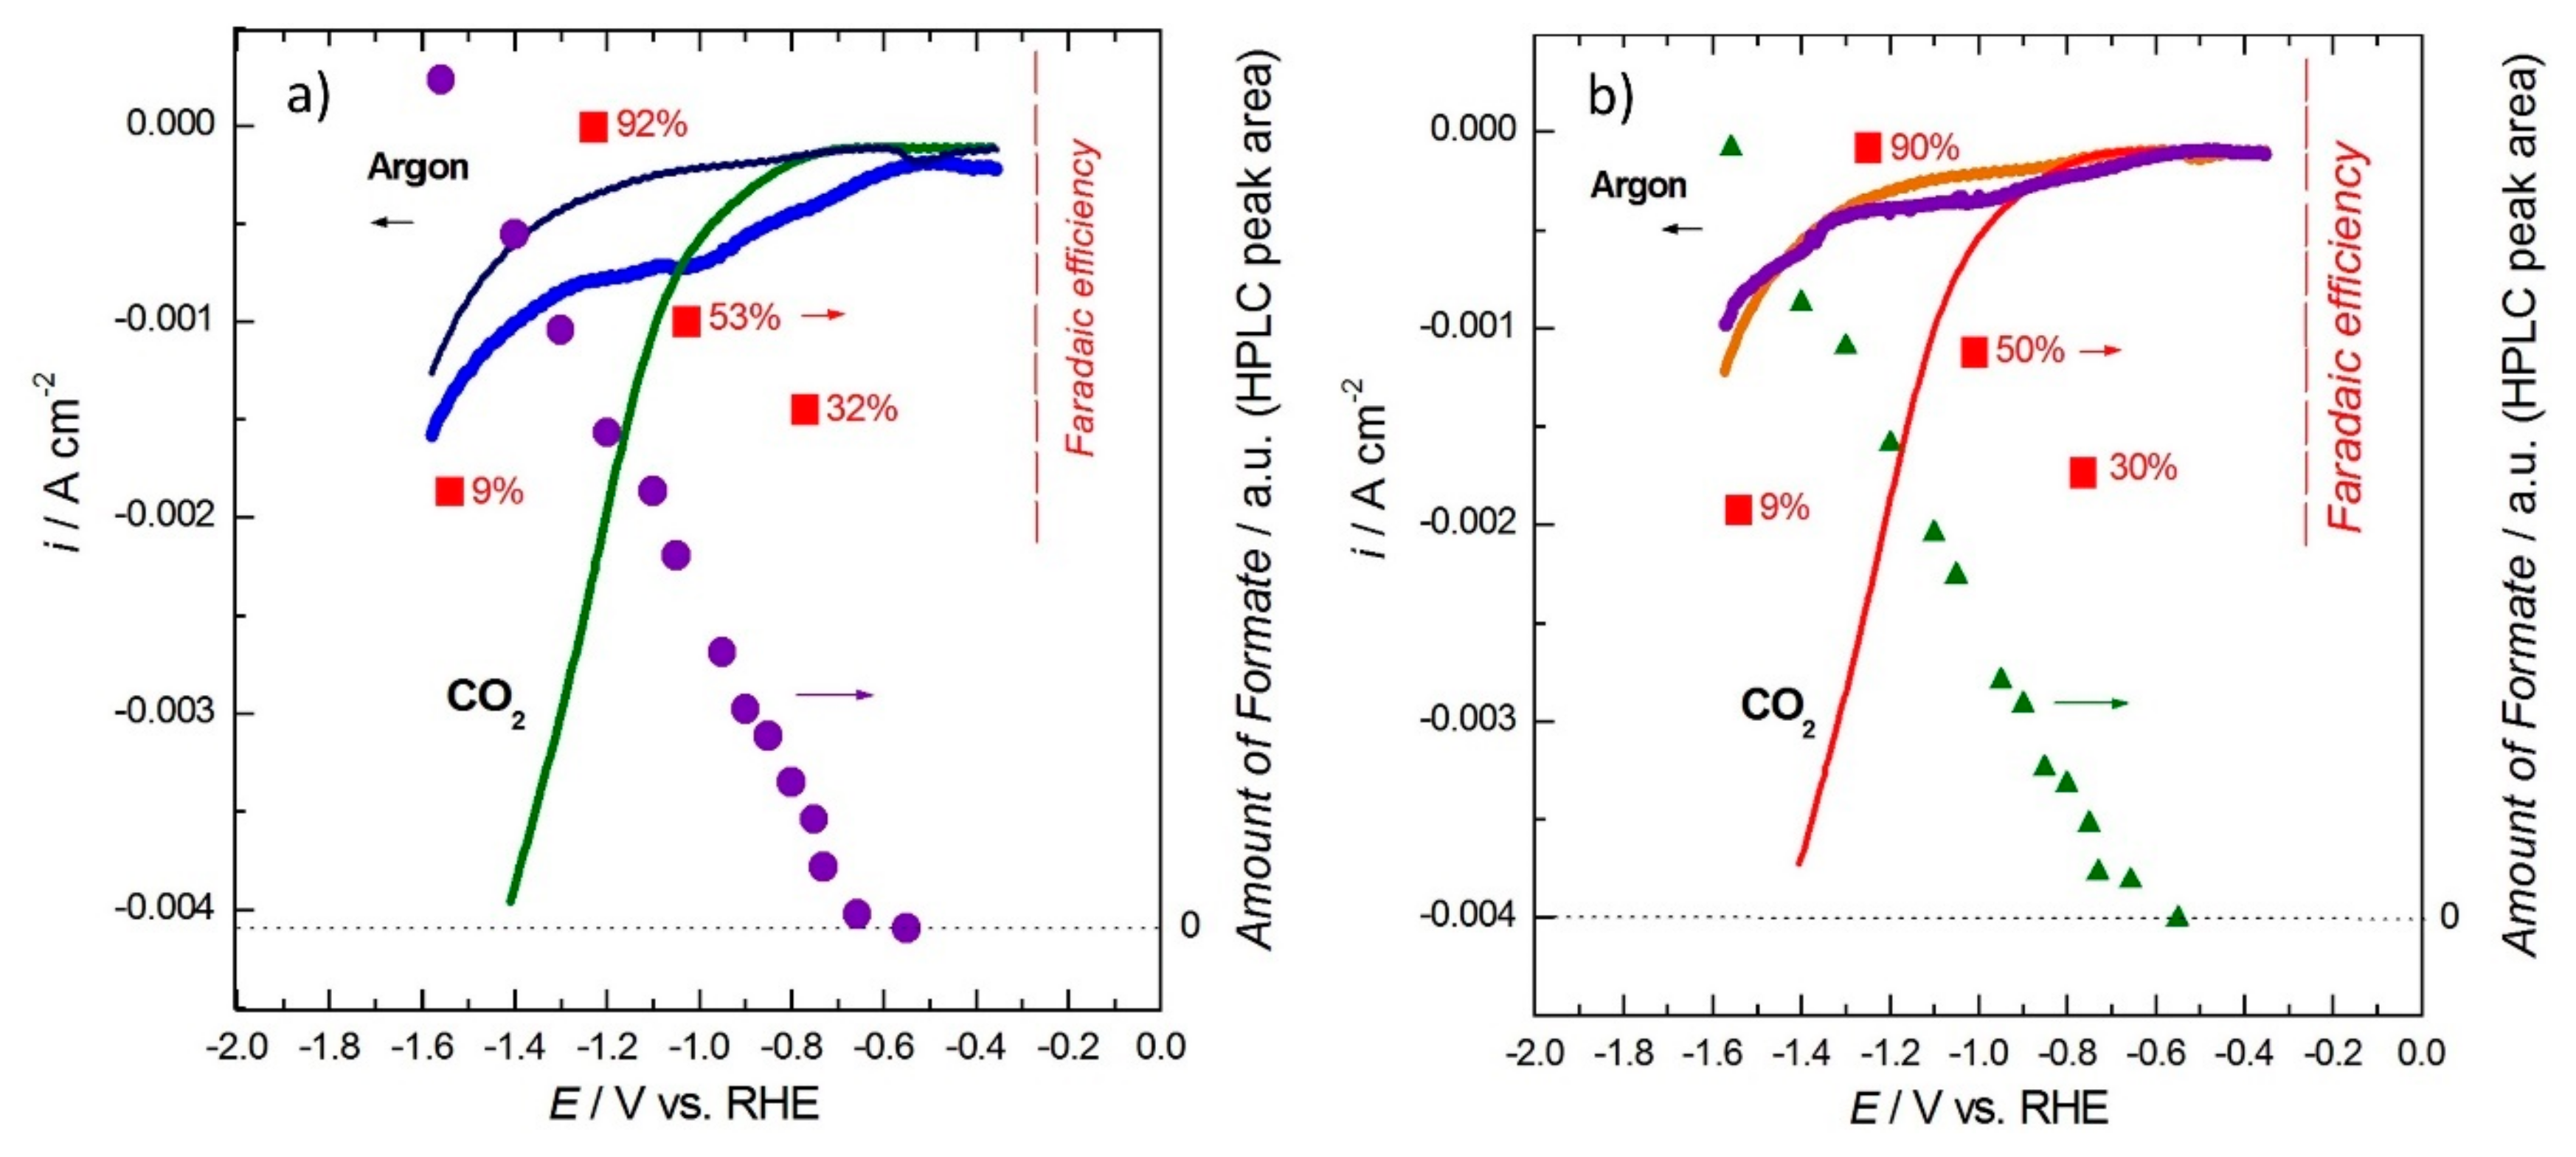
2.1. Experimental Results on Tin-Based Electrodes

In order to verify the surface chemistry, high-resolution X-ray photoelectron spectroscopy (XPS) spectra for the Sn 3d bands have been obtained for the Sn-1 and Sn-2 electrodes, as shown in Figure S1a,b, respectively. The peaks at ca. 484.7 and 493.0 eV are ascribed to Sn0 for 3d3/2 and 3d5/2, respectively, and those at ca. 486.5 and 495.5 eV are ascribed to SnO2 (Sn2+ and Sn4+) for 3d3/2 and 3d5/2, respectively, for both electrodes. However, the Sn-1 electrode presents peak areas corresponding quantitatively to 6% of Sn0 and 94% of SnO2, whereas the Sn-2 electrode contains a slightly lower amount of SnO2 (86%). Comparatively, Chen et al. [16] have found a content of 18% of SnOx surface phase on etched Sn electrode, which has increased to about 60–70% after one day of air exposition [16]. The etching procedure that is used in the present study is very similar to that conducted by Chen et al., which indicates that the Sn surface is readily oxidized in air even upon removal of the oxide layer through the etching process. This is easily explained by the tendency of non-noble metals to form surface oxides spontaneously under ambient or aqueous conditions [31], but we would expect different degrees of oxidation with the use of different conditions for preparation of these materials.
The first and the second linear voltammetric scan curves obtained for the Sn-1 and Sn-2 electrodes in Ar-saturated 0.1 mol L−1 Na2SO4 electrolyte are presented in Figure 1a,b, respectively. In the Ar-saturated electrolyte for Sn-1, we can see a cathodic current wave in the first scan (blue curve) that starts at ca. −0.7 V and reaches a plateau at ca. −1.0 V (vs. RHE), which may indicate the reduction of SnO2 (formed after exposition to air) to SnO and, possibly, to metallic Sn, at lower potentials. A second cathodic wave is observed below ca. −1.4 V (vs. RHE), being ascribed to the water electrochemical reduction (hydrogen evolution). However, in the second linear scan (dark blue curve), the first cathodic current wave decreases substantially. The Sn-2 electrode shows a similar behavior, but the first linear scan (see violet curve in Figure 1b) has a much lower first cathodic current wave compared to Sn-1. In fact, as demonstrated by Cho S. et al. [23], the electrochemical reduction analysis of tin electrodes, with intentional growth of Sn-oxide layers, revealed that SnO grows as the first layer within few hours when Sn is exposed to air. They have showed that as oxidation time and the temperature in which the electrodes were submitted in contact to air increases, the reduction potential of the tin oxides is shifted towards more negative values. They have also observed that the surface of tin was covered with a blocking layer of SnO2 over the SnO layer in humid conditions. At 150 °C, the formation of SnO was followed by the growth of SnO2 during long aging time.
The curves of the first linear scan for both Sn-1 and Sn-2 electrodes are in fair agreement with those obtained by Cho S. et al. [23], showing similar values for the electrochemical reduction of the Sn oxides. In this sense, the higher cathodic current for Sn-1 is directly associated to the higher amount of SnO2 species presented by this electrode in comparison with Sn-2 due to its longer time of exposition to air. For both electrodes, most of the oxides are electrochemically reduced after the first negative-going scan in Ar-saturated electrolyte. Since the second negative-going scan has no cathodic current for both electrodes (only that for H2 production below ca. −1.4 V), this would indicate the production of metallic Sn surfaces, as Sn0 may be formed at low potentials in parallel to the hydrogen evolution. However, as mentioned before [16], metastable metal oxides are known to persist on electrode surfaces even at low potentials (below the standard reduction potentials), at least in the topmost atomic layers. Probably, the maintenance of these metastable oxides under in-situ conditions is given by the OH species that are formed during the CO2 conversion and by the parallel water reduction. In particular, for the case of Sn, this was nicely evidenced by in-situ Raman experiments [24,25]. Dutta et al. [24,25] have shown that the Raman signal ascribed to tin oxides is still present in the potential domain where the CO2 reduction to formate takes place. Therefore, even having different initial amounts of surface oxides, Sn-1 and Sn-2 electrodes may have a surface with very similar structure/composition (similar surface metastable oxide amount) after the first scan in Ar-saturated electrolyte.
As can be noted in Figure 1a,b, the onset potential of the cathodic current at ca. −0.60–0.70 V (vs. RHE) is coincident with the initiation of the formate production for both Sn-1 and Sn-2 electrodes (violet circles and olive triangles, respectively), and it follows a linear increase with the decrease of the potential, at least in the potential domain considered in this study. For both electrodes, the faradaic efficiencies (FE, red squares) increase from 32 and 30% at −0.75 V to 53 and 50% at 1.00 V, respectively. FE reaches a maximum at −1.25 V for both electrodes, with 92 and 90% for Sn-1 and Sn-2 respectively. At a lower potential, −1.50 V, FE is decreased substantially to about 9%. Thus, Sn-1 and Sn-2 electrodes behave similarly in in-situ conditions even presenting different initial content of tin oxides, with formate production occurring at the same onset potential with practically the same faradaic efficiency. We have also tested the immediate immersion of the tin electrodes in the electrochemical cell after the etching procedure and water rinse, as well as thermally treated Sn foils at 150 °C for 1.0 h. Both sets of experiments have returned the same faradaic efficiencies. Here, it is important to mention that no other liquid product (ionic or molecular species) was produced, as revealed by measurements of gas chromatography and high-performance liquid chromatography (HPLC). CO was detected, but only at very low amounts, at low overpotentials (below −1.0 V vs. RHE), as expected. Previous studies have found faradaic efficiencies of ca. 7% for Sn foil and Sn/C-based electrodes at low overpotentials [32,33]. Thus, the faradaic efficiencies for formate production do not suffer significant influence from the CO formation in the potential domain that is herein investigated. The substantial decrease of FE for formate production at potentials below −1.5 V vs. RHE is, therefore, ascribed to the competition with the water reduction (hydrogen evolution).
Comparatively, Wu et al. [34] have also submitted Sn foil electrodes to an acidic etching procedure that resulted in a maximum FE of 95% at the same potential and using the same electrolyte that we have employed in the present study. It is important to emphasize that these values of FE lying in the interval of 90–95% are among the highest values that have been reported in the literature. Interestingly, the high FE is maintained even after 4 h of polarization, as can be observed in Figure S2. Although we are not able to argue that the CO2 reduction mechanism remains the same in this time interval, this result evidences the high stability of the Sn electrode for the CO2 reduction.
There is no consensus in literature about the key parameters that govern the FE for formate production on Sn-based electrodes. Some authors claim that high FE on bulk or nanostructured Sn electrodes is only obtained upon the presence of surface oxides [16,35], whereas others claim that that sub-surface oxygen has a decisive role [36]. These studies are in disagreement with the work published by Wu et al. [34] These apparent contradictions were clarified by Zhang et al. [28] They compared an Sn(SnOx)-modified glassy carbon electrode with a Sn foil, and the resulting FE were 50 and 22% at −1.10 V vs. RHE, respectively. Their characterization via XPS showed very similar spectra for both electrodes and so, with similar surface oxidation state. Hence, the oxidation state cannot be an important factor controlling the electrocatalytic activities. On the other hand, a central difference was found in the X-ray diffraction results, which revealed that the Sn (SnOx)-modified glassy carbon electrode has a highly preferred orientation in the Sn (200) plane, whereas the Sn foil has a random orientation, typically of polycrystalline Sn. Thus, they have associated the differences in the electrocatalytic activity to the preferential adsorption of CO2 reduction intermediates on the Sn (200) surface.
Considering that previous studies using in-situ Raman [24,25] revealed that residual tin oxides (metastable) are still present at potentials where the CO2 reduction occur with high FE, tin oxides under electrochemical polarization may produce a surface with a residual oxide layer that is very active for CO2 reduction. It is on this surface that this process takes place with the highest faradaic efficiency. Indeed, a previous study demonstrated that native oxides can result in high FE in Sn nanoparticles [37]. Interestingly, as can be noted in Figure 1, when the potential is too low (~ −1.5 V), FE suffers a strong decrease. The results of Raman in-situ [24] disclosed that the signal ascribed to tin oxide loses intensity, significantly, which indicates the reduction to metallic tin that is accompanied by a decrease in FE, being H2 the major product. Indeed, Cui et al. [21] showed that the presence of Tin-oxide species on the surface promotes CO2 reduction by lowering the overpotential. It was shown that CO2 can be inserted into the -OH group in a hydroxylated SnO layer, a process that is followed by the electrochemical reduction to formate. However, at low potentials, they have also demonstrated the adsorption of a hydrogen atom takes place to form (-Sn)H*, which reacts with CO2 molecule for formate production [5]. Thus, the CO2 reduction follows different reaction mechanisms on an oxide-covered- and metallic tin surface at low-to-medium and high overpotentials, respectively. In the latter, the hydrogen evolution is dominant over CO2 reduction.
In summary, the acidic treatment removes the electrically non-conductive SnO2 phase from the Sn foil surface, leaving pure metallic tin atoms at the topmost layer. However, after the exposition to air, an Sn oxide layer is formed again in the experimental conditions of this study, but now with much lower thickness. Under in-situ conditions, after potential excursions to low potentials, most of this re-grown oxide is electrochemically reduced, remaining only metastable surface Sn oxides (probably with a few layers) that are just enough to catalyze the conversion reaction, while also presenting “better” morphology to carry out the process. In fact, such electrode configuration may have a better electric conductivity that facilitates the electron transfer during the CO2 reduction reaction. The effect of the Sn oxide thickness was previously evaluated in a similar way, but using Sn oxide nanoparticles [37]. As an overall result of acid etching that is followed by air exposition, our Sn-based electrodes present high FE (90–92%) for CO2 reduction to formate, a value that is among the highest that have been reported in the literature. In the next section, further insights will be given on the reaction mechanism.

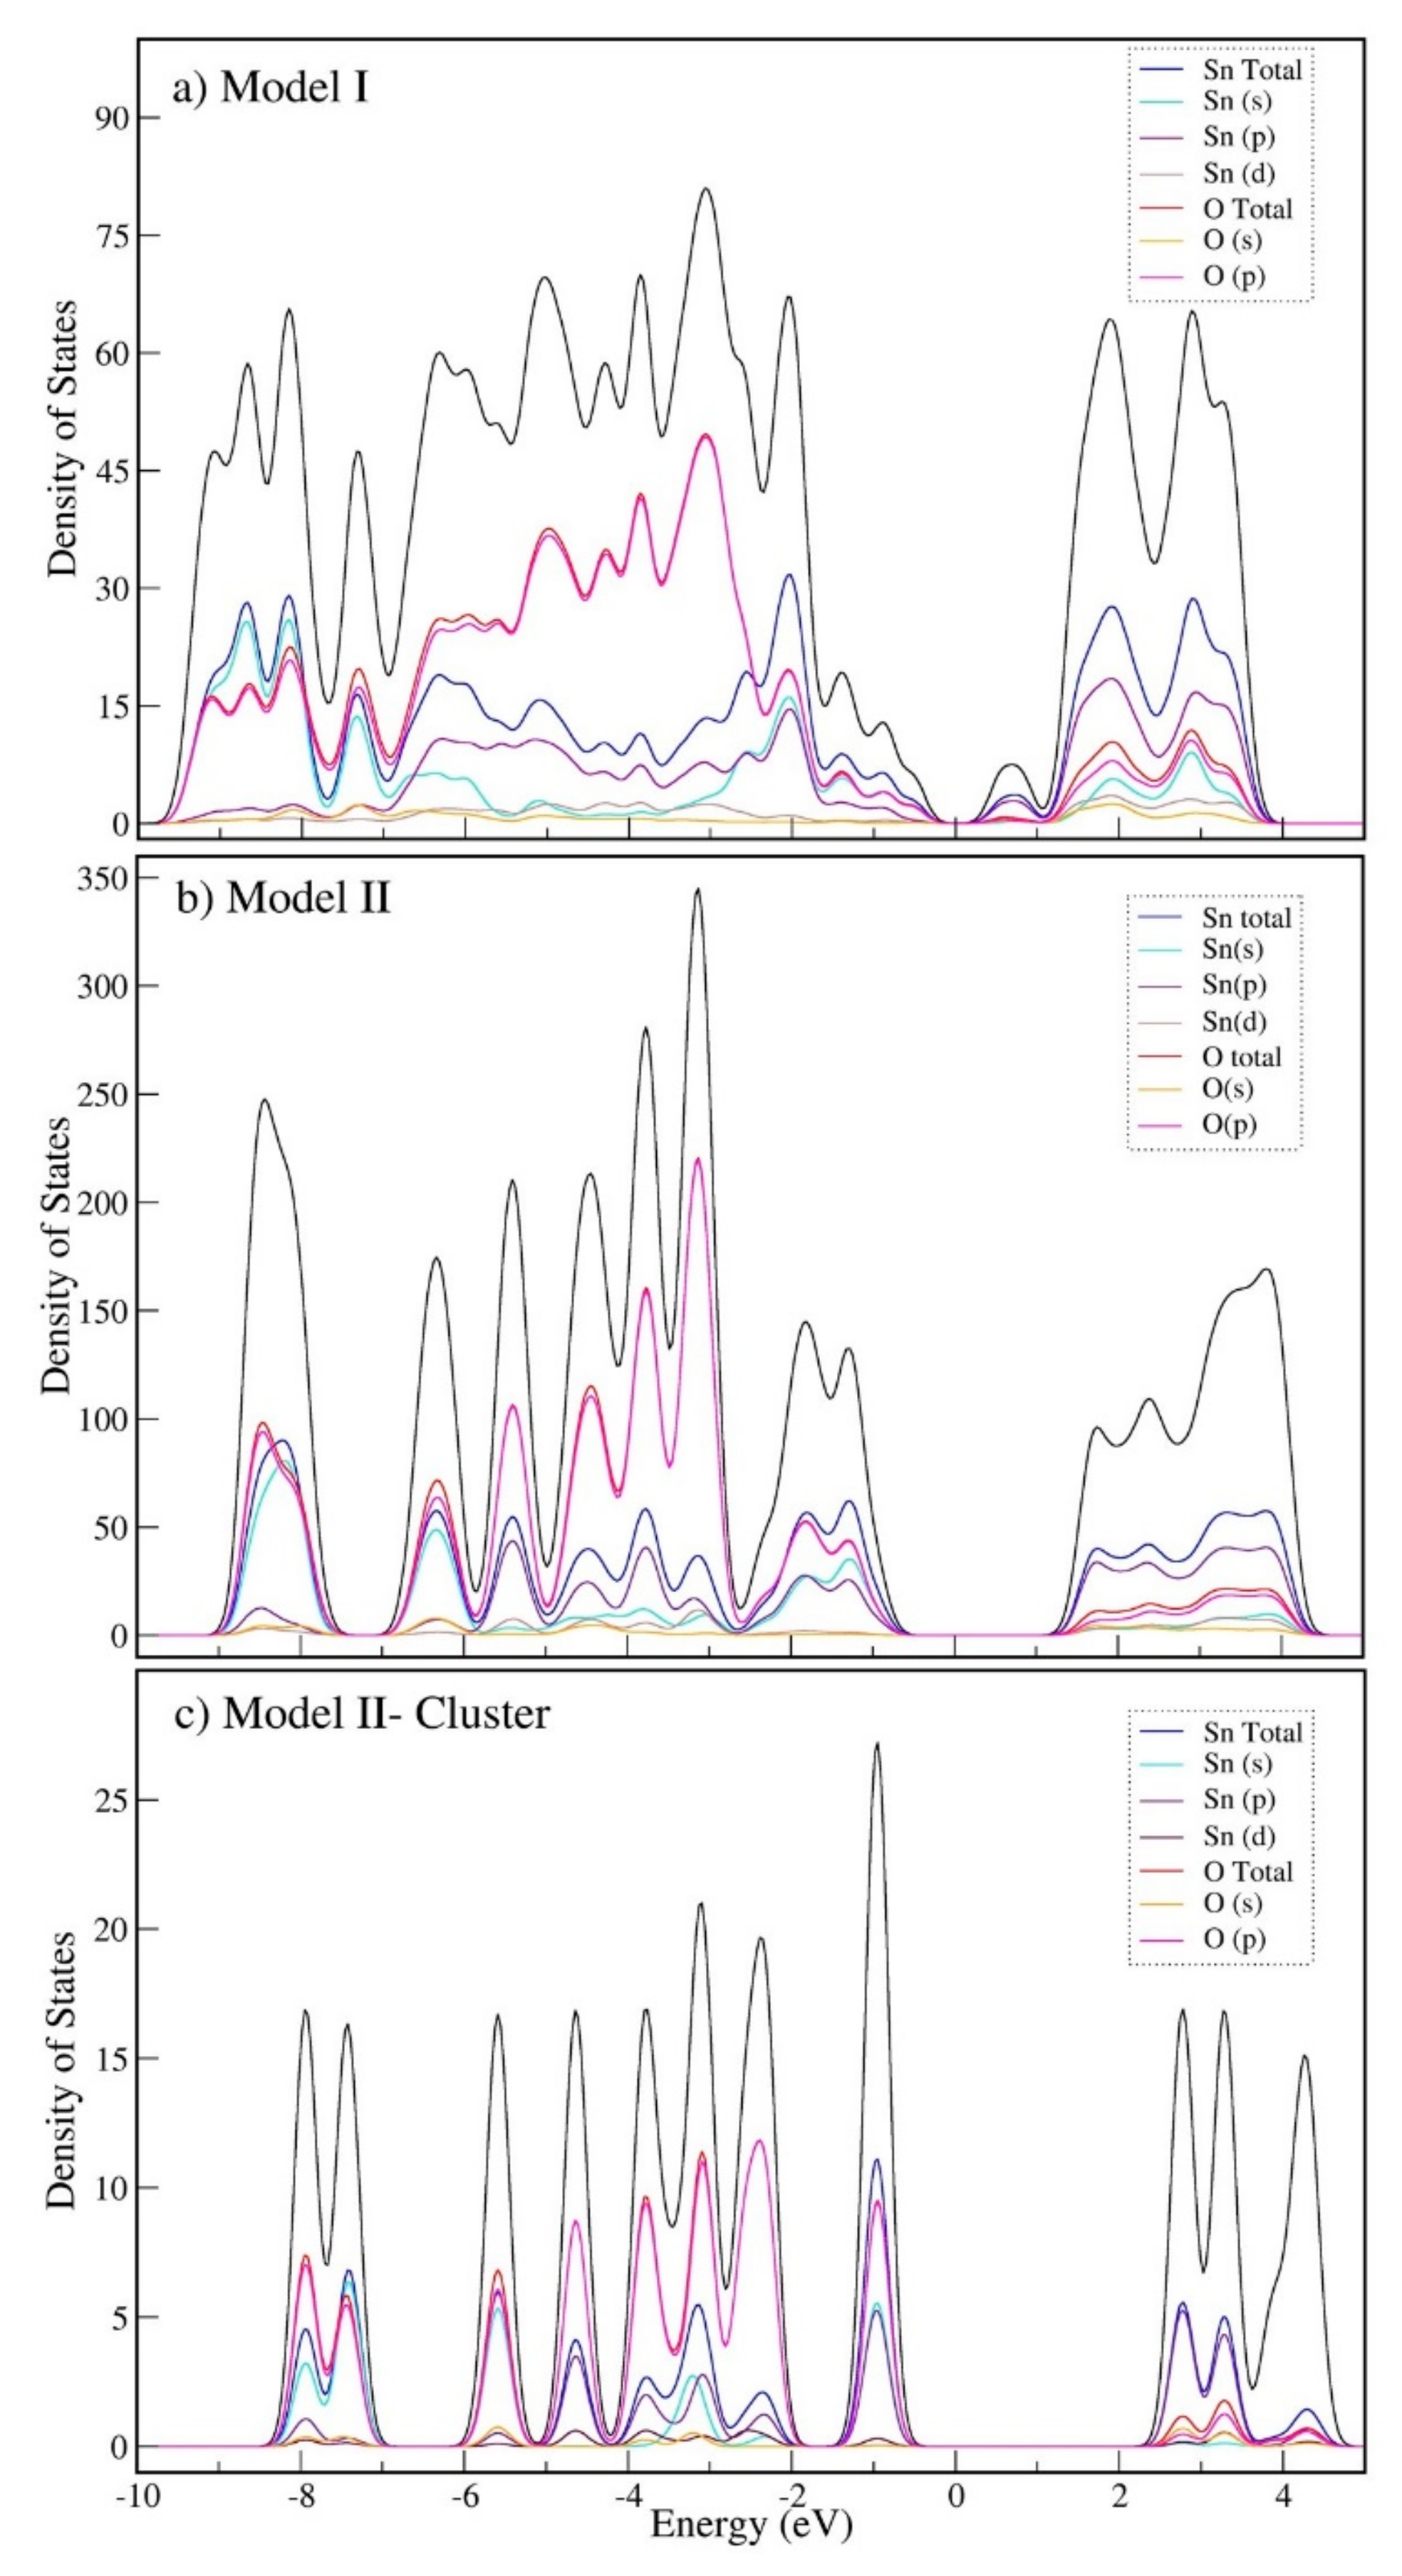
2.2. Bulk Calculations

In order to build a model that represents the SnOX layer, we have chosen SnO and Sn6O4(OH)4 as tin oxide-derived materials. In this subsection, some basic information regarding the bulk structure of these materials is summarized.
Tin (II) oxide (SnO) crystallizes in a tetragonal structure with P4/nmm space group symmetry and our optimized lattice parameters are found to be a = b = 3.84 Å and c = 4.81 Å at Perdew–Burke–Ernzerhof functional (PBE) level including D3-Grimme corrections for van der Waals (VDW) interactions, in quite good agreement with other theoretical reports [38,39,40,41]. In this crystal, Sn-O-Sn layers interact through weak dispersive forces with a calculated interlayer distance of 3.69 Å. As shown in Figure 2a, each Sn is surrounded by four oxygen atoms in a square pyramidal geometry with Sn-O bond length of 2.24 Å and Sn-O-Sn angle of 117.79°.
The crystallization of tin (II) oxyhydroxide (Sn6O4(OH)4) occurs in a P   4   ¯ 2 1 c space group with optimized dimensions a = b = 7.88 Å and c = 9.10 Å and Sn-O bond length varying from 2.14 Å to 2.41 Å at PBE level including VDW corrections, which is also in accordance with the literature [42]. Each unit cell contains two clusters where the four-coordinated Sn is disposed in a geometry similar to SnO and the interlayer distances are about 3.92 Å. In the hydroxyl groups, the hydrogen atoms are oriented towards the four-coordinated O atoms to form hydrogen bonds at a distance of 1.84 Å, whereas the remaining O atoms are found in the vertices of a trigonal pyramidal arrangement (Figure 2b).
SnO is assumed to be a semimetal or a small-gap semiconductor with fundamental gap of 0.7 eV [21]. As expected, the use of the Perdew–Burke–Ernzerhof functional (PBE) functional has returned an underestimated value of 0.3 eV, a problem that was overcome by using the HSE06 hybrid functional with 38% of exact exchange. At this level of theory, we have obtained a band gap of 0.697 eV and 3.363 eV for SnO and Sn6O4(OH)4, respectively. In these compounds, the electronic configuration of Sn is 4d10 5s2 5p0 as a result from the two-electron transfer from Sn5p to the oxygen, whereas the filled 5s subshell constitutes a lone pair that promotes the distortion in the Sn geometry [39,43]. A detailed analysis of the bulk electronic structure of these oxides is not the main focus of the current study and will be presented in a new publication in due course.

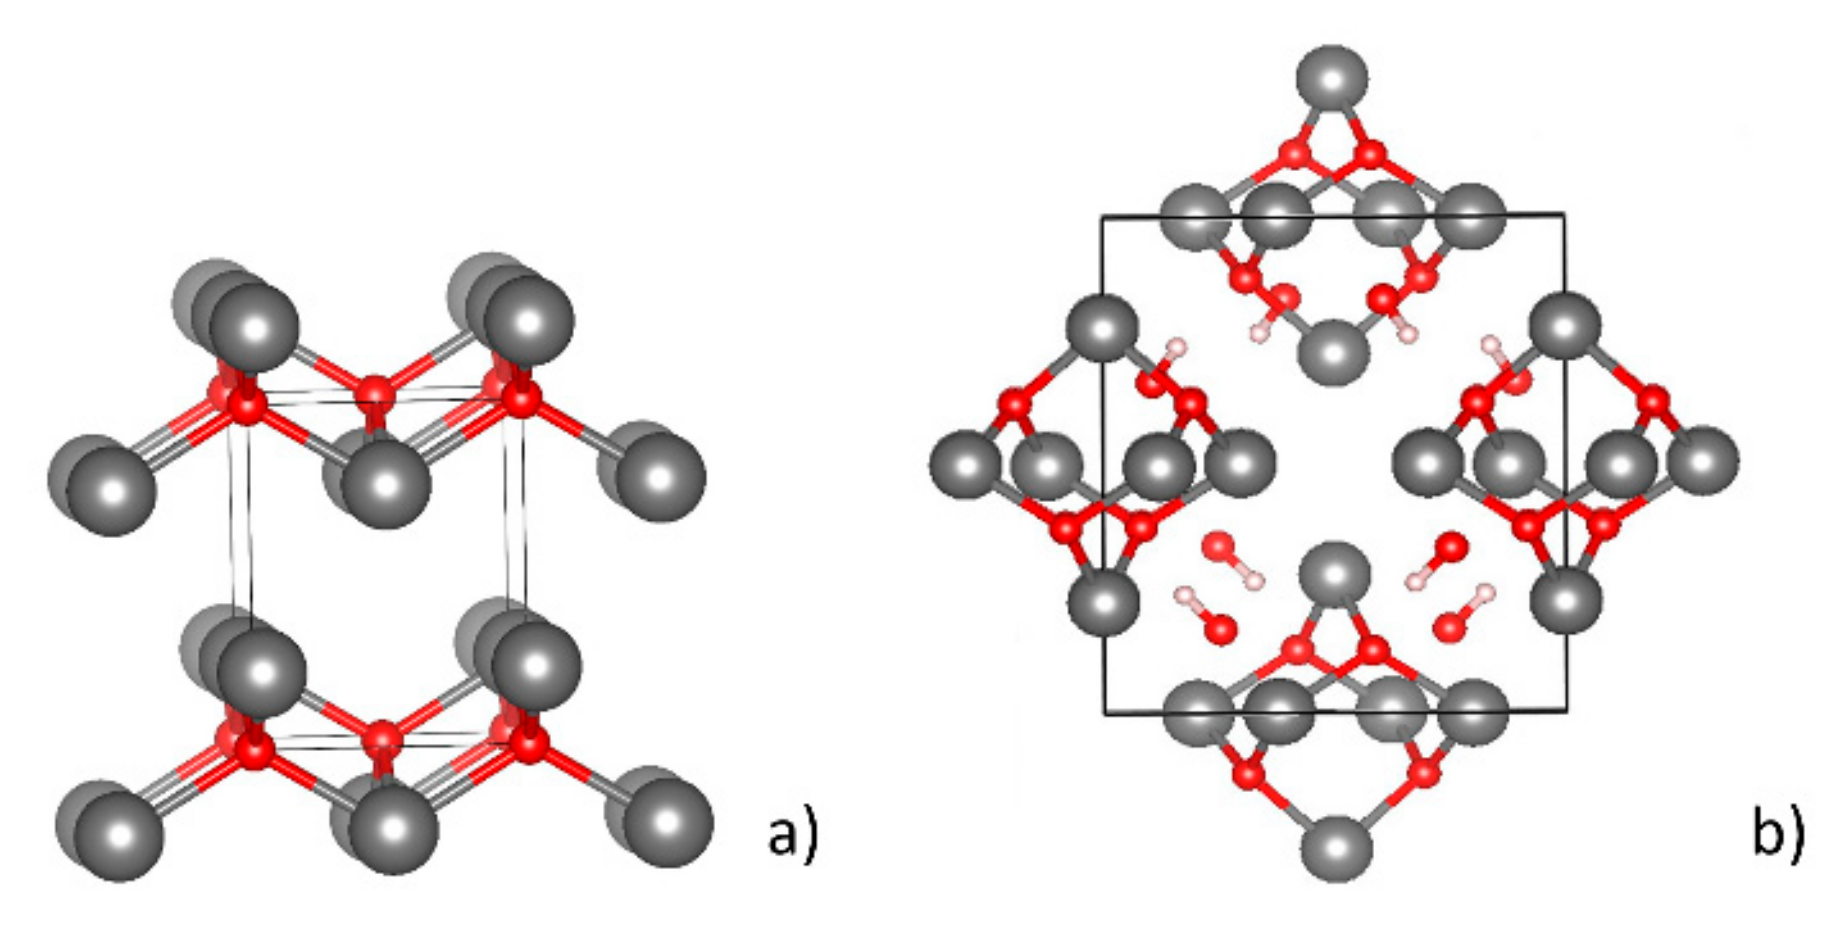
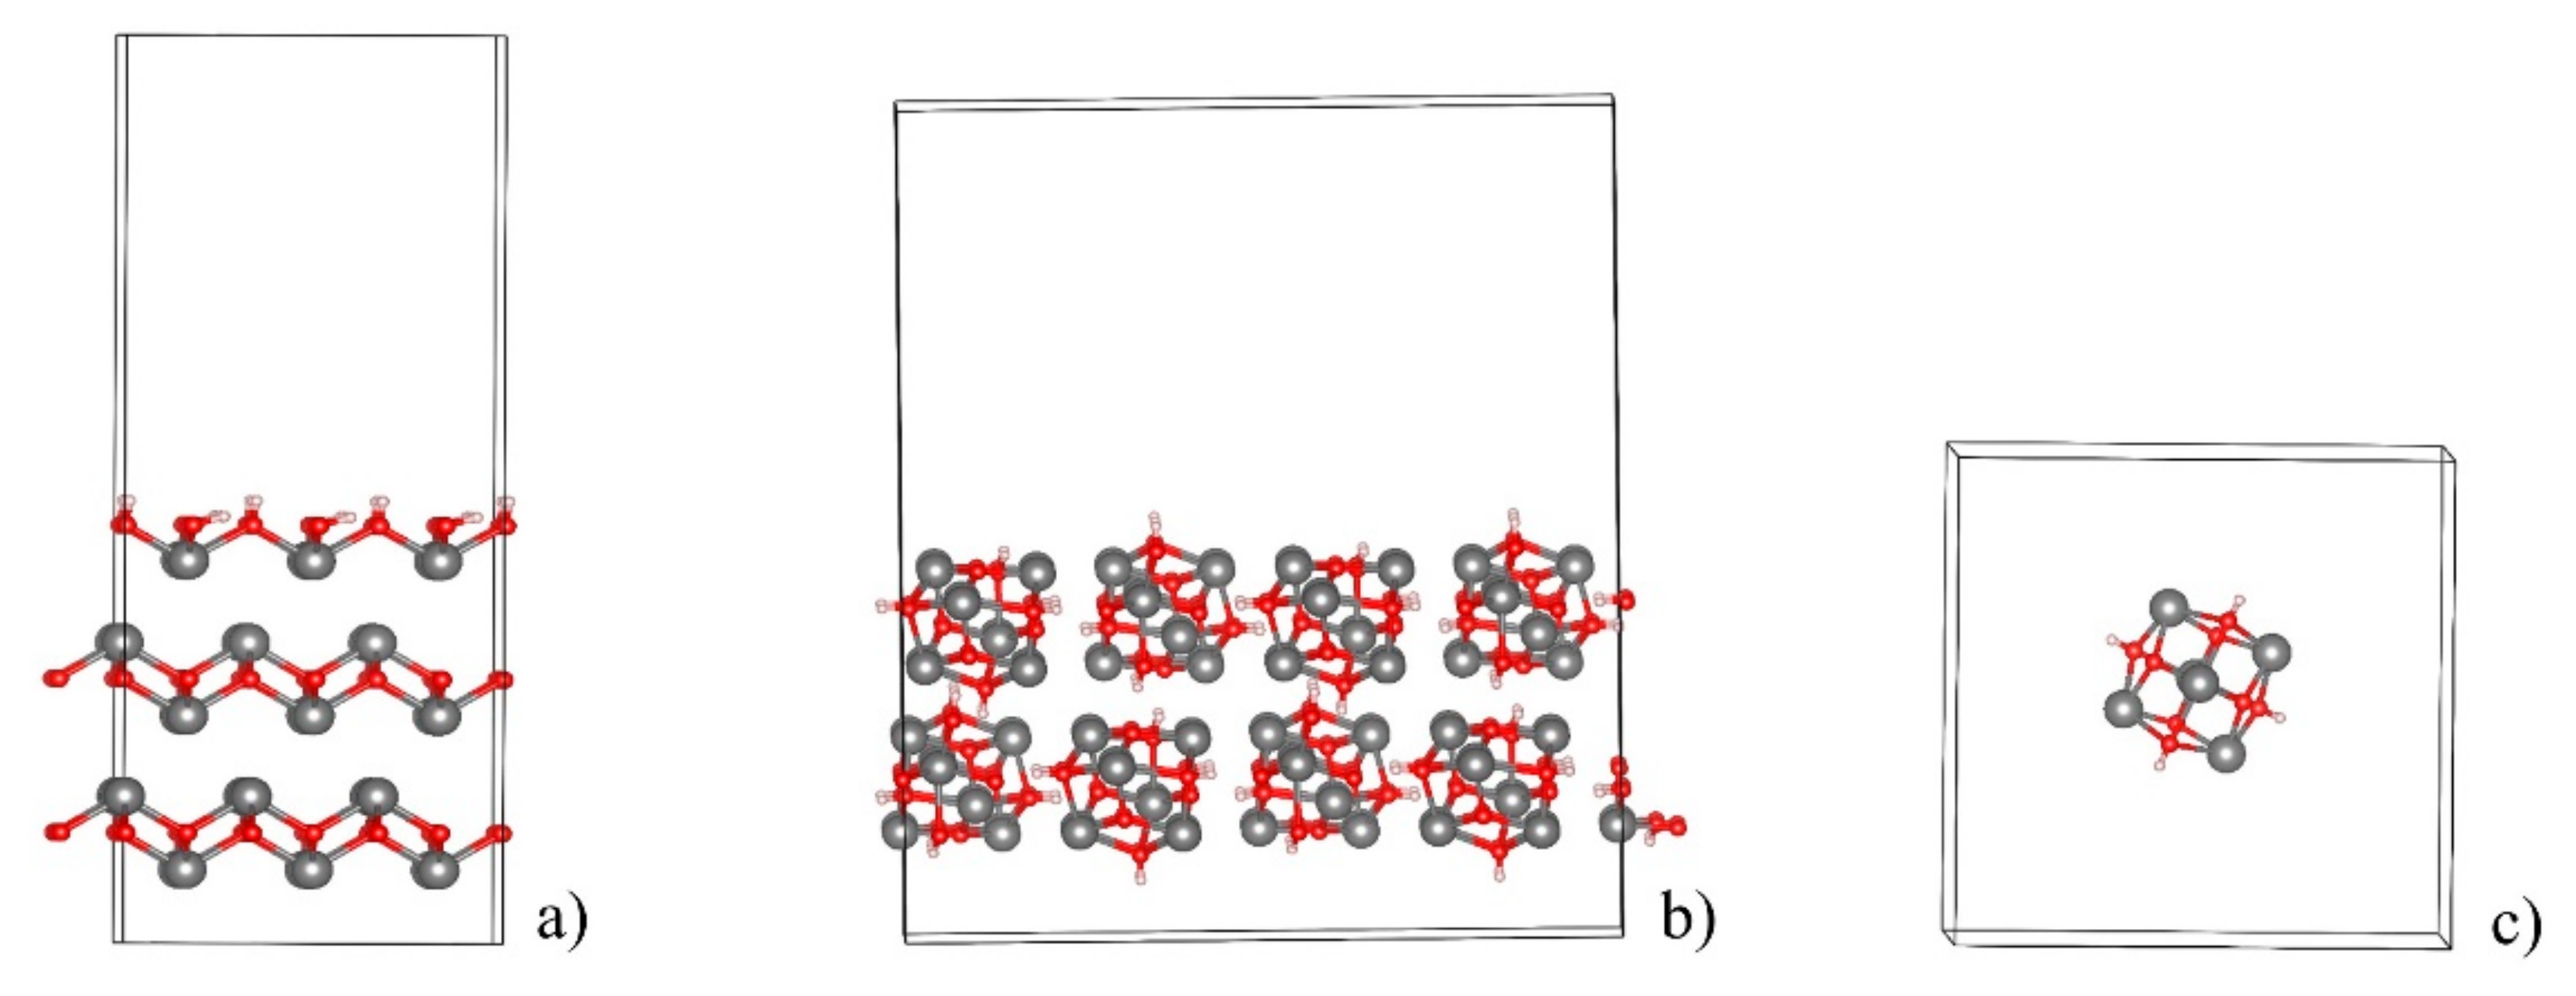
2.3. Surface Energies and Slab Structures

As described previously, we have initiated the SnOx modelling by assessing the surfaces energies (γ) in order to obtain the preferential surface orientations from the thermodynamics viewpoint. In the case of SnO, the surface energy follows the trend (001) (0.353 J/m2) < (011) (0.547 J/m2) ≈ (101) (0.545 J/m2) < (100) (0.585 J/m2) < (112) (0.603 J/m2) with small variation as a function of the number of layers. Therefore, we have continued to model the reactivity on the oxide surface using the lowest energy (001) direction. For Sn6O4(OH)4, we have chosen to use the (011) orientation, which possesses the most closed-packed structure and a low surface energy of 0.175 J/m2.
The periodic boundary conditions impose the need of expanding the surface area of the slab in order to avoid interactions between the adsorbates and their correspondent images, allowing a proper description of the reaction pathways. Therefore, for SnO, we have built up a (2 × 2) expanded slab geometry and the slab thickness has been reduced to two-layers due to computation demand, which actually does not differ significantly from that of the six-layer slab regarding the surface energy. Furthermore, the formation of the hydroxylated structures with high –OH coverage, typical on oxide-water interfaces, has been modelled by modifying the uppermost layer of the slab to construct a stoichiometric Sn(OH)2 surface keeping the Sn(II) valence state, as shown in Figure 3a. In this sense, our model differs significantly from other models recently proposed by Wang et al. [29] and Cui et al. [21] who have considered embedded -OH groups in a SnO slab that was built along the (101) direction and the SnO/Sn(112) surface, respectively.
The surface relaxation leads to a structure covered by -OH units, further called as SnOOH model, whose hydrogen orientation is directed towards the oxygen atoms from other units, possibly forming hydrogen-bond like interactions at the distance of 1.93 Å. No particular changes in the Sn-O bond length or O-Sn-O angle have been observed for the SnO-slab in comparison with its bulk structure. As it shall be displayed, this model allows us to investigate the incorporation of CO2 into Sn-OH chemical bonds to form bicarbonate like structures that have been proposed as active species on the reaction pathways.
In the case of Sn6O4(OH)4, a 2 × 2 expanded (011) slab geometry has been built up with a two-layer thickness. It is important to notice that each layer contains the entire Sn6O4(OH)4 cluster. This system (model II) does not require any additional modification of the chemical composition since the –OH groups are already intrinsically incorporated in the materials structure (see Figure 3b). The relaxed structure displays a Sn-O bond length of about 2.15 Å, reaching 2.48 Å for the oxygen atom in the hydroxyl group and O-Sn-O angle of 97°. Additionally, a model based on the isolated Sn6O4(OH)4 cluster system has been built up by embedding the cluster in a vacuum region of a cubic supercell with lattice constants a = 15.85 Å. The idea here is to analyze the relevance of the crystal environment on this ionic compound. The relaxed structure of such an isolated cluster does not differ much from those of the bulk and the slab geometries, displaying O-H bond length of 0.98 Å and the Sn-O bond distance varying from 2.12 Å to 2.48 Å (Figure 3c).
In Figure 4, we display the partial density of states (DOS) plots that were obtained with Gaussian smearing for the different structures. Similar to bulk SnO, the model I exhibits a valence band top with predominant O2p and Sn5s character with a lower contribution from Sn5p orbitals. This pattern remains unchanged until −1.7 eV, where bands are composed predominantly by O2p and Sn5s orbitals. The bottom of the conduction band (CB) is mainly composed by Sn5p orbitals, but O2p antibonding states are also found to contribute, as well as Sn2s and O2s antibonding states in an even lower extent. For model II (Figure 4b), the valence band top has O2p character with lower contributions of Sn5s and Sn5p states. From −2.7 eV to −5.9 eV, O2p states have a higher contribution when compared to Sn5p states, but smaller contributions from Sn5s and O2s can also be seen. The bottom of the CB is also predominantly formed from Sn5p states, but O2p, O2s and Sn5s antibonding states can also been verified.
In Figure 4c, we show the partial DOS of the cluster model, which displays localized states as a result of the non-crystal environment. Besides that, the band gap is found to be enlarged in comparison to the bulk system due to quantum confinement effects, as described previously in the literature for other semiconductor clusters, such as CdS and CuCl [44]. Additionally, it is easily seen the region close to the valence band (VB) has equal contributions from Sn5s and Sn5p states with a predominant O2p character, as shown previously.

2.4. Insertion of CO2

In the first step, the CO2 molecule is assumed to react with -OH group to form the carbonate species, as it has been suggested by Bocarsly et al [2]. In our SnOx surface models, the -OH groups are naturally exposed along the (011) direction, but artificially added in the case of SnOOH model. Our calculations indicate that the formation of carbonate is an exothermic process with ∆E = −0.75 eV (model I) and ∆E = −0.51 eV/−0.32 eV (model II/cluster model), suggesting that the monodentate oxygen-coordination is thermodynamically favored. In this sense, it is likely that the approximation of carbon dioxide to the Sn-OH bond induces its breaking. In Figure 5a–c, the processes regarding the models studied at this work can be visualized. For simplicity, we will use “reactive site’’ to denominate the specific oxygen atom (from -OH) that is involved in the reaction process. As indicated in Figure 5a, the high coverage of -OH groups in the SnO surface promotes medium range interactions of O···H in Sn-O-H···OCOH (i) and Sn-HO···HOCO (ii) at about 1.68 Å, modifying the angle Sn-O-H from the range 110.0–114.0° to 121.4° as a result of attraction between the surface hydrogen by the oxygen in the carbonate. In these species, two C-O bonds exhibit a single bond character with length of 1.34 Å, whereas C=O is shortened to 1.24 Å. The O-H bond at the molecule has a bond length of 1.02 Å and the Sn-O becomes weaker in the region of adsorption, as the bond length is increased to 2.36 Å and 2.29 Å. At other points on the surface, these values vary from 2.19 Å to 2.26 Å.
At the surface of tin(II) oxyhydroxide (see Figure 5b), the Sn-O bond is found to be slightly weaker when compared to model I, with a bond length that lies in the range of 2.37 Å and 2.45 Å. However, the adsorbed carbonate species also alters such strength, increasing the distance to 2.57 Å and 2.60 Å due to delocalization of the charge density around the molecule. At the tin-carbonate species, the C-O bonds exhibit a bond length that varies from 1.22 Å (C=O) to 1.38 Å (C-O(H) bond). The Sn-O bonds at the isolated cluster (see Figure 5c) varies according to the coordination numbers, with a similar bond length of four-coordinated O atoms as in the model II (2.35–2.48 Å), whereas this value is reduced to around 2.12 Å at the three-coordinated sites. The introduction of carbonate causes some changes in the four-coordinated atom, elongating one of the Sn-O bonds to 2.96 Å, whereas the other bonds are unaltered (2.36 Å–2.46 Å). The O-H and C-O bonds keep the same pattern obtained for the model II. In this sense, the O···H interactions between the carbonate species and the SnO-modified surface (model I, Figure 5a) seems to stabilize the carbonate, resulting in a more thermodynamically favorable process.
In Figure 6a–c, it is shown the assessment of the electronic structure after the carbon dioxide insertion on the different models that are considered in this work. This process of chemical adsorption does not necessarily implicate in major changes in band composition at energies close to the band edges, but at lower energies some variances are verified. In model I, new bands can be seen at −9.7 eV and −11.3 eV. They contain mainly contributions from O2p states, with a minor mixing with Sn5s states, being clearly related to the surface-oxygen bonded to the intermediate species. At −11.28 eV, O2p and O2s states form a band due to non-interaction between the two remaining oxygen atoms at the intermediate species with the crystal. At model II, the band gap is found to be reduced by around 0.5 eV when compared to the initial slab, reaching 1.12 eV. Similar to model I, new bands appear at lower energies as result of the CO2 insertion. For instance, the shoulder visualized at −7.08 eV is composed mainly by 2p-orbitals from the O bonded to the surface, but carbon (not shown) and Sn5s states also contribute in a less extent. At around −10.82 eV, another band regarding contributions from O2p bonding states can be seen along with C states. Such bands come from the remaining oxygen atoms in the carbonate molecule, whose orbitals do not overlap with the ones from other surface atoms. Analogous to model II, the cluster exhibits a band at around −10.30 eV with a O2p character, also containing C states, as result from C-O hybridization in carbonate. However, the small peak found at −7.0 eV in model II is not visualized in the cluster, as well as the band gap is not significantly altered.

2.5. Reduction Reaction

At this stage, we assess the thermodynamics of the electrochemical reduction of the carbonate species. The electrochemical reactions for different studied models are illustrated in Figure 7a–c. As can be observed, the carbonate is hydrogenated through a proton coupled electron transfer mechanism. To model such hydrogenated state, we have explored a few configurations with the hydrogen atom also forming chemical bond with the oxygen or tin atoms (see Figure S3). The lowest energy configuration was found to be the one forming C-H bond and stabilizing the formic acid structure. Actually, it should be point out that as the hydrogen was added to the carbon atom, the geometry optimization has led to the formation of the formic acid without any kinetic barrier. Furthermore, the hydrogenated molecule was only physically bound to the surface through a weak dispersive interaction indicating that it should be released in solution following the first electron reduction. These results indicate that the mechanism proposed by Baruch et al. [2] would need to be slightly modified since the formation of surface bound formate species, through a proton coupled two electron transfer, was not found to be stable in the investigated models.
To further validate the models and compare with our experimental results, we have calculated the reduction potentials of the bound carbonate species through the assessment of the reaction free energies as described in the computational details section. All potentials are referred to RHE by setting to zero the free energy of the following reaction: H+ + e → 1/2H2. Our theoretical results indicate that the first proton-coupled electron transfer takes place at a calculated potential of E = −1.09 and −1.65 V (vs. RHE) for models I and II, respectively, as displayed in Figure 7a,b. For the isolated cluster model, two possible configurations can be formed at different redox potentials, which can be seen in Figure 7c. At the potential E = (−1.51 V vs. RHE), the bidentate oxygen coordination is generated, whereas at the right-hand side, formic acid is produced, maintaining a physical adsorption. In this sense, it has been reported that the formic acid is generated with higher efficiency at an applied potential in the range −1.2 to −1.6 V (vs. RHE) or −1.4 to −1.8V vs. Ag/AgCl (3M NaCl) in the original work [2]. Our experimental data showed that the onset of the cathodic current was ca. −0.80 to −0.90 V (vs. RHE), which suggests that the SnOOH is the active layer in this study. Similarly, the calculated reduction potential of E = −1.65 V (vs. RHE) for model II is coherent with the CV measurements for Sn6O4(OH)4 obtained by Baruch et al. (−1.2 to −1.6 V vs. RHE) [2]. Moreover, the calculated redox potential from the isolated cluster model indicates that the crystal environmental does not display strong effect on the reaction thermodynamics.
Alternative reaction pathways for formic acid production from the carbonate-bonded species can be visualized in Figure S3, with a hydrogenation step that takes place at either the oxygen or tin atom at the SnOOH surface. In a feasible pathway, the oxygen-bridge atom that is connected to the surface (OHOC=O, Figure S3b) is found to undergo the proton-coupled electron transfer at −0.57 V (vs. RHE). Thus, the favorable enthalpy strongly suggests that is a competitive reaction that originates molecular hydrogen and carbon dioxide, with release of both compounds in the medium (here, the vacuum). At this point, it is important to emphasize that the preference for formic acid formation in detriment of the molecular hydrogen and the starting compound is a question that remains open. Additionally, the possibility for hydrogenation of the tin-atom site instead of the C-H site at the carbonate species can be favored at higher potentials (E = −1.55 V vs. RHE). In such case, the Sn-H bond is expected to lead to molecular hydrogen through two possible mechanisms, where the second hydrogenation process can take place either at the Sn-H site or be adsorbed at a Sn site. In the latter case, the adsorbed hydrogen atoms interact to form the molecular gas, as previously described by the Volmer–Tafel mechanism [45].
All the aforementioned theoretical assessments of the reaction thermodynamics corroborate with the mechanisms that involve the initial stabilization of the carbonate species at the electrode–electrolyte interfaces. However, such species may be electrochemically reduced to form the formic acid through a proton coupled one-electron process, which is released in solution leaving a Sn-O unit on the electrode surface. The latter would then be promptly reduced to recover the Sn-OH structure and then closing the catalytic cycle. Depending on the pH condition the formic acid would then be deprotonated stabilizing the formate molecule.

3. Materials and Methods

3.1. Measurements of Carbon Dioxide Electrochemical Reduction

The electrochemical reduction of carbon dioxide was conducted on tin foil electrodes which were 1.0 cm2 in area and had a thickness of 0.2 mm and fabricated via melting procedures of high-purity tin granules (Alfa AesarTM, 99.99%, Ward Hill, MA, USA). The electrodes were submitted to etching in 1.0 mol L−1 nitric acid solution at 90 °C for 10 min, for further removal of eventual surface contaminants and surface oxides. Here, it is worth to mention that the etching procedure using 24 wt.% HBr solutions produced similar results. The electrodes were copiously rinsed with distilled water at room temperature (ca. 25 °C). After the rinse, the tin-based electrodes were exposed to air for 1 day (here referred as “Sn-1”) or for only 10 min (“Sn-2”). Surface characterization was achieved via X-ray photoelectron spectroscopy (XPS) in a ScientaOmicron (ESCA + model, Uppsala, Sweden)by using a high-performance hemispheric analyzer (EAC 2000) with monochromatic Al Kα (hν = 1486.6 eV) anode operated at 12.5 kV. A pass energy of 50 eV with a 0.05 eV per step was used to record the high-resolution spectra.
All electrochemical measurements were conducted using a potentiostat/galvanostat (Autolab PGSTAT 30N, 128N or 204N, Metrohm-Eco Chemie) which is controlled by the NOVA 2.1.4® software. A glassy carbon plate and a leak-free Ag/AgCl/Cl(sat. KCl) were used as counter and reference electrode, respectively. However, all experimental potentials will be referred to the reversible hydrogen electrode (RHE) scale in order to eliminate the pH effect. The experiments were performed in a homemade gastight H-shaped electrolysis cell, in Ar- or in CO2-saturated in 0.1 mol L−1 Na2SO4 electrolyte. The compartments were separated by a Nafion 115 (Dupont) membrane, but a glass frit has returned very similar results. Measurements of linear sweep voltammetry (LSV) were used for electrochemical characterization in Ar- and CO2-saturated electrolytes, before the electrochemical reduction of CO2. At least two linear sweeps were carried out from open circuit voltage (OCP; ca. −0.3 V) to −1.6 V vs. RHE, at a scan rate of 10 mV s−1. The first and the last scans were saved as the electrochemical profile for comparison purposes. The experiments of CO2 electrochemical reduction were carried out under potentiostatic conditions, in CO2-saturated electrolyte and with continuous bubbling of CO2 in the cathodic compartment. The total charge of 18.7 mC has been controlled for each potential and electrode during the electrolysis. Stability tests of 4 h were conducted for the Sn-1 electrode at −1.25 V vs. RHE, and the faradaic efficiencies were determined for each elapsed hour.
The formation of HCOO species was quantified by high-performance liquid chromatography (HPLC). For these measurements, it was used a Prominence Ultra-fast Liquid Chromatograph® (Shimadzu corp., Kyoto, Japan), equipped with UV-Vis SPD-20A and RID-10A detectors, and an Aminex HPX-87H® analytical column (300 mm × 7.8 mm ID, Bio-Rad Laboratories Inc., Hercules, CA, USA). The chromatographic separation was conducted using an isocratic elution of 3.33 mmol L-1 H2SO4 at a flow rate of 0.6 mL min−1, with an injection loop of 20 µL. The detector was set to measure the absorbance at 210 nm.

3.2. Computational Methods

All calculations were performed within the density functional theory (DFT) framework as implemented in the Vienna Ab-Initio Simulation Package (VASP) [46]. The Kohn–Sham equations were solved in a project augment wave (PAW) scheme, with the Perdew–Burke–Ernzerhof functional (PBE) [47]. Furthermore, the D3-Grimme [48] correction was applied to describe van der Waals interactions. As a first step, the lattice parameters and ionic positions of tin (II) oxide (SnO) and tin (II) oxyhydroxide (Sn6O4(OH)4) were fully optimized starting from the available crystallographic data [37,38,39,41]. The cutoff energy of 700 eV was used for the plane-waves basis set for both compounds, whereas 7 × 7 × 7 and 8 × 8 × 6 Monkhorst−Pack k-point meshes were used for SnO and Sn6O4(OH)4, respectively. These values were defined according to the convergence tests.
In order to model the interface reactivity, we have built slabs with a variant number of layers and crystal orientations from the optimized bulk structures. By computing the slab electronic total energy (Eslab), we have obtained the surface energy, defined as the excess of free energy per unit area of a crystal facet [49], i.e., the cost in energy to form a surface from the bulk structure that could be written as follows:
γ = E s l a b t × E b u l k 2 A ,
where t and A stand for the number of layers and surface area, respectively. Here, a range of 3–11 layers was used to determine the surface energies of (001) and (100) facets of SnO (model I), whereas 2–6 layers and the (011) facet were the choice for Sn6O4(OH)4 (model II). In both cases, a vacuum region of 12 Å was used. According to convergence tests, 5 × 5 × 1 and 6 × 6 × 1 k-point grids were employed for SnO and Sn6O4(OH)4, respectively. The respective cutoff energies were 500 eV and 700 eV. In this initial step, the surface area was chosen to be small, which reduces the computational time associated with the numerous tests varying the size of the supercell. However, due to the periodic boundary conditions, it is further necessary to expand the surface area in order to avoid interactions between the adsorbates and their respective images when we are investigating surface reactivity. In this work, the surface area was enlarged in 2 × 2, while the k-point grid and cutoff energy were reduced to 2 × 2 × 1 and 400 eV, respectively.
The solvation effects at the electrode/solvent interface were investigated through the Born–Haber thermodynamic cycle (Scheme 1), a popular method in molecular theoretical chemistry that can also be used in our study. In Scheme 1, the property of interest is ∆rGsolid-liquid, a quantity defined as the Gibbs free energy of reaction at the solid/liquid interface, which in this formalism is not obtained directly but through a vector sum involving the free energies of reaction ∆rGsolid-vacuum at the solid-vacuum interface and solvation energies in aqueous medium, ∆solvG, such as:
ΔrGsolid-liquid = ΔrGsolid-vacuum − ΔsolvG (Ox) + ΔsolvG (Red),
where
ΔrGsolid-vacuum = [G (Red) − G (Ox)]solid-vacuum,
and Ox and Red stand for oxidized and reduced species, respectively.
Our solid-state calculations provide ∆rGsolid-vacuum, while the solvation energies were obtained in aqueous medium through the implicit solvent model available on VASP-SOL code [50]. After obtaining ∆rGsolid-liquid, the redox potential E was determined through the relation
E = −ΔrGsolid-liquid/n,
In (4), n is the number of electrons involved in the reaction. In a zero-Kelvin calculation, the Gibbs free energy is composed solely by the enthalpic term, which is a sum of the internal energy (Eelect and the zero-point correction) and a pressure-volume term. Here, we consider uniquely the electronic energy, which has the main contribution to the internal energy. However, we do not expect the vibrational contributions or the temperature effects to influence the obtained trend [51]. In order to establish the reference electrode (RHE), we have also calculated the total energy of a hydrogen molecule embedded in a vacuum region of a cubic supercell with lattice constant a = 20.0 Å.
The electronic structure has been assessed by calculating the density of states (DOS) and its projected components (pDOS) on Sn, O, C and H atoms. For the bulk electronic structure, it has been used the tetrahedron method with Blöchl corrections, whereas larger systems required the Gaussian smearing with a width broadening of 0.2 eV.

4. Conclusions

In this work, we have employed experimental and theoretical methodologies with the aim of advancing the understanding on the underlying mechanisms of the carbon dioxide reduction to formate catalyzed by Sn-based electrodes. In the experimental approach, we have considered two sets of Sn electrode preparation, involving different exposures times to air after acid etching, producing electrodes with different initial extent of oxidation. The onset potentials of carbon dioxide electrochemical reduction to formic acid on the two different tin foil electrodes were at ca. −0.8 to −0.9 V vs. RHE, with similar maximum faradaic efficiencies, of 90–92%, at a potential of ca. −1.25 V vs. RHE. Thus, under in-situ conditions, even having different initial extent of oxidation, the electrode surfaces converge to very similar structures, with partially reduced or metastable Sn oxides that serve as active sites for the CO2 reduction. Additionally, the high faradaic efficiencies of the Sn electrodes brought by the etching/air exposition procedure was attributed to the formation of an optimized Sn oxide layer thickness, allowing the presence of Sn oxides that are important for the CO2 “activation”, with good electric conductivity, favoring the electron transfer during the CO2 reduction reaction.
In order to assess the reaction thermodynamics and the electronic structure in the reaction process, we have employed a DFT-based approach. Firstly, we have built two models based on tin (II) oxide (SnO) and tin (II) oxyhydroxide (Sn6O4(OH)4) bulk structures, also evaluating the crystal environment on the latter model. In the catalytic process, the tin-carbonate species is formed as a result of the reaction of carbon dioxide with the -OH group at the catalytic surface, with an electronic structure that exhibit new bands at lower energy region resulting from C-O hybridization in the carbonate species. Our calculations show that the formation of the tin-carbonate species is thermodynamically favored by ∆E = −0.32 to −0.75 eV (isolated cluster/model I) for the monodentate oxygen-coordinated intermediate. The first proton-coupled electron transfer is found to occur at a calculated potential of −1.65 V/−1.09 V (vs. RHE) for the layered-tin (II) oxyhydroxide/SnOOH system. Thus, we suggest that the active surface layer in our experimental approach is tin-oxide based system with hydroxylated surface, which is well represented by the SnOOH model. On the other hand, the (Sn6O4(OH)4) model is consistent with the experimental studies previously published in the literature, with a minor potential increase of 10 mV in absence of the crystal environment (cluster model).
Therefore, our findings support the mechanisms involving the CO2 adsorption via oxygen favored by its chemical reaction with terminal OH species, producing carbonate species: The carbonate is electrochemically reduced to form the formic acid through a proton coupled one-electron process, which is subsequently released in solution leaving a Sn-O unit on the electrode surface. The latter would then be promptly reduced to recover the Sn-OH structure and then closing the catalytic cycle. Depending on the pH condition the formic acid would then be deprotonated stabilizing the formate ions.

Supplementary Materials

The following are available online at https://www.mdpi.com/2073-4344/9/8/636/s1, Figure S1: Sn 3d XPS spectra of Sn-1 (a) and Sn-2 (b) electrodes. Figure S2: Faradaic current and faradaic current efficiencies for formate production at −1.3 V vs. RHE, obtained during the stability text for the Sn-1 electrode. Figure S3: Alternative pathways for the first hydrogenation process on the O-site (a,b) and Sn-site (c), with no formic acid as the resulting product.

Author Contributions

Experimental measurements: R.S., J.M.P., M.R.C. and F.H.B.L.; theoretical modelling: G.B.D., C.R.M. and C.M.A.; writing-draft G.B.D., F.H.B.L. and C.M.A.; writing-review and editing, G.B.D., F.H.B.L., C.R.M. and C.M.A.

Funding

This project has received financial support from the Swedish Research Council (VR), the STandUP for Energy collaboration (Sweden), CAPES (Coordenação de Aperfeiçoamento de Pessoal de Nível Superior) foundation for the financial support in her phD studies, FAPESP (Fundação de Amparo à Pesquisa do Estado de São Paulo -- F.H.B.L. grant No. 2016/13323-0 and 2013/16930-7, C.R.M. grant No. 2017/02317-2 and M.R.C. grant No. 2014/26699-3), CNPq (Conselho Nacional de Desenvolvimento Científico e Tecnológico -- F.H.B.L. grant No. 306469/2016-2 and C.R.M grant No. 308333/2015-2).

Acknowledgments

We would like to thank the Swedish National Infrastructure for Computing (SNIC) at the PDC Center for High Performance Computing and at National Supercomputer Centre at Linköping University (NSC) for providing the computational resources for the development of this work. The authors also acknowledge Prof. Renato V. Gonçalves from IFSC (Instituto de Física de São Carlos)-USP for the support with XPS measurements and data analysis (FAPESP Grant No. 2013/07296-2, Brazil).

Conflicts of Interest

The authors declare no conflicts of interest.

References

  1. WMO. WMO Greenhouse Gas Bulletin|World Meteorological Organization. WMO Bull. 2016, 2015, 1–4. [Google Scholar]
  2. Baruch, M.F.; Pander, J.E.; White, J.L.; Bocarsly, A.B. Mechanistic Insights into the Reduction of CO2 on Tin Electrodes using in Situ ATR-IR Spectroscopy. ACS Catal. 2015, 5, 3148–3156. [Google Scholar] [CrossRef]
  3. Hu, J.; Liu, H. Advances in CO2 Conversion and Utilization; American Chemical Society: Houghton, MI, USA, 2010; Volume 1056, ISBN 0-8412-2596-6. [Google Scholar]
  4. Wang, Q.; Dong, H.; Yu, H. Development of rolling tin gas diffusion electrode for carbon dioxide electrochemical reduction to produce formate in aqueous electrolyte. J. Power Sources 2014, 271, 278–284. [Google Scholar] [CrossRef]
  5. Cui, C.; Wang, H.; Zhu, X.; Han, J.; Ge, Q. A DFT study of CO2 electrochemical reduction on Pb(211) and Sn(112). Sci. China Chem. 2015, 58, 607–613. [Google Scholar] [CrossRef]
  6. Leitner, W. The coordination chemistry of carbon dioxide and its relevance for catalysis: A critical survey. Coord. Chem. Rev. 1996, 153, 257–284. [Google Scholar] [CrossRef]
  7. Pérez, E.R.; Santos, R.H.A.; Gambardella, M.T.P.; De Macedo, L.G.M.; Rodrigues-Filho, U.P.; Launay, J.C.; Franco, D.W. Activation of carbon dioxide by bicyclic amidines. J. Org. Chem. 2004, 69, 8005–8011. [Google Scholar] [CrossRef] [PubMed]
  8. Prakash, G.K.S.; Viva, F.A.; Olah, G.A. Electrochemical reduction of CO2 over Sn-Nafion® coated electrode for a fuel-cell-like device. J. Power Sources 2013, 223, 68–73. [Google Scholar] [CrossRef]
  9. Hull, J.F.; Himeda, Y.; Wang, W.-H.; Hashiguchi, B.; Periana, R.; Szalda, D.J.; Muckerman, J.T.; Fujita, E. Reversible hydrogen storage using CO2 and a proton-switchable iridium catalyst in aqueous media under mild temperatures and pressures. Nat. Chem. 2012, 4, 383–388. [Google Scholar] [CrossRef] [PubMed]
  10. Yin, G.; Abe, H.; Kodiyath, R.; Ueda, S.; Srinivasan, N.; Yamaguchi, A.; Miyauchi, M. Selective electro- or photo-reduction of carbon dioxide to formic acid using a Cu–Zn alloy catalyst. J. Mater. Chem. A 2017, 5, 12113–12119. [Google Scholar] [CrossRef]
  11. Jiménez, C.; García, J.; Camarillo, R.; Martínez, F.; Rincón, J. Electrochemical CO2 Reduction to Fuels Using Pt/CNT Catalysts Synthesized in Supercritical Medium. Energy Fuels 2017, 31, 3038–3046. [Google Scholar] [CrossRef]
  12. Bei, J.; Zhang, R.; Chen, Z.; Lv, W.; Wang, W. Efficient reduction of CO2 to formate using in situ prepared nano-sized Bi electrocatalyst. Int. J. Electrochem. Sci. 2017, 12, 2365–2375. [Google Scholar] [CrossRef]
  13. White, J.L.; Bocarsly, A.B. Enhanced Carbon Dioxide Reduction Activity on Indium-Based Nanoparticles. J. Electrochem. Soc. 2016, 163, H410–H416. [Google Scholar] [CrossRef]
  14. Zhang, S.; Kang, P.; Meyer, T.J. Nanostructured tin catalysts for selective electrochemical reduction of carbon dioxide to formate. J. Am. Chem. Soc. 2014, 136, 1734–1737. [Google Scholar] [CrossRef] [PubMed]
  15. Del Castillo, A.; Alvarez-Guerra, M.; Solla-Gullón, J.; Sáez, A.; Montiel, V.; Irabien, A. Sn nanoparticles on gas diffusion electrodes: Synthesis, characterization and use for continuous CO2 electroreduction to formate. J. CO2 Util. 2017, 18, 222–228. [Google Scholar] [CrossRef]
  16. Chen, Y.; Kanan, M.W. Tin oxide dependence of the CO2 reduction efficiency on tin electrodes and enhanced activity for tin/tin oxide thin-film catalysts. J. Am. Chem. Soc. 2012, 134, 1986–1989. [Google Scholar] [CrossRef] [PubMed]
  17. Sahara, G.; Ishitani, O. Efficient Photocatalysts for CO2 Reduction. Inorg. Chem. 2015, 54, 5096–5104. [Google Scholar] [CrossRef] [PubMed]
  18. Barton Cole, E.; Lakkaraju, P.S.; Rampulla, D.M.; Morris, A.J.; Abelev, E.; Bocarsly, A.B. Using a one-electron shuttle for the multielectron reduction of CO2 to methanol: Kinetic, mechanistic, and structural insights. J. Am. Chem. Soc. 2010, 132, 11539–11551. [Google Scholar] [CrossRef] [PubMed]
  19. Gattrell, M.; Gupta, N.; Co, A. A review of the aqueous electrochemical reduction of CO2 to hydrocarbons at copper. J. Electroanal. Chem. 2006, 594, 1–19. [Google Scholar] [CrossRef]
  20. Feaster, J.T.; Shi, C.; Cave, E.R.; Hatsukade, T.; Abram, D.N.; Kuhl, K.P.; Hahn, C.; Nørskov, J.K.; Jaramillo, T.F. Understanding Selectivity for the Electrochemical Reduction of Carbon Dioxide to Formic Acid and Carbon Monoxide on Metal Electrodes. ACS Catal. 2017, 7, 4822–4827. [Google Scholar] [CrossRef]
  21. Cui, C.; Han, J.; Zhu, X.; Liu, X.; Wang, H.; Mei, D.; Ge, Q. Promotional effect of surface hydroxyls on electrochemical reduction of CO2 over SnOx/Sn electrode. J. Catal. 2016, 343, 257–265. [Google Scholar] [CrossRef]
  22. Hoflund, G.B.; Corallo, G.R. Electron-energy-loss study of the oxidation of polycrystalline tin. Phys. Rev. B 1992, 46, 7110–7120. [Google Scholar] [CrossRef] [PubMed]
  23. Cho, S.; Yu, J.; Kang, S.K.; Shih, D.Y. Oxidation study of pure tin and its alloys via electrochemical reduction analysis. J. Electron. Mater. 2005, 34, 635–642. [Google Scholar] [CrossRef]
  24. Dutta, A.; Kuzume, A.; Rahaman, M.; Vesztergom, S.; Broekmann, P. Monitoring the Chemical State of Catalysts for CO2 Electroreduction: An In Operando Study. ACS Catal. 2015, 5, 7498–7502. [Google Scholar] [CrossRef]
  25. Dutta, A.; Kuzume, A.; Kaliginedi, V.; Rahaman, M.; Sinev, I.; Ahmadi, M.; Roldán Cuenya, B.; Vesztergom, S.; Broekmann, P. Probing the chemical state of tin oxide NP catalysts during CO2 electroreduction: A complementary operando approach. Nano Energy 2018, 53, 828–840. [Google Scholar] [CrossRef]
  26. Lee, C.H.; Kanan, M.W. Controlling H+ vs CO2 Reduction Selectivity on Pb Electrodes. ACS Catal. 2015, 5, 465–469. [Google Scholar] [CrossRef]
  27. Luc, W.; Collins, C.; Wang, S.; Xin, H.; He, K.; Kang, Y.; Jiao, F. Ag-sn bimetallic catalyst with a core-shell structure for CO2 reduction. J. Am. Chem. Soc. 2017, 139, 1885–1893. [Google Scholar] [CrossRef] [PubMed]
  28. Zhang, Y.; Chen, L.; Li, F.; Easton, C.D.; Li, J.; Bond, A.M.; Zhang, J. Direct Detection of Electron Transfer Reactions Underpinning the Tin-Catalyzed Electrochemical Reduction of CO2 using Fourier-Transformed ac Voltammetry. ACS Catal. 2017, 7, 4846–4853. [Google Scholar] [CrossRef]
  29. Wang, S.; Wang, J.; Xin, H. Insights into electrochemical CO2 reduction on tin oxides from first-principles calculations. Green Energy Environ. 2017, 2, 168–171. [Google Scholar] [CrossRef]
  30. Lee, C.W.; Cho, N.H.; Yang, K.D.; Nam, K.T. Reaction Mechanisms of the Electrochemical Conversion of Carbon Dioxide to Formic Acid on Tin Oxide Electrodes. ChemElectroChem 2017, 4, 2130–2136. [Google Scholar] [CrossRef]
  31. Pourbaix, M. Atlas of Electrochemical Equilibria in Aqueous Solutions Version 2; National Association of Corrosion Engineers: Houston, TX, USA, 2016; Volume 52, ISBN 0915567989. [Google Scholar]
  32. Hori, Y.; Wakebe, H.; Tsukamoto, T.; Koga, O. Electrocatalytic process of CO selectivity in electrochemical reduction of CO2. Electrochim. Acta 1994, 39, 1833–1839. [Google Scholar] [CrossRef]
  33. Gu, J.; Héroguel, F.; Luterbacher, J.; Hu, X. Densely Packed, Ultra Small SnO Nanoparticles for Enhanced Activity and Selectivity in Electrochemical CO2 Reduction. Angew. Chem. Int. Ed. 2018, 57, 2943–2947. [Google Scholar] [CrossRef] [PubMed]
  34. Wu, J.; Risalvato, F.G.; Ke, F.-S.; Pellechia, P.J.; Zhou, X.-D. Electrochemical Reduction of Carbon Dioxide I. Effects of the Electrolyte on the Selectivity and Activity with Sn Electrode. J. Electrochem. Soc. 2012, 159, F353–F359. [Google Scholar] [CrossRef]
  35. Zhang, R.; Lv, W.; Lei, L. Role of the oxide layer on Sn electrode in electrochemical reduction of CO2 to formate. Appl. Surf. Sci. 2015, 356, 24–29. [Google Scholar] [CrossRef]
  36. Won, D.H.; Choi, C.H.; Chung, J.; Chung, M.W.; Kim, E.H.; Woo, S.I. Rational Design of a Hierarchical Tin Dendrite Electrode for Efficient Electrochemical Reduction of CO2. ChemSusChem 2015, 8, 3092–3098. [Google Scholar] [CrossRef] [PubMed]
  37. Wu, J.; Risalvato, F.G.; Ma, S.; Zhou, X.D. Electrochemical reduction of carbon dioxide III. the role of oxide layer thickness on the performance of Sn electrode in a full electrochemical cell. J. Mater. Chem. A 2014, 2, 1647–1651. [Google Scholar] [CrossRef]
  38. Wang, Y.-F.; Li, J.-W.; Hou, Y.-F.; Yu, X.-Y.; Su, C.-Y.; Kuang, D.-B. Hierarchical tin oxide octahedra for highly efficient dye-sensitized solar cells. Chemistry 2010, 16, 8620–8625. [Google Scholar] [CrossRef] [PubMed]
  39. Walsh, A.; Watson, G.W. Electronic structures of rocksalt, litharge, and herzenbergite SnO by density functional theory. Phys. Rev. B Condens. Matter Mater. Phys. 2004, 70, 235114. [Google Scholar] [CrossRef] [Green Version]
  40. Tao, J.; Guan, L. Tailoring the electronic and magnetic properties of monolayer SnO by B, C, N, O and F adatoms. Sci. Rep. 2017, 7, 44568. [Google Scholar] [CrossRef] [PubMed]
  41. Zhang, J.; Han, Y.; Liu, C.; Ren, W.; Li, Y.; Wang, Q.; Su, N.; Li, Y.; Ma, B.; Ma, Y.; et al. Electrical Transport Properties of SnO under High Pressure. J. Phys. Chem. C 2011, 115, 20710–20715. [Google Scholar] [CrossRef]
  42. Abrahams, I.; Grimes, S.M.; Johnston, S.R.; Knowles, J.C. Tin(II) oxyhydroxide by X-ray powder diffraction. Acta Crystallogr. Sect. C Cryst. Struct. Commun. 1996, 52, 286–288. [Google Scholar] [CrossRef]
  43. Watson, G.W. Origin of the electron distribution in SnO. J. Chem. Phys. 2001, 114, 758–763. [Google Scholar] [CrossRef]
  44. Krishna, M.V.R.; Friesner, R.A. Quantum confinement effects in semiconductor clusters. J. Chem. Phys. 1991, 95, 8309–8322. [Google Scholar] [CrossRef]
  45. Azizi, O.; Jafarian, M.; Gobal, F.; Heli, H.; Mahjani, M.G. The investigation of the kinetics and mechanism of hydrogen evolution reaction on tin. Int. J. Hydrog. Energy 2007, 32, 1755–1761. [Google Scholar] [CrossRef]
  46. Kresse, G.; Furthmüller, J. Efficient iterative schemes for ab initio total-energy calculations using a plane-wave basis set. Phys. Rev. B Condens. Matter Mater. Phys. 1996, 54, 11169–11186. [Google Scholar] [CrossRef] [PubMed]
  47. Perdew, J.P.; Ernzerhof, M.; Burke, K. Generalized gradient approximation made simple. Phys. Rev. Lett. 1996, 77, 3865–3868. [Google Scholar] [CrossRef] [PubMed]
  48. Grimme, S.; Antony, J.; Ehrlich, S.; Krieg, H. A consistent and accurate ab initio parametrization of density functional dispersion correction (DFT-D) for the 94 elements H-Pu. J. Chem. Phys. 2010, 132, 154104. [Google Scholar] [CrossRef] [PubMed]
  49. Vitos, L.; Ruban, A.V.; Skriver, H.L.; Kollár, J. The surface energy of metals. Surf. Sci. 1998, 411, 186–202. [Google Scholar] [CrossRef]
  50. Mathew, K.; Sundararaman, R.; Letchworth-Weaver, K.; Arias, T.A.; Hennig, R.G. Implicit solvation model for density-functional study of nanocrystal surfaces and reaction pathways. J. Chem. Phys. 2014, 140, 084106. [Google Scholar] [CrossRef] [Green Version]
  51. Deiss, E. Average Voltage, Energy Density, and Specific Energy of Lithium-Ion Batteries. J. Electrochem. Soc. 1997, 144, 3877–3881. [Google Scholar] [CrossRef]
Figure 1. Linear scan voltammetric current responses that were obtained in Ar and in CO2-saturated 0.1 mol L−1 Na2SO4 electrolytes for Sn-based electrodes at different experimental conditions after acid etching. In (a) the Sn-1 electrode was exposed to air for one day. The blue and dark-blue curves represent the first and second linear scan, respectively. The violet circles represent the total amount of formate and the red squares the faradaic efficiencies. In (b) the Sn-2 electrode was exposed to air for only 10 min. The violet and orange curves represent the first and second linear scan, respectively. The green triangles represent the total amount of formate and the red squares the faradaic efficiencies.
Catalysts 09 00636 g001
Figure 2. SnO (a) and tin oxyhydroxide (Sn6O4(OH)4) (b) bulk structures obtained from optimization at PBE level. Red, silver and white colors represent O, Sn and H, respectively.
Catalysts 09 00636 g002
Figure 3. Slab structure for models I (a) and II (b,c). In (c) the cluster from model II is disposed in the centrum of an empty box, simulating a non-crystal environment. In the model I (a), there is a relation of two hydroxyl groups for each Sn surface atom. Red, silver and white colors represent O, Sn and H, respectively.
Catalysts 09 00636 g003
Figure 4. Total and partial density of states (DOS) of models I (a), II (b) and the cluster in a non-periodic environment (c). The Fermi energy is set to zero.
Catalysts 09 00636 g004
Figure 5. Schematic representation of carbon dioxide insertion at -OH site in the electrocatalyst surface of model I (a), model II (b) and cluster unit (c). ∆E stands for variation in the electronic energy, which takes into account the solvation energies (the value in parentheses does not include solvation effects). The sphere colors represent Sn (silver); O (red); C (brown) and H (white).
Catalysts 09 00636 g005
Figure 6. Total and partial DOS plots at chemically adsorbed CO2-surface system, where the surface is determined by model I (a), model II (b) and isolated cluster (c). The fermi energy is set to zero.
Catalysts 09 00636 g006
Figure 7. Schematic representation of the proton-electron coupled transfer in the electrocatalyst surface of modified-SnO (model I, (a)), Sn6O4(OH)4 (model II, (b); isolated cluster, (c)). E stands for redox potential vs. reversible hydrogen electrode (RHE).
Catalysts 09 00636 g007
Scheme 1. Thermodynamic cycle used for calculation of ΔrG(solv).
Catalysts 09 00636 sch001

