Numerical Evaluation of Potential Catalyst Savings for Ventilation Air Methane Catalytic Combustion in Helical Coil Reactors with Selective Wall Coating

 ,
, 


Abstract
:1. Introduction
2. Mathematical Model
2.1. Governing Equations
2.2. Methane Catalytic Oxidation Reaction
2.3. Constitutive Relations
2.4. Boundary Condition
- Inlet: premix reactant is supplied to the reactor. The velocity, temperature, and species mass fraction are set,Inlet velocity for the mixture is summarized in Table 1.
- Reaction walls: The reaction takes place on the wall and is resolved by Equation (9). To activate the wall surface reaction, the reaction mechanism is incorporated to the species boundary condition. No-slip condition are applied. The wall temperature is not known a priori and needs to be iterated for from the heat source due to the reaction. Note that the initial temperature is very important in the steady state model to trigger the reaction.
- Non-reaction walls: Similar to boundary conditions for the reaction wall but the reaction on these walls is turned off.
- Outlet: The pressure and stream-wise gradient of the temperature and species mass fraction is set to zero.
2.5. Streamlines and Masslines Visualization
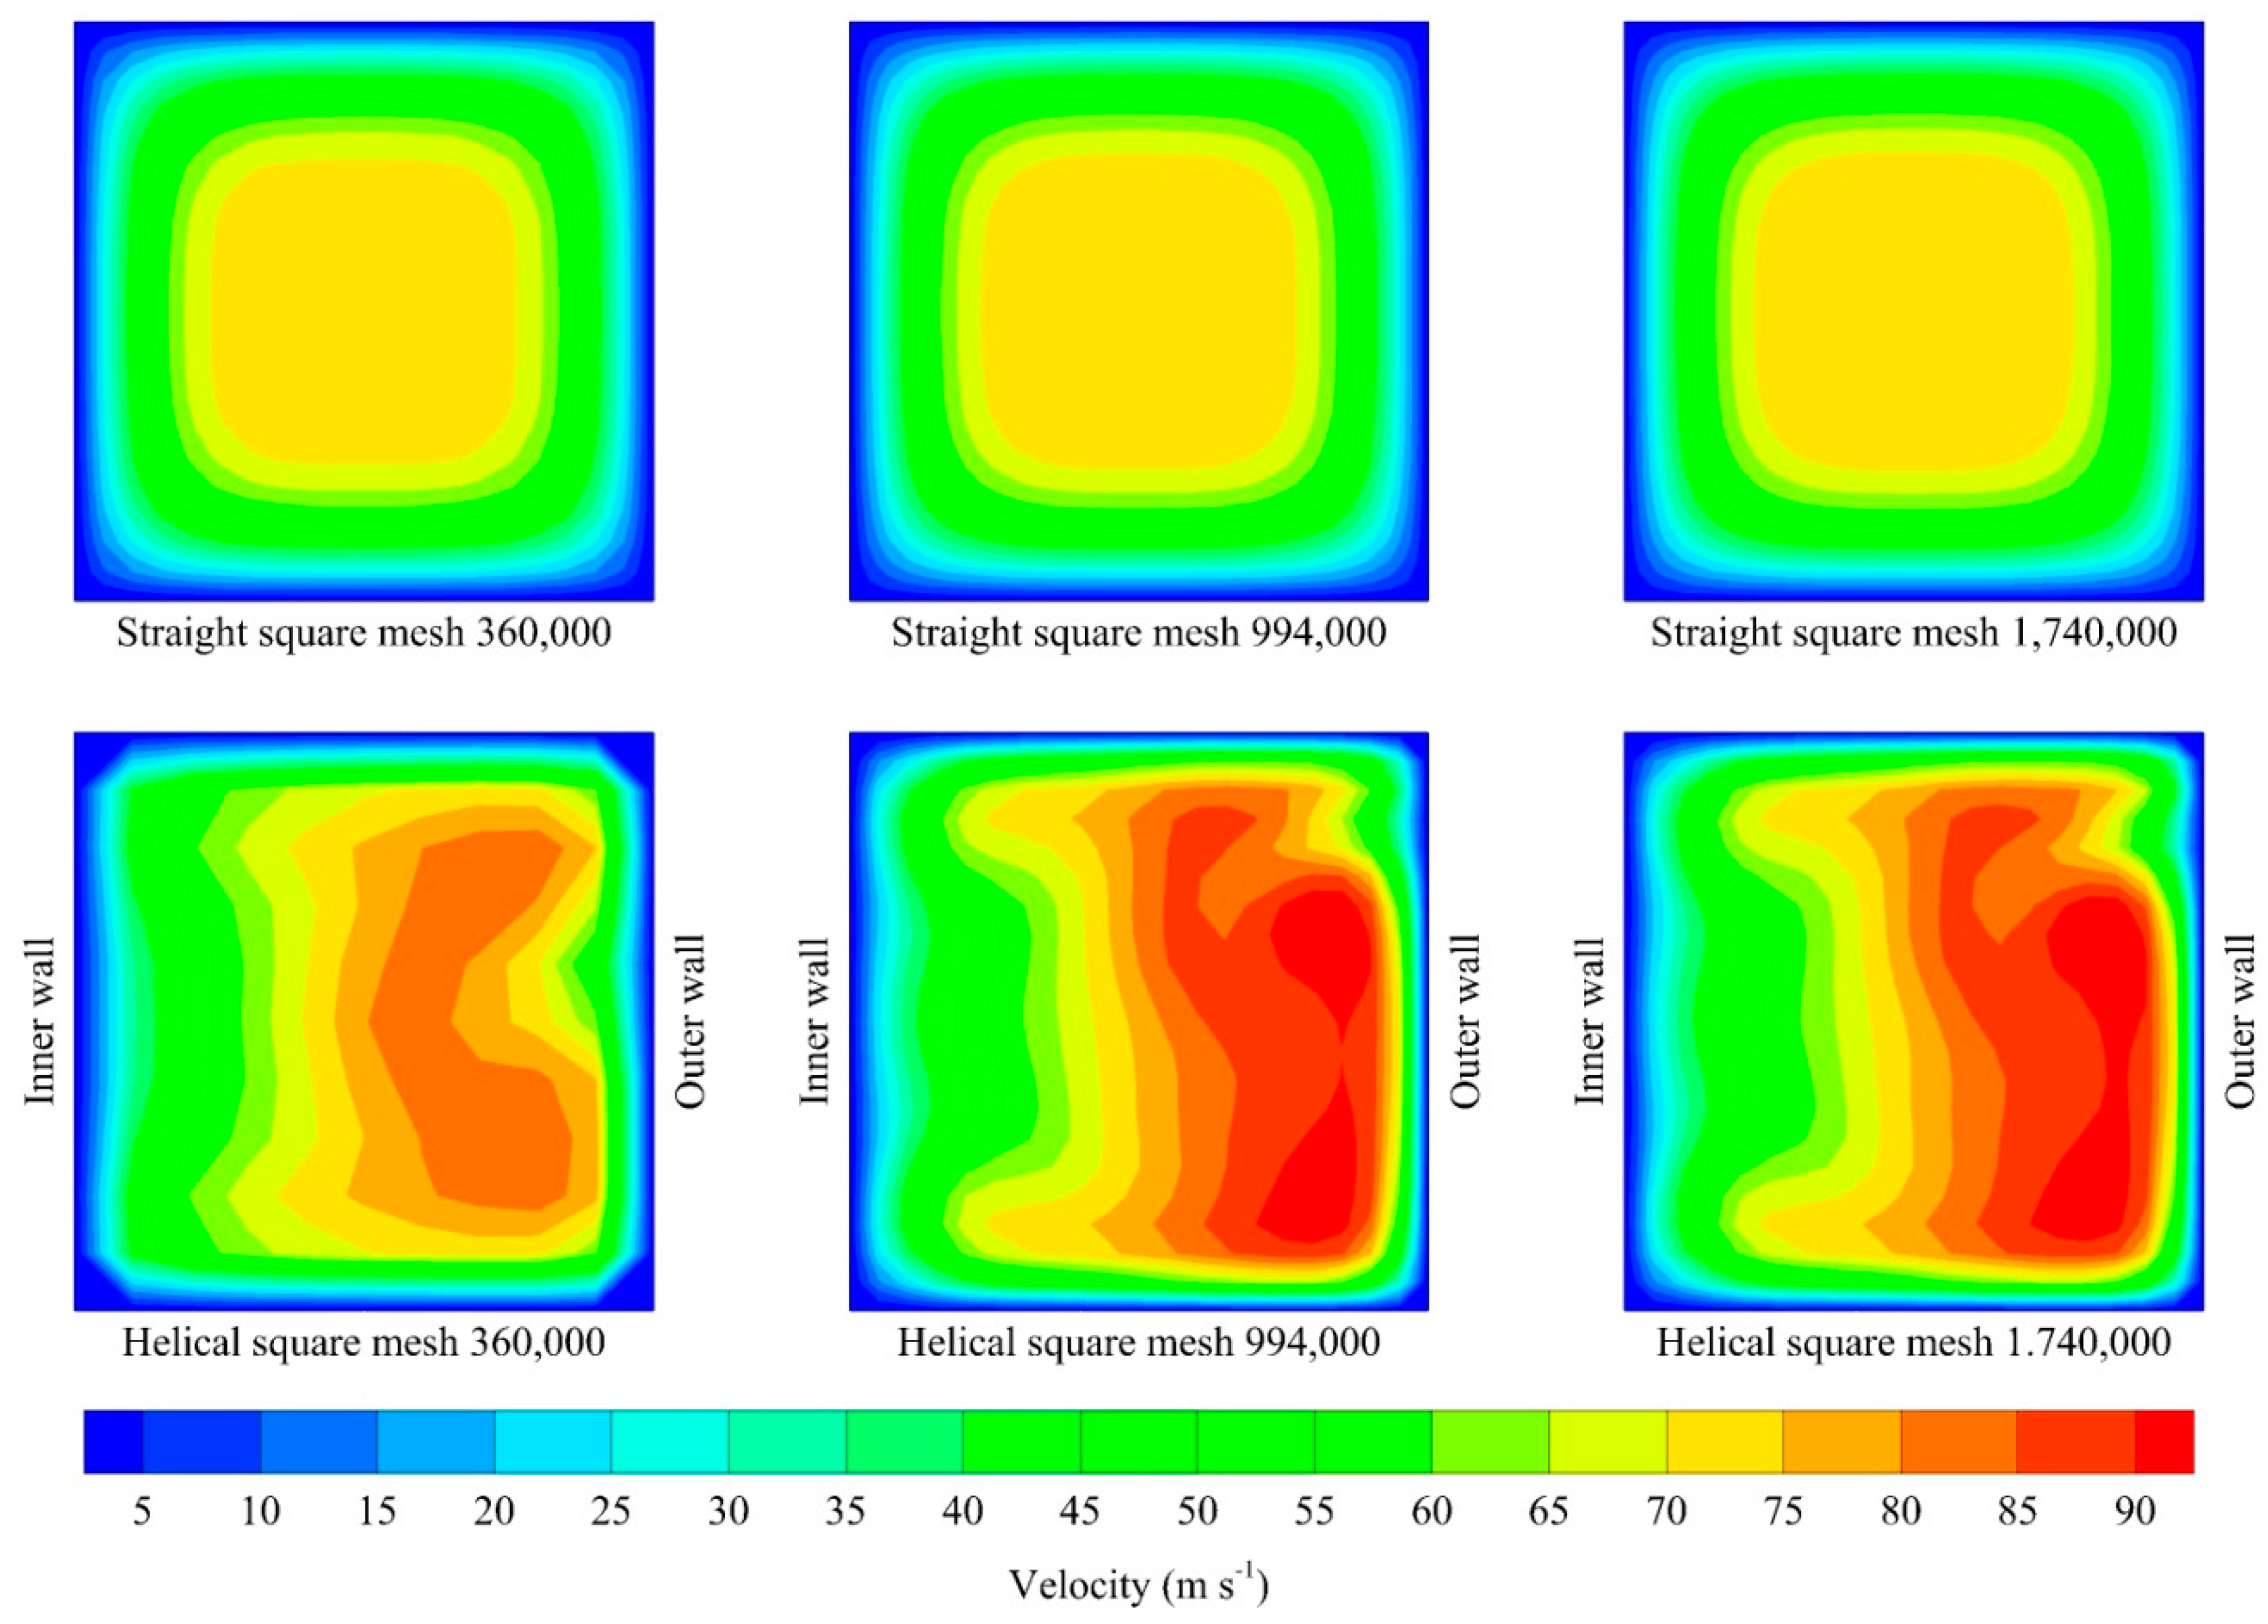
2.6. Numerical Methodology
3. Results and Discussion
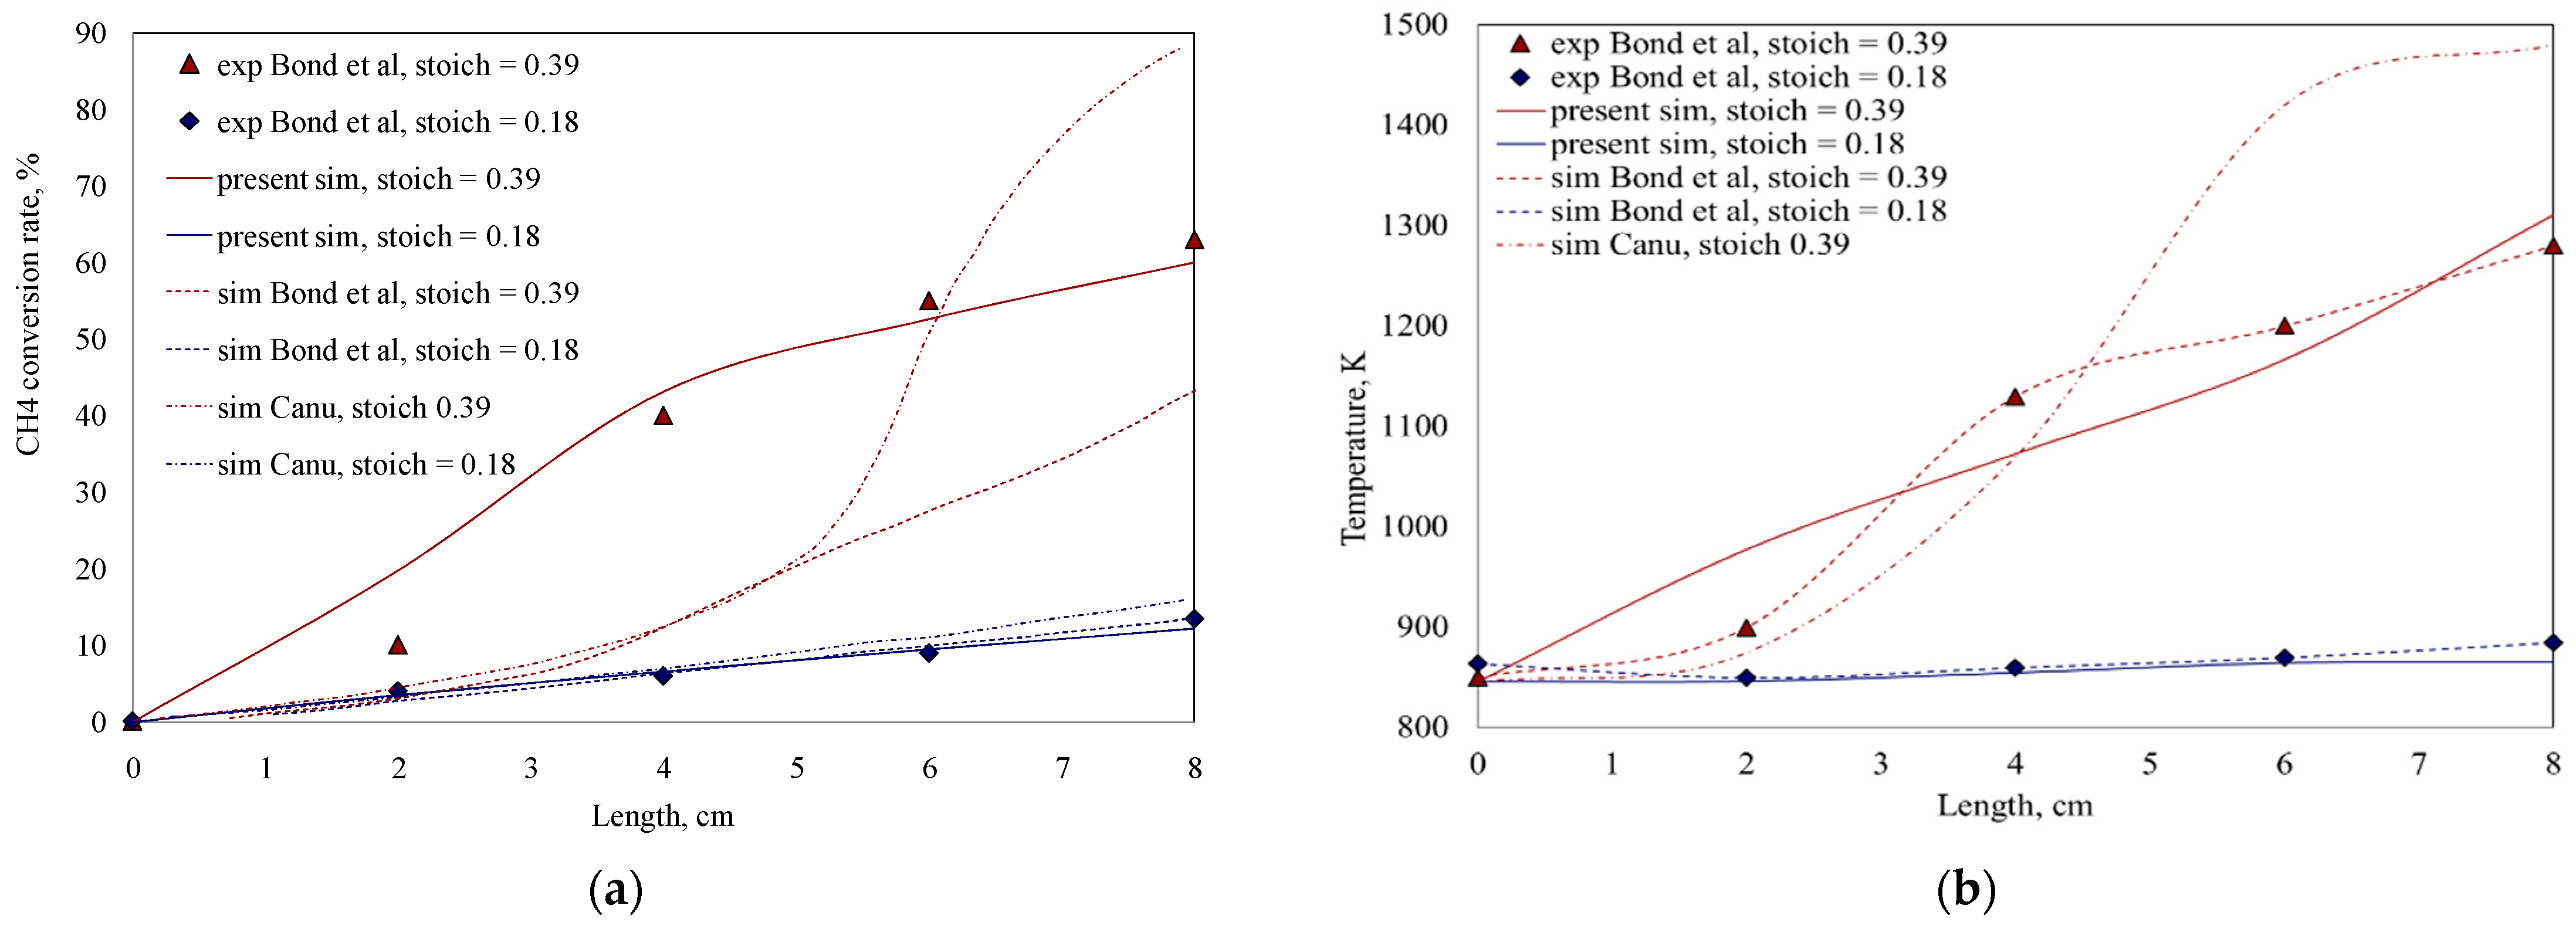
3.1. Model Validation
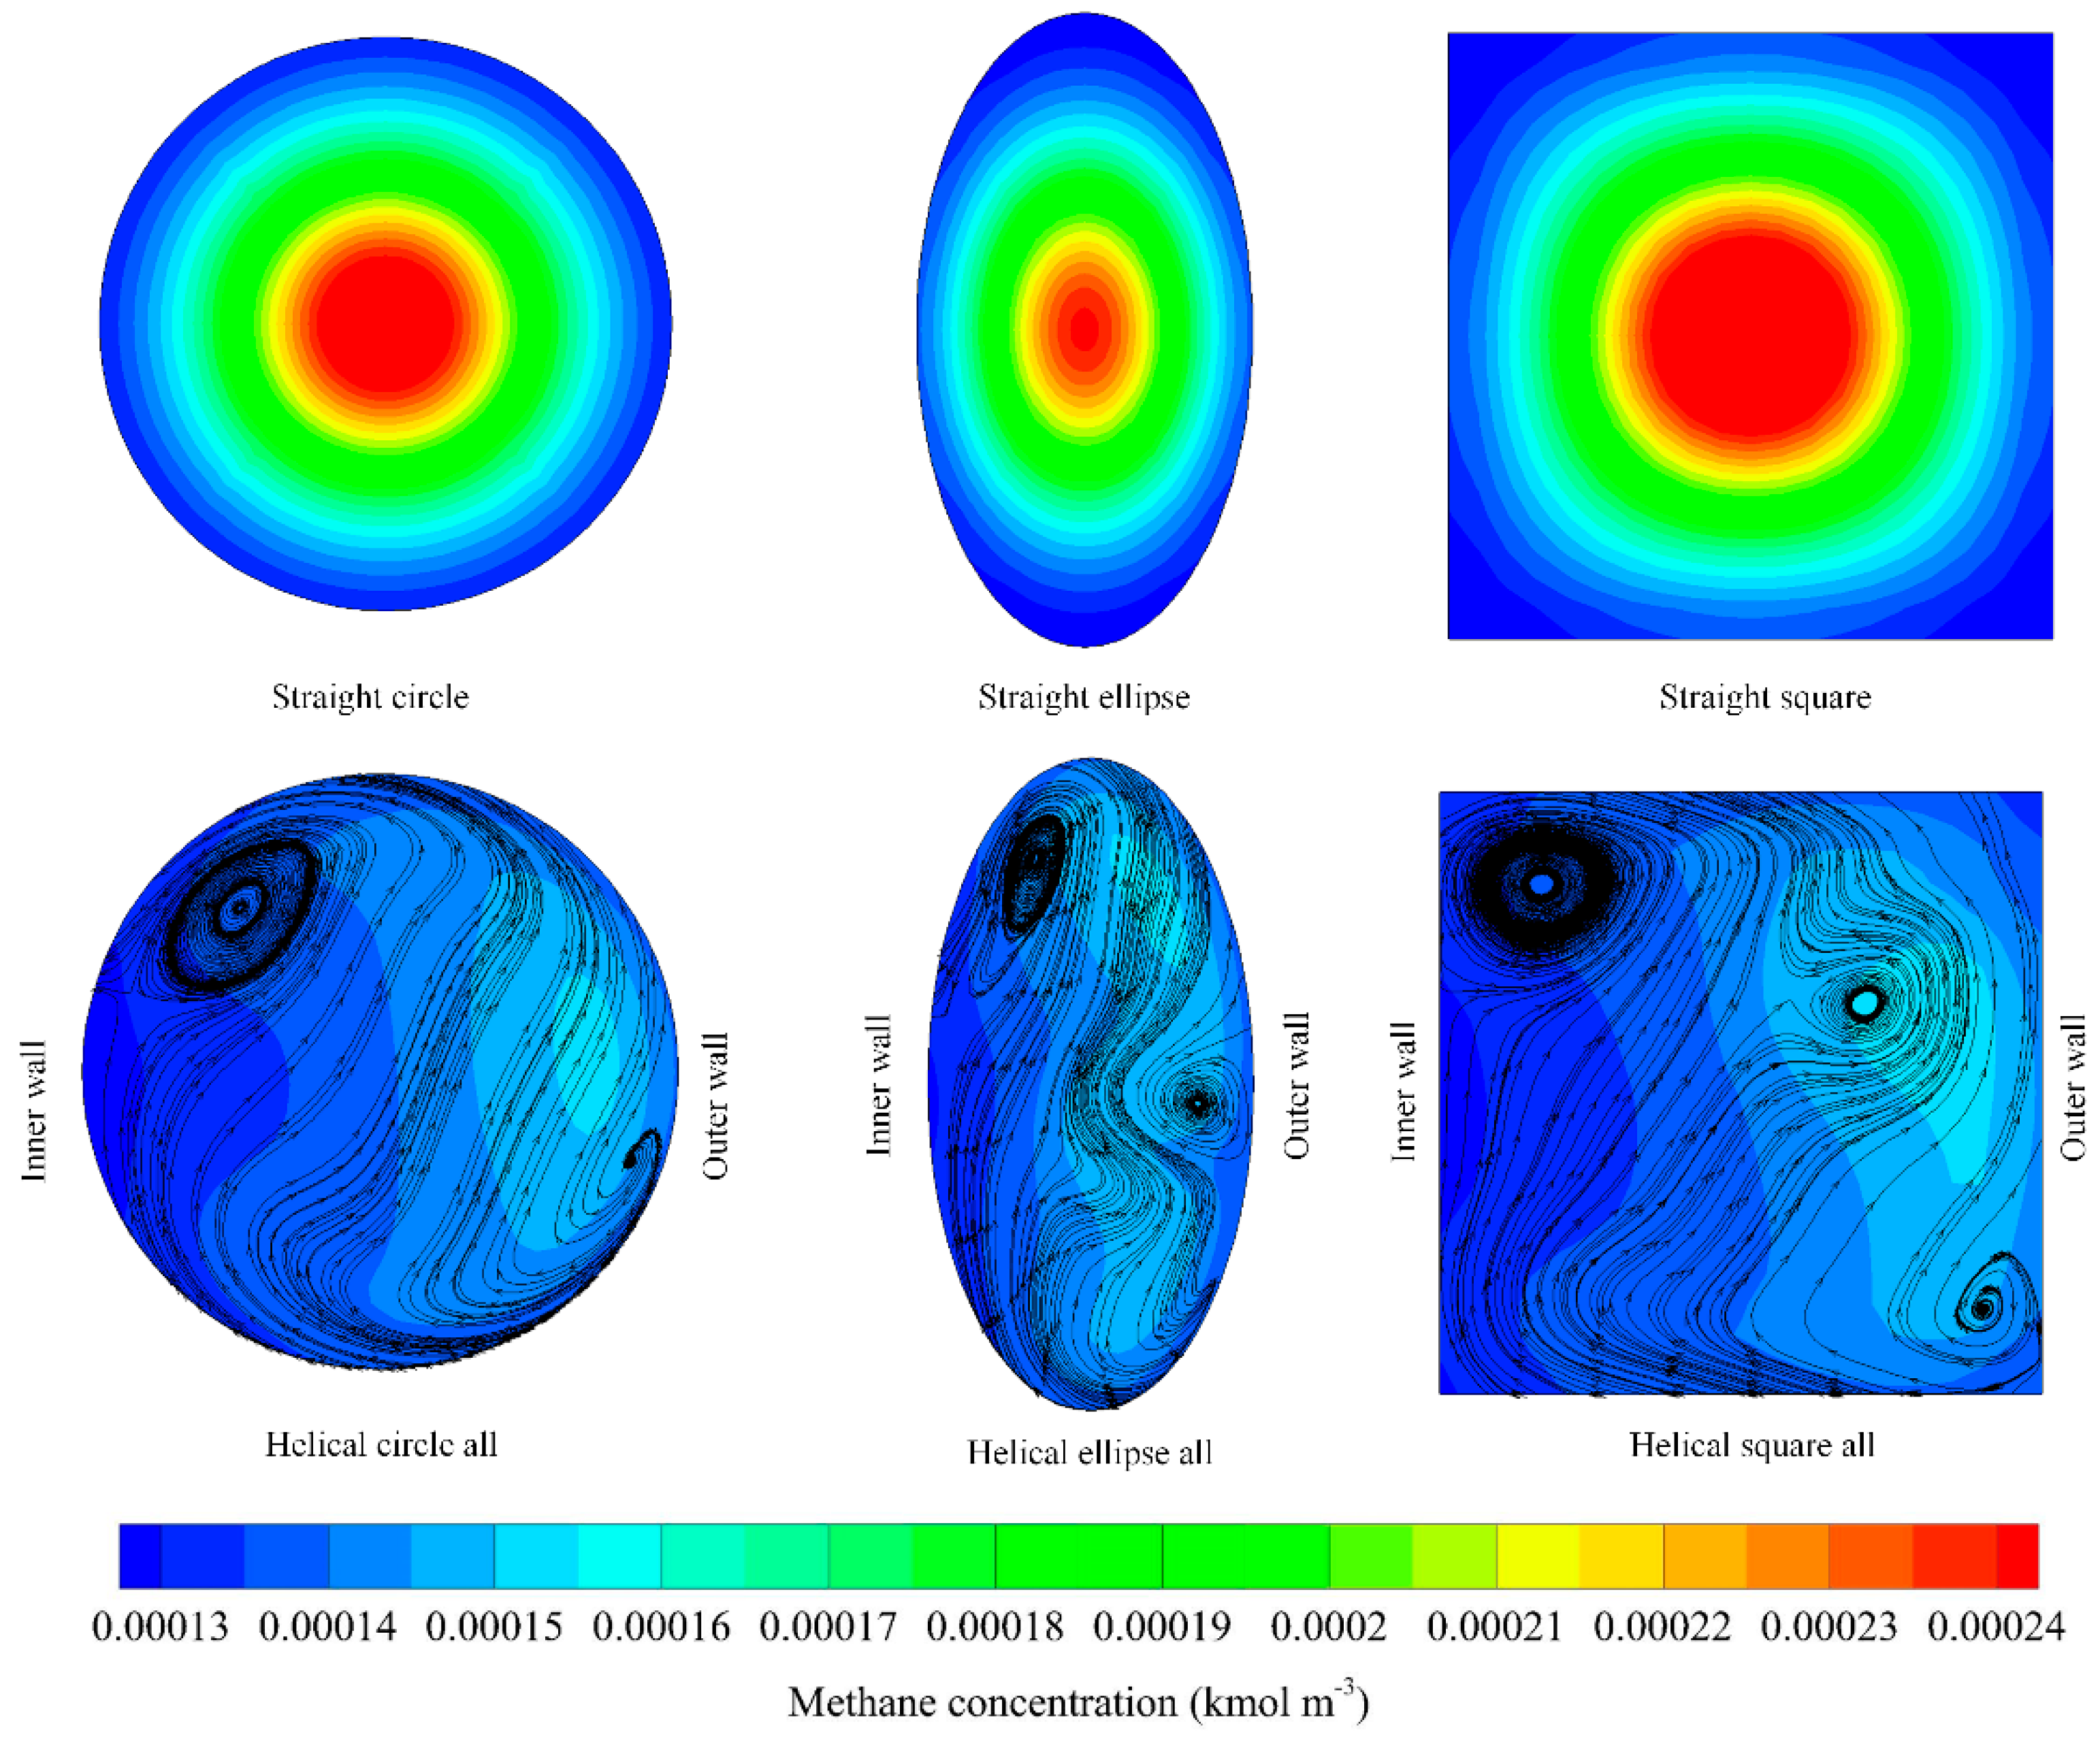
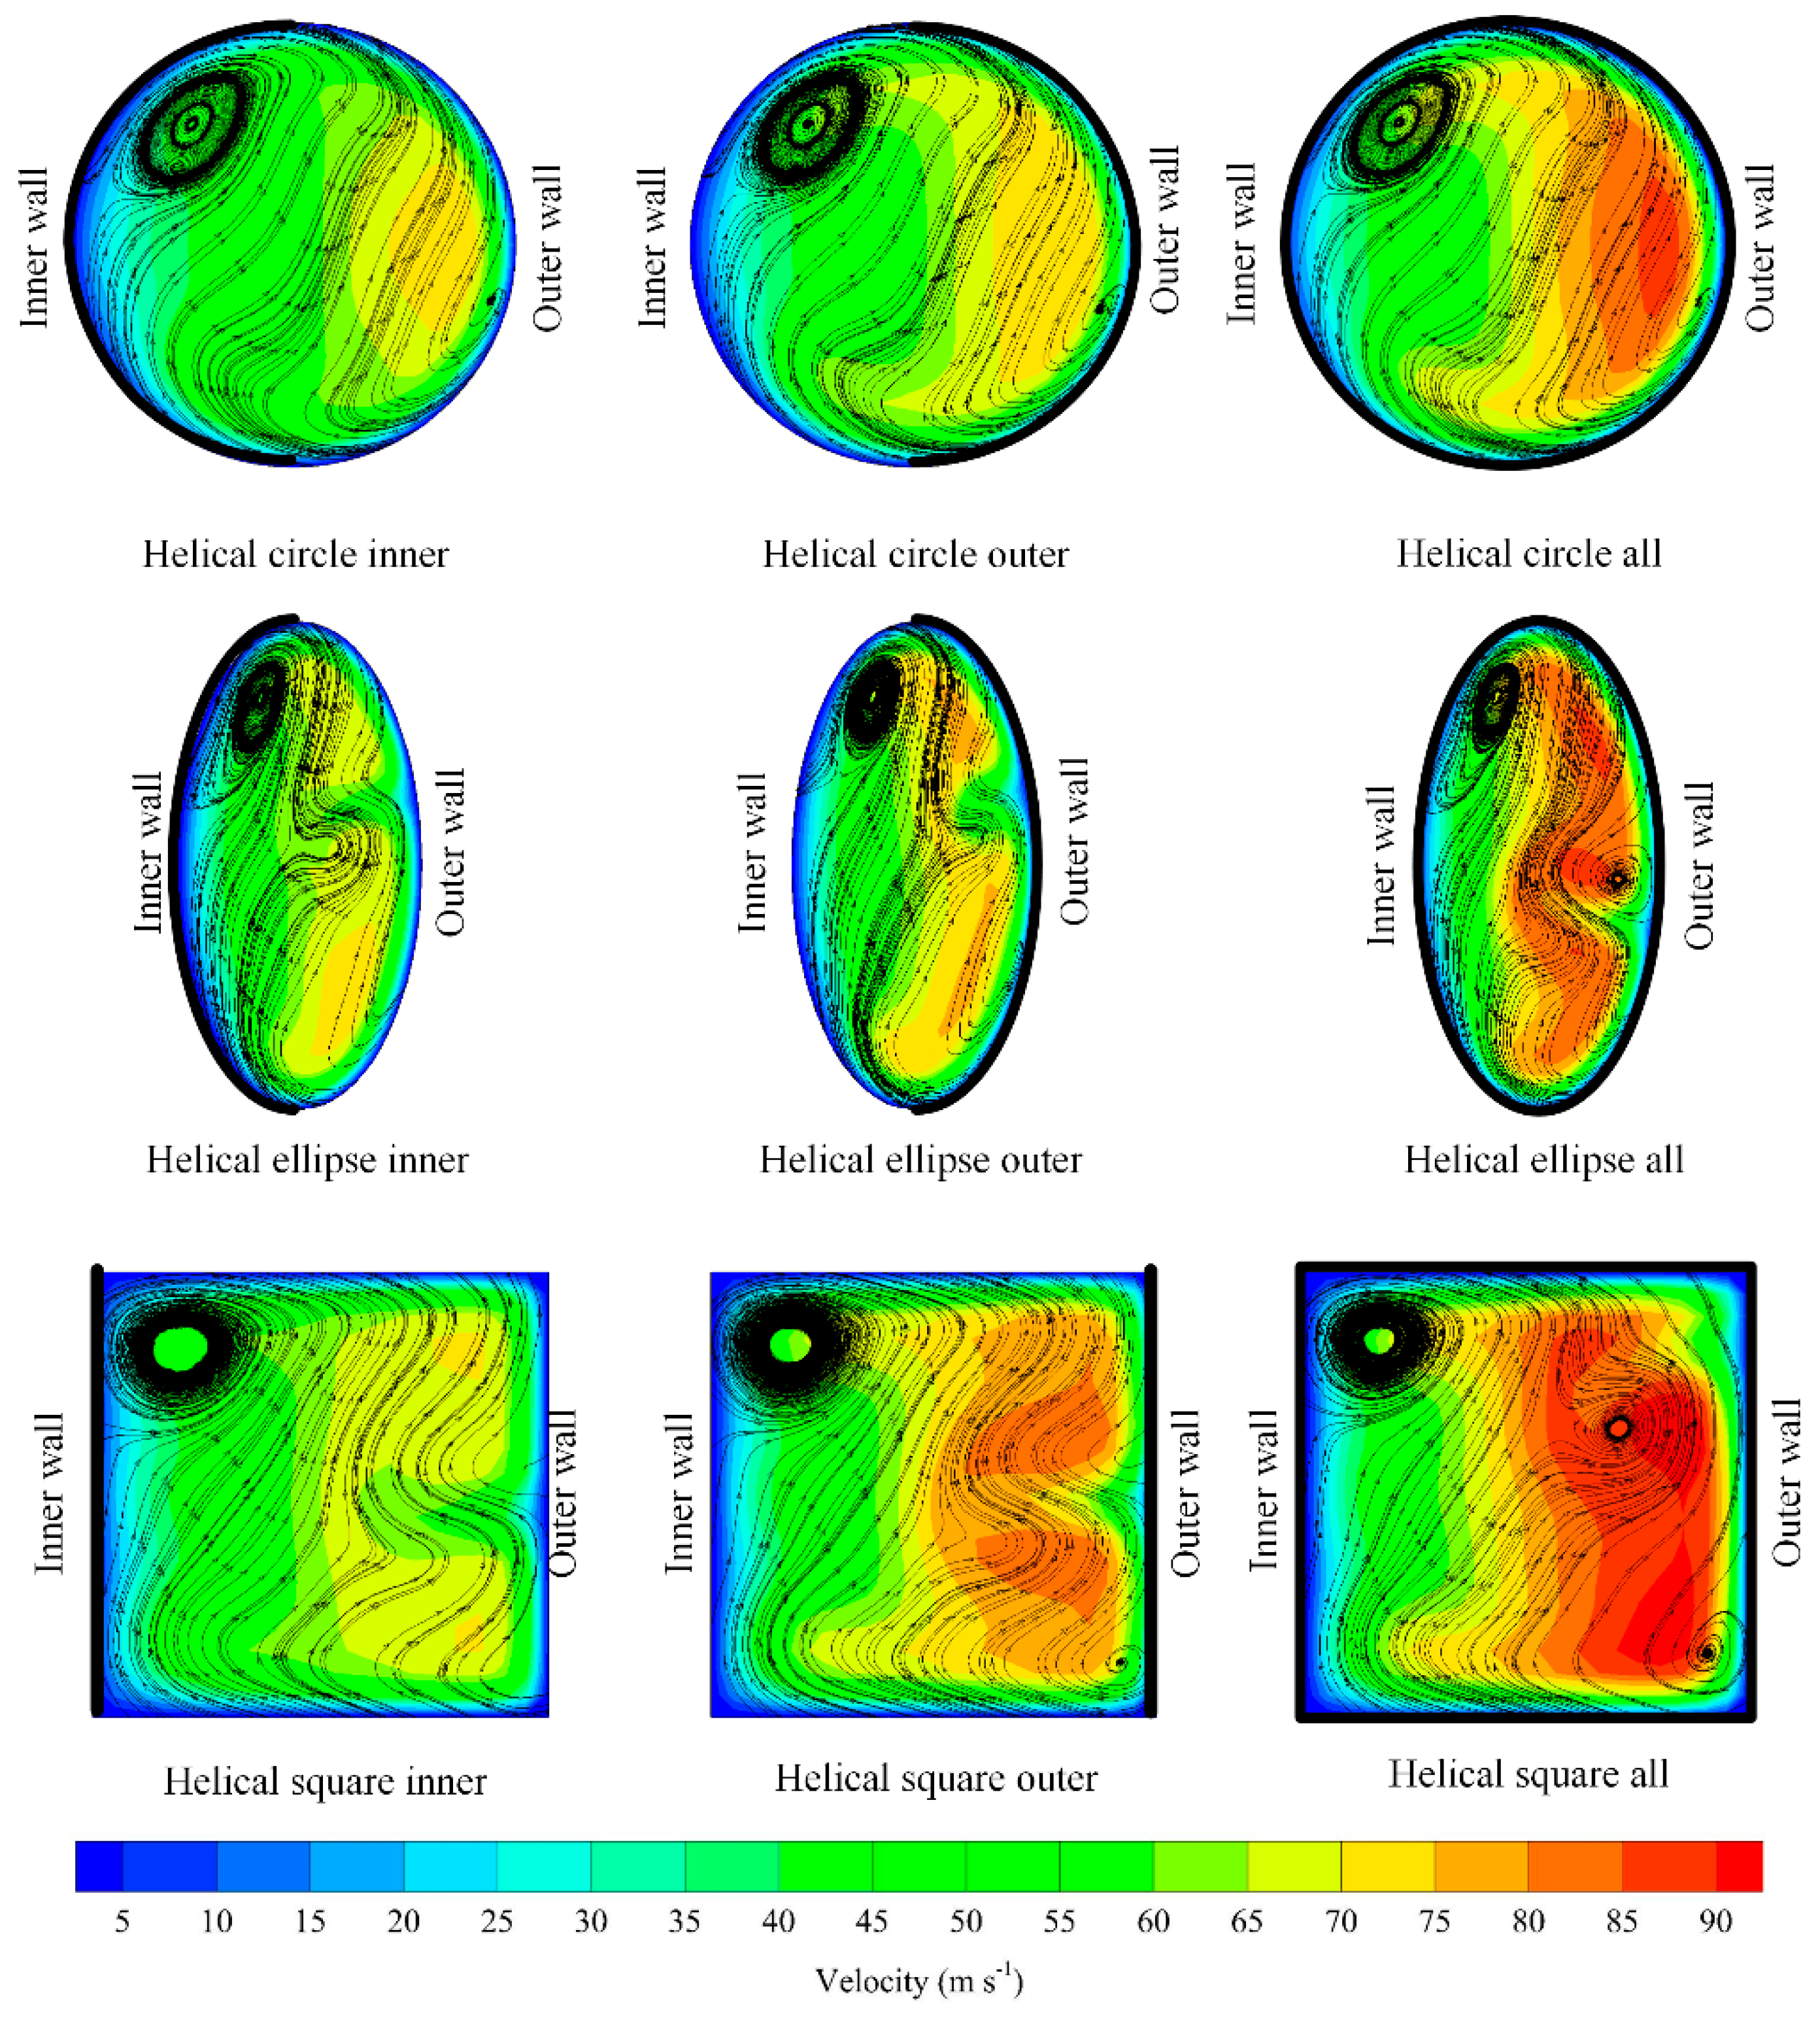
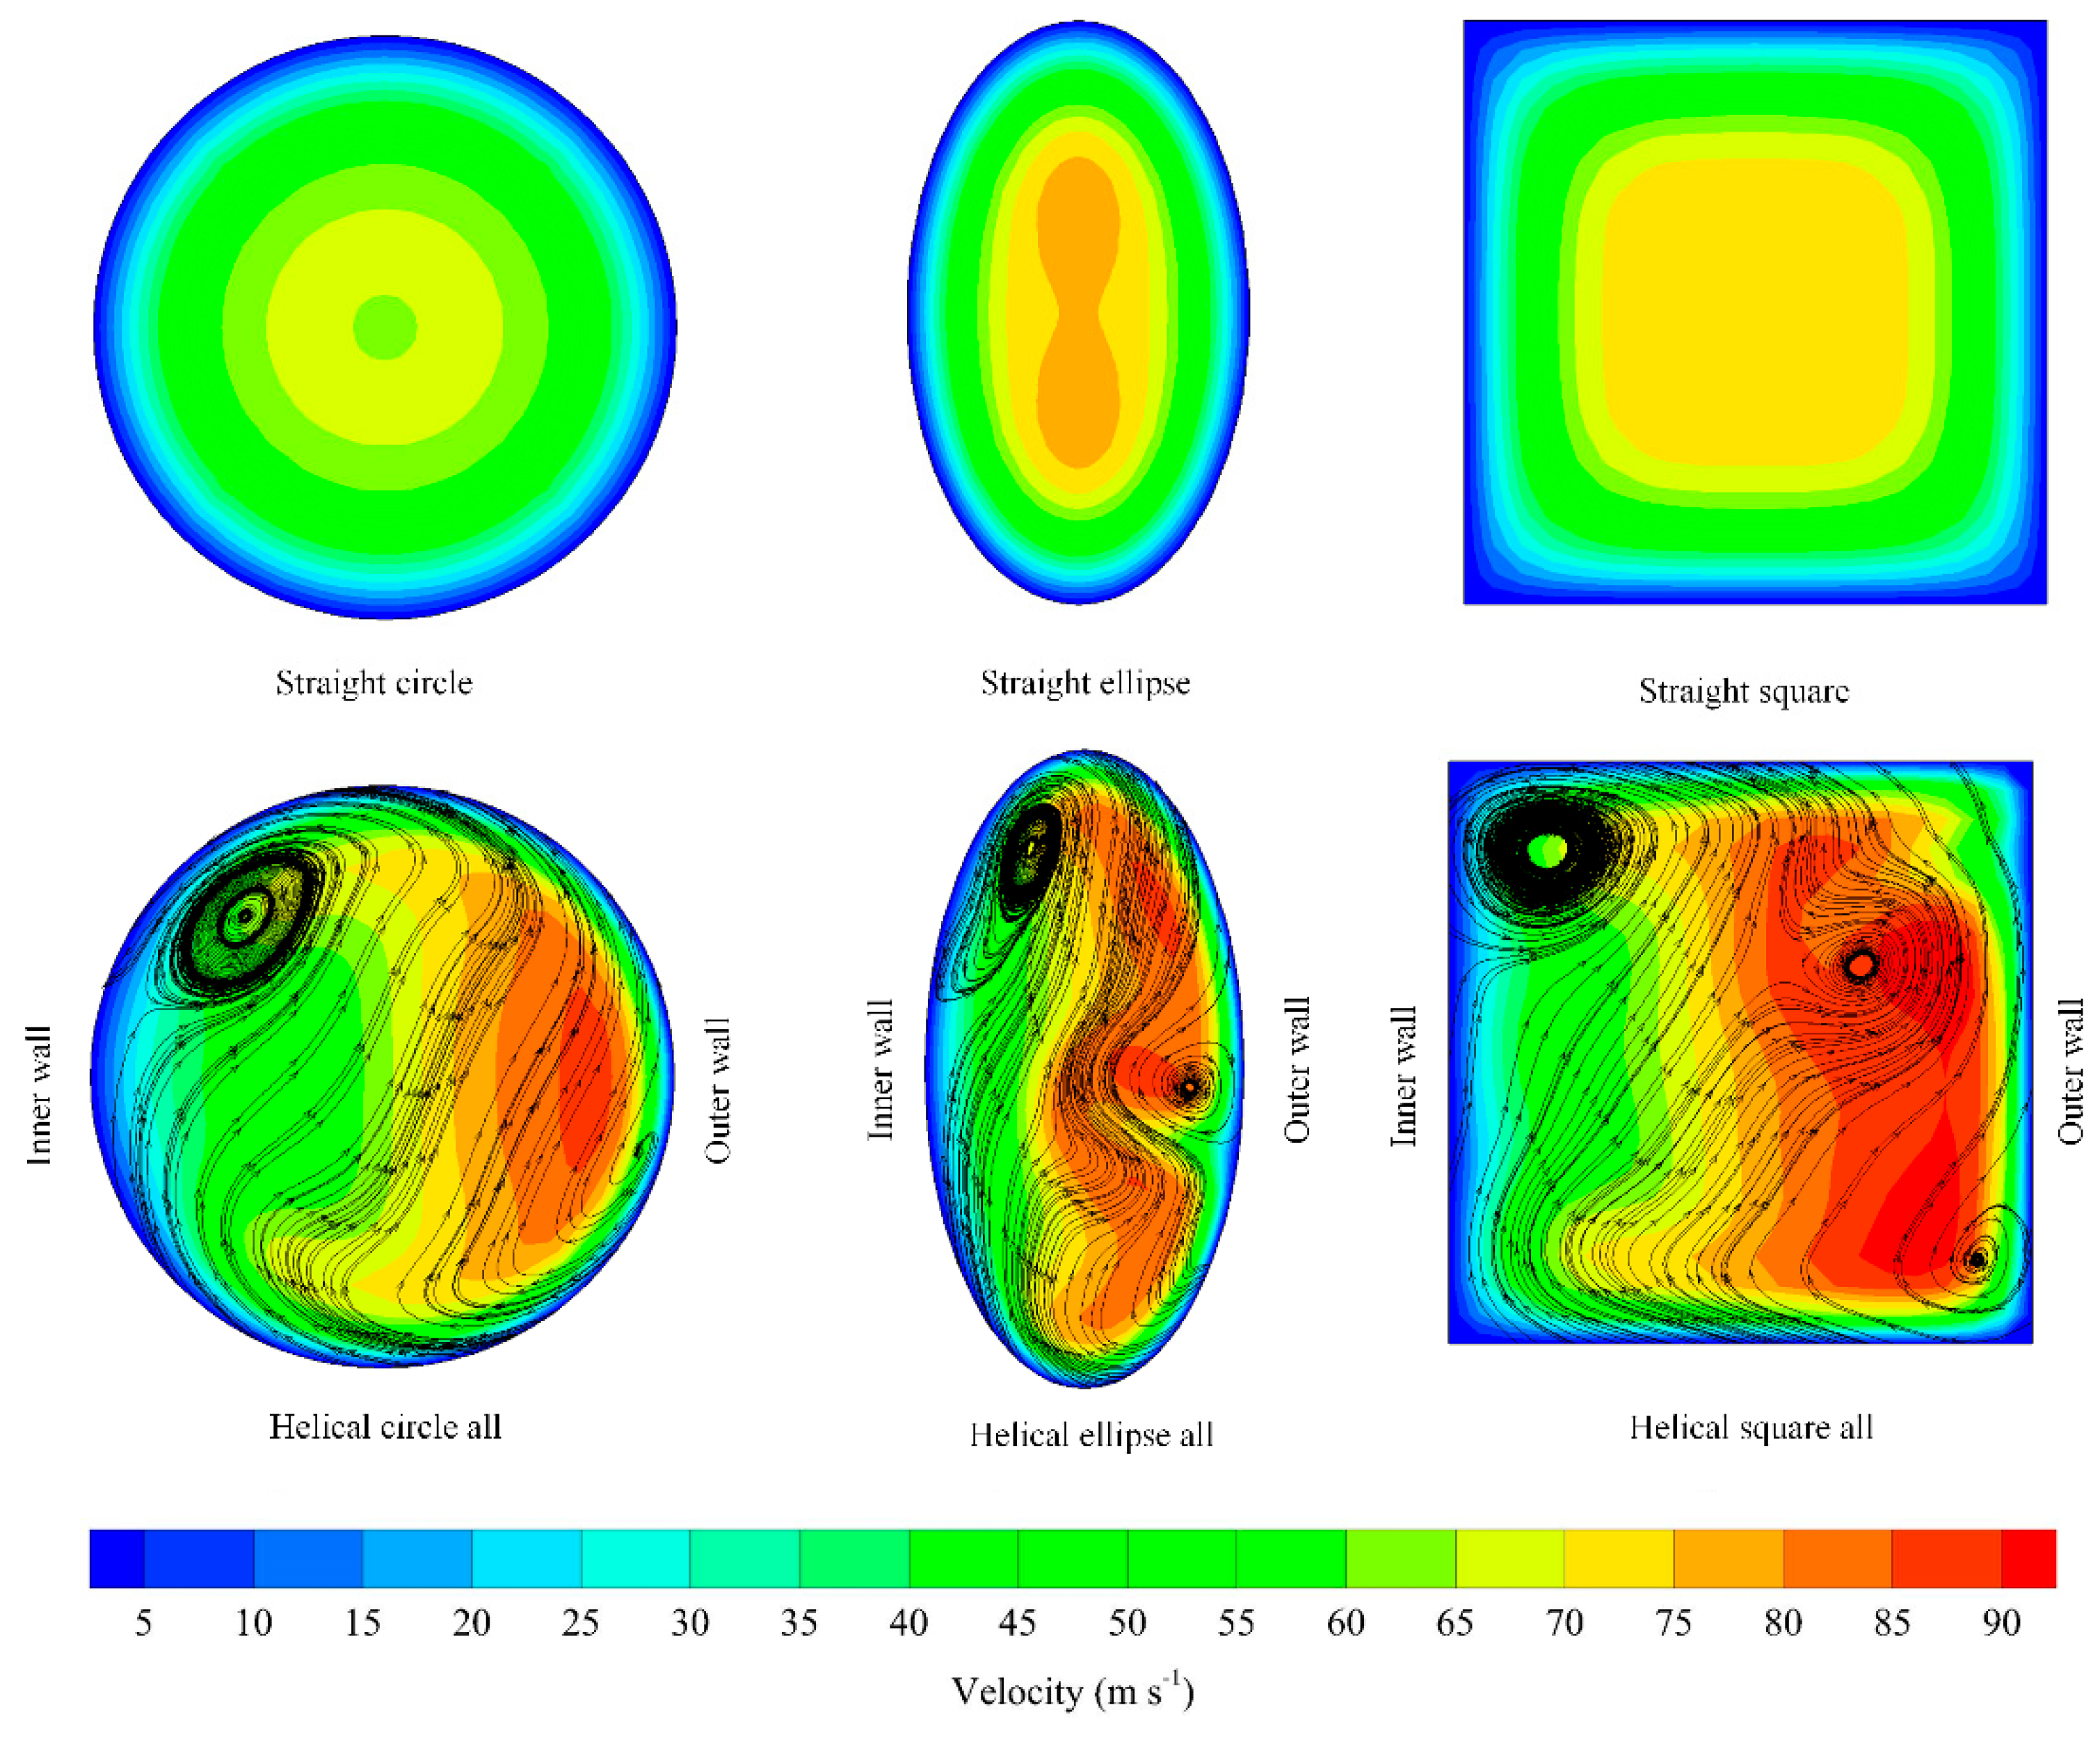
3.2. Effect of Reactor Geometry
3.3. Effect of Cross-Section Area
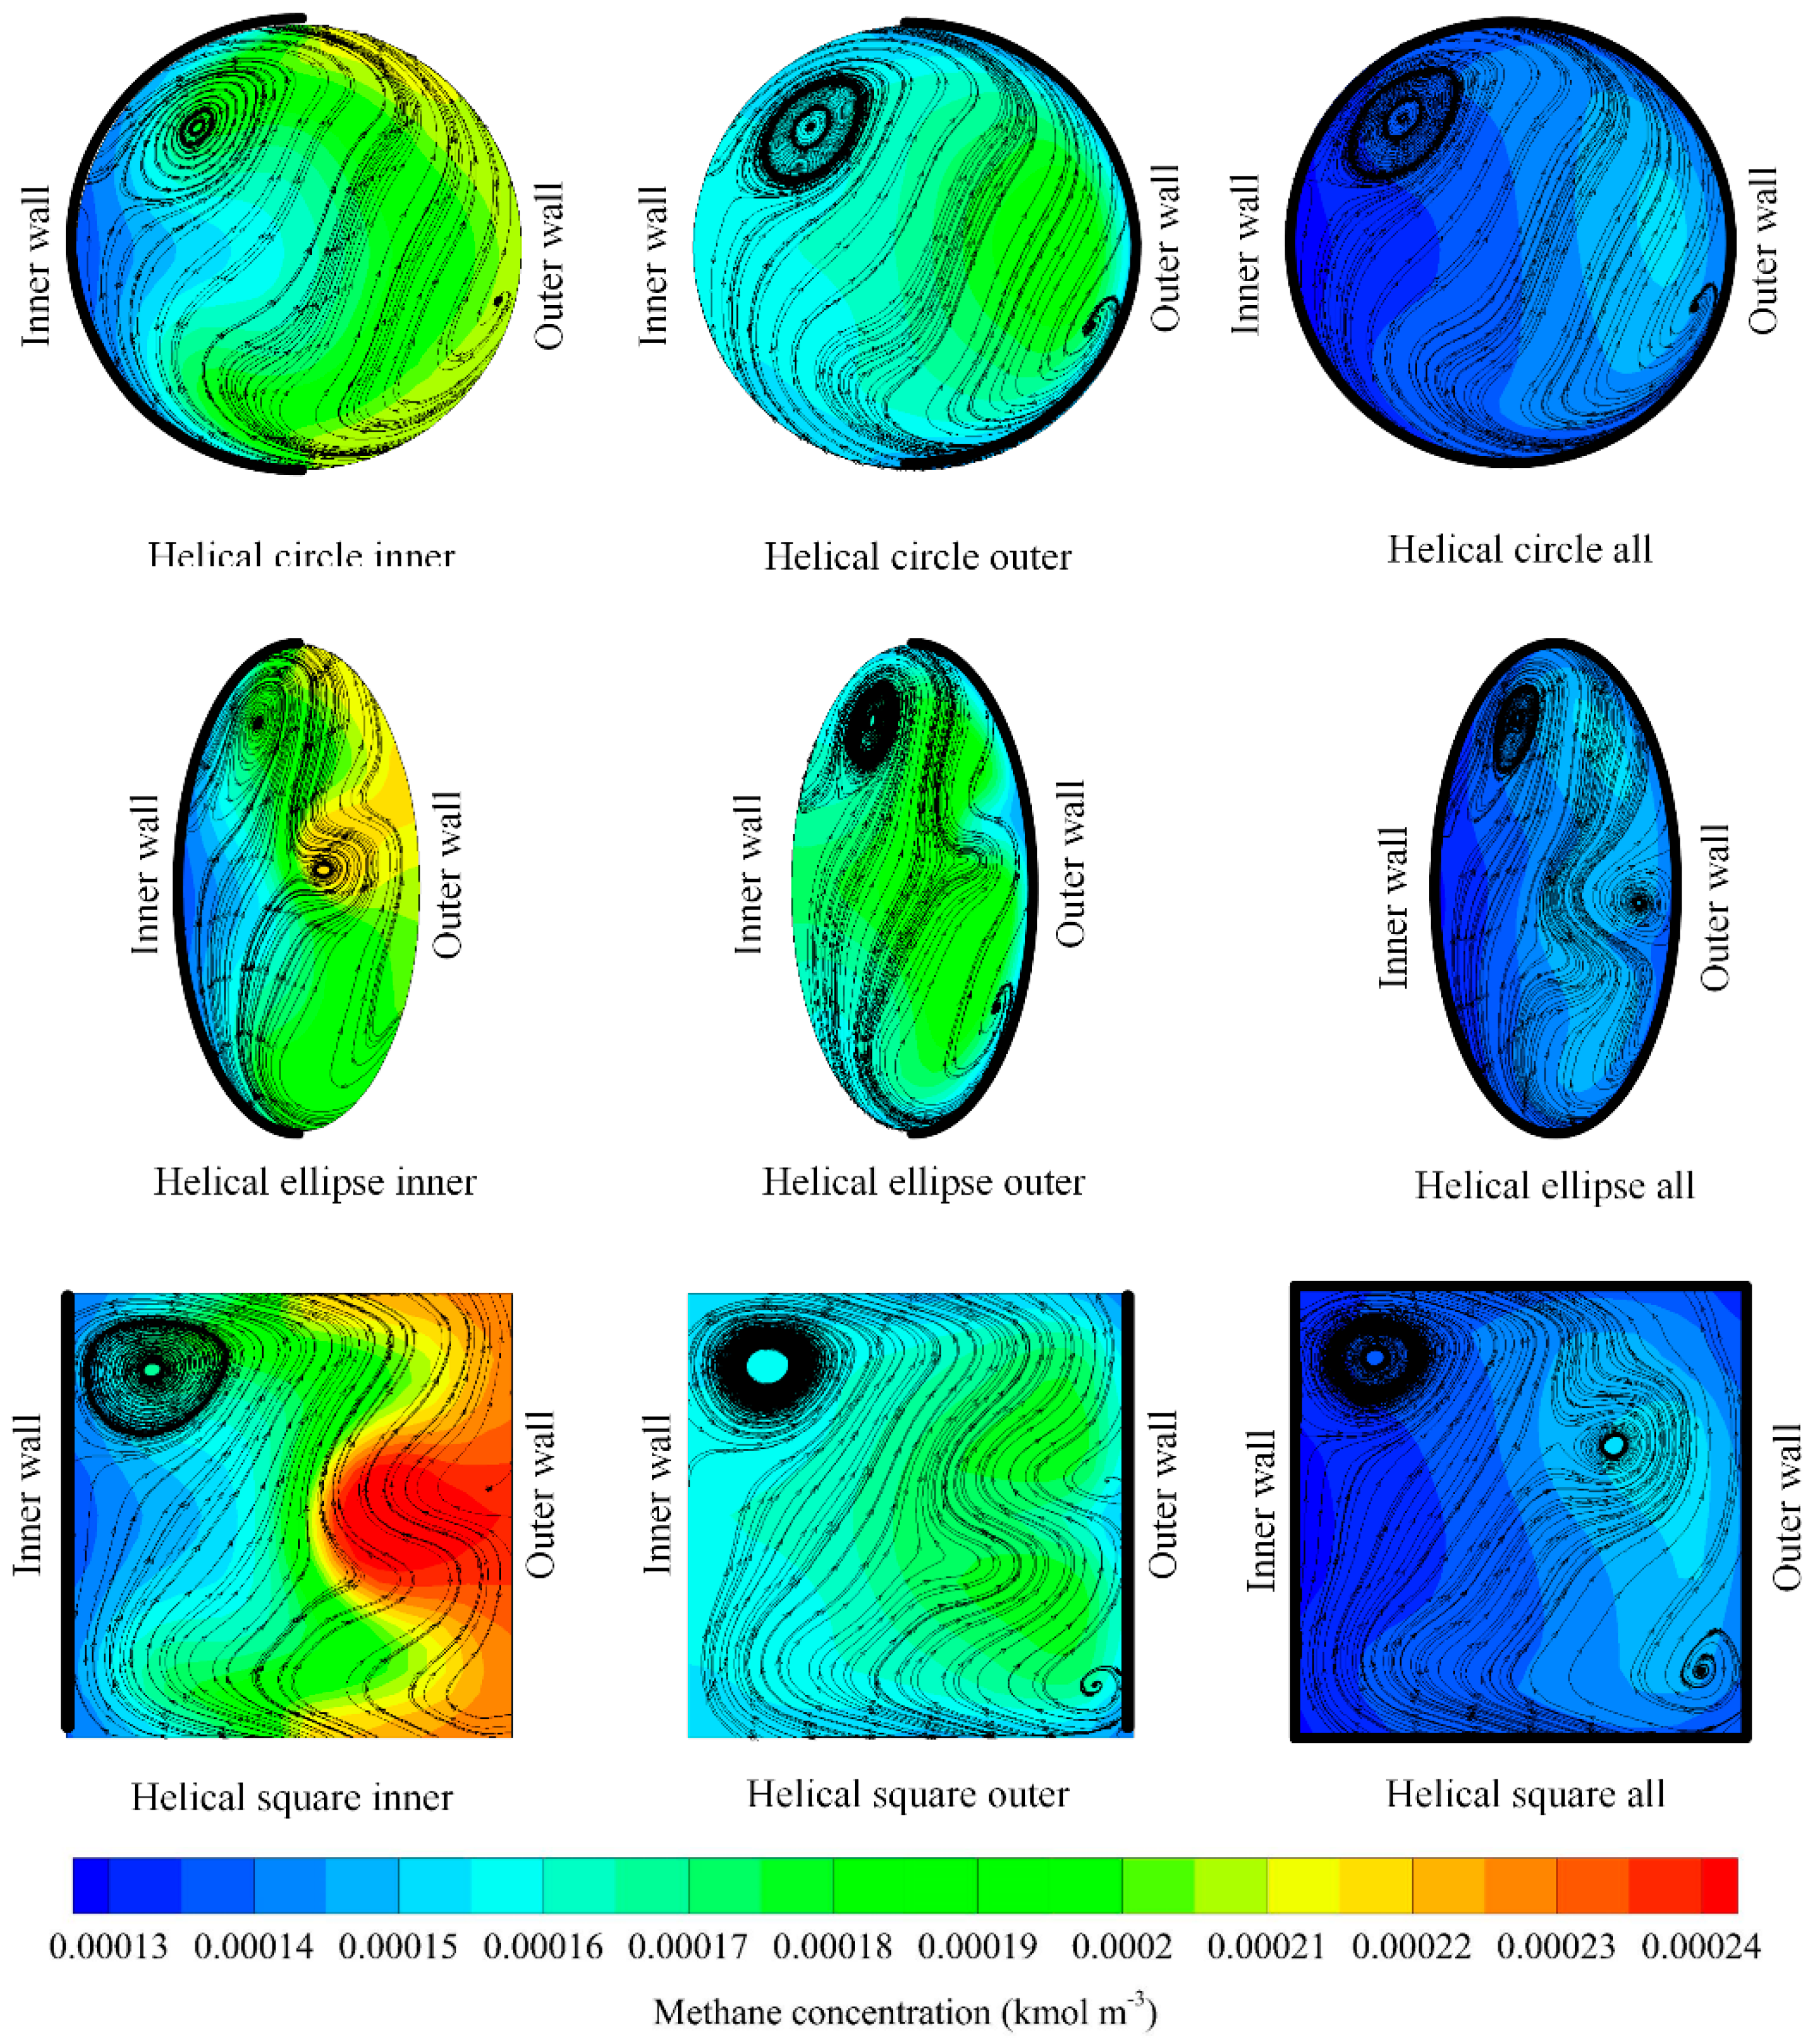
3.4. Effect of Selective Coating Strategies
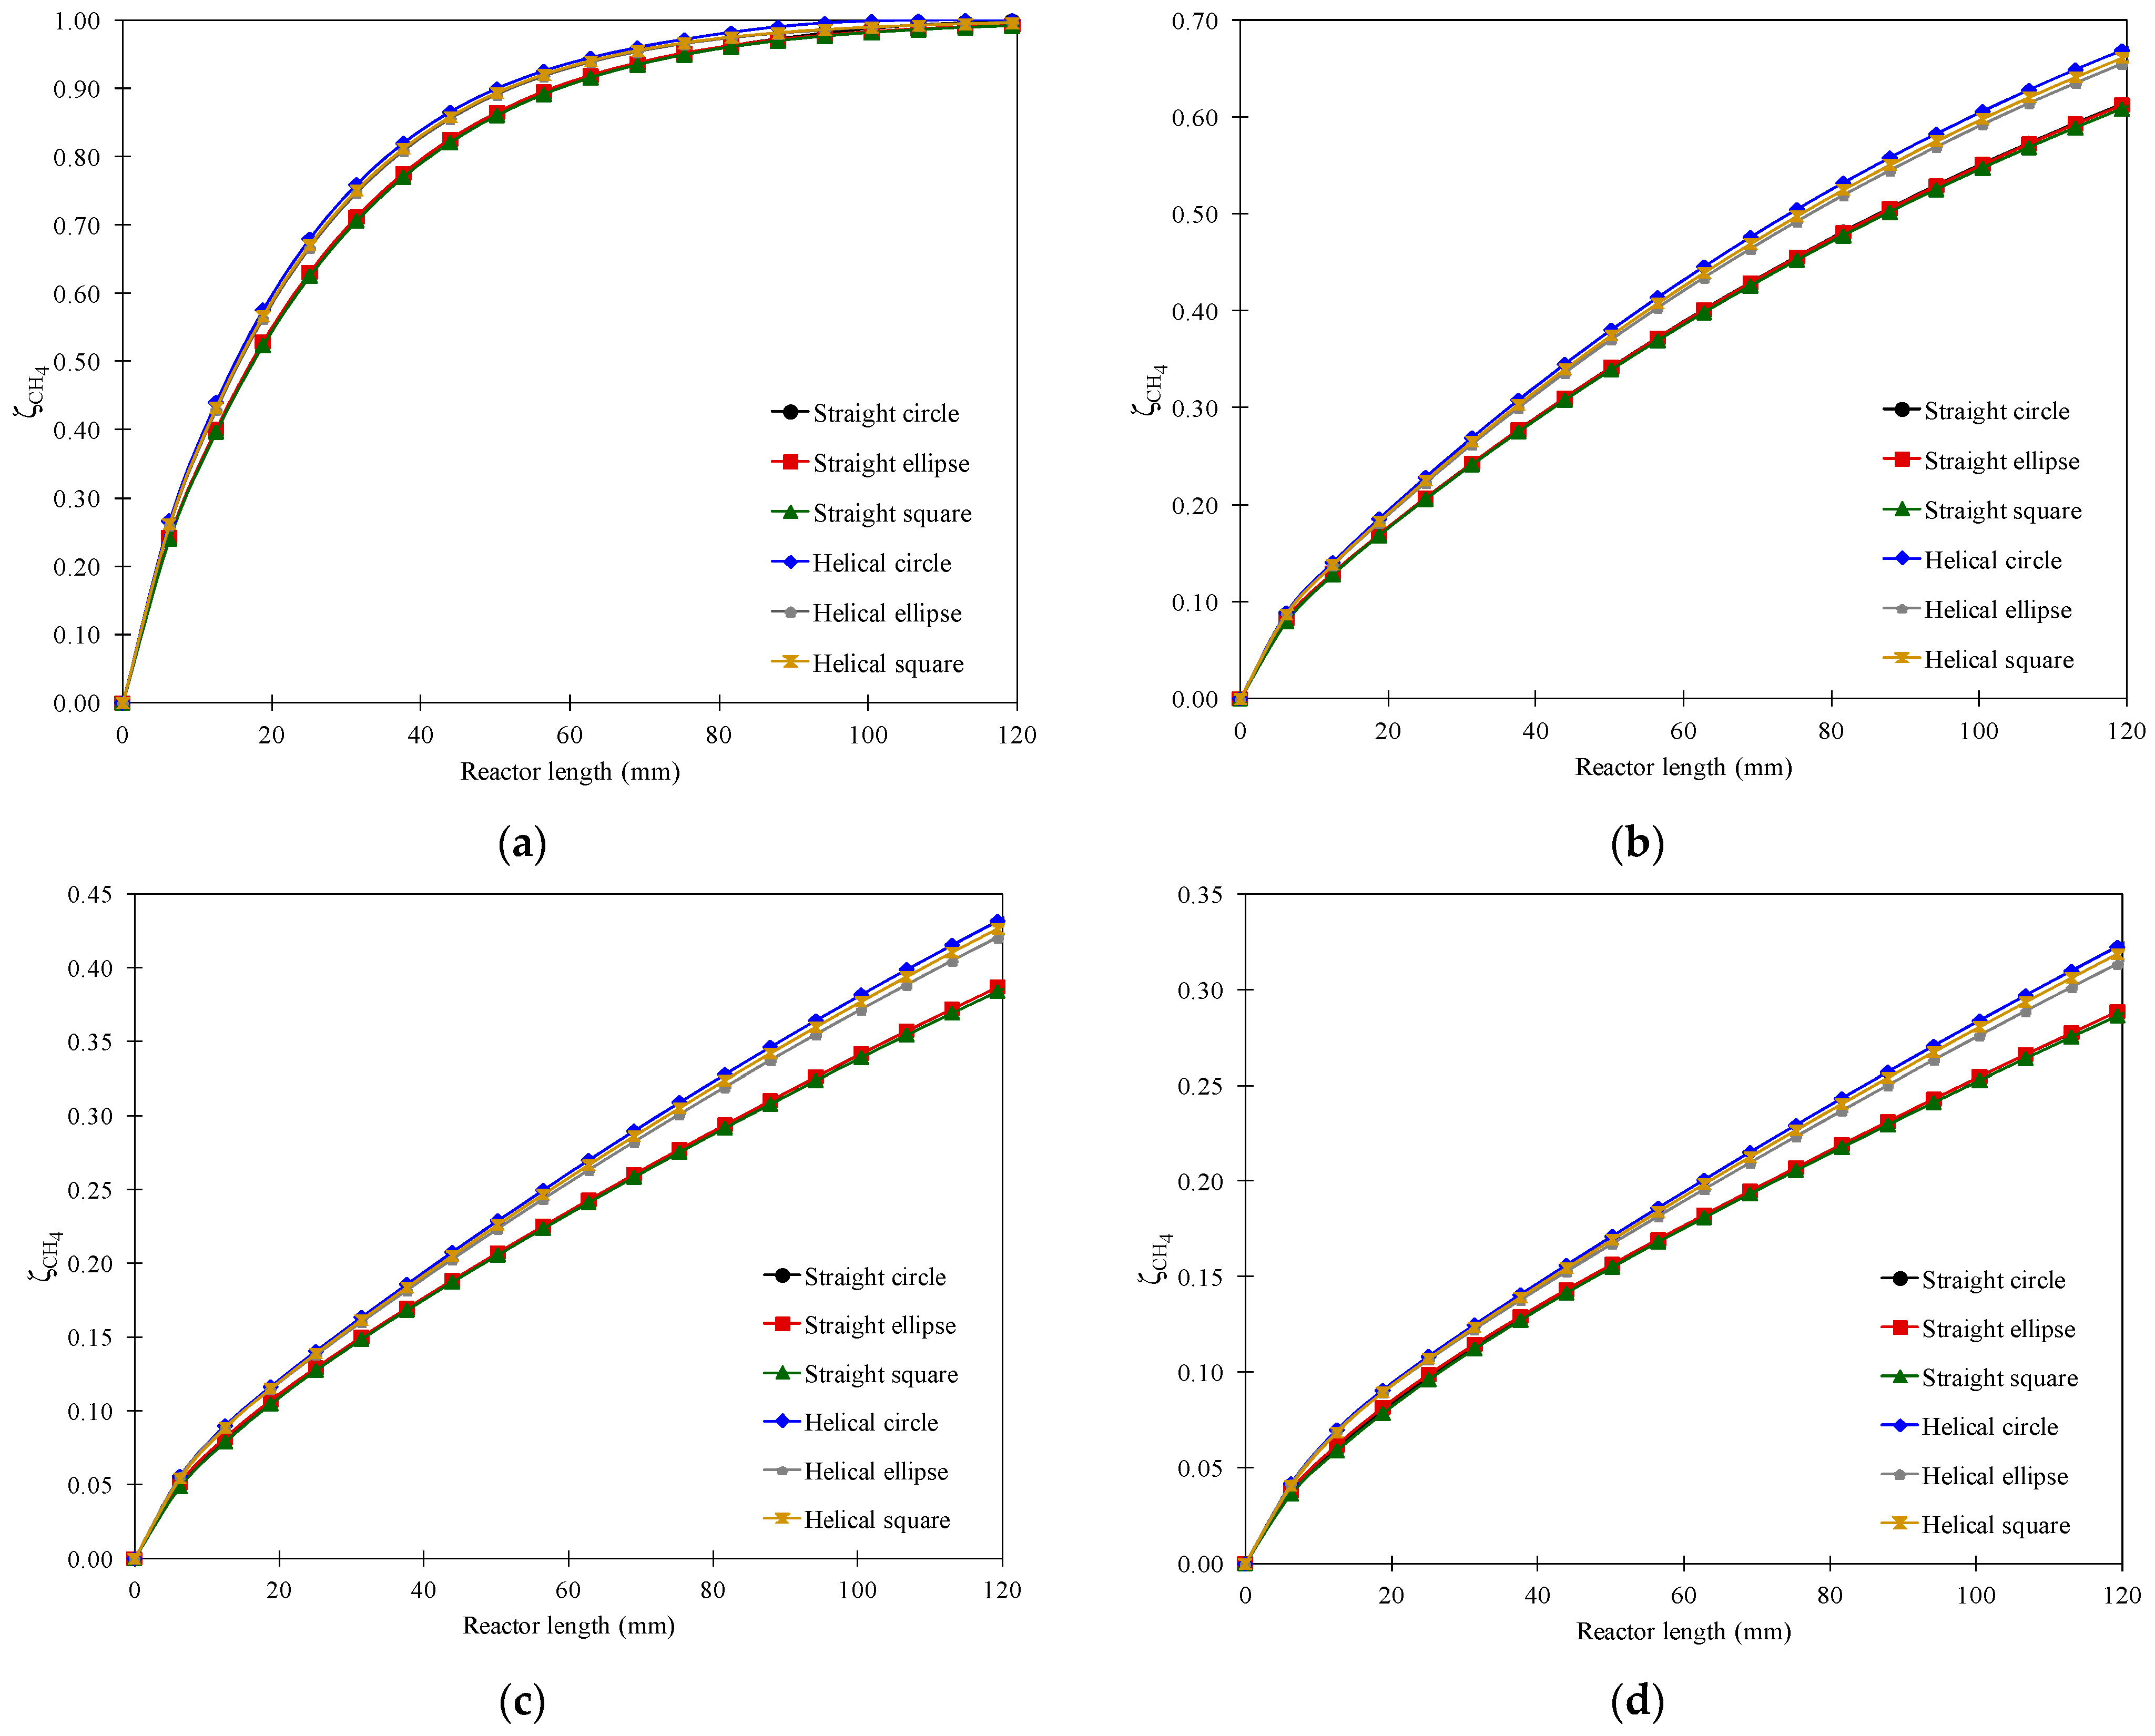
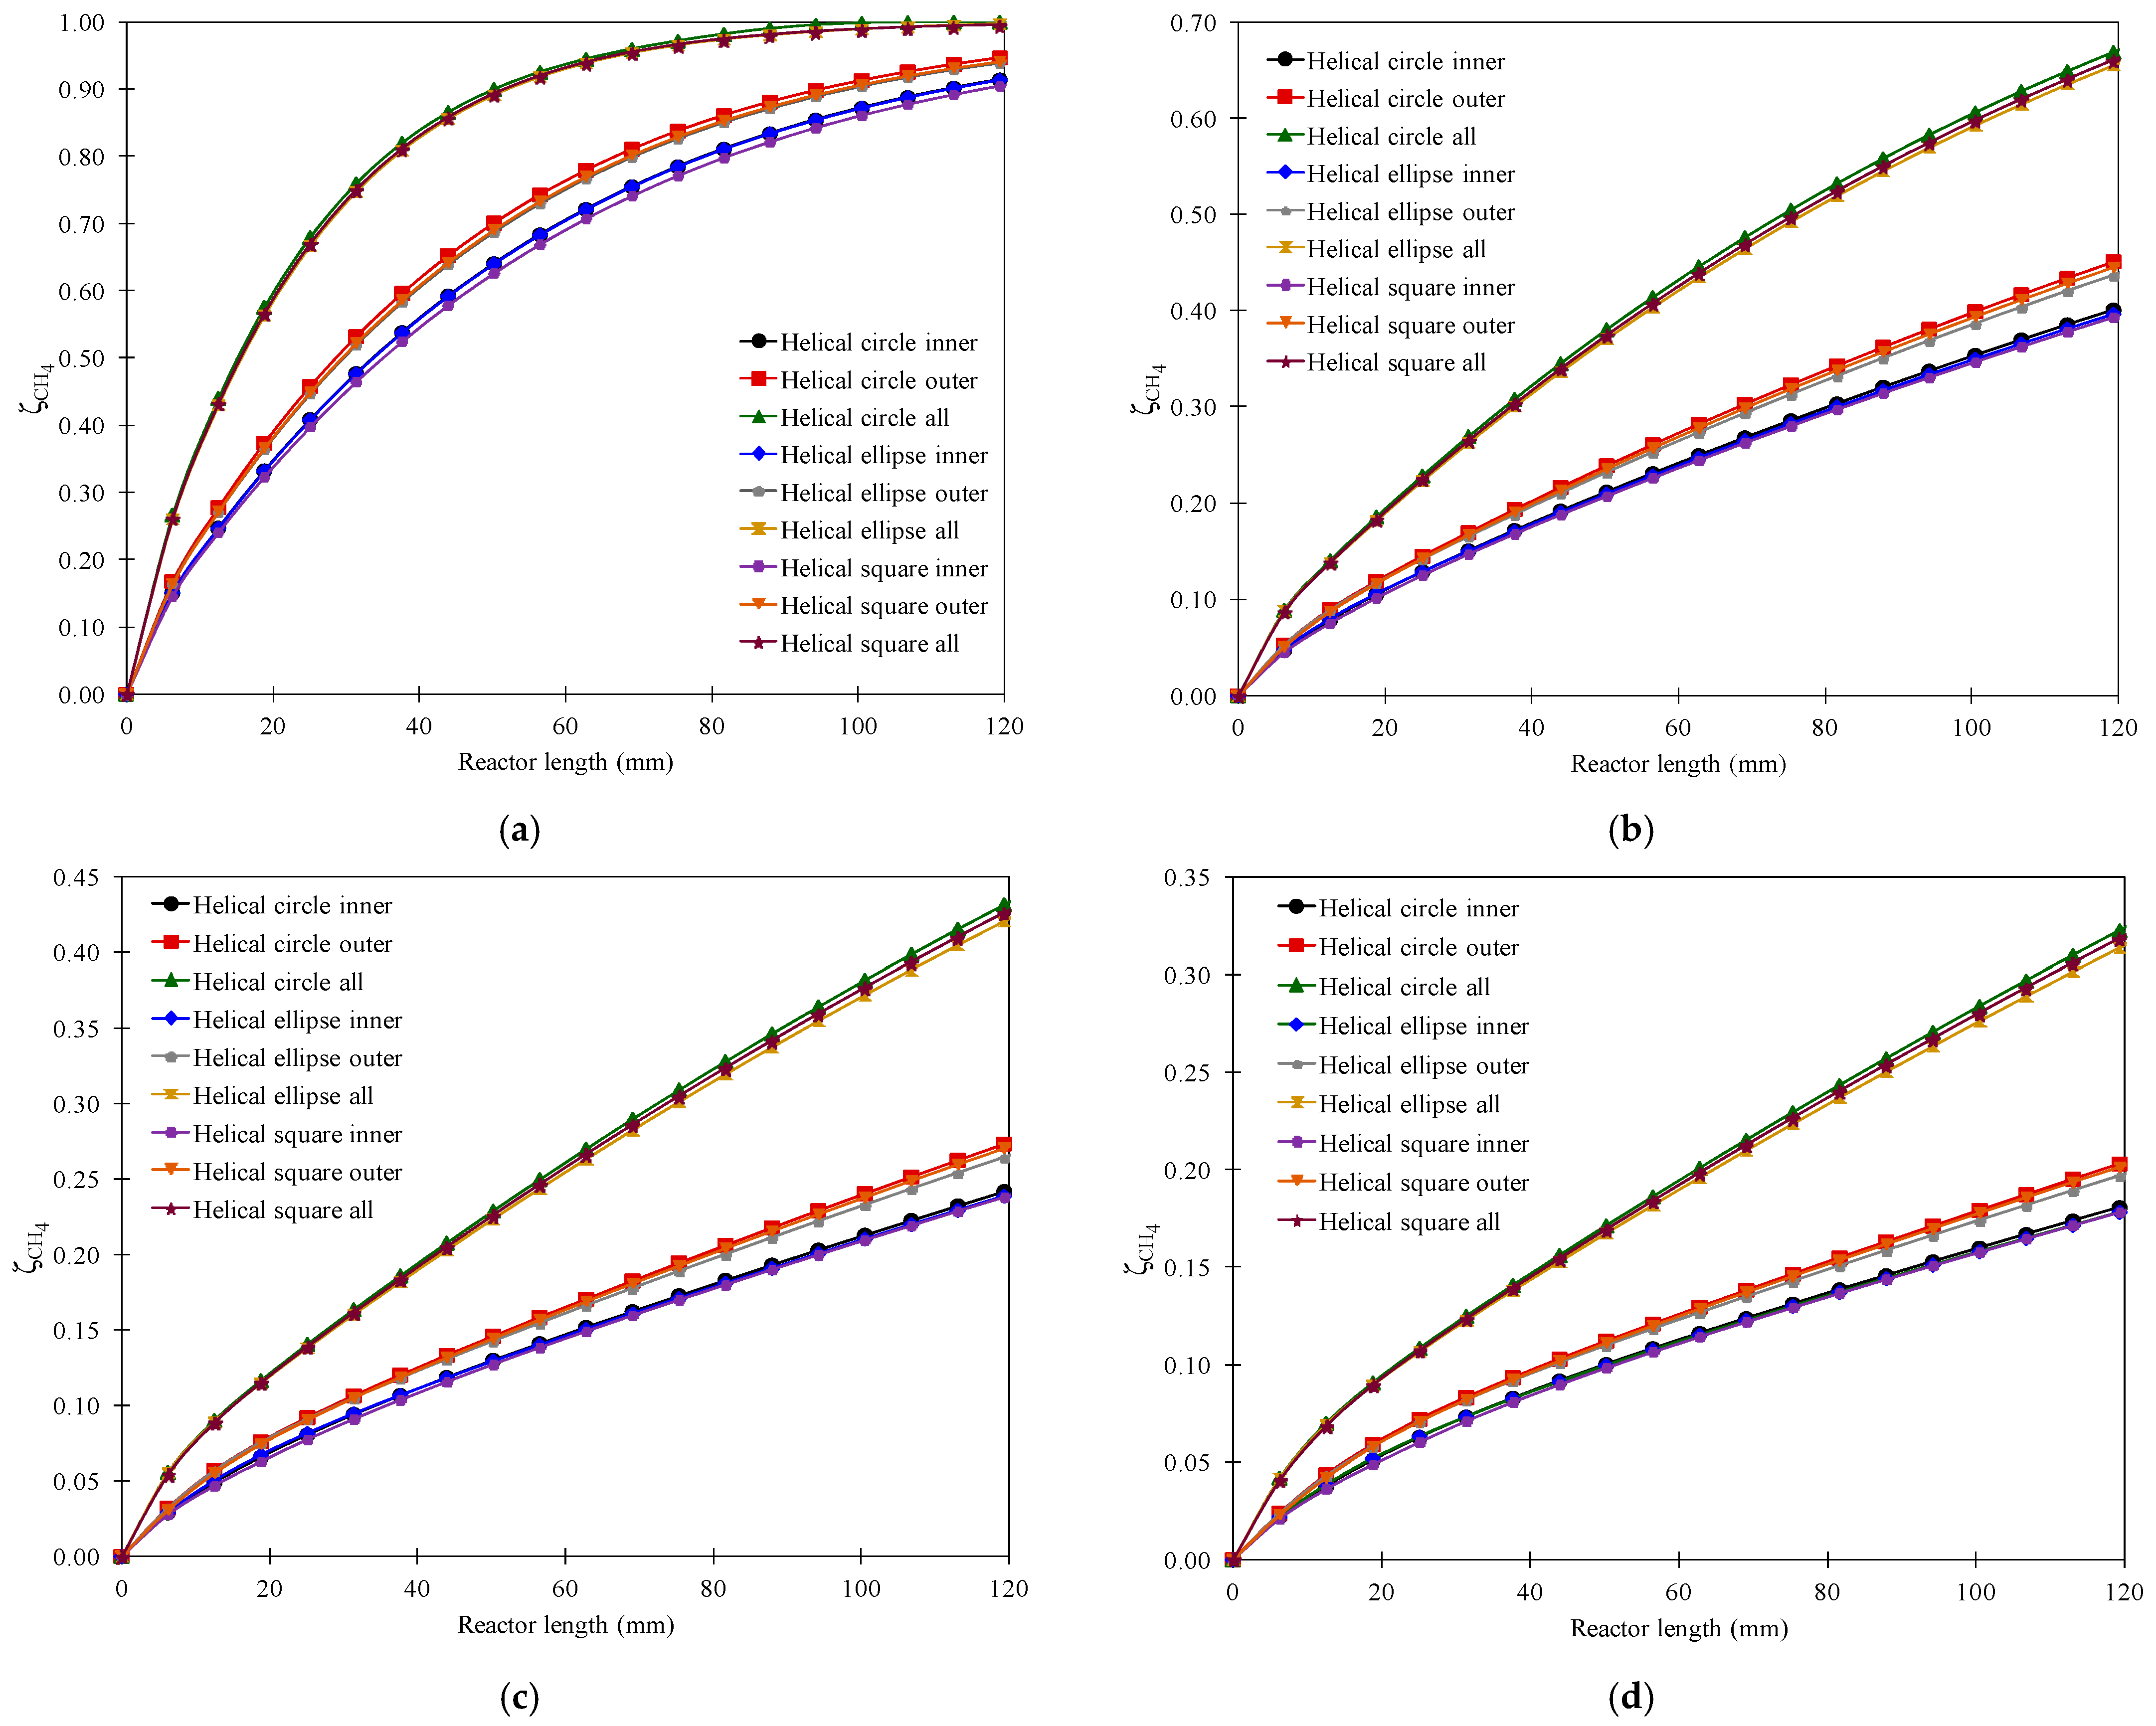
3.5. Effect of Channel Length
3.6. Overall Performance
4. Conclusions
Author Contributions
Funding
Acknowledgments
Conflicts of Interest
References
- Kurnia, J.C.; Sasmito, A.P.; Mujumdar, A.S. CFD simulation of methane dispersion and innovative methane management in underground mining faces. Appl. Math. Model. 2014, 38, 3467–3484. [Google Scholar] [CrossRef]
- Yueze, L.; Akhtar, S.; Sasmito, A.P.; Kurnia, J.C. Prediction of air flow, methane, and coal dust dispersion in a room and pillar mining face. Int. J. Min. Sci. Technol. 2017, 27, 657–662. [Google Scholar] [CrossRef]
- Kurnia, J.C.; Sasmito, A.P.; Mujumdar, A.S. Simulation of a novel intermittent ventilation system for underground mines. Tunn. Undergr. Space Technol. 2014, 42, 206–215. [Google Scholar] [CrossRef]
- Wang, Y.; Man, C.; Che, D. Catalytic Combustion of Ventilation Air Methane in a Reverse-Flow Reactor. Energy Fuels 2010, 24, 4841–4848. [Google Scholar] [CrossRef]
- Kurnia, J.C.; Xu, P.; Sasmito, A.P. A novel concept of enhanced gas recovery strategy from ventilation air methane in underground coal mines—A computational investigation. J. Nat. Gas Sci. Eng. 2016, 35, 661–672. [Google Scholar] [CrossRef]
- Jiang, X.; Mira, D.; Cluff, D.L. The combustion mitigation of methane as a non-CO2 greenhouse gas. Prog. Energy Combust. Sci. 2018, 66, 176–199. [Google Scholar] [CrossRef]
- Sabia, P.; Sorrentino, G.; Bozza, P.; Ceriello, G.; Ragucci, R.; de Joannon, M. Fuel and thermal load flexibility of a MILD burner. Proc. Combust. Inst. 2019, 37, 4547–4554. [Google Scholar] [CrossRef]
- Sorrentino, G.; Sabia, P.; de Joannon, M.; Bozza, P.; Ragucci, R. Influence of preheating and thermal power on cyclonic burner characteristics under mild combustion. Fuel 2018, 233, 207–214. [Google Scholar] [CrossRef]
- Doan, N.A.K.; Swaminathan, N. Autoignition and flame propagation in non-premixed MILD combustion. Combust. Flame 2019, 201, 234–243. [Google Scholar] [CrossRef]
- Bai, Y.; Cherkasov, N.; Huband, S.; Walker, D.; Walton, R.I.; Rebrov, E. Highly Selective Continuous Flow Hydrogenation of Cinnamaldehyde to Cinnamyl Alcohol in a Pt/SiO2 Coated Tube Reactor. Catalysts 2018, 8, 58. [Google Scholar] [CrossRef]
- Cherkasov, N.; Bai, Y.; Rebrov, E. Process Intensification of Alkynol Semihydrogenation in a Tube Reactor Coated with a Pd/ZnO Catalyst. Catalysts 2017, 7, 358. [Google Scholar] [CrossRef]
- Yue, J. Multiphase flow processing in microreactors combined with heterogeneous catalysis for efficient and sustainable chemical synthesis. Catal. Today 2018, 308, 3–19. [Google Scholar] [CrossRef]
- Tanimu, A.; Jaenicke, S.; Alhooshani, K. Heterogeneous catalysis in continuous flow microreactors: A review of methods and applications. Chem. Eng. J. 2017, 327, 792–821. [Google Scholar] [CrossRef]
- Setiawan, A.; Friggieri, J.; Kennedy, E.M.; Dlugogorski, B.Z.; Stockenhuber, M. Catalytic combustion of ventilation air methane (VAM)—Long term catalyst stability in the presence of water vapour and mine dust. Catal. Sci. Technol. 2014, 4, 1793–1802. [Google Scholar] [CrossRef]
- Su, S.; Agnew, J. Catalytic combustion of coal mine ventilation air methane. Fuel 2006, 85, 1201–1210. [Google Scholar] [CrossRef]
- Karakurt, I.; Aydin, G.; Aydiner, K. Mine ventilation air methane as a sustainable energy source. Renew. Sustain. Energy Rev. 2011, 15, 1042–1049. [Google Scholar] [CrossRef]
- Marín, P.; Ordóñez, S.; Díez, F.V. Procedures for heat recovery in the catalytic combustion of lean methane–air mixtures in a reverse flow reactor. Chem. Eng. J. 2009, 147, 356–365. [Google Scholar] [CrossRef]
- Cimino, S.; Pirone, R.; Russo, G. Thermal Stability of Perovskite-Based Monolithic Reactors in the Catalytic Combustion of Methane. Ind. Eng. Chem. Res. 2001, 40, 80–85. [Google Scholar] [CrossRef]
- Aubé, F.; Sapoundjiev, H. Mathematical model and numerical simulations of catalytic flow reversal reactors for industrial applications. Comput. Chem. Eng. 2000, 24, 2623–2632. [Google Scholar] [CrossRef]
- Gosiewski, K. Efficiency of heat recovery versus maximum catalyst temperature in a reverse-flow combustion of methane. Chem. Eng. J. 2005, 107, 19–25. [Google Scholar] [CrossRef]
- Lan, B.; Li, Y.-R. Numerical study on thermal oxidation of lean coal mine methane in a thermal flow-reversal reactor. Chem. Eng. J. 2018, 351, 922–929. [Google Scholar] [CrossRef]
- Mei, H.; Li, C.; Liu, H.; Ji, S. Simulation of Catalytic Combustion of Methane in a Monolith Honeycomb Reactor1 1Supported by the National Natural Science Foundation of China (No.20136010 and No.20376005). Chin. J. Chem. Eng. 2006, 14, 56–64. [Google Scholar] [CrossRef]
- Dupont, V.; Zhang, S.-H.; Bentley, R.; Williams, A. Experimental and modelling studies of the catalytic combustion of methane. Fuel 2002, 81, 799–810. [Google Scholar] [CrossRef]
- Schefer, R.W.; Wicksall, D.M.; Agrawal, A.K. Combustion of hydrogen-enriched methane in a lean premixed swirl-stabilized burner. Proc. Combust. Inst. 2002, 29, 843–851. [Google Scholar] [CrossRef]
- Sorrentino, G.; Ceriello, G.; de Joannon, M.; Sabia, P.; Ragucci, R.; van Oijen, J.; Cavaliere, A.; de Goey, L.P.H. Numerical Investigation of Moderate or Intense Low-Oxygen Dilution Combustion in a Cyclonic Burner Using a Flamelet-Generated Manifold Approach. Energy Fuels 2018, 32, 10242–10255. [Google Scholar] [CrossRef]
- Soni, S.; Sharma, L.; Meena, P.; Roy, S.; Nigam, K.D.P. Compact coiled flow inverter for process intensification. Chem. Eng. Sci. 2019, 193, 312–324. [Google Scholar] [CrossRef]
- Akhtar, S.; Khan, M.N.; Kurnia, J.C.; Shamim, T. Investigation of energy conversion and flame stability in a curved micro-combustor for thermo-photovoltaic (TPV) applications. Appl. Energy 2017, 192, 134–145. [Google Scholar] [CrossRef]
- Di Benedetto, A.; Landi, G.; Di Sarli, V.; Barbato, P.S.; Pirone, R.; Russo, G. Methane catalytic combustion under pressure. Catal. Today 2012, 197, 206–213. [Google Scholar] [CrossRef]
- Landi, G.; Di Benedetto, A.; Barbato, P.S.; Russo, G.; Di Sarli, V. Transient behavior of structured LaMnO3 catalyst during methane combustion at high pressure. Chem. Eng. Sci. 2014, 116, 350–358. [Google Scholar] [CrossRef]
- Di Sarli, V.; Barbato, P.S.; Di Benedetto, A.; Landi, G. Start-up behavior of a LaMnO3 partially coated monolithic combustor at high pressure. Catal. Today 2015, 242, 200–210. [Google Scholar] [CrossRef]
- Barbato, P.S.; Di Sarli, V.; Landi, G.; Di Benedetto, A. High pressure methane catalytic combustion over novel partially coated LaMnO3-based monoliths. Chem. Eng. J. 2015, 259, 381–390. [Google Scholar] [CrossRef]
- Di Benedetto, A.; Di Sarli, V.; Russo, G. A novel catalytic-homogenous micro-combustor. Catal. Today 2009, 147, S156–S161. [Google Scholar] [CrossRef]
- Kurnia, J.C.; Sasmito, A.P.; Birgersson, E.; Shamim, T.; Mujumdar, A.S. Evaluation of mass transport performance in heterogeneous gaseous in-plane spiral reactors with various cross-section geometries at fixed cross-section area. Chem. Eng. Process. Process Intensif. 2014, 82, 101–111. [Google Scholar] [CrossRef]
- Kurnia, J.C.; Sasmito, A.P.; Mujumdar, A.S. Potential catalyst savings in heterogeneous gaseous spiral coiled reactor utilizing selective wall coating—A computational study. Comput. Chem. Eng. 2016, 88, 59–72. [Google Scholar] [CrossRef]
- Kurnia, J.C.; Sasmito, A.P.; Shamim, T.; Mujumdar, A.S. Numerical investigation of heat transfer and entropy generation of laminar flow in helical tubes with various cross sections. Appl. Therm. Eng. 2016, 102, 849–860. [Google Scholar] [CrossRef]
- U.S. EPA Ventilation Air Methane (VAM) Utilization Technologies. August 2016. Available online: https://www.epa.gov/sites/production/files/2017-01/documents/vam_technologies-1-2017.pdf.pdf (accessed on 8 March 2019).
- Kaushik, S.C.; Reddy, V.S.; Tyagi, S.K. Energy and exergy analyses of thermal power plants: A review. Renew. Sustain. Energy Rev. 2011, 15, 1857–1872. [Google Scholar] [CrossRef]
- NIST Office NIST Chemistry WebBook. Available online: https://webbook.nist.gov/cgi/cbook.cgi?ID=C74828&Mask=1 (accessed on 8 March 2019).
- Pittam, D.A.; Pilcher, G. Measurements of heats of combustion by flame calorimetry. Part 8.—Methane, ethane, propane, n-butane and 2-methylpropane. J. Chem. Soc. Faraday Trans. 1 Phys. Chem. Condens. Phases 1972, 68, 2224–2229. [Google Scholar] [CrossRef]
- Bond, T.G.; Noguchi, B.A.; Chou, C.-P.; Mongia, R.K.; Chen, J.-Y.; Dibble, R.W. Catalytic oxidation of natural gas over supported platinum: Flow reactor experiments and detailed numberical modeling. Symp. Int. Combust. 1996, 26, 1771–1778. [Google Scholar] [CrossRef]
- Canu, P. Simulation and interpretation of catalytic combustion experimental data. Catal. Today 2001, 64, 239–252. [Google Scholar] [CrossRef]
- Chigier, N.A.; Beér, J.M. Velocity and Static-Pressure Distributions in Swirling Air Jets Issuing from Annular and Divergent Nozzles. J. Basic Eng. 1964, 86, 788–796. [Google Scholar] [CrossRef]
- Sheen, H.J.; Chen, W.J.; Jeng, S.Y.; Huang, T.L. Correlation of swirl number for a radial-type swirl generator. Exp. Therm. Fluid Sci. 1996, 12, 444–451. [Google Scholar] [CrossRef]


| Parameter | Symbol | Value | Unit |
|---|---|---|---|
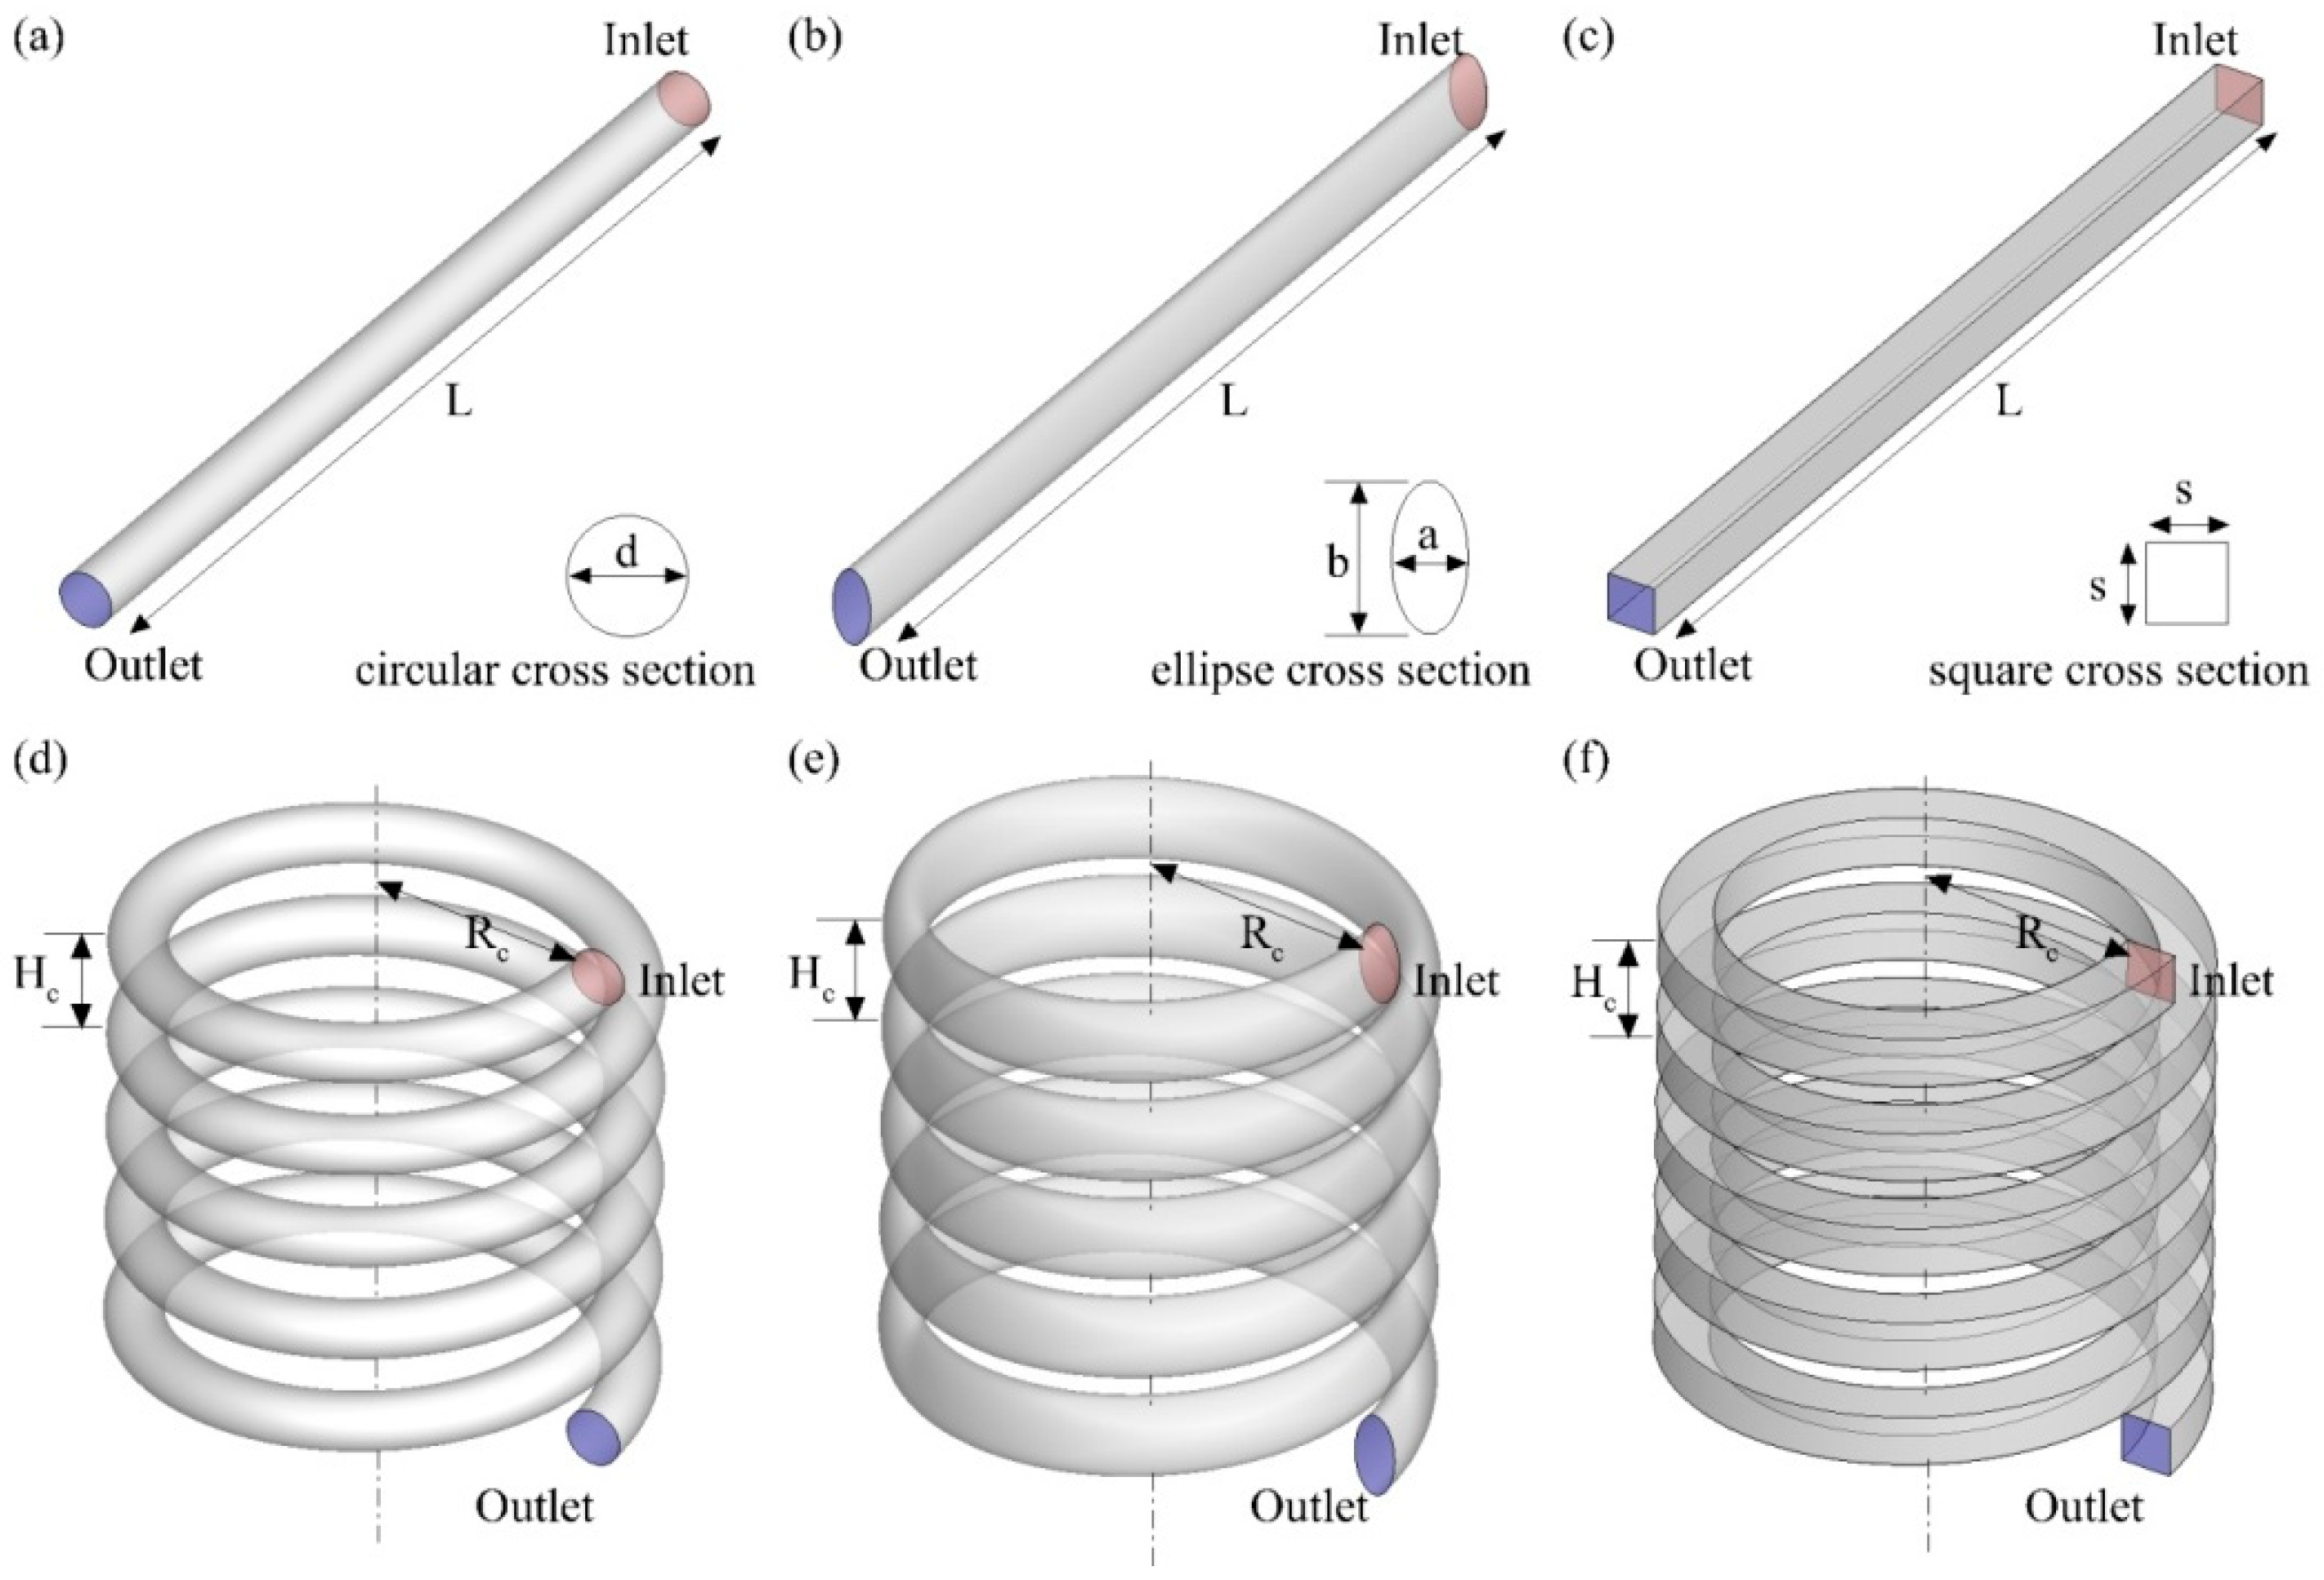
| Diameter of circular cross-section | d | 1.13 × 10⁻³ | m |
| Side of square cross-section | s | 1.00 × 10⁻³ | m |
| Minor axis of ellipse cross-section | a | 7.98 × 10⁻⁴ | m |
| Major axis of ellipse cross-section | b | 1.60 × 10⁻³ | m |
| Pitch/distance between helical turn | h | 2.00 × 10⁻³ | m |
| Helical coil radius | Rc | 4.00 × 10⁻³ | m |
| Total length of reactor | L | 12.58 × 10⁻² | m |
| Platinum coverage on the surface | Pt (s) | 2.71 × 10⁻⁸ | kmol m−2 |
| Inlet velocity | 1.38, 6.88,13.77, 20.65 (square) 1.50, 7.51, 15.03, 22.54 (ellipse) 1.56, 7.78, 15.56, 23.33 (square) | m s−1 | |
| Inlet oxygen mass fraction | 0.23 | - | |
| Inlet methane mass fraction | 0.01 | - | |
| Inlet hydrogen mass fraction | 4.50 × 10⁻² | - | |
| Inlet temperature | 300 | K | |
| Wall temperature | Twall | 1290 | K |
| No. | Reaction | Ar | βr | Er (J/kmol) |
|---|---|---|---|---|
| 1 | H2 + 2Pt(s) → 2H(s) | 4.36 × 10⁷ | 0.5 | 0 |
| 2 | 2H(s) → H2 + 2Pt(s) | 3.70 × 10²⁰ | 0 | 6.74 × 10⁷ |
| 3 | O2 + 2Pt(s) → 2O(s) | 1.80 × 10¹⁷ | −0.5 | 0 |
| 4 | O2 + 2Pt(s) → 2O(s) | 2.01 × 10¹⁴ | 0.5 | 0 |
| 5 | 2O(s) → O2 + 2Pt(s) | 3.70 × 10²⁰ | 0 | 2.13 × 10⁸ |
| 6 | H2O + Pt(s) → H2O(s) | 2.37 × 10⁸ | 0.5 | 0 |
| 7 | H2O(s) → H2O + Pt(s) | 1.00 × 10¹³ | 0 | 4.03 × 10⁷ |
| 8 | OH + Pt(s) → OH(s) | 3.25 × 10⁸ | 0.5 | 0 |
| 9 | OH(s) → OH + Pt(s) | 1.00 × 10¹³ | 0 | 1.93 × 10⁸ |
| 10 | H(s) + O(s) → OH(s) + Pt(s) | 3.70 × 10²⁰ | 0 | 1.15 × 10⁷ |
| 11 | H(s) + OH(s) → H2O(s) + Pt(s) | 3.70 × 10²⁰ | 0 | 1.74 × 10⁷ |
| 12 | OH(s) + OH(s) → H2O(s) + O(s) | 3.70 × 10²⁰ | 0 | 4.82 × 10⁷ |
| 13 | CO + Pt(s) → CO(s) | 7.85 × 10¹⁵ | 0.5 | 0 |
| 14 | CO(s) → CO + Pt(s) | 1.00 × 10¹³ | 0 | 1.25 × 10⁸ |
| 15 | CO2(s) → CO2 + Pt(s) | 1.00 × 10¹³ | 0 | 2.05 × 10⁷ |
| 16 | CO(s) + O(s) → CO2(s) + Pt(s) | 3.70 × 10²⁰ | 0 | 1.05 × 10⁸ |
| 17 | CH4 + 2Pt(s) → CH3(s) + H(s) | 2.30 × 10¹⁶ | 0.5 | 0 |
| 18 | CH3(s) + Pt(s) → CH2(s) + H(s) | 3.70 × 10²⁰ | 0 | 2 × 10⁷ |
| 19 | CH2(s) + Pt(s) → CH(s) + H(s) | 3.70 × 10²⁰ | 0 | 2 × 10⁷ |
| 20 | CH(s) + Pt(s) → C(s) + H(s) | 3.70 × 10²⁰ | 0 | 2 × 10⁷ |
| 21 | C(s) + O(s) → CO(s) + Pt(s) | 3.70 × 10²⁰ | 0 | 6.28 × 10⁷ |
| 22 | CO(s) + Pt(s) → C(s) + O(s) | 1.00 × 10¹⁷ | 0 | 1.84 × 10⁸ |
| 23 | OH(s) + Pt(s) → H(s) + O(s) | 1.56 × 10¹⁸ | 0 | 1.15 × 10⁷ |
| 24 | H2O(s) + Pt(s) → H(s) + OH(s) | 1.88 × 10¹⁸ | 0 | 1.74 × 10⁷ |
| 25 | H2O(s) + O(s) → OH(s) + OH(s) | 4.45 × 10²⁰ | 0 | 4.82 × 10⁷ |
| Geometry | Reactor Length | |||
|---|---|---|---|---|
| 31 mm | 63 mm | 94 mm | 126 mm | |
| Straight circle | 111.69 | 223.08 | 334.62 | 446.16 |
| Straight ellipse | 121.75 | 243.37 | 365.06 | 486.74 |
| Straight square | 125.86 | 251.36 | 377.04 | 502.72 |
| Helical circle inner | 50.84 | 101.68 | 152.53 | 203.37 |
| Helical circle outer | 60.85 | 121.70 | 182.55 | 243.40 |
| Helical circle all | 111.69 | 223.38 | 335.08 | 446.77 |
| Helical ellipse inner | 56.59 | 113.19 | 169.78 | 226.37 |
| Helical ellipse outer | 65.16 | 130.32 | 195.48 | 260.64 |
| Helical ellipse all | 121.75 | 243.50 | 365.25 | 487.01 |
| Helical square inner | 57.05 | 114.09 | 171.14 | 228.18 |
| Helical square outer | 68.82 | 137.63 | 206.45 | 275.27 |
| Helical square all | 125.86 | 251.73 | 377.59 | 503.45 |
| Total Mesh | Straight Tube | Helical Coil Tube | ||
|---|---|---|---|---|
| Pressure Drop (Pa) | Methane Consumption | Pressure Drop (Pa) | Methane Consumption | |
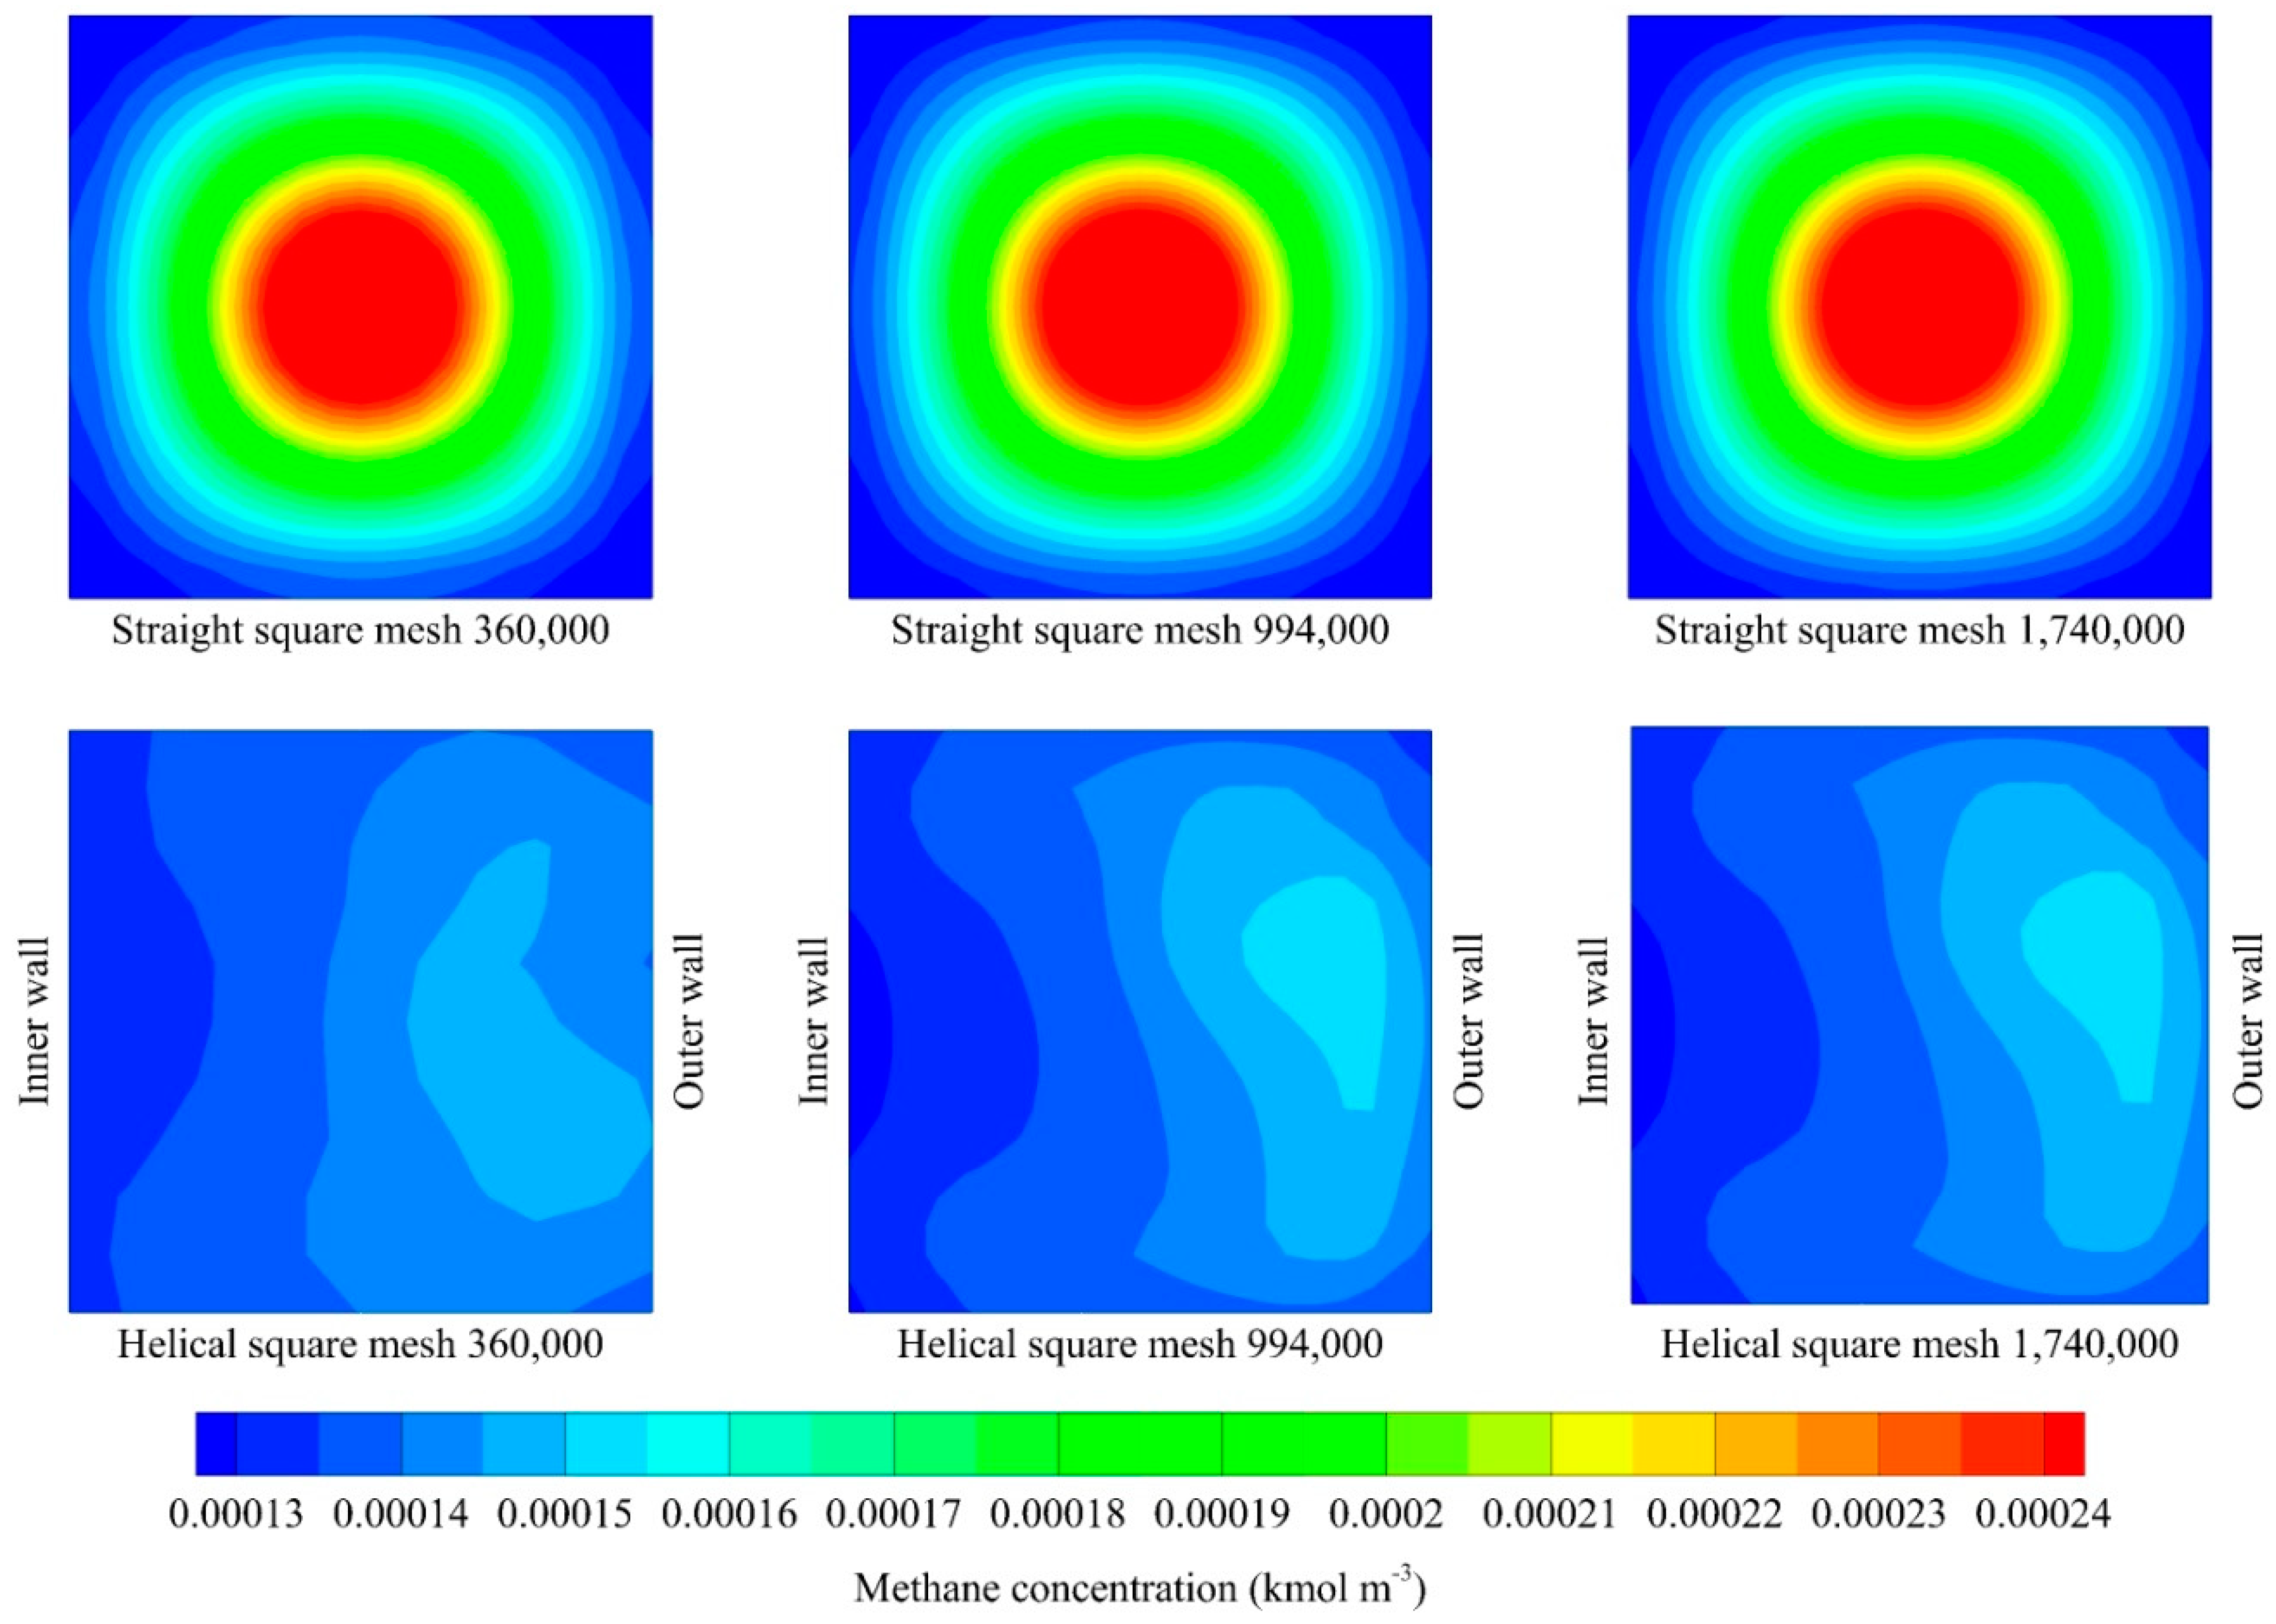
| 80,000 | 5190.42 | 0.40 | 11,682.55 | 0.44 |
| 160,000 | 5173.41 | 0.40 | 11,682.55 | 0.44 |
| 360,000 | 5221.76 | 0.40 | 11,636.86 | 0.44 |
| 720,000 | 5221.21 | 0.40 | 11,594.56 | 0.44 |
| 994,000 | 5221.36 | 0.40 | 11,543.44 | 0.44 |
| 1,280,000 | 5220.97 | 0.40 | 11,543.23 | 0.44 |
| 1,740,000 | 5220.56 | 0.40 | 11,542.98 | 0.44 |
| Geometry | Reactor 31 mm | Reactor 63 mm | ||||||
|---|---|---|---|---|---|---|---|---|
| Re 100 | Re 500 | Re 1000 | Re 1500 | Re 100 | Re 500 | Re 1000 | Re 1500 | |
| Straight circle | 0.21 | 0.36 | 0.45 | 0.51 | 0.27 | 0.60 | 0.73 | 0.82 |
| Straight ellipse | 0.23 | 0.40 | 0.49 | 0.56 | 0.30 | 0.65 | 0.79 | 0.89 |
| Straight square | 0.24 | 0.41 | 0.50 | 0.57 | 0.31 | 0.67 | 0.81 | 0.92 |
| Helical circle inner | 0.14 | 0.23 | 0.28 | 0.33 | 0.22 | 0.37 | 0.45 | 0.52 |
| Helical circle outer | 0.16 | 0.25 | 0.32 | 0.37 | 0.23 | 0.42 | 0.51 | 0.58 |
| Helical circle all | 0.23 | 0.40 | 0.49 | 0.56 | 0.28 | 0.67 | 0.81 | 0.90 |
| Helical ellipse inner | 0.16 | 0.24 | 0.31 | 0.36 | 0.24 | 0.40 | 0.49 | 0.56 |
| Helical ellipse outer | 0.17 | 0.27 | 0.34 | 0.40 | 0.25 | 0.45 | 0.54 | 0.62 |
| Helical ellipse all | 0.24 | 0.43 | 0.52 | 0.60 | 0.31 | 0.71 | 0.86 | 0.96 |
| Helical square inner | 0.16 | 0.25 | 0.31 | 0.36 | 0.24 | 0.41 | 0.50 | 0.58 |
| Helical square outer | 0.18 | 0.28 | 0.35 | 0.41 | 0.26 | 0.47 | 0.57 | 0.65 |
| Helical square all | 0.25 | 0.45 | 0.55 | 0.63 | 0.32 | 0.74 | 0.90 | 1.01 |
| Geometry | Reactor 94 mm | Reactor 126 mm | ||||||
| Re 100 | Re 500 | Re 1000 | Re 1500 | Re 100 | Re 500 | Re 1000 | Re 1500 | |
| Straight circle | 0.29 | 0.79 | 0.97 | 1.09 | 0.30 | 0.94 | 1.20 | 1.34 |
| Straight ellipse | 0.32 | 0.86 | 1.06 | 1.19 | 0.32 | 1.03 | 1.31 | 1.47 |
| Straight square | 0.33 | 0.89 | 1.09 | 1.22 | 0.34 | 1.06 | 1.34 | 1.51 |
| Helical circle inner | 0.26 | 0.50 | 0.61 | 0.69 | 0.28 | 0.62 | 0.75 | 0.84 |
| Helical circle outer | 0.27 | 0.57 | 0.68 | 0.77 | 0.29 | 0.70 | 0.85 | 0.95 |
| Helical circle all | 0.30 | 0.87 | 1.09 | 1.21 | 0.30 | 1.03 | 1.34 | 1.50 |
| Helical ellipse inner | 0.28 | 0.54 | 0.65 | 0.74 | 0.30 | 0.67 | 0.81 | 0.91 |
| Helical ellipse outer | 0.29 | 0.60 | 0.72 | 0.81 | 0.31 | 0.74 | 0.90 | 1.00 |
| Helical ellipse all | 0.32 | 0.93 | 1.16 | 1.29 | 0.33 | 1.10 | 1.42 | 1.59 |
| Helical square inner | 0.28 | 0.56 | 0.67 | 0.76 | 0.31 | 0.69 | 0.83 | 0.94 |
| Helical square outer | 0.30 | 0.63 | 0.77 | 0.86 | 0.32 | 0.78 | 0.95 | 1.06 |
| Helical square all | 0.33 | 0.97 | 1.21 | 1.35 | 0.34 | 1.15 | 1.49 | 1.68 |
| Geometry | Reactor 31 mm | Reactor 63 mm | ||||||
|---|---|---|---|---|---|---|---|---|
| Re 100 | Re 500 | Re 1000 | Re 1500 | Re 100 | Re 500 | Re 1000 | Re 1500 | |
| Straight circle | 0.15 | 5.08 | 23.78 | 58.57 | 0.29 | 8.66 | 40.33 | 99.47 |
| Straight ellipse | 0.22 | 7.25 | 33.91 | 83.54 | 0.42 | 12.50 | 57.64 | 141.99 |
| Straight square | 0.22 | 7.36 | 34.34 | 84.60 | 0.41 | 12.58 | 58.54 | 144.12 |
| Helical circle inner | 0.18 | 6.34 | 32.08 | 83.92 | 0.36 | 13.40 | 68.86 | 181.16 |
| Helical circle outer | 0.18 | 6.78 | 34.73 | 91.99 | 0.36 | 13.92 | 72.26 | 191.86 |
| Helical circle all | 0.20 | 7.81 | 41.16 | 109.98 | 0.38 | 14.99 | 79.11 | 211.62 |
| Helical ellipse inner | 0.24 | 8.06 | 39.89 | 100.87 | 0.48 | 16.74 | 83.80 | 215.78 |
| Helical ellipse outer | 0.24 | 8.49 | 41.80 | 110.28 | 0.49 | 17.24 | 87.34 | 227.95 |
| Helical ellipse all | 0.26 | 9.86 | 51.53 | 137.52 | 0.51 | 18.65 | 98.68 | 263.26 |
| Helical square inner | 0.25 | 8.96 | 45.26 | 118.11 | 0.51 | 19.37 | 97.98 | 260.38 |
| Helical square outer | 0.25 | 9.89 | 52.12 | 137.39 | 0.52 | 20.23 | 108.93 | 285.22 |
| Helical square all | 0.28 | 11.59 | 61.47 | 162.61 | 0.54 | 22.03 | 116.56 | 313.94 |
| Geometry | Reactor 94 mm | Reactor 126 mm | ||||||
| Re 100 | Re 500 | Re 1000 | Re 1500 | Re 100 | Re 500 | Re 1000 | Re 1500 | |
| Straight circle | 0.42 | 12.04 | 55.03 | 135.63 | 0.55 | 15.39 | 68.97 | 169.12 |
| Straight ellipse | 0.62 | 17.52 | 79.11 | 194.03 | 0.82 | 22.51 | 99.68 | 242.81 |
| Straight square | 0.60 | 17.46 | 80.03 | 197.06 | 0.80 | 22.29 | 100.28 | 246.04 |
| Helical circle inner | 0.54 | 20.56 | 106.49 | 281.14 | 0.73 | 27.85 | 145.34 | 385.47 |
| Helical circle outer | 0.55 | 21.09 | 110.07 | 292.66 | 0.73 | 28.39 | 148.96 | 397.24 |
| Helical circle all | 0.56 | 22.16 | 116.95 | 312.60 | 0.74 | 29.46 | 155.84 | 417.20 |
| Helical ellipse inner | 0.72 | 25.52 | 128.72 | 337.60 | 0.97 | 34.41 | 174.88 | 461.52 |
| Helical ellipse outer | 0.73 | 26.02 | 132.44 | 349.02 | 0.97 | 34.92 | 178.65 | 475.26 |
| Helical ellipse all | 0.75 | 27.44 | 145.64 | 388.09 | 0.99 | 36.34 | 193.58 | 515.40 |
| Helical square inner | 0.77 | 29.84 | 151.74 | 408.53 | 1.04 | 40.35 | 207.47 | 563.96 |
| Helical square outer | 0.78 | 30.64 | 163.31 | 434.95 | 1.04 | 41.22 | 219.15 | 590.81 |
| Helical square all | 0.81 | 32.48 | 170.90 | 463.43 | 1.07 | 43.10 | 226.72 | 619.15 |
| Geometry | Reactor 31 mm | Reactor 63 mm | ||||||
|---|---|---|---|---|---|---|---|---|
| Re 100 | Re 500 | Re 1000 | Re 1500 | Re 100 | Re 500 | Re 1000 | Re 1500 | |
| Straight circle | 3.60 | 6.08 | 7.19 | 7.66 | 2.33 | 5.02 | 5.82 | 6.09 |
| Straight ellipse | 3.61 | 6.06 | 7.09 | 7.44 | 2.33 | 5.00 | 5.72 | 5.84 |
| Straight square | 3.59 | 6.03 | 7.04 | 7.30 | 2.33 | 4.97 | 5.70 | 5.82 |
| Helical circle inner | 5.31 | 8.16 | 9.29 | 9.11 | 4.01 | 6.70 | 7.17 | 6.32 |
| Helical circle outer | 4.94 | 7.68 | 8.83 | 8.75 | 3.62 | 6.35 | 6.81 | 6.06 |
| Helical circle all | 3.85 | 6.69 | 7.59 | 7.63 | 2.39 | 5.52 | 6.17 | 5.84 |
| Helical ellipse inner | 5.20 | 7.92 | 8.99 | 8.63 | 3.93 | 6.47 | 6.82 | 5.83 |
| Helical ellipse outer | 4.93 | 7.60 | 8.74 | 8.43 | 3.63 | 6.23 | 6.61 | 5.69 |
| Helical ellipse all | 3.79 | 6.51 | 7.33 | 7.20 | 2.38 | 5.37 | 5.91 | 5.41 |
| Helical square inner | 5.20 | 7.93 | 8.68 | 8.01 | 3.96 | 6.52 | 6.72 | 5.28 |
| Helical square outer | 4.84 | 7.47 | 8.31 | 7.64 | 3.57 | 6.18 | 6.34 | 5.02 |
| Helical square all | 3.81 | 6.57 | 7.29 | 6.98 | 2.38 | 5.42 | 5.90 | 5.21 |
| Geometry | Reactor 94 mm | Reactor 126 mm | ||||||
| Re 100 | Re 500 | Re 1000 | Re 1500 | Re 100 | Re 500 | Re 1000 | Re 1500 | |
| Straight circle | 1.66 | 4.41 | 5.21 | 5.40 | 1.27 | 3.94 | 4.80 | 4.98 |
| Straight ellipse | 1.65 | 4.39 | 5.11 | 5.17 | 1.26 | 3.92 | 4.71 | 4.76 |
| Straight square | 1.65 | 4.37 | 5.09 | 5.15 | 1.26 | 3.90 | 4.69 | 4.74 |
| Helical circle inner | 3.16 | 6.01 | 6.22 | 5.02 | 2.57 | 5.53 | 5.64 | 4.23 |
| Helical circle outer | 2.78 | 5.69 | 5.97 | 4.93 | 2.22 | 5.21 | 5.45 | 4.26 |
| Helical circle all | 1.68 | 4.79 | 5.49 | 5.09 | 1.26 | 4.23 | 5.01 | 4.59 |
| Helical ellipse inner | 3.10 | 5.79 | 5.87 | 4.49 | 2.52 | 5.33 | 5.31 | 3.72 |
| Helical ellipse outer | 2.81 | 5.58 | 5.74 | 4.51 | 2.24 | 5.11 | 5.22 | 3.81 |
| Helical ellipse all | 1.66 | 4.67 | 5.25 | 4.67 | 1.26 | 4.13 | 4.78 | 4.20 |
| Helical square inner | 3.14 | 5.84 | 5.78 | 3.93 | 2.56 | 5.38 | 5.20 | 3.09 |
| Helical square outer | 2.75 | 5.53 | 5.52 | 3.89 | 2.20 | 5.07 | 5.02 | 3.21 |
| Helical square all | 1.67 | 4.71 | 5.24 | 4.47 | 1.26 | 4.16 | 4.76 | 3.98 |
© 2019 by the authors. Licensee MDPI, Basel, Switzerland. This article is an open access article distributed under the terms and conditions of the Creative Commons Attribution (CC BY) license (http://creativecommons.org/licenses/by/4.0/).
Share and Cite
Kurnia, J.C.; Chaedir, B.A.; Lim, D.C.; Chen, L.; Jiang, L.; Sasmito, A.P. Numerical Evaluation of Potential Catalyst Savings for Ventilation Air Methane Catalytic Combustion in Helical Coil Reactors with Selective Wall Coating. Catalysts 2019, 9, 380. https://doi.org/10.3390/catal9040380
Kurnia JC, Chaedir BA, Lim DC, Chen L, Jiang L, Sasmito AP. Numerical Evaluation of Potential Catalyst Savings for Ventilation Air Methane Catalytic Combustion in Helical Coil Reactors with Selective Wall Coating. Catalysts. 2019; 9(4):380. https://doi.org/10.3390/catal9040380
Chicago/Turabian StyleKurnia, Jundika C., Benitta A. Chaedir, Desmond C. Lim, Lianjun Chen, Lishuai Jiang, and Agus P. Sasmito. 2019. "Numerical Evaluation of Potential Catalyst Savings for Ventilation Air Methane Catalytic Combustion in Helical Coil Reactors with Selective Wall Coating" Catalysts 9, no. 4: 380. https://doi.org/10.3390/catal9040380
APA StyleKurnia, J. C., Chaedir, B. A., Lim, D. C., Chen, L., Jiang, L., & Sasmito, A. P. (2019). Numerical Evaluation of Potential Catalyst Savings for Ventilation Air Methane Catalytic Combustion in Helical Coil Reactors with Selective Wall Coating. Catalysts, 9(4), 380. https://doi.org/10.3390/catal9040380