Article

Experimental Design and Optimization of Triclosan and 2.8-Diclorodibenzeno-p-dioxina Degradation by the Fe/Nb2O5/UV System

1
Departamento de Engenharia Química, Universidade Tecnológica Federal do Paraná, Av Monteiro Lobato, s/n—Km 04, Ponta Grossa, PR 84016-210, Brazil
2
Departamento de Engenharia Química, Universidade Estadual de Maringá, Avenida Colombo, 5790, Maringá, PR 87020-900, Brazil
3
Departamento de Química, Universidade Federal de Santa Catarina, Campus Reitor João David Ferreira Lima, R. Eng. Agronômico Andrei Cristian Ferreira, s/n, Florianópolis, SC 88040-900, Brasil
4
Departamento de Química, Universidade Tecnológica Federal do Paraná, Via do Conhecimento, s/n—Km 01, Pato Branco, PR 85503-390, Brazil
5
Departamento Acadêmico de Física, Universidade Tecnológica Federal do Paraná, Av Monteiro Lobato, s/n—Km 04, Ponta Grossa, PR 84016-210, Brazil
*
Author to whom correspondence should be addressed.
Catalysts 2019, 9(4), 343; https://doi.org/10.3390/catal9040343
Submission received: 11 February 2019 / Revised: 18 March 2019 / Accepted: 27 March 2019 / Published: 8 April 2019

Abstract

:
This study describes the experimental design and optimization of the photocatalytic reaction using the immobilized catalyst Fe/Nb2O5 in the degradation of Triclosan and 2.8-DCDD. The techniques employed to characterize the photocatalysts were: specific surface area, average pore volume, average pore diameter, photo-acoustic spectroscopy (PAS), X-ray diffraction (XRD), and scanning electron microscopy (SEM/EDS). The reaction parameters studied were pH, catalyst concentration, catalyst calcination temperature, and nominal metallic charge. The results indicated that the immobilized Fe/Nb2O5 catalysts were efficient in the degradation of Triclosan and 2.8-dichlorodibenzene-p-dioxin. The catalysts with nominal metal loading of 1.5% Fe calcined at 873 K showed the highest constant reaction rate and the lowest half-life 0.069 min−1 and 10.04 min. Tests in different matrices indicated that the photocatalytic reaction using aqueous solution containing Cl is faster when compared with the ultrapure water matrix.

1. Introduction

The chemical compounds progressive use, coupled with the low efficiency of effluent collection and treatment systems, have contributed to the significant increase in contaminants of emerging concern found in surface waters. This was considered to be of low risk to the environment, and these contaminants were detected only a few years ago.
Among the contaminants of emerging concern is the Triclosan (TCS) and 5-chloro-2-(2,4-dichlorophenoxy)-5-phenol—an antimicrobial agent that is extensively used as a preservative in a variety of consumer products such as toothpaste, antiseptic soaps, detergents, cosmetics, plastic kitchenware, socks, rugs, and toys [1,2,3]. The TCS presence can be harmful to both human and animal health since it tends to undergo bio-magnification and can be degraded by photolysis, which generates by-products of greater toxicity, such as chlorophenols and dioxins [4,5,6]. Among the dioxins that may be formed, 2,8-dichlorodibenzene-p-dioxin (2.8-DCDD) stands out as being a chemically stable compound and it is known to suppress antibody responses. In addition, exposure to radiation, mainly in an environment with free chlorine, favors the reaction of transformation of the TCS in this compound [6,7].
Conventional water treatment methods are ineffective for removing substances with biological activity, such as Triclosan, and extremely stable substances such as dioxins. Therefore, in recent decades, Advanced Oxidation Processes (AOPs) have received attention as an alternative for removing these compounds. They are based on the hydroxyl radicals generation, which has a strong oxidizing character and has the capacity to degrade compounds through oxidation. The formation of free radicals that react with dissolved oxygen is an example of such [8,9].
Many semiconductors have been studied in the heterogeneous photo catalysis in order to degrade pollutants in water bodies (ZnO, CdO, TiO2, Fe2O3, among others). Among these, TiO2 stands out as the most used photo catalyst due to its highly chemical stability, nontoxic, band gap of 3.2 eV for UV radiation (natural/artificial), and relatively low cost [10,11,12,13]. However, since its band gap is 3.2 eV, the highest efficiency of the process is limited by the absorption of the TiO2 semiconductor with a radiation of over 385 nm, which corresponds to approximately 3% of the solar spectrum at sea level.
Thus, the search for new catalysts becomes essential. The use of niobium pentoxide (Nb2O5) as a semiconductor for application in heterogeneous photocatalysis has few literature references. This compound has chemical characteristics of low toxicity and band gap (3.4 eV), which is very similar to TiO2 [14,15]. It is a stable semiconductor and insoluble in water, which can be attacked only by concentrated hydrofluoric acid. Compared with vanadium oxide, it is more stable and difficult to reduce. In contrast to titanium oxide, it presents an advantage in some types of photo degradation [16].
Due to the characteristics of the oxide, it has been used in catalytic reactions such as dehydrogenation, alkylation, hydrolysis, and photocatalytic degradation. The study of Nb2O5 shows that it has a combination of energy when in contact with ultraviolet radiation, and, also, when together with another semiconductor, can greatly increase the catalytic activity and the life of a catalyst [16,17].
One of the negative aspects of the photocatalytic process is the difficulty to separate the catalyst after its treatment. In this direction, the material immobilization allows the separation of the catalyst by avoiding the need of a later step in the process and increases the porosity, the adsorption capacity, and thermal stability [18]. On the other hand, a catalytic activity reduction occurs [19,20]. In order to improve the photoreaction efficiency, many authors have metals such as Ag [21], Fe [22], and Cu [23] added to it in order to prevent the process of electron/role recombination in semiconductors.
In this context, this study describes the optimization of the photocatalytic degradation of TCS and 2.8-DCDD using the immobilized Fe/Nb2O5 as the photo-catalyst. It was also analyzed using different parameters such as pH, catalyst concentration, and the catalyst calcination temperature.

2. Results and Discussion

2.1. Catalysts Characterization

2.1.1. Pore Properties (BET Method)

The results of the textural properties for the calcined Fe/Nb2O5 catalysts at different temperatures are shown in Table 1.
A variation of the specific surface area for the studied catalysts ranges from 20.26 to 149.63 m2 g−1. The lowest area obtained for the samples was 0.5% Fe/Nb2O5 calcined at 673 K, and the highest for the sample was 1.0% Fe/Nb2O5 at 773 K. These results indicate the influence of the calcination temperature and the addition of Fe. The 1.0% Fe/Nb2O5 catalysts and 0.5% Fe/Nb2O5 calcined at 773 K and 873K practically obtained the same results of approximately 150 m2 g−1. The catalysts are mesoporous materials (pores of internal width between 20 Å and 50 Å). When comparing the results of the pore diameter, it is possible to verify that the samples did not have significant variations in this property. Regarding the micro-pore volumes, there was considerable variation of 0.00518 cm3 g−1 (1.5% Fe/Nb2O5 calcined at 873 K) and 0.01064 cm3 g−1 (1.7% Fe/Nb2O5 calcined at 773 K). Fontana et al. (2018) [24] profiled a surface area of 1.50 m2 g−1, pore volume of 0.049 cm3 g−1, and pore diameter of 15.60 Å for non-calcined Nb2O5 samples. Nakajima et al. (2011) [25] found that Nb2O5 samples calcined at 573 K had a pore volume of 0.21 cm3 g−1 and a diameter of 18 Å. When compared with the results obtained, it is noted that the surface areas of the immobilized Fe/Nb2O5 catalysts are larger than those of the non-calcined and non-immobilized Nb2O5 catalysts, as well as their pore diameter.

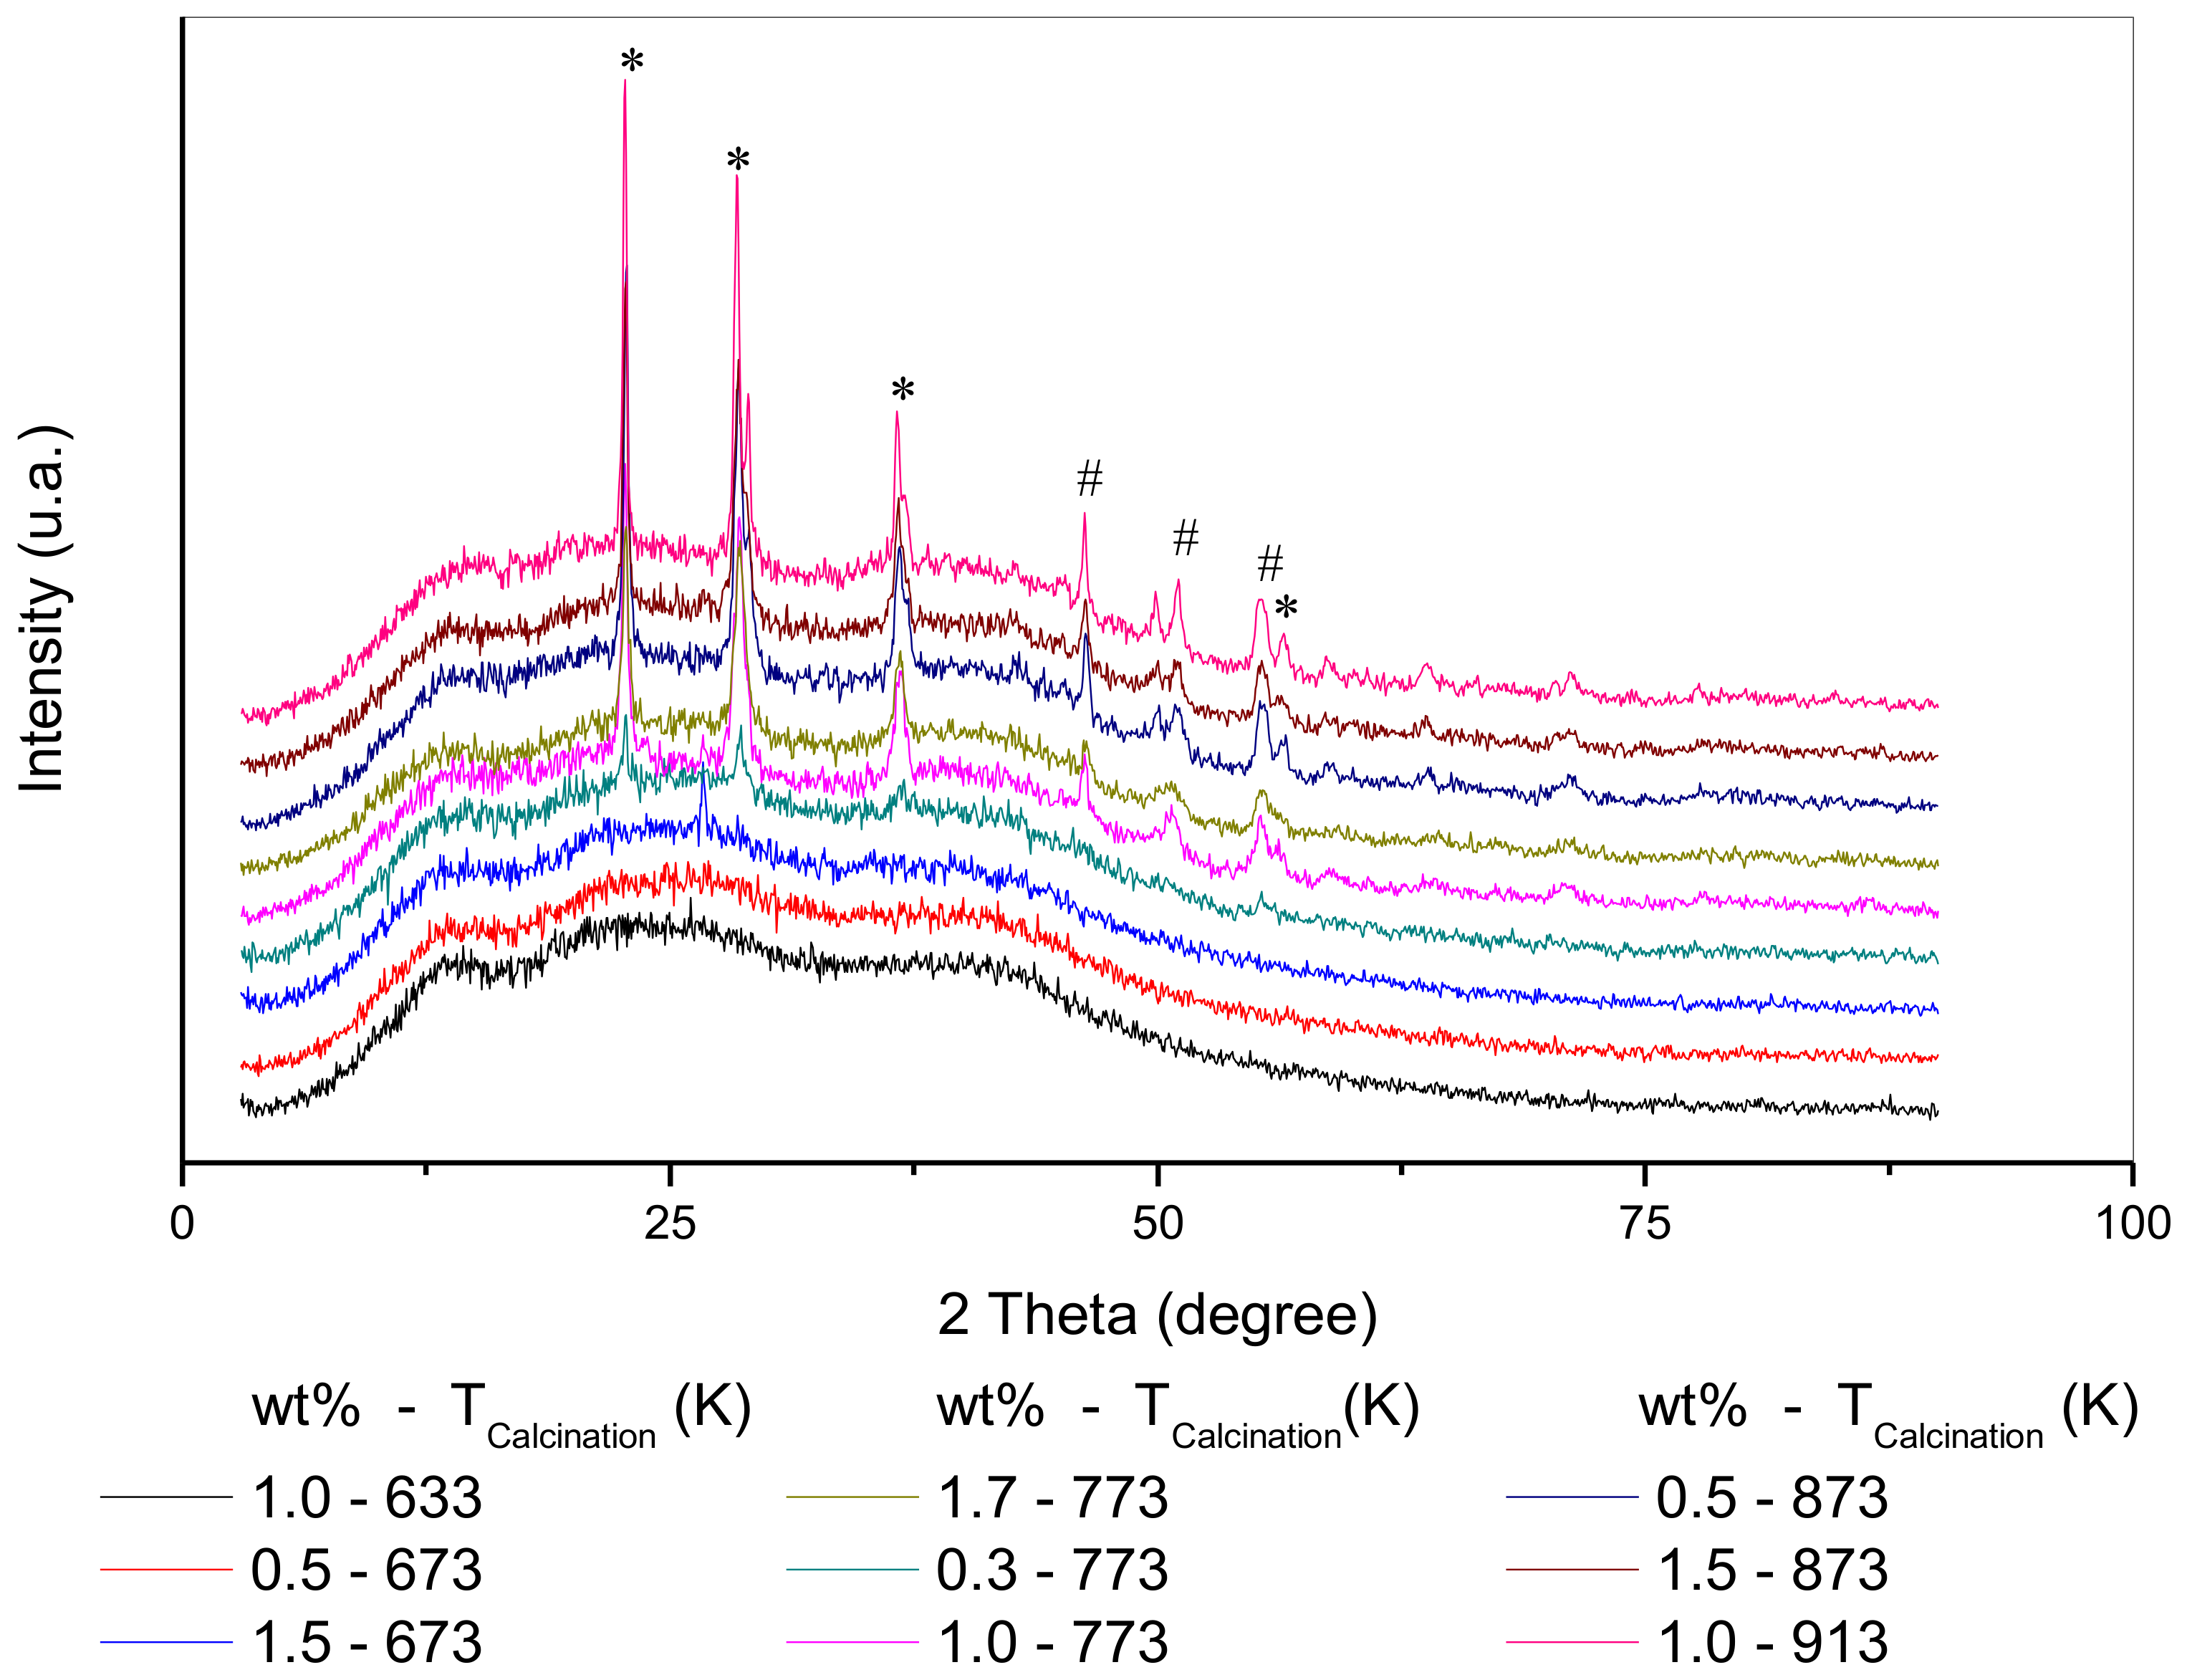
2.1.2. X-ray Diffraction (XRD)

The XRD analysis of the calcined Fe/Nb2O5 immobilized samples are presented in Figure 1. The peaks obtained were compared with the standards published by ICDD (International Center for Diffraction Data).
By analyzing the diffractograms, it is possible to verify that the catalyst 1.0% Fe/Nb2O5, 0.5% Fe/Nb2O5, and 1.5% Fe/Nb2O5 samples calcined at 673K have a non-crystalline (amorphous) structure. Similar results were found for niobium samples at the same catalyst calcination temperatures from research conducted by Morais et al. (2017) [26]. The diffractograms indicate that the TT-Nb2O5 (ICDD00-028-0317) with the cell parameters a = b = 3.6070 Å, c = 3.9250 Å, and T-Nb2O5 (ICDD00-027-1313) forms with the cell parameters a = 6.1680 Å, b = 29.3120 Å, and c = 3.9380 Å were obtained for the catalysts calcined at temperatures higher than 673 K. It was also observed that 1.0% Fe/Nb2O5, 1.7% Fe/Nb2O5 calcined at 773 K and 0.5% Fe/Nb2O5, 1.5% Fe/Nb2O5 calcined at 873 K and 1.0% Fe/Nb2O5 calcined at 913 K showed a semi-crystalline structure, with crystallite sizes of 30, 26, 35, 35, and 40 nm, respectively. The sample 0.3% Fe/Nb2O5 773 K showed a semi-crystalline structure, but it was not possible to calculate the size of the crystallites and to determine a hexagonal shape due to it being very amorphous. Sreethawonget al. (2012) [27] found similar results for Nb2O5 sol-gel samples calcined at 773 K with an orthorhombic form (T) with crystallites of approximate size of 18.5 nm. A result was also found by Liu et. al. (2011) [28] in Nb2O5 samples of an orthorhombic form (T). However, the crystallite sizes were 0.39 nm.

2.1.3. Photoacoustic Spectroscopy (PAS)

The band gap results and the absorption threshold for the Nb2O5 catalysts are shown in Table 2. The values found ranged from 3.05 to 3.94 eV. According to Greenwood and Eranshaw (2003) [29], the band gap of Nb2O5 has a range of 3.1 to 4.0 eV. Analyzing the values obtained in relation to the nominal metallic load of Fe, it was observed that the band gap is likely to decrease with an increase in the Fe quantity. This also happens with samples of iron-doped TiO2 catalysts [30,31]. It obtained the following values for the calcination temperature at 673 K (0.5% Fe-4.75 eV and 1.5% Fe-3.28 eV). It also occurred for the catalysts calcined at 873 K. An approximate value was found for the catalyst 0.3% and 1.0% when calcined at 773 K. It was also found that, when the calcination temperature increases, the band gap tends to increase as well. In particular, this was observed for the catalysts with a low metal nominal loading. On the other hand, Yoshimura et. al. (1996) [32] indicated band gap energies of 3.41 eV for samples of Nb2O5 calcined at 773 K, and 3.45 eV for non-calcined samples. The values found were very similar to those presented by the other authors. The samples 1.0% Fe/Nb2O5 913 K and 0.5% Fe/Nb2O5 873 K showed the highest band gap energy values of 3.94 eV, while 1.5% Fe/Nb2O5 873 K presented the lowest band gap energy values of 3.05 eV. This latter result (3.05 eV) suggests that this catalyst is absorbing in regions closer to the visible region of the electromagnetic spectrum. This means that it requires less energy for electronic transactions to occur. In this context, Weibin et al. (2013) [33] reported a value of 3.70 eV, while Scheidt et al. (2014) [34] presented a band gap energy of 3.61 eV for non-calcined Nb2O5 samples. Other authors such as Hamaguchi, (2011) [35], Prado et. al. (2008) [36], Liu et. al. (2011) [28] and Gallo (2016) [37] found band gap energies for Nb2O5 of 3.61, 3.40, 3.72, and 3.60 eV, respectively.

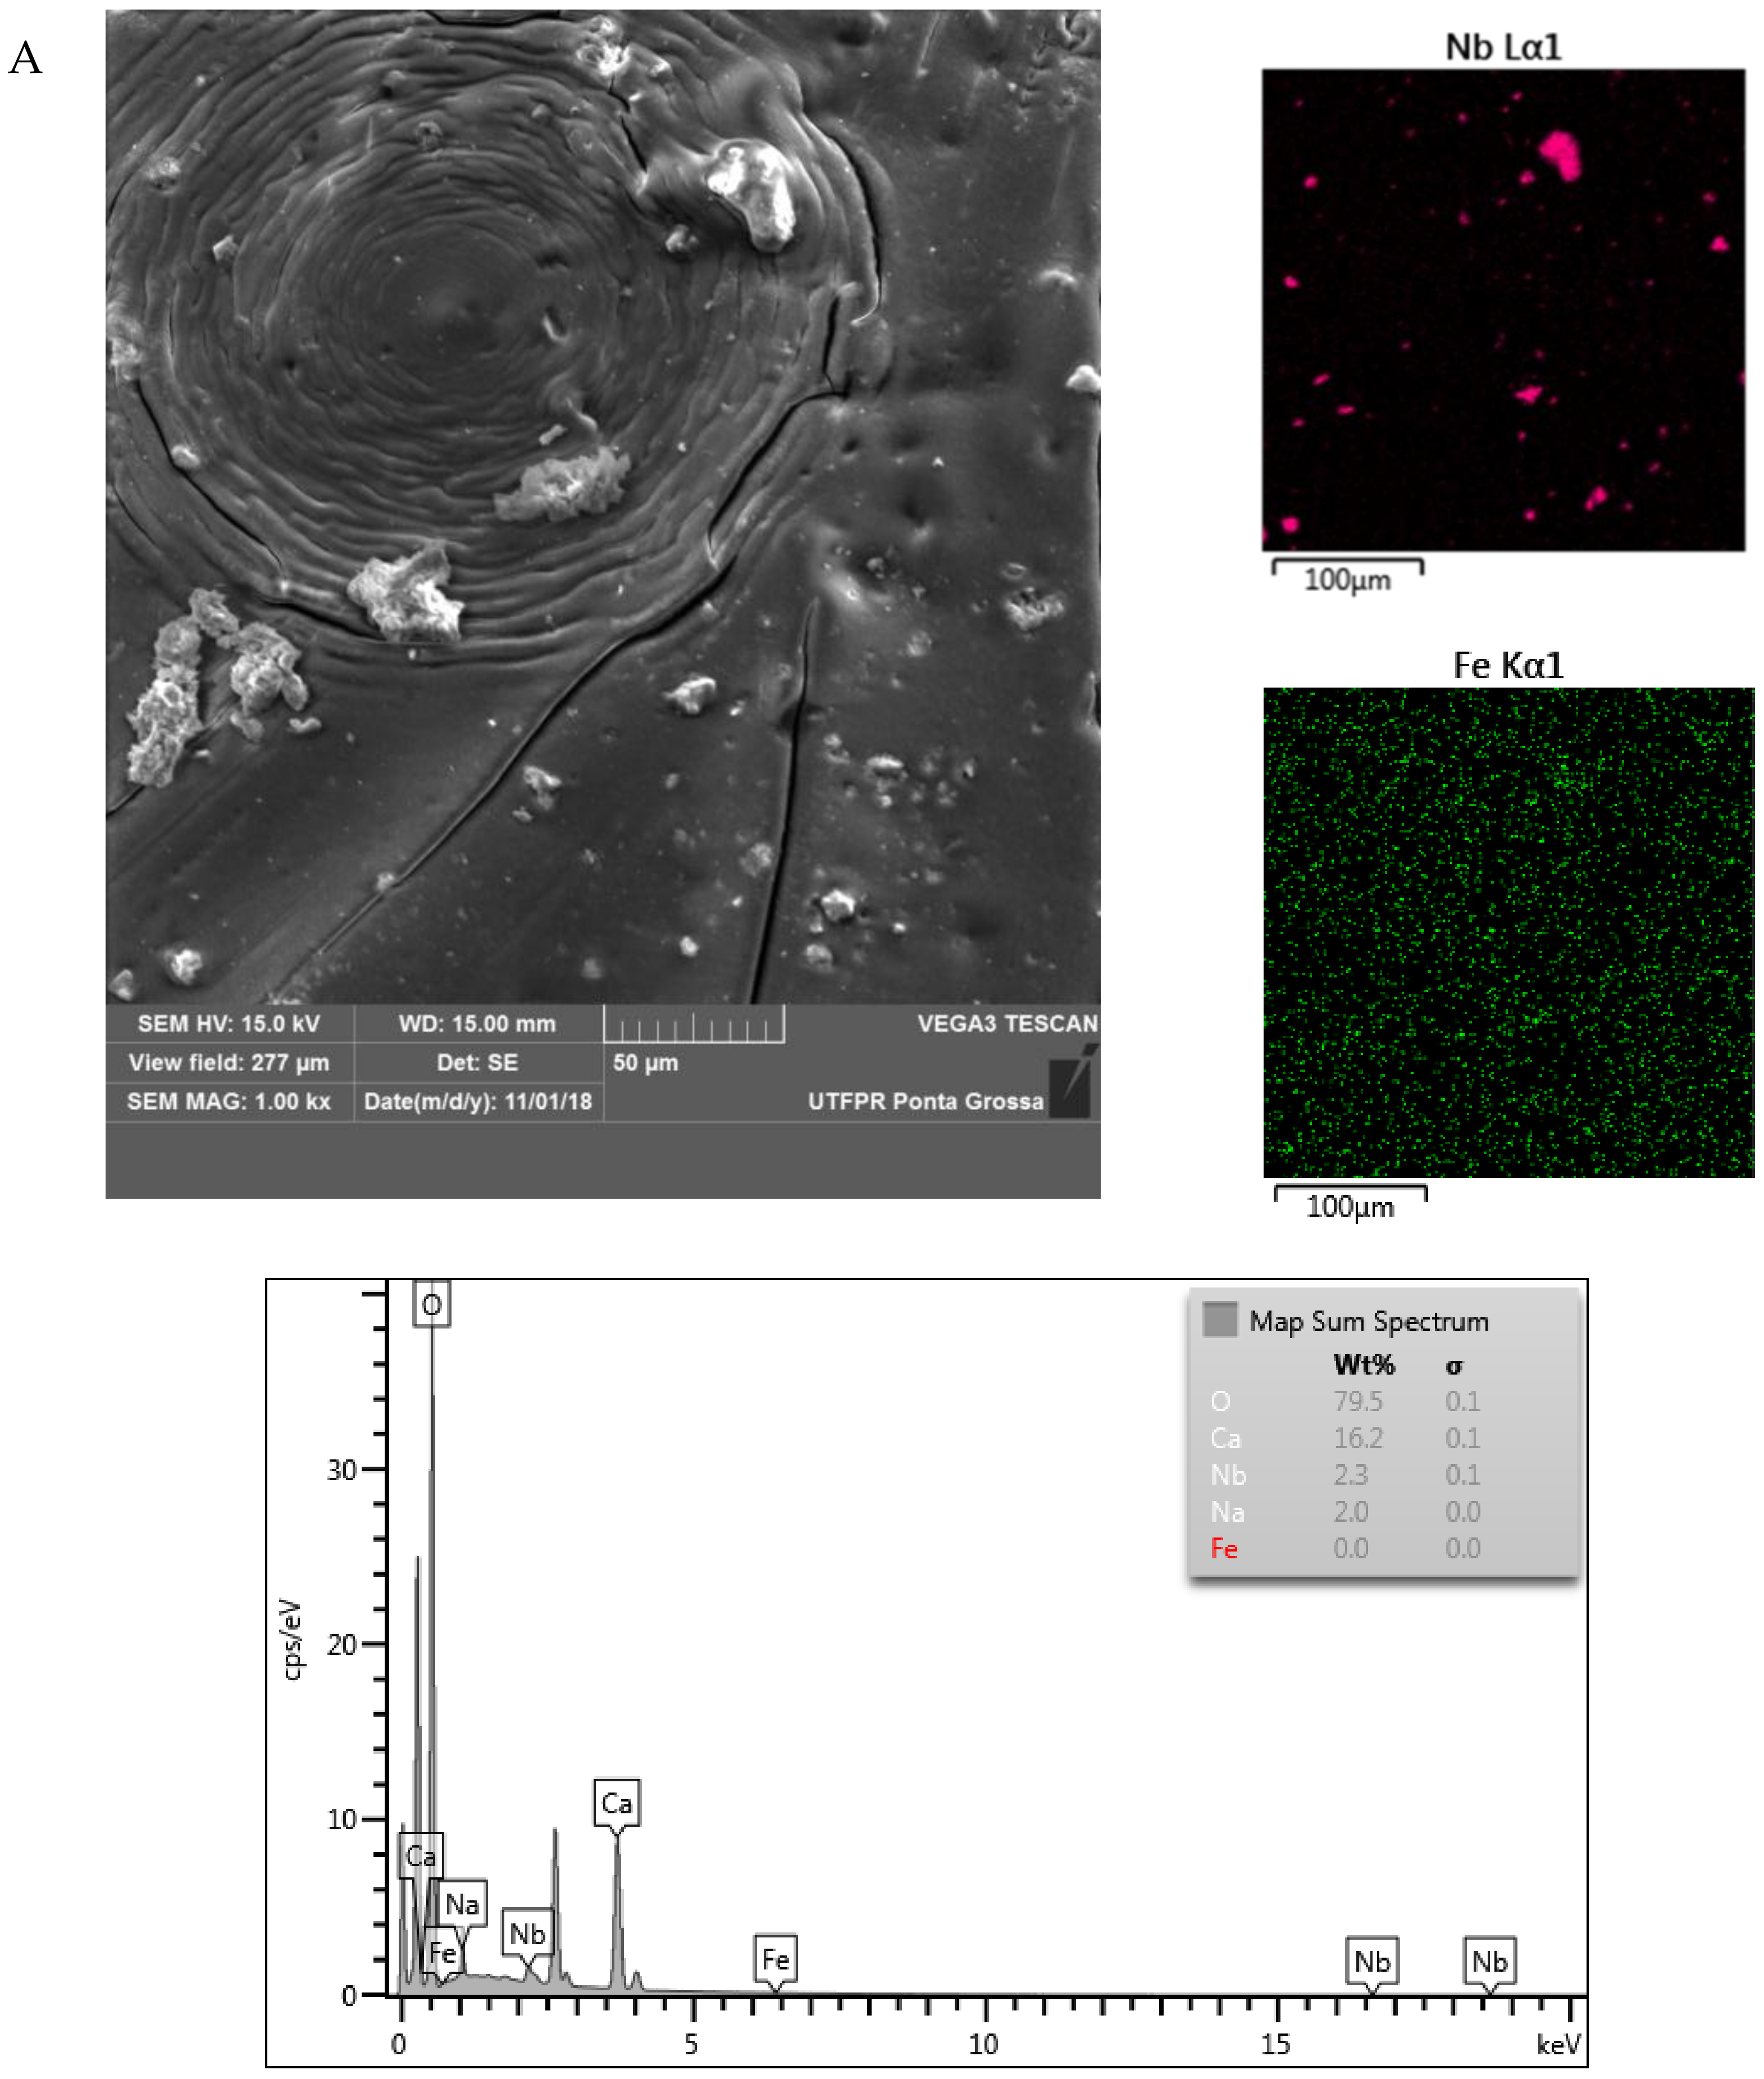
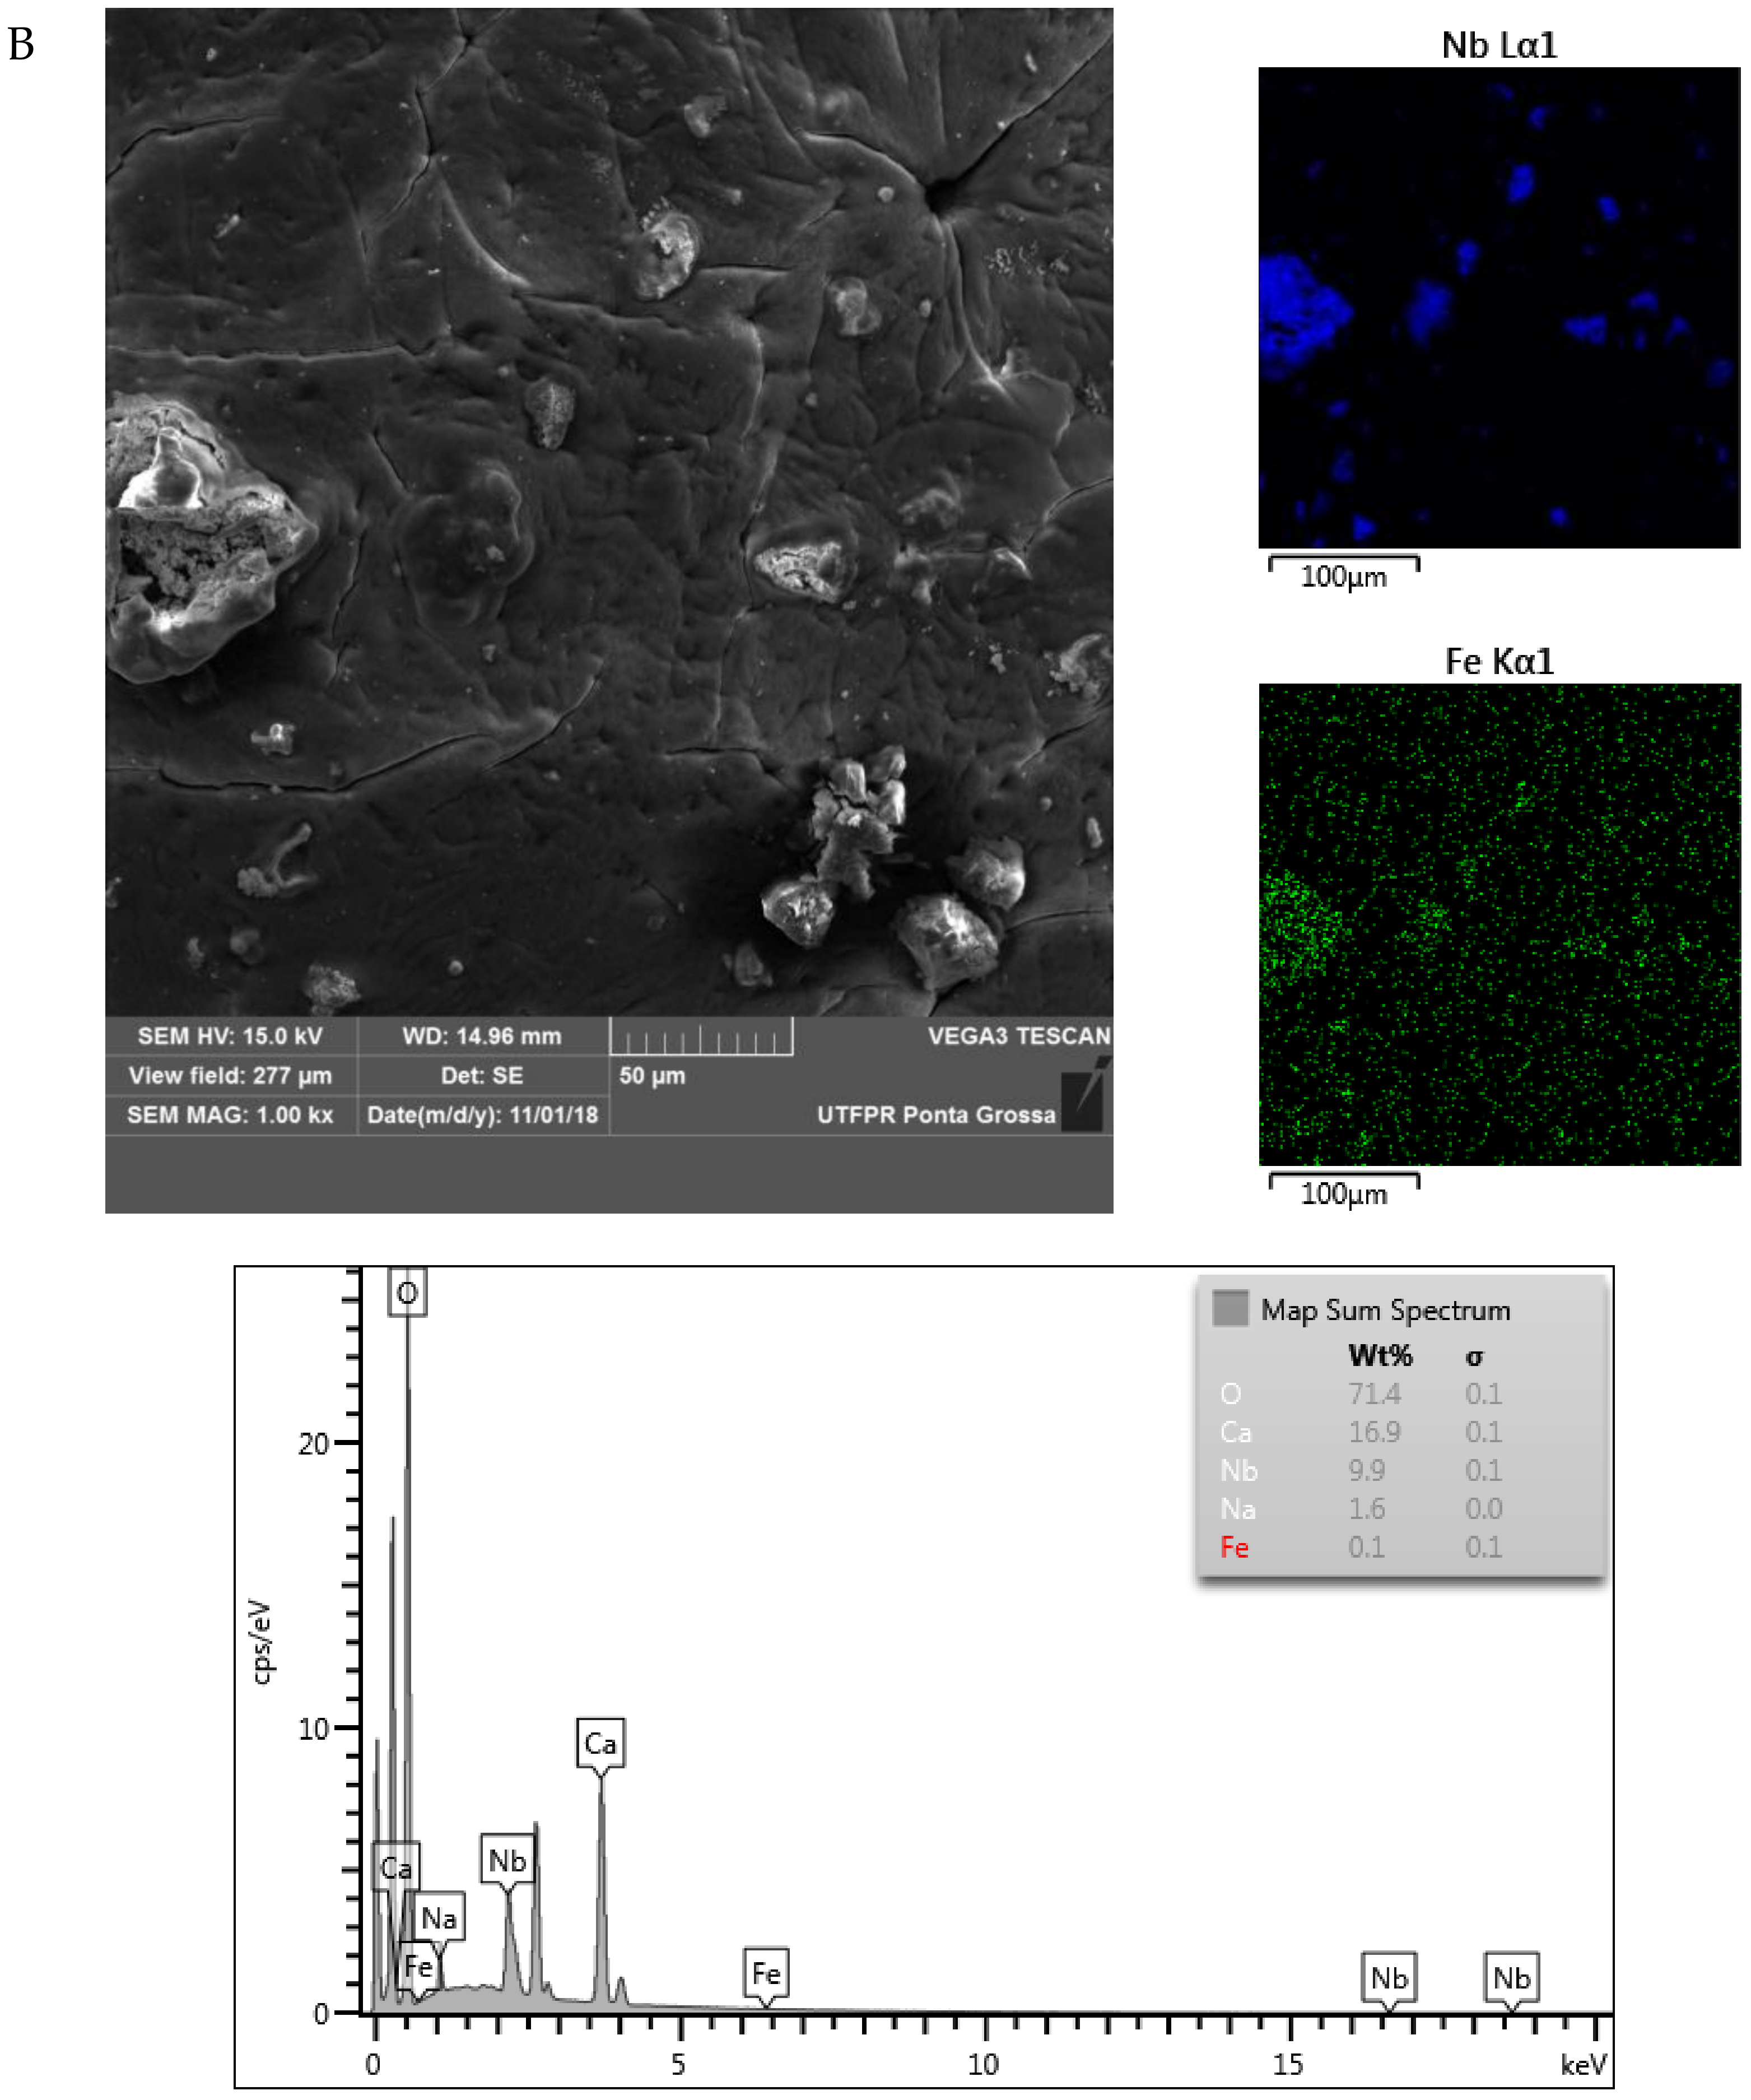
2.1.4. Scanning Electron Microscopy (SEM/EDS)

Figure 2 shows the images obtained by the scanning electron microscopy with an EDS detector (SEM/EDS), for 0.3 and 1.7% Fe/Nb2O5 samples calcined at 773 K, respectively.
Using the SEM/EDS analysis for both samples, it is possible to observe that the dispersion on the surface catalysts was homogeneous since the formation of Fe/Nb2O5 agglomerates is distributed on the alginate sphere surface. The surface presents some rugosity, which can favor the interaction between the adsorbate and adsorbent. This benefits the catalytic activity. Similar structures on alginate spheres immobilized catalysts were reported by References [38,39]. Thus, it is verified that there were no major structural changes on the catalysts, and, subsequently, in the catalytic activity as well.

2.2. Photocatalytic Reaction

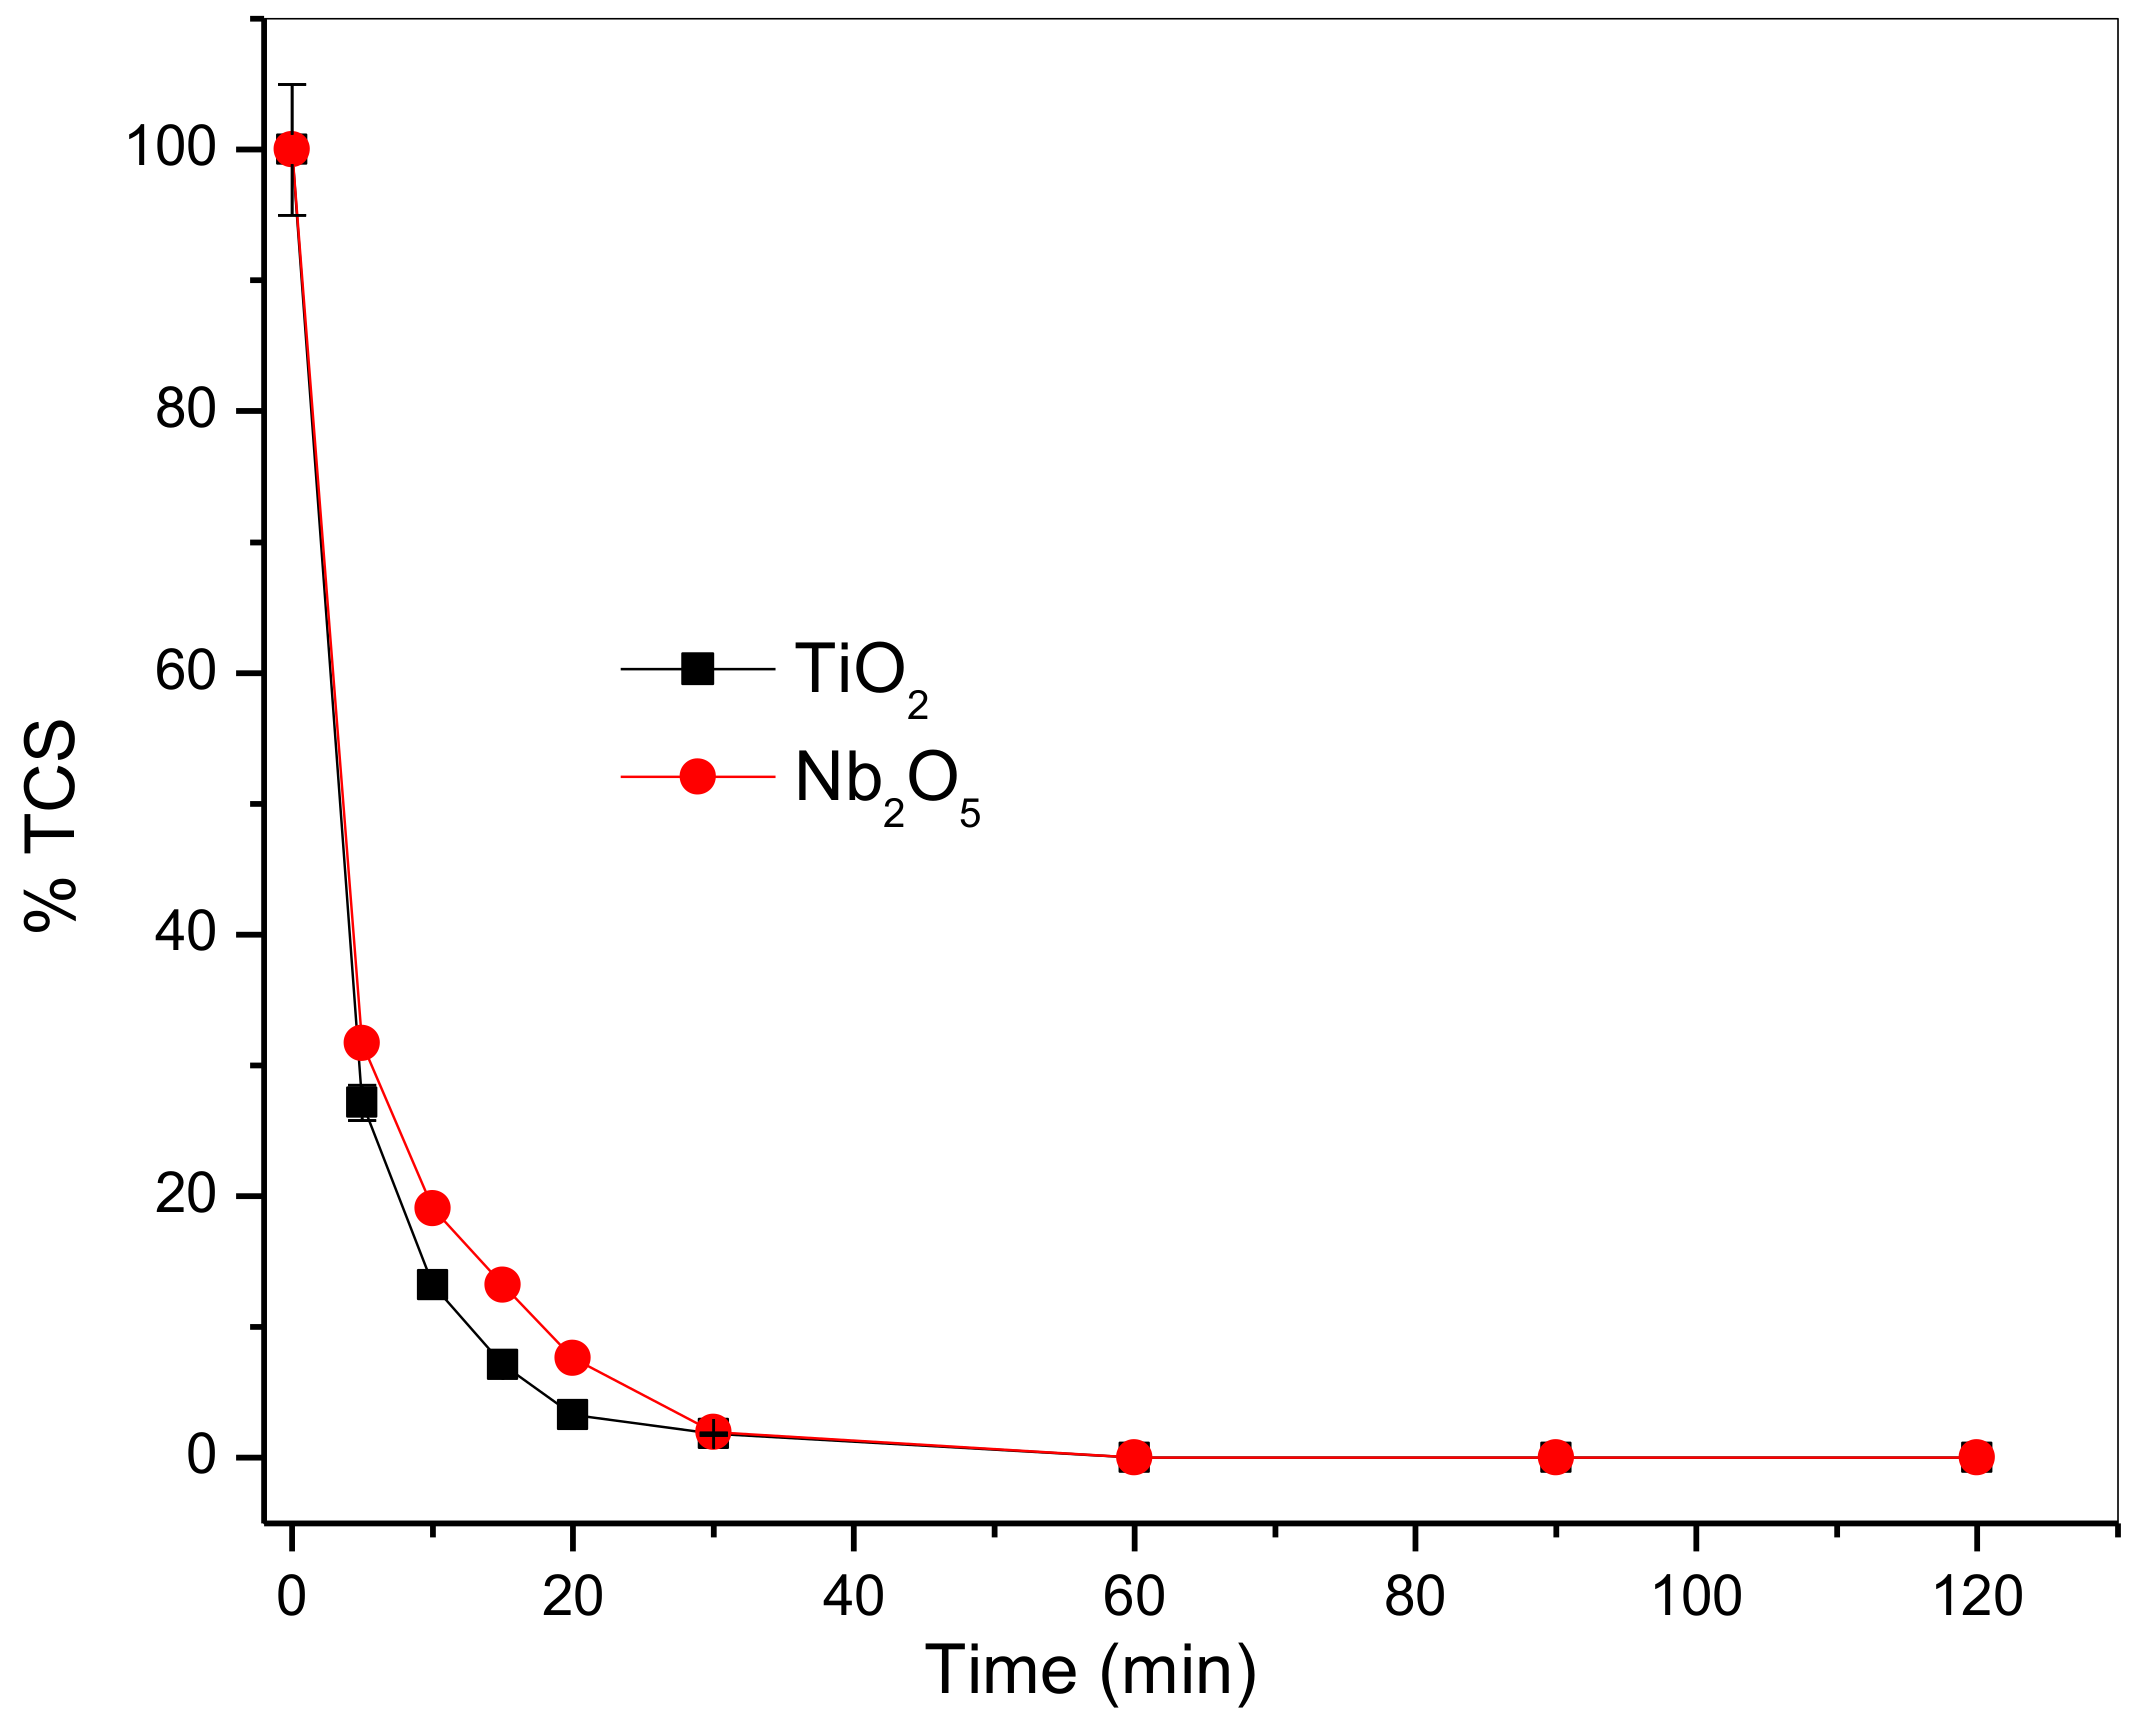
2.2.1. Catalyst Influence

The effect of the photocatalysis process in the TCS degradation was evaluated using TiO2 and Nb2O5 as catalysts (calcined at 773 K). The results are shown in Figure 3.
The results presented in Figure 3 showed that there is no significant difference between the photo-catalysts TiO2 and Nb2O5 for TCS degradation. Therefore, in the next steps, the Fe/Nb2O5 catalyst was used.

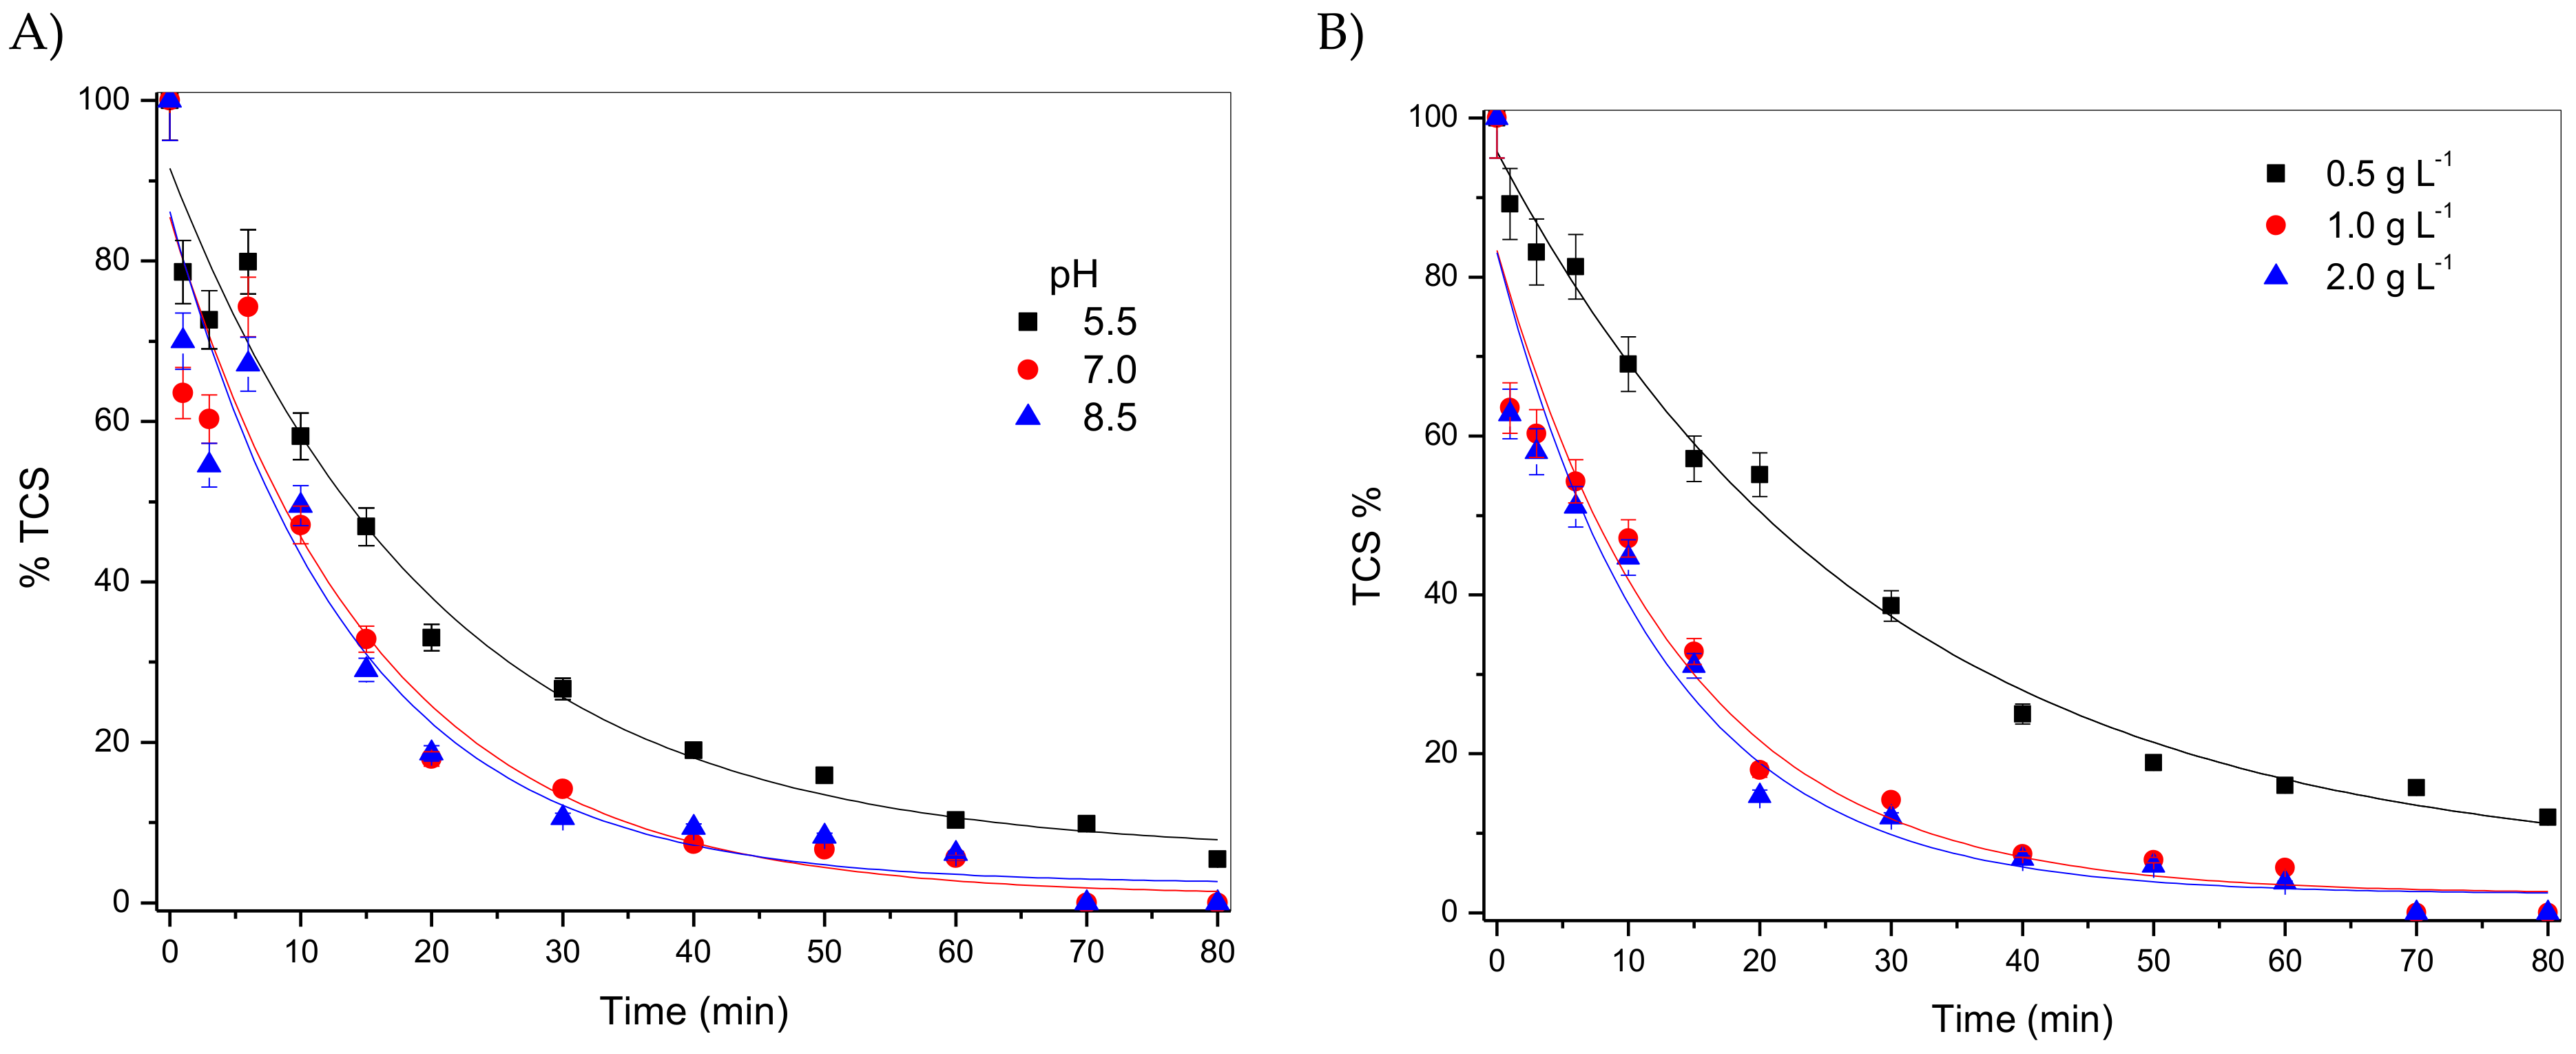
2.2.2. pH Influence and Mass Catalitic

In order to analyze the pH and catalyst mass influence in the TCS degradation, the conditions were verified at pH 5.5, 7.0, and 8.5 using the 1.0% Fe/Nb2O5 catalyst calcined at 773 K, 1 g L−1 (Figure 4A) and 0.5, 1.0, and 2.0 g L−1 catalyst (Figure 4B).
The results indicated that, in the neutral and alkaline pH, the TCS degradation kinetics obtained were higher than in an acidic pH. As described in the literature, the photocatalytic efficiency of Triclosan did not change at a neutral pH, but significantly decreased in the acidic condition by inhibiting the generation of OH radicals [40]. On the other hand, the degradation in pH 7.0 and 8.5 was practically the same. A concentration of 0.5, 1.0, and 2.0 g L−1 was used to verify the catalyst mass influence. It was observed that the TCS total degradation does not occur within 80 min at the lowest catalyst concentration (0.5 g L−1). However, concentrations of 1.0 and 2.0 g L−1 showed very similar results (Figure 4B). Therefore, a pH 7.0 and a catalyst mass concentration of 1.0 g L−1 were maintained, in the following tests.

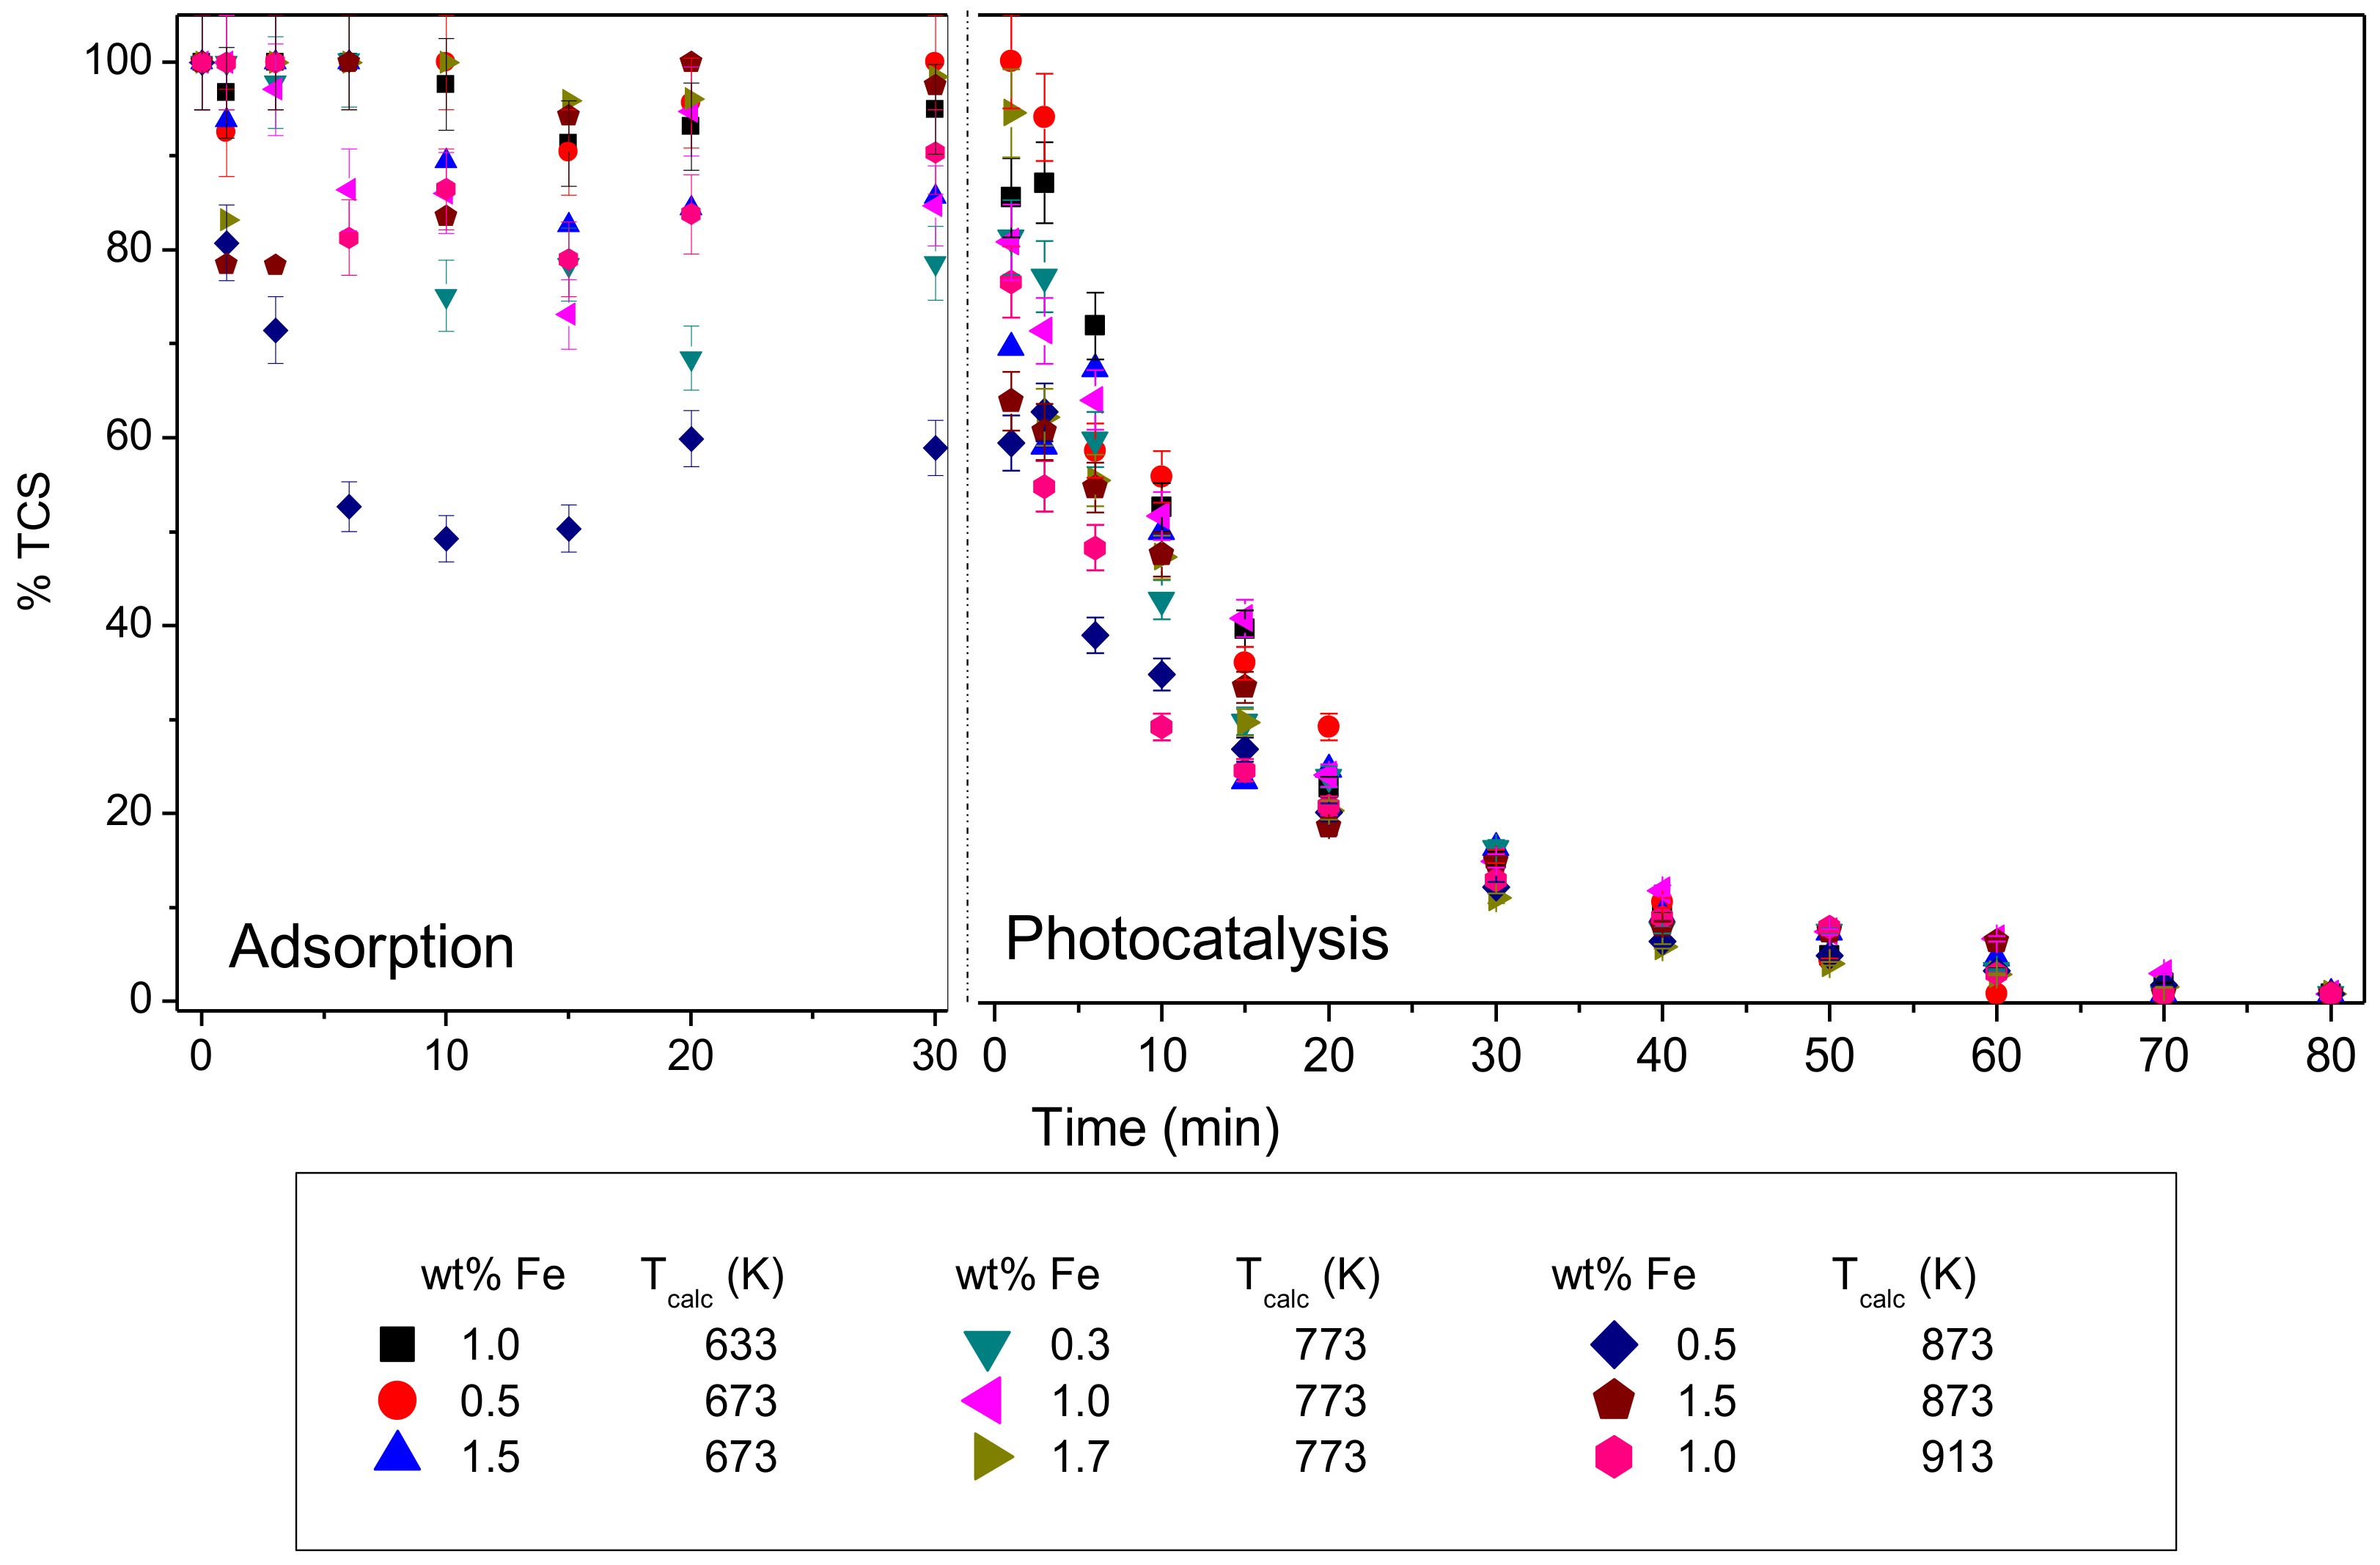
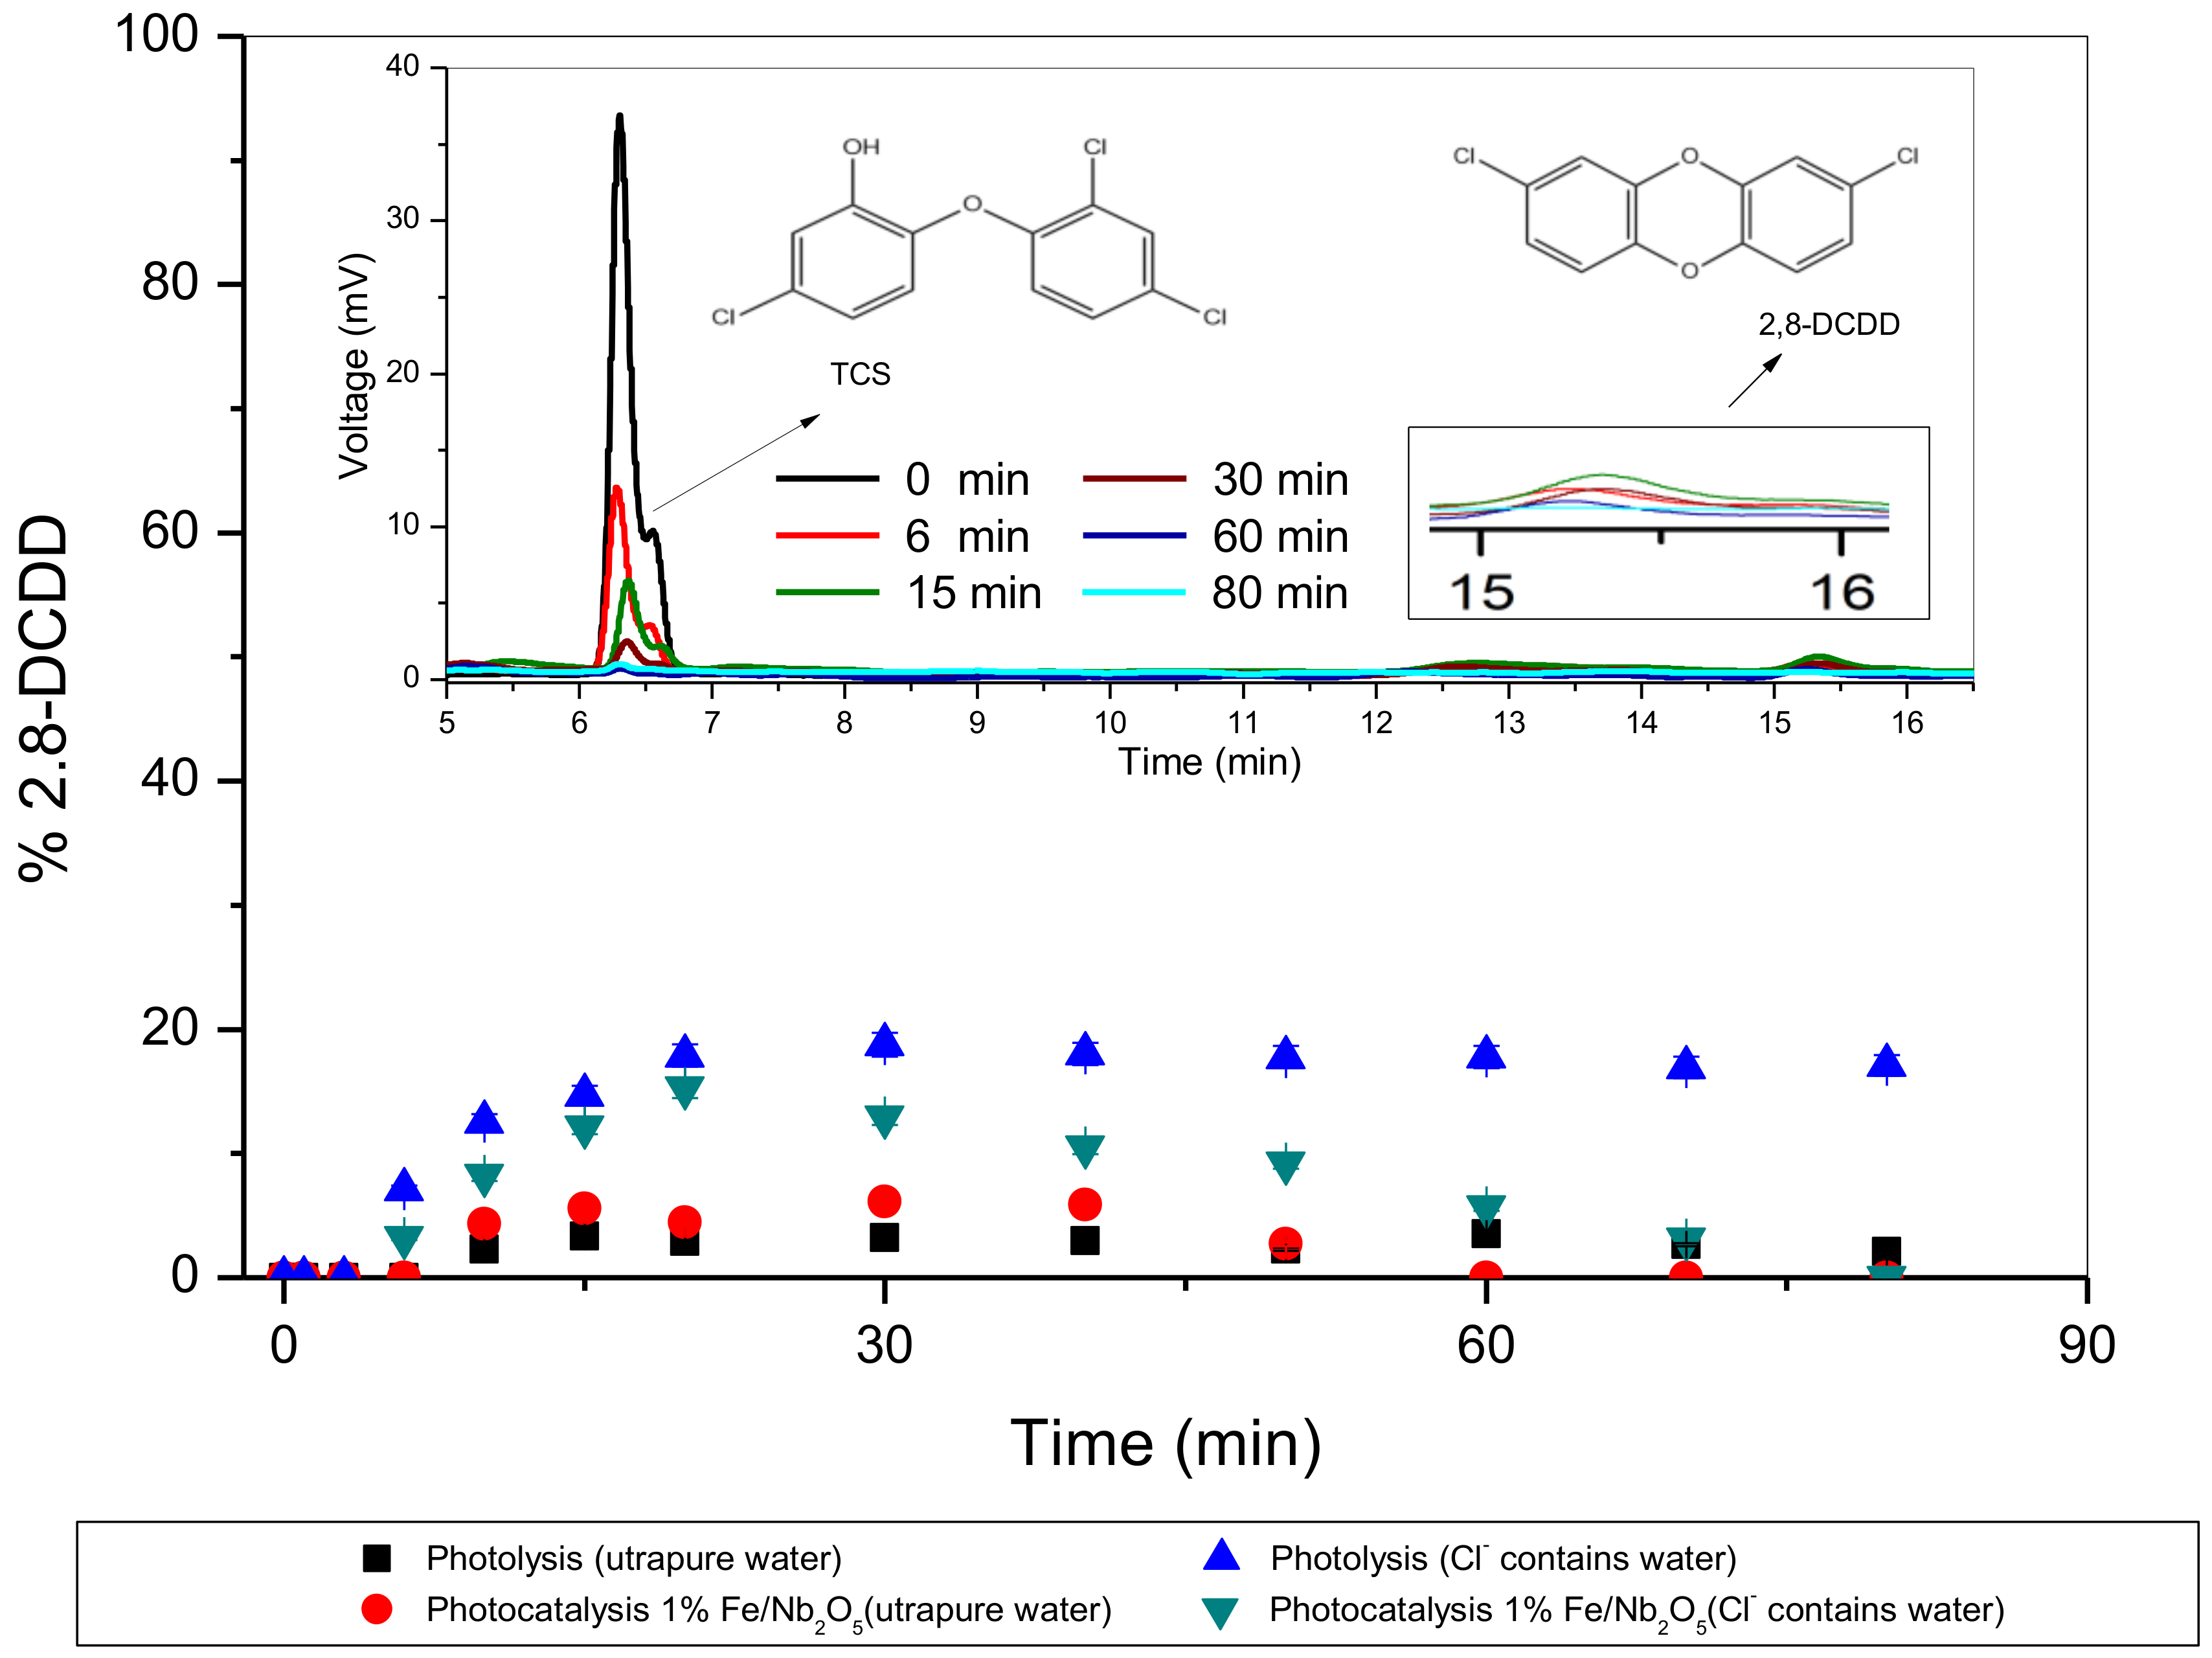
2.2.3. Adsorption, Photolysis, and Photo Catalyst Tests

The results of adsorption and photocatalytic for the TCS degradation using the Fe/Nb2O5 immobilized catalysts are shown in Figure 5. The adsorption was performed in the first 30 min before the photo catalysis.
It was observed that there was an instability in the adsorption process (adsorption and desorption of TCS on catalytic surface), which indicates that only the adsorption process is not adequate for the TCS removal. In addition, it was verified that a greater adsorption does not directly imply a higher rate of degradation. For example, 0.5 wt % catalyst calcined at 873 K obtained approximately 40% adsorption. However, other catalysts saw a similar level of degradation of TCS, without the same adsorption capacity. This catalyst had a high specific surface area (~149 m2 g−1). The photocatalytic degradation presented an exponential profile for all catalysts studied. The data obtained indicated that all the photo catalysts degraded the TCS after 80 min of the reaction.
It is also possible to verify that catalysts with higher calcination temperatures of 873 K and 913 K have a higher photocatalytic activity in the first 15 min of the reaction, when compared to the other catalysts used.
These values show that the photocatalytic degradation of TCS in an aqueous solution can be described by a pseudo-first order kinetic model. In addition, to compare the results obtained, the half-life (t1/2) was evaluated, which indicates the approximate time required for the contaminant concentration to be halved.
Its half-life was calculated according to Equation (1), where k is the constant reaction rate. The results are shown in Table 3.
t 1 2   =   ln 1 2 k  
Among all the catalysts, the 1.5% Fe/Nb2O5 calcined at 873 K was the one with the highest constant reaction rate and the lowest half-life of 0.069 min−1 and 10.04 min. Another relevant characteristic is that it has the smallest band gap (3.05 eV). Figure 5 shows a comparison degradation kinetics of TCS between photo catalysis (1.5% Fe/Nb2O5calcined at 873 K) and photolysis. The experiments were performed in different matrices, ultrapure water, and water containing Cl. The reaction orders, rate constant, and t1/2 are shown in the subtitle of Figure 6.
In Figure 7, it can be verified that the photo catalysis is more efficient in the 100% degradation of TCS, which does not occur for photolysis. In both matrices used, the photo catalysis was efficient.
At the same time, an analysis on the generation/degradation of 2.8-DCDD was performed, where the TCS in the presence of Cl and radiation, is transformed into this compound.
Figure 7 shows that 2.8-DCDD has a kinetics of higher formation in matrices containing Cl, which was previously described by Reference [6]. It is also noted that, in these environments, the transformation of TCS into 2,8-DCDD occurs extremely fast in approximately 20 min. It is observed that the photolysis is not efficient in the 2.8-DCDD degradation. However, the photocatalysis is able to degrade it completely after 80 min of reaction.
Then the formation of hydroxyl radicals (∙OH) occur. According to Reference [5], two conditions need to be satisfied for the formation of DCDDs and DCHDFs (dichlorohydroxydibenzofurans). First, ∙OH radicals are present for the cleavage and oxidation. Second, the chlorinated phenoxyphenols are not to be de-chlorinated into phenoxyphenols before they react with ∙OH.
Iron leaching tests were performed in triplicate. The concentrations of iron were determined by Flame atomic absorption spectrometry (F AAS) using a spectrometer (Perkin Elmer AAnalyst 700, Lübeck, Germany). The results indicated that leaching of Fe does not occur.

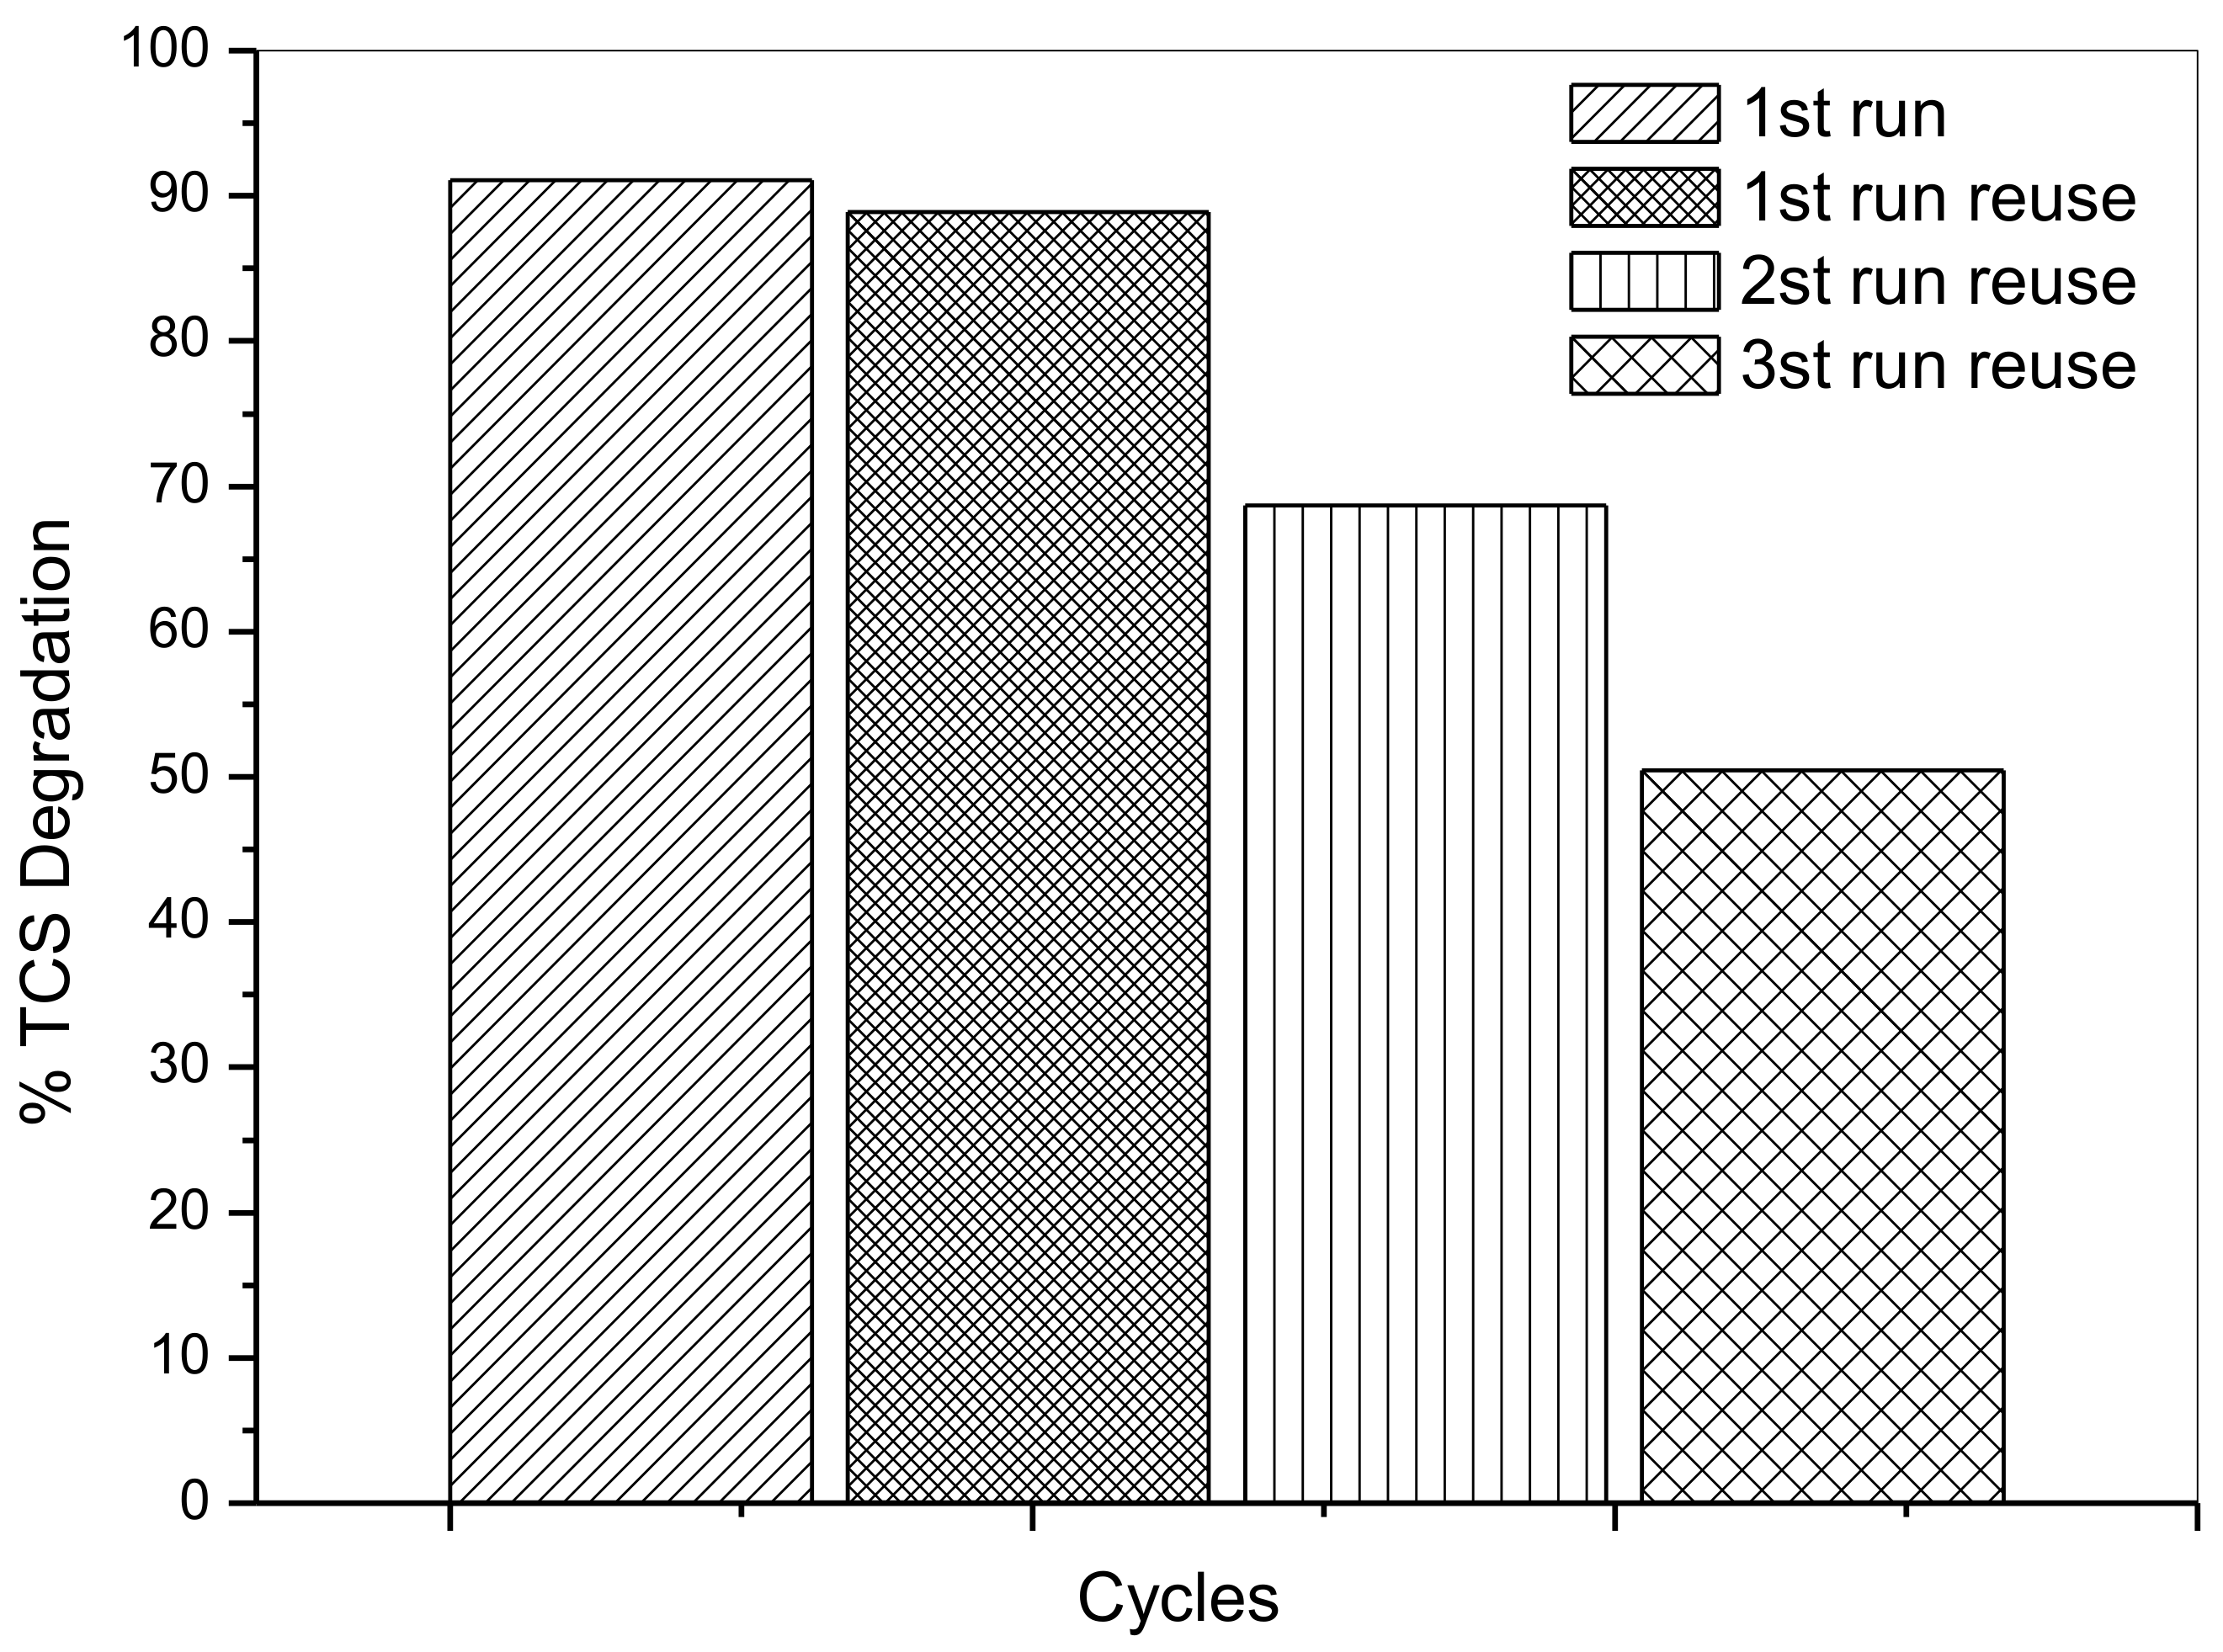
2.2.4. Photo Stability

To evaluate photo stability, tests in successive cycles (80 min each) were performed (Figure 8) and 1.5% Fe/Nb2O5 calcined at 873 K were used. In the first cycle, a TCS degradation of about 91% occurs, decreasing to 89% in the first reuse cycle, 68% in the second reuse, and reaching only 50% in the third reuse cycle. This time is sufficient to TCS and 2.8-DCDD degradation. However, the catalytic deactivation may be related with surface adsorbed compounds and by-products formed in the reaction.

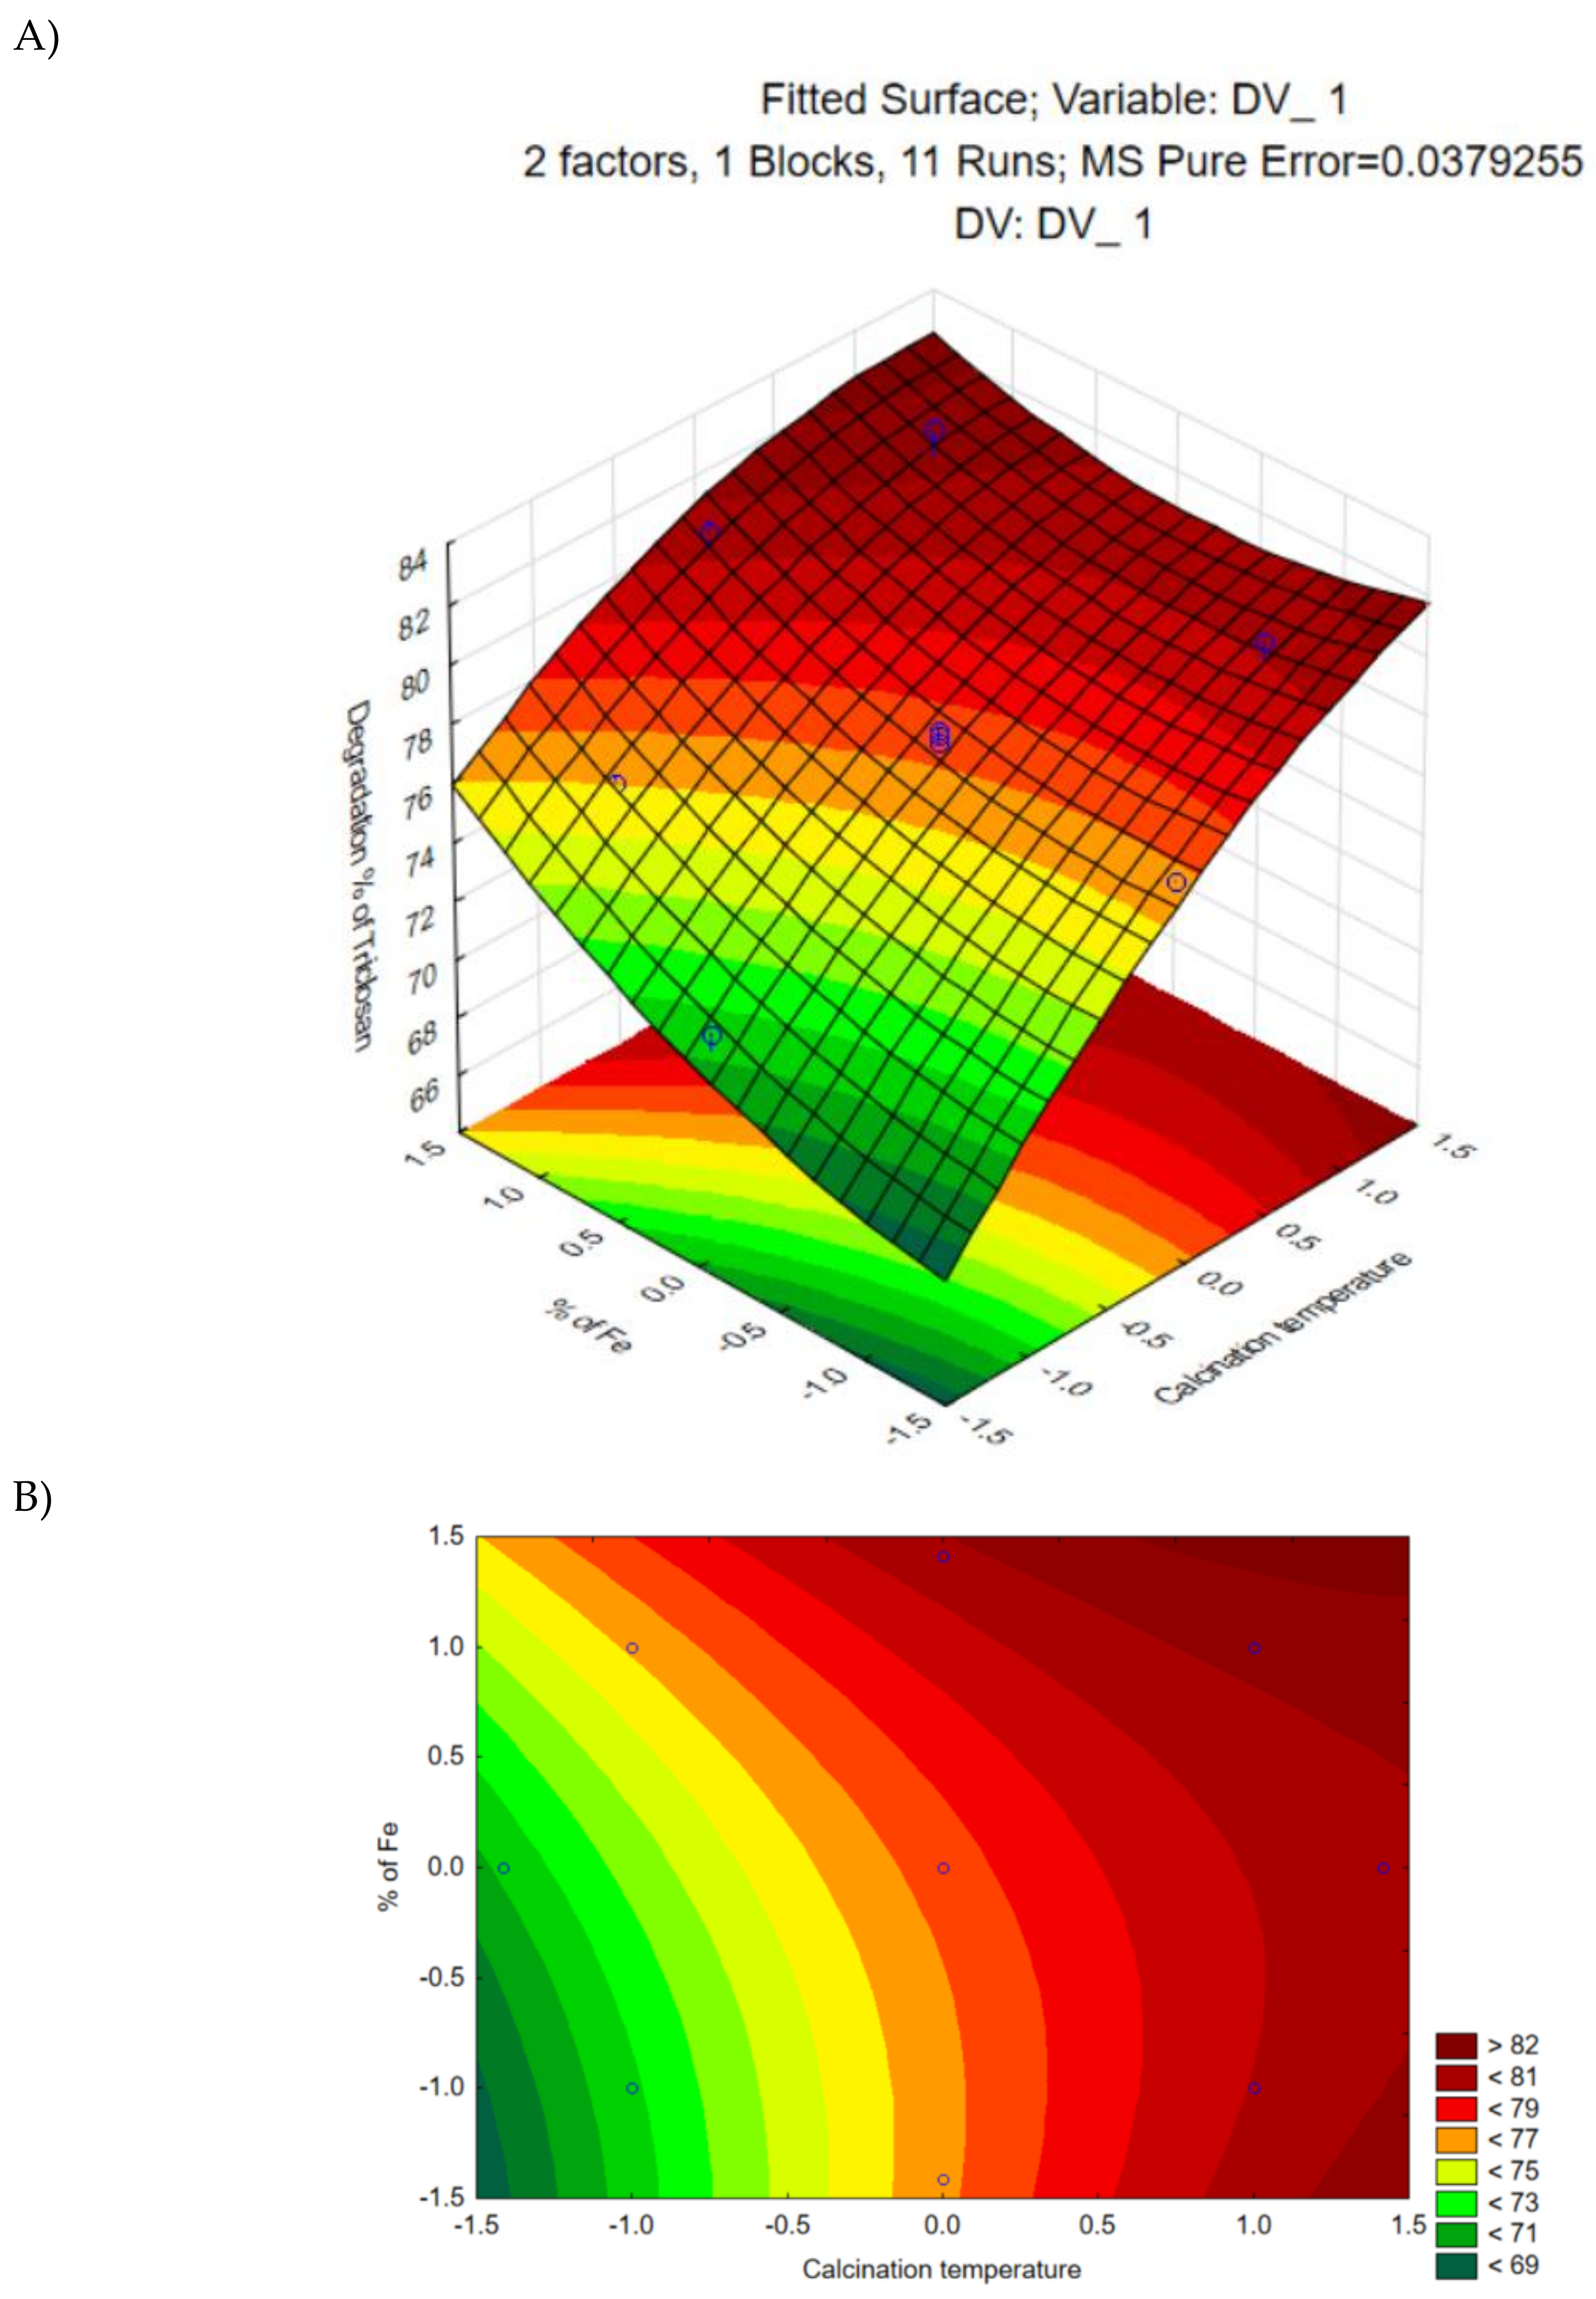
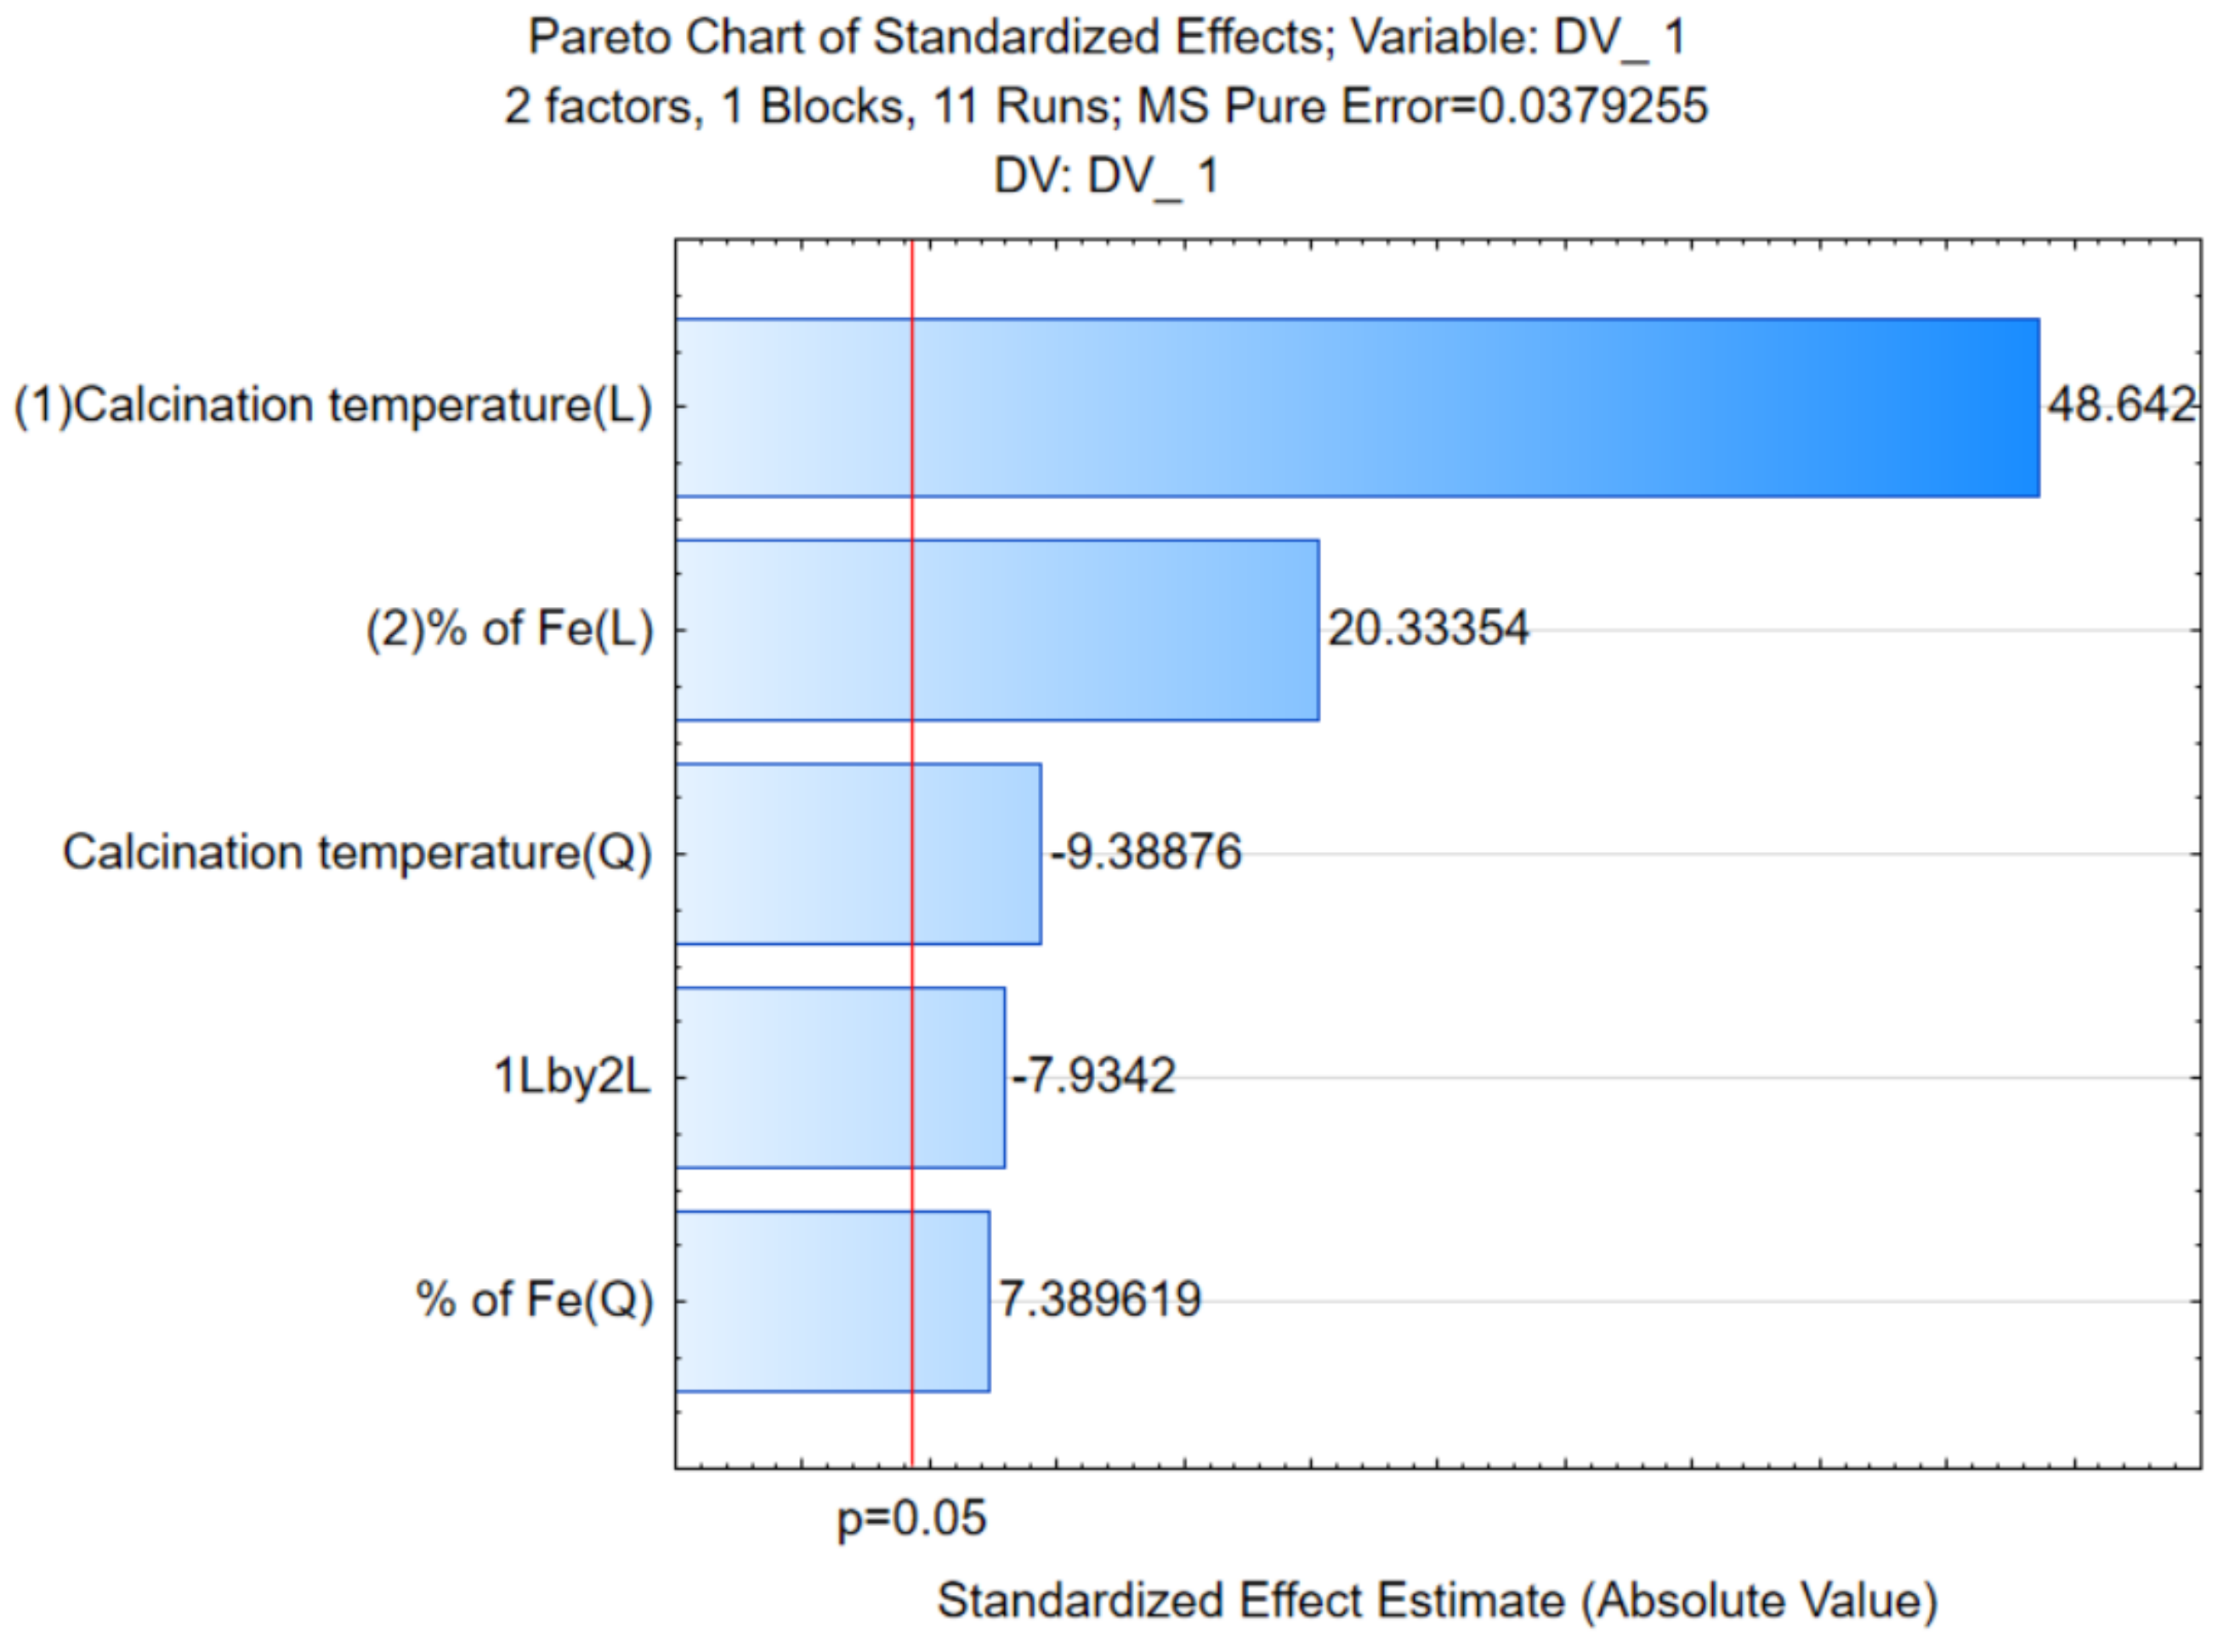
2.3. Experimental Design and Optimization

The effects on the parameters of the nominal load of metal (%Fe) and calcination temperature on the TCS degradation were investigated.
According to the results obtained in the Response surface and Surface Contour (Figure 9A,B) and the e Pareto chart (Figure 10), all variables studied were significant for the process.
It was mainly observed that the effects are more accentuated at higher calcination temperatures and higher iron percentages. These are two conditions that significantly affect the photocatalytic process.
From the data obtained, it was possible to table a new construct with R2 = 0.98204 presented in Table 4.
In order to verify if the generated model was significant, the statistical test F was used as a basis. For α = 0.05, we have F (Reg, Res) 5.5 > F (Tab) 5.5 and F (Err) 3.2 < F (Tab) 3.2. Subsequently, it can confidently be concluded to a percentage of 95% that the generated model is significant and there is no evidence of significant differences between treatments.

3. Materials and Methods

Chemicals: Acetonitrile (HPLC–supplied by J.T.Barker, Ciudad de México, México) PA-ACS–CH3CN. Panreac-AppliChem., Triclosan–(supplied by Merck, Darmstadt, Germany); Niobium pentoxide hydrated (Nb2O5) (supplied by CBMM–Companhia Brasileira de Matalurgia e Mineração, Araxá, Minas Gerais, Brasil), Iron Nitrate III (ICO) nonohydrate P.A. ACS (Fe(NO3)·3.9·H2O) (supplied by SYNTH, São Paulo, Brasil), Sodium Alginate (P.A) (supplied by Sigma Aldrich, St Louis, MO, USA), and Calcium Chloride-(P.A.) (supplied by Nuclear, São Paulo, Brasil).

3.1. Fe/Nb2O5 Immobilized Synthesis

The catalyst synthesis was performed in two stages: (i) Impregnation method–used for supported iron on niobium, with solvent in excess, with different nominal metal loads (0.3%, 0.5%, 1.0%, 1.5% and 1.7%), as described by Reference [33,41]. It was then dried in a rotary evaporator and stove to remove the solvent in excess. Afterward, it was then calcined at different temperatures (633, 673, 773, 873, and 913 K) with heating ramps. (ii) Catalytic immobilization—for the catalyst immobilization, it used a methodology adapted from Reference [31], which incorporated sodium alginate as the polymer matrix. The concentrations used were: sodium alginate 2% (w/v) and photocatalyst 1g L−1. The catalyst was agitated with sodium alginate in a solution and then dripped in a 2% (w/v) calcium chloride solution (CaCl2) in a 288 K ultra-thermostatic bath to form the sodium alginate beads. After 24 hours, the beads were washed with ultrapure water and oven dried at 333 K for 8 hours.

3.2. Characterization

Textural Properties: Porous properties such as specific surface area, mean pore diameter, and pore volume were established using a QUANTACHROME Analyzer—Model Novatouch 2 LX with N2 adsorption at 77 K. The samples were previously submitted to a thermal treatment at 333K for 12 hours, which puts them under vacuum to eliminate any existing water within the pores of the solids. Photoacoustic spectroscopy (PAS): The photoacoustic spectroscopy measurements in the UV–VIS spectral regions were performed using a lab-made experimental setup.
It obtained a monochromatic light through a 1000-Watt xenon arc lamp (66926, Newport Corporation/Oriel) and a monochromator (74100, Newport Corporation by Oriel Instruments, São Paulo, São Paulo, Brasil. The light beam was modulated using a mechanical chopper (SR540—Stanford Research Systems). A lab-made photoacoustic cell was designed to have a very low volume and was made of aluminum block. It was machined to hold samples with dimensions of up to 10 mm in diameter and 1.5 mm in thickness. This allowed light to enter through a high transparent quartz window of a 6-mm diameter and 2-mm thickness. The distance of the microphone chamber was 15 mm. It was connected to the sample holder room through a 1-mm diameter duct. The capacitive microphone (4953, Brüel&Kjaer) used was a 12-mm diameter. It was very sensitive and presented a gain of 50 mV/Pa, and a flat frequency response between 3 to 10 kHz. It also used a lock-in amplifier (SR830, Stanford Research System). All the photoacoustic spectra were obtained at a 23 Hz modulation frequency and recorded between 225 to 700 nm. Data was acquired using a personal computer, and the PAS spectra were normalized regarding the carbon black signal. The band gap energies were established through Equation (2):
λ   =   h c E g a p   =   1240 E g a p
where Egap is the band gap energy in eV units. The direct method was applied to obtain the values, i.e., m = 2.
X-ray diffraction: The samples were measured through a Rigaku-Denki Diffractometer with Cu-Kα radiation (λ = 1.5406 Å) at 40 kV voltage and 40 mA current. Subsequently, the obtained patterns were compared with the diffraction dataset cards from the ICDD.
Scanning electron microscopy (SEM/EDS): For the analysis, a scanning electron microscope (model VEGA 3 LMU, brand TESCAN) was used, complete with W 30kV filament, 3.0 nm resolution, SE detectors, and retractable BSE. It also featured a low vacuum mode (500 Pa), chamber with internal diameter of 230 mm, and a door width of 148 mm. The microscope also included compucentric rotation, 5-axis fully motorized, with X movement: 80 mm, Y: 60 mm and Z: 47mm, CCD camera for viewing samples, and “chamberview” software, VegaTC operational software, data processing system, and track-ball. The Microscope is also equipped with the EDS detector, dry, model AZTec Energy X-Act, resolution 130 eV, brand Oxford.

3.3. Photocatalytic Tests

The reaction mixture was transferred to a reactor consisting of a cylindrical Pyrex cell (5.0 × 10⁻⁴ m3) surrounded by a water jacket and a magnetic stirrer. This was used to ensure a constant temperature (298 K) with ultra-thermostatic bath and solution homogeneity throughout the experiment. The tests were performed for 80 min and opened to the air. Oxygen was pumped at 8.3 × 10⁻⁹ m3 s−1 into the solution containing 10 ppm of TCS and a photo catalyst. The TCS 10 mg L−1 solution was prepared with 70% of acetonitrile and 30% of ultrapure water. A total of 500 mL was inserted into the reactor, along with the catalyst mass. UV light was irradiated by using a 125-W medium pressure mercury lamp, the radiation incidence was measured (2.48 mW/cm2). Aliquots were collected at regular intervals of time. Chromatographic analysis of Triclosan was performed with a high performance liquid chromatograph YL Clarity model 9100 equipped with a pre-column, reverse phase C-18 column, and visible ultraviolet detector (UV-VIS). It used the standard acetonitrile HPLC for chemical analysis and the pH control of sodium hydroxide and nitric acid.
Different conditions were studied: pH 5.5, 7.0, and 8.5, catalyst mass 0.5, 1.0, and 2.0 g L−1 and calcination temperature of the catalyst between 633 and 913 K. The adsorption tests were performed by applying the same procedures of the previous photocatalytic test, but without the presence of light. The photolysis experiments were conducted using no catalysts and followed the same procedures of the photocatalytic tests. The tests were completed twice.
Tests about photo stability were performed in four successive cycles. Between the cycles, the catalyst was filtered, washed (ultrapure water), and dried.

3.4. Optimization of Experimental Parameters

The effects of operating parameters of TCS degradation using the Fe/Nb2O5 catalyst were analyzed by using a central composite factorial. The general form of this factorial design is 2n plus a star configuration ( ± α   =   2 n ( 1 / 4 ) ), with a central point, where n and 2 represent the number of factors and the two levels of work [33], respectively. The levels are defined as low level (−1), high level (+1), central point (0), and two outer points. The independent variables were the Calcination Temperature of catalysts and nominal metal load (%Fe), while the dependent variable Y (variable response) was the TCS removal percentage. The settings for the independent variables were as follows (low/high value): calcination Temperature: 633 to 913 K, and nominal metal load: 0.3 to 1.7 %Fe. Table 5 shows experimental results of the independent variables. The values for coded and decoded variables are also shown.

4. Conclusions

The Fe/Nb2O5 immobilized catalysts were efficient in the Triclosan and 2,8-dichlorodibenzene-p-dioxin degradation. The characterization indicated that a variation in the specific surface area occurs for the catalysts studied. This is influenced by the calcination temperature and nominal metal loading.
In the XRD analysis, catalysts calcined at 673 K or at lower temperatures have a non-crystalline structure. Above this calcination temperature, structures in the form T and TT were found. The band gap results, in general, see a decrease of the band gap in accordance with an increase in the nominal metallic charge of Fe. On the other hand, when the calcination temperature increases, the band gap also tends to increase. The SEM/EDS analysis showed the formation of agglomerates throughout the sphere surface and rugosity. The photocatalytic tests indicated that the operating optimum conditions were pH 7.0 and catalyst mass of 1.0 g L−1. The adsorption process is not efficient for the TCS removal and a higher adsorption on the catalytic surface does not imply a faster photocatalytic process. All catalysts were efficient in the TCS degradation after 80 min of reaction. The catalysts 1.5% Fe/Nb2O5 calcined at 873 K showed the highest constant reaction rate and the lowest half-life—0.069 min−1 and 10.04 min. This was, consequently, the best catalyst studied.
Photo catalysis was efficient (100% degradation) in both matrices studied (ultrapure and water containing Cl). On the other hand, this did not occur with photolysis. In the process, the generation and subsequent degradation of 2.8-DCDD occurred. This degradation was larger in matrices containing Cl, since it was totally degraded after 80 min of reaction. The parameters studied (nominal metal load (%Fe) and calcination temperature) in the experimental design and optimization were significant for the process. From the results obtained, it was concluded that the greater the amount of Fe percentage and calcination temperature, the better the result.

Author Contributions

M.Z.F, E.A., and E.S.C. carried out the experiment, conceived, and planned the experiments. R.B. and D.T.D. Characterization Analysis. G.G.L. and O.A.A.D.S. original draft preparation. All authors discussed the results and contributed to the final manuscript.

Acknowledgments

The authors thank the CBMM-CompanhiaBrasileira de Matalurgia e Mineração by the Niobium, and CNPq agency.

Conflicts of Interest

The authors declare no conflict of interest.

References

  1. Bedoux, G.; Roig, B.; Thomas, O.; Dupont, V.; Le Bot, B. Occurrence and toxicity of antimicrobial triclosan and by-products in the environment. Environ. Sci. Pollut. Res. 2012, 19, 1044–1065. [Google Scholar] [CrossRef]
  2. Reiss, R.; Mackay, N.; Habig, C.; Griffin, J. An ecological risk assessment for triclosan in lotic systems following discharge from wastewater treatment plants in the United States. Environ. Toxicol. Chem. 2002, 21, 2483–2492. [Google Scholar] [CrossRef]
  3. Singer, H.; Müller, S.; Tixier, C.; Pillonel, L. Triclosan: Occurrence and Fate of a Widely Used Biocide in the Aquatic Environment: Field Measurements in Wastewater Treatment Plants, Surface Waters, and Lake Sediments. Environ. Sci. Technol. 2002, 36, 4998–5004. [Google Scholar] [CrossRef] [PubMed]
  4. Wang, J.L.; XU, L.J. Advanced oxidation processes for wastewater treatment: formation of hydroxyl radical and application. Crit. Rev. Environ. Sci. Technol. 2012, 42, 251–325. [Google Scholar] [CrossRef]
  5. Niu, J.; Dai, Y.; Yin, L.; Shang, J.; Crittenden, J.C. Photocatalytic reduction of triclosan on Au-Cu2O nanowire arrays as plasmonic photoatalysts under visible light irradiation. Phys. Chem. Chem. Phys. 2015, 17, 17421–17428. [Google Scholar] [CrossRef] [PubMed]
  6. Buth, J.M.; Steen, P.O.; Sueper, C.; Blumentritt, D.; Vikesland, P.J.; Arnold, W.A.; McNeill, K. Dioxin Photoproducts of Triclosan and Its Chlorinated Derivatives in Sediment Cores. Environ. Sci. Technol. 2010, 44, 4545–4551. [Google Scholar] [CrossRef]
  7. UNEP—United Nations Environment Programme. Persistent Organic Pollutants. 2013. Available online: http://www.chem.unep.ch/pops/ (accessed on 22 January 2018).
  8. Chen, J.; Huang, Y.; Li, G.; An, T.; Hu, Y.; Li, Y. VOCs elimination and health risk reduction in e-waste dismantling workshop using integrated techniques of electrostatic precipitation with advanced oxidation technologies. J. Hazard. Mater. 2016, 302, 395–403. [Google Scholar] [CrossRef] [PubMed] [Green Version]
  9. Zeng, Z.-Q.; Wang, J.-F.; Li, Z.-H.; Sun, B.-C.; Shao, L.; Li, W.-J.; Zou, H.-K. The Advanced Oxidation Process of Phenol Solution by O3/H2O2in a Rotating Packed Bed. Ozone Sci. Eng. 2013, 35, 101–108. [Google Scholar] [CrossRef]
  10. Abdullah, A.M.; Al-Thani, N.J.; Tawbi, K.; Al-Kandari, H. Carbon/nitrogen-doped TiO2: New synthesis route, characterization and application for phenol degradation. Arab. J. Chem. 2016, 9, 229–237. [Google Scholar] [CrossRef]
  11. Pelaez, M.; Nolan, N.T.; Pillai, S.C.; Seery, M.K.; Falaras, P.; Kontos, A.G. A review on the visible light active titanium dioxide photocatalysts for environmental applications. Appl. Catal. B Environ. 2012, 125, 331–349. [Google Scholar] [CrossRef] [Green Version]
  12. Espino-Estévez, M.R.; Fernández-Rodríguez, C.; González-Díaz, O.M. Effect of TiO2–Pd and TiO2–Ag on the photocatalytic oxidation of diclofenac, isoproturon and phenol. Chem. Eng. J. 2016, 298, 82–95. [Google Scholar] [CrossRef]
  13. Léonard, G.L.; Pàez, C.A.; Ramírez, A.E.; Mahy, J.G.; Heinrichs, B. Interactions between Zn2+ or ZnO with TiO2 to produce an efficient photocatalytic, superhydrophilic and aesthetic glass. J. Photochem. Photobiol. A Chem. 2018, 350, 32–43. [Google Scholar] [CrossRef]
  14. Yan, J.; Wu, G.; Guan, N.; Li, L. Nb2O5/TiO2 heterojunctions: Synthesis strategy and photocatalytic activity. Appl. Catal. B 2014, 152–153, 280–288. [Google Scholar] [CrossRef]
  15. Kalan, R.E.; Yaparatne, S.; Amirbahman, A.; Tripp, C.P. P25 titanium dioxide coated magnetic particles: Preparation, characterization and photocatalytic activity. Appl. Catal. B 2016, 187, 249–258. [Google Scholar] [CrossRef]
  16. Castro, D.C. Síntese de Nb2O5 mesoporo para aplicação em fotocatálise heterogênea. Master’s Degree, Universidade Federal de Mato Grosso do Sul, Campo Grande, MS, Brazil, 2014. [Google Scholar]
  17. Zhao, Y.; Zhou, X.; Ye, L.; Chi Edman Tsang, S. Nanostructured Nb2O5 catalysts. Nano Rev. 2012, 3, 17631. [Google Scholar] [CrossRef]
  18. Dong, Y.; Tang, D.; Li, C. Photocatalytic oxidation of methyl orange in water phase by immobilized TiO2-carbon nanotube nanocomposite photocatalyst. Appl. Surf. Sci. 2014, 296, 1–7. [Google Scholar] [CrossRef]
  19. Katsaros, G.; Stergiopoulos, T.; Arabatzis, I.; Papadokostaki, K.; Falaras, P. A solvent-free composite polymer/inorganic oxide electrolyte for high efficiency solid-state dye-sensitized solar cells. J. Photochem. Photobiol. 2002, 149, 191–198. [Google Scholar] [CrossRef]
  20. Sakkas, V.; Arabatzis, I.; Konstantinou, I.; Dimou, A.; Albanis, T.; Falaras, P. Metolachlor photocatalytic degradation using TiO2 photocatalysts. Appl. Catal. B Envioron. 2004, 49, 195–205. [Google Scholar] [CrossRef]
  21. Santos, L.M.; Machado, W.A.; França, M.D.; Borges, K.A.; Paniago, R.M.; Patrocinio, A.O.T.; Machado, A.E.H. Structural characterization of Ag-doped TiO2 with enhanced photocatalytic activity. RSC Adv. 2015, 5, 103752–103759. [Google Scholar] [CrossRef]
  22. Arcanjo, G.S.; Mounteer, A.H.; Bellato, C.R.; da Silva, L.M.M.; Brant Dias, S.H.; da Silva, P.R. Heterogeneous photocatalysis using TiO2 modified with hydrotalcite and iron oxide under UV–visible irradiation for color and toxicity reduction in secondary textile mill effluent. J. Environ. Manage. 2018, 211, 154–163. [Google Scholar] [CrossRef]
  23. Yadav, H.M.; Otari, S.V.; Koli, V.B.; Mali, S.S.; Hong, C.K.; Pawar, S.H.; Delekar, S.D. Preparation and characterization of copper-doped anatase TiO2 nanoparticles with visible light photocatalytic antibacterial activity. J. Photochem. Photobiol. 2014, 280, 32–38. [Google Scholar] [CrossRef]
  24. Fontana, K.B.; Chaves, E.S.; Kosera, V.S.; Lenzi, G.G. Barium removal by photocatalytic process: An alternative for water treatment. J. Water Process Eng. 2018, 22, 163–171. [Google Scholar] [CrossRef]
  25. Nakajima, K.; Baba, Y.; Noma, R.; Kitano, M.N.; Kondo, J.; Hayashi, S.; Hara, M. Nb2O5·nH2O as a Heterogeneous Catalyst with Water-Tolerant Lewis Acid Sites. J. Am. Chem. Soc. 2011, 133, 4224–4227. [Google Scholar] [CrossRef]
  26. Morais, L.A.; Adán, C.; Araujo, A.S.; Guedes, A.P.M.A.; Marugán, J. Synthesis, Characterization, and Photonic Efficiency of Novel Photocatalytic Niobium Oxide Materials. Glob. Chall. 2017, 1, 1700066. [Google Scholar] [CrossRef]
  27. Sreethawong, T.; Ngamsinlapasathian, S.; Yoshikawa, S. Crystalline mesoporous Nb2O5 nanoparticles synthesized via a surfactant-modified sol–gel process. Mater. Lett. 2012, 78, 135–138. [Google Scholar] [CrossRef]
  28. Liu, J.; Zhang, T.; Wang, Z.; Dawson, G.; Chen, W. Simple pyrolysis of urea into graphitic carbon nitride with recyclable adsorption and photocatalytic activity. J. Mater. Chem. 2011, 21, 14398. [Google Scholar] [CrossRef]
  29. Greenwood, N.N.; Earnshaw, A. Chemistry of the Elements, 2nd ed; Butterworth-Heinemann: Oxford, UK, 1998. [Google Scholar]
  30. Yamashita, H.; Harada, M.; Misaka, J.; Takeuchi, M.; Neppolian, B.; Anpo, M. Photocatalytic degradation of organic compounds diluted in water using visible light-responsive metal ion-implanted TiO2 catalysts: Fe ion-implanted TiO2. Catal. Today 2003, 84, 191–196. [Google Scholar] [CrossRef]
  31. Malengreaux, C.M.; Pirard, S.L.; Léonard, G.; Mahy, J.G.; Klobes, B.; Herlitschke, M.; Hermann, R.; Heinrichs, B.; Bartlett, J.R. Study of the photocatalytic activity of Fe3+, Cr3+, La3+ and Eu3+ single- doped and co-doped TiO2 catalysts produced by aqueous sol-gel processing. J. Alloys Compd. 2017, 691, 726–738. [Google Scholar] [CrossRef]
  32. Yoshimura, K.; Miki, T.; Iwama, S.; Tanemura, S. Characterization of niobium oxide electrochromic thin films prepared by reactive d.c. magnetron sputtering. Thin Solid Films 1996, 281–282, 235–238. [Google Scholar] [CrossRef]
  33. Weibin, Z.; Weidong, W.; Xueming, W.; Xinlu, C.; Dawei, Y.; Changle, S.; Li, B. The investigation of NbO2 and Nb2O5 electronic structure by XPS, UPS and first principles methods. Surf. Interface Anal. 2013, 45, 1206–1210. [Google Scholar] [CrossRef]
  34. Scheidt, G. Caracterização óptica de filmes finos de NbOx obtidos por sputtering reativo. Master’s Degree in Nuclear Technology-Materials-Nuclear and Energy Research Institute, University of São Paulo, São Paulo, Brazil, 2014. [Google Scholar]
  35. Hamaguchi, R. Preparação, caracterização e estudo das propriedades fotocatalíticas de catalisadores obtidos de dopagem de TiO2 e Nb2O5. Master’s Degree, DQ-FFCLRP-USP, Ribeirão Preto, Brazil, 2011. [Google Scholar]
  36. Prado, A.G.S.; Bolzon, L.B.; Pedroso, C.P.; Moura, A.O.; Costa, L.L. Nb2O5 as efficient and recyclable photocatalyst for indigo carmine degradation. Appl. Catal. B 2008, 82, 219–224. [Google Scholar] [CrossRef]
  37. Gallo, I.F.L. Preparação e caracterização de fotocatalisadores heterogêneos de titânio e nióbio e avaliação do potencial de fotodegradação. Master’s Degree, FFCL-USP, Ribeirão Preto, Brazil, 2016. [Google Scholar]
  38. Dalponte, I.; Mathias, A.L.; Jorge, R.M.M.; Weinschutz, R. Degradação fotocatalítica de tartrazina com TiO2 imobilizado em esferas de alginato. Quim. Nova. 2016, 39, 1165–1169. [Google Scholar] [CrossRef]
  39. Kosera, V.S.; Cruz, T.M.; Chaves, E.S.; Tiburtius, E.R.L. Triclosan degradation by heterogeneous photocatalysis using ZnO immobilized in biopolymer as catalyst. J. Photochem. Photobiol. 2017, 344, 184–191. [Google Scholar] [CrossRef]
  40. Son, H.-S.; Lee, S.-J.; Cho, I.-H.; Zoh, K.-D. Kinetics and mechanism of TNT degradation in TiO2 photocatalysis. Chemosphere 2004, 57, 309–317. [Google Scholar] [CrossRef]
  41. Lenzi, G.G.; Fávero, C.V.B.; Colpini, L.M.S.; Bernabe, H.; Baesso, M.L.; Specchia, S.; Santos, O.A.A. Photocatalytic reduction of Hg(II) on TiO2 and Ag/TiO2 prepared by the sol–gel and impregnation methods. Desalination 2011, 270, 241–247. [Google Scholar] [CrossRef]
Figure 1. XRD pattern of Fe/Nb2O5 sample where (*) TT phase (pseudo-hexagonal form) (#) T phase (orthorhombic form).
Catalysts 09 00343 g001
Figure 2. MEV/EDS of sample (A) 0.3% Fe/Nb2O5 773 K, (B) 1.5% Fe/Nb2O5 at 873 K, increase 500×.
Catalysts 09 00343 g002aCatalysts 09 00343 g002b
Figure 3. Influence of photo-catalysts using TiO2 and Nb2O5 (calcined at 773K).
Catalysts 09 00343 g003
Figure 4. Influence of (A) pH (1% Fe/Nb2O5 calcined 773 K, 1.0 g L−1) and (B) catalyst mass (pH 7.0, 1.0% Fe/Nb2O5 calcined 773 K).
Catalysts 09 00343 g004
Figure 5. Adsorption and photo catalysis results (pH = 7.0, 1 g L−1).
Catalysts 09 00343 g005
Figure 6. Photo catalysis and photolysis in different matrices.
Catalysts 09 00343 g006
Figure 7. Generation of 2.8-DCDD from photocatalytic and photolytic processes in different matrices.
Catalysts 09 00343 g007
Figure 8. Photocatalytic reuse cycle (1.5%Fe/Nb2O5 calcined at 873 K).
Catalysts 09 00343 g008
Figure 9. (A) Response surface plot for degradation TCS by Nb2O5 versus wt % Fe and Temperature Calcination. (B) Surface contour obtained in the experimental design. (Coded variable Table 5).
Catalysts 09 00343 g009
Figure 10. Pareto chart (pH = 7.0, 1 g L−1, and 20 min of reaction).
Catalysts 09 00343 g010
Table 1. Summarizes the surface textural properties catalysts (Specific surface area (So), Micropore Volume (Vm), and average pore diameter (Dm).
Catalyst Fe/Nb2O5
wt %-T Calcination (K)
So (m2 g−1)Vm (cm3 g−1)Dm (Å)
0.3%-77349.510.0097233.03
0.5%-67320.260.0058933.25
0.5%-873148.830.0071633.05
1.0%-63329.550.0077233.16
1.0%-773149.630.0081633.34
1.0%-91325.420.0063533.10
1.5%-67364.900.0076933.07
1.5%-87321.240.0051833.34
1.7%-77343.440.0106433.25
Table 2. Result of band gaps UV–VIS.
Catalyst Fe/Nb2O5
wt %-TCalcination (K)
Band Gap (eV)Absorption Threshold
(nm)
0.3%-7733.88281
0.5%-6733.75281
0.5%-8733.94279
1.0%-6333.92281
1.0%-7733.90281
1.0%-9133.94281
1.5%-6733.28292
1.5%-8733.05300
1.7%-7733.85281
Table 3. Half-life t1/2, first-order reaction rate constant results.
wt %-Tcalcination (K)k (min−1)t1/2 (min)R2
0.3%-773 0.057012.160480.97926
0.5%-673 0.066610.406050.98392
0.5%-873 0.059511.649530.98398
1.0%-633 0.062311.125960.99583
1.0%-773 0.050013.862940.97886
1.0%-913 0.053812.893360.93194
1.5%-673 0.051413.485350.96524
1.5%-873 0.069010.045610.93221
1.7%-773 0.067010.345480.99106
R2 = Coefficient of Determination.
Table 4. Analysis of variance.
Source of VariationSum of Squares (SS)Degrees of Freedom (df)Mean Square
(MS)
FProb > F
Regression115.4253523.0850654.665445.05
Resisual2.111550.422297
Lack of Fit2.035630.67854517.89152119.16
Pure erro0.075920.037925
Total117.536810---
Table 5. Design matrix and experimental results for the central composite factorial design.
RunCalcination Temperature (K)%Fe and (Coded Variable)
1873 (+1)1.5 (+1)
2873 (+1)0.5 (−1)
3673 (−1)1.5 (+1)
4673 (−1)0.5 (−1)
5913 (+α)1.0 (0)
6633 (−α)1.0 (0)
7773 (0)0.3 (−α)
8773 (0)1.7 (+α)
9773 (0)1.0 (0)
10773 (0)1.0 (0)
11773 (0)1.0 (0)

