Article

Blockage Detection and Diagnosis of Externally Parallelized Monolithic Microreactors

1
Department of Chemical Engineering, Kyoto University, Nishikyo, Kyoto 615-8510, Japan
2
Department of Synthetic Chemistry and Biological Chemistry, Kyoto University, Nishikyo, Kyoto 615-8510, Japan
3
Emaus Kyoto Inc. R&D, 26 Nishida-cho, Saiin, Ukyo, Kyoto 615-0055, Japan
*
Authors to whom correspondence should be addressed.
Catalysts 2019, 9(4), 308; https://doi.org/10.3390/catal9040308
Submission received: 15 March 2019 / Accepted: 25 March 2019 / Published: 28 March 2019
(This article belongs to the Special Issue Catalysts for Suzuki–Miyaura Coupling Reaction)

Abstract

:
To realize stable operation of a microchemical system, it is necessary to develop a process monitoring method that can detect and diagnose blocked microreactors. In this study, a system composed of five monolithic microreactors and a split-and-recombine-type flow distributor (SRFD) was developed for Suzuki–Miyaura coupling. Firstly, the effects of operating conditions on the yield was examined by using a single microreactor. After that, an optimal design problem was formulated to maximize the blockage detection performance by adjusting the channel resistances of the SRFD and the sensor locations in the SRFD under the design constraints. To efficiently solve the problem, a pressure drop compartment model, which is analogous to electrical resistance networks, was used. The optimally designed system was experimentally evaluated from the viewpoint of the capability of continuous operation and the blockage detection and diagnosis performance. The evaluation results show that continuous operation was successfully carried out for one hour, and that the artificially generated blockage of each microreactor was accurately identified. The developed system minimized the process performance degradation due to blockage.

1. Introduction

Continuous flow microreactor technology has attracted great attention from chemical, pharmaceutical, and agrochemical industries. Microreactors (MRs) have many advantages, such as rapid mixing, high heat transfer, and accurate control of short residence times. These advantages offer greater control of the reaction conditions, which leads to improved product selectivity and yield when compared to batch methods. However, since the throughput of each MR is low, the numbering-up approach, which means the parallelization of MRs, is often adopted to increase the production amount [1].
In a numbering-up system, the uniform flow distribution is the most important issue. Use of multiple sensors and actuators makes it possible to control the flow rate to each MR, but leads to a complicated system which would cause various problems during operation. Therefore, it has been desirable to develop a system or device that spontaneously controls the distributed flow to ensure uniformity of the flow rate of MRs. Several kinds of flow distributors (FDs) have been developed, so far, for uniform distribution throughout the numbering-up system. Among the developed FDs, split-and-recombine-type FDs (SRFDs) were used for the detection and diagnosis of a blocked MR using a small number of sensors [2], but their usefulness has not been assessed in reaction processes.
Cross-coupling reactions serve as a powerful method for carbon–carbon bond formation in the synthesis of a variety of functional materials and biologically active compounds [3]. The Suzuki–Miyaura cross-coupling reaction can be regarded as one of these important bond-formation processes. Valsartan is one of the synthetic angiotensin II inhibitors, and holds the largest market share (for example, Diovan, Novartis, recorded sales worth US $4.2 billion in 2006) [4,5,6]. Goosen et al. have reported a synthetic process for the preparation of a key intermediate 3 (Figure 1) of valsartan via decarboxylation with a copper/phenanthroline [7]. Littke et al. have also reported a synthetic process for the preparation of 3 via homogeneous Pd-catalyzed Suzuki–Miyaura coupling [8]. However, a more efficient, versatile, and practical method for the synthesis of key intermediate 3 of valsartan has been required. Nagaki et al. have reported that Suzuki–Miyaura coupling of 2 prepared from o-cyanobromobenzene (1) and p-iodobenzaldehyde using monolithic MRs, where palladium on monolith is used as a catalyst, and serves as a more practical way to synthesize valsartan via compound 4, as shown in Figure 1 [9].
In this study, a numbering-up system consisting of five monolithic MRs connected to an SRFD with function of blockage detection was developed, and the practicality of the system was demonstrated using a Suzuki–Miyaura coupling reaction. To design the numbering-up system, the channel resistances and sensor locations in the SRFD were optimized to achieve high performance of the blockage detection. After constructing the experimental system based on the design result, its continuous operation was carried out for an hour. In addition, the usefulness of the previously proposed blockage detection and diagnosis method [2] was evaluated for an artificially generated blockage.

2. Design of the Numbering-Up System

A numbering-up system was designed as follows: First, the relationship between the operating conditions and the yield of a given monolithic MR was investigated by experiment. Next, the required number of the MRs was determined on the basis of the experimental result and the specified production amount. Then, a numbering-up system including MRs, an SRFD, and two sensors was efficiently designed using the pressure drop compartment (PDC) model, which is analogous to an electrical resistance network.

2.1. Study of the Reaction Conditions

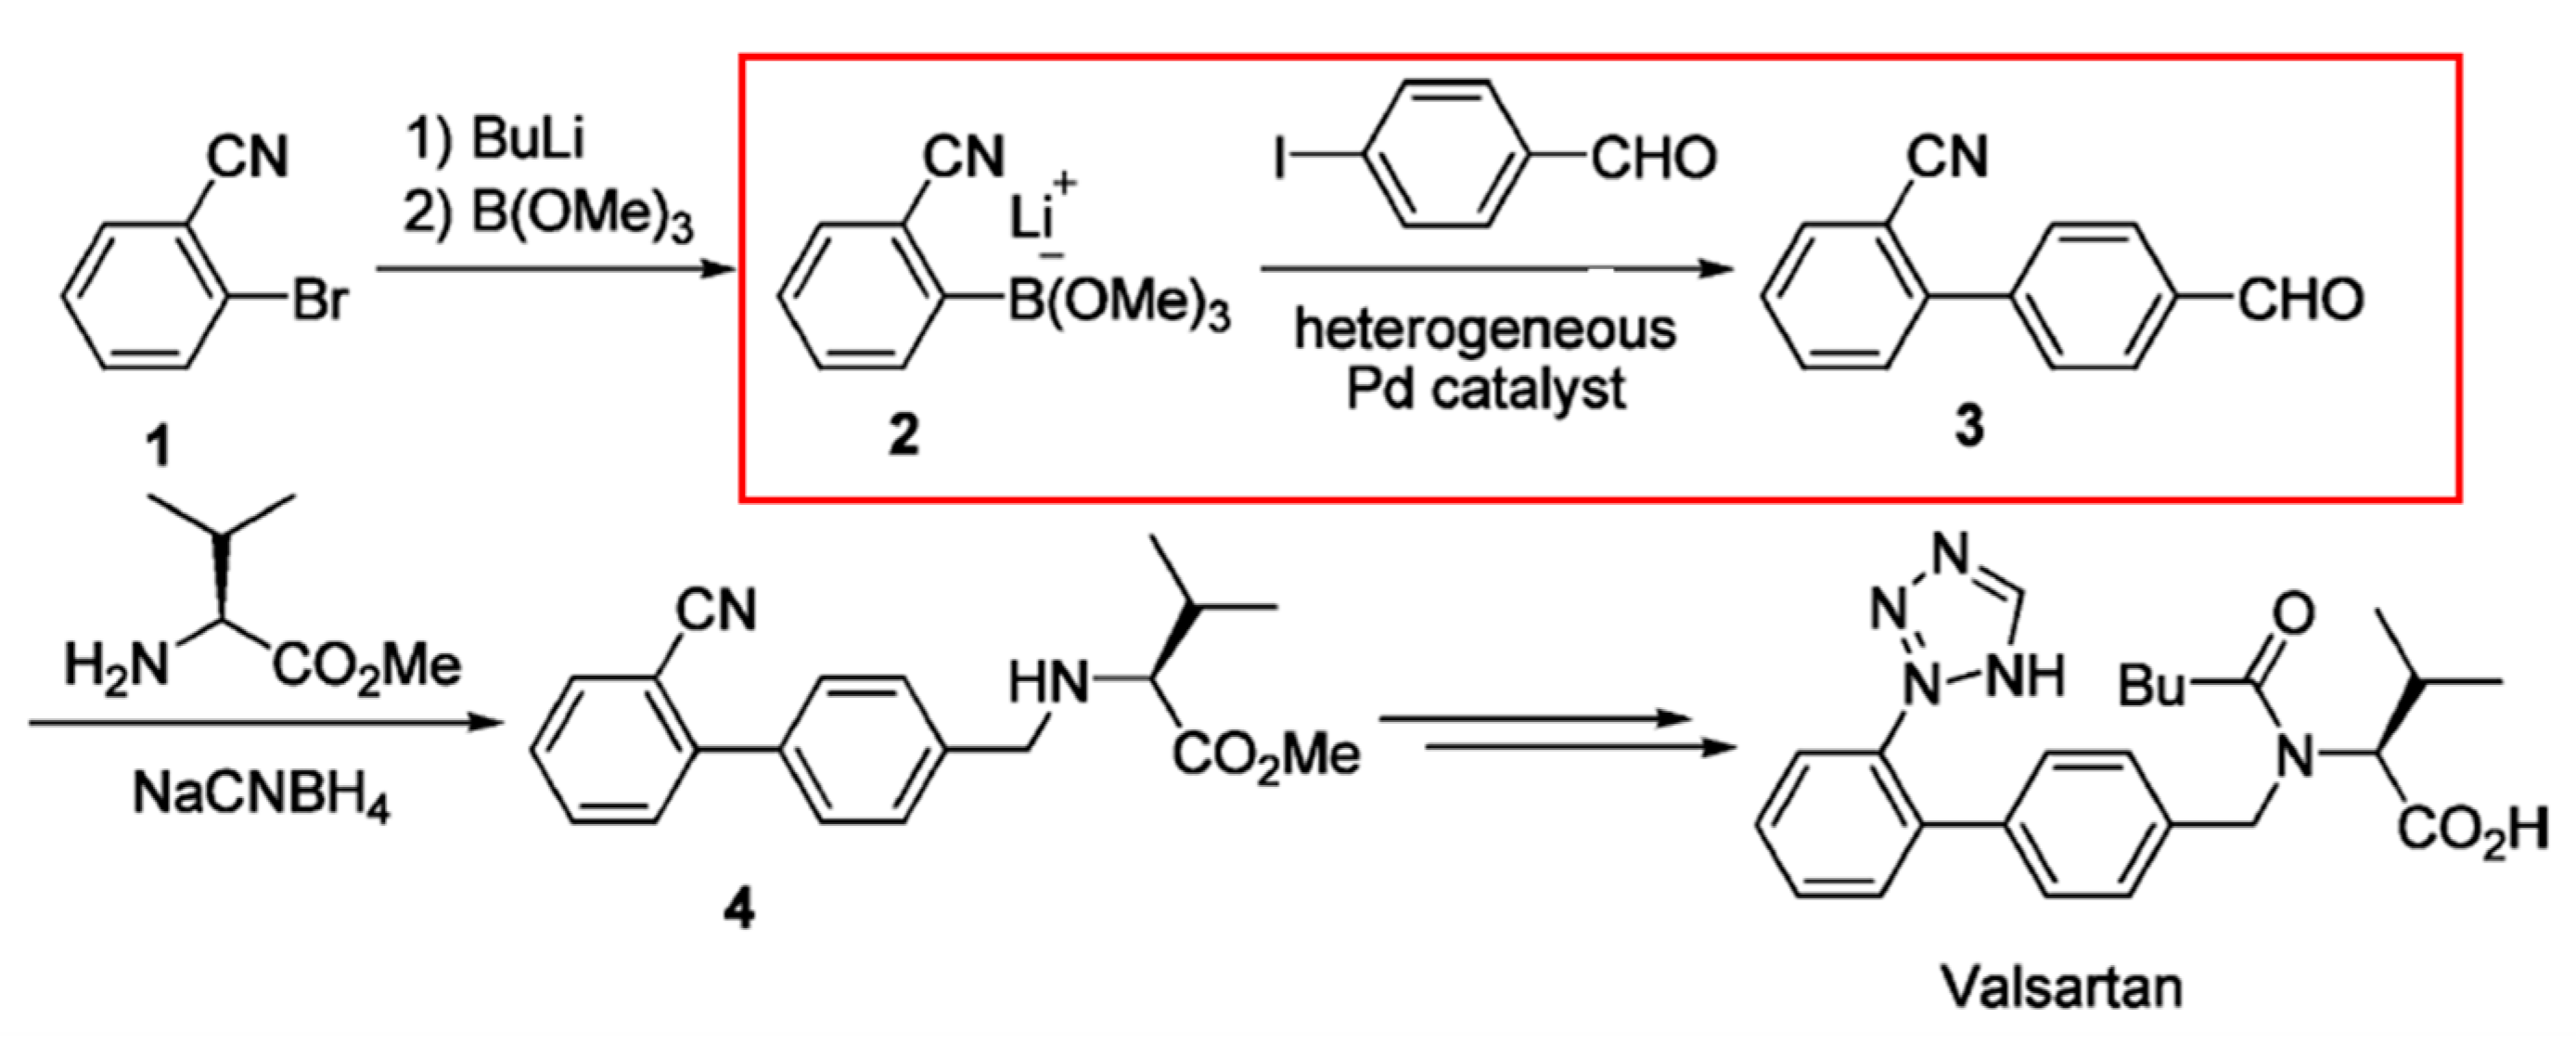
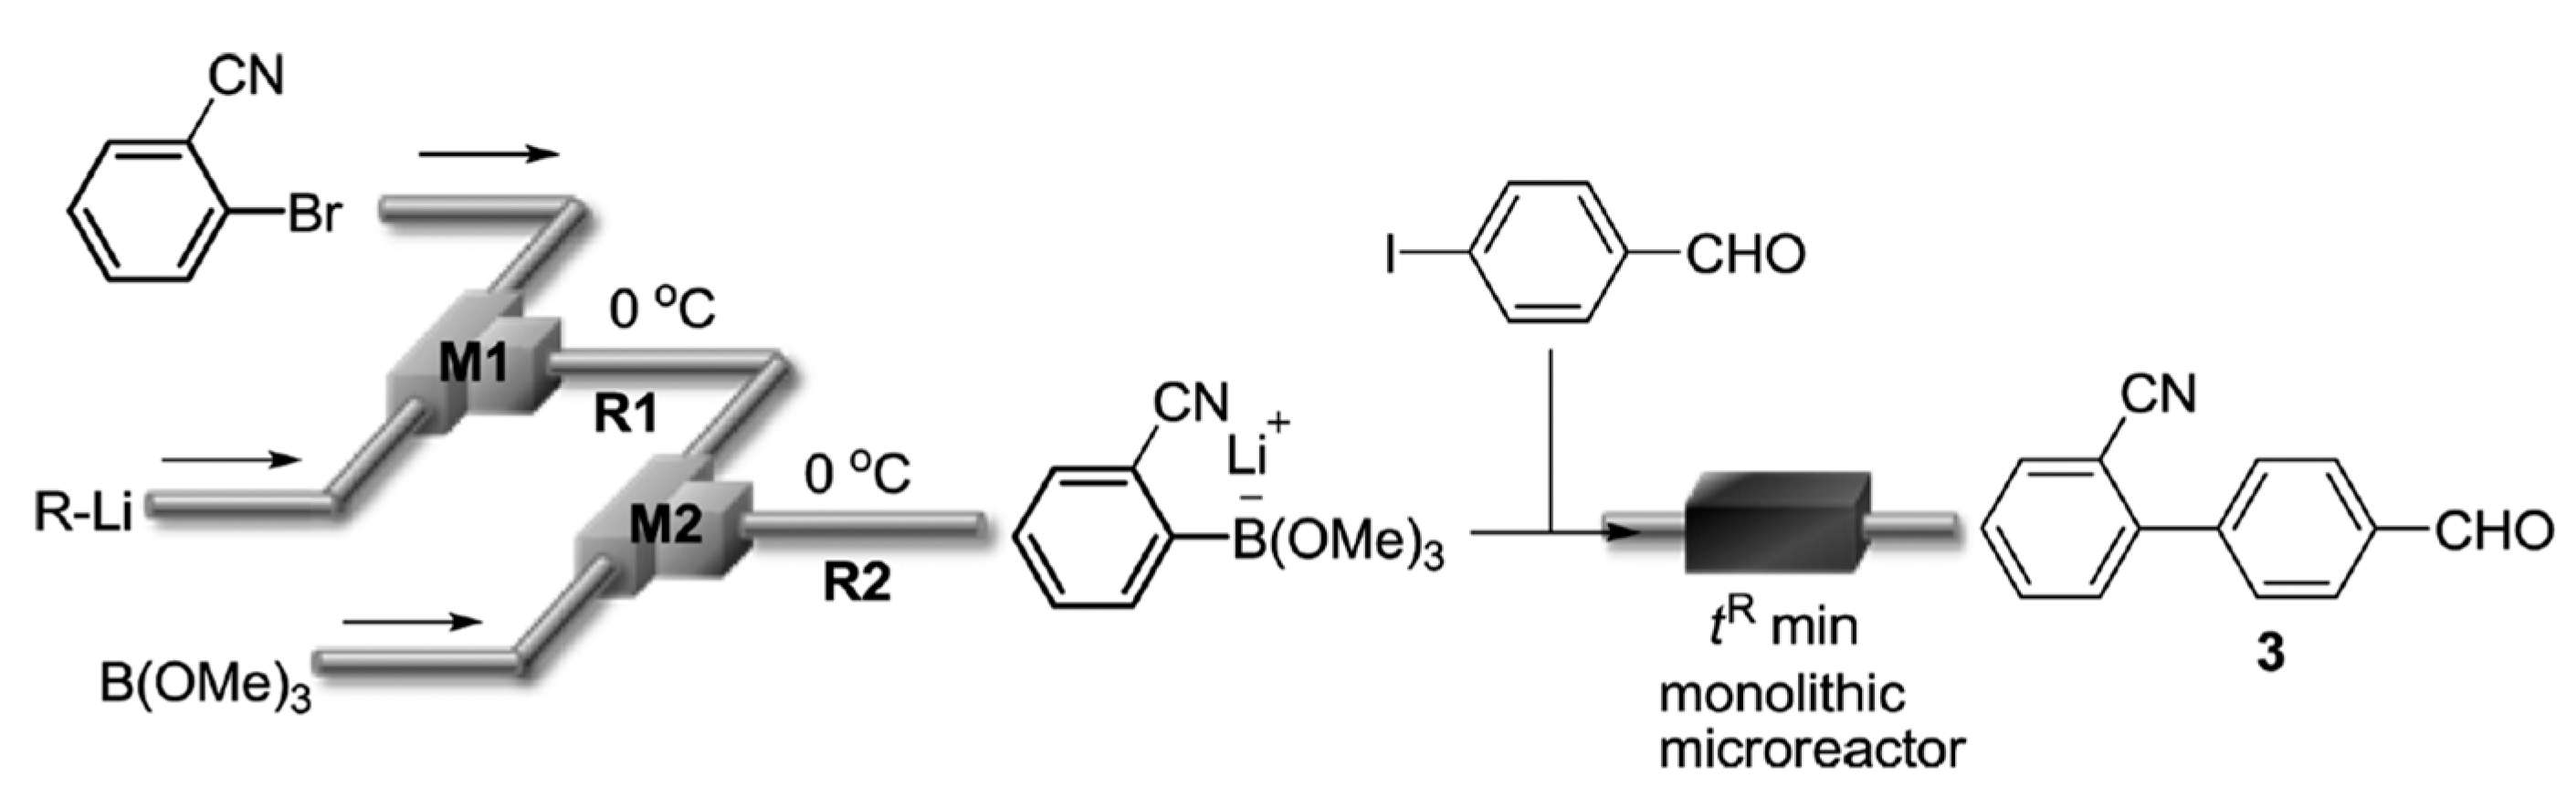
Figure 1 shows a synthesis route of valsartan. In this study, although we focus on the coupling reaction, namely, the reaction from 2 to 3, we will first explain how to synthesize the organoboron component (2) from o-cyanobromobenzene (1). Component 2 was generated in an MR system composed of two stainless steel T-shaped mixers (M1 (inner diameter = 500 μm) and M2 (inner diameter = 500 μm) manufactured by Sanko Seiki Co., Inc.) and two stainless steel tube reactors (R1 (inner diameter = 1000 μm, length = 12.5 cm) and R2 (inner diameter = 1000 μm, length = 50 cm) at 0 °C, as shown in Figure 2. The mixers and tube reactors were connected with stainless steel fittings (GL Sciences, 1/16 OUW). A solution of o-cyanobromobenzene (0.10 M in THF, flow rate: 6.0 mL/min) and a solution of n-BuLi (0.40 M in hexane, flow rate: 1.5 mL/min) were introduced into M1 by syringe pumps. The resulting solution was passed through R1 (0.79 s) and was mixed with a solution of trimethoxyborane (0.20 M in THF, flow rate: 3.0 mL/min) at M2. The resulting solution was passed through R2 (2.2 s) [
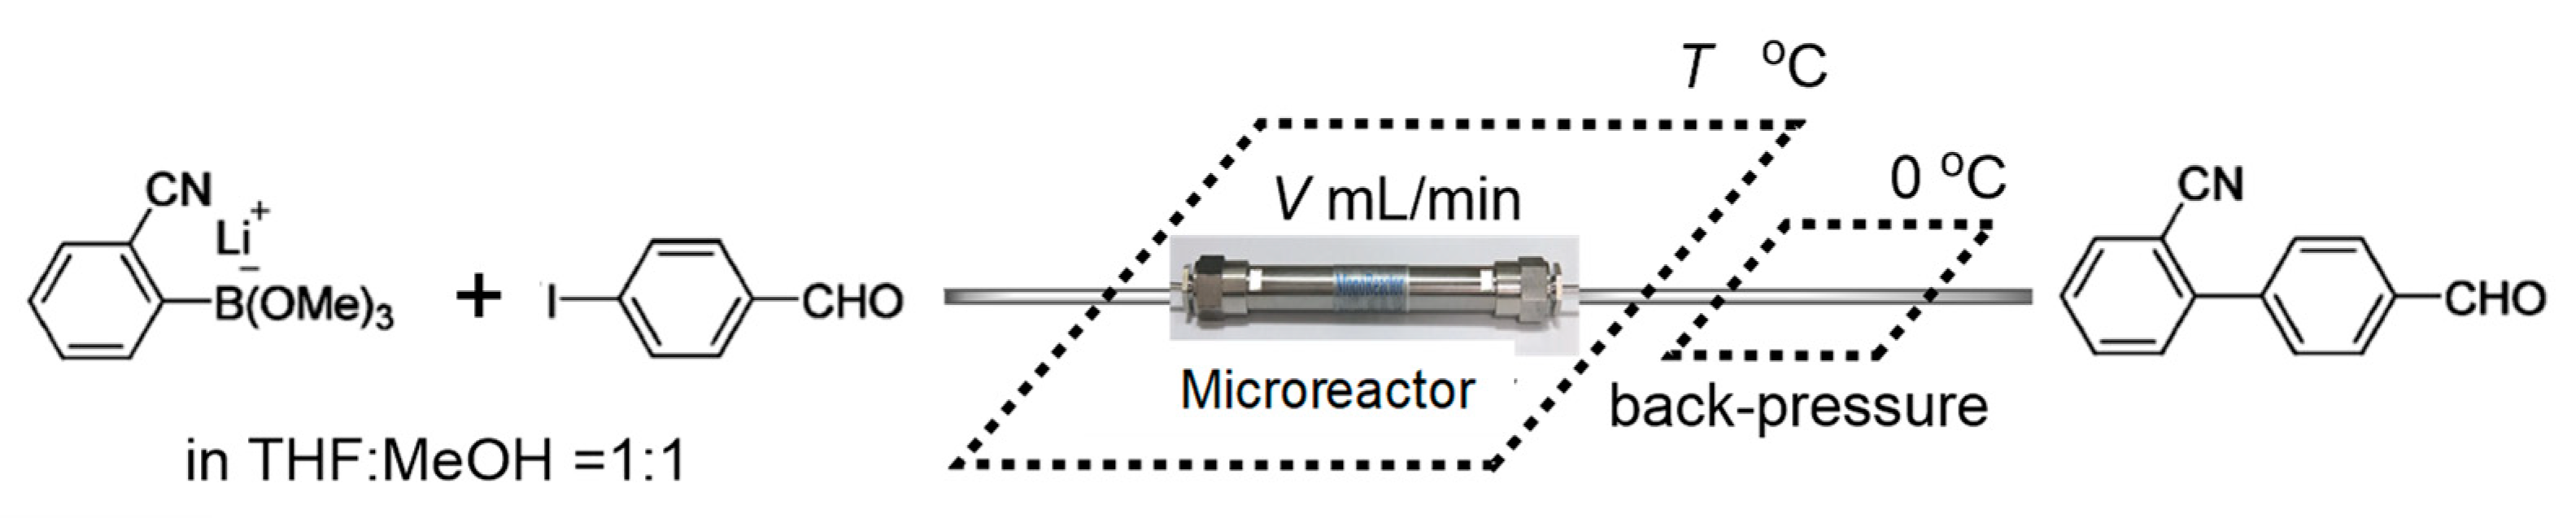
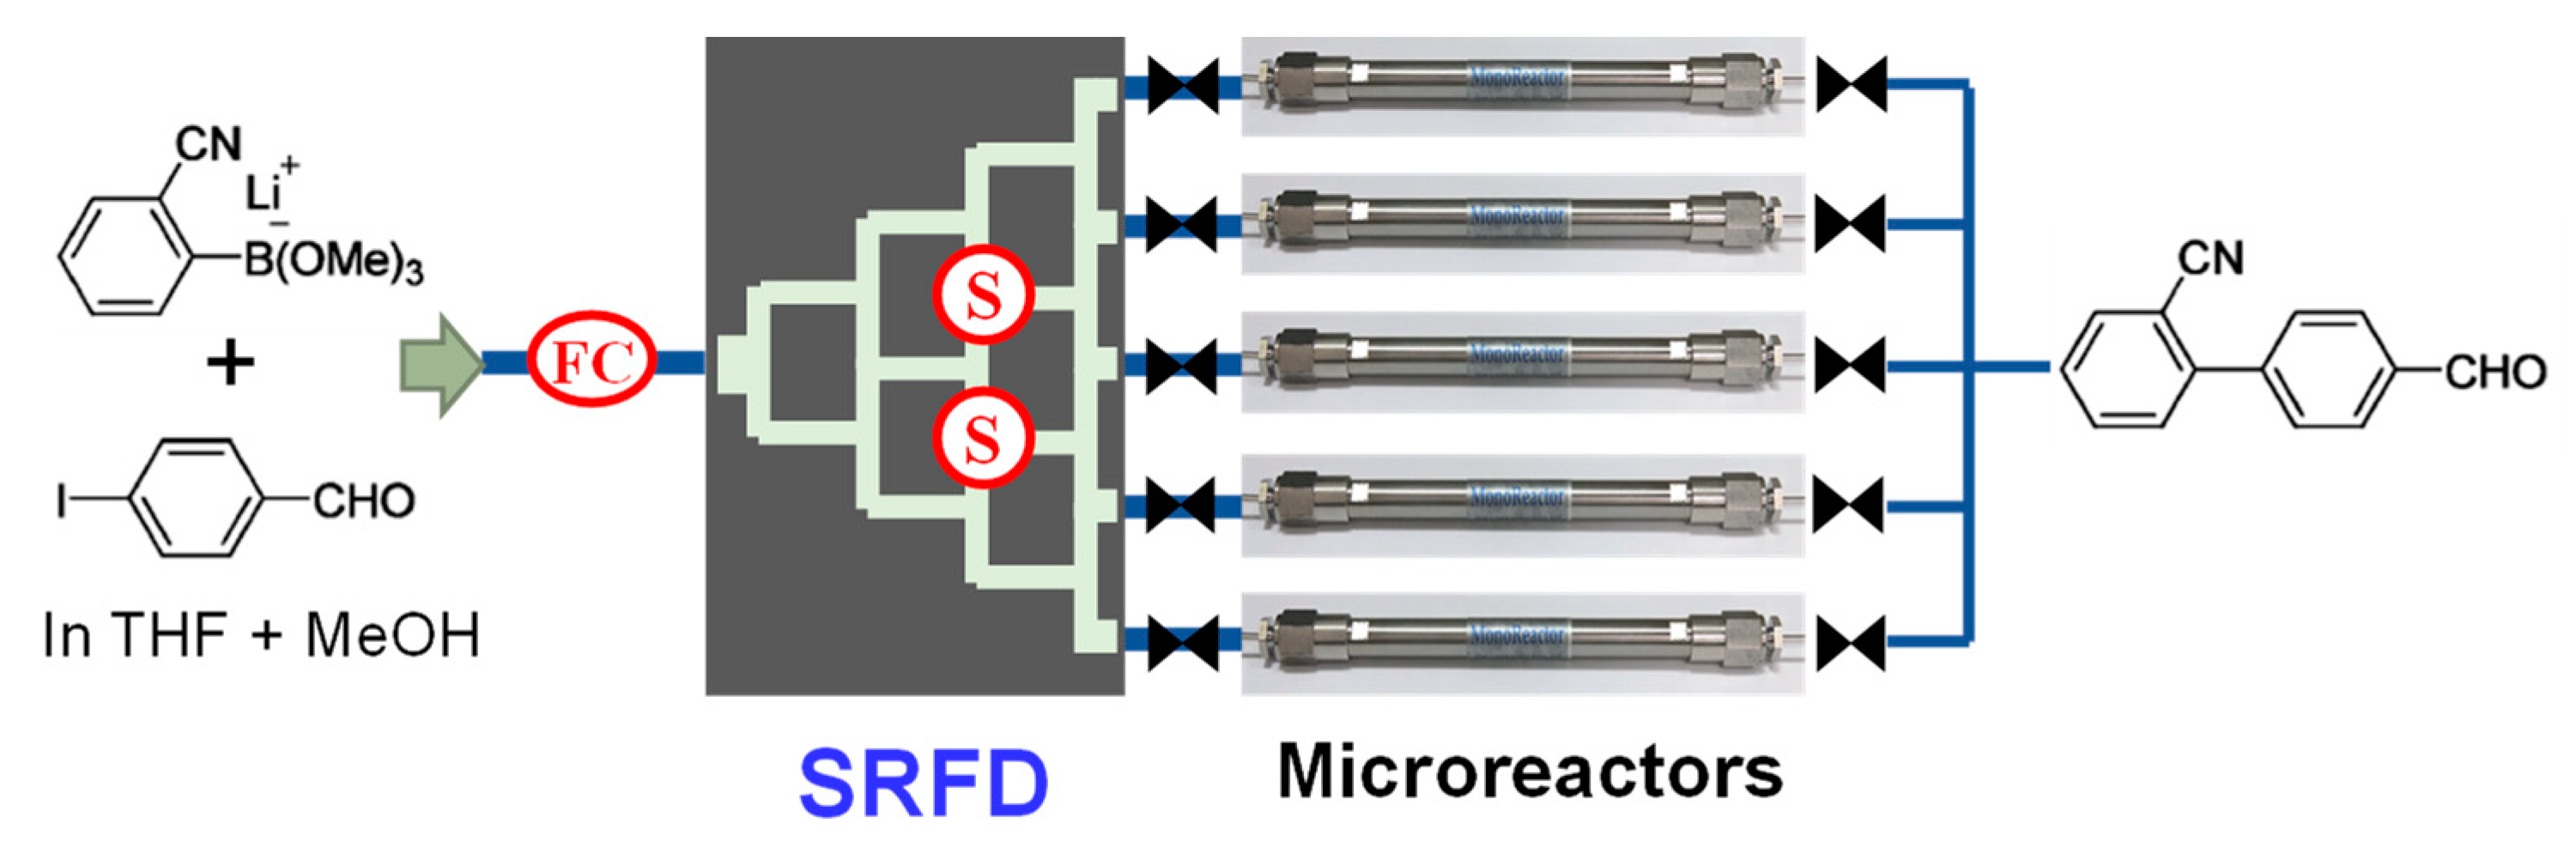
10]. The resulting solution was collected in a vessel. Then, a solution of p-iodobenzaldehyde (0.033 M in MeOH, 0.25 equiv.) was added, and the mixing solution was introduced to a monolithic MR produced by Emaus Kyoto Inc. R&D, in which the reaction from 2 to 3 was carried out.
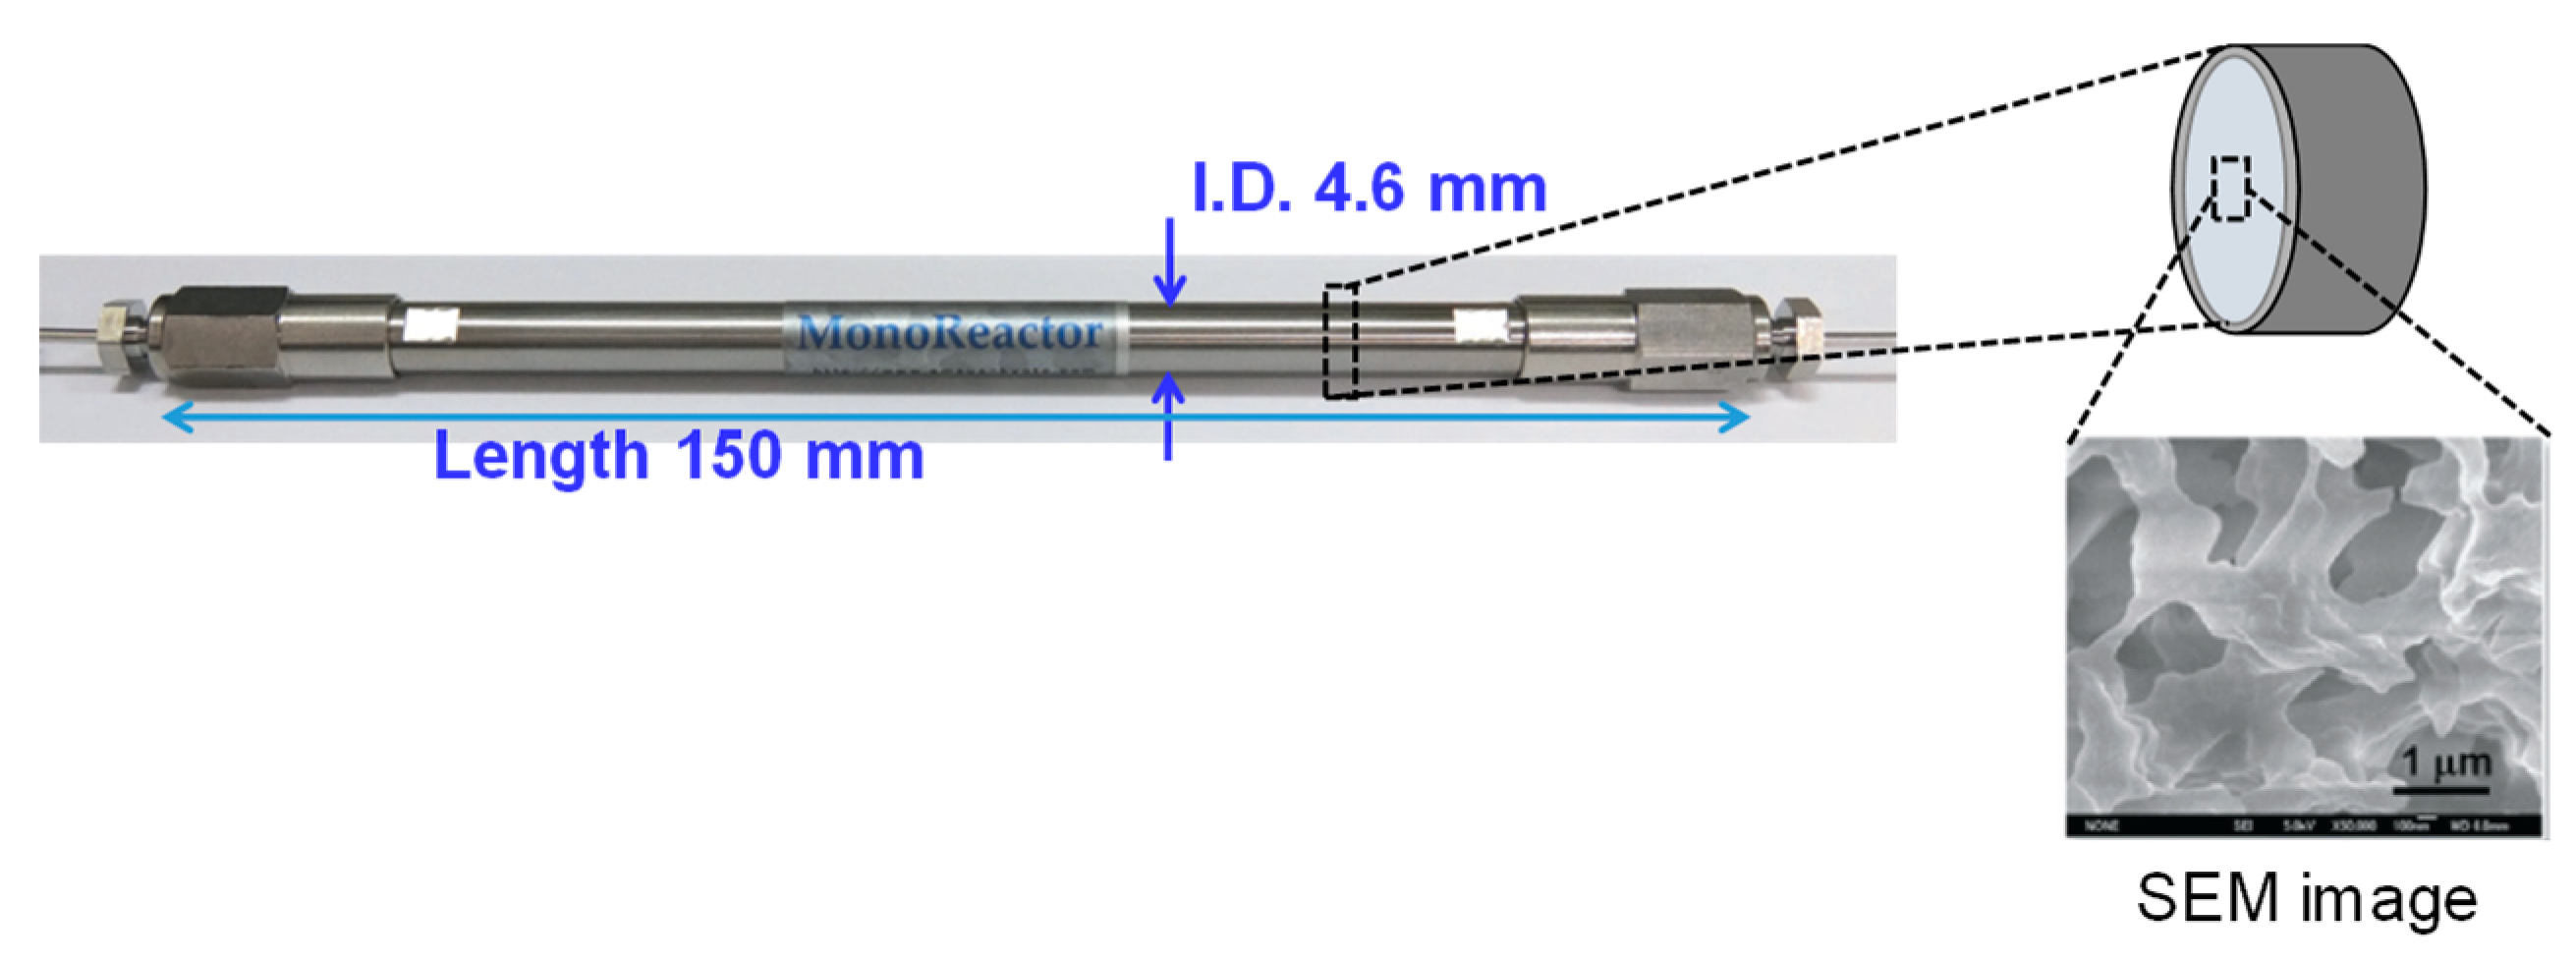
The monolithic MR has a total length of 150 mm and an inside diameter of 4.6 mm. 
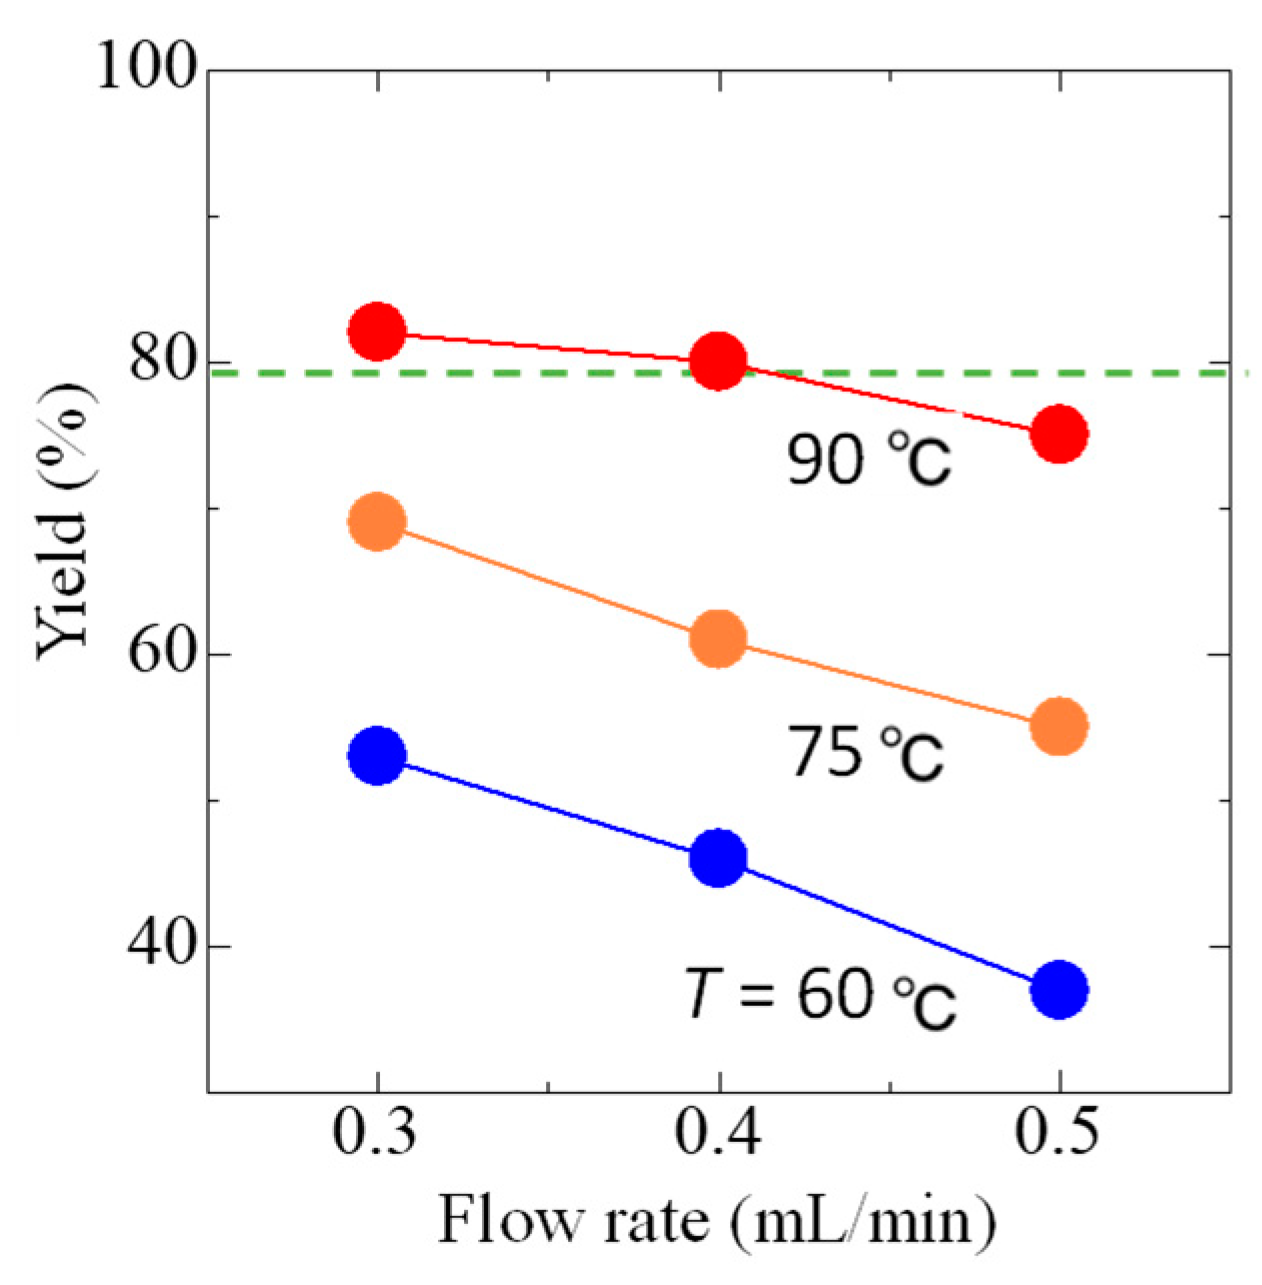
Figure 3 shows a photo of the reactor and an SEM image of the monolith structure inside the reactor. Palladium was supported on the monolith and can be used as a catalyst. The monolithic MRs show good flow characteristics, such as low pressure drop. The operation conditions, such as concentration, pressure, temperature, and flow rate (reaction time), have an impact on the reactor characteristics. In this study, the feed concentration was given from the previous process, and the pressure was set to 400 kPa to avoid boiling. Under this condition, the effects of flow rate and temperature on yield were experimentally investigated using a single reactor system, which is shown in Figure 4. After a steady state was reached, the product solution was collected (10 min). The yield of product was determined by GC analysis. The product was also isolated for characterization. Based on the experimental results shown in Figure 5, it was decided that the reaction would be carried out at a flow rate of 0.4 mL/min and temperature of 90 °C, because they could achieve a high yield and large throughput. Based on this, if the total production rate is set to 2 mL/min, it is necessary to parallelize five reactors in the numbering-up system.

2.2. Design Problem Formulation

When the numbering-up system composed of five reactors was designed, the most important point was to realize uniform flow distribution. Typical FDs are either bifurcation-type or manifold-type. The former cannot be applied to our system because the number of parallelized reactors is limited to 2n (where n is an integer). The latter could be applied to our system, making it be possible to realize uniform flow distribution by adjusting channel resistances or by installing flow controllers at all reactors, and to identify a blocked reactor by installing sensors at all reactors. However, if the number of reactors further increase, the number of controllers and sensors becomes even larger. A large number of controllers and sensors are not realistic in terms of cost and maintenance. In a previous study, the SRFD, which consists of bifurcation points, junction points, and channels, was proposed as a new type of FD [
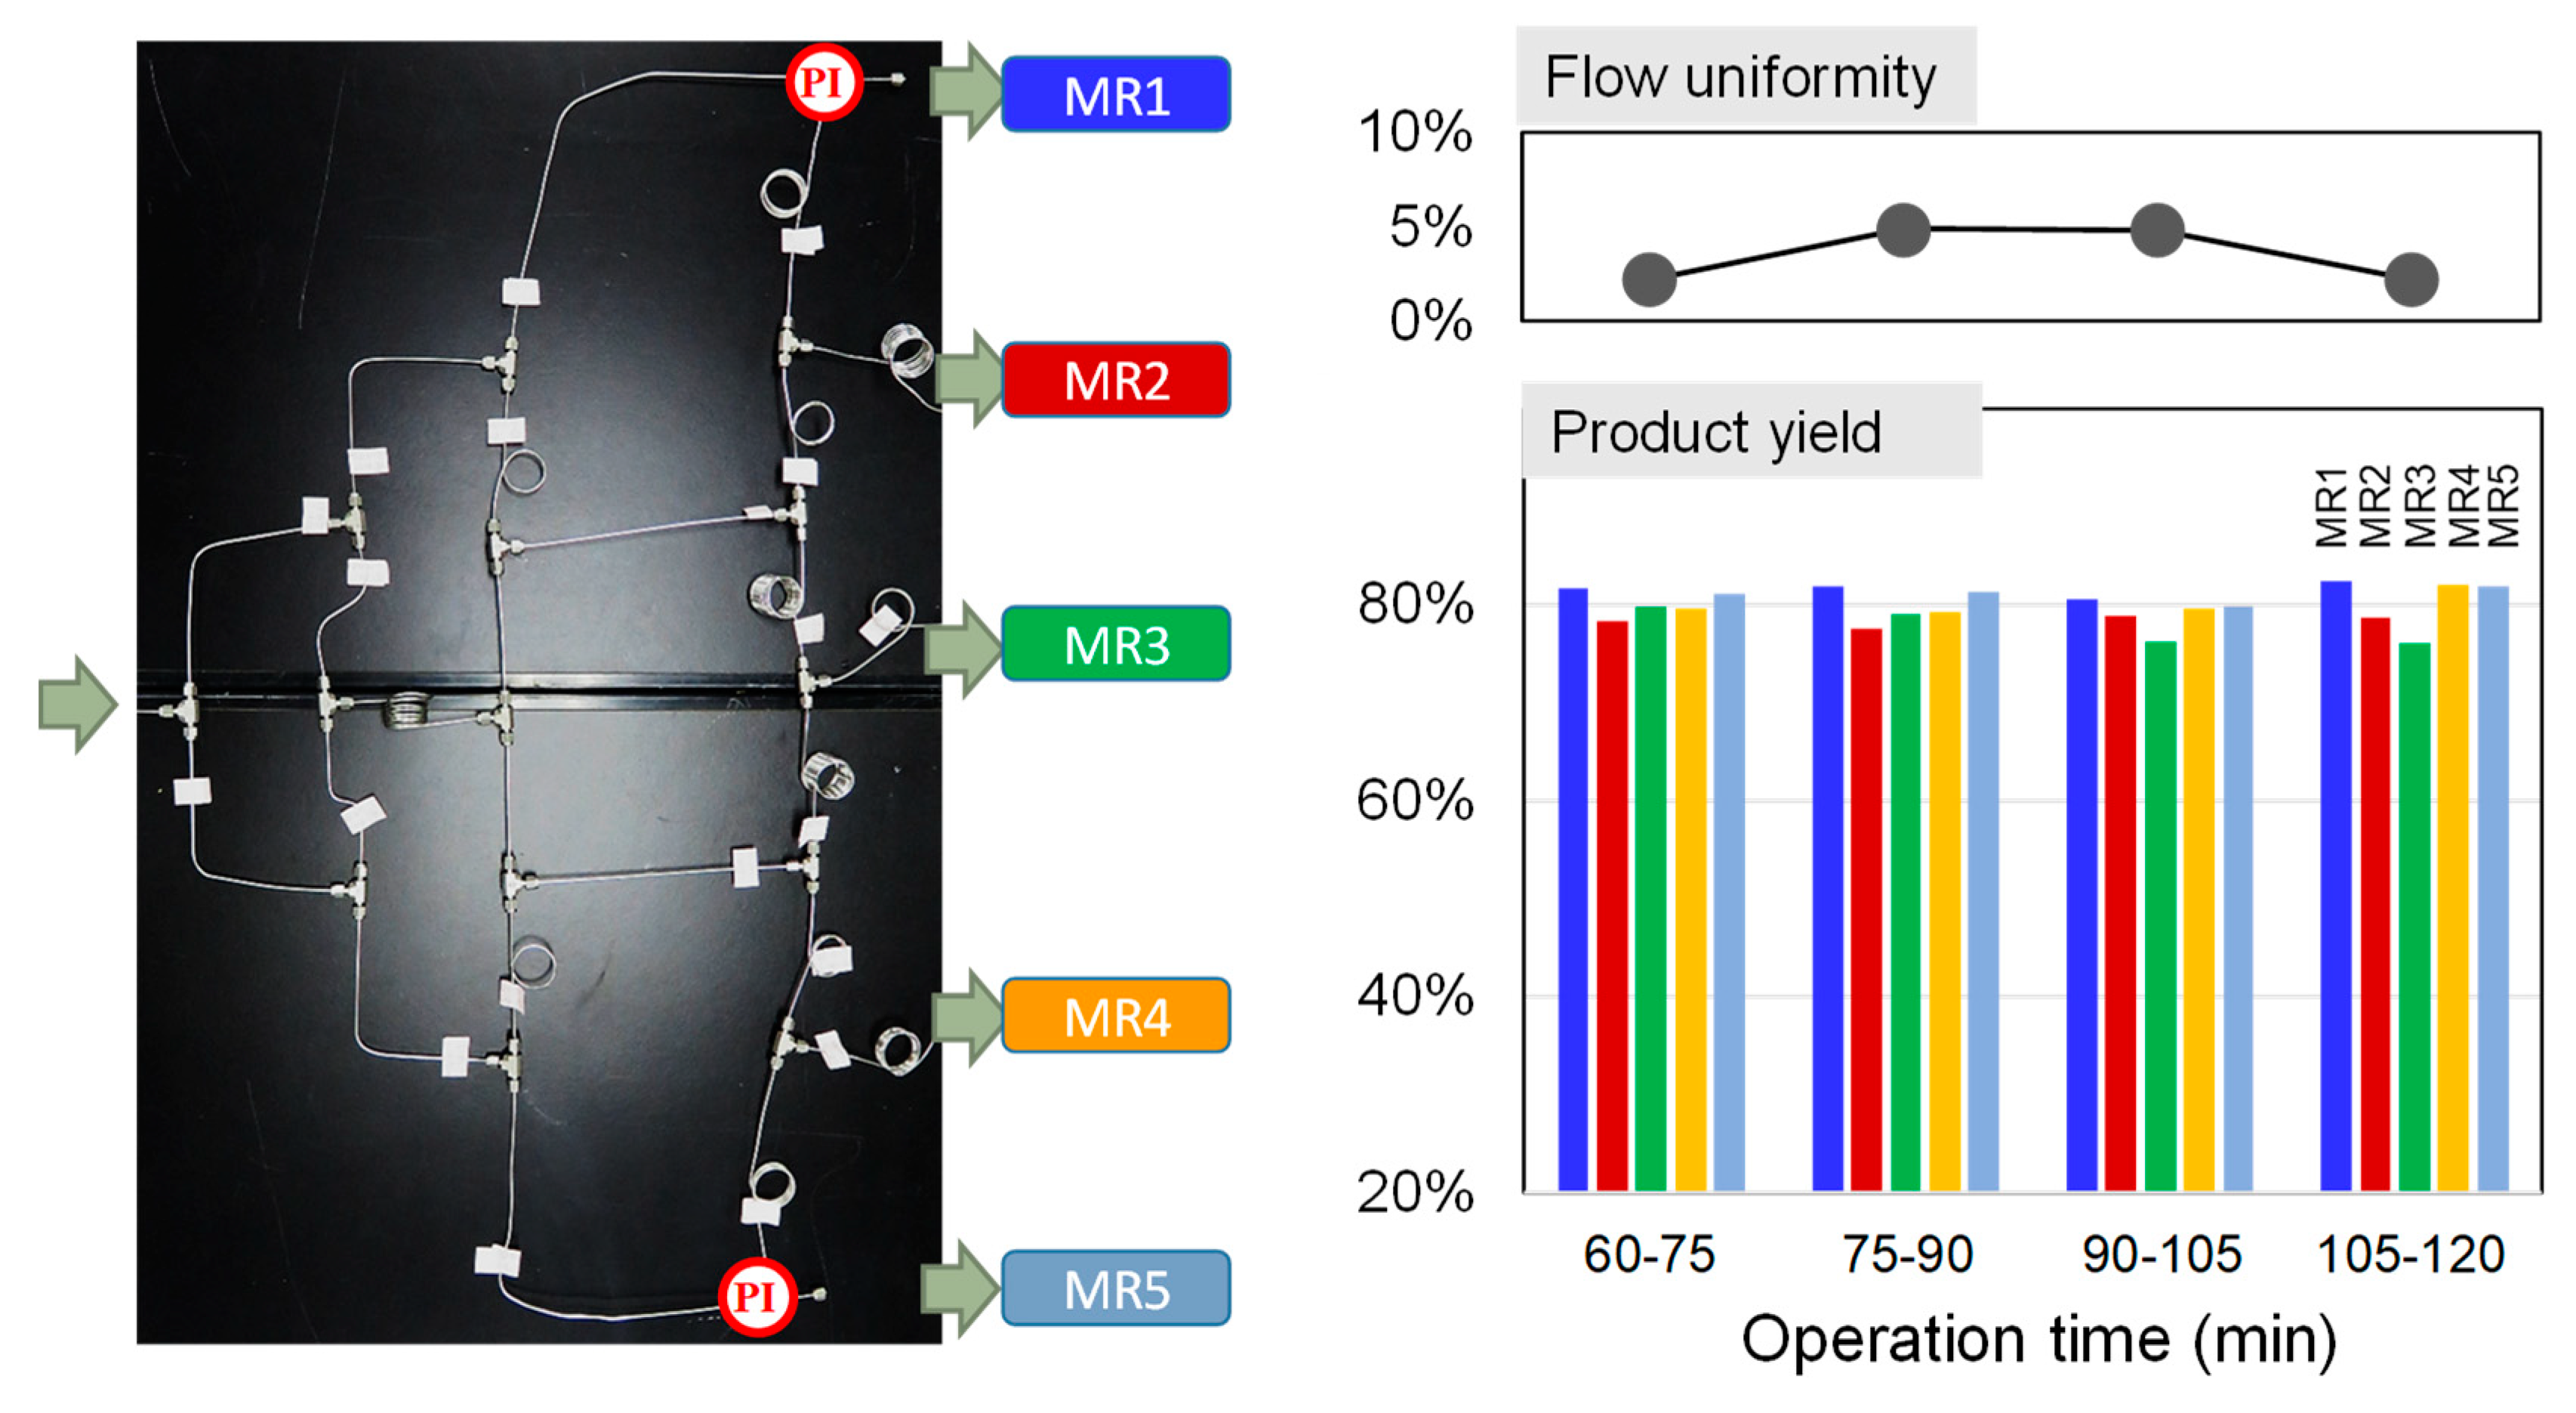
2]. The SRFD makes it possible to control the flow distribution by adjusting channel resistances and to identify a blocked reactor by using two sensors. In this study, the SRFD was used to construct a numbering-up system consisting of five monolithic MRs, as shown in 
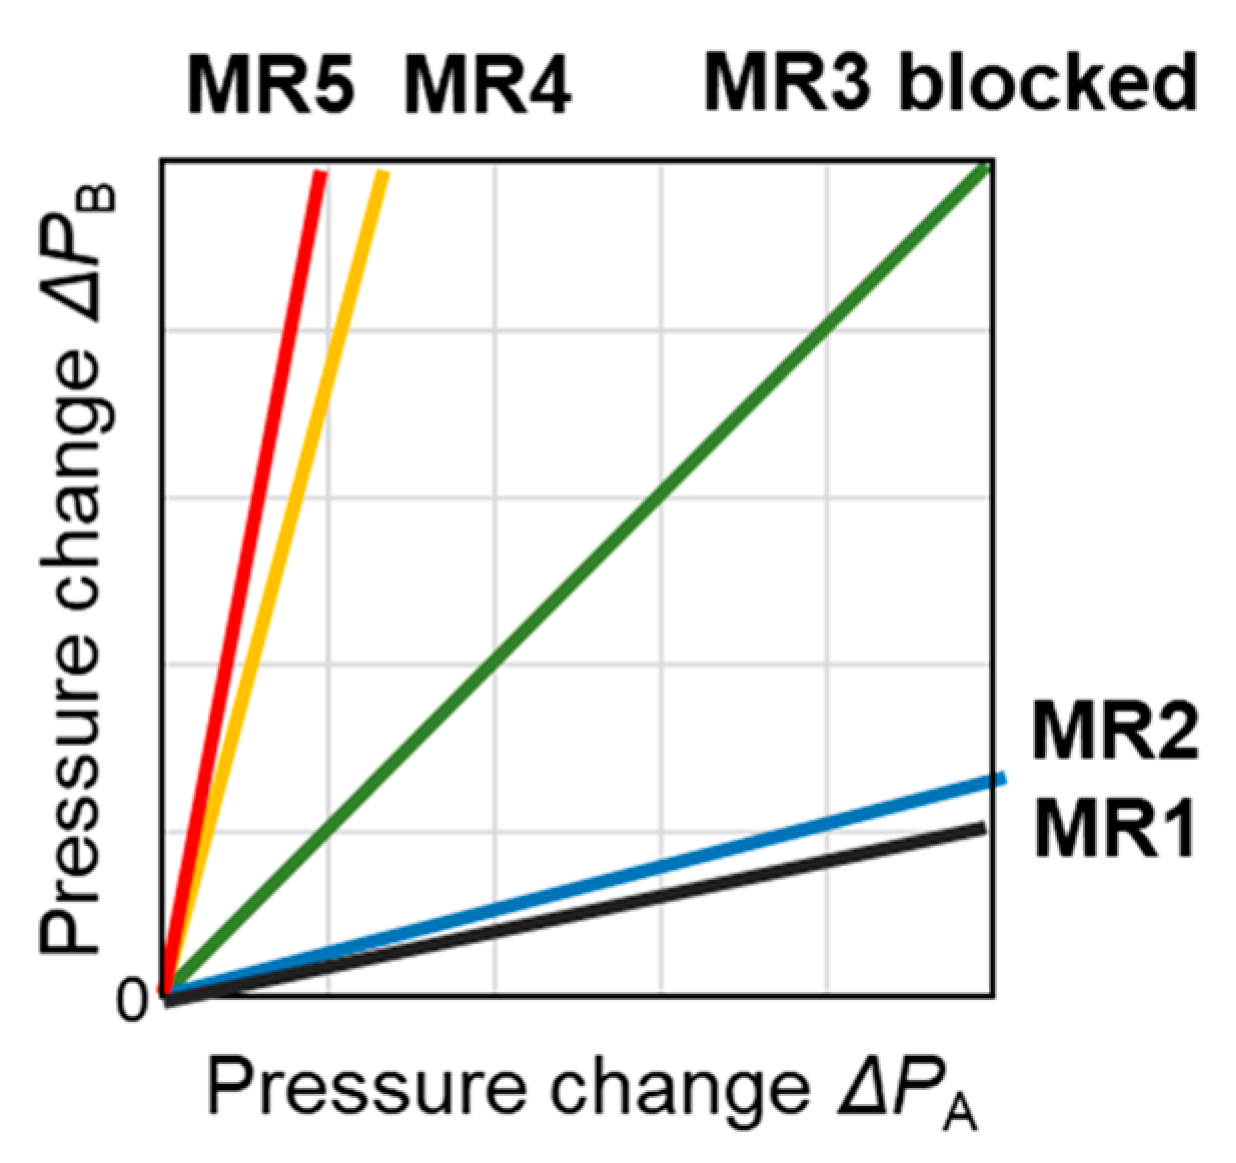
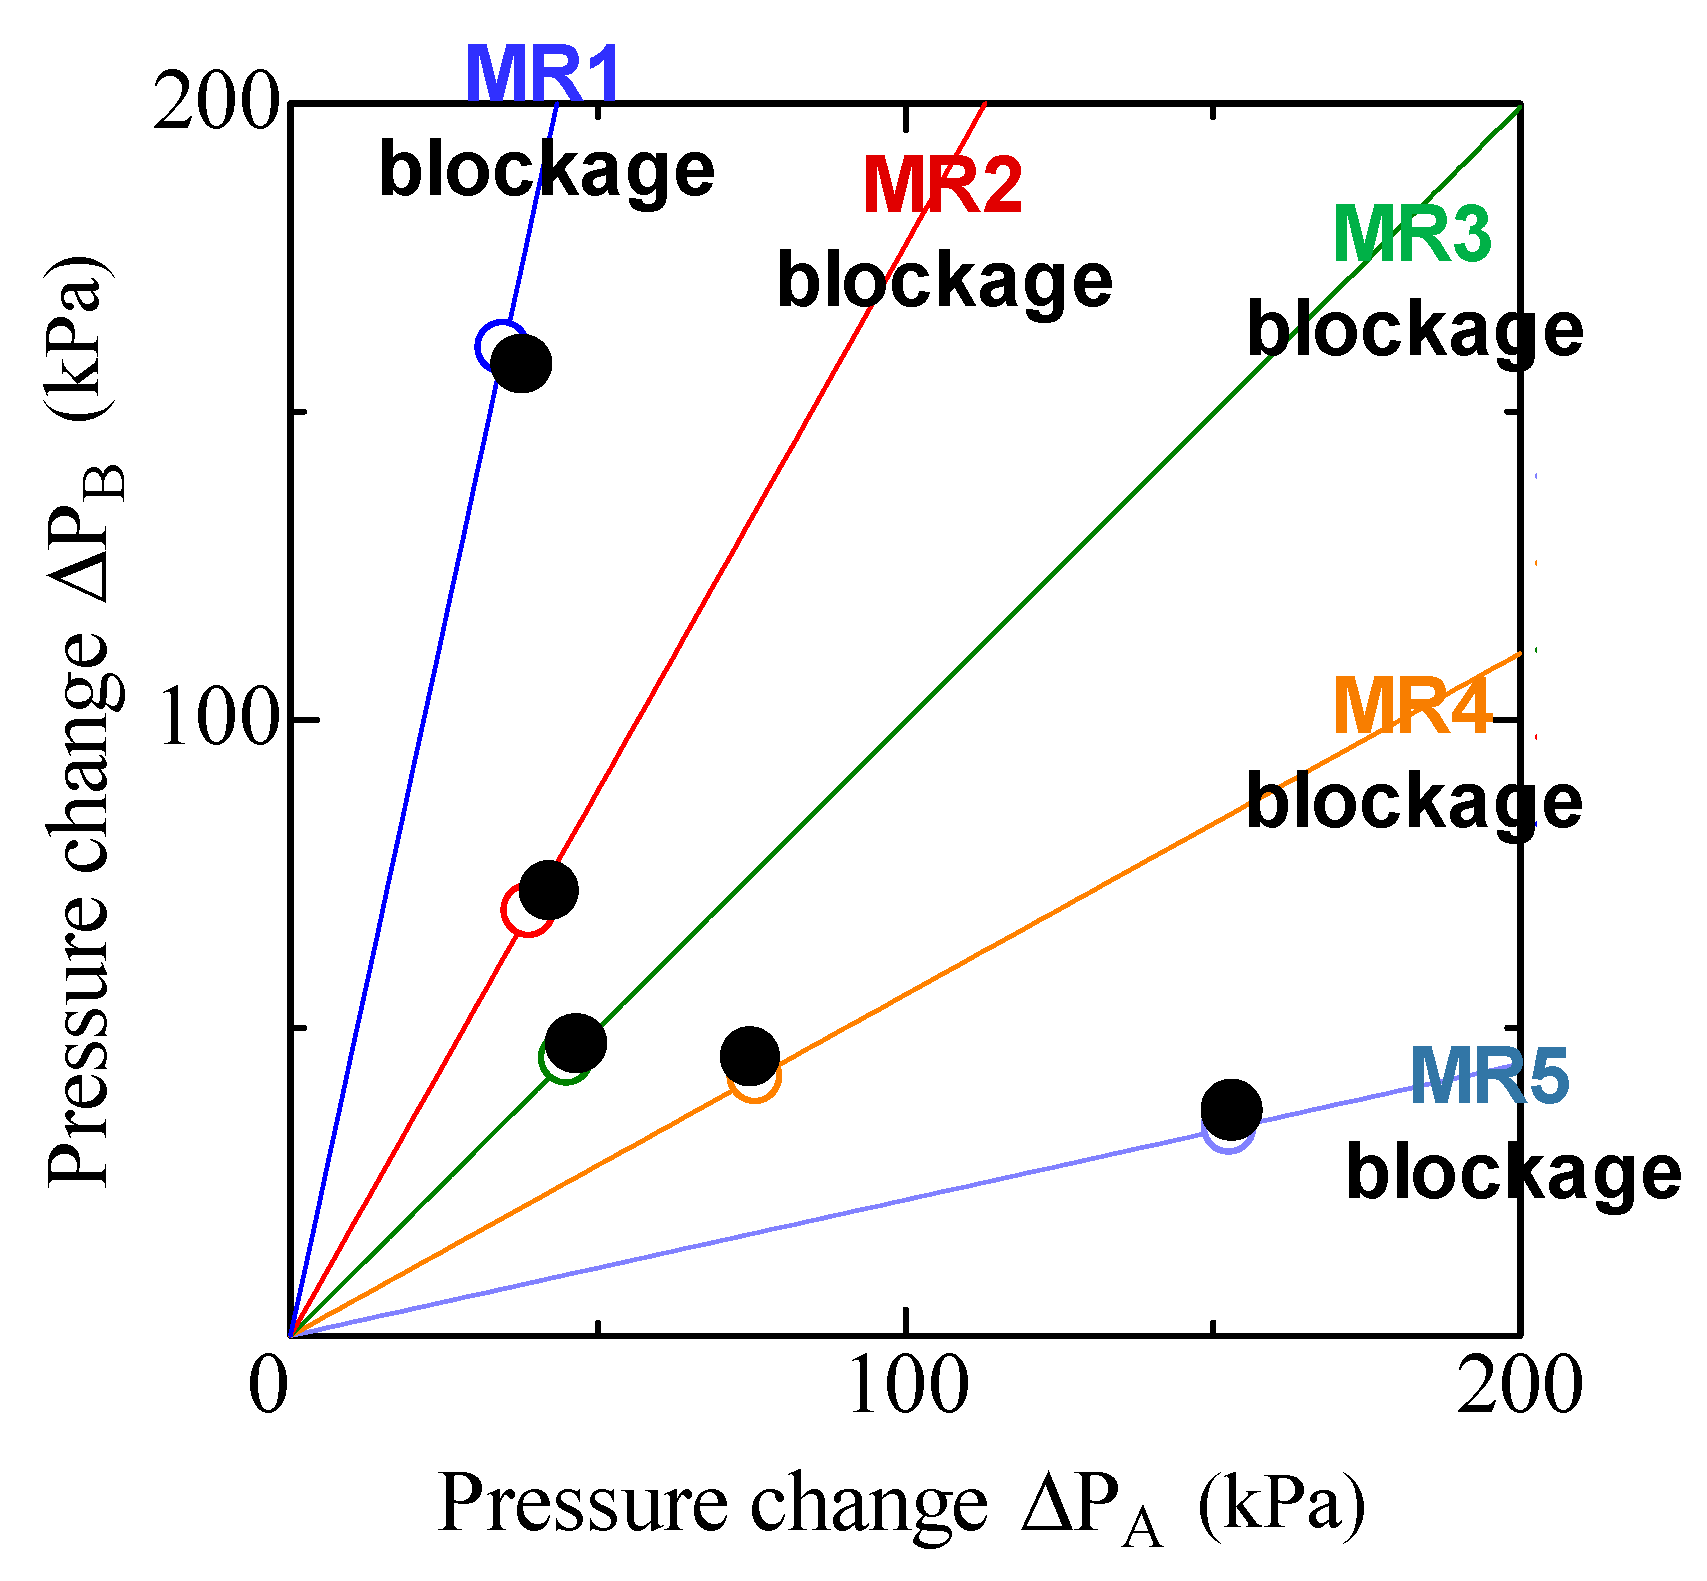
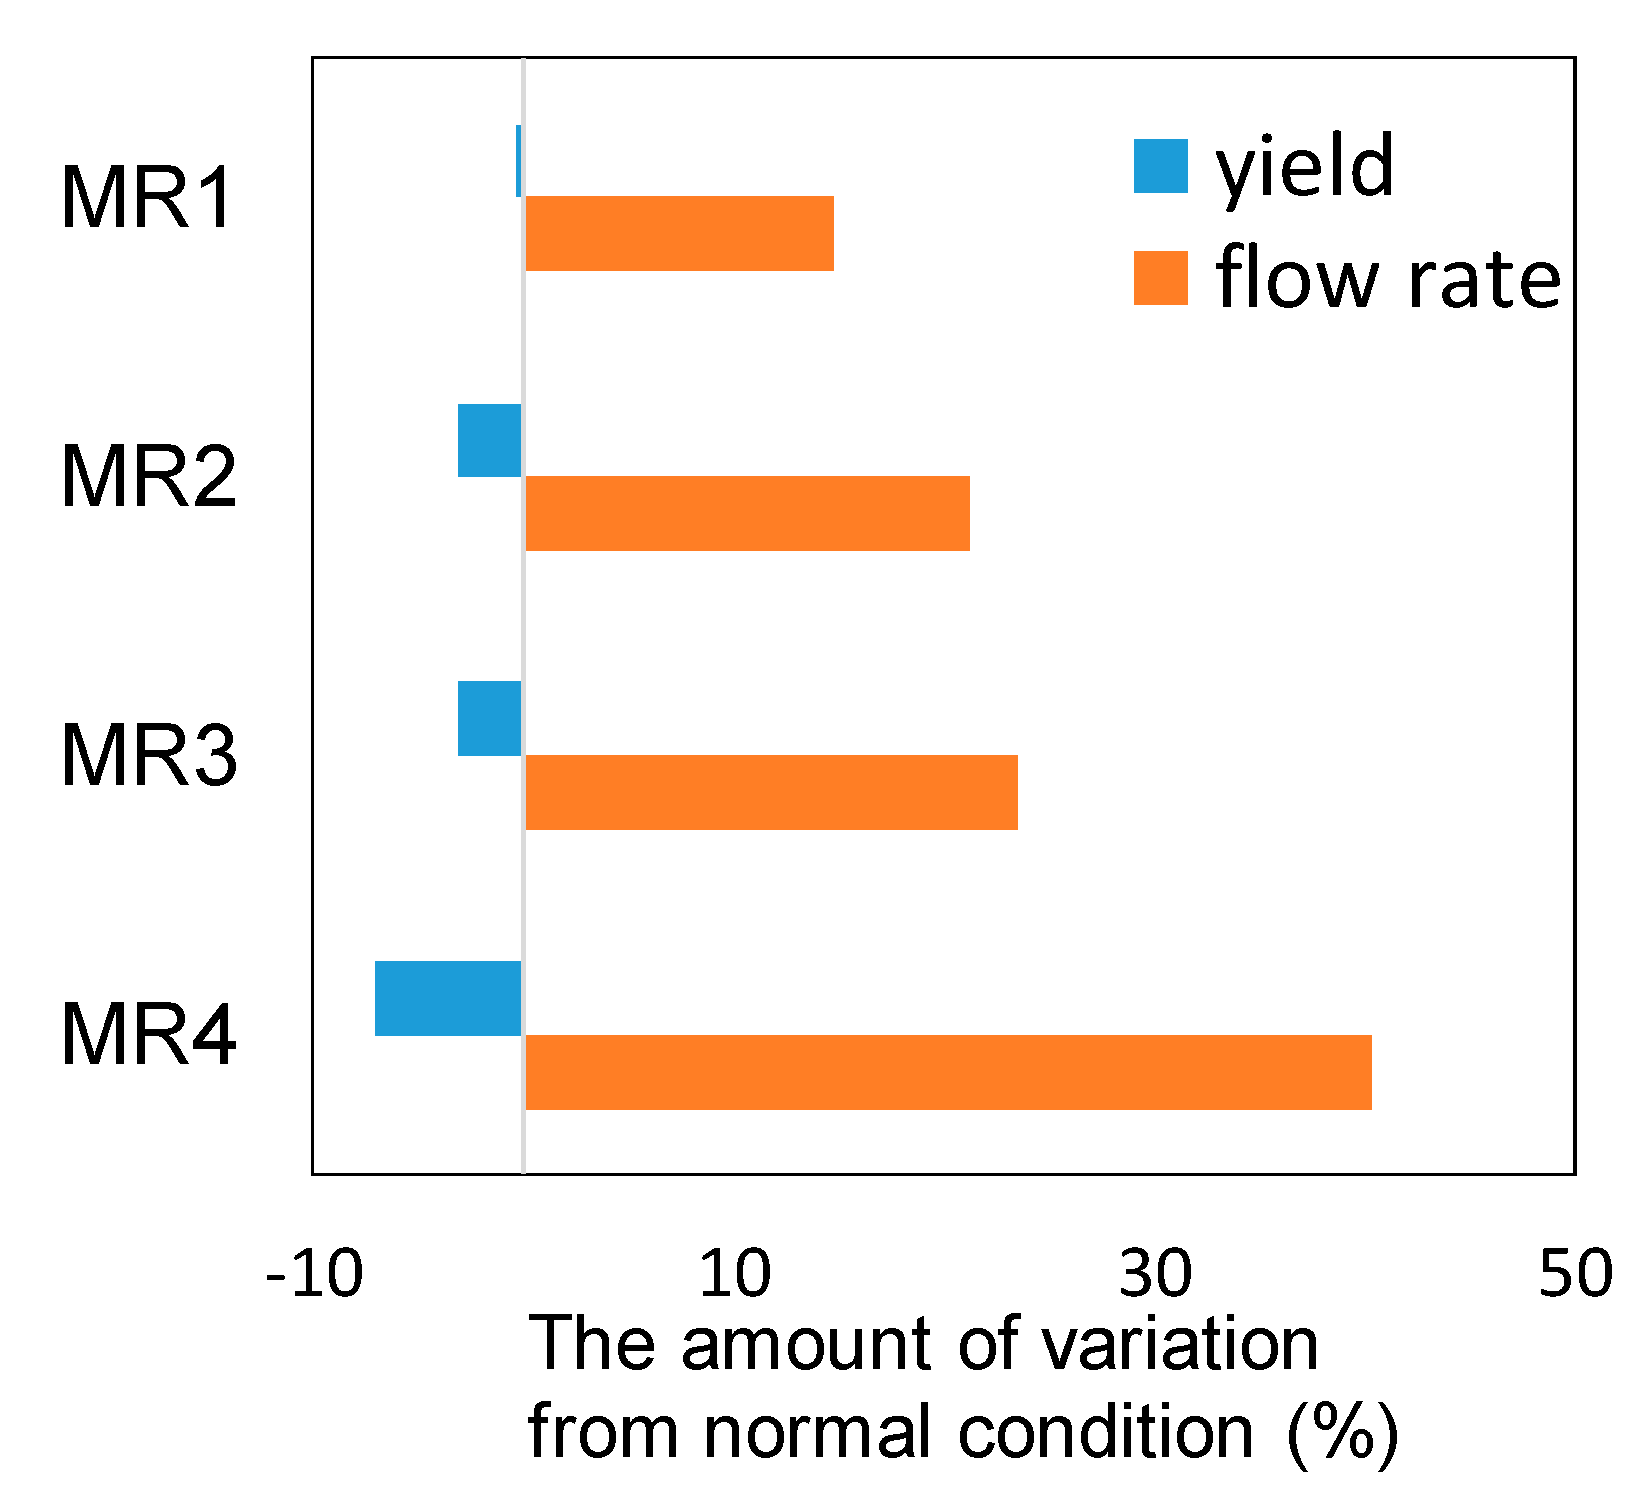
Figure 6. Using pressure sensors as sensors, the identification of blocked reactors can be explained as follows: When each reactor is blocked, the flow and pressure distributions inside the SRFD change. As a result, the pressure measurements deviate from normal conditions. Such deviation is different according to the blocked reactor, as shown in Figure 7. Figure 7 is called the pressure change diagram. A blocked reactor can be identified on the basis of this diagram. However, if the distance between two lines in the pressure change diagram is short, this will lead to misdiagnosis of the blocked reactor. Therefore, it is necessary to appropriately design channel resistances of the SRFD and positions of two pressure sensors to achieve flow equipartition at normal conditions and accurately identify the blocked reactor at abnormal conditions under the design constraints.
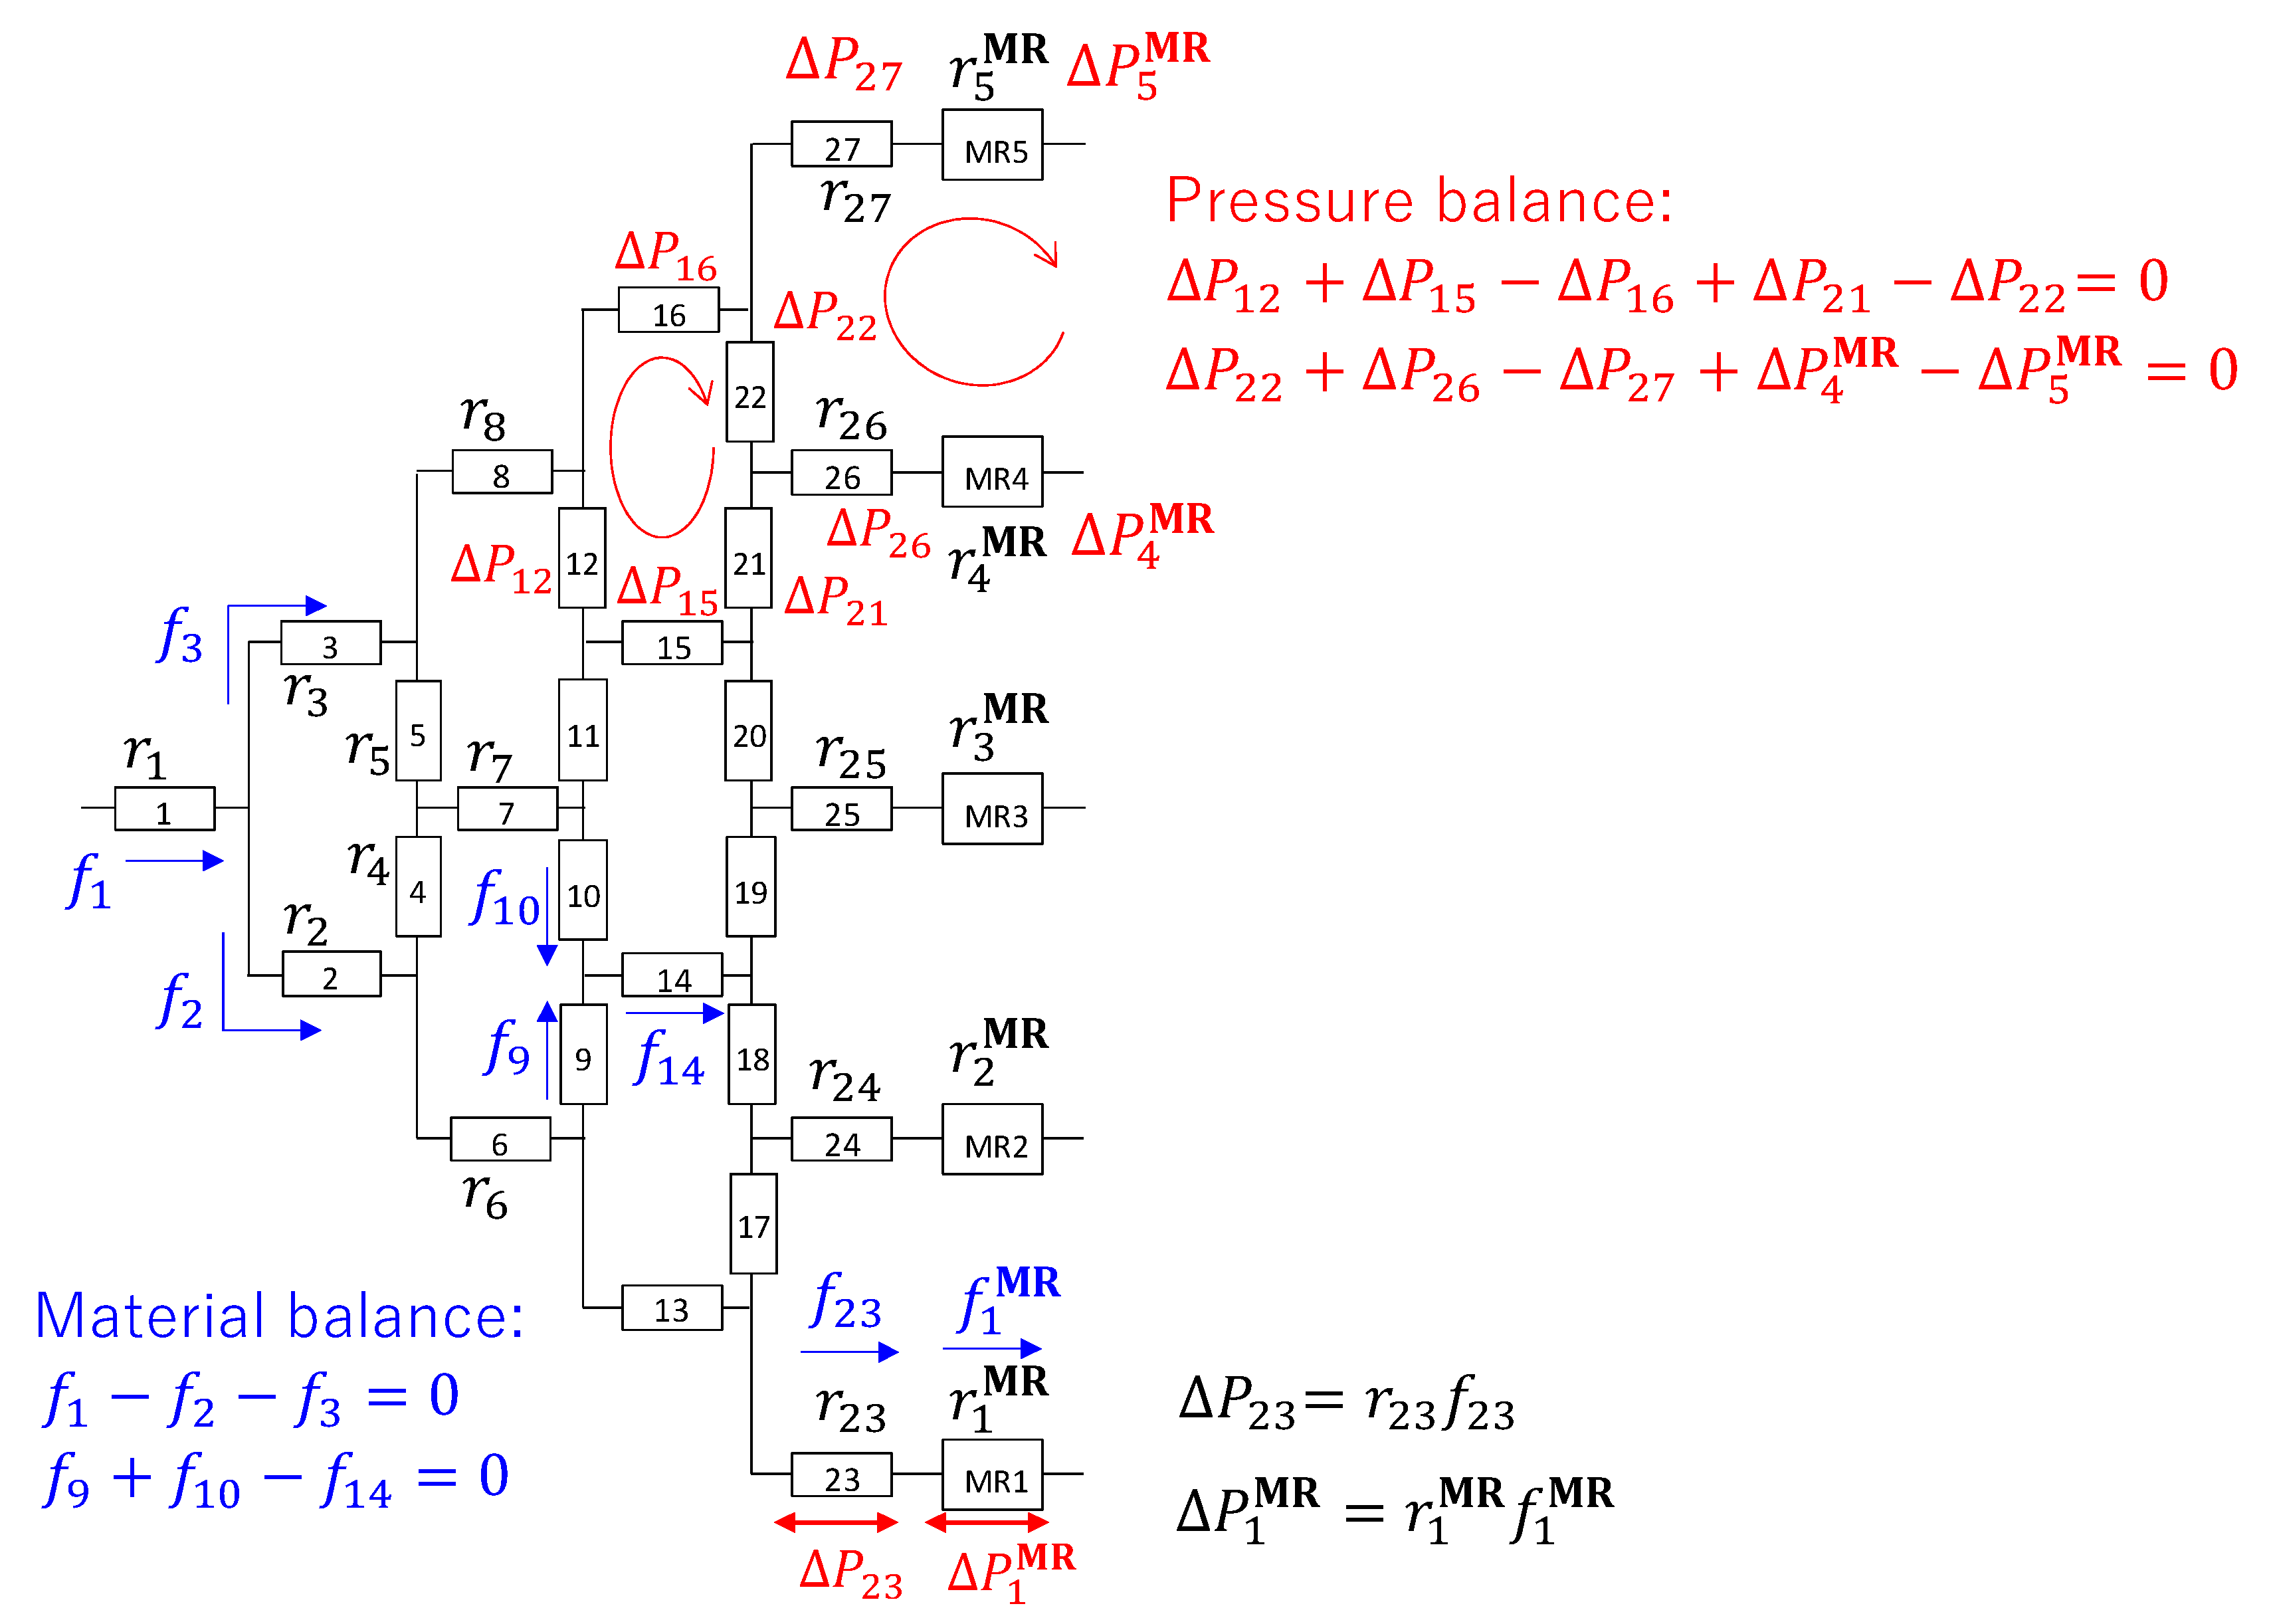
To efficiently evaluate the flow and pressure distributions throughout the process in the design optimization, a pressure drop compartment (PDC) model, which is analogous to an electrical resistance network, is used in this study. The usefulness of the PDC model was confirmed by computational fluid dynamics (CFD) simulation using COMSOL Multiphysics®. The PDC model is useful under laminar flow conditions where the relationship between pressure drop and the flow rate in each channel is linear, and the additional pressure drops at the entrance, exit, branching, and merging of channels are negligible. Figure 8 shows the constructed PDC models for SRFD with five parallelized MRs. The SRFD is divided into compartments labeled 1 to 27, followed by compartments labeled MR1 to MR5. Three variables, i.e., channel resistance r, pressure drop ΔP, and flow rate f, are given for each compartment, and material balance and pressure balance equations are constructed. A part of the material balance and pressure balance equations in the constructed PDC model is shown in Figure 8.
A design problem formulation for NR reactors connected to an SRFD is as follows:
min s 1 , s 2 min r max k , l cos θ ( Δ P ^ B , k , Δ P ^ B , l ) s 1 , s 2 { 1 , , n C } , s 1 s 2 r = { r 1 , , r n C } ,    k , l { 1 , , n R } ,    k l
subject to
f 0 , 1 = f i , 1 = f inlet = const .    i = 1 , , n R
r N , i MR = const .    i = 1 , , n R
r B , i MR = const .    i = 1 , , n R
| f inlet / n R f 0 , i MR | f err    i = 1 , , n R
r L r j r U    j = 1 , , n C
Δ P 0 , j = r j f 0 , j    j = 1 , , n C
Δ P i , j = r j f i , j    i = 1 , , n R , j = 1 , , n C
Δ P 0 , i MR = r N , i MR f 0 , i MR    i = 1 , , n R
Δ P i , i MR = r B , i MR f i , i MR    i , i = 1 , , n R
j { 1 , , n C } α p , j f 0 , j + i { 1 , , n R } β p , i f 0 , i MR = 0    p = 1 , , n p
j { 1 , , n c } α p , j f i , j + i { 1 , , n R } β p , i f i , i MR = 0    i = 1 , , n R , p = 1 , , n p
j { 1 , , n c } γ q , j Δ P 0 , j + i { 1 , , n R } δ q , i Δ P 0 , i MR = 0    q = 1 , , n q
j { 1 , , n c } γ q , j Δ P i , j + i { 1 , , n R } δ q , i Δ P i , i MR = 0    i = 1 , , n R , q = 1 , , n q
Δ P ^ B , i = { P s 1 , i P s 1 , 0 , P s 2 , i P s 2 , 0 }    i = 1 , , n R ,     s 1 , s 2 { 1 , , n C } ,    s 1 s 2 P s , 0 = j { 1 , , n c } ε s , j Δ P 0 , j + i { 1 , , n R } ζ s , i Δ P 0 , i MR     s { 1 , , n C } P s , i = j { 1 , , n c } ε s , j Δ P i , j + i { 1 , , n R } ζ s , i Δ P i , i MR     i = 1 , , n R ,     s { 1 , , n C }
where each equation is explained as follows:
Equation (1): The objective function is to minimize the maximum of a set of cos θ by adjusting sensor locations s1 and s2, and each channel resistance r. Sensors can be placed on channels or bifurcation and junction points. θ is formed by two lines in the pressure change diagram. nc means the total number of compartments except for MRs. n R is the total number of parallelized MRs. Δ P ^ is given by Equation (15), and its subscripts k and l mean a blocked MR.
Equation (2): The feed flow rate to SRFD is constant under both normal and abnormal conditions. The first subscript of f denotes the process condition, namely 0 and i, and refer to a normal condition and a single blocked MRi, respectively. The second subscript of f denotes the first compartment.
Equation (3): The channel resistance of normal MRi is constant. The subscript N means a normal condition.
Equation (4): The channel resistance of abnormal MRi is constant, which is given by a constant multiple of that in a normal MR. The subscript B means an abnormal condition.
Equation (5): In the normal condition, the difference between the flow rate of MRi and the flow rate when the uniform flow distribution is achieved must be less than or equal to ferr.
Equation (6): The channel resistance of the compartment j needs to be in the range of r L and r U .
Equation (7): In the compartment j, the pressure drop is equal to the product of channel resistance and flow rate. The first subscripts (0) of the pressure drop and the flow rate denote a normal condition.
Equation (8): This is similar to Equation (7), but the first subscripts of the pressure drop and the flow rate represent a situation where a single MRi is blocked.
Equation (9): In the compartment of MRi, the pressure drop is equal to the product of channel resistance and flow rate. The subscripts (0 and N) denote normal MRs.
Equation (10): This is similar to Equation (9), but the first subscripts of the pressure drop and the flow rate represent a situation where a single MRi is blocked.
Equation (11): Material balance equations are formulated for SRFD and MRs under normal conditions. α and β are coefficients with a value of 0, 1, or −1. np is the total number of material balance equations which is equal to the number of bifurcation and junction points in SRFD.
Equation (12): Material balance equations are formulated for SRFD and MRs under abnormal conditions.
Equation (13): Pressure balance equations are formulated for SRFD and MRs under normal conditions. γ and δ are coefficients with a value of 0, 1, or −1. nq is the total number of pressure balance equations and is equal to the number of closed channel loops, namely 10 in this case study.
Equation (14): Pressure balance equations are formulated for SRFD and MRs under an abnormal condition.
Equation (15): The pressure difference data vector has two components, which are given by the difference in measurements between normal and abnormal conditions. ε and ζ are coefficients with a value of 0, 1, or −1.

2.3. Design Result

According to the design problem formulation, the location of the two sensors and channel resistances are optimized under the design conditions shown in Table 1. It was assumed that the SRFD is bilaterally symmetrical with respect to a line connecting the compartments 1, 7, 25, and MR3, that the channel resistance of the first compartment is fixed at a constant value, and that the influence of sensor installation on the pressure distribution over the process is negligible. The lower limits of norms of pressure difference vectors were set to 10 kPa. The maximum allowable pressure drop over the system was set to 260 kPa. In addition, the effluent from each MR is discharged to a tank after mixing, and the pressure drop between the outlet of MRs and the tank is negligible in the whole process. The design problem was solved by using a generalized reduction gradient nonlinear solver with a multistart scatter search. The optimal channel resistances are summarized in Table 2. The location of sensors is shown in Figure 9 (left), and the obtained pressure change diagram is shown in Figure 10.

3. Experimental Evaluation of the Developed System

After constructing the experimental system based on the design result, its continuous operation was carried out. In addition, the usefulness of the previously proposed blockage detection and diagnosis method [2] was evaluated for an artificially generated blockage.

3.1. Continuous Operation

The parallelized monolithic MRs were immersed in a circulated oil bath to control the temperature. The desirable operating conditions for each MR were given according to the aforementioned study, namely, a solution of 2 and that of p-iodobenzaldehyde were supplied to each MR at the flow rate of 0.4 mL/min at the reaction temperature of 90 °C. The total flow rate of the system was controlled at 2 mL/min using a plunger pump (Shimadzu, LC-20AT). The SRFD consisting of 27 channels and 16 T-joints (Swagelok, SS-100-3) shown in Figure 9 (left) was used for flow distribution. Each channel was composed of a SUS tube. Since the pressure drop of SUS tube strongly depends on the inner diameter, the pressure drop of each tube was measured by flowing mixing solution (THF/MeOH (1:1)), then the necessary length was determined. The results are summarized in Table 3. In Table 3, the channel number corresponds to the compartment number of the SRFD model shown in Figure 8. The pressure sensors (Yokogawa, FP101) were installed in the constructed SRFD according to the design result. They are indicated by PI in Figure 9 (left). After the system construction was completed, the flow uniformity of the SRFD was evaluated experimentally using a mixing solution of THF and MeOH (2 mL/min, 1:1). As shown in Table 4, the flow distribution was achieved with the difference between maximum and minimum flow rate less than 2%. In Table 4, the outlet number corresponds to the compartment number of the SRFD model shown in Figure 8.
Subsequently, continuous operation of the coupling reaction was carried out. After a steady state was reached, the resulting solutions were collected every 15 min. The collected solutions were treated with brine. After extraction, the organic layer was separated, washed with H2O, and dried over Na2SO4. After filtration, the removal of solvents under reduced pressure gave the crude product, which was purified by column chromatography (hexane/ethyl acetate (4:1)). The yield of product was determined by GC analysis, which was performed on a SHIMADZU GC-2014 gas chromatograph equipped with a flame ionization detector using a fused silica capillary column (column, CBPI; 0.25 mm × 25 m; initial oven temperature, 323 K; rate of temperature increase, 10 K/min; final oven temperature, 523 K). The experimental results are shown in Figure 9 (right). It was demonstrated that flow distribution was achieved with the difference between maximum and minimum flow rate less than 5%, and that a stable reaction operation was maintained for over 1 hour while achieving close to the target yield in each reactor.

3.2. Blockage Detection and Diagnosis Performance

The usefulness of the previously proposed blockage detection and diagnosis method [2] was evaluated for an artificially generated blockage. The artificial blockage was realized by closing the valve after the MR. For example, when MR5 was blocked, the flow rates at MR1–4 shifted as shown in Figure 11. It was shown that the flow rate shift becomes large as the MR is closer to MR5. It was also shown that the yield decreased because the reaction time was shortened when the flow rate was increased. Such yield degradation was minimized by using the blockage detection and diagnosis method [2]. Each blocked MR was identified on the basis of the pressure change diagram, which is shown in Figure 10. Closed and open circles correspond to experiment and PDC model-based simulation, respectively. It was concluded that the usefulness of the proposed blockage detection and diagnosis method was demonstrated in the reaction experiment process.

4. Conclusions

A numbering-up system consisting of five monolithic MRs connected to an SRFD with the function of blockage detection was developed, and the practicality of the system was demonstrated using a Suzuki–Miyaura coupling reaction.

Author Contributions

Conceptualization, O.T. and A.N.; methodology, O.T. and A.N.; software, S.T. and K.N.; validation, O.T., S.T., and K.N.; formal analysis, O.T., S.T., K.N, K.H., and A.N.; investigation, O.T., S.T., and A.N.; resources, N.I.; data curation, O.T. and S.T.; writing—original draft preparation, O.T. and S.T.; writing—review and editing, S.T. and A.N.; visualization, O.T. and S.T.; supervision, J.-i.Y. and S.H.; funding acquisition, O.T. and S.H.

Funding

This research was partially supported by the Grant-in-Aid for Scientific Research (S) (No. 25220913) and Scientific Research (B) (No. 15K18264).

Conflicts of Interest

The authors declare no conflict of interest.

References

  1. Hessel, V.; Renken, A.; Schouten, J.C.; Yoshida, J. Micro Process Engineering, A Comprehensive Handbook Volume 3: System, Process and Plant Engineering; WILEY-VCH Verlag: Weinheim, Germany, 2009. [Google Scholar]
  2. Tanaka, Y.; Tonomura, O.; Isozaki, K.; Hasebe, S. Detection and diagnosis of blockage in parallelized microreactors. Chem. Eng. J. 2011, 167, 483–489. [Google Scholar] [CrossRef]
  3. Hassan, J.; Sévignon, M.; Gozzi, C.; Schulz, E.; Lemaire, M. Aryl−aryl bond formation one century after the discovery of the Ullmann reaction. Chem. Rev. 2002, 102, 1359–1470. [Google Scholar] [CrossRef] [PubMed]
  4. Novartis Annual Report 2006; Novartis International AG: Basel, Switzerland, 2007.
  5. Bühlmayer, P.; Ostermayer, F.; Schmidlin, T. Preparation of [(tetrazolylbiphenyl)methyl]amines and analogs as angio-tensin II antagonists. Eur. Pat. Appl. EP443983, 12 February 1991. [Google Scholar]
  6. Bühlmayer, P.; Furet, P.; Criscione, L.; de Gasparo, M.; Whitebread, S.; Schmidlin, T.; Lattmann, R.; Wood, J. Valsartan, a potent, orally active angiotensin II antagonist developed from the structurally new amino acid series. Bioorg. Med. Chem. Lett. 1994, 4, 29–34. [Google Scholar] [CrossRef]
  7. Goossen, L.J.; Melzer, B.J. Synthesis of valsartan via decarboxylative biaryl coupling. J. Org. Chem. 2007, 72, 7473–7476. [Google Scholar] [CrossRef] [PubMed]
  8. Littke, A.F.; Fu, G.C. Palladium-catalyzed coupling reactions of aryl chlorides. Angew. Chem. Int. Ed. 2002, 41, 4176–4211. [Google Scholar] [CrossRef]
  9. Nagaki, A.; Hirose, K.; Tonomura, O.; Taniguchi, S.; Taga, T.; Hasebe, S.; Ishizuka, N.; Yoshida, J. Design of a numbering-up system of monolithic microreactors and its application to synthesis of a key intermediate of valsartan. Org. Process Ree. Dev. 2016, 20, 687–691. [Google Scholar] [CrossRef]
  10. Nagaki, A.; Kim, H.; Usutani, H.; Matsuo, C.; Yoshida, J. Generation and reaction of cyano-substituted aryllithium compounds using microreactors. Org. Biomol. Chem. 2010, 8, 1212–1217. [Google Scholar] [CrossRef] [PubMed]
Figure 1. Synthesis of valsartan. The reaction within the red frame is coupling reaction.
Catalysts 09 00308 g001
Figure 2. Microreactor system for synthesis of a key intermediate (3) of valsartan.
Catalysts 09 00308 g002
Figure 3. Monolithic microreactor (MR) and SEM image of the monolith structure inside the reactor.
Catalysts 09 00308 g003
Figure 4. A single reactor system for optimizing Suzuki–Miyaura coupling reaction conditions.
Catalysts 09 00308 g004
Figure 5. Effects of reaction temperature and flow rate on yield.
Catalysts 09 00308 g005
Figure 6. Numbering-up system with split-and-recombine-type flow distributor (SRFD).
Catalysts 09 00308 g006
Figure 7. Pressure change diagram.
Catalysts 09 00308 g007
Figure 8. Model of SRFD with five parallelized MRs.
Catalysts 09 00308 g008
Figure 9. Constructed SRFD (left) and flow uniformity and product yield during the reaction experiment (right).
Catalysts 09 00308 g009
Figure 10. Result of blockage detection and diagnosis. Closed and open circles correspond to the experiment and pressure drop compartment (PDC) model-based simulation, respectively.
Catalysts 09 00308 g010
Figure 11. Shift of flow rate and yield under MR5 blockage.
Catalysts 09 00308 g011
Table 1. Design conditions.
NameValue
f inlet (mm3·s−1)33.33
r N , i MR (kPa·s·mm−3)16.5
r B , i MR (MPa·s·mm−3)165
f err (mm3·s−1)0.001
r L (Pa·s·mm−3)10
r U (kPa·s·mm−3)100
Table 2. Resistances of channels in the SRFD.
Channel No.Channel Resistance (kPa·s·mm−3)Channel No.Channel Resistance (kPa·s·mm−3)
2, 30.0114, 150.01
4, 57.3417, 2234.47
6, 80.0118, 2116.67
739.4419, 200.01
9, 120.0123, 270.01
10, 110.1624, 260.01
13, 1625.152520.40
Table 3. Sizes of channels in the SRFD.
Channel No.Length (m)Nominal I.D. (mm)Channel No.Length (m)Nominal I.D. (mm)
11.0001.00150.1760.77
20.1760.77160.2990.13
30.1760.77170.5020.13
40.1140.13180.2550.13
50.1080.13191.0500.25
60.1760.77201.0300.25
70.5670.13210.2620.13
80.1760.77220.4810.13
90.1790.77230.1760.77
100.0840.31241.0000.25
110.0830.31250.3750.13
120.1790.77261.0100.25
130.3200.13270.1760.77
140.1760.77
Table 4. Evaluation result of flow uniformity of the SRFD itself.
Outlet number2324252627
Normalized flow rate (-)1.001.011.001.010.99

