The Effect of Citric Acid Concentration on the Properties of LaMnO3 as a Catalyst for Hydrocarbon Oxidation


 , , ,
, , ,  and
and
Abstract
:1. Introduction
2. Results and Discussion
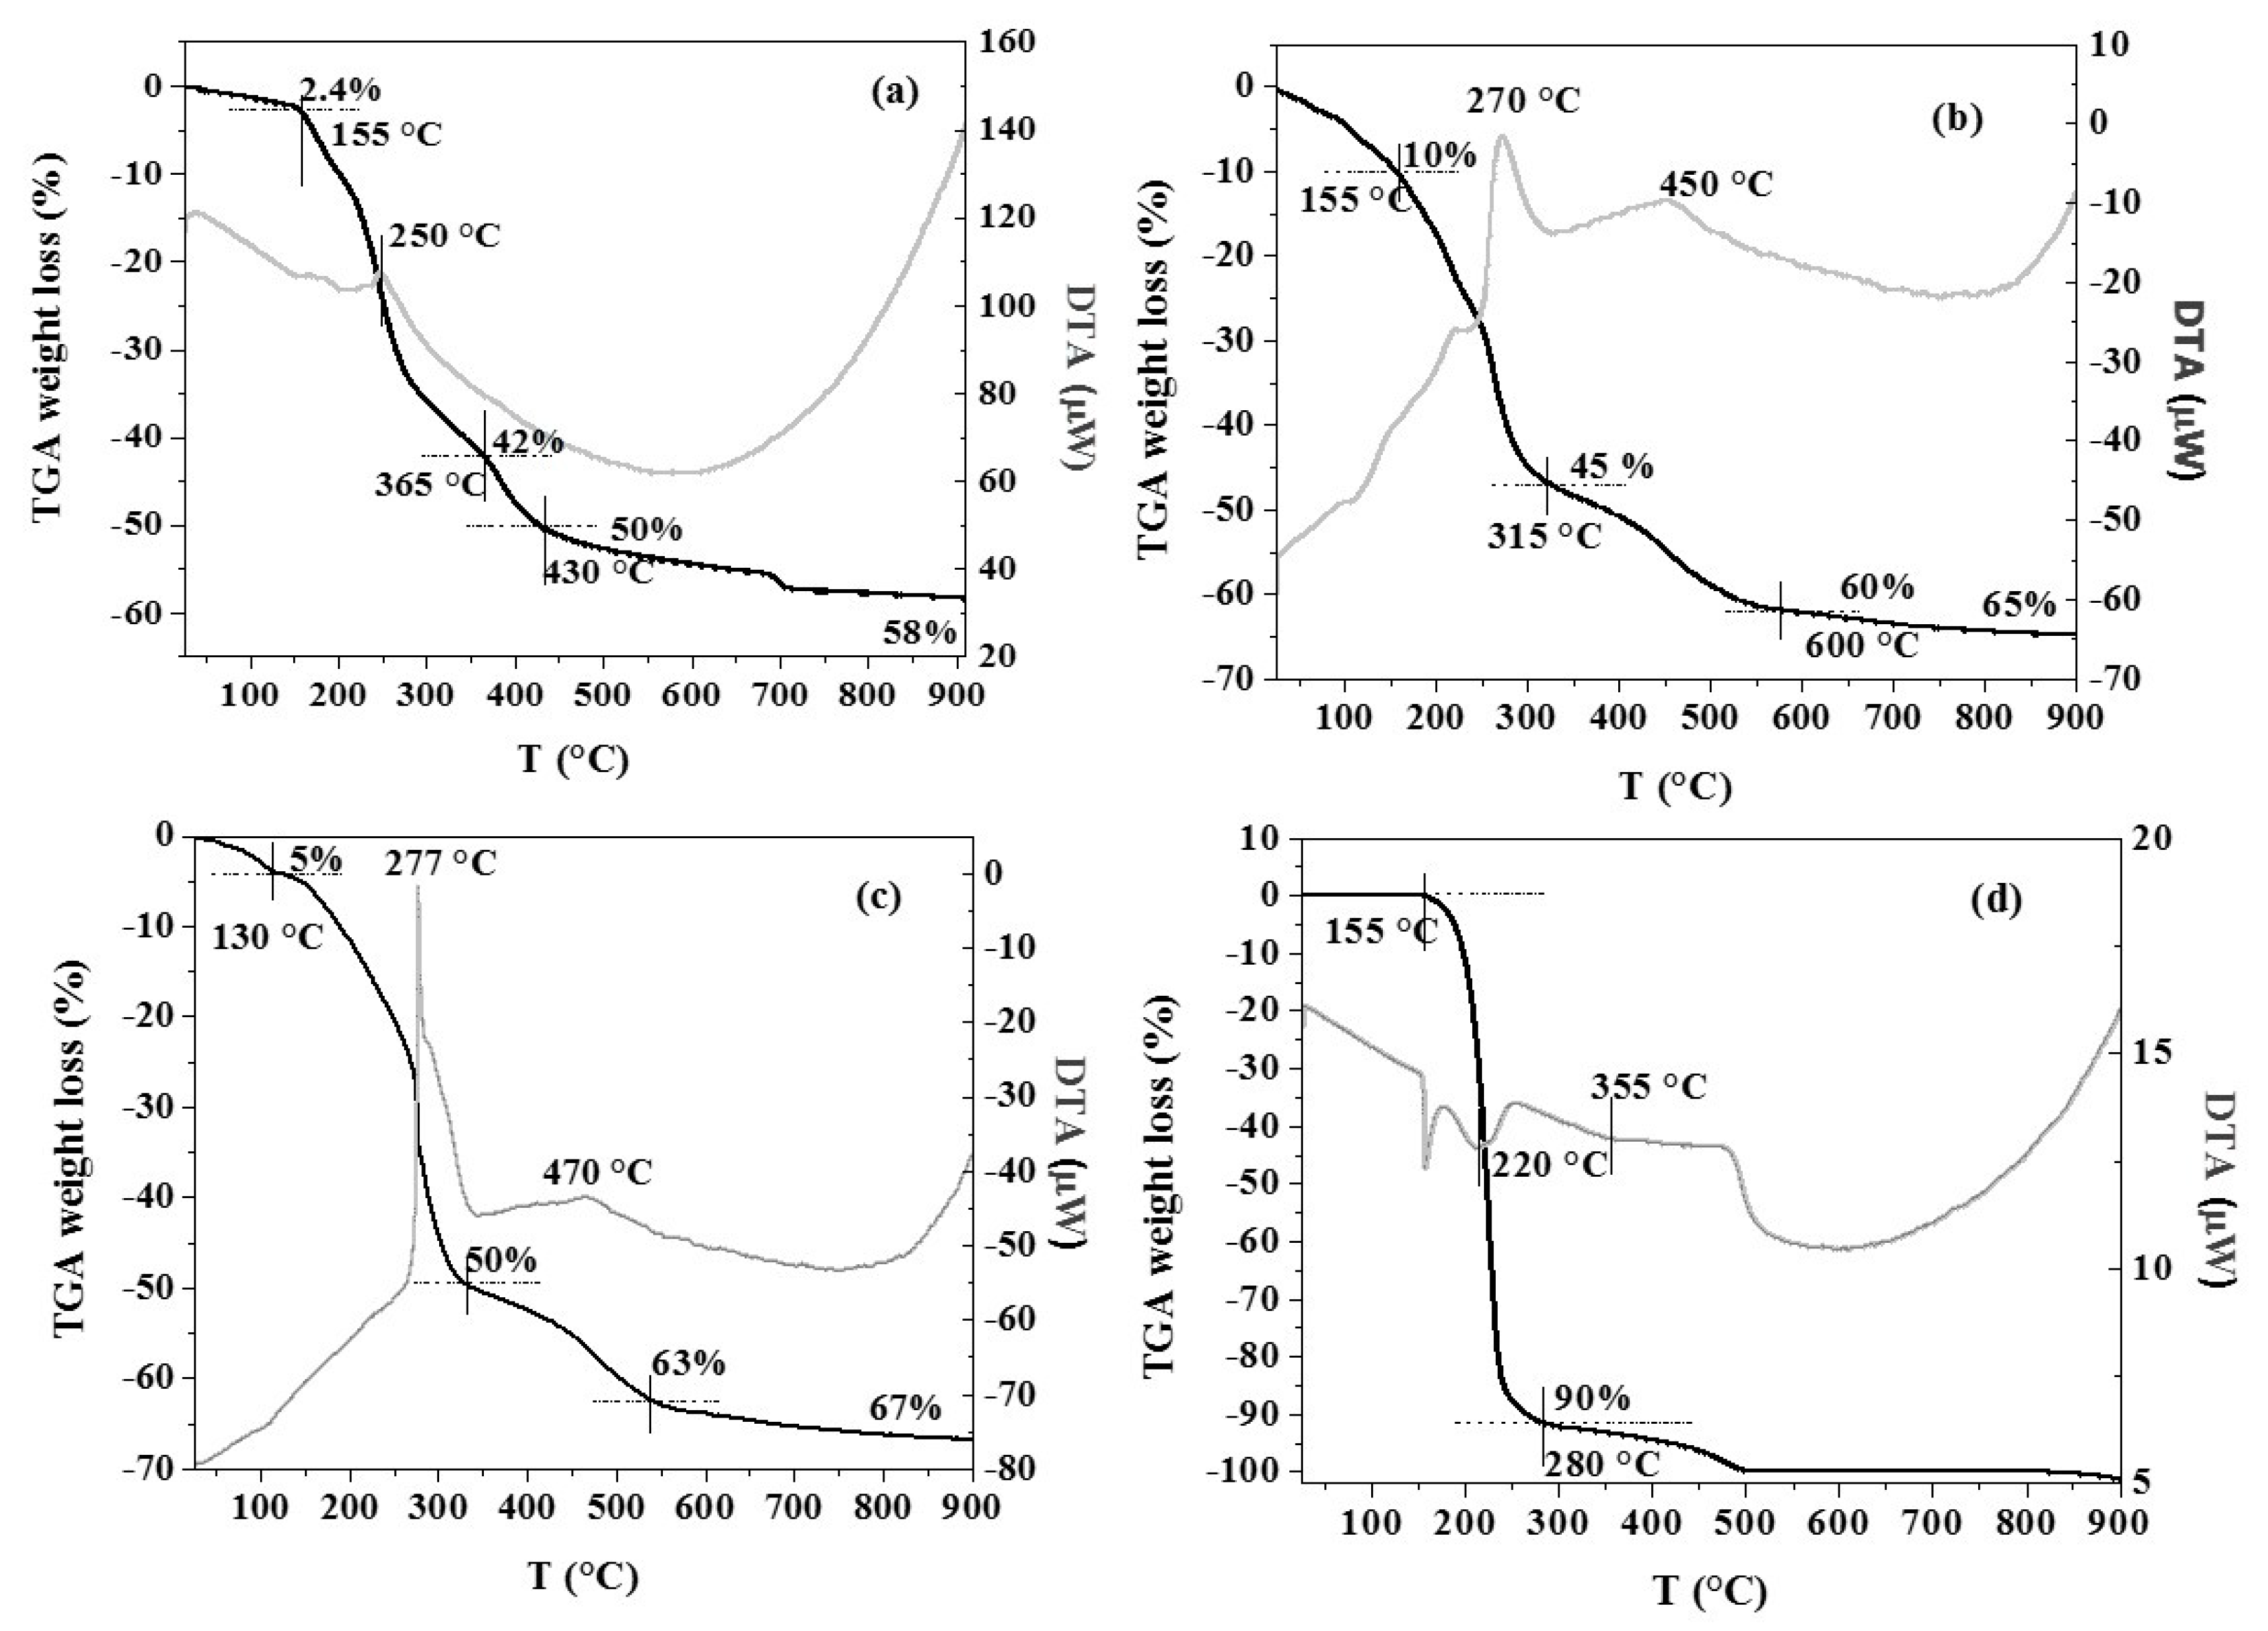
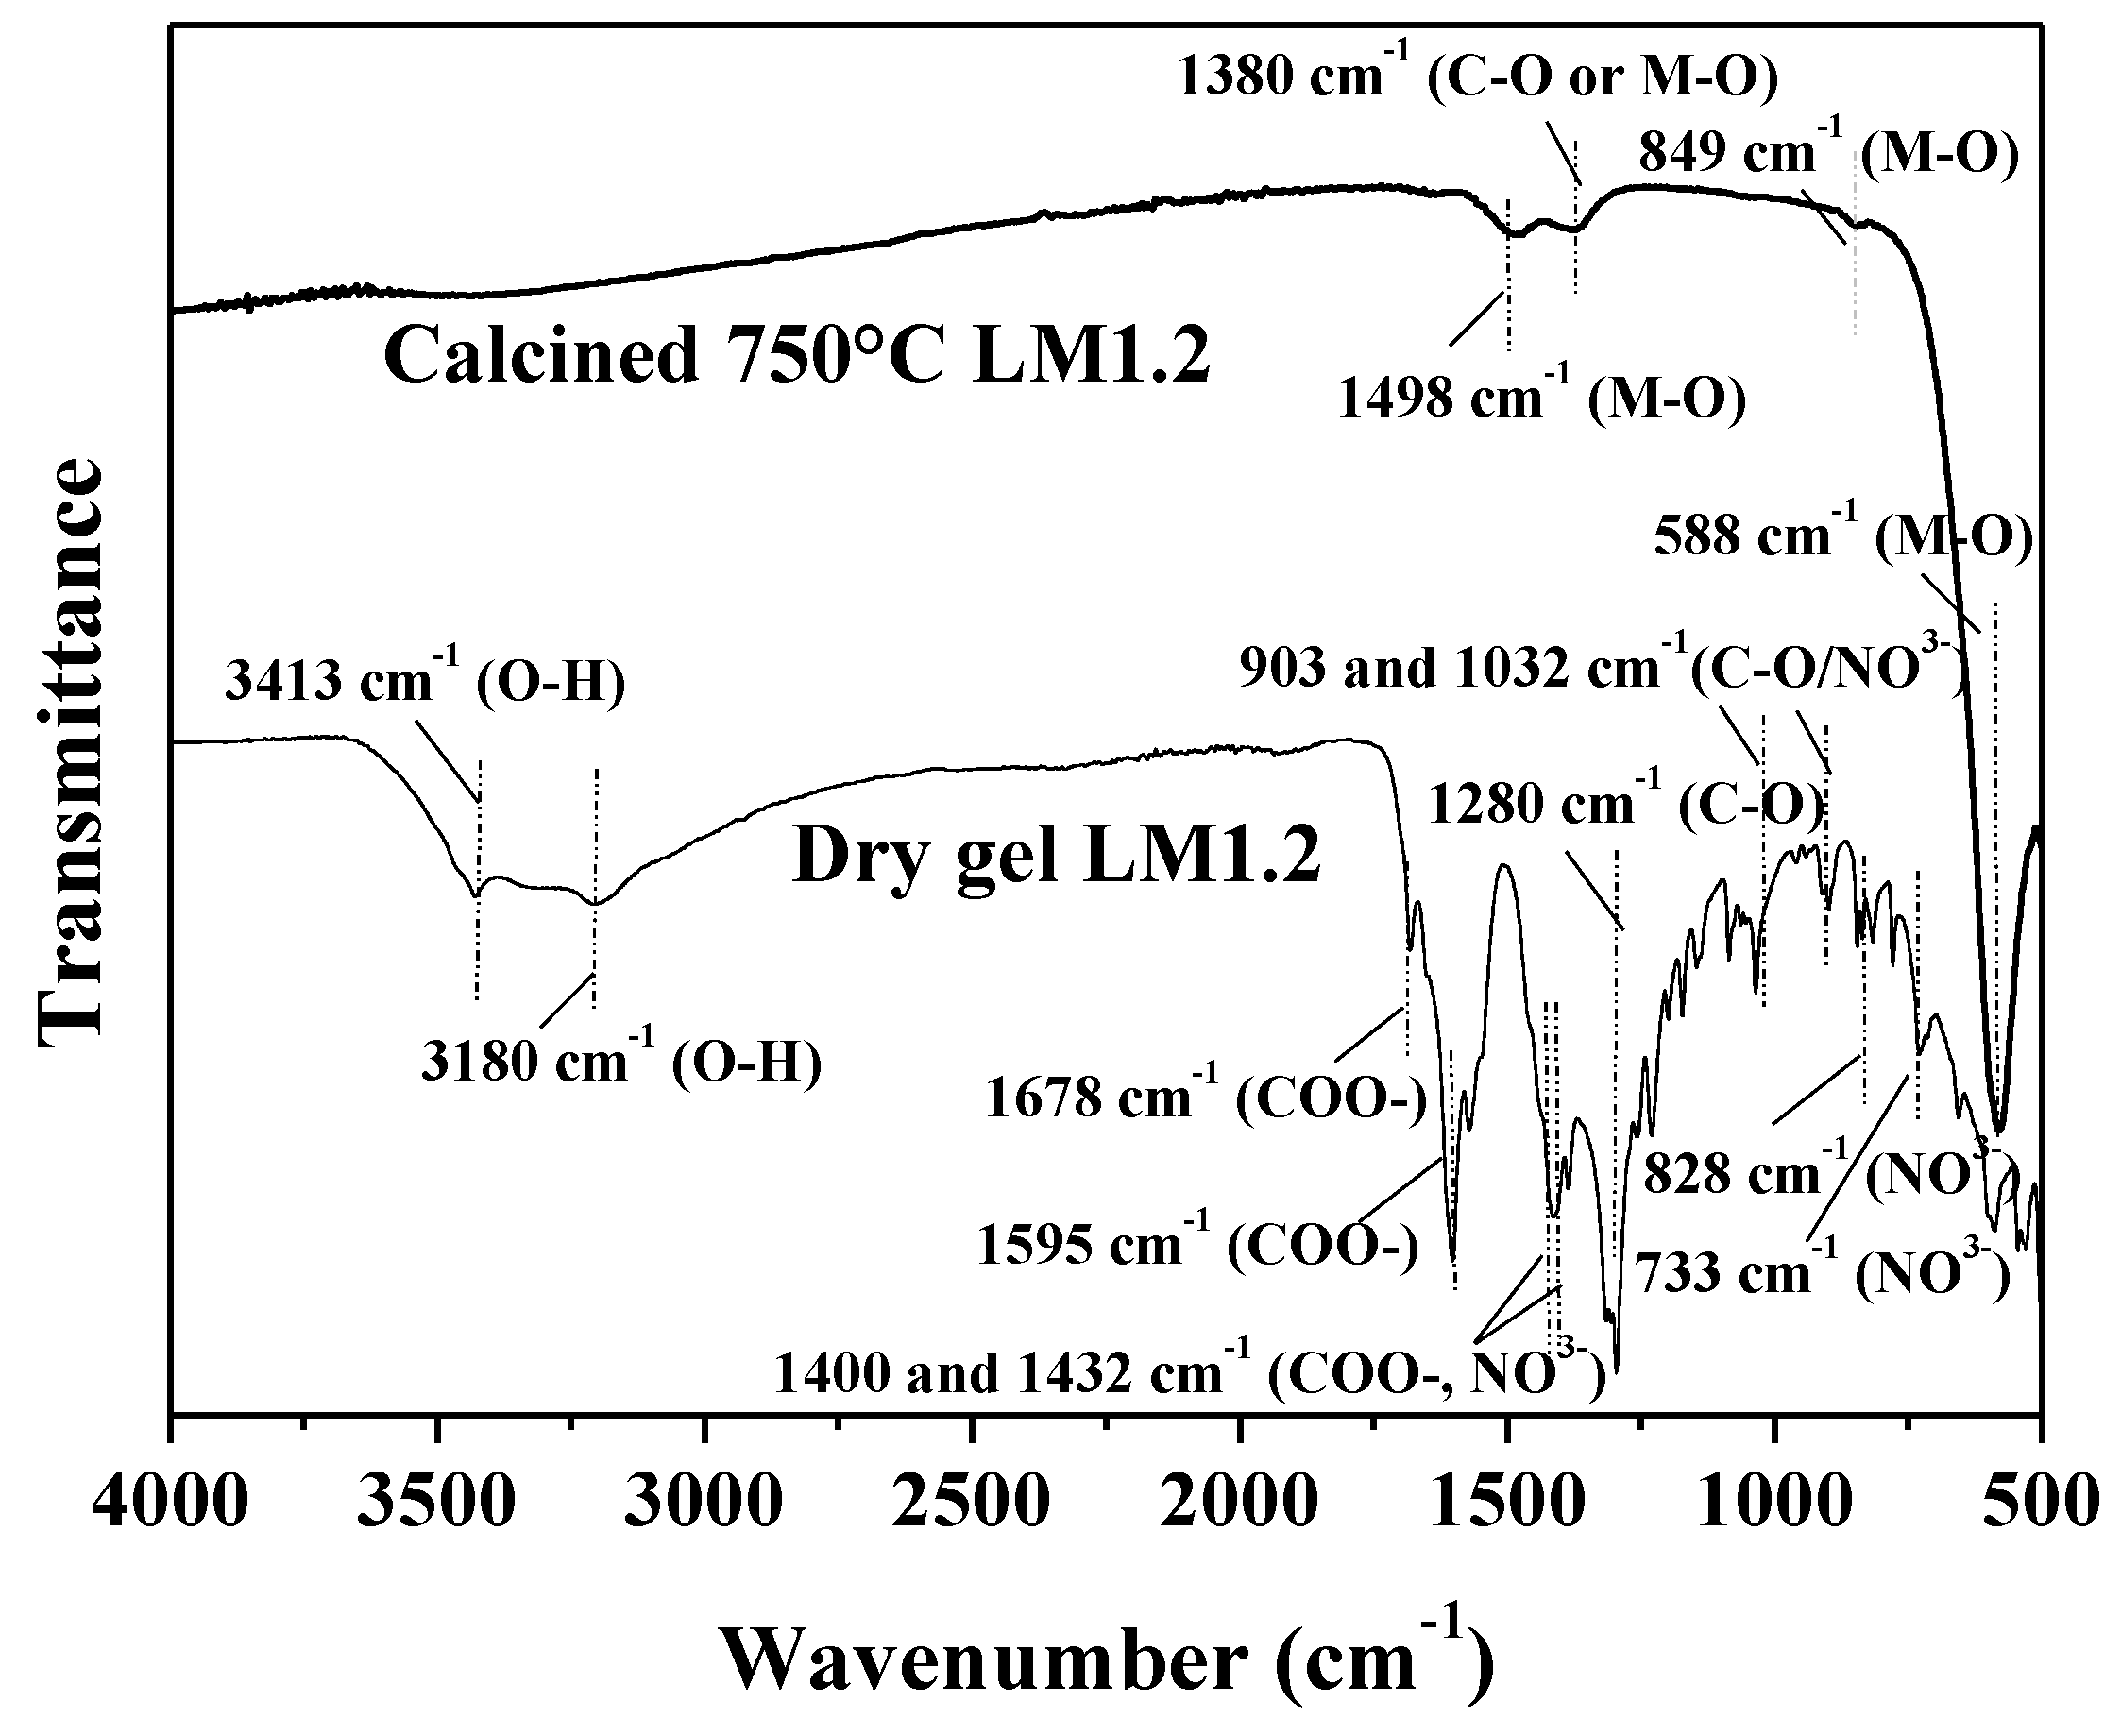
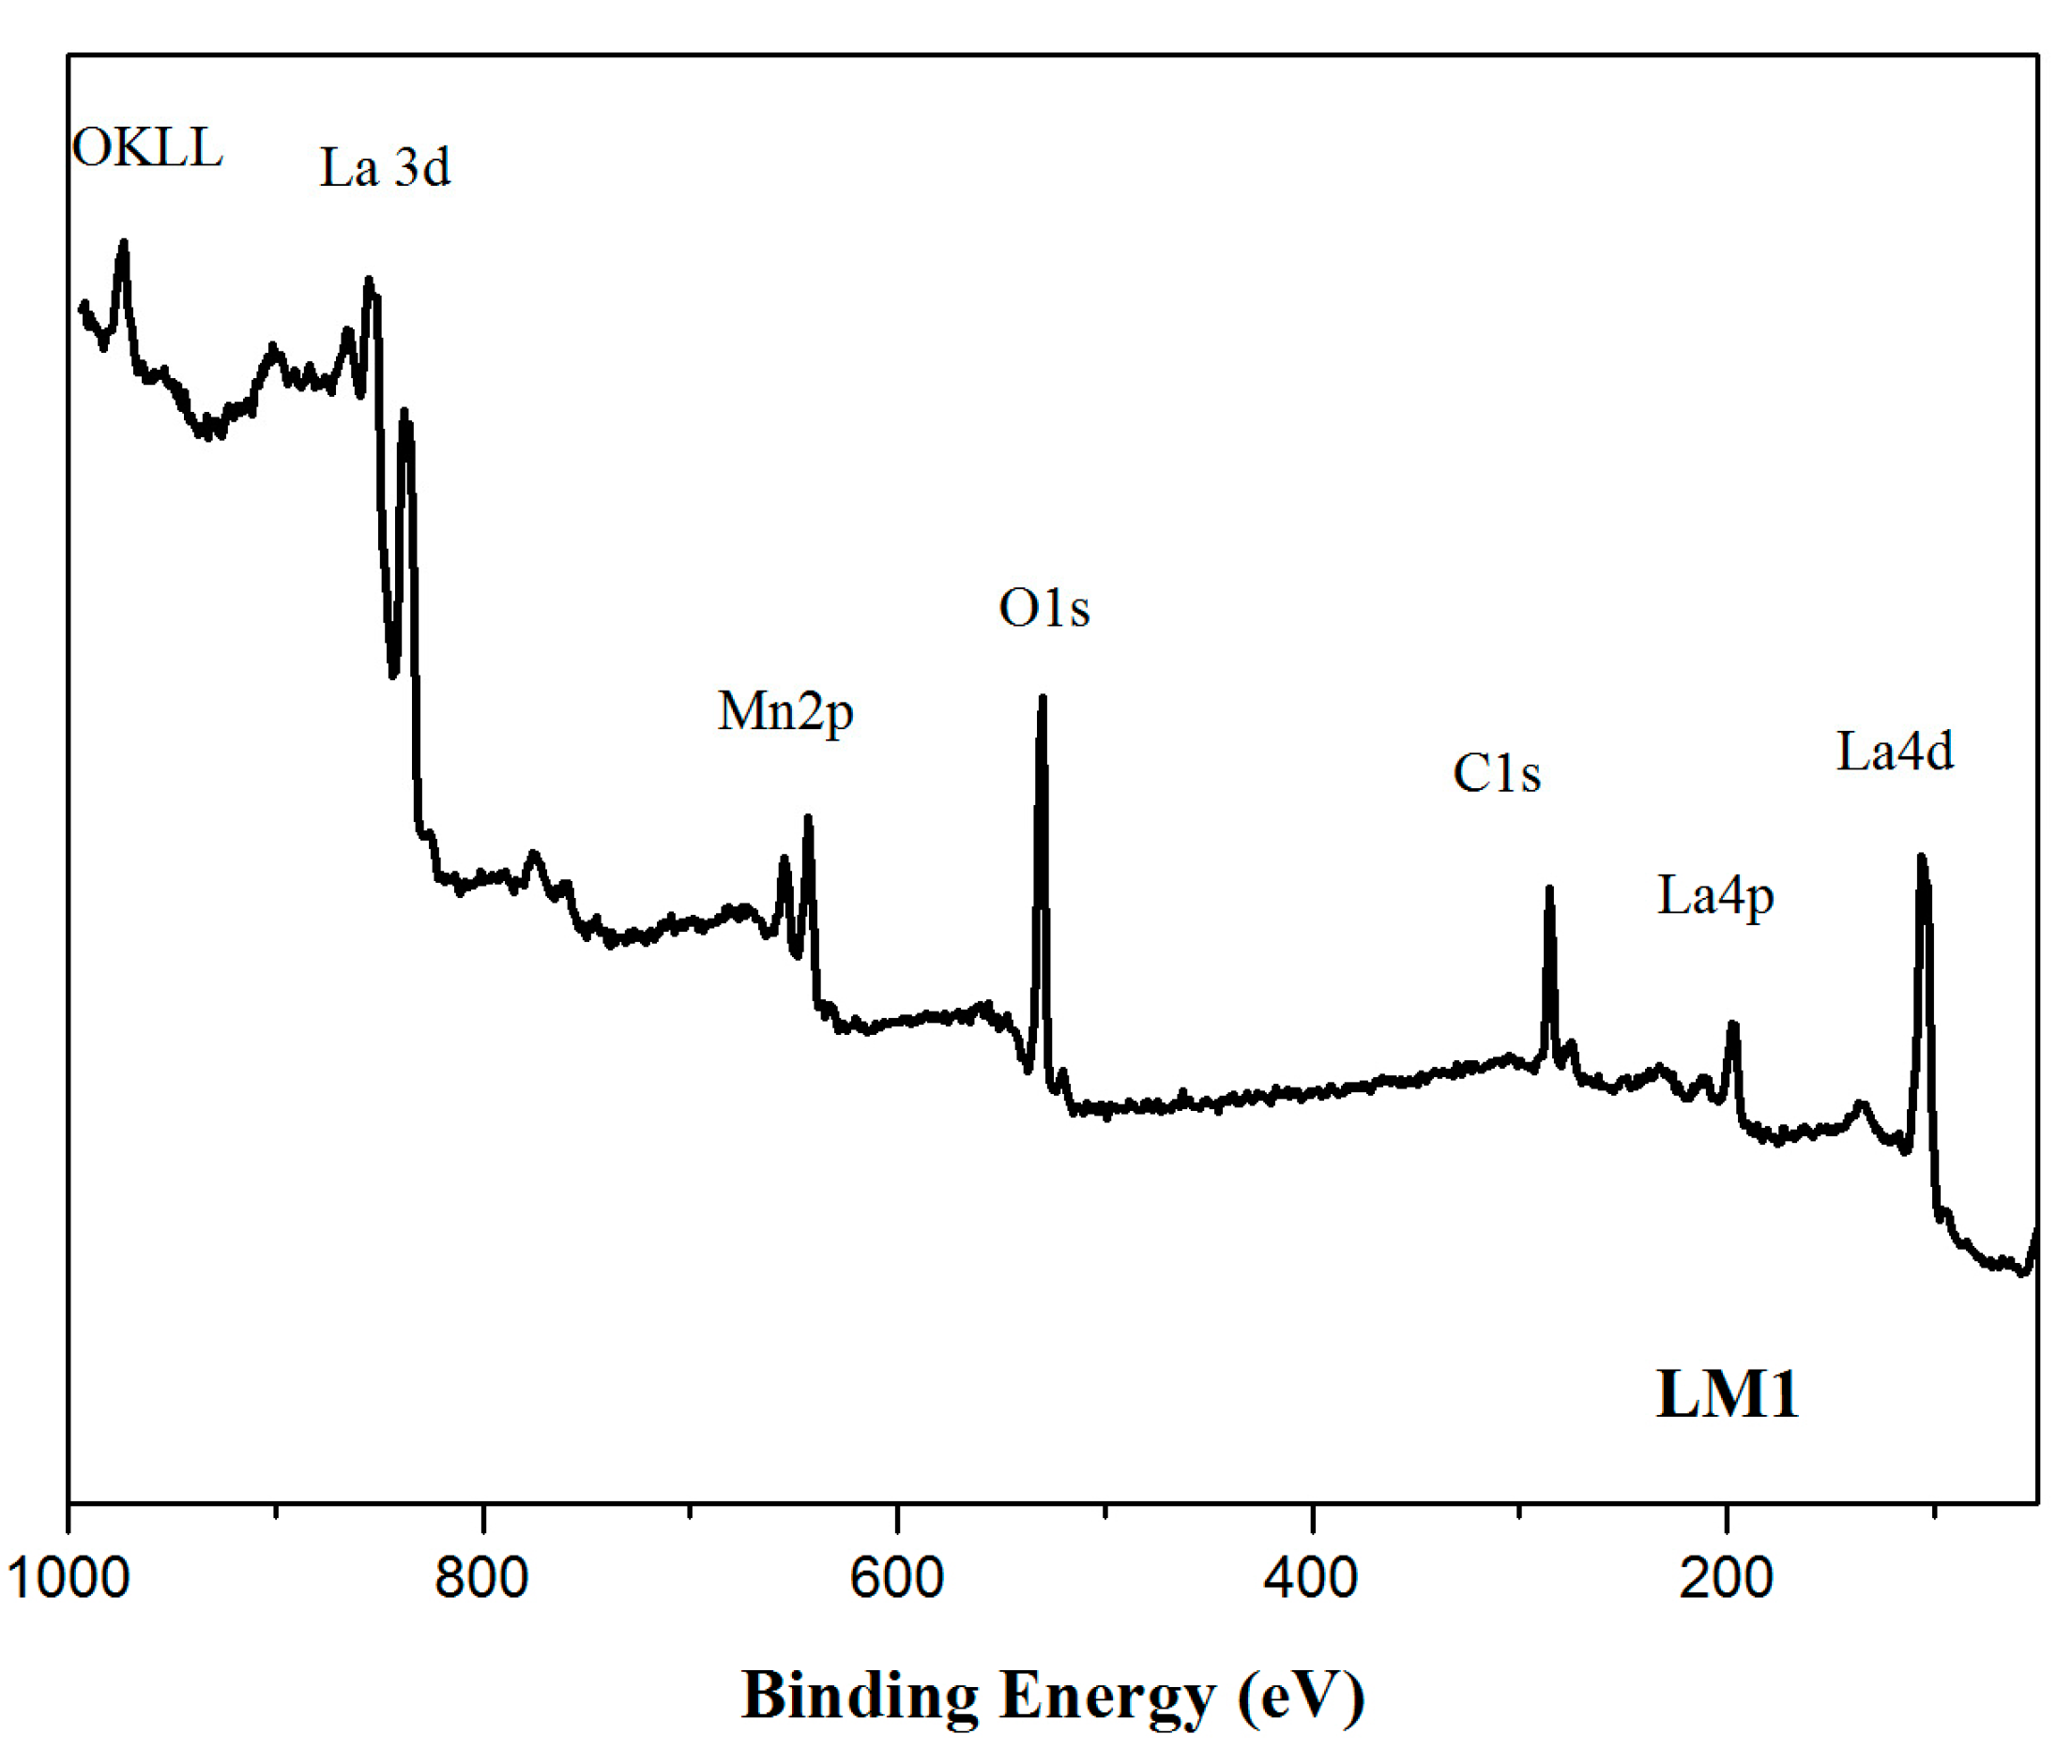
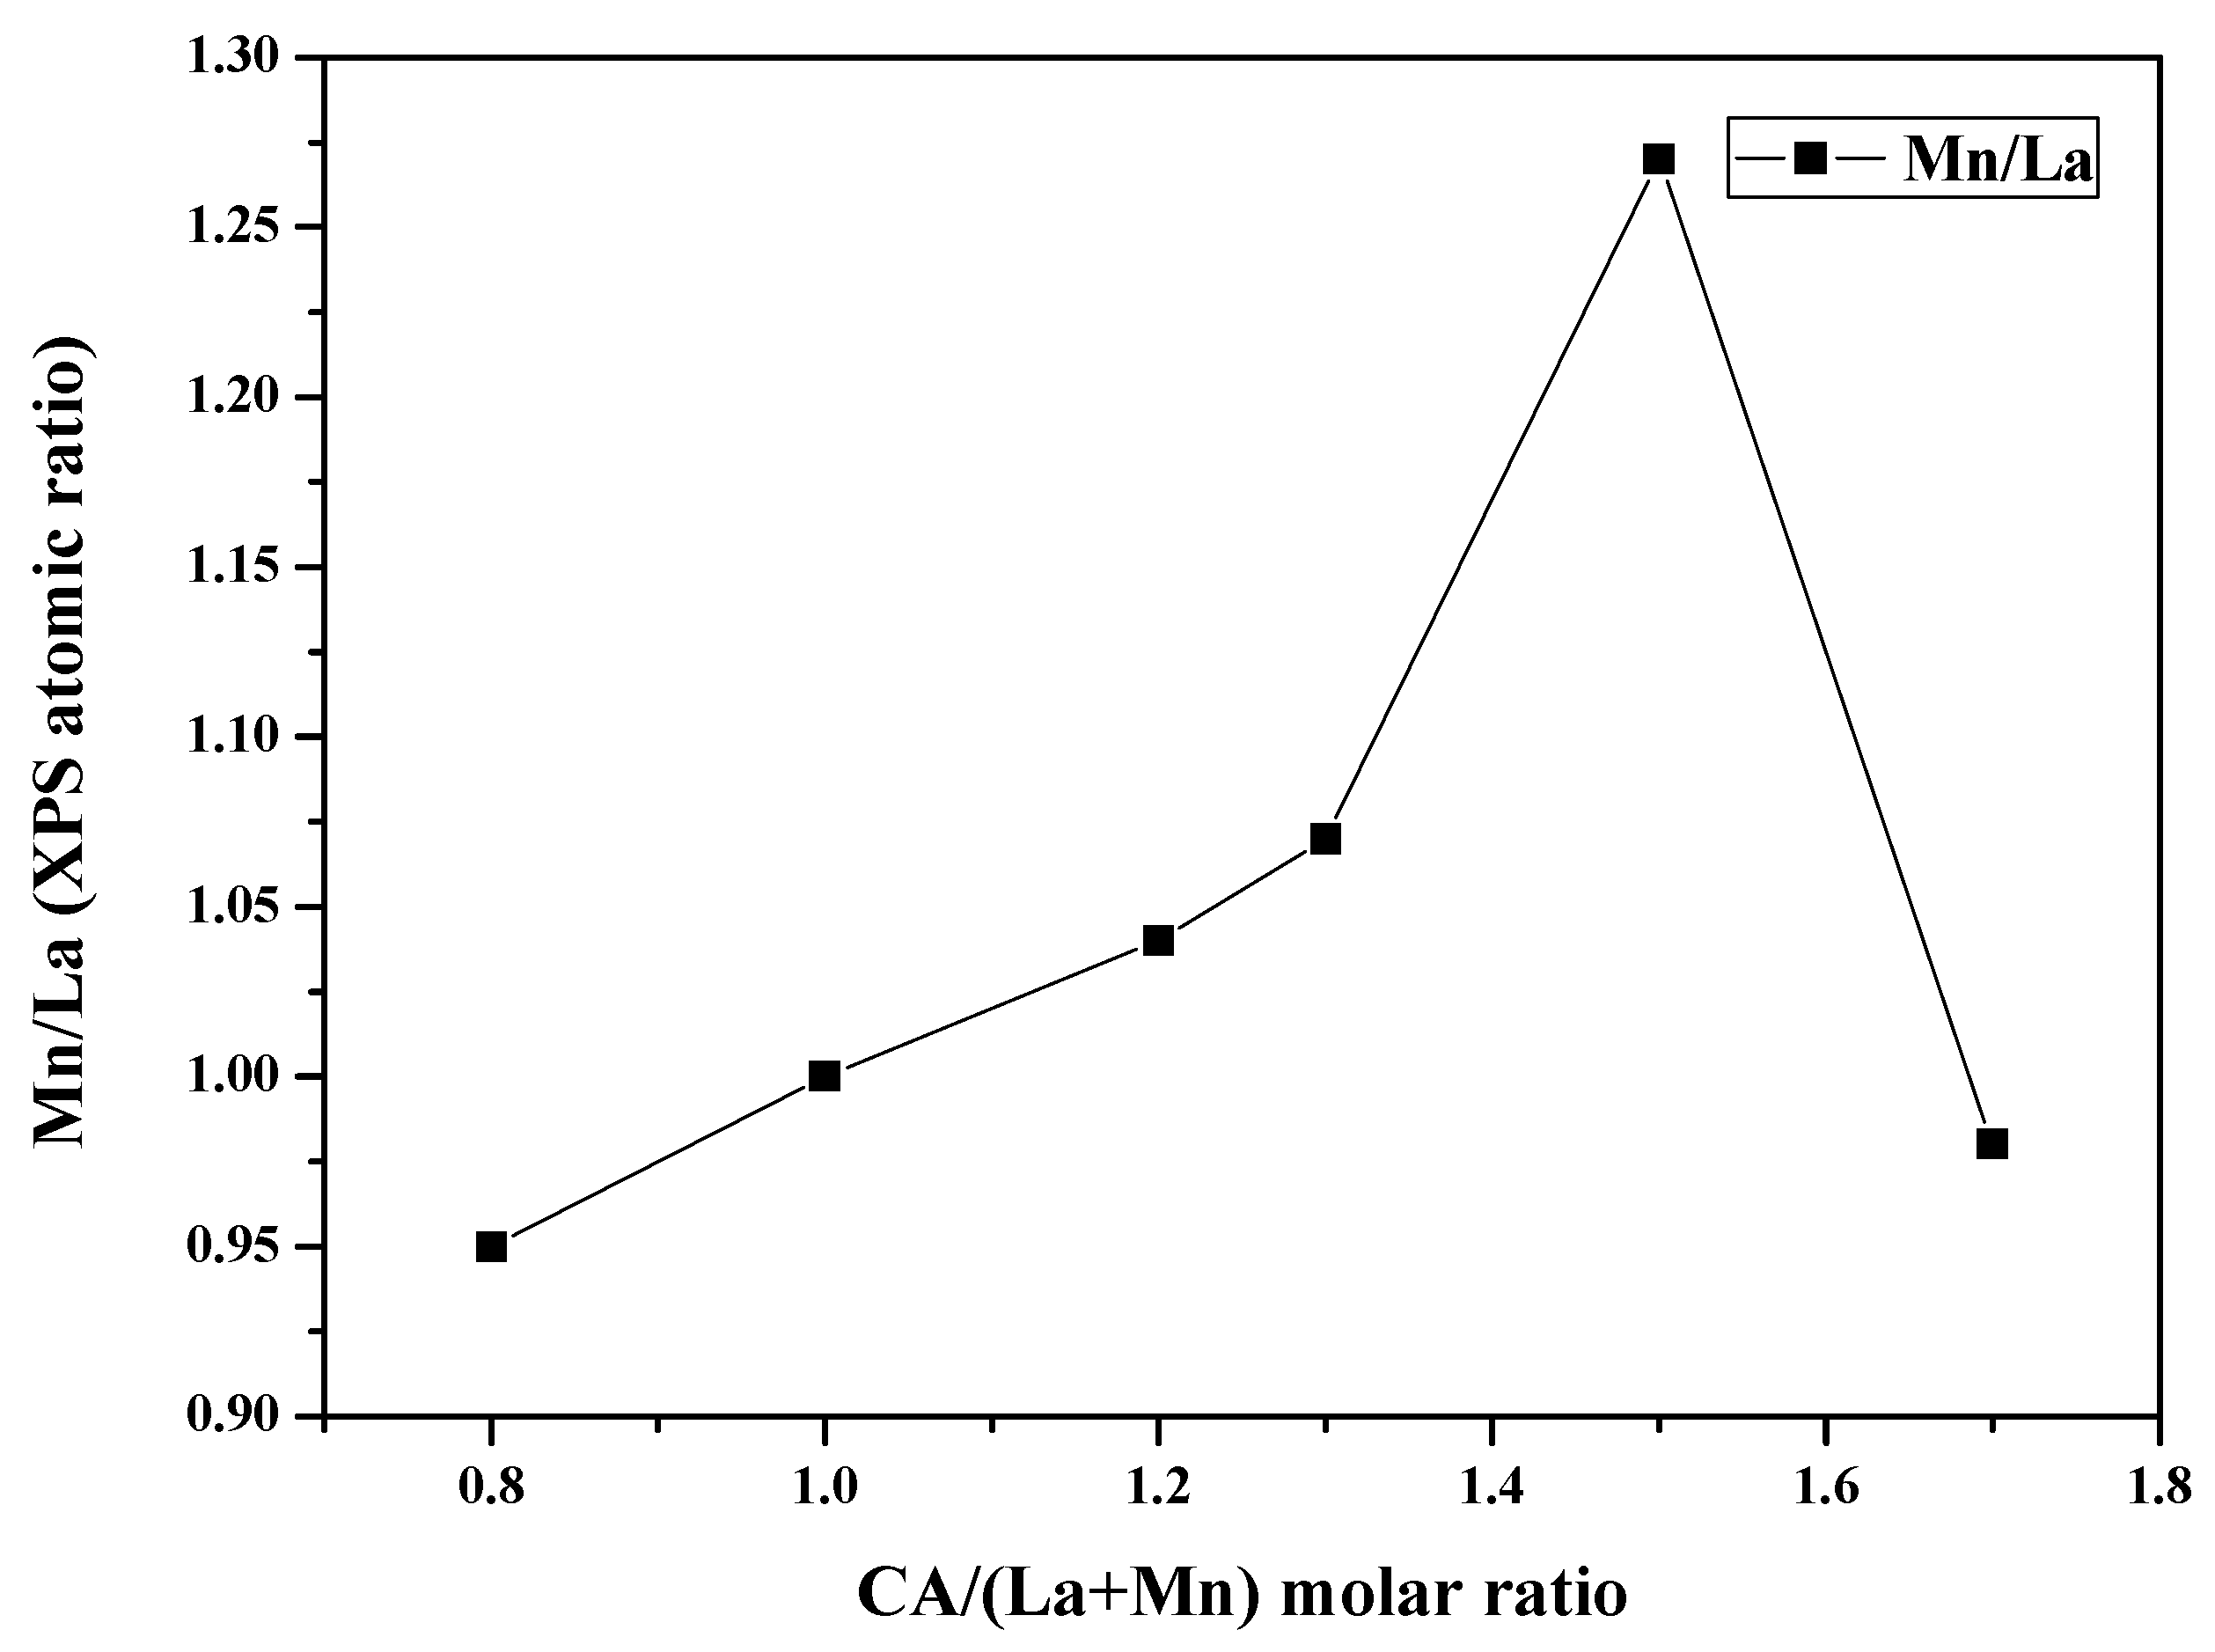
2.1. Characterization
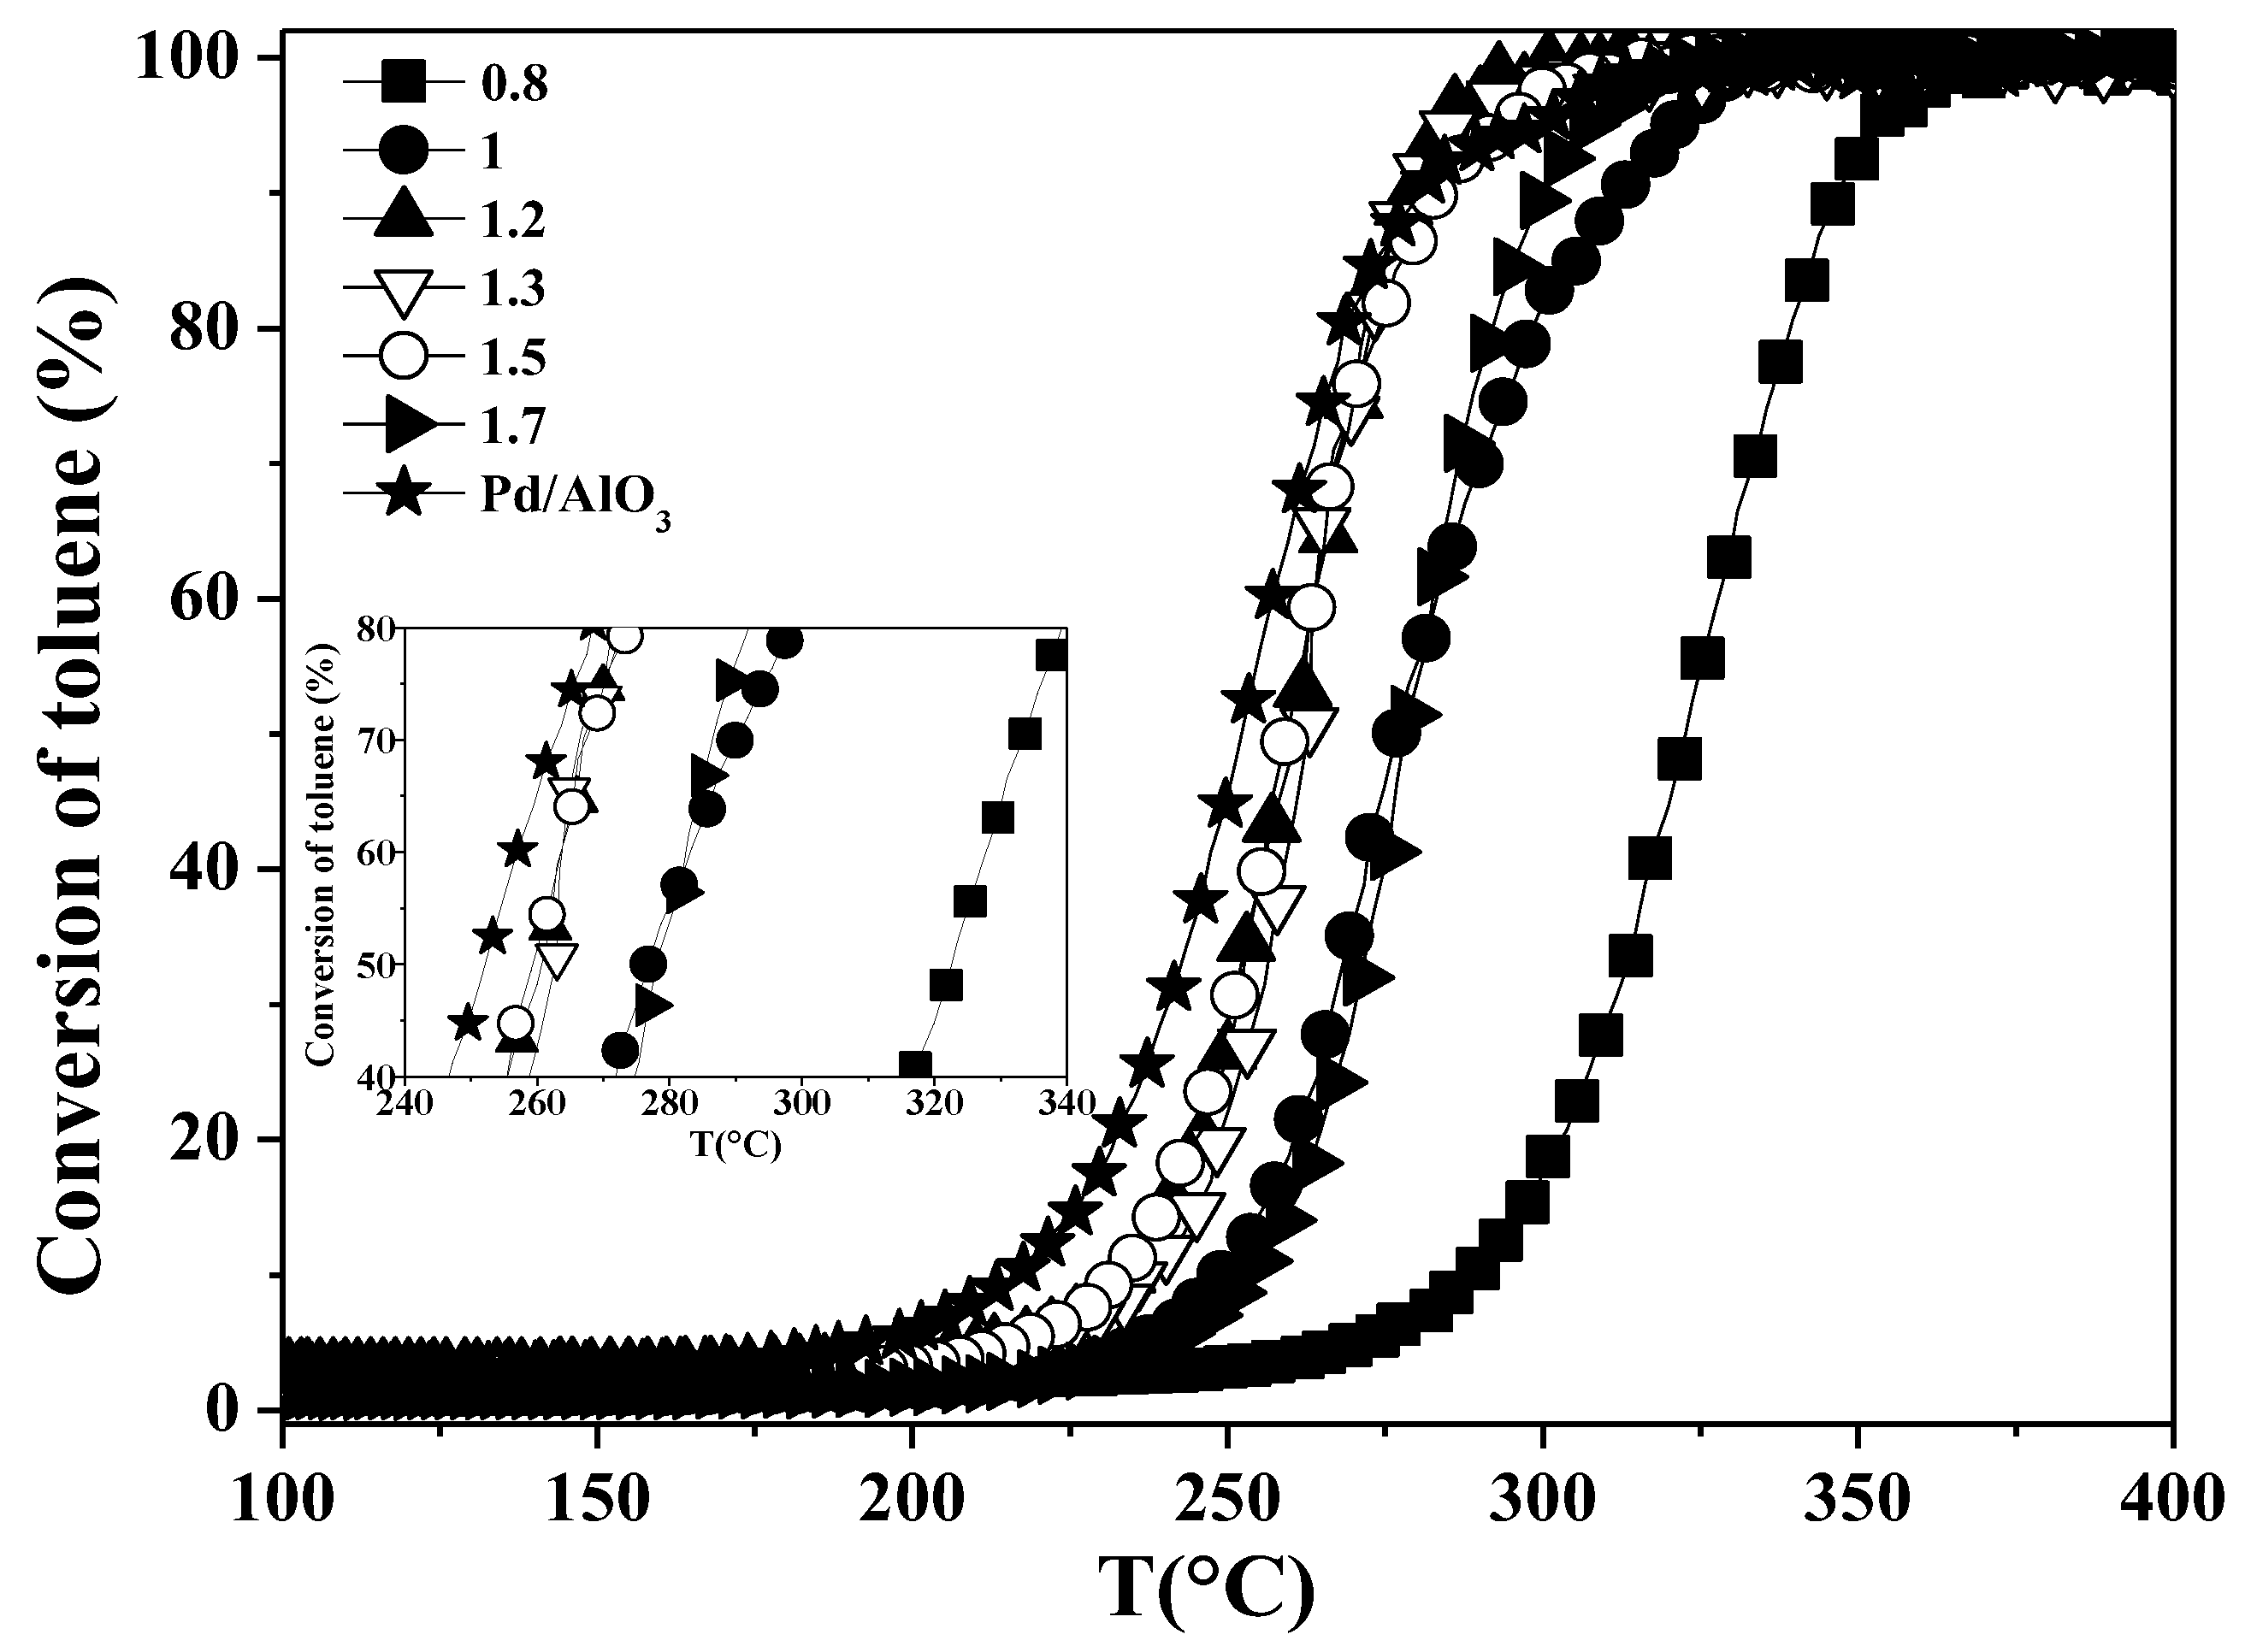
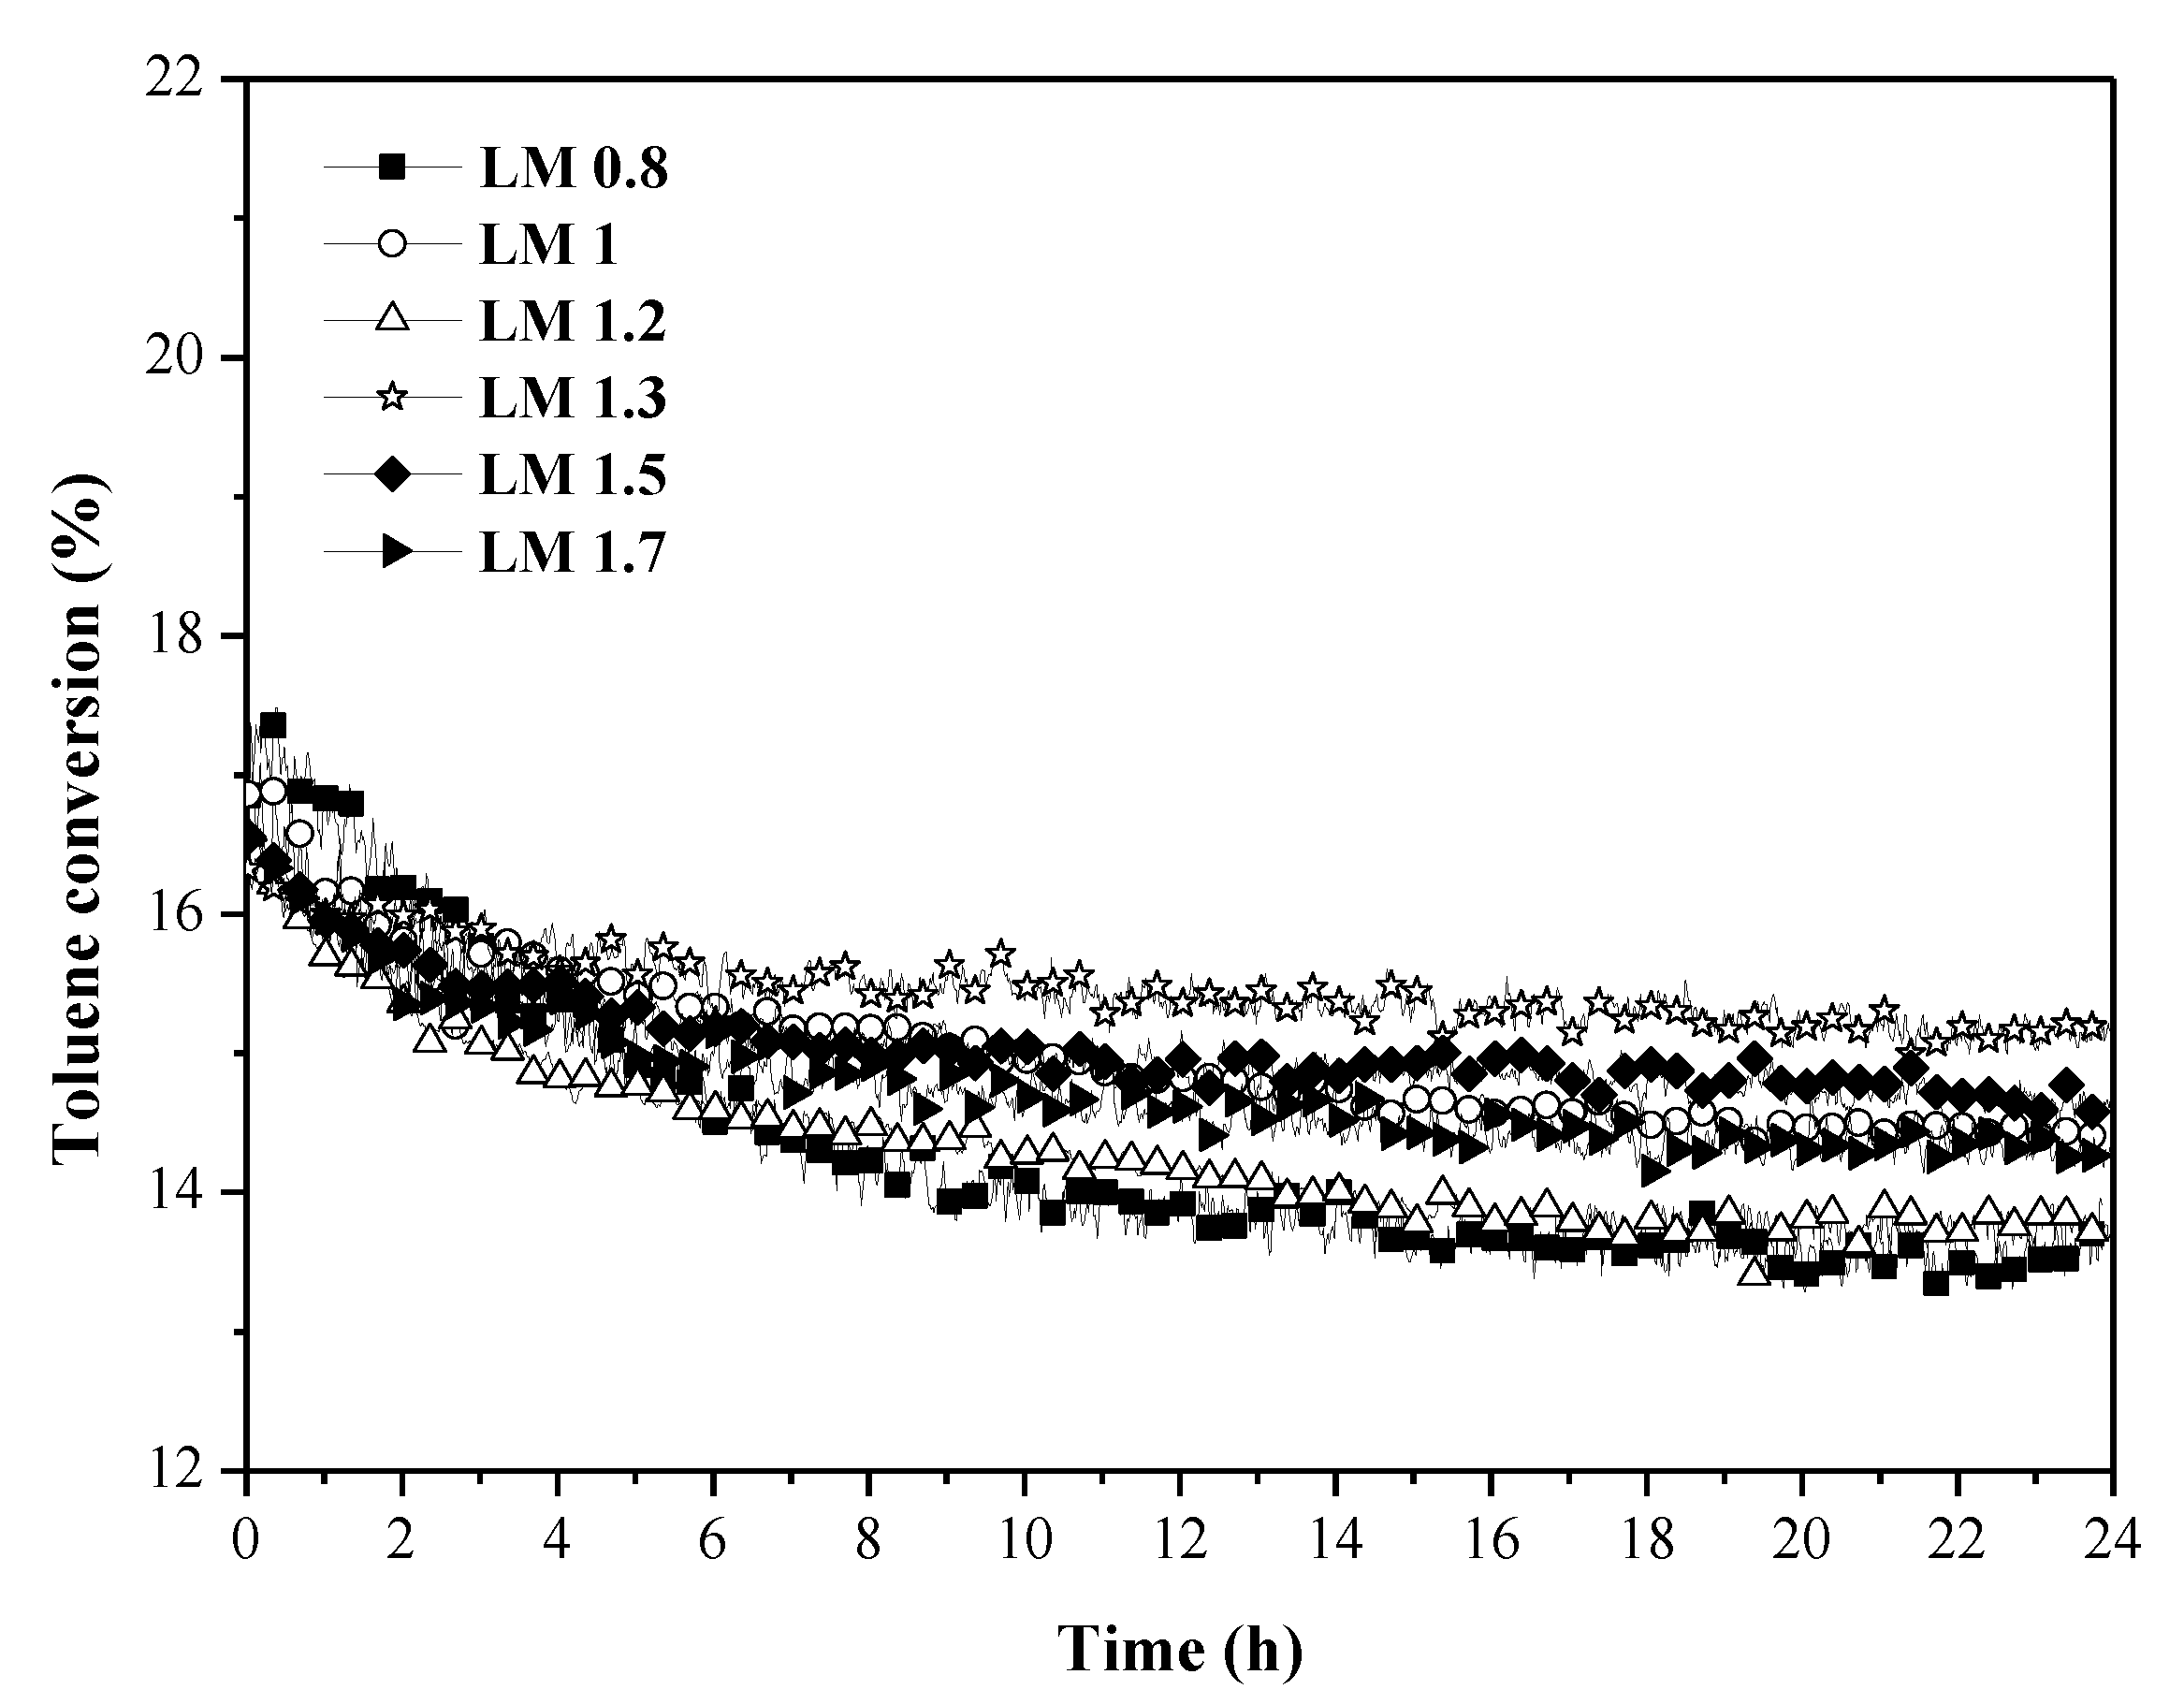
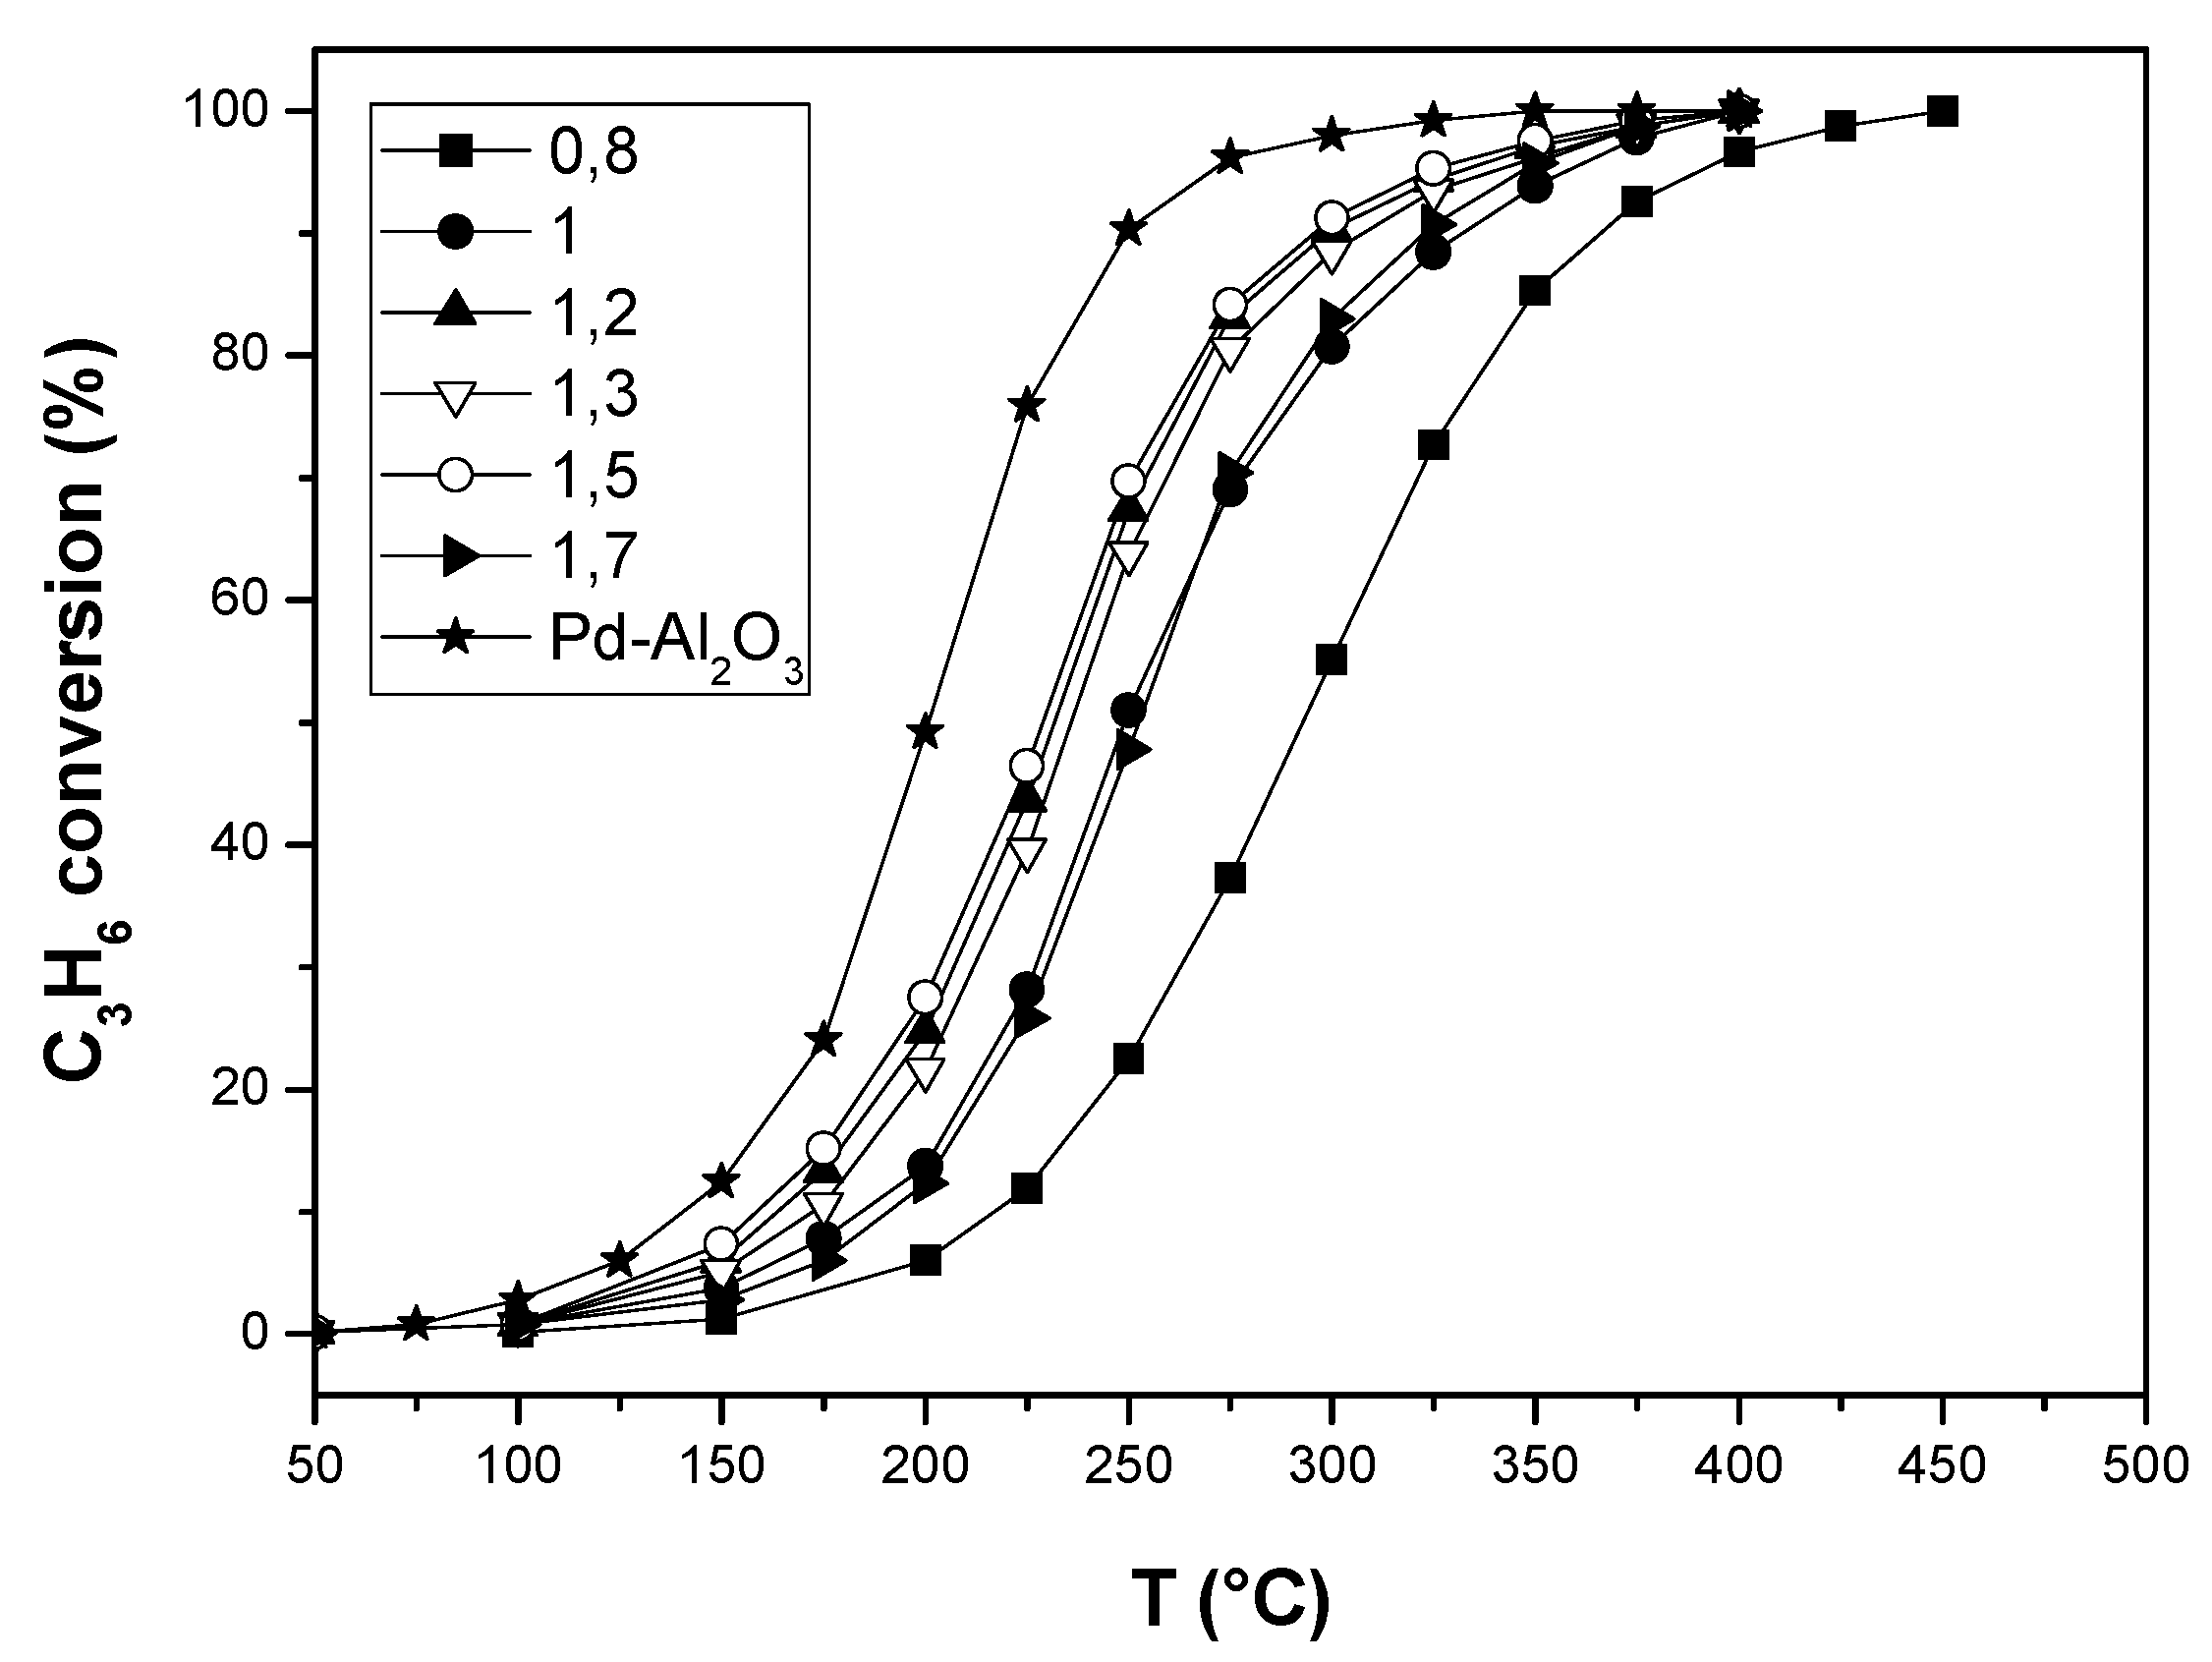
2.2. Toluene and Propene Oxidation Tests
3. Materials and Methods
3.1. LaMnO3 Preparation
3.2. Characterizations
3.3. Catalytic Tests
4. Conclusions
Author Contributions
Funding
Acknowledgments
Conflicts of Interest
References
- Holtappels, P.; Bagger, C. Fabrication and performance of advanced multi-layer SOFC cathodes. J. Eur. Ceram. Soc. 2002, 22, 41–48. [Google Scholar] [CrossRef]
- Yuasa, M.; Shimanoe, K.; Teraoka, Y.; Yamazoe, N. Preparation of carbon-supported nano-sized LaMnO3 using reverse micelle method for energy-saving oxygen reduction cathode. Catal. Today 2007, 126, 313–319. [Google Scholar] [CrossRef]
- Zhu, C.; Nobuta, A.; Nakatsugawa, I.; Akiyama, T. Solution combustion synthesis of LaMO3 (M = Fe, Co, Mn) perovskite nanoparticles and the measurement of their electrocatalytic properties for air cathode. Int. J. Hydrogen Energy 2013, 38, 13238–13248. [Google Scholar] [CrossRef]
- Nagaev, E.L. Colossal-magnetoresistance materials: Manganites and conventional ferromagnetic semiconductors. Phys. Rep. 2001, 346, 387–531. [Google Scholar] [CrossRef]
- Wu, X.; Xu, L.; Weng, D. The NO selective reduction on the La1−xSrxMnO3 catalysts. Catal. Today 2004, 90, 199–206. [Google Scholar] [CrossRef]
- Giannakis, A.E.; Ladavos, A.K.; Pomonis, P.J. Preparation, characterization and investigation of catalytic activity for NO+CO reaction of LaMnO3 and LaFeO3 perovskites prepared via microemulsion method. Appl. Catal. B Environ. 2004, 49, 147–158. [Google Scholar] [CrossRef]
- Kim, C.H.; Qi, G.; Dahlberg, K.; Li, W. Strontium-Doped Perovskites Rival Platinum Catalysts for Treating NOx in Simulated Diesel Exhaust. Nature 2010, 327, 1624–1627. [Google Scholar]
- Ciambelli, P.; Palma, V.; Tikhov, S.F.; Sadykov, V.A.; Isupova, L.A.; Lisi, L. Catalytic activity of powder and monolith perovskites in methane combustion. Catal. Today 1999, 47, 199–207. [Google Scholar] [CrossRef]
- Song, K.S.; Xing, H.; Sang, C.; Kim, D.; Kang, S.K. Catalytic combustion of CH4 and CO on La1−xMxMnO3 perovskites. Catal. Today 1999, 47, 155–160. [Google Scholar] [CrossRef]
- Cimino, S.; Pirone, R.; Lisi, L. Zirconia supported LaMnO3 monoliths for the catalytic combustion of methane. Appl. Catal. B Environ. 2002, 35, 243–254. [Google Scholar] [CrossRef]
- Gallagher, P.K.; Johnson, D.W.; Remeika, J.P.; Schrey, F.; Trimble, L.E.; Vogel, E.M.; Voorhoeve, R.J.H. The activity of La0.7Sr0.3MnO3 without Pt and La0.7Pb0.3MnO3 with varying Pt contents for the catalytic oxidation of CO. Mater. Res. Bull. 1975, 10, 529–538. [Google Scholar] [CrossRef]
- Gallagher, P.K.; Johnson, D.W.; Vogel, E.M.; Schrey, F. Effects of the Pt content of La0.7Pb0.3MnO3 on its catalytic activity for the oxidation of CO in the presence of SO2. Mater. Res. Bull. 1975, 10, 623–628. [Google Scholar] [CrossRef]
- Song, K.S.; Kang, S.K.; Kim, S.D. Preparation and characterization of Ag/MnOx/perovskite catalysts for CO oxidation. Cat. Lett. 1997, 49, 65–68. [Google Scholar] [CrossRef]
- Li, W.B.; Wang, J.X.; Gong, H. Catalytic combustion of VOCs on non-noble metal catalysts. Catal. Today 2009, 148, 81–87. [Google Scholar] [CrossRef]
- Stege, W.P.; Cadús, L.E.; Barbero, B.P. La1−xCaxMnO3 perovskites as catalysts for total oxidation of volatile organic compounds. Catal. Today 2011, 172, 53–57. [Google Scholar] [CrossRef]
- Zhang, C.; Wang, C.; Zhan, W.; Guo, Y.; Lu, G.; Baylet, A.; Giroir-Fendler, A. Catalytic oxidation of vinyl chloride emission over LaMnO3 and LaB0.2Mn0.8O3 (B = Co, Ni, Fe) catalysts. Appl. Catal. B Environ. 2013, 129, 509–516. [Google Scholar] [CrossRef]
- Gallagher, P.K.; Johnson, D.W.; Vogel, E.M.; Schrey, F. Studies of some supported perovskite oxidation catalysts. Mater. Res. Bull. 1974, 9, 1345–1352. [Google Scholar] [CrossRef]
- Yamazoe, N.; Teraoka, Y. Oxidation catalysis of perovskites—Relationships to bulk structure and composition (valency, defect, etc.). Catal. Today 1990, 8, 175–199. [Google Scholar] [CrossRef]
- Spinicci, R.; Faticanti, M.; Marini, P.; De Rossi, S.; Porta, P. Catalytic activity of LaMnO3 and LaCoO3 perovskites towards VOCs combustion. J. Mol. Catal. A Chem. 2003, 197, 147–155. [Google Scholar] [CrossRef]
- Ivanov, D.V.; Sadovskaya, E.M.; Pinaeva, L.G.; Isupova, L.A. Influence of oxygen mobility on catalytic activity of La-Sr-Mn-O composites in the reaction of high temperature N2O decomposition. J. Catal. 2009, 267, 5–13. [Google Scholar] [CrossRef]
- Bell, R.J.; Millar, G.J.; Drennan, J. Influence of synthesis route on the catalytic properties of La1−xSrxMnO3. Solid State Ion. 2000, 131, 211–220. [Google Scholar] [CrossRef]
- Royer, S.; Bérubé, F.; Kaliaguine, S. Effect of the synthesis conditions on the redox and catalytic properties in oxidation reactions of LaCo1−xFexO3. Appl. Catal. A Gen. 2005, 282, 273–284. [Google Scholar] [CrossRef]
- Wachowski, L. Influence of the method of preparation on the porous structure of perovskite oxides. Surf. Coat. Technol. 1986, 29, 303–311. [Google Scholar] [CrossRef]
- Baythoun, M.S.G.; Sale, F.R.J. Production of strontium-substituted lanthanum manganite perovskite powder by the amorphous citrate process. Mater. Sci. 1982, 17, 2757–2769. [Google Scholar] [CrossRef]
- Taguchi, H.; Yamada, S.; Nagao, M.; Ichikawa, Y.; Tabata, K. Surface characterization of LaCoO3 synthesized using citric acid. Mater. Res. Bull. 2002, 37, 69–76. [Google Scholar] [CrossRef]
- Ng Lee, Y.; Lago, R.M.; Fierro, J.L.G.; Gonzalez, J. Hydrogen peroxide decomposition over Ln1−xAxMnO3 (Ln = La or Nd and A = K or Sr) perovskites. Appl. Catal. A Gen. 2001, 215, 245–256. [Google Scholar]
- Zhang, C.; Guo, Y.; Boreave, A.; Retailleau, L.; Baylet, A.; Giroir-Fendler, A. LaMnO3 perovskite oxides prepared by different methods for catalytic oxidation of toluene. Appl. Catal. B Environ. 2014, 490, 148–149. [Google Scholar] [CrossRef]
- Tejuca, L.G.; Fierro, J.L.G.; Tascon, J.M.D. Structure and Reactivity of Perovskite-Type Oxides. Adv. Catal. 1989, 36, 237–328. [Google Scholar]
- Wachowski, L.; Zielinski, S.; Burewicz, A. Preparation, stability and oxygen stoichiometry in perovskite-type binary oxides. Acta Chim. Acad. Sci. Hung. 1981, 106, 217–225. [Google Scholar]
- Kaliaguine, S.; Van Neste, A. Process for Synthesizing Perovskites Using High Energy Milling. U.S. Patent 6017504, 25 January 2000. [Google Scholar]
- Kaliaguine, S.; Van Neste, A. Process for Synthesizing Metal Oxides and Metal Oxides Having a Perovskite or Perovskite-Like Crystal Structure. U.S. Patent 6770256, 3 August 2004. [Google Scholar]
- Mali, A.; Ataie, A. Structural characterization of nano-crystalline BaFe12O19 powders synthesized by sol–gel oxidation route. Scr. Mater. 2005, 53, 1065–1070. [Google Scholar] [CrossRef]
- Yue, Z.X.; Guo, W.Y.; Zhou, J.; Gui, Z.J.; Li, L.T. Synthesis of nanocrystilline ferrites by sol–gel combustion process: The influence of pH value of solution. J. Magn. Magn. Mater. 2004, 270, 216–223. [Google Scholar] [CrossRef]
- Sihaib, Z.; Puleo, F.; Garcia-Vargas, J.M.; Retailleau, L.; Descorme, C.; Liotta, L.F.; Valverde, J.L.; Gil, S.; Giroir-Fendler, A. Manganese oxide-based catalysts for toluene oxidation. Appl. Catal. B Environ. 2017, 209, 689–700. [Google Scholar] [CrossRef]
- Ghiasi, E.; Malekzadeh, A.; Ghiasi, M. Moderate concentration of citric acid for the formation of LaMnO3 and LaCoO3 nano-perovskites. J. Rare Earths 2013, 31, 997–1002. [Google Scholar] [CrossRef]
- Taguchi, H.; Matsuura, S.I.; Nagao, M.; Choso, T.; Tabata, K. Synthesis of LaMnO3+δ by Firing Gels Using Citric Acid. J. Solid State Chem. 1997, 129, 60–65. [Google Scholar] [CrossRef]
- Hammami, R.; Aïssa, S.B.; Batis, H. Effects of thermal treatment on physicochemical and catalytic properties of lanthanum manganite LaMnO3+y. Appl. Catal. A Gen. 2009, 353, 145–153. [Google Scholar] [CrossRef]
- Predoana, L.; Malic, B.; Kosec, M.; Carata, M.; Caldararu, M.; Zaharescu, M. Characterization of LaCoO3 powders obtained by water-based sol–gel method with citric acid. J. Eur. Ceram. Soc. 2007, 27, 4407–4411. [Google Scholar] [CrossRef]
- Gómez-Cuaspud, J.A.; Valencia-Ríos, J.S.; Carda-Castelló, J.B. Preparation and characterization of perovskite oxides by polymerization-combustion. J. Chil. Chem. Soc. 2010, 55, 445–449. [Google Scholar] [CrossRef]
- Berger, D.; Matei, C.; Papa, F.; Macovei, D.; Fruth, V.; Deloume, J.P. Pure and doped lanthanum manganites obtained by combustion method. J. Eur. Ceram. Soc. 2007, 27, 4395–4398. [Google Scholar] [CrossRef]
- Nagabhushana, B.M.; Chakradhar, R.P.S.; Ramesh, K.P.; Shivakumara, C.; Chandrappa, G.T. Combustion synthesis, characterization and metal–insulator transition studies of nanocrystalline La1−xCaxMnO3 (0.0≤x≤0.5). Mater. Chem. Phys. 2007, 102, 47–52. [Google Scholar] [CrossRef]
- Taguchi, H.; Sugita, A.; Nagao, M.; Tabata, K. Surface characterization of LaMnO3+δ powder annealed in air. J. Solid State Chem. 1995, 119, 164–168. [Google Scholar] [CrossRef]
- Biesinger, M.C.; Payne, B.P.; Grosvenor, A.P.; Lau, L.W.M.; Gerson, A.R.; Smart, R.S.C. Resolving surface chemical states in XPS analysis of first row transition metals, oxides and hydroxides: Cr, Mn, Fe, Co and Ni. Appl. Surf. Sci. 2011, 257, 2717–2730. [Google Scholar] [CrossRef]
- Kuyyalil, J.; Newby, D., Jr.; Laverock, J.; Yu, Y.; Cetin, D.; Basuc, S.N.; Ludwig, K.; Smith, K.E. Vacancy assisted SrO formation on La0.8Sr0.2Co0.2Fe0.8O3-δ surfaces—A synchrotron photoemission study. Surf. Sci. 2015, 642, 33–38. [Google Scholar] [CrossRef]
- Liu, P.; He, H.; Wei, G.; Liu, D.; Liang, X.; Chen, T.; Zhu, J.; Zhu, R. An efficient catalyst of manganese supported on diatomite for toluene oxidation: Manganese species, catalytic performance, and structure-activity relationship. Microporous Mesoporous Mater. 2017, 239, 101–110. [Google Scholar] [CrossRef]
- Doornkamp, C.; Ponec, V. The universal character of the Mars and Van Krevelen mechanism. J. Mol. Catal. A Chem. 2000, 162, 19–32. [Google Scholar] [CrossRef]
- Liotta, L.F.; Ousmane, M.; Di Carlo, G.; Pantaleo, G.; Deganello, G.; Marcì, G.; Retailleau, L.; Giroir-Fendler, A. Total oxidation of propene at low temperature over Co3O4–CeO2 mixed oxides: Role of surface oxygen vacancies and bulk oxygen mobility in the catalytic activity. Appl. Catal. A Gen. 2008, 347, 81–88. [Google Scholar] [CrossRef]


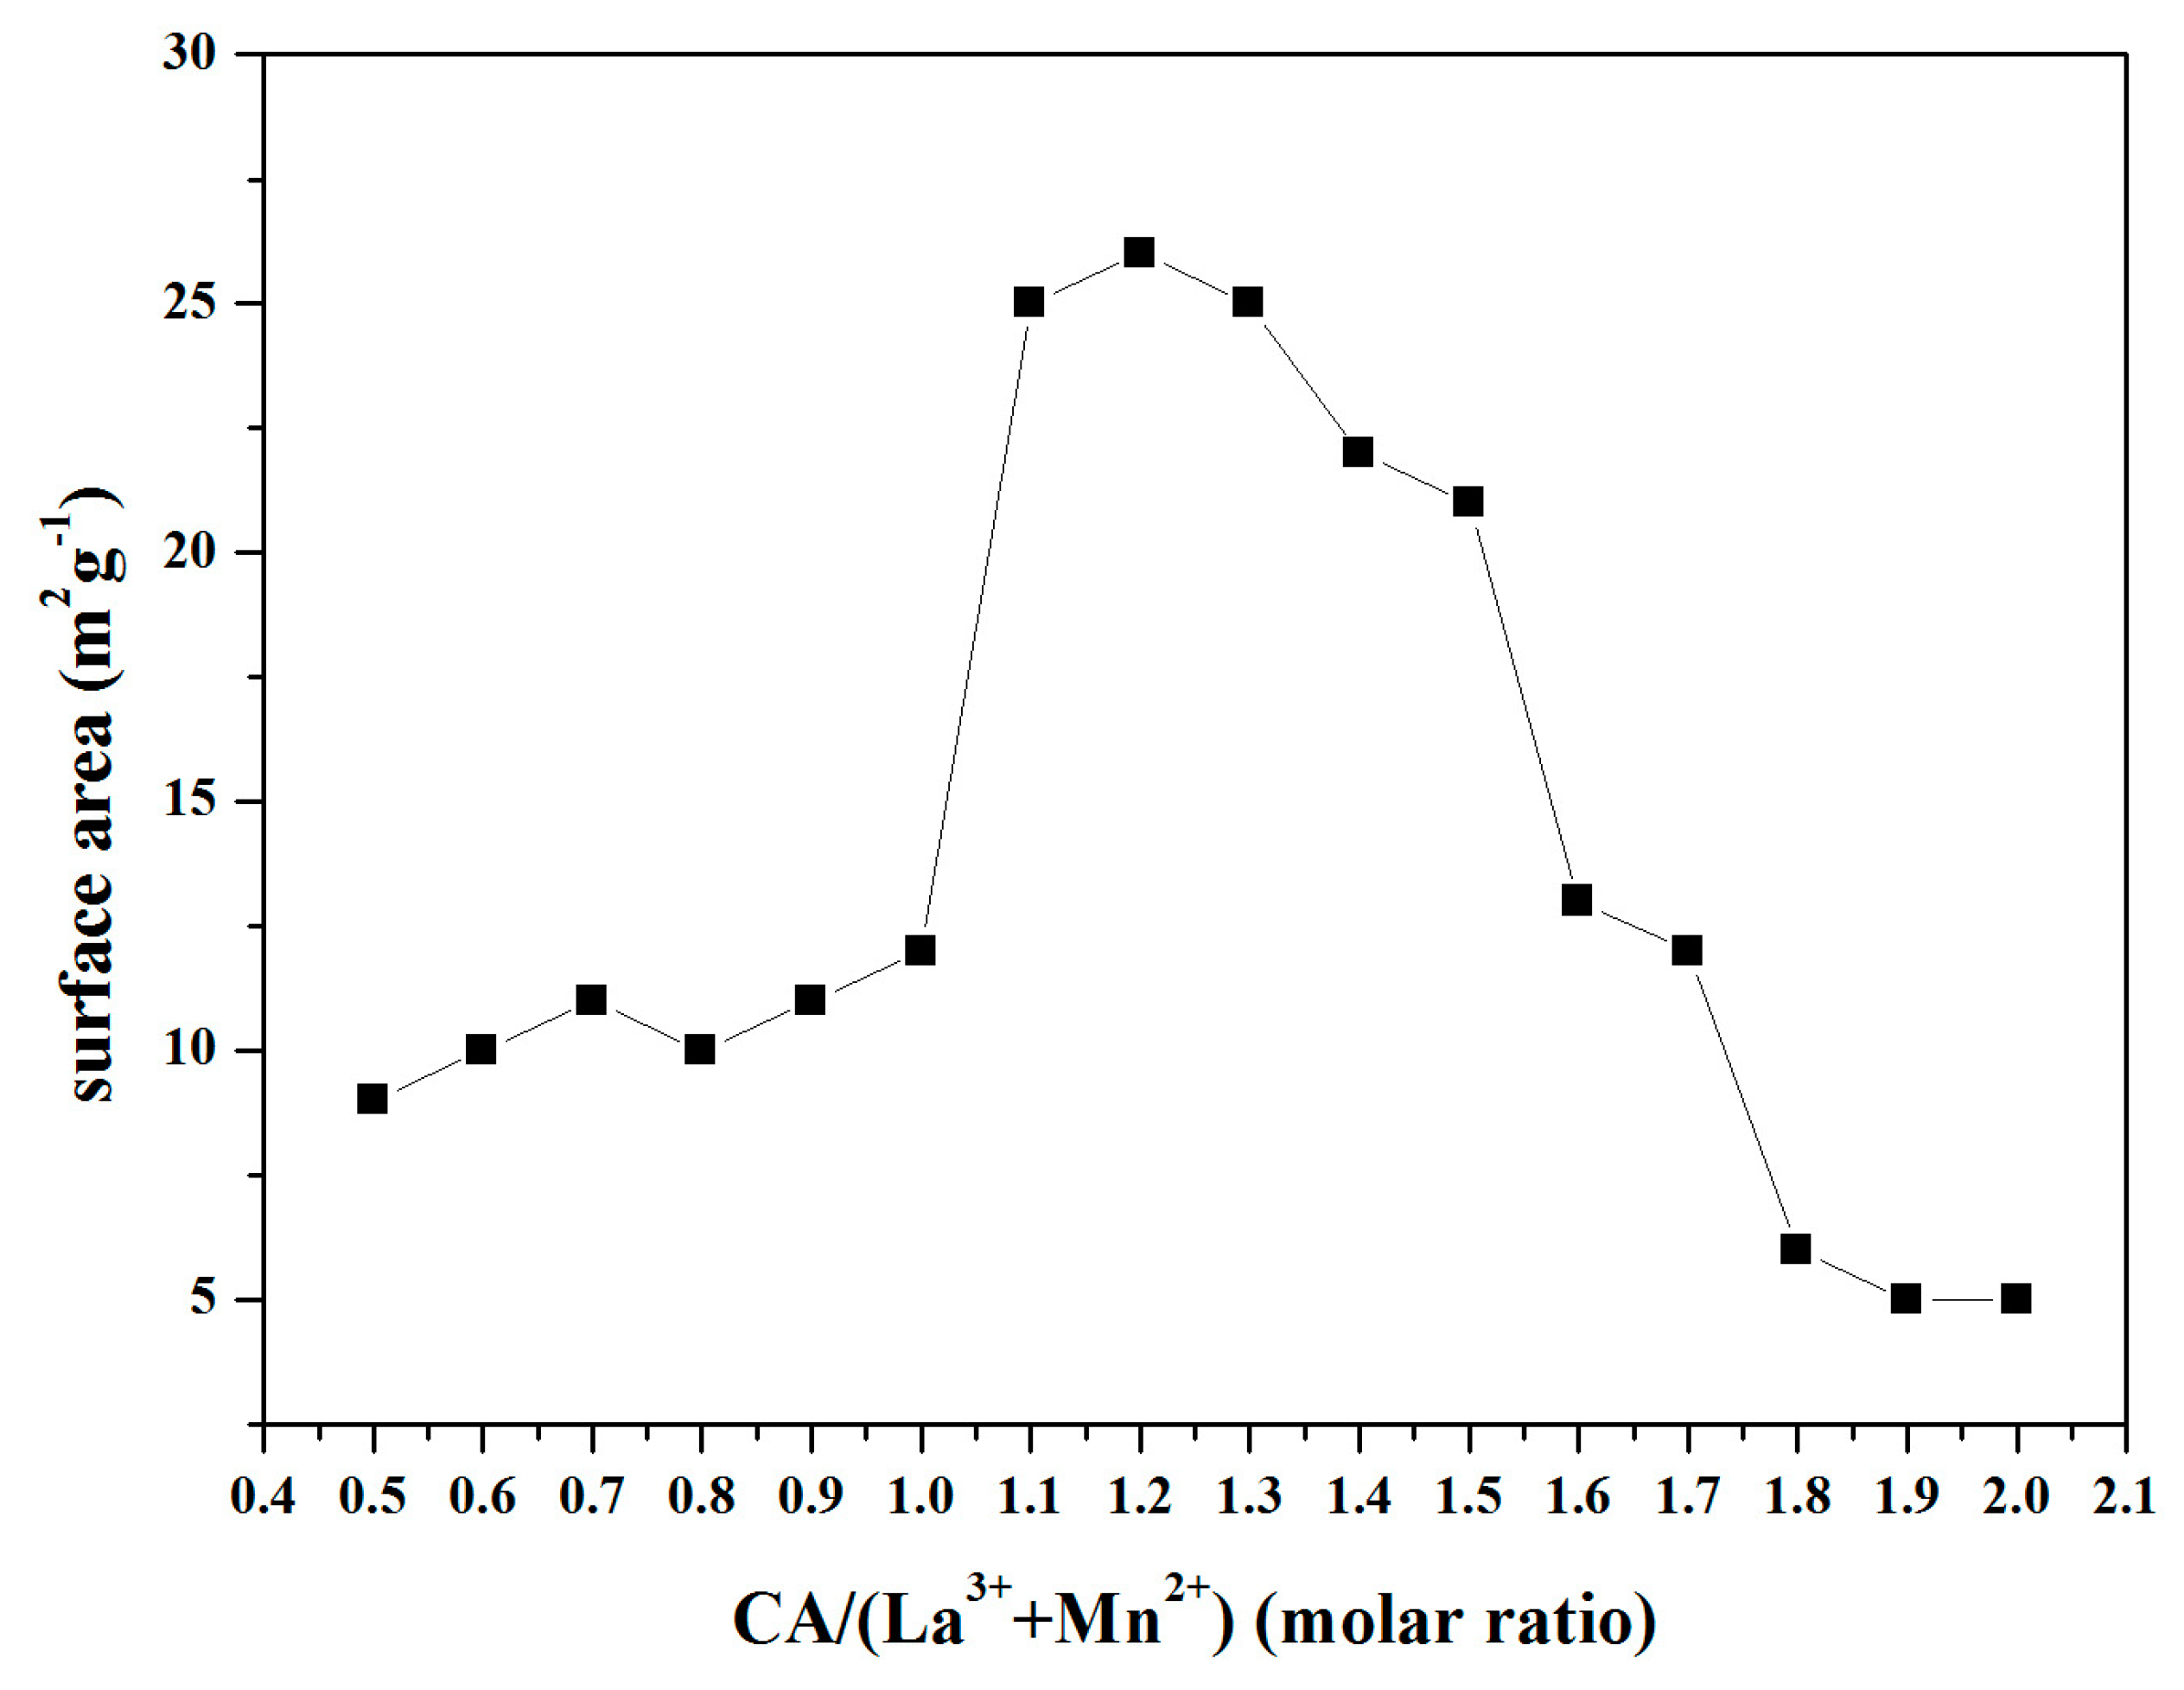
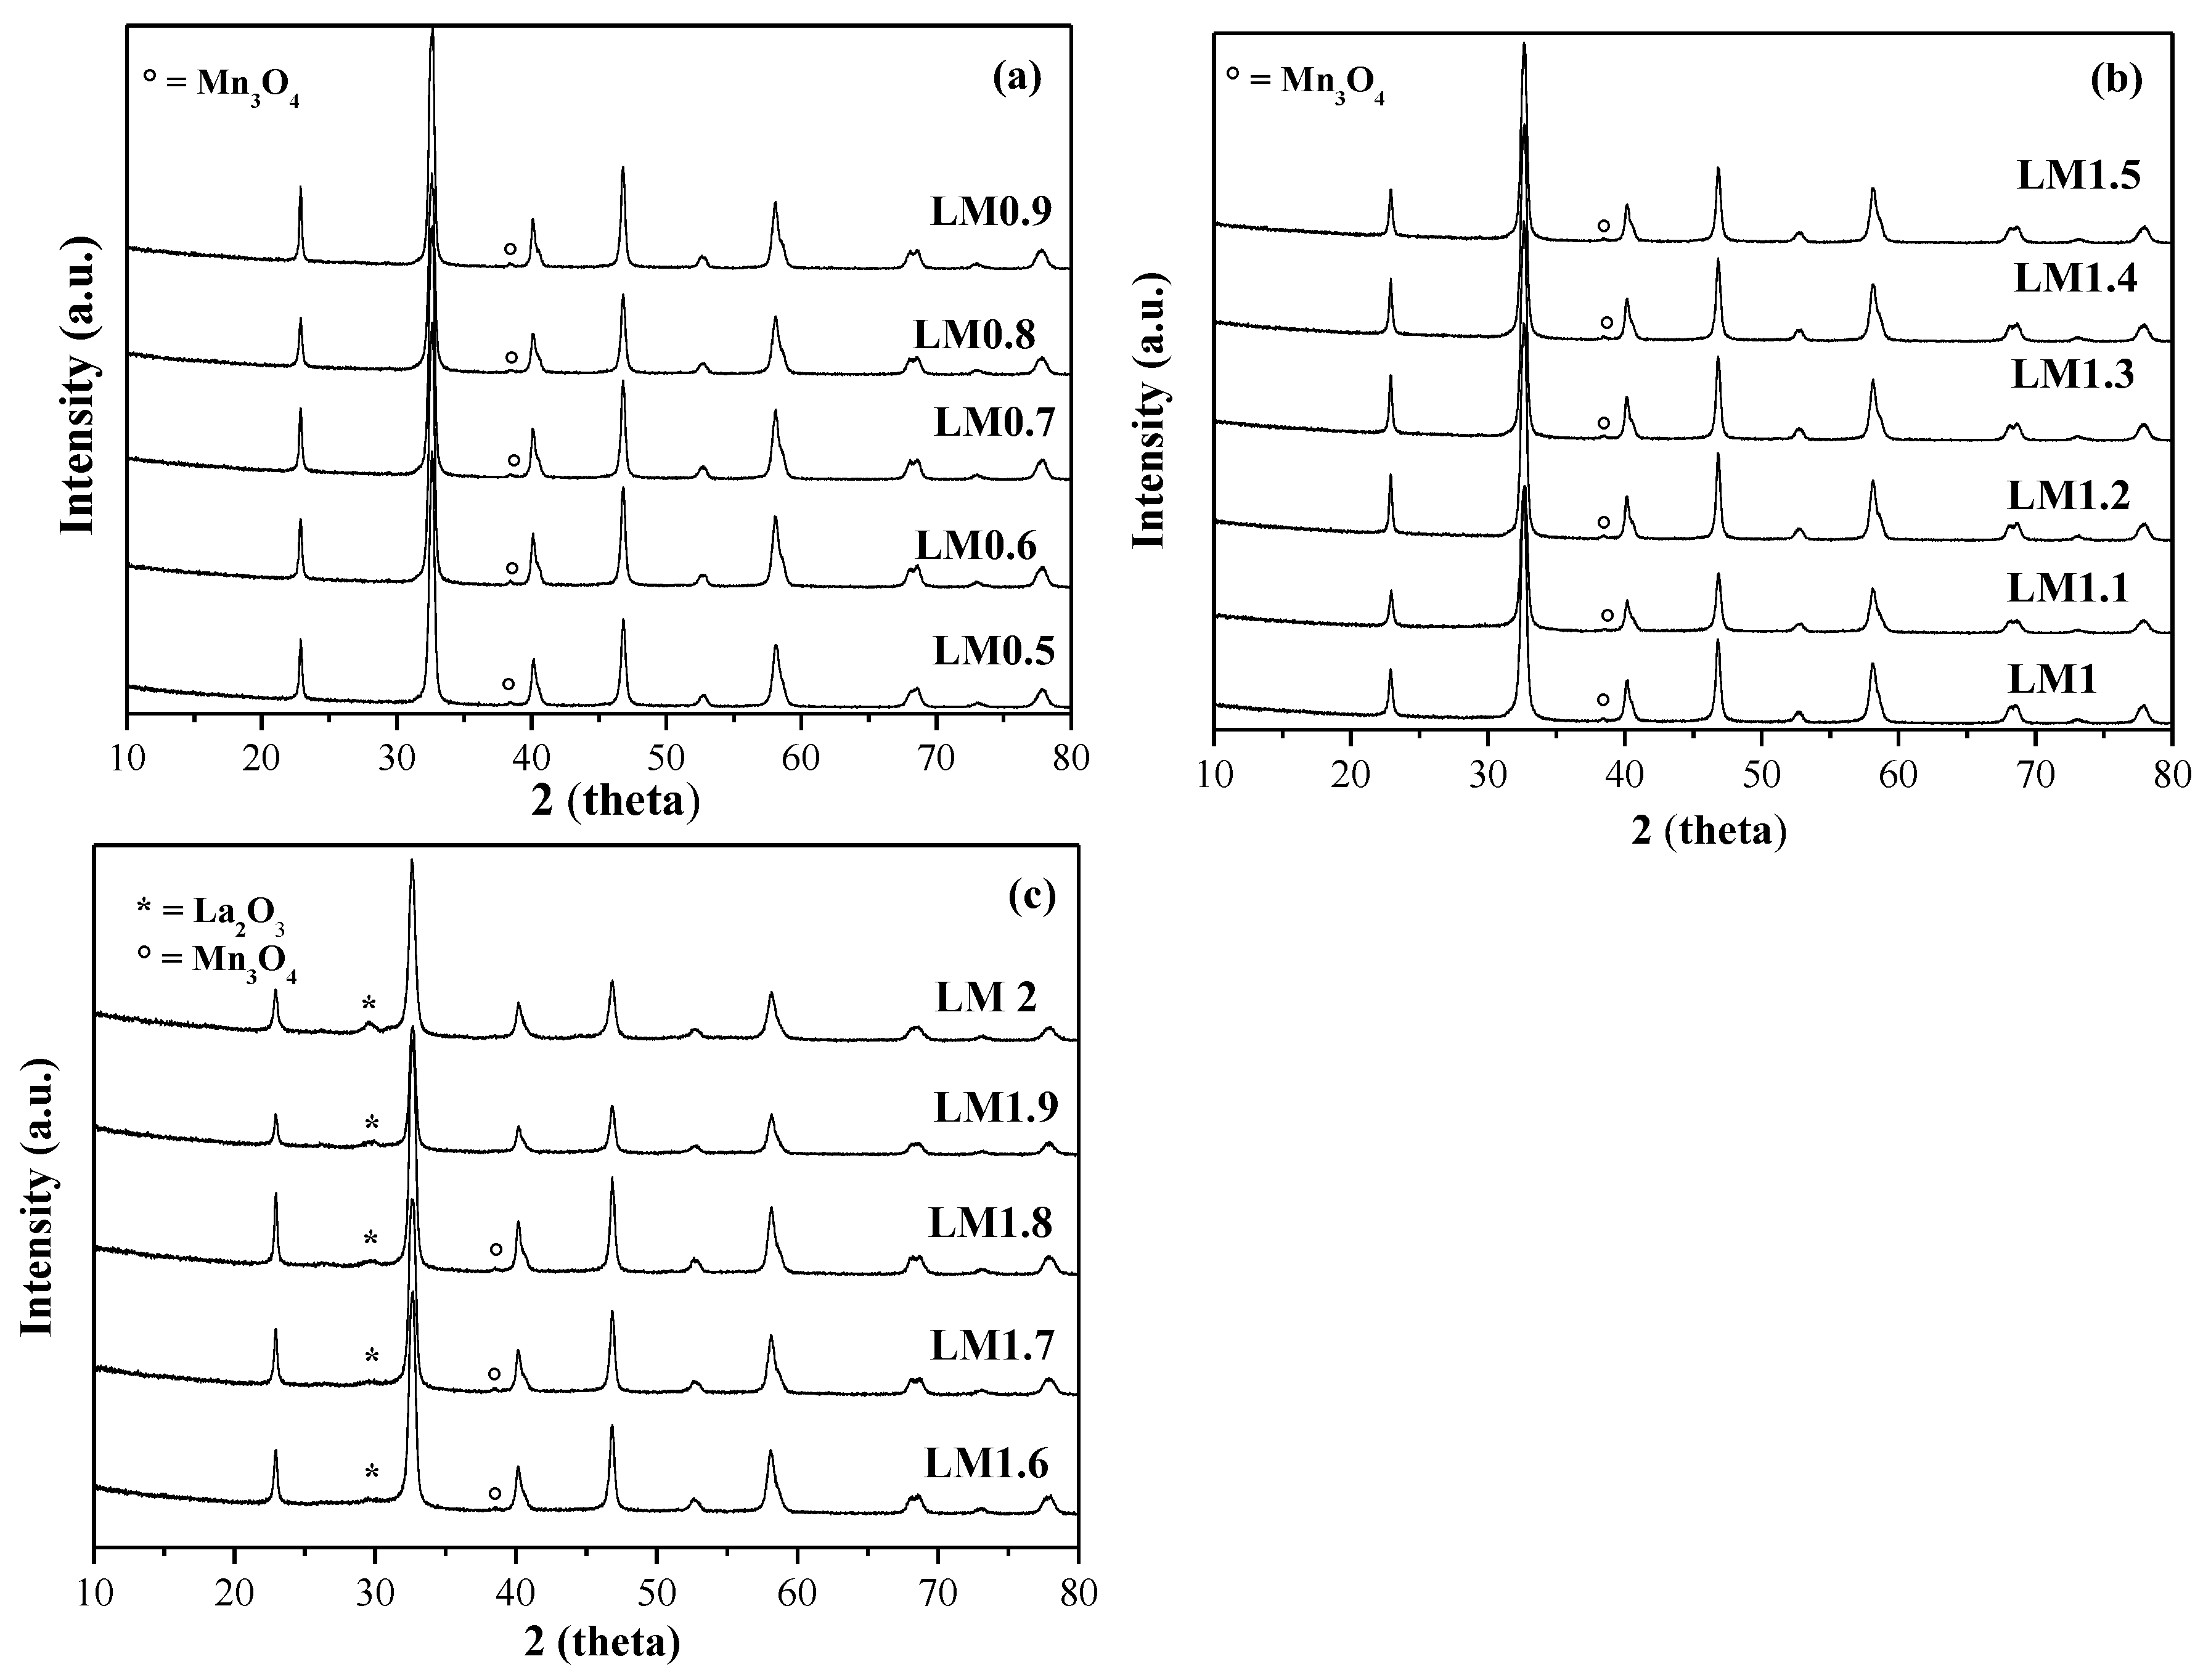
| Samples | Mn 1 (wt %) | La 1 (wt %) | SSA 2 (m2 × g−1) | dXRD 3 (nm) |
|---|---|---|---|---|
| LM0.5 | 22.17 | 56.20 | 9 | 26 |
| LM0.6 | 20.44 | 55.66 | 10 | 25 |
| LM0.7 | 22.02 | 55.74 | 11 | 22 |
| LM0.8 | 21.41 | 56.20 | 10 | 25 |
| LM0.9 | 21.03 | 56.49 | 11 | 21 |
| LM1 | 21.58 | 55.42 | 12 | 23 |
| LM1.1 | 21.25 | 53.5 | 25 | 19 |
| LM1.2 | 21.75 | 54.8 | 26 | 18 |
| LM1.3 | 21.42 | 55.23 | 25 | 18 |
| LM1.4 | 21.50 | 55.1 | 22 | 20 |
| LM1.5 | 21.55 | 54.6 | 21 | 20 |
| LM1.6 | 21.56 | 56.41 | 13 | 23 |
| LM1.7 | 21.22 | 56.20 | 12 | 22 |
| LM1.8 | 22.06 | 56.30 | 5 | 25 |
| LM1.9 | 20.77 | 57 | 6 | 28 |
| LM2 | 20.56 | 56.72 | 5 | 30 |
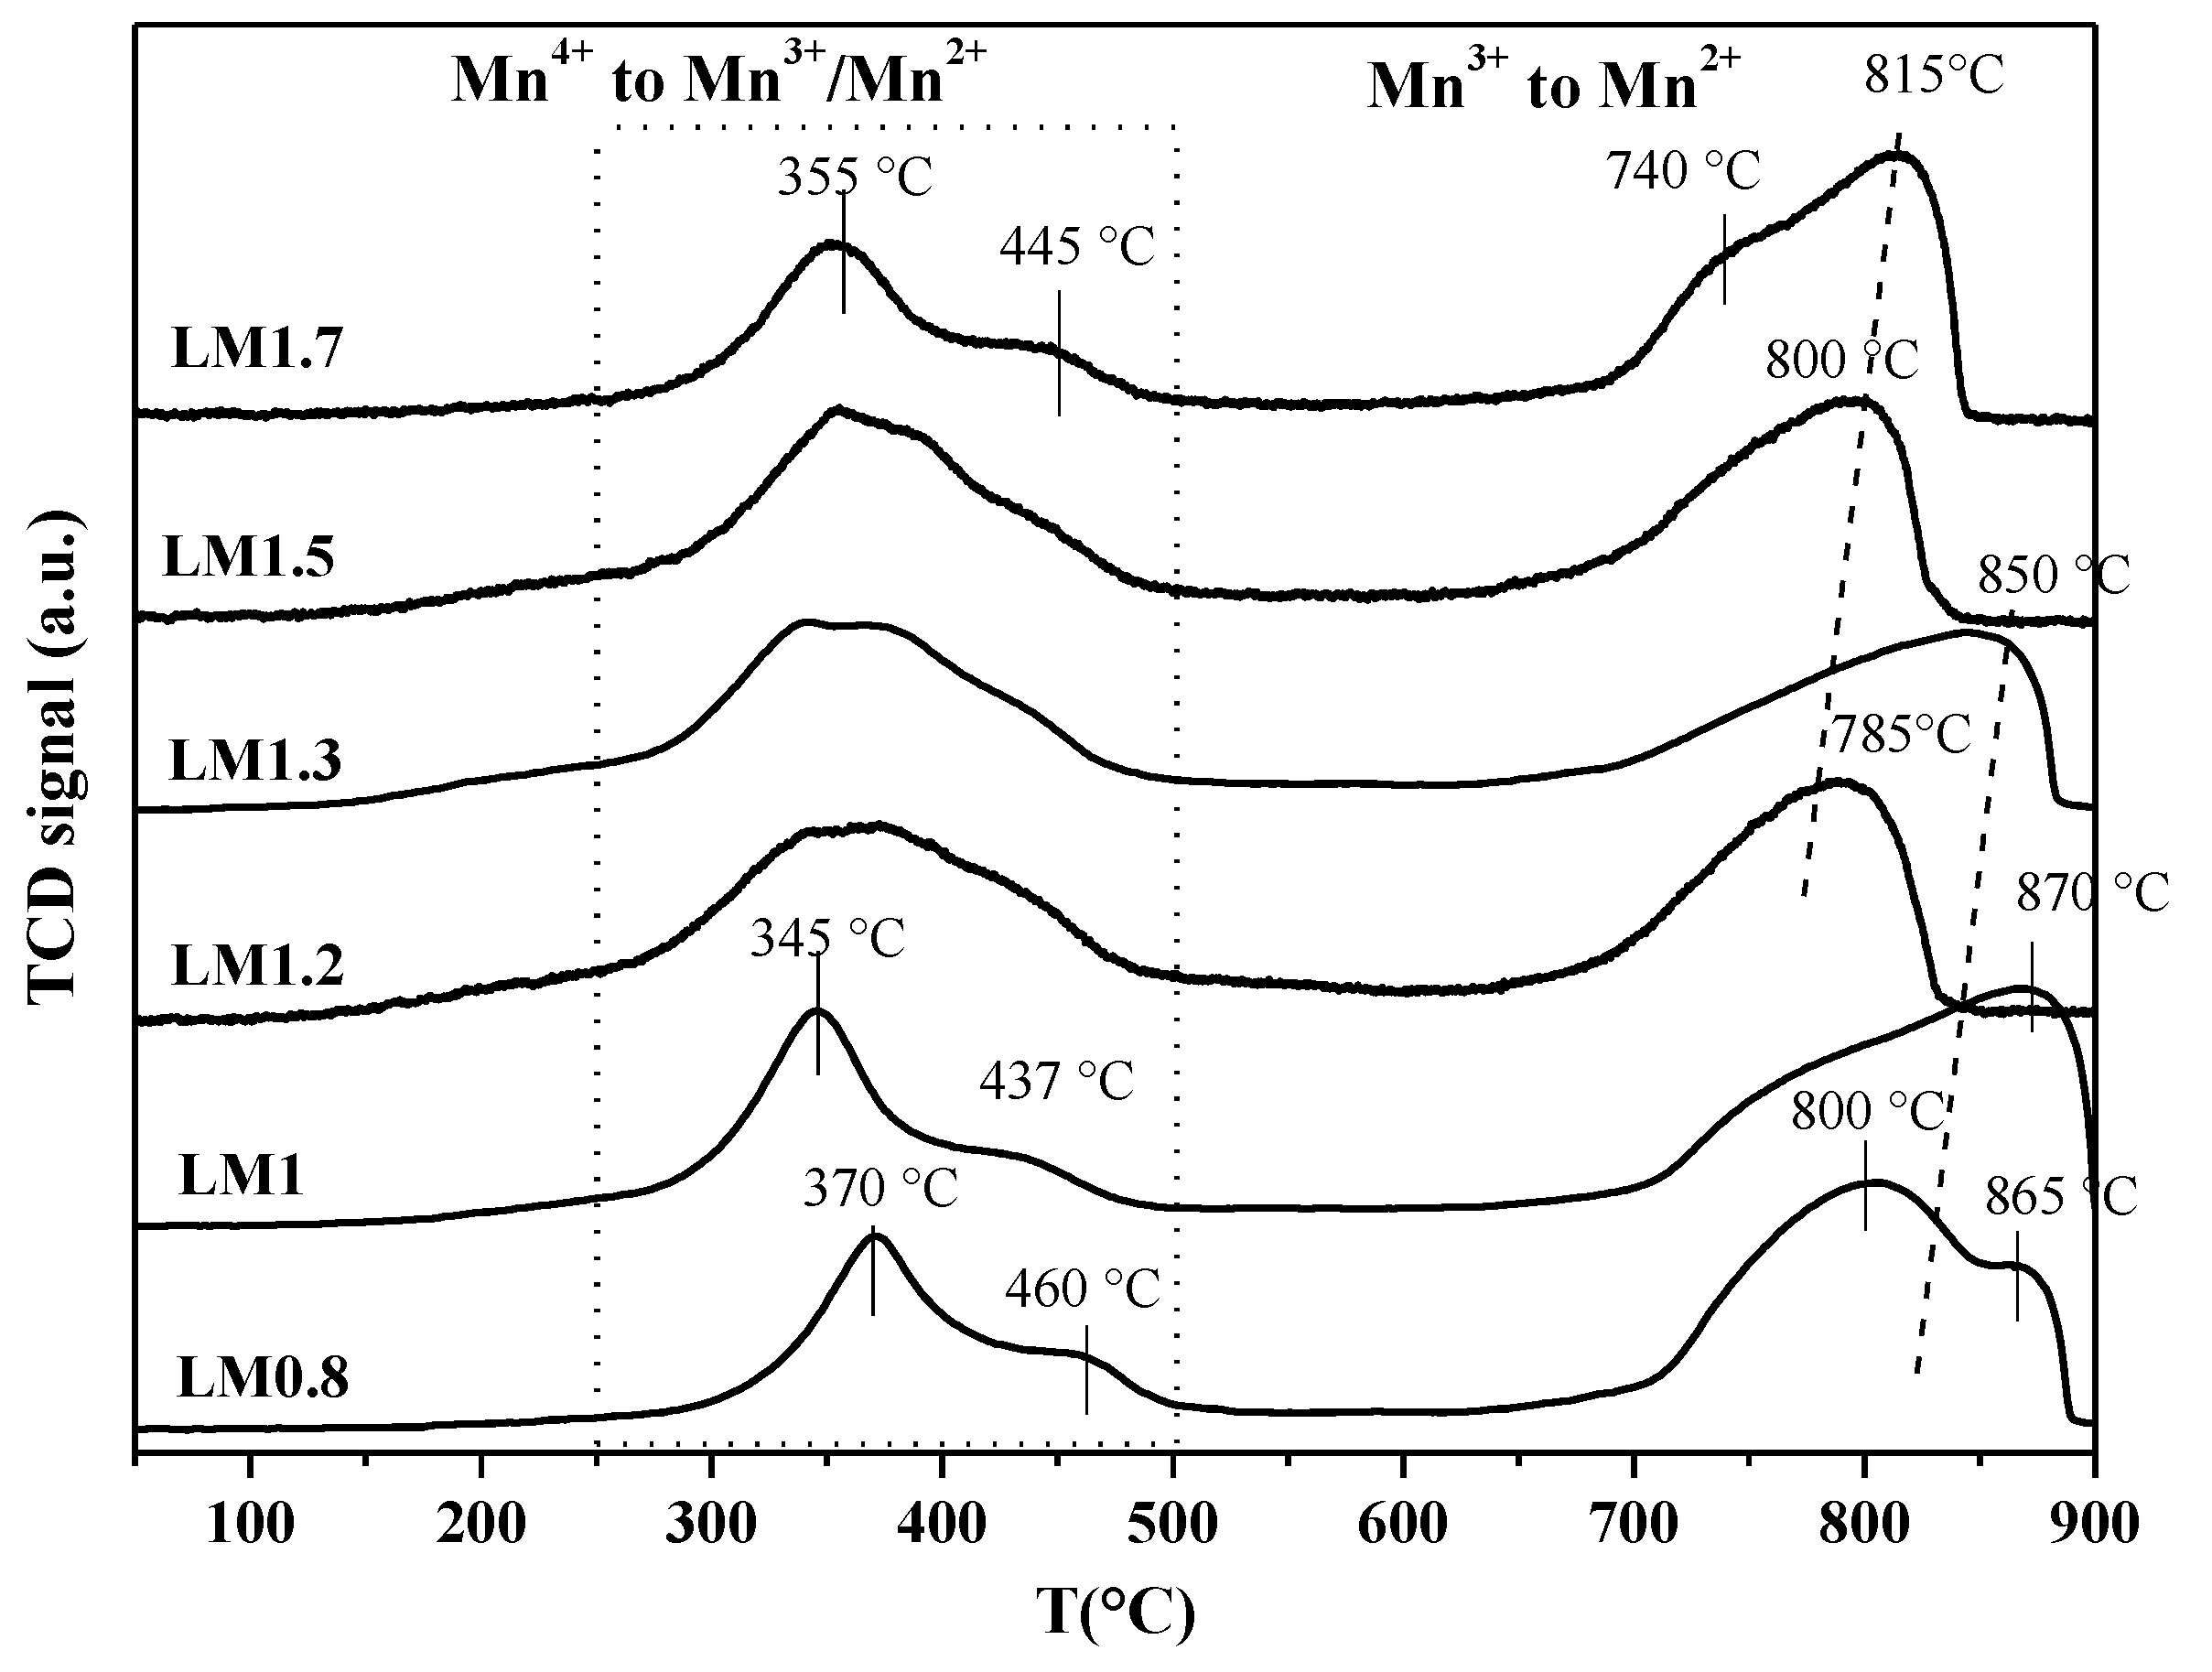
| Samples | H2-Uptake (mmol × g−1) | |||
|---|---|---|---|---|
| 250–500 °C | 650–900 °C | Total Uptake | Reducibility % Mnn+ to Mn(n−1)+ (Calculated Between 250 and 500 °C) 1 | |
| LM0.8 | 1.073 | 1.923 | 2.996 | 51.9 |
| LM1 | 1.156 | 1.883 | 3.039 | 55.9 |
| LM1.2 | 1.296 | 0.926 | 2.222 | 62.7 |
| LM1.3 | 1.297 | 1.175 | 2.472 | 62.7 |
| LM1.5 | 1.292 | 0.922 | 2.216 | 62.5 |
| LM1.7 | 1.066 | 1.367 | 2.433 | 51.6 |
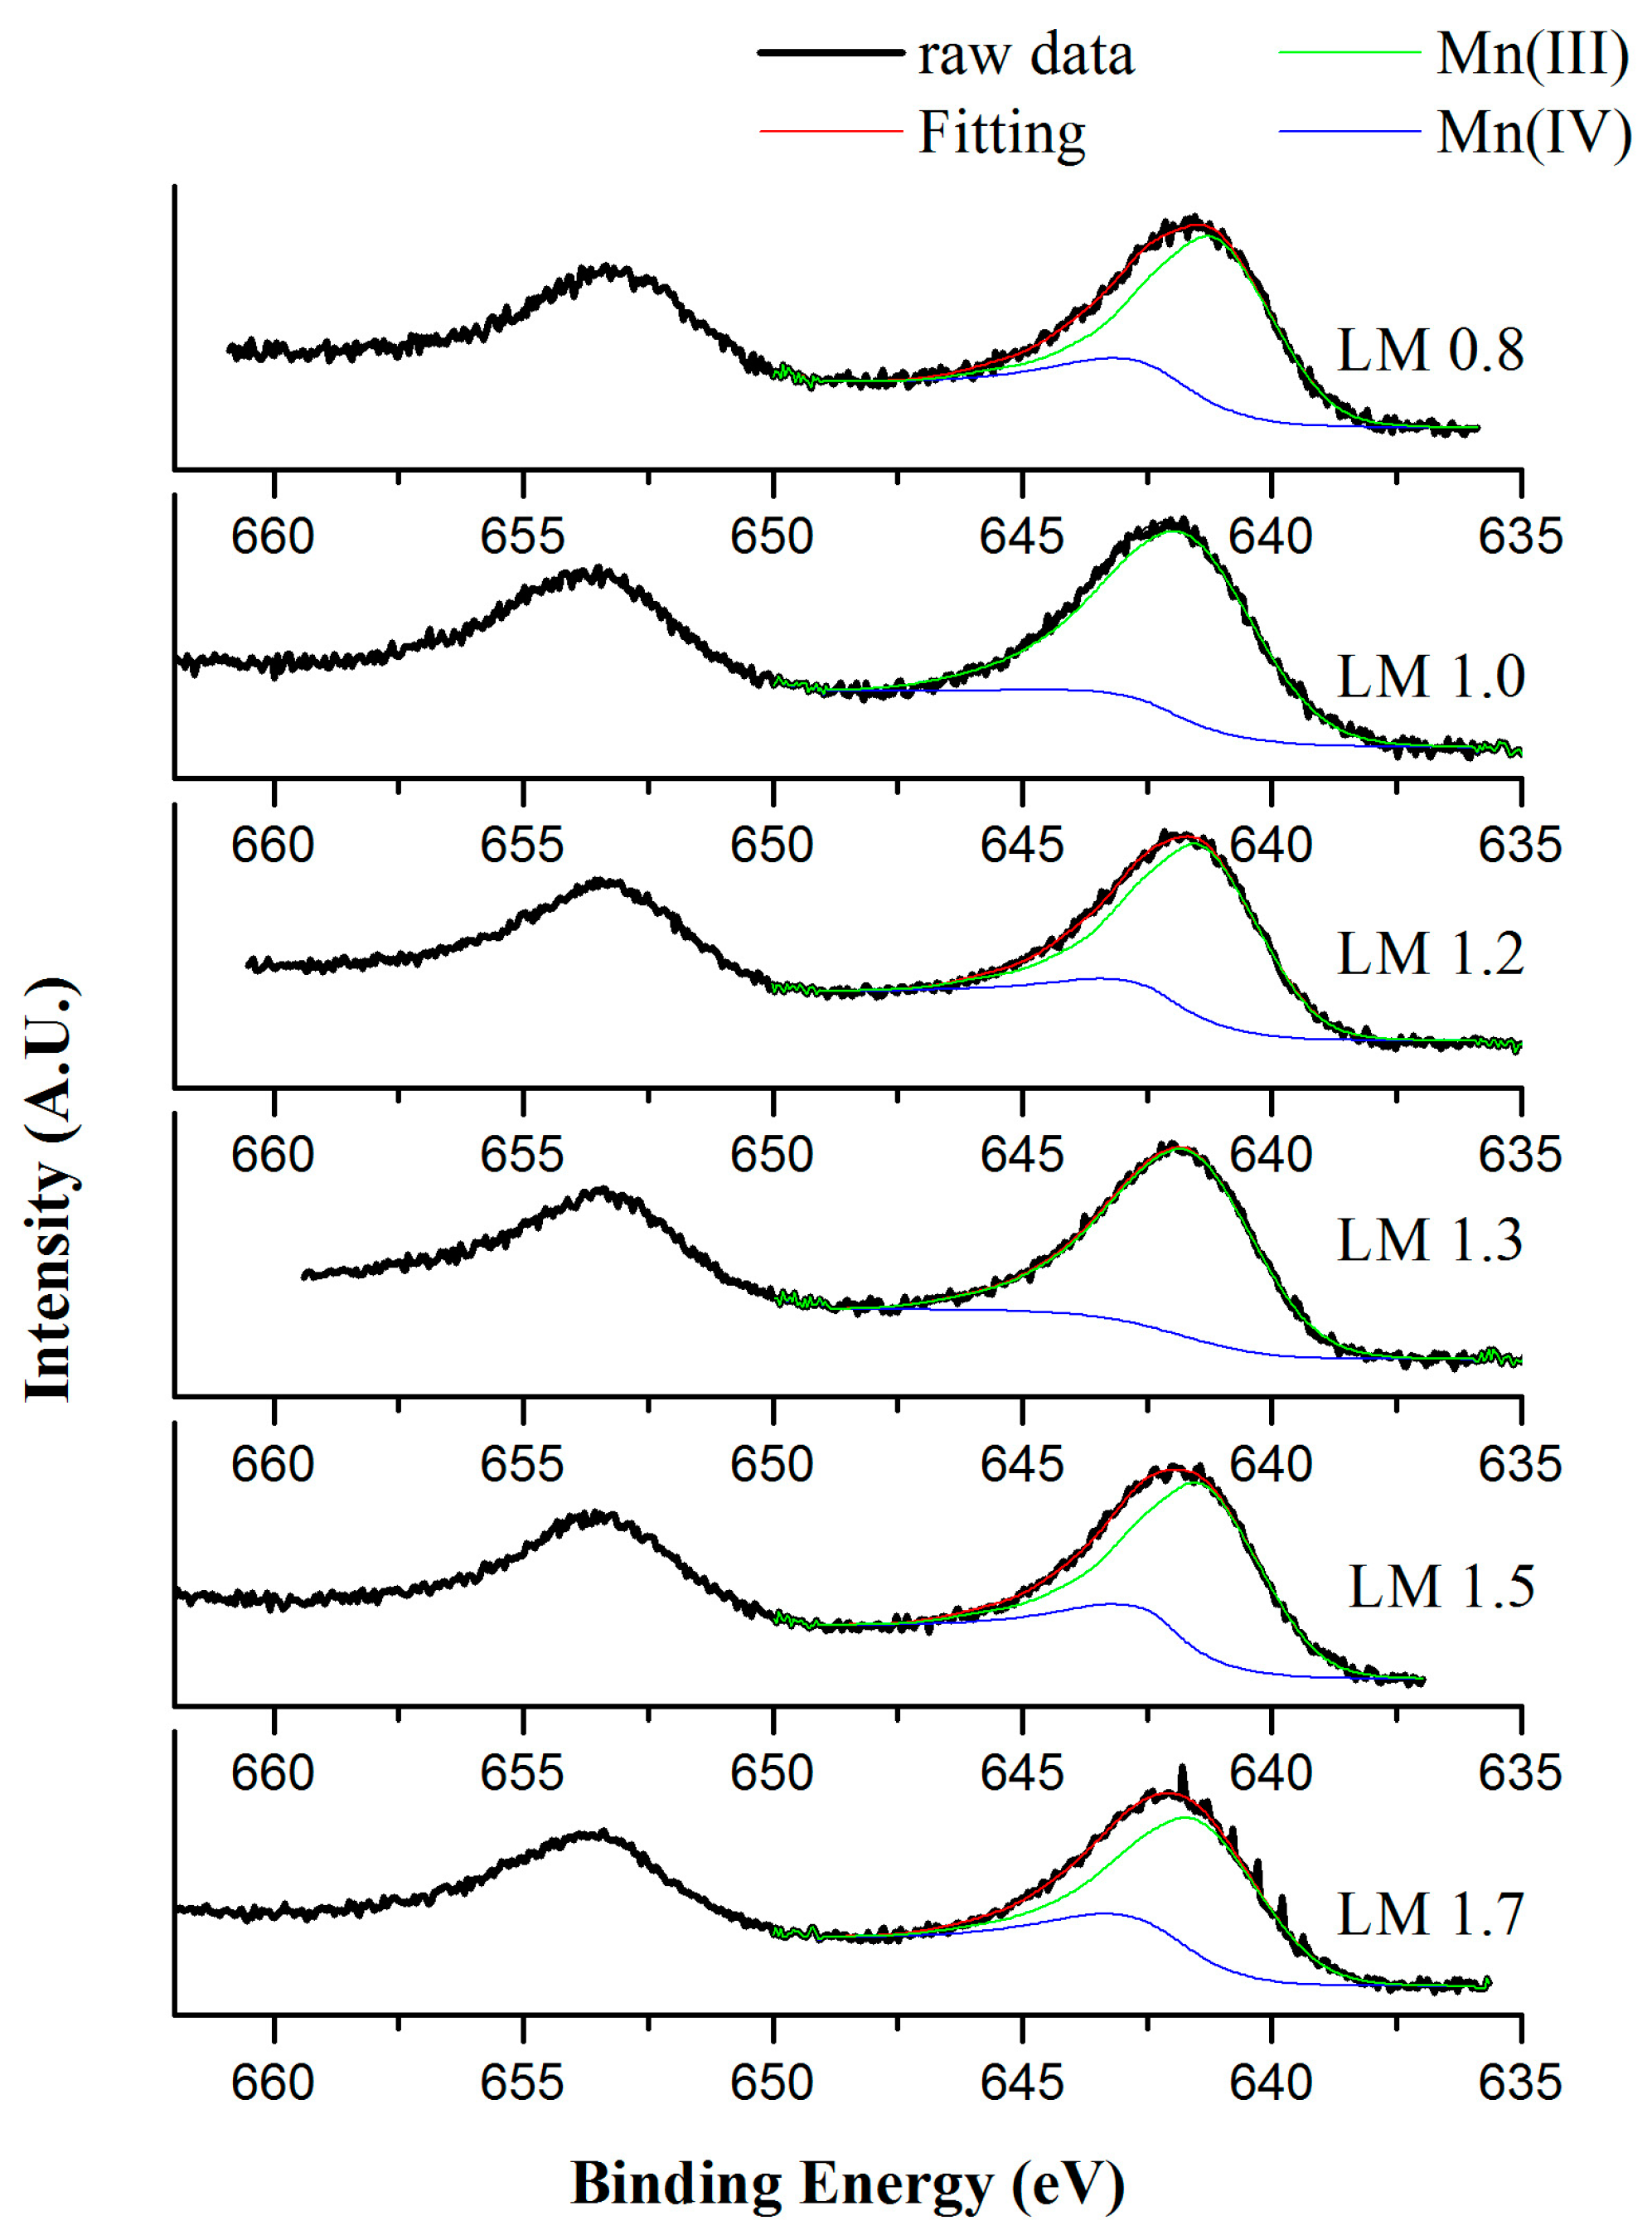
| Samples | O1s (eV) | Mn/La |
|---|---|---|
| LM0.8 | 529.3 (59%) 531.6 (41%) | 0.95 |
| LM1.0 | 529.6 (70%) 531.9 (30%) | 1.00 |
| LM1.2 | 529.3 (52%) 531.6 (48%) | 1.04 |
| LM1.3 | 529.4 (47%) 531.7 (53%) | 1.07 |
| LM1.5 | 529.5 (66%) 531.7 (34%) | 1.27 |
| LM1.7 | 529.3 (60%) 531.6 (40%) | 0.98 |
| Catalysts | 1st Run | 2nd Run | 3rd Run | ||||||
|---|---|---|---|---|---|---|---|---|---|
| T10 (°C) | T50 (°C) | T90 (°C) | T10 (°C) | T50 (°C) | T90 (°C) | T10 (°C) | T50 (°C) | T90 (°C) | |
| Pd/Al2O3 | 212 | 249 | 276 | 214 | 252 | 279 | 215 | 253 | 281 |
| LM0.8 | 294 | 325 | 345 | 294 | 324 | 346 | 296 | 325 | 351 |
| LM1 | 245 | 272 | 305 | 251 | 277 | 313 | 255 | 281 | 317 |
| LM1.2 | 233 | 255 | 272 | 237 | 260 | 279 | 243 | 266 | 284 |
| LM1.3 | 238 | 258 | 275 | 243 | 263 | 281 | 247 | 267 | 284 |
| LM1.5 | 233 | 257 | 279 | 237 | 259 | 283 | 239 | 263 | 288 |
| LM1.7 | 251 | 275 | 294 | 255 | 279 | 301 | 260 | 283 | 305 |
| Catalysts | Reaction Rate (mol × g−1 × s−1) a | Reaction Rate (mol × m−2 × s−1) b |
|---|---|---|
| LM0.8 | 7.00 × 10⁻⁵ | 7.00 × 10⁻⁶ |
| LM1 | 3.90 × 10⁻⁴ | 3.25 × 10⁻⁵ |
| LM1.2 | 1.70 × 10⁻³ | 6.54 × 10⁻⁵ |
| LM1.3 | 7.00 × 10⁻⁴ | 2.80 × 10⁻⁵ |
| LM1.5 | 9.90 × 10⁻⁴ | 4.71 × 10⁻⁵ |
| LM1.7 | 3.10 × 10⁻⁴ | 2.58 × 10⁻⁵ |
| Catalysts | 2nd Run | ||
|---|---|---|---|
| T10 (°C) | T50 (°C) | T90 (°C) | |
| LM0.8 | 218 | 293 | 367 |
| LM1 | 184 | 249 | 333 |
| LM1.2 | 163 | 231 | 299 |
| LM1.3 | 174 | 236 | 309 |
| LM1.5 | 160 | 229 | 298 |
| LM1.7 | 192 | 253 | 324 |
| Pd-Al2O3 | 141 | 201 | 250 |
© 2019 by the authors. Licensee MDPI, Basel, Switzerland. This article is an open access article distributed under the terms and conditions of the Creative Commons Attribution (CC BY) license (http://creativecommons.org/licenses/by/4.0/).
Share and Cite
Sihaib, Z.; Puleo, F.; Pantaleo, G.; La Parola, V.; Valverde, J.L.; Gil, S.; Liotta, L.F.; Giroir-Fendler, A. The Effect of Citric Acid Concentration on the Properties of LaMnO3 as a Catalyst for Hydrocarbon Oxidation. Catalysts 2019, 9, 226. https://doi.org/10.3390/catal9030226
Sihaib Z, Puleo F, Pantaleo G, La Parola V, Valverde JL, Gil S, Liotta LF, Giroir-Fendler A. The Effect of Citric Acid Concentration on the Properties of LaMnO3 as a Catalyst for Hydrocarbon Oxidation. Catalysts. 2019; 9(3):226. https://doi.org/10.3390/catal9030226
Chicago/Turabian StyleSihaib, Zakaria, Fabrizio Puleo, Giuseppe Pantaleo, Valeria La Parola, José Luis Valverde, Sonia Gil, Leonarda Francesca Liotta, and Anne Giroir-Fendler. 2019. "The Effect of Citric Acid Concentration on the Properties of LaMnO3 as a Catalyst for Hydrocarbon Oxidation" Catalysts 9, no. 3: 226. https://doi.org/10.3390/catal9030226
APA StyleSihaib, Z., Puleo, F., Pantaleo, G., La Parola, V., Valverde, J. L., Gil, S., Liotta, L. F., & Giroir-Fendler, A. (2019). The Effect of Citric Acid Concentration on the Properties of LaMnO3 as a Catalyst for Hydrocarbon Oxidation. Catalysts, 9(3), 226. https://doi.org/10.3390/catal9030226