Article

The Performance of Nickel and Nickel-Iron Catalysts Evaluated As Anodes in Anion Exchange Membrane Water Electrolysis

by
Emily Cossar
1,
Alejandro Oyarce Barnett
2,3,*,
Frode Seland
4 and
Elena A. Baranova
1,*
1
Department of Chemical and Biological Engineering, Centre for Catalysis Research and Innovation (CCRI), University of Ottawa, 161 Louis-Pasteur Ottawa, ON K1N 6N5, Canada
2
SINTEF Industry, Sustainable Energy Technology Department, New Energy Solutions Group, NO-7491 Trondheim, Norway
3
Department of Energy and Process Engineering, Norwegian University of Science and Technology, NO-7491 Trondheim, Norway
4
Department of Materials Science and Engineering, Norwegian University of Science and Technology, NO-7491 Trondheim, Norway
*
Authors to whom correspondence should be addressed.
Catalysts 2019, 9(10), 814; https://doi.org/10.3390/catal9100814
Submission received: 29 August 2019 / Revised: 19 September 2019 / Accepted: 24 September 2019 / Published: 27 September 2019
(This article belongs to the Section Electrocatalysis)

Abstract

:
Anion exchange membrane water electrolysis (AEMWE) is an efficient, cost-effective solution to renewable energy storage. The process includes oxygen and hydrogen evolution reactions (OER and HER); the OER is kinetically unfavourable. Studies have shown that nickel (Ni)- iron (Fe) catalysts enhance activity towards OER, and cerium oxide (CeO2) supports have shown positive effects on catalytic performance. This study covers the preliminary evaluation of Ni, Ni90Fe10 (at%) and Ni90Fe10/CeO2 (50 wt%) nanoparticles (NPs), synthesized by chemical reduction, as OER catalysts in AEMWE using commercial membranes. Transmission electron microscopy (TEM) images of the Ni-based NPs indicate NPs roughly 4–6 nm in size. Three-electrode cell measurements indicate that Ni90Fe10 is the most active non-noble metal catalyst in 1 and 0.1 M KOH. AEMWE measurements of the anodes show cells achieving overall cell voltages between 1.85 and 1.90 V at 2 A cm−2 in 1 M KOH at 50 °C, which is comparable to the selected iridium-black reference catalyst. In 0.1 M KOH, the AEMWE cell containing Ni90Fe10 attained the lowest voltage of 1.99 V at 2 A cm−2. Electrochemical impedance spectroscopy (EIS) of the AEMWE cells using Ni90Fe10/CeO2 showed a higher ohmic resistance than all catalysts, indicating the need for support optimization.

Graphical Abstract

1. Introduction

As global warming and climate change concerns continue to rise, the concept of a “hydrogen economy” is becoming more and more important. This ideal is based on using hydrogen (H2) as a clean, renewable fuel [1]. H2 can also be used to store renewable energy through water electrolysis [2]. Water electrolysis utilizing anion exchange membranes (AEMs) is an emerging water electrolysis technology, used for its ability to produce hydrogen both efficiently and at low cost. Compared to traditional alkaline water electrolysis, which employ porous diaphragm separators, solid polymer electrolytes may provide certain advantages, such as lower gas crossover, improved efficiency, higher current densities, differential pressure operation and improved operation dynamics [3]. Unlike other solid polymer electrolyser technologies, such as proton exchange membrane water electrolysis (PEMWE), anion exchange membrane water electrolysis (AEMWE) technology has the potential to operate without expensive noble-metal catalysts, such as iridium, ruthenium and platinum, in addition to low-cost materials for bipolar plates and current collectors. AEMWE, therefore, aims to combine the low costs of alkaline electrolysis with the high efficiency and flexibility of the proton exchange membrane (PEM) electrolysis design [3].
The theoretical thermodynamic potential for water electrolysis is 1.23 V at room temperature. To achieve a low activation overvoltage during electrolysis’s operation, high performing oxygen and hydrogen evolving catalysts are required. As the goal of water electrolysis is its industrialization, catalyst cost is imperative. As such, the development of active non-noble metal catalysts is crucial to further develop and establish AEMWE technology. The number of studies addressing performance improvements through the development of new AEM materials, catalysts and membrane electrode assemblies (MEAs) have increased in recent years [4,5,6,7,8,9,10,11,12,13]. However, the water splitting performance reported for AEMWE is still lower than that of PEMWE [14,15], particularly when employing non-noble metal catalysts and lower concentrations of alkaline solutions, or water [16].
The water electrolysis process occurs through two simultaneously occurring half-cell reactions: the oxygen evolution reaction (OER) on the anode and the hydrogen evolution reaction (HER) on the cathode. OER kinetics are more sluggish than HER kinetics [17]; therefore, the performance of water electrolysers heavily depends on the OER. Generally, the OER activity of non-noble electrocatalysts is high in alkaline environments [14]. Non-noble metal oxides are, therefore, of interest as catalysts for AEMWE. More specifically, catalysts based on Ni or Co (hydroxides, oxides, spinels and perovskites) and pyrochlores show good activity towards the OER in alkaline media. Ni-based electrocatalysts have been particularly well investigated, and include different ratios of Ni–iron (Fe), Ni–chromium (Cr) and Ni–molybdenum (Mo) oxide catalysts [6,18,19,20,21,22,23], amongst other bimetallics and alloys. Li et al. [18] studied various electrodeposited, Ni-bimetallic catalysts for OER. Among all tested metals, the NiFe catalyst showed the highest promotional effect, achieving the lowest overpotential of 256 mV at 0.5 A cm−2 with 10% iron incorporation. Similarly, Trotochaud et al. [20] tested multiple metal and mixed-metal oxide catalysts prepared by spin coating for OER. Their study showed that the Ni90Fe10Ox catalyst obtained the lowest overpotential of 297 mV at 1 mA cm−2.
The most widely accepted description of the Ni oxidation steps in alkaline media is through the Bode diagram, a simplified version of which is shown in Figure 1 below [24].
In an alkaline environment, nickel is first oxidized to the unstable α-Ni(OH)2 (about −0.5 V versus Hg/HgO). Prolonged exposure to an alkaline environment or slight anodic polarization brings it to the stable β-Ni(OH)2 phase. Further polarization induces the oxidative deprotonation of β-Ni(OH)2 to β-NiOOH (~0.45 V versus Hg/HgO or ~1.38 V versus RHE at pH 14), the active phase for OER [17]. Finally, further increasing the electrode potential will overcharge the nickel catalyst and bring it to the γ-NiOOH phase, which is believed to be the highest-achievable Ni oxidation phase. It is most commonly assumed that the β-NiOOH oxidation phase is most active towards the OER [17]. This oxidative deprotonation process to generate the catalytic species for the OER is not particular for nickel; it has been reported that cobalt, iron and manganese-based catalysts also deprotonate prior to oxygen evolution, in processes that are strongly pH-dependent [25,26,27,28,29].
Ceria (CeO2) is an ionically conducting support that has been widely studied and applied in various electrochemical applications due to the advantageous metal support interactions (MSIs) that it may provide [30,31,32]. The MSIs occur through the unique properties of CeO2, such as oxygen storage and release properties, and good ionic conductivity [33,34,35]. Using CeO2 as a catalyst support can modify a catalyst’s dispersion, minimize a catalyst’s agglomeration and increase a catalyst’s surface area. There are very few reports dealing with CeO2 supports for non-noble metal catalysts for OER. Chen et al. [34] reported that the incorporation of CeO2 into a copper oxide catalyst increased OER activity through strong electronic interactions between Ce4+ and Cu ions. They reported an optimal cerium content of 6.9%; further increasing the Ce content resulted in a less optimal Ce4+ distribution, and subsequently lower OER activity. Feng et al. [33] studied the incorporation of CeO2 into FeOOH heterolayered nanotubes and concluded that the enhancement of OER’s performance obtained through the incorporation of ceria into their catalyst was likely the result of the increased FeOOH/CeO2 interfaces as well as the high oxygen storage capacity of the material. Haber et al. [36] developed a Ni0.3Fe0.07Co0.2Ce0.43Ox catalyst exhibiting good activity and stability towards OER. Said catalyst was further studied by Favaro et al. [35], who concluded that the incorporation of ceria into the catalyst does provide unique promotional catalytic properties towards OER. Finally, McCrory et al. [37], showed that their NiCeOx material had the highest overpotential for OER compared to IrOx and NiOx, NiFeOx, amongst other bimetallic electrocatalysts in 1 M NaOH. Preliminary cyclic voltammograms of the effect of ceria incorporation into the Ni catalyst are shown in Figure S1 of the Supplementary Information.
With respect to AEMWE studies, Seetharaman et al. [38] studied graphene oxide (GO) modified NiO electrode as an OER catalyst with enhanced electron conductivity and catalytic activity. A NiZnS ternary alloy was used at the cathode. The initial AEMWE performance of the electrodeposited catalysts on Ni foams was evaluated in the study. A Selemion™ AMV membrane (Asahi Glass Co. Ltd.) was used to prepare the membrane electrode assemblies (MEAs) and was sandwiched between the coated, foam electrodes. The AEMWE cell tests were performed using deionized water and concentrations of an alkaline solution (potassium hydroxide (KOH)) ranging from 0 to 5.36 M. They also tested various operating temperatures ranging from 30 to 80 °C. Increasing the concentration of the alkaline solution improved the initial cell performance, with current densities of approximately 65 and 140 mA cm−2 observed for pure water and 5.36 M KOH, respectively, at 1.8 V and 30 °C. When using the 5.36 M electrolyte and holding the system at 1.8 V, the current density increased from 100 to 380 mA cm−2 when increasing the operating temperature from 30 to 80 °C.
Xiao et al. [39] used electrocatalysts, such as Ni–Fe and Ni–Mo complexes, for the OER and HER in their MEAs. The Ni–Fe electrode was made using a solid-state electrochemical reduction procedure. Specifically, a solution containing Ni and Fe nitrates was sprayed onto a preheated Ni foam substrate and later electrochemically reduced by applying a cathodic current. The resulting loading of the catalysts was 40 mg cm−2 for both electrodes, and the membrane and ionomer used were xQAPS. The performance achieved was 400 mg cm−2 at 1.85 V in ultra-pure water. Ayers et al. [40] characterized AEMWE using non-noble metal complexes as catalysts for OER. They reported results for the ternary catalysts 30% Ni–Fe–Co/C and 30% Ni–Fe–Mo/C compared to 30% Ni–Fe/C and IrO2. Although they reported very low current densities, between 5 and 40 mA cm−2 at 1.8 V, the ternary catalysts showed higher performance compared to IrO2 and 30% Ni–Fe/C.
Recently, Pavel et al. [41] developed and evaluated AEMWE using low cost transition metal catalysts. The commercial catalysts Acta 4030 (Ni/CeO2-La2O3/C) and Acta 3030 (CuCoOx) (Acta SpA, Italy) were used as HER and OER catalysts, respectively. The loadings of the HER and OER catalysts were 7.4 and 36 mg cm−2, respectively. These catalysts were designed to withstand relatively mild alkaline conditions (pH 10–11). The authors explained the effect of HER loading on the kinetic contribution and performance of the AEM electrolysis. Results showed current densities between 60 and 300 mA cm−2 at 1.8 V, as the HER catalyst’s loading ranged from 0.6 to 7.4 mg cm−2, while the OER catalyst’s loading was kept constant at 36 mg cm−2.
The aim of the presented work was to synthesize, characterize and electrochemically evaluate nanosized nickel-based electrocatalysts for the OER. Ni, Ni90Fe10 and Ni90Fe10/CeO2 catalysts were synthesized by a scalable method, characterized by scanning and transmission electron microscopy (SEM and TEM), X-ray diffraction (XRD) and electrochemically evaluation using a conventional three-electrode electrochemical cell. The Ni-based electrocatalysts were also evaluated as anodes in real AEMWEs and compared to commercially available noble metal-based anode electrodes. This paper includes a study on the influence of the alkaline electrolyte concentration on the catalytic activity of the OER; ex-situ, three-electrode OER measurements and in situ AEMWE performances are compared at 1 M and 0.1 M KOH concentrations.

2. Results and Discussion

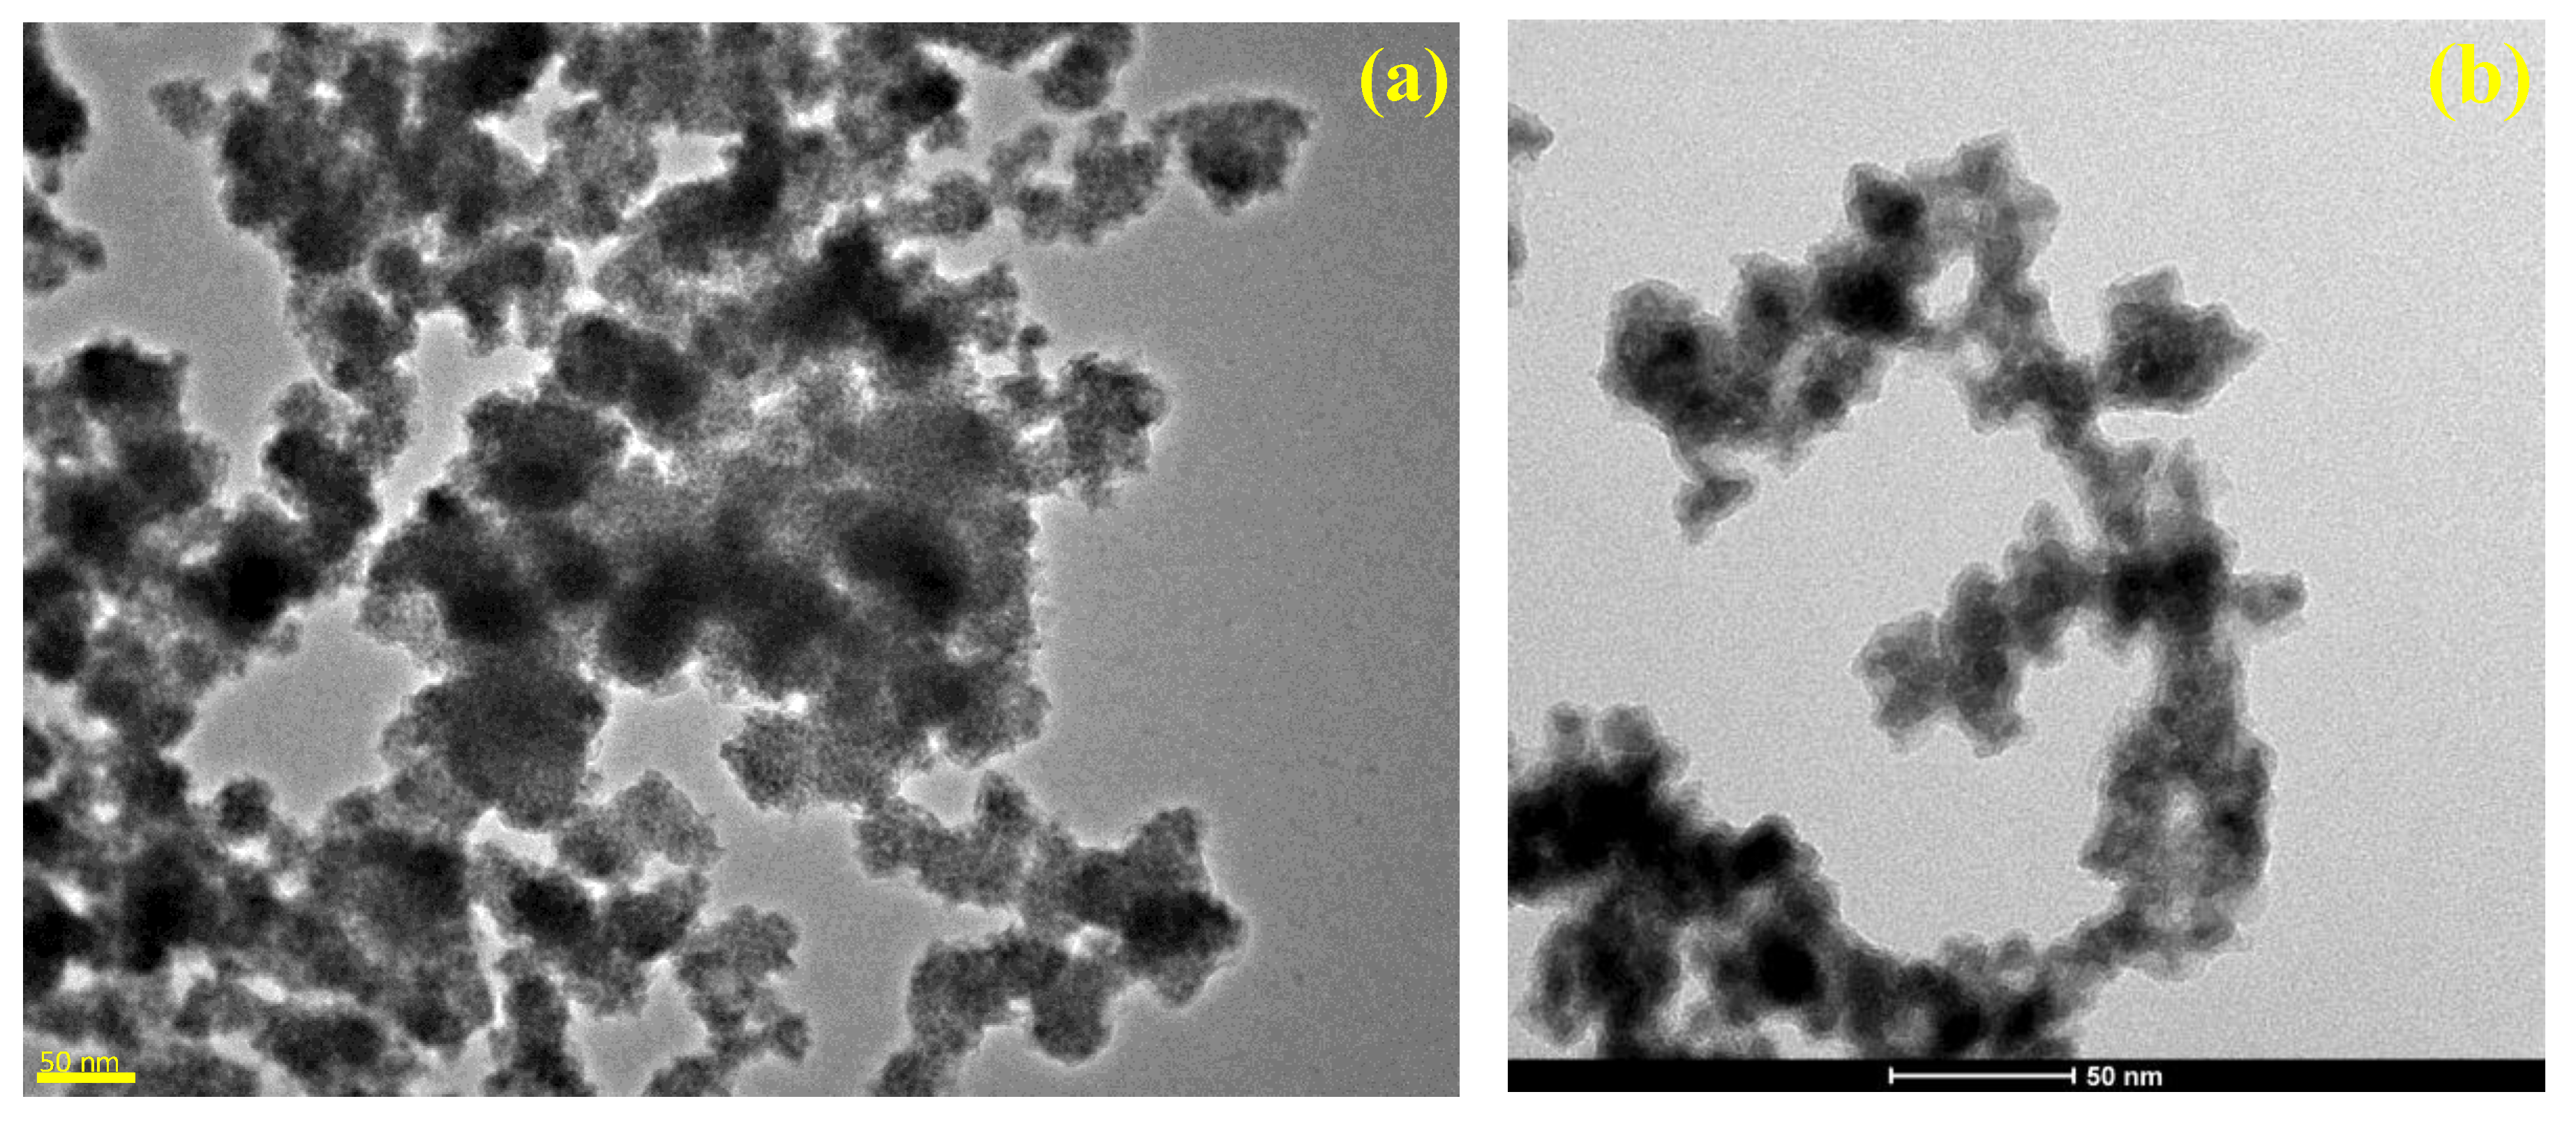
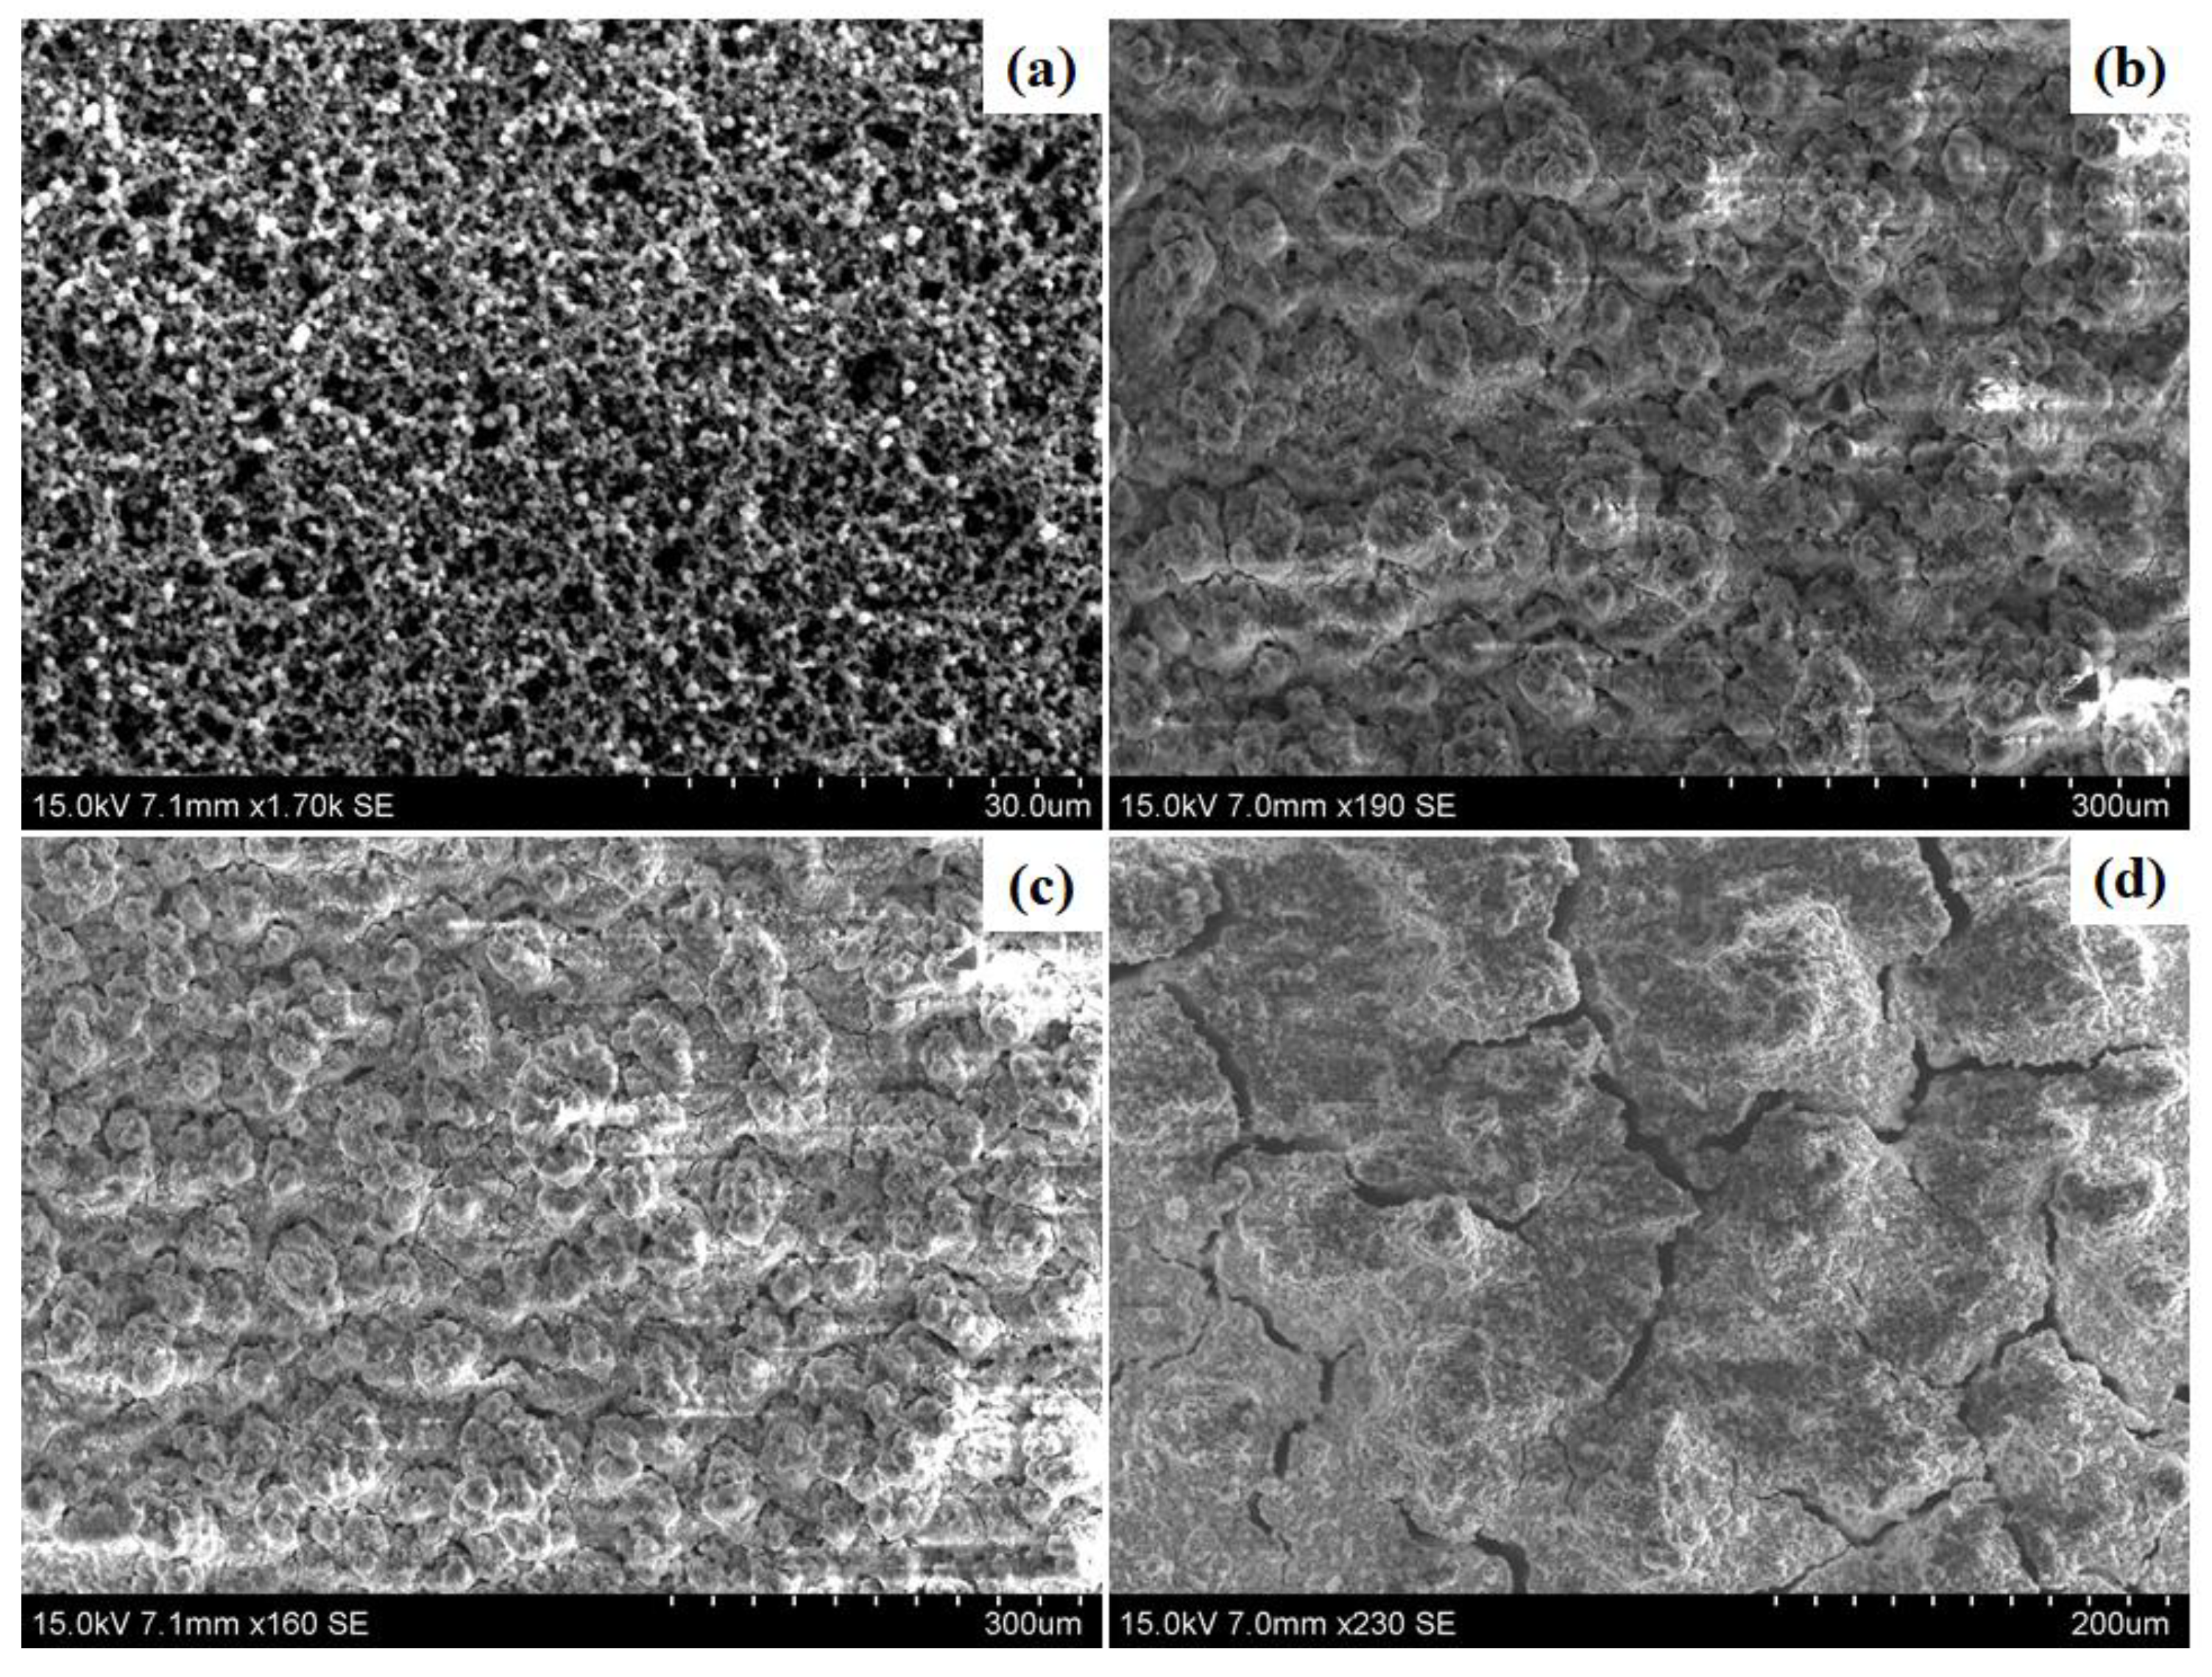
2.1. Scanning and Transmission Electron Microscopy

Figure 2a,b shows TEM images of the as-synthesized Ni and Ni90Fe10 nanoparticles (NPs), respectively. Using the scale on the image, it was possible to approximate a particle size of around 4–6 nm, agglomerated into larger clusters of NPs.
Figure 3a–d represents SEM images of the anodes used in the AEMWE prior to experiments. Low magnitude images are displayed to show how the bulk electrode surfaces differ from each other. Comparisons with the Ni, Ni90Fe10 and Ni90Fe10/CeO2 electrodes are shown in Figure 3b–d, respectively. The Ir black benchmark shown in Figure 3a, shows a more porous electrode with a clearer presence of particles making up the electrode surface. Although the same ink preparation and electrode spraying procedure was used for all electrodes, the Ni-based electrode fabrication procedure may need further optimization. The Ni anode shows an almost flaky electrode surface, which was very similar to results obtained for the Ni90Fe10 electrode surface. The Ni90Fe10/CeO2 electrode shows relatively flat surface with large cracks in it, which is likely the result of having to spray twice as much ink onto the membrane to get the same Ni loading, as 50 wt% of this catalyst is CeO2 support. Furthermore, increasing the magnification of the Ni-based anodes did not present a more detailed electrode surface, hence why they were kept at a lower magnification than Ir.

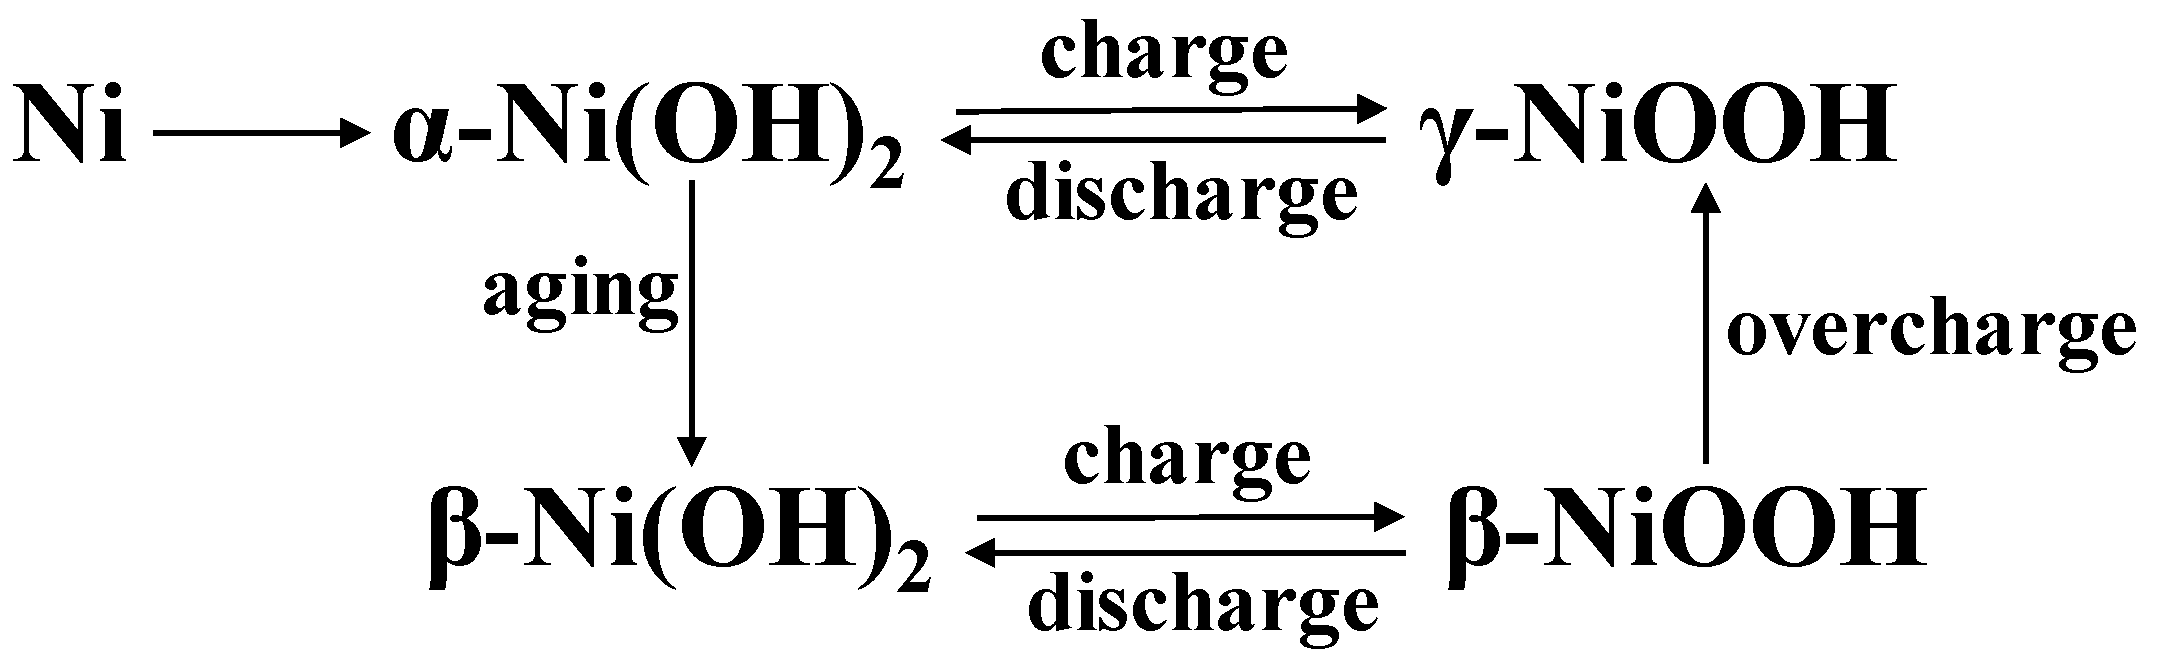
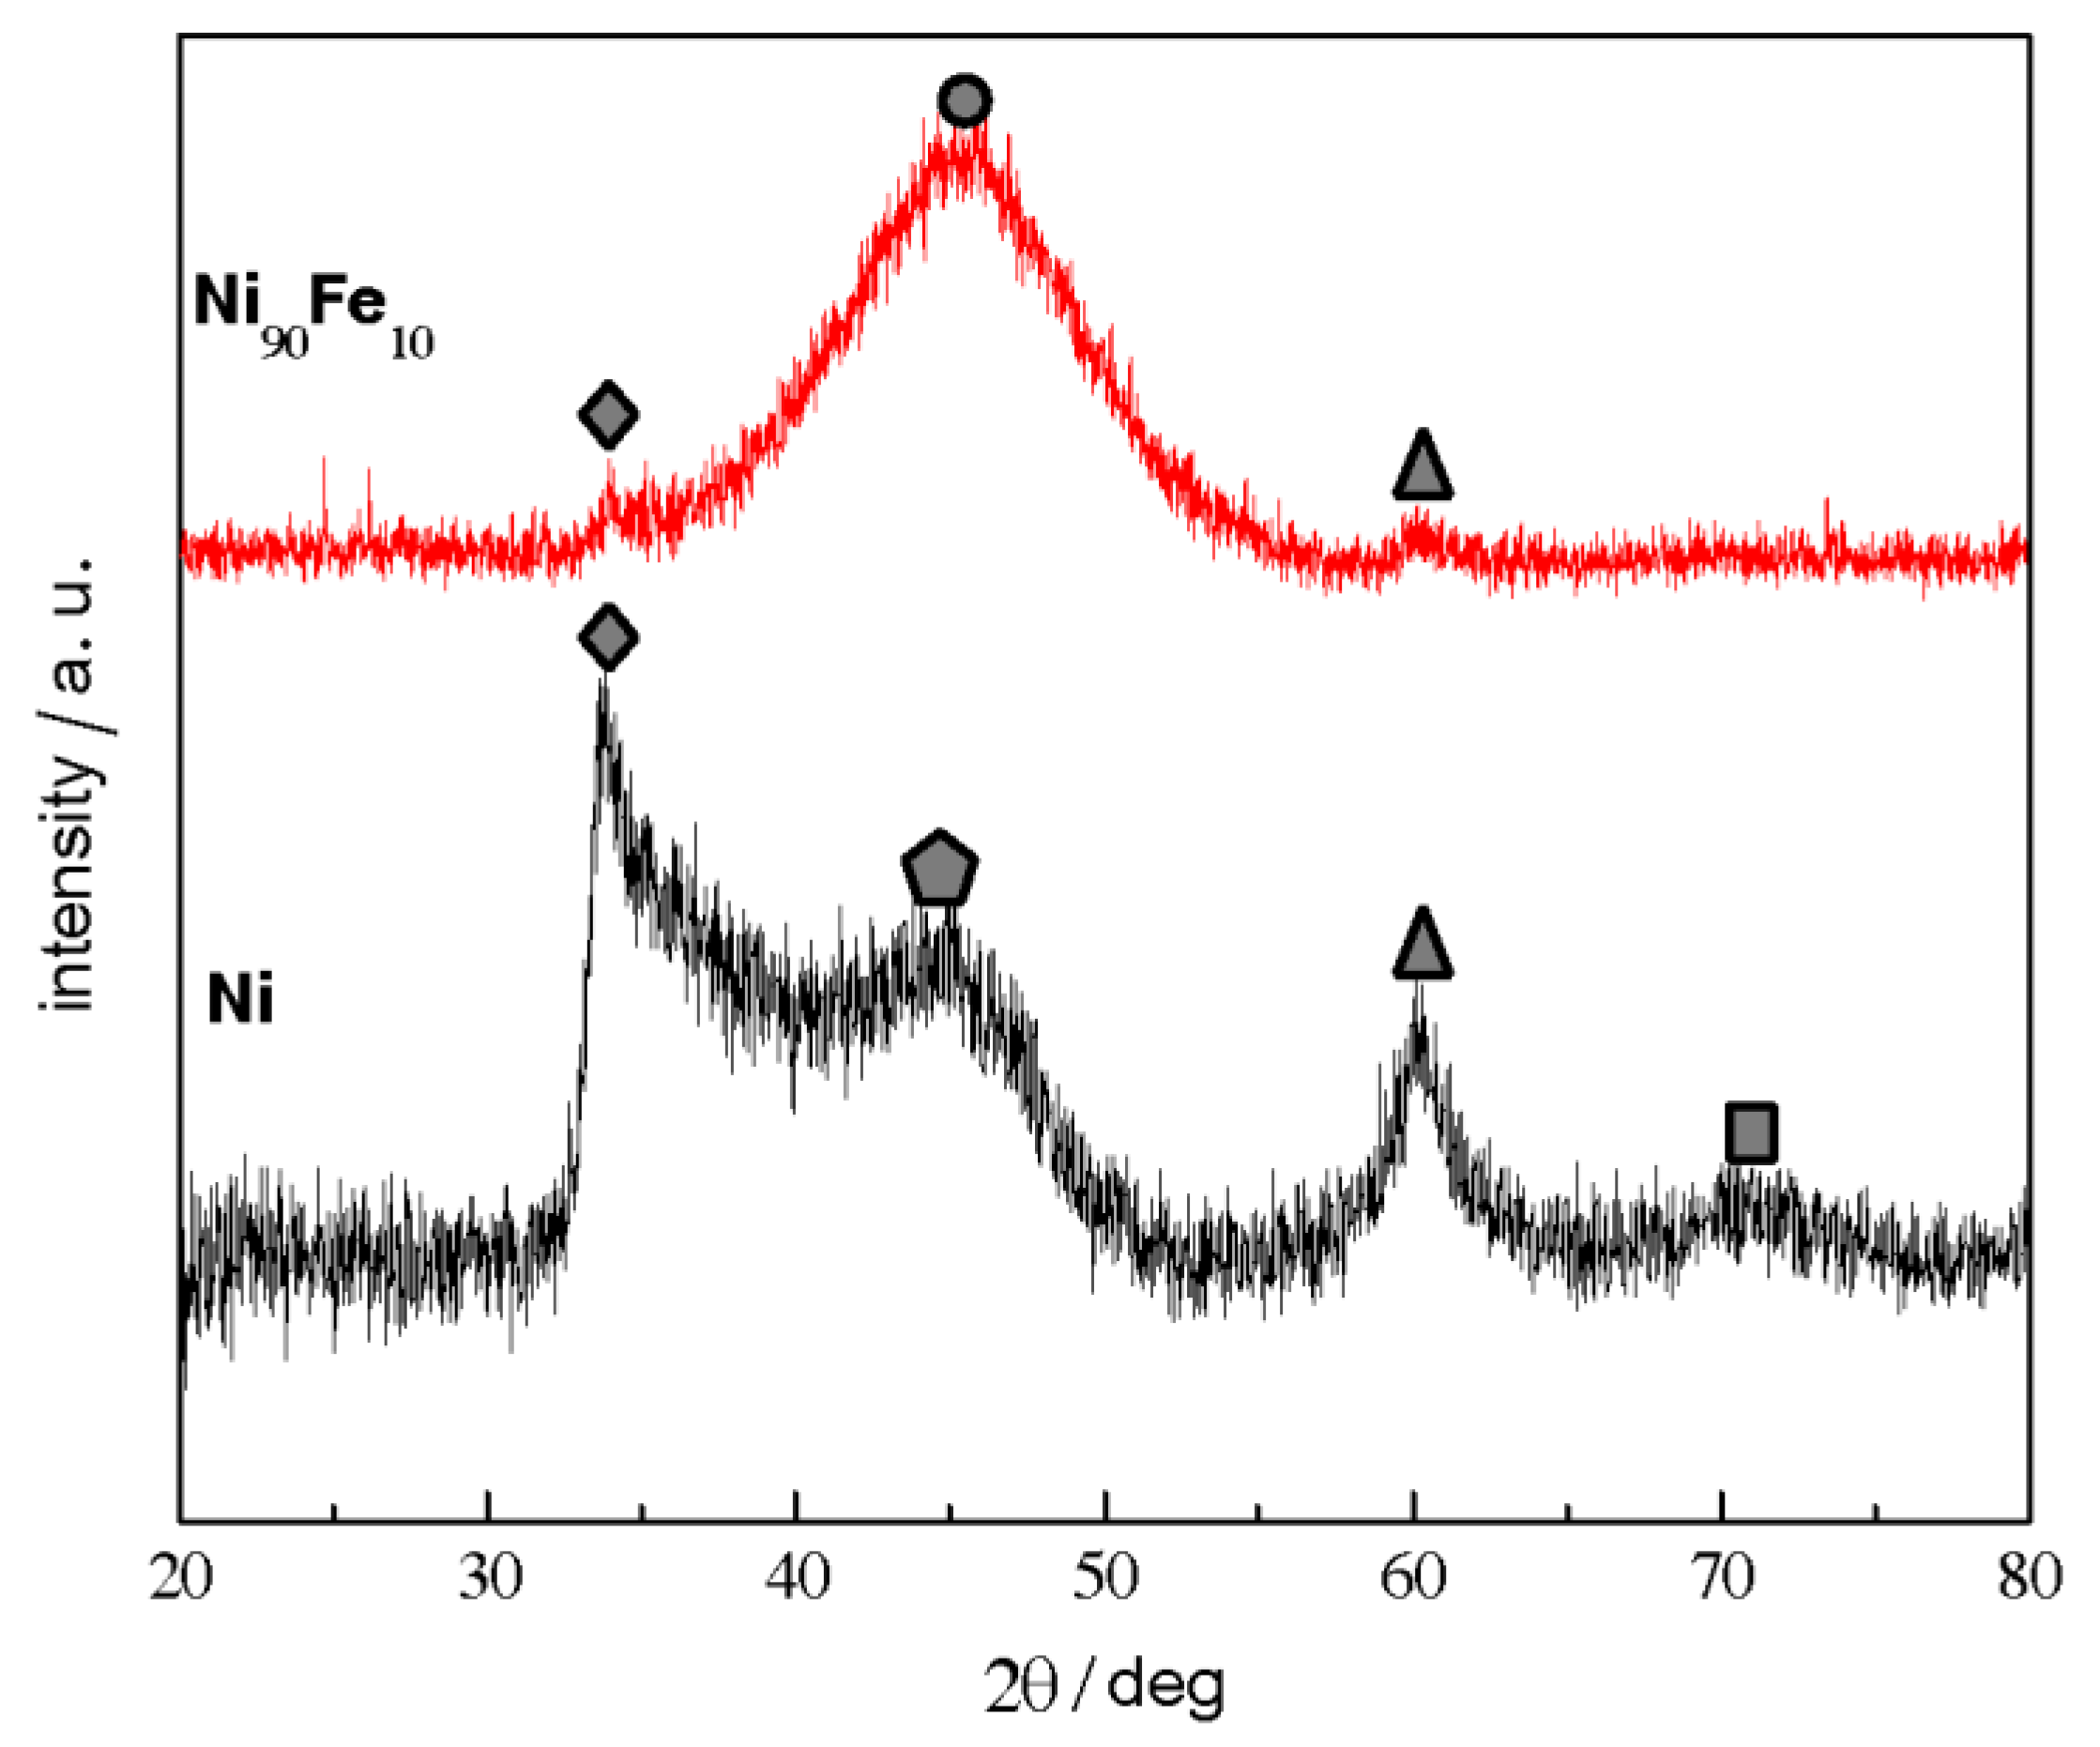
2.2. X-ray Diffraction

The XRD patterns of the Ni and Ni90Fe10 NPs are shown in Figure 4. XRD was not used to characterize the supported Ni catalyst, as ceria is also a face centered cubic (FCC) [32], and therefore, interferes with the main nickel diffraction peaks. As can be seen in Table 1, both samples include a mixture of Ni and β-Ni(OH)2—the stable Ni(OH)2 phase. In the Ni90Fe10 XRD pattern, the peak identified with the circle icon could be Ni (111) or Fe (110) [42,43]. Possible salt contamination can occur due to the synthesis method; however, catalyst samples were washed multiple times with water prior to XRD measurements to remove all NaCl. The possible presence of NaCl was ruled out due to the absence of particular sharp peaks in the XRD spectra [44]. Having both Ni and Fe in the same peak position, and the slight shift between the Ni(III) peaks shown in the Ni XRD, indicated the potential formation of an alloy material. Additionally, the broad peak shown in the Ni90Fe10 pattern reflects the very small particle size observed in the TEM image of the synthesized materials, shown in Figure 2.

2.3. Electron Energy-Loss Spectroscopy

Figure 5 summarized an EELS spectrum taken for the Ni90Fe10/CeO2 material. In Figure 5a, it is possible to see, in orange, the region of the STEM image where the analysis was carried out. The region in yellow was used for drift correction. As shown in Figure 5b, within the orange region, two sections were analyzed; the first section shows a cloudier area, while the second section shows a clearer structured area. As seen in Figure 5c, the first region mostly consisted of the Ni and Fe metals in the sample, while the second region mostly consisted of the CeO2 support. This observation is also seen in the EELS mapping found in Figure S5 of the Supplementary Information of this article. For TEM, STEM and EDX, characterization of the Ni90Fe10/CeO2 catalyst, see Figures S2–S4 in the Supplementary Information.

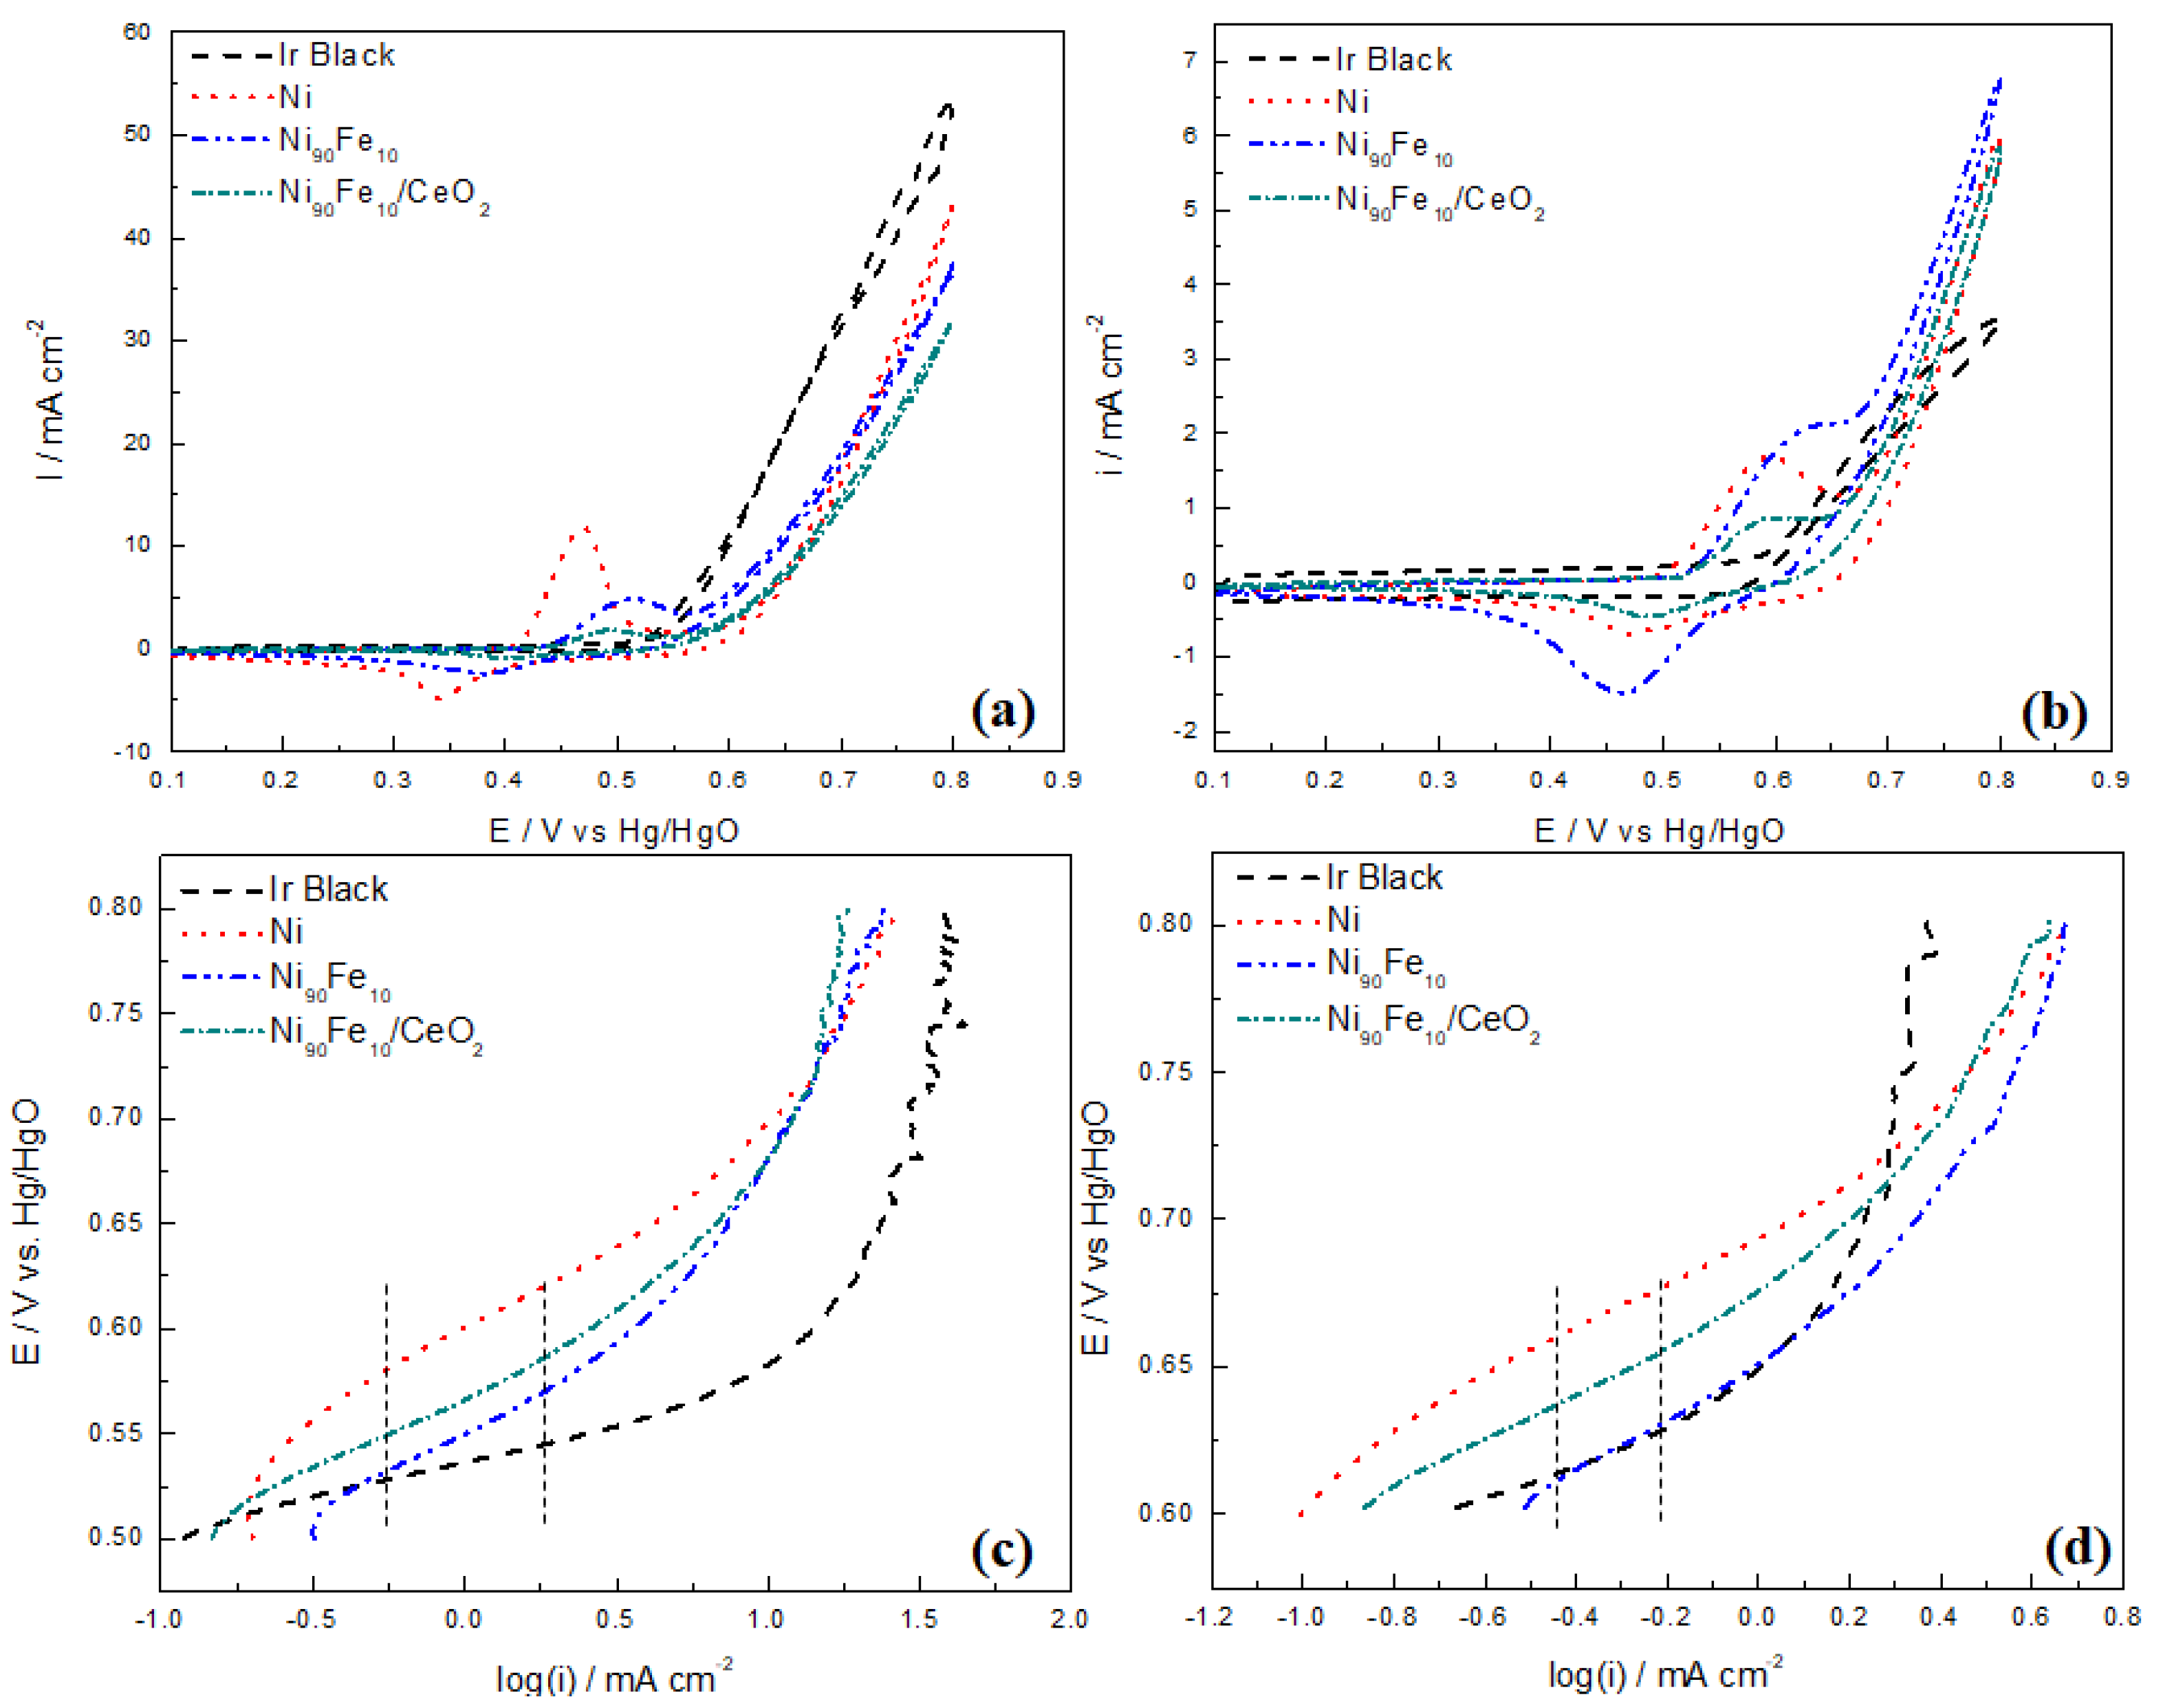
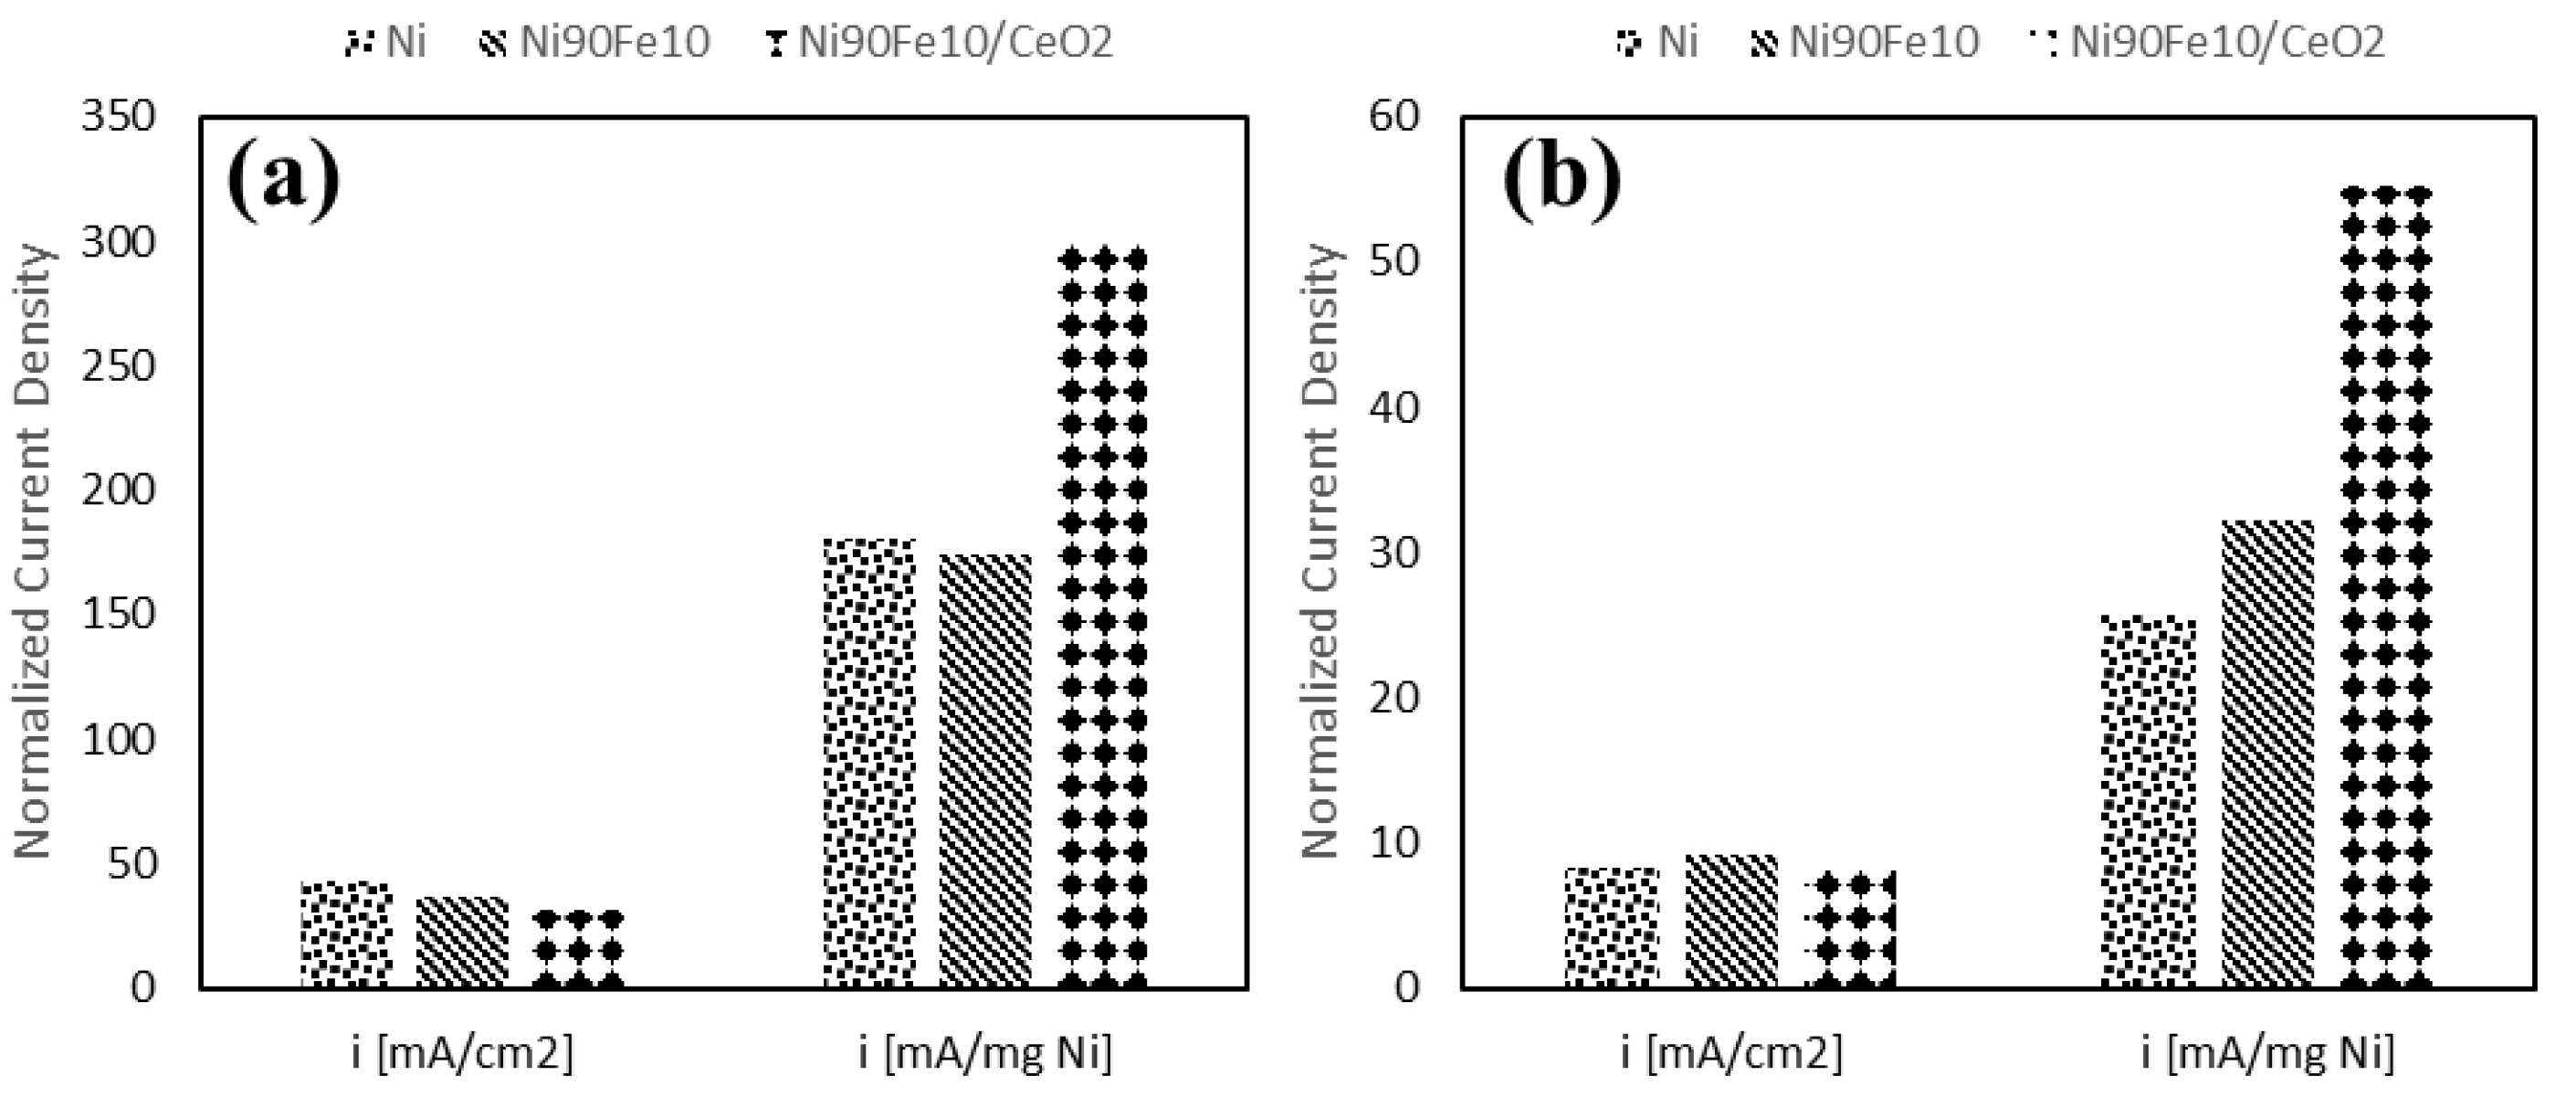
2.4. OER Experiments

In the cyclic voltammograms (CVs) shown in Figure 6a, the overpotentials for OER in 1 M KOH can be summarize as ηIr black < ηNi90Fe10/CeO2 < ηNi90Fe10 < ηNi, where the onset potential for OER of Ir occurs at ~0.524 V (~1.449 V versus RHE). It is important to note that the onset potentials are values taken at low currents. In addition to showing the lowest onset potential for OER, the iridium electrode also attains the highest current density and holds the lowest overpotential at 10 mA cm−2, as shown in Table 2. Among the Ni-based electrocatalysts, the Ni electrode shows the highest current density, while the Ni90Fe10/CeO2 sample exhibits the lowest onset potential for the OER at ~0.553 V (~1.478 V versus RHE). However, the Ni90Fe10 sample is the only sample that shows a lowered onset potential, while also attaining a high current density for OER. Additionally, it showed the second lowest overpotential at 10 mA cm−2. From the CV shown in Figure 6b, the reaction overpotentials for OER in 0.1 M KOH can be written as ηIr black < ηNi90Fe10/CeO2 < ηNi90Fe10 < ηNi, where the onset potential for OER or Ir occurs at ~0.589 V (1.455 V versus RHE). Although the Ir black still showed the lowest onset potential for the OER in 0.1 M KOH, the catalyst performs rather poorly due to apparently slow kinetics, reaching less than 5 mA cm−2. The Ni90Fe10 sample, on the other hand, continued to show a relatively high current for OER and held an overpotential of 0.404 V at 5 mA cm−2. The Ni90Fe10/CeO2 sample still exhibits the lowest onset potential amongst the Ni-based materials at around 0.635 V (1.501 V versus RHE). Figure 6c,d shows Tafel plots obtained from linear sweep voltammograms (LSVs) run at 1 mV s−1 in the OER region. Delineated on the figures are the regions in which the slopes tabulated in Table 2 were calculated. Note that no activity coefficients or exchange current densities were reported, as accurate estimations of a complete kinetic model require very detailed studies, such as the one reported by Reksten et al. [45] for IrxRu(1−x)O2 catalysts in acidic electrolyte.
The results summarized in Figure 6 and Table 2 indicate that the unsupported Ni90Fe10 catalyst is the most promising Ni-based material for OER in alkaline environment, as it shows both a lower onset potential and a higher current density in both 1 M and 0.1 M KOH. Amongst all Ni-based materials, it also shows the lowest overpotential at both 5 and 10 mA cm−2. Similar results have been previously reported, where the addition of Fe increases the OER activity [18,21,23,46,47]. Increased OER overpotentials with decreasing electrolyte concentrations have also been reported [18,21,23,46,47]. When comparing values in Table 2, it is possible to observe that in this case, our Ni-based catalysts experience an increase in overpotential between 87 and 101 mV, when decreasing the electrolyte concentration from 1 M to 0.1 M KOH. As for the OER kinetics, it was noticed that the Tafel slopes obtained in 1 M KOH for our study were sometimes twice as high compared to the values reported in literature [18,20,21,23,46,47,48]. Discrepancies in the literature are common, with reported values ranging between 40 and 130 mV dec−1 for the Tafel slope of nickel-based oxides, and are likely combinations of the regions of LSV used to calculate the slope; it is well known that there are generally two Tafel regions for OER, separated at ~1.5 V versus RHE (~0.575 V versus Hg/HgO in 1 M KOH) [17]. Another possible cause for the different Tafel slopes for Ni-based materials could be the state of the oxide surface at the time of the measurement or the scan rate selected.
In addition, only a small increase in the Tafel slope was observed for the Ni-based catalysts when decreasing the electrolyte concentration, a clear indication that the kinetics for the OER remain unchanged in this pH region. On the other hand, it seems as though the kinetics of Ir-based catalysts are considerably more affected by the decrease in KOH concentration, more than doubling the Tafel slope from 32 to 70 mV dec−1, while going from 1 M to 0.1 M KOH, respectively. These results are concurrent with observations reported in literature where Ir electrodes show a rather significant decrease in performance with decreasing electrolyte pH, either due to the development of a poorly conducting oxide film on the surface of the iridium working electrode [49], a change in OER mechanism [49] or possible blocking of the electrode surface due to evolving oxygen [50] However, Pi et al. [51] reported Tafel slopes of 32.7, 38.4 and 40.1 mV dec−1 in 1 M KOH, and 42.1, 48.5, 50.2 mV dec−1 in 0.1 M KOH for surface-cleaned 3D Ir nanosheets, 3D Ir nanosheets and Ir NPs, respectively. The 3D nanosheets were prepared with the wet-chemical synthesis method. A study by Lyons et al. [50] also reported similar Tafel slopes of 44 and 43 mV dec−1 in 0.1 and 1 M KOH, respectively, for IrO2 electrodes prepared via thermal decomposition onto a substrate. Finally, Tahir et al. [52], reported a Tafel slope of 65 mV dec−1 in 1 M KOH for IrO2.
Figure 6 and Table 2 show that the Ni90Fe10/CeO2 catalyst has a comparable overpotential for OER to those of the unsupported Ni-based materials. Although the current is not as high when including the ceria support, the material still shows promising activity through its Tafel parameters, which are very similar to the rest of the Ni-based materials. It is important to note that the CVs presented in Figure 6 were normalized by geometric surface area; normalizing the results by mass of metallic Ni would show that the ceria supported materials are the most promising OER catalysts, as shown in Figure 7, where the current densities normalized by geometric surface area and by mass of nickel at 0.8 V versus Hg/HgO (1.725 and 1.666 V versus RHE in 1 and 0.1 M KOH, respectively), are compared. Based on the interesting results of the cerium-content optimization reported in the paper by Chen et al. [34], future work on the Ni-based materials should include support content optimization of the synthesized catalysts. Figure S6 in the Supplementary Information shows the normalization by mass of metal in the Ni-based samples.

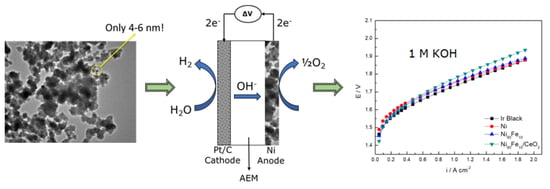
2.5. AEMWE Experiments

Polarization curves and electrochemical impedance spectroscopy (EIS) were carried out in an AEMWE cell. As shown in Figure 8a,b, polarization curves in 1 M KOH show a significantly higher performance and lower overpotential for OER than those taken in 0.1 M KOH. Achieving current densities of 2 A cm−2 at cell voltages of 1.85–1.9 V in 1 M KOH at 50 °C, may be regarded as an excellent result, considering the non-noble metal nature of these catalysts [2,8]. In 1 M KOH, the Ni and Ni90Fe10 electrodes show similar performance to the benchmark at only twice the intended metallic loading (6 mg cm−2 versus 3 mg cm−2 for Ir-black). As shown in Table 3, the Ni90Fe10 and Ni90Fe10/CeO2 electrodes have lower overpotentials than the Ni electrode at lower current densities; however, not at higher current densities, in accordance with our ex-situ CV experiments (Figure 6a,b). In 0.1 M KOH, the Ni90Fe10 electrode was the only catalyst that could reach an operating current of 2 A cm−2, without inducing too high an overpotential. Contrary to the non-noble catalyst results, the Ir black benchmark electrode shows a significant decrease in performance at the lower electrolyte concentration. This result not only reflects the three-electrode cell results very nicely, but also shows that Ni-based electrocatalysts, particularly the Ni90Fe10 catalyst, are promising electrocatalysts for use as AEMWE anodes. The Ni90Fe10 catalyst shows similar performance as the Ir noble metal in 1 M KOH and outperforms the noble metal in 0.1 M. The nickel-based materials in this work also show comparable, if not better, performance than other AEMWE tests carried out with similar set ups [12,53].
EIS measurements were carried out to evaluate the overall cell resistance and charge transfer resistance for the single AEMWE cell. Figure 8c,d and Table 3 show the EIS of each cell set up at 1 A cm−2. Although the EIS measurements were done for the full cell, a simple R(QR) circuit was used to fit the experimental data. The R(QR) model is shown in the corners of Figure 8c,d, and consists of a solution or overall cell resistance (REL) in series with a parallel combination of a charge transfer resistance (RCT) and a constant phase element (Q). REL is found from the high frequency intersection of the real axis of the fitted curve, while the RCT is represented by the diameter of the ensuing semicircle. All parameters were extracted from fits of the experimental data and reproduced in Table 3 under various conditions. Apart from the Ni90Fe10/CeO2, all anodes exhibited similar REL in 1 M KOH. As the REL corresponds to the ohmic resistance of the cell, it was expected that it be similar for the unsupported Ni, Ir and Ni90Fe10 catalysts. It is interesting to observe that the electrolyser cell using the Ni90Fe10/CeO2 shows more than twice the REL compared to the other cells for the same KOH concentration. This increase in ohmic resistance is caused by the rather large amount of less-conductive ceria in the catalytic layer (6 mg cm−2 for both the Ni catalyst and the CeO2 support), increasing the thickness of the catalytic layer. Incorporating ceria into the catalyst therefore affected both the electrode bulk conductivity and contact resistance between the anode electrode and the porous transport layers (PTLs). Nevertheless, the Ni90Fe10/CeO2 anode showed lower charge-transfer resistances in both 0.1 and 1 M KOH, indicating good kinetics.
Table 3 clearly shows that decreasing that the KOH concentration decreases electrolysis performance for all materials by affecting the charge transfer resistance (RCT) and kinetics of the electrochemical reactions, and the ohmic resistance or electrolyte resistance (REL) through a lack of OH ions. However, in the case of the Ni90Fe10 and Ni90Fe10/CeO2, the decrease in KOH concentration does not have as large an effect on the activity and kinetics of the OER compared to the Ni and Ir catalysts. The presence of Fe in the catalysts seems to shift the OER onset potential to lower values due to the formation of a NiFe mixed oxyhydroxide (NixFe(1−x)OOH) independent of pH [25].

3. Materials and Methods

3.1. Synthesis of Ni-Based Materials by Chemical Reduction

Ni, Ni90Fe10 and Ni90Fe10/CeO2 nanoparticles (NPs) were synthesized by a scalable chemical reduction method in ethanol using sodium borohydride as the reducing agent. First, the nickel chloride hexahydrate (NiCl2∙6H2O, 99.999% purity, Sigma Aldrich, St. Louis, MO, USA) precursor salt was dissolved in ethanol (EtOH, 99%, Greenfield, Grayslake, IL, USA) with magnetic stirring for 45 min at room temperature. Depending on whether the desired compound included Fe or CeO2, or both, the ferrous sulphate heptahydrate (FeSO4∙7H2O, ≥99%, Sigma Aldrich, St. Louis, MO, USA), precursor salt and cerium oxide nanopowder support (CeO2, 99.5%, Alfa Aesar, Haverhill, MA, USA ) were dissolved in ethanol using the same procedure. Next, the solutions were mixed together, and magnetic stirring was continued for 5 min to ensure that the solution was homogenous. Sodium borohydride (NaBH4, ≥98%, ACROS, Geel, Belgium) was then dissolved in around 5–10 mL of ultrapure water (ultrapure water, Milli-Q® Millipore, 18.2 MΩ cm at 293 K), then added to the reaction mixture, which was then further mixed for 30 min to ensure everything was completely reduced. Once the reaction was complete, the nanoparticles were washed three times with ethanol using a centrifuge run at 6000 rpm for 10 min per wash. Finally, the particles were left in a freeze drier overnight (around 15 h) to remove all residual ethanol from the sample. In this study, monometallic Ni nanoparticles were prepared, as were Ni90Fe10 (at%) and Ni90Fe10/CeO2 (50 wt% Ni90Fe10 metal supported on CeO2). Note that all glassware used in the NP synthesis was cleaned using the Aqua Regia procedure (2:1 HCl: HNO3, 37%, 70%, respectively, Sigma Aldrich, St. Louis, MO, USA). This synthesis procedure was easily scaled by adjusting the precursor salt quantities for the new desired material output, and by modifying the ethanol required to dissolve the salts. This ensured a similar concentration of precursor salts throughout all batches.

3.2. Material Characterization

The transmission electron microscopy (TEM) micrographs for the Ni and Ni90Fe10 catalysts were taken on the JEOL JEM 2100F Field Emission Transmission Electron Microscope (FETEM) (Tokyo, Japan) with an operating voltage of 200 kV. The scanning electron microscopy (SEM) micrographs of all AEMWE anodes were taken on the Hitachi Model S-3400N PC-Based Variable Pressure Scanning Electron Microscope (ON, Canada). SEM images were taken at an acceleration voltage of 15 kV. X-ray diffraction (XRD) results for the Ni and Ni90Fe10 catalysts were measured using the Rigaku Ultima IV multi-purpose diffractometer (Tokyo, Japan) using Copper Kα radiation and an x-ray wave length λ, of 1.5418 Å, at 40 kV and 44 mA. The XRD spectra were taken over a 2θ range of 20°–80° at a rate of 0.5° 2θ min−1.
For the Ni90Fe10/CeO2 material an Field Electron and Ion Company (FEI, Hillsboro, OR, USA) Titan3 80–300 TEM operated at 300 keV, equipped with a corrected electron optical systems (CEOS) aberration corrector for the probe forming lens and a monochromated field-emission gun, was used to obtain both high-resolution TEM (HRTEM) and annular dark-field (ADF) images. The ADF images were collected using a high-angle annular dark-field (HAADF) Fischione detector in the scanning transmission electron microscopy (STEM) mode. Additionally, energy-dispersive X-ray (EDX) spectroscopy and electron energy-loss spectroscopy (EELS) were carried out on the ceria-supported material using the TEM instrument described above, equipped with an EDX spectrometer (EDAX Analyzer, DPP-II) and an EELS spectrometer with a Gatan Tridiem 866 Image Filter. To optimize the signal intensity, EDX spectra were acquired with the specimen tilted at 15 degrees. EELS spectra were acquired in STEM with a convergence semi angle of 15 mrad and an acceptance semi angle of 40 mrad. Techniques not presented in the main article are presented in the Supplementary Information.

3.3. Ex-Situ Experiments

3.3.1. Cell Set-Up

The synthesized materials were first studied for the OER in a conventional, two-compartment, three-electrode electrochemical glass cell. The working and counter electrodes (WE and CE) were in the main compartment, while the reference electrode (RE) was in the second compartment. Prior to experiments, the glassy carbon surface of the WE was first polished with 30 micron alumina (Al2O3, Carveth Metallurgical Limited, Canada), then with 3 micron alumina (Al2O3, Buehler, Lake Bluff, IL, USA), both of which were mixed with ultrapure water. After polishing, the electrode surface was wiped with ethanol, then ultrapure water. The WE consisted of 10 μL of a catalyst ink deposited on a 0.196 cm2 glassy carbon electrode. The catalyst ink was made with 6 mg catalyst, 1 mL of ultrapure water, 200 μL isopropanol (IPA, 99.9%, Fischer Scientific, Hampton, NH, USA) and 100 μL of Nafion ® (~5%, Sigma Aldrich, St. Louis, MO, USA). Once the ink was made, it was sonicated for around 5 min, then the deposited ink was dried in an oven at 60 °C. The CE was a platinum mesh and the RE was mercury/mercury oxide (Hg/HgO) electrode (Koslow Scientific Company, Englewood, NJ, USA). Note that all potentials in this article are reported with respect to the Hg/HgO reference electrode unless otherwise specified. See the Supplementary Information for conversions to RHE and how the overpotentials were calculated. All electrochemistry experiments were carried out using either 1 M or 0.1 M potassium hydroxide solutions (KOH, ≥85%, Sigma Aldrich, St. Louis, MO, USA) at a room temperature of around 23 °C.

3.3.2. OER Experiments

Electrochemical tests were conducted using the Bio-Logic Potentiostat/Galvanostat using the EC Labs software (Bio-Logic Science Instruments, Seyssinet-Pariset, France). The OER tests included a cyclic voltammogram (CV) run between [0.1, 0.8] V for 10 cycles at a scan rate of 20 mV s−1, followed by a linear sweep voltammogram (LSV) run between [0.3, 0.8] V at a scan rate of 1 mV s−1. The tests mentioned were applied to the nickel-based materials, and an iridium black benchmark (Ir black, 99.8%, Alfa Aesar, Haverhill, MA, USA) catalyst. Before running the CVs and LSVs on the Ni-based materials, the WEs were polarized at −1.3 V for 5 min, and −0.8 V for 10 min [54], to first remove the oxides from the surfaces, and then to remove the hydrogen produced in the first polarization step. Only the fifth cycle of all cyclic voltammetry experiments is reported.

3.4. In Situ Experiments

3.4.1. Cell Set-Up

The AEMWE cell hardware consisted of a modified 25 cm2 fuel cell hardware (BalticFuelCell Gmbh). The cell has parallel flow fields made with gold coated titanium, which were used as both anode and cathode endplates. The endplate material selection was based on minimizing ohmic losses in the AEMWE cell or rather to minimize the interfacial contact resistances (ICRs). The electrolyser setup also included a 5 L Teflon tank with heaters, which was used as the KOH reservoir. A double headed peristaltic pump was used to pump 300 mL min−1 of KOH through the AEMWE cell at both anode and cathode.
The membrane electrode assembly consisted of a commercial anionic exchange membrane (fumasep FAA-3PE-30, Fumatech, Bietigheim-Bissingen, Germany), onto which the anode and cathode were hand-sprayed with an air brush. The membrane was secured with a gasket, as shown in Figure 9. Furthermore, in the interest of conserving material, only 5 cm2 of the 25 cm2 cell was used for the electrode area. The MEAs were assembled in the cell between two, 1 mm thick, commercially available, titanium, porous transport layers (PTLs) (Bekaert, Zwevegem, Belgium).
The anodes consisted of the previously mentioned Ni-based materials, and the Ir-black benchmark (Alfa Aesar, City, Haverhill, MA, USA), while the cathode consisted of platinum supported on carbon (Pt/C, 60 wt% metal on support, Alfa Aesar, Haverhill, MA, USA). The ink for the anodes were made with a solution of 50:50 by weight of ultrapure water: IPA, which included ~2 wt% metal and an anionic ionomer (fumion FAA-3-SOLUT-10, Bietigheim-Bissingen, Fumatech, Germany). The final electrode had ~10 wt% ionomer acting as both a catalyst binder and a facilitator for hydroxide ion transport. Multiple sonication and ultrasonication steps were used to ensure the solution was very fine and well dispersed. The ink for the cathodes were made in a similar way to the anode inks; however, the ionomer was present at ~23 wt% in the final electrode. Note that the ink preparation procedures were obtained by ink optimization of the benchmark electrodes; namely, the Ir-black anode and the Pt/C cathode.
In the AEMWE experiments, the anode loading for the benchmark was 3 mg cm−2, while the loading for the Ni-based materials was 6 mg cm−2. The cathode loading was held at a Pt loading of 1 mg cm−2 for all experiments. Note that those are intended metal loadings. For the actual metal loadings, see Table S1 in the Supplementary Information of this article. Actual metal loadings were calculated using ImageJ and a differential weight of samples taken from the template used to delimit the electrode area during spraying.

3.4.2. AEMWE Experiments

Before starting electrolysis testing, the cell was mounted into the system, and around 2 L of 1 M KOH was circulated through the system overnight to exchange the bromine anions in the membrane with hydroxide ions from the alkaline electrolyte. The system was then cleaned by pumping ultrapure water through it. Electrolysis testing was then carried out using the HCP-803 Potentiostat equipped with the EC Labs software (Bio-Logic Science Instruments, Seyssinet-Pariset, France). First, polarization curves were taken, by stepping up the current from 0 to 10 A (0 to 2 A cm−2). Next, electrochemical impedance spectroscopy (EIS) was performed by applying a direct current (DC) of 5 A (1 A cm−2) and an alternating current (AC) of ±5% DC, while the frequency ranged from 20,000 to 0.1 Hz. The impedance data was fitted to a simple equivalent circuit using magnitude weighting in the Maple application “Complex Nonlinear Least Squares Fitting of Immittance Data,” authored by David Harrington [55]. Polarization and EIS experiments were repeated three times in 1 M KOH, after which the system was flushed with ultrapure water, then all measurements were taken three times in 0.1 M KOH. All AEMWE experiments were performed at 50 ± 2 °C, by controlling the temperature in the cell and the KOH storage tank, individually.

4. Conclusions

In this study, Ni-based materials were synthesized for the promotion of the oxygen evolution reaction for applications in energy storage through anion-exchange, membrane-alkaline water electrolysis (AEMWE). Ni, Ni90Fe10 and Ni90Fe10/CeO2 NPs were synthesized via chemical reduction in ethanol using sodium borohydride. The materials were characterized by TEM imaging and were found to be around 4–6 nm in size. Ex-situ electrochemical experiments were conducted in a conventional three-electrode cell at both 1 M and 0.1 M KOH and results were compared to an Ir-black benchmark electrode. Results indicate that on average, the Ni90Fe10 material is the best-performing material for OER, showing very low onset potentials and excellent catalytic activity. This result was also obtained for the lower electrolyte concentration, wherein the NiFe-based electrode outperformed all catalysts, including the Ir benchmark electrode.
In-situ AEMWE experiments were performed in a modified 25 cm2 fuel cell for simultaneous O2 and H2 production. At twice the metallic loading compared to the Ir benchmark anode, the Ni-based materials showed state-of-the-art performance, achieving current densities of 2 A cm−2 at 1.85–1.9 V in 1 M KOH at 50 °C. In 0.1 M KOH, the cell set up using the Ni90Fe10 anode attained 1.99 V at 2 A cm−2. These are promising results, considering the non-noble metal nature of these catalysts and that long-term stability measurements are on-going. Based on impedance results, the ceria-supported NiFe catalyst showed higher cell resistances (higher REL values), yet showed a low onset potential for the OER, and a low charge transfer resistance, indicating the Ni90Fe10/CeO2 may be used as an anode catalyst in AEMWE if the support is further optimized in terms of electrical conductivity.

Supplementary Materials

The following are available online at https://www.mdpi.com/2073-4344/9/10/814/s1, Figure S1: CVs from 0.1 to 0.8 V of Ni (black), CeO2 (red) and Ni/CeO2 (blue) run at 20 mV s−1 in 1 M KOH. Figure S2: TEM Images of Ni90Fe10/CeO2 showing (a) mostly the Ni and Fe and (b) mostly the CeO2 support. Figure S3: STEM Images of Ni90Fe10/CeO2 showing (a) mostly the Ni and Fe and (b) mostly the CeO2 support. Figure S4: Spatially-resolved EDX of Ni90Fe10/CeO2. (a) Shows the two selected regions of the STEM image, (b) shows the analysis of Region 1 and (c) shows the analysis of Region 2. Figure S5: EELS mapping of Ni90Fe10/CeO2. (a) Shows the Fe mapping, (b) shows the Ni mapping and (c) shows the analyzed region in orange. Figure S6: Comparison between current densities by geometric surface area and by mass of metal at 0.8 V against Hg/HgO in (a) 1 M KOH and (b) 0.1 M KOH. Table S1: Anode metal loadings on the membrane electrode assemblies.

Author Contributions

Material synthesis, characterization, ex-situ oxygen evolution measurements, in-situ electrolysis measurements, writing and editing, E.C. In-situ electrolysis measurements, funding acquisition, supervision, writing and editing, A.O.B. Funding acquisition, supervision, writing and editing, F.S. funding acquisition, supervision, writing and editing, E.A.B.

Funding

This research was conducted as part of the Engineered Nickel Catalysts for Electrochemical Clean Energy project administered from Queen’s University and supported by Grant number RGPNM 477963-2015 under the Natural Sciences and Engineering Research Council of Canada (NSERC) Discovery Frontiers Program. Additionally, this work was performed within the HAPEEL project “Hydrogen Production by Alkaline Polymer Electrolyte Electrolysis,” financially supported by the Research Council of Norway-ENERGIX program, contract number 268019. The Research Council of Norway is also acknowledged for the support to the Norwegian Fuel cell and Hydrogen Centre and the INTPART project 261620.

Acknowledgments

The authors would also like to thank Martin Couillard from the Natural Research Council of Canada for his help in characterizing the Ni90Fe10/CeO2 sample.

Conflicts of Interest

The authors declare no conflict of interest.

References

  1. Clark, D.; Brandon, N. What’s the “Hydrogen Economy”? The Guardian: London, UK, 2012. [Google Scholar]
  2. Zeng, K.; Zhang, D. Recent progress in alkaline water electrolysis for hydrogen production and applications. Prog. Energy Combust. Sci. 2010, 36, 307–326. [Google Scholar] [CrossRef]
  3. Leng, Y.; Chen, G.; Mendoza, A.J.; Tighe, T.B.; Hickner, M.A.; Wang, C.Y. Solid-state water electrolysis with an alkaline membrane. J. Am. Chem. Soc. 2012, 134, 9054–9057. [Google Scholar] [CrossRef] [PubMed]
  4. Varcoe, J.R.; Atanassov, P.; Dekel, D.R.; Herring, A.M.; Hickner, M.A.; Kohl, P.A.; Kucernak, A.R.; Mustain, W.E.; Nijmeijer, K.; Scott, K.; et al. Anion-exchange membranes in electrochemical energy systems. Energy Environ. Sci. 2014, 7, 3135–3191. [Google Scholar] [CrossRef] [Green Version]
  5. Cho, M.K.; Park, H.Y.; Lee, H.J.; Kim, H.J.; Lim, A.; Henkensmeier, D.; Yoo, S.J.; Kim, J.Y.; Lee, S.Y.; Park, H.S.; et al. Alkaline anion exchange membrane water electrolysis: Effects of electrolyte feed method and electrode binder content. J. Power Sources 2018, 382, 22–29. [Google Scholar] [CrossRef]
  6. Vincent, I.; Bessarabov, D. Low cost hydrogen production by anion exchange membrane electrolysis: A review. Renew. Sustain. Energy Rev. 2018, 81, 1690–1704. [Google Scholar] [CrossRef]
  7. Phillips, R.; Edwards, A.; Rome, B.; Jones, D.R.; Dunnill, C.W. Minimising the ohmic resistance of an alkaline electrolysis cell through effective cell design. Int. J. Hydrog. Energy 2017, 42, 23986–23994. [Google Scholar] [CrossRef] [Green Version]
  8. Park, J.E.; Kang, S.Y.; Oh, S.H.; Kim, J.K.; Lim, M.S.; Ahn, C.Y.; Cho, Y.H.; Sung, Y.E. High-performance anion-exchange membrane water electrolysis. Electrochim. Acta 2019, 295, 99–106. [Google Scholar] [CrossRef]
  9. Hnát, J.; Paidar, M.; Schauer, J.; Žitka, J.; Bouzek, K. Polymer anion-selective membranes for electrolytic splitting of water. Part II: Enhancement of ionic conductivity and performance under conditions of alkaline water electrolysis. J. Appl. Electrochem. 2012, 42, 545–554. [Google Scholar] [CrossRef] [Green Version]
  10. Chanda, D.; Hnát, J.; Bystron, T.; Paidar, M.; Bouzek, K. Optimization of synthesis of the nickel-cobalt oxide based anode electrocatalyst and of the related membrane-electrode assembly for alkaline water electrolysis. J. Power Sources 2017, 347, 247–258. [Google Scholar] [CrossRef]
  11. Kim, J.H.; Lee, J.N.; Yoo, C.Y.; Lee, K.B.; Lee, W.M. Low-cost and energy-efficient asymmetric nickel electrode for alkaline water electrolysis. Int. J. Hydrog. Energy 2015, 40, 10720–10725. [Google Scholar] [CrossRef]
  12. Schalenbach, M.; Kasian, O.; Mayrhofer, K.J.J. An alkaline water electrolyzer with nickel electrodes enables efficient high current density operation. Int. J. Hydrog. Energy 2018, 43, 11932–11938. [Google Scholar] [CrossRef]
  13. Liu, Z.; Sajjad, S.D.; Gao, Y.; Yang, H.; Kaczur, J.J.; Masel, R.I. The effect of membrane on an alkaline water electrolyzer. Int. J. Hydrog. Energy 2017, 42, 29661–29665. [Google Scholar] [CrossRef]
  14. Katsounaros, I.; Cherevko, S.; Zeradjanin, A.R.; Mayrhofer, K.J.J. Oxygen electrochemistry as a cornerstone for sustainable energy conversion. Angew. Chem. Int. Ed. 2014, 53, 102–121. [Google Scholar] [CrossRef] [PubMed]
  15. Marini, S.; Salvi, P.; Nelli, P.; Pesenti, R.; Villa, M.; Berrettoni, M.; Zangari, G.; Kiros, Y. Advanced alkaline water electrolysis. Electrochim. Acta 2012, 82, 384–391. [Google Scholar] [CrossRef]
  16. Faid, A.; Oyarce Barnett, A.; Seland, F.; Sunde, S. Highly active nickel-based catalyst for hydrogen evolution in anion exchange membrane electrolysis. Catalysts 2018, 8, 614. [Google Scholar] [CrossRef]
  17. Fabbri, E.; Habereder, A.; Waltar, K.; Kötz, R.; Schmidt, T.J. Developments and perspectives of oxide-based catalysts for the oxygen evolution reaction. Catal. Sci. Technol. 2014, 4, 3800–3821. [Google Scholar] [CrossRef] [Green Version]
  18. Li, X.; Walsh, F.C.; Pletcher, D. Nickel based electrocatalysts for oxygen evolution in high current density, alkaline water electrolysers. Phys. Chem. Chem. Phys. 2011, 13, 1162–1167. [Google Scholar] [CrossRef] [PubMed]
  19. Cho, M.K.; Lim, A.; Lee, S.Y.; Kim, H.; Yoo, S.J.; Sung, Y.; Park, H.S.; Jang, J.H. A review on membranes and catalysts for anion exchange membrane water electrolysis single cells. J. Electrochem. Sci. Technol. 2017, 8, 183–196. [Google Scholar] [CrossRef]
  20. Trotochaud, L.; Ranney, J.K.; Williams, K.N.; Boettcher, S.W. Solution-cast metal oxide thin film electrocatalysts for oxygen evolution. J. Am. Chem. Soc. 2012, 134, 17253–17261. [Google Scholar] [CrossRef] [PubMed]
  21. Gong, M.; Dai, H. A mini review of NiFe-based materials as highly active oxygen evolution reaction electrocatalysts. Nano Res. 2015, 8, 23–39. [Google Scholar] [CrossRef]
  22. Long, X.; Ma, Z.; Yu, H.; Gao, X.; Pan, X.; Chen, X.; Yang, S.; Yi, Z. Porous FeNi oxide nanosheets as advanced electrochemical catalysts for sustained water oxidation. J. Mater. Chem. A 2016, 4, 14939–14943. [Google Scholar] [CrossRef]
  23. Gong, M.; Li, Y.; Wang, H.; Liang, Y.; Wu, J.Z.; Zhou, J.; Wang, J.; Regier, T.; Wei, F.; Dai, H. An advanced Ni-Fe layered double hydroxide electrocatalyst for water oxidation. J. Am. Chem. Soc. 2013, 135, 8452–8455. [Google Scholar] [CrossRef] [PubMed]
  24. Bode, H.; Dehmelt, K.; White, J. Zur kenntnis der nickelhydroxidelektrode—I.Über das nickel (II)-hydroxidhydrat. Electrochim. Acta 1966, 11, 1079–1087. [Google Scholar] [CrossRef]
  25. Diaz-Morales, O.; Ferrus-Suspedra, D.; Koper, M.T.M. The importance of nickel oxyhydroxide deprotonation on its activity towards electrochemical water oxidation. Chem. Sci. 2016, 7, 2639–2645. [Google Scholar] [CrossRef] [PubMed] [Green Version]
  26. Surendranath, Y.; Kanan, M.W.; Nocera, D.G. Mechanistic studies of the oxygen evolution reaction by a cobalt-phosphate catalyst at neutral pH. J. Am. Chem. Soc. 2010, 132, 16501–16509. [Google Scholar] [CrossRef] [PubMed]
  27. Takashima, T.; Hashimoto, K.; Nakamura, R. Mechanisms of pH-dependent activity for water oxidation to molecular oxygen by MnO2 electrocatalysts. J. Am. Chem. Soc. 2012, 134, 1519–1527. [Google Scholar] [CrossRef] [PubMed]
  28. Lyons, M.E.G.; Cakara, A.; O’Brien, P.; Godwin, I.; Doyle, R.L. Redox, pH sensing and electrolytic water splitting properties of electrochemically generated nickel hydroxide thin films in aqueous alkaline solution. Int. J. Electrochem. Sci. 2012, 7, 11768–11795. [Google Scholar]
  29. Lyons, M.E.G.; Doyle, R.L.; Brandon, M.P. Redox switching and oxygen evolution at oxidized metal and metal oxide electrodes: Iron in base. Phys. Chem. Chem. Phys. 2011, 13, 21530–21551. [Google Scholar] [CrossRef]
  30. Panaritis, C.; Edake, M.; Couillard, M.; Einakchi, R.; Baranova, E.A. Insight towards the role of ceria-based supports for reverse water gas shift reaction over RuFe nanoparticles. J. CO2 Util. 2018, 26, 350–358. [Google Scholar] [CrossRef]
  31. Dole, H.A.E.; Baranova, E.A. Ethylene oxidation in an oxygen-deficient environment: Why ceria is an active support? ChemCatChem 2016, 8, 1977–1986. [Google Scholar] [CrossRef]
  32. Rao, G.R.; Mishra, B.G. Structural redox and catalytic chemistry of ceria based materials. Bull. Catal. Soc. India 2003, 2, 122–134. [Google Scholar]
  33. Feng, J.-X.; Ye, S.-H.; Xu, H.; Tong, Y.-X.; Li, G.-R. Design and synthesis of FeOOH/CeO2 heterolayered nanotube electrocatalysts for the oxygen evolution reaction. Adv. Mater. 2016, 28, 4698–4703. [Google Scholar] [CrossRef] [PubMed]
  34. Chen, Z.; Kronawitter, C.X.; Yang, X.; Yeh, Y.W.; Yao, N.; Koel, B.E. The promoting effect of tetravalent cerium on the oxygen evolution activity of copper oxide catalysts. Phys. Chem. Chem. Phys. 2017, 19, 31545–31552. [Google Scholar] [CrossRef] [PubMed]
  35. Favaro, M.; Drisdell, W.S.; Marcus, M.A.; Gregoire, J.M.; Crumlin, E.J.; Haber, J.A.; Yano, J. An operando investigation of (Ni-Fe-Co-Ce)Ox system as highly efficient electrocatalyst for oxygen evolution reaction. ACS Catal. 2017, 7, 1248–1258. [Google Scholar] [CrossRef]
  36. Haber, J.A.; Cai, Y.; Jung, S.; Xiang, C.; Mitrovic, S.; Jin, J.; Bell, A.T.; Gregoire, J.M. Discovering Ce-rich oxygen evolution catalysts, from high throughput screening to water electrolysis. Energy Environ. Sci. 2014, 7, 682–688. [Google Scholar] [CrossRef] [Green Version]
  37. McCrory, C.C.L.; Jung, S.; Peters, J.C.; Jaramillo, T.F. Benchmarking heterogeneous electrocatalysts for the oxygen evolution reaction. J. Am. Chem. Soc. 2013, 135, 16977–16987. [Google Scholar] [CrossRef] [PubMed]
  38. Seetharaman, S.; Balaji, R.; Ramya, K.; Dhathathreyan, K.S.; Velan, M. Graphene oxide modified non-noble metal electrode for alkaline anion exchange membrane water electrolyzers. Int. J. Hydrog. Energy 2013, 38, 14934–14942. [Google Scholar] [CrossRef]
  39. Xiao, L.; Zhang, S.; Pan, J.; Yang, C.; He, M.; Zhuang, L.; Lu, J. First implementation of alkaline polymer electrolyte water electrolysis working only with pure water. Energy Environ. Sci. 2012, 5, 7869–7871. [Google Scholar] [CrossRef]
  40. Ayers, K.E.; Anderson, E.B.; Capuano, C.B.; Niedzwiecki, M.; Hickner, M.A.; Wang, C.-Y.; Leng, Y.; Zhao, W. Characterization of anion exchange membrane technology for low cost electrolysis. ECS Trans. 2013, 45, 121–130. [Google Scholar] [CrossRef]
  41. Pavel, C.C.; Cecconi, F.; Emiliani, C.; Santiccioli, S.; Scaffidi, A.; Catanorchi, S.; Comotti, M. Highly efficient platinum group metal free based membrane-electrode assembly for anion exchange membrane water electrolysis. Angew. Chem. Int. Ed. 2014, 53, 1378–1381. [Google Scholar] [CrossRef] [PubMed]
  42. Sun, Y.P.; Li, X.Q.; Cao, J.; Zhang, W.X.; Wang, H.P. Characterization of zero-valent iron nanoparticles. Adv. Colloid Interface Sci. 2006, 120, 47–56. [Google Scholar] [CrossRef] [PubMed]
  43. Hall, D.S.; Lockwood, D.J.; Bock, C.; MacDougall, B.R. Nickel hydroxides and related materials: A review of their structures, synthesis and properties. Proc. R. Soc. A Math. Phys. Eng. Sci. 2015, 471, 20140792. [Google Scholar] [CrossRef] [PubMed]
  44. Baranova, E.A.; Le Page, Y.; Ilin, D.; Bock, C.; MacDougall, B.; Mercier, P.H.J. Size and composition for 1–5 nm Ø PtRu alloy nano-particles from Cu Kα X-ray patterns. J. Alloys Compd. 2009, 471, 387–394. [Google Scholar] [CrossRef]
  45. Reksten, A.H.; Thuv, H.; Seland, F.; Sunde, S. The oxygen evolution reaction mechanism at IrxRu1−xO2 powders produced by hydrolysis synthesis. J. Electroanal. Chem. 2018, 819, 547–561. [Google Scholar] [CrossRef]
  46. Lyons, M.E.G.; Brandon, M.P. A comparative study of the oxygen evolution reaction on oxidised nickel, cobalt and iron electrodes in base. J. Electroanal. Chem. 2010, 641, 119–130. [Google Scholar] [CrossRef]
  47. Lu, X.; Zhao, C. Electrodeposition of hierarchically structured three-dimensional nickel-iron electrodes for efficient oxygen evolution at high current densities. Nat. Commun. 2015, 6, 6616. [Google Scholar] [CrossRef]
  48. Tahir, M.; Pan, L.; Idrees, F.; Zhang, X.; Wang, L.; Zou, J.J.; Wang, Z.L. Electrocatalytic oxygen evolution reaction for energy conversion and storage: A comprehensive review. Nano Energy 2017, 37, 136–157. [Google Scholar] [CrossRef]
  49. Cherevko, S.; Geiger, S.; Kasian, O.; Kulyk, N.; Grote, J.-P.; Savan, A.; Shrestha, R.B.; Merzlikin, S.; Breitbach, B.; Ludwig, A.; et al. Oxygen and hydrogen evolution reactions on Ru, RuO2, Ir, and IrO2 thin film electrodes in acidic and alkaline electrolytes: A comparative study on activity and stability. Catal. Today 2015, 262, 170–180. [Google Scholar] [CrossRef]
  50. Lyons, M.E.G.; Floquet, S. Mechanism of oxygen reactions at porous oxide electrodes. Part 2—Oxygen evolution at RuO2, IrO2 and IrxRu1−xO2 electrodes in aqueous acid and alkaline solution. Phys. Chem. Chem. Phys. 2011, 13, 5314–5335. [Google Scholar] [CrossRef]
  51. Pi, Y.; Zhang, N.; Guo, S.; Guo, J.; Huang, X. Ultrathin laminar Ir superstructure as highly efficient oxygen evolution electrocatalyst in broad pH range. Nano Lett. 2016, 16, 4424–4430. [Google Scholar] [CrossRef]
  52. Tahir, M.; Mahmood, N.; Zhang, X.; Mahmood, T.; Butt, F.K.; Aslam, I.; Tanveer, M.; Idrees, F.; Khalid, S.; Shakir, I.; et al. Bifunctional catalysts of Co3O4@GCN tubular nanostructured (TNS) hybrids for oxygen and hydrogen evolution reactions. Nano Res. 2015, 8, 3725–3736. [Google Scholar] [CrossRef]
  53. Vincent, I.; Kruger, A.; Bessarabov, D. Development of efficient membrane electrode assembly for low cost hydrogen production by anion exchange membrane electrolysis. Int. J. Hydrogen Energy 2017, 42, 10752–10761. [Google Scholar] [CrossRef]
  54. Alsabet, M.; Grden, M.; Jerkiewicz, G. Electrochemical growth of surface oxides on nickel. Part 1: Formation of α-Ni(OH)2 in relation to the polarization potential, polarization time, and temperature. Electrocatalysis 2011, 2, 317–330. [Google Scholar] [CrossRef]
  55. Harrington, D. Complex Nonlinear Least Squares Fitting of Immittance Data. Available online: https://www.maplesoft.com/applications/view.aspx?SID=154540 (accessed on 26 August 2019).
Figure 1. Nickel oxidation steps in alkaline media.
Catalysts 09 00814 g001
Figure 2. TEM of (a) Ni and (b) Ni90Fe10 nanoparticles (NPs).
Catalysts 09 00814 g002
Figure 3. SEMs of (a) Ir black, (b) Ni, (c) Ni90Fe10 and (d) Ni90Fe10/CeO2 anodes of the catalyst coated membranes. The magnifications of the images are 30, 300, 300 and 200 μm, respectively.
Catalysts 09 00814 g003
Figure 4. XRD results for Ni (black) and Ni90Fe10 (red) NPs.
Catalysts 09 00814 g004
Figure 5. EELS results for Ni90Fe10/CeO2. (a) The area of STEM image that was analyzed in orange, (b) shows the regions within the orange area that were analyzed and (c) shows the results of the analysis of the two regions.
Catalysts 09 00814 g005
Figure 6. (a,b) Stable CVs run at 20 mV s−1 in 1 M and 0.1 M KOH, respectively. (c,d) Tafel plots obtained from LSVs run between [0.3, 0.8] V at 1 mV s−1 in 1 M and 0.1 M KOH, respectively. Catalysts: Ir black (black), Ni (red), Ni90Fe10 (blue) and Ni90Fe10/CeO2 (green) NPs.
Catalysts 09 00814 g006
Figure 7. Comparison between current densities by geometric surface area and by mass of Ni at 0.8 V versus Hg/HgO in (a) 1 M KOH and (b) 0.1 M KOH. Data for Figure 7a,b were taken from the CVs presented in Figure 6a,b, respectively.
Catalysts 09 00814 g007
Figure 8. (a,b) Polarization curves up to 2 A cm−2 in 1 M and 0.1 M KOH, respectively. (c,d) Electrochemical impedance spectroscopy in 1 M and 0.1 M KOH, respectively. Catalysts: Ir black (black square), Ni (red circle), Ni90Fe10 (blue triangle) and Ni90Fe10/CeO2 (green inverted triangle) NPs. Experiments were conducted at 50 °C.
Catalysts 09 00814 g008
Figure 9. Compact Alkaline Exchange Membrane Water Electrolyser Cell Design.
Catalysts 09 00814 g009
Table 1. XRD results [42,43].
Icon on Figure 4Experimental 2θ [deg]Corresponding Compound; Reported 2θ [deg]
Diamond Catalysts 09 00814 i00133.78β-Ni(OH)2 (100); 33.1
Pentagon Catalysts 09 00814 i00244.65Ni (111); 44.45
Circle Catalysts 09 00814 i00345.37Ni (111); 44.45
Fe (110); 44.9
Triangle Catalysts 09 00814 i00459.99β-Ni(OH)2 (110); 59.1
Square Catalysts 09 00814 i00570.68β-Ni(OH)2 (103); ~71
Table 2. Tafel slopes and overpotentials at 0.1 and 1 M for Ir black, Ni, Ni90Fe10 and Ni90Fe10/CeO2 NPs.
CatalystKOH Conc. [M]Tafel Slope [mV dec−1]η @ 5 mA cm−2 [mV]η @ 10 mA cm−2 [mV]
Ir Black1.032.0268295
0.170.6N/AN/A
Ni1.075.5337365
0.173.1424N/A
Ni90Fe101.071.9298341
0.183.3404N/A
Ni90Fe10/CeO21.070.7323369
0.182.1424N/A
Table 3. Summary of polarization curve and electrochemical impedance results.
Catalyst.KOH conc. [M]E @ 0.4 A/cm2 [V]E @ 1.4 A/cm2 [V]REL [mΩ]RCT [mΩ]Y [10−4 F s(1−α)]α
Ir Black1.01.6081.8046.0 ± 0.127 ± 0.13.6 ± 0.10.577 ± 0.005
0.11.6912.01111.6 ± 0.240.2 ± 0.311.5 ± 0.10.618 ± 0.007
Ni1.01.6361.8154.1 ± 0.225.2 ± 0.312.8 ± 0.80.465 ± 0.009
0.11.7131.9848.0 ± 0.336.7 ± 0.56.4 ± 0.40.478 ± 0.009
Ni90Fe101.01.6221.8236.3 ± 0.226.1 ± 0.36.6 ± 0.50.53 ± 0.01
0.11.6591.9119.4 ± 0.133.6 ± 0.22.8 ± 0.10.551 ± 0.005
Ni90Fe10/CeO21.01.6271.85413.0 ± 0.421.2 ± 0.210.1 ± 0.30.74 ± 0.04
0.11.7032.02327.0 ± 0.425.6 ± 0.60.5 ± 0.10.74 ± 0.02

