Article

Bio-Oil Steam Reforming over a Mining Residue Functionalized with Ni as Catalyst: Ni-UGSO

Department of Chemical Engineering and Biotechnological Engineering, Université de Sherbrooke, 2500, Boulevard de l’Université, Sherbrooke, QC J1K 2R1, Canada
*
Author to whom correspondence should be addressed.
Catalysts 2018, 8(1), 1; https://doi.org/10.3390/catal8010001
Submission received: 17 November 2017 / Revised: 12 December 2017 / Accepted: 15 December 2017 / Published: 22 December 2017
(This article belongs to the Special Issue Catalysis in Steam Reforming)

Abstract

:
Bio-oil reforming is considered for syngas or H2 production. In this work, we studied the steam reforming (SR) of two raw bio-oils without adding external steam, using a recently-developed catalyst, Ni-UGSO. Experiments were performed at temperature (T) = 750–850 °C and weight hourly space velocity (WHSV) = 1.7–7.1 g/gcat/h to assess C conversion (XC) and product yields. The results show that, in all conditions and with both bio-oils tested, the catalyst is stable for the entire duration of the tests (~500 min) even when some C deposition occurred and that only at the highest WHSV tested there is a slight deactivation. In all tests, catalytic activity remained constant after a first, short, transient state, which corresponded to catalyst activation. The highest yields and conversions, with Y H 2 , Y CO and XC of 94%, 84% and 100%, respectively, were observed at temperatures above 800 °C and WHSV = 1.7 g/gcat/h. The amount of H2O in the bio-oils had a non-negligible effect on catalyst activity, impacting Y H 2 , Y CO and XC values. It was observed that, above a critical amount of H2O, the catalyst was not fully activated. However, higher H2O content led to the reduction of C deposits as well as lower Y H 2 and Y CO and, through the water-gas-shift reaction, to higher Y CO 2 (CO2 selectivity). Fresh and spent catalysts were analyzed by physisorption (BET), X-ray diffraction, scanning electron microscopy and thermogravimetric analysis: the results reveal that, during the oils’ SR reaction, the initial spinel (Ni-Fe-Mg-Al) structures decreased over time-on-stream (TOS), while metallic Ni, Fe and their alloy phases appeared. Although significant sintering was observed in used catalysts, especially at high H2O/C ratio, the catalyst’s specific surface generally increased; the latter was attributed to the presence of nanometric metallic Ni and Ni-Fe alloy particles formed by reduction reactions. A small amount of C (4%) was formed at low H2O/C.

1. Introduction

Biomass is a renewable energy resource. It can be combusted to provide heat, gasified to produce syngas, torrefied to yield biochar or undergo pyrolysis to generate bio-oils (or pyrolysis oils) [1]. Bio-oils are complex mixtures of various hydrocarbons and oxygenated compounds: H2O, ketones, aldehydes, acids and sugars [2]. They may have many applications as: fuel for burners [3] or engines [4], transportation fuels after upgrading [5] or feedstock for producing chemicals and syngas [6]. In the latter two cases, such applications are difficult to implement due to the unfavorable physico-chemical properties of bio-oils. Indeed, they are viscous; have high O and H2O content; have low heating value (<20 MJ/kg); and have high acidity. They are unstable so they age relatively rapidly and phase-separate upon storage [7]. However, this latter issue can be prevented by including additives such as methanol [7,8]. Because of mixture complexity, it is technically difficult and expensive to isolate chemicals with available separation processes.
The main advantage of bio-oils is that they are liquid [9], and easy to store and transport. These attributes have led the National Renewable Energy Laboratory (NREL) in the USA to work on the concept of distributed H2 production by bio-oil catalytic reforming [9,10,11,12], which is currently a promising options for bio-oil use. Other work has been done in collaboration with the NREL—transportation fuel production from bio-oils via bio-oil hydroprocessing—where the H2 needed is produced by the catalytic reforming of 38 wt % of feedstock [13].
The targeted reaction is Equation (1):
C x H y O z + ( x z ) H 2 O x CO + ( x z + y 2 ) H 2
Side reactions also take place in the reactor: water-gas-shift (WGS) (Equation (2)), Boudouard equilibrium (Equation (3)) and thermal cracking (Equation (4)):
CO + H 2 O CO 2 + H 2
C + CO 2 2 CO
C x H y O z C + C a H b + C e H f O g
where C a H b designates light hydrocarbons, such as: CH 4 , C 2 H 6   and   C 2 H 4 , while C e H f O g represents light oxygenated compounds, such as acetone, ethanol, and methanol.
To increase H2 yield, a WGS reactor is commonly added next to the reforming unit [9], and H2 is purified through a pressure swing adsorption (PSA) unit.
Bio-oil steam reforming (SR) was studied in the 1990s at the NREL: Wang et al. [10,14] investigated H2 production from bio-oils, using commercial Ni-based catalysts. The same group studied catalytic reforming of bio-oil aqueous fractions over a variety of commercial and research-based Ni catalysts [15]. The commercial catalysts performed better while La2O3 and MgO addition to classical Ni/Al2O3 enhanced steam adsorption and facilitated C gasification. Moreover, they showed that addition through impregnation of metallic Cr and Co reduced Ni crystallite size, which proved beneficial in terms of catalytic efficiency and resistance to coke deposition. Later on, NREL researchers studied different routes of H2 production from bio-oils: (a) catalytic SR [11], partial oxidation (POX) [16], and autothermal reforming (ATR) [9]; and (b) non-catalytic POX [17]. Different reactor configurations (fixed bed, fluidized bed, and staged reactor) as well as different catalysts were tested. POX and ATR have the advantage of being much less energy-intensive and, consequently, more economical processes, but their H2 yields are generally lower.
Other groups also worked on bio-oil reforming. Hu and Lu [18] developed an original “Y” reactor for mixed SR and dry reforming of bio-oils over two catalyst beds aimed at increasing CO2 conversion or CO2 selectivity (expressed in an equivalent way). The catalysts used we Ni/Al2O3 and Ni/La2O3. Xie et al. [19] studied bio-oil SR enhanced by CO2 sorption with CaO over Ni-Ce/Co-Al2O3 catalyst: they compared three precursors of the sorbent CaO and confirmed that at least partial removal of CO2 improved H2 yield because the WGS reaction was, thus, favored. Seyedeyn-Azad et al. [20] worked on SR of the aqueous fraction of bio-oil over Ni-MgO/Al2O3 catalyst; they assessed the effect of bio-oil/H2O ratio, Ni loading and catalyst preparation conditions on H2 yield; the maximum H2 yield obtained was 61%. Gao et al. [21] have studied the SR of raw bio-oil over the nano-Ni/ceramic foam catalyst; they assessed the effect of: reaction temperature (TR), WHSV and catalyst calcination temperature (Tcal) on products composition and yield; the highest H2 yield was obtained at Tcal = 400 °C, TR = 700 °C and WHSV = 1.4 h−1. Similar work was conducted by Quan et al. [22] on the SR of coconut shell bio-oil over Fe/olivine catalyst; the latter was suitable for the conversion of most of the phenolic compounds. The authors also show that a Tcal > 900 °C could lead to catalyst deactivation and Fe sintering. Remón et al. [23] studied the SR of various bio-oils aqueous fraction over Ni-Co/Al-Mg catalyst; they evaluated the effect of the liquids compositions on products yield and found that acetic acid and furfural content had the greatest impact on reforming results.
Many works on SR of bio-oil model compounds have been published. Vagia and Lemonidou [24,25] performed thermodynamic analysis of SR and autothermal SR of simulated bio-oils with oxygenated compounds (acetic acid, ethylene glycol and acetone) where the effects of temperature, H2O/C ratio and pressure on product composition and yield were evaluated. González-Gil et al. [26] studied the catalytic SR of representative molecules (acetone and ethanol) of bio-oil aqueous fractions: they demonstrated that the addition of Rh on Ni/Al2O3 improved H2 selectivity. Trane-Restrup and Jensen [27] investigated SR and the oxidative SR (OSR) of three cyclic model compounds, guaïacol, furfural and 2-methylfuran, at various temperatures over Ni/CeO2-K/MgAl2O4. The catalyst was active during 4 h but significant C deposition was observed, mostly in the case of guaïacol SR. OSR led to less C deposition but at the expense of H2 yield.
Generally, catalysts used in SR are Ni-based because of their high activity and low cost. However, they deactivate relatively quickly owing to C deposition and sintering. Noble metals, such as Rh, Ru, Pt and Pd, are also employed and display better resistance to deactivation for comparable activity with Ni but they are much more expensive [28]. To improve the resilience of Ni catalysts to C deposits, promotors like alkali metals are used as they enhance steam adsorption [29]. S passivation, or the addition of a noble metal, such as Au, reduces the rate of C deposits considerably by blocking the step sites [30]. Navarro et al. [31] reported that the addition of Pt enhances acetone gasification by increasing the reducibility and surface exposure of metallic Ni. Catalyst supports, such as hydrotalcite, favor the presence of small Ni particles compared to NiO/α-Al2O3 and NiO/CaO-Al2O3 catalysts [32]: the smaller the particles, the lower the C deposits. Spinel type catalysts such as NiAl2O4/Al2O3-YSZ have been reported to be effective for liquid hydrocarbon SR with high resistance to C deposits [33,34,35].
In this study, we assessed the SR of two different raw bio-oils (named MemU and WU) without adding external steam over a new patent-pending Ni-based spinel catalyst made from the mining residue UGSO [36]. The catalyst, named Ni-UGSO, has already demonstrated high activity and resilience in methane SR and dry reforming [37,38].

2. Results and Discussion

2.1. Bio-Oil Properties

Table 1 reports measured properties of the two bio-oils. These two oils behaved differently; the difference was attributed mainly to H2O content. Indeed, H2O content has a significant impact on SR and on catalyst morphology. In this study, molar H2O/C ratio was low (0.6 for MemU and 1.85 for WU) compared to other studies (2 < H2O/C < 10) where external steam was added [17,19,39] or the bio-oil aqueous fraction was used [16,24]. Nevertheless, our results were comparable or even better in terms of yields, selectivity and catalyst resistance to coke deposition. These points are detailed below.

2.2. Steam Reforming Results

The SR results of the two bio-oils appear in Figure 1 and Figure 2. They showed that:
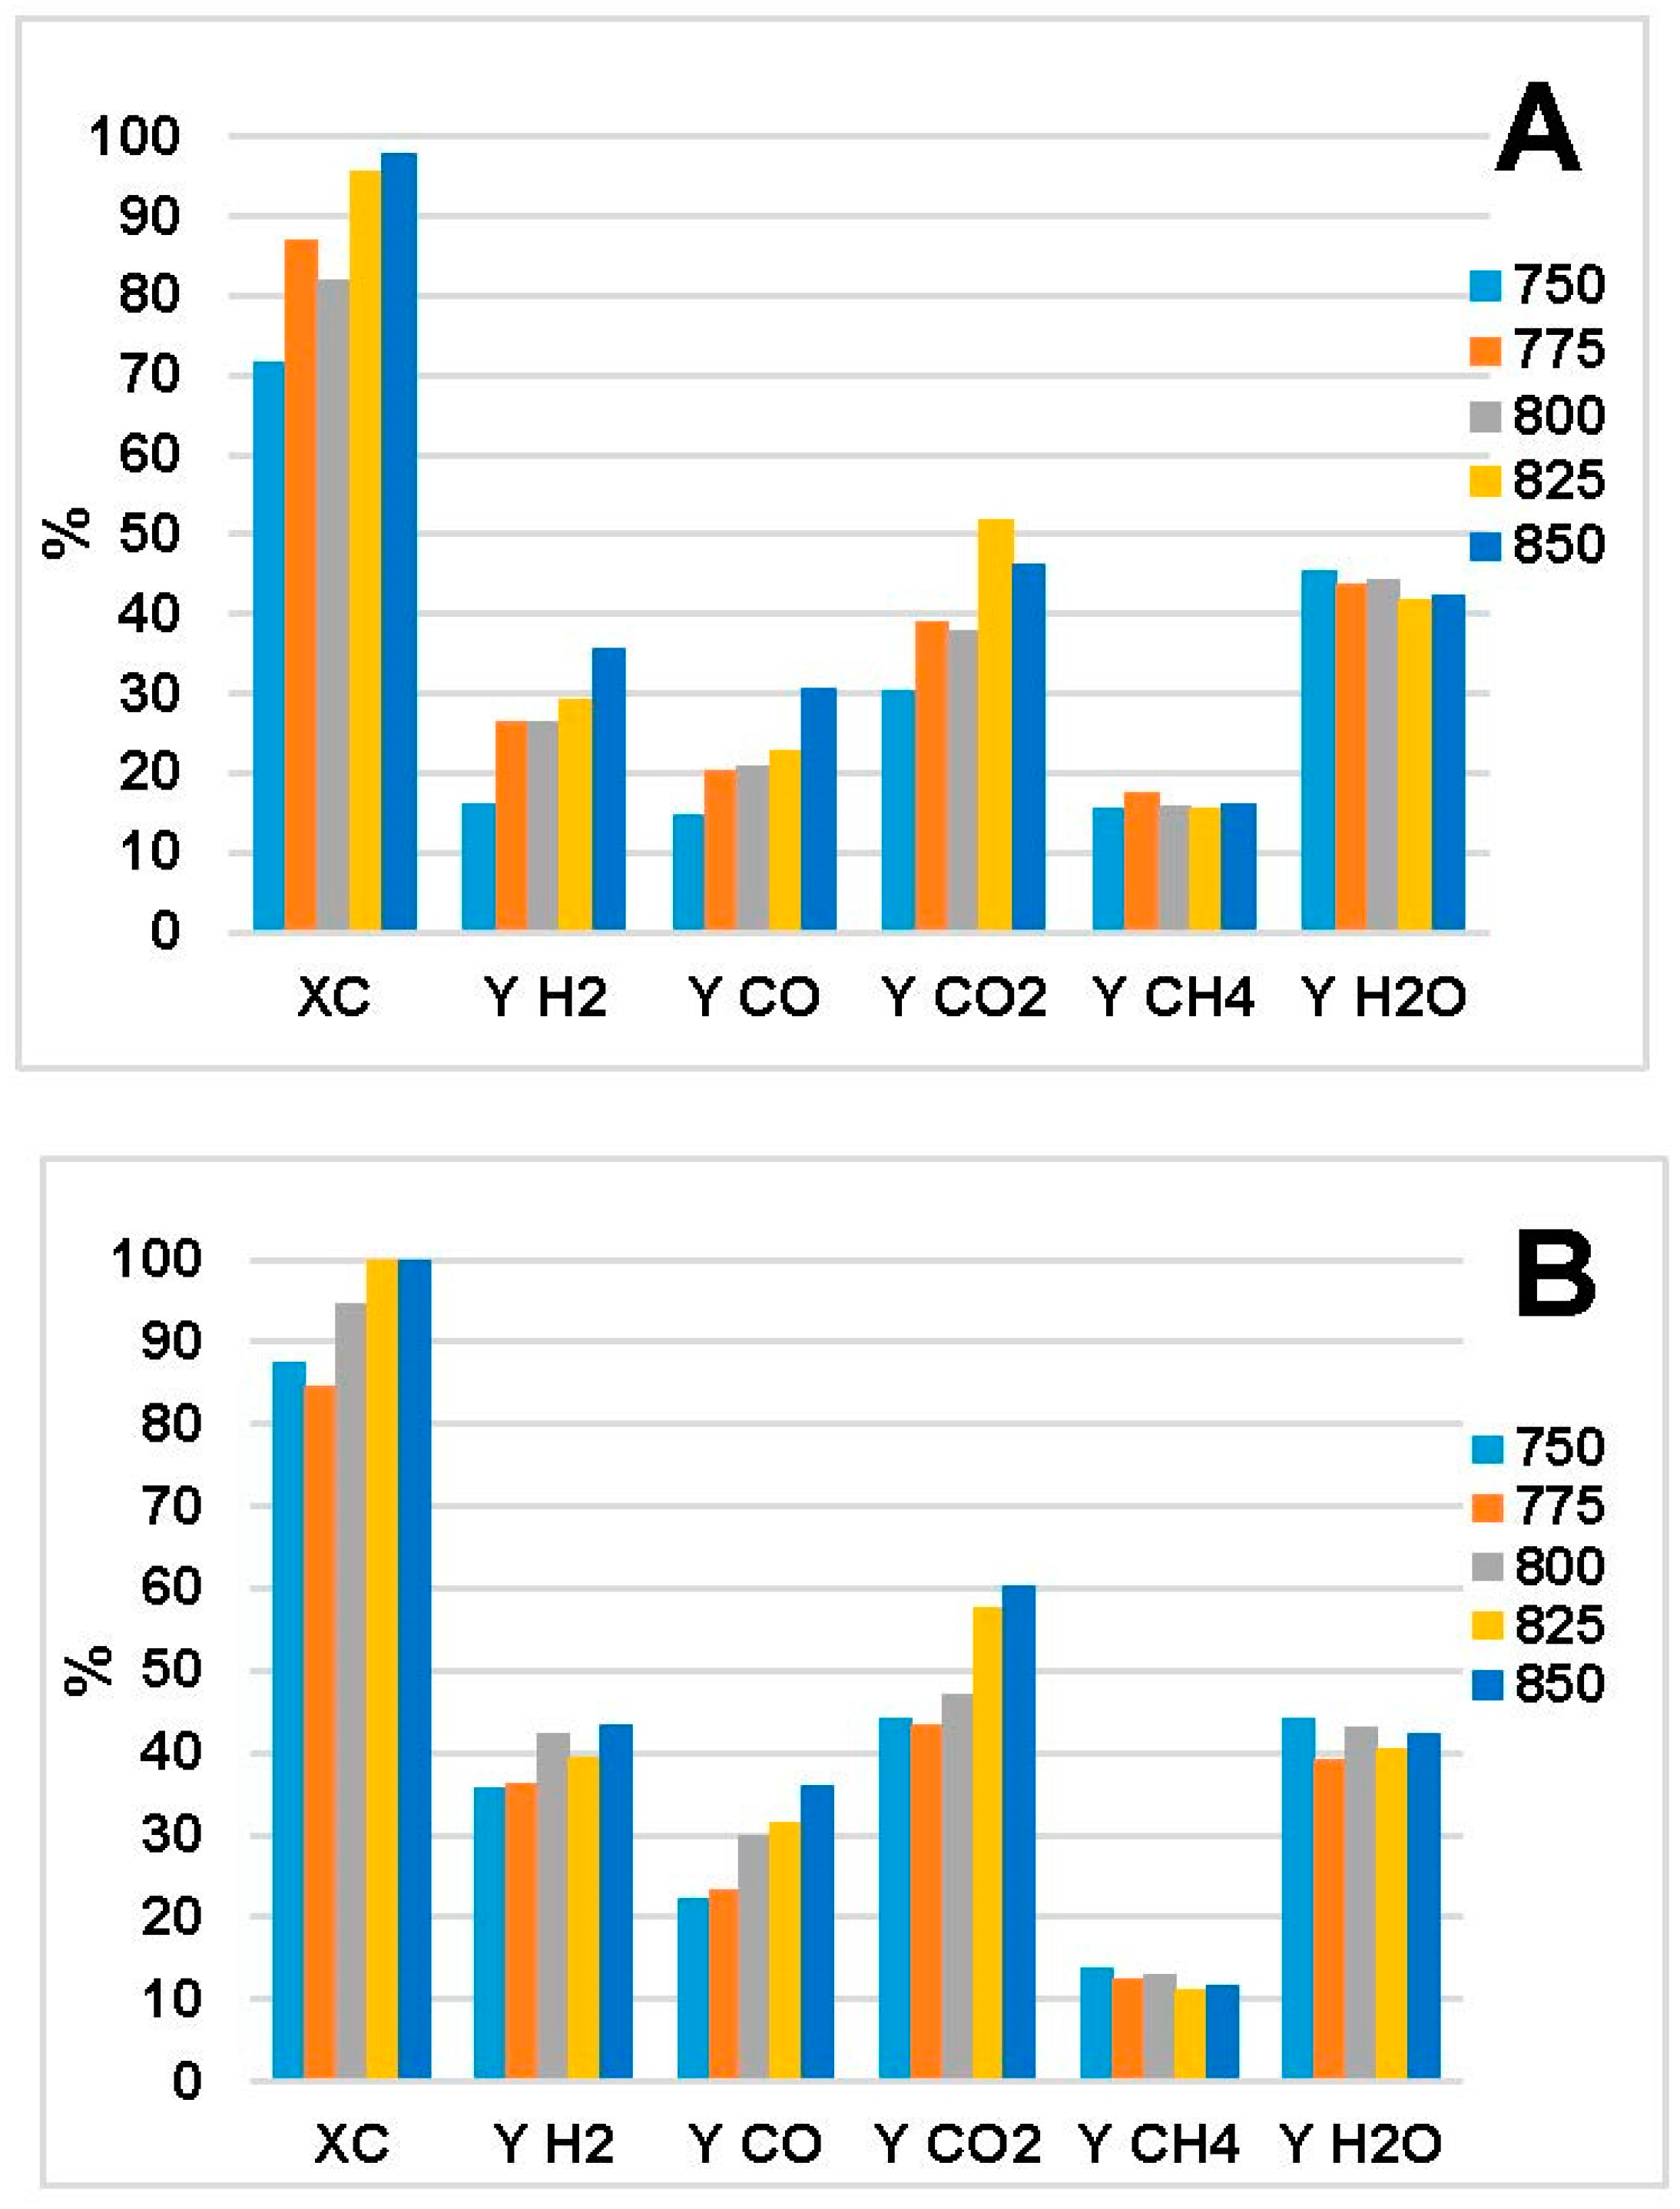
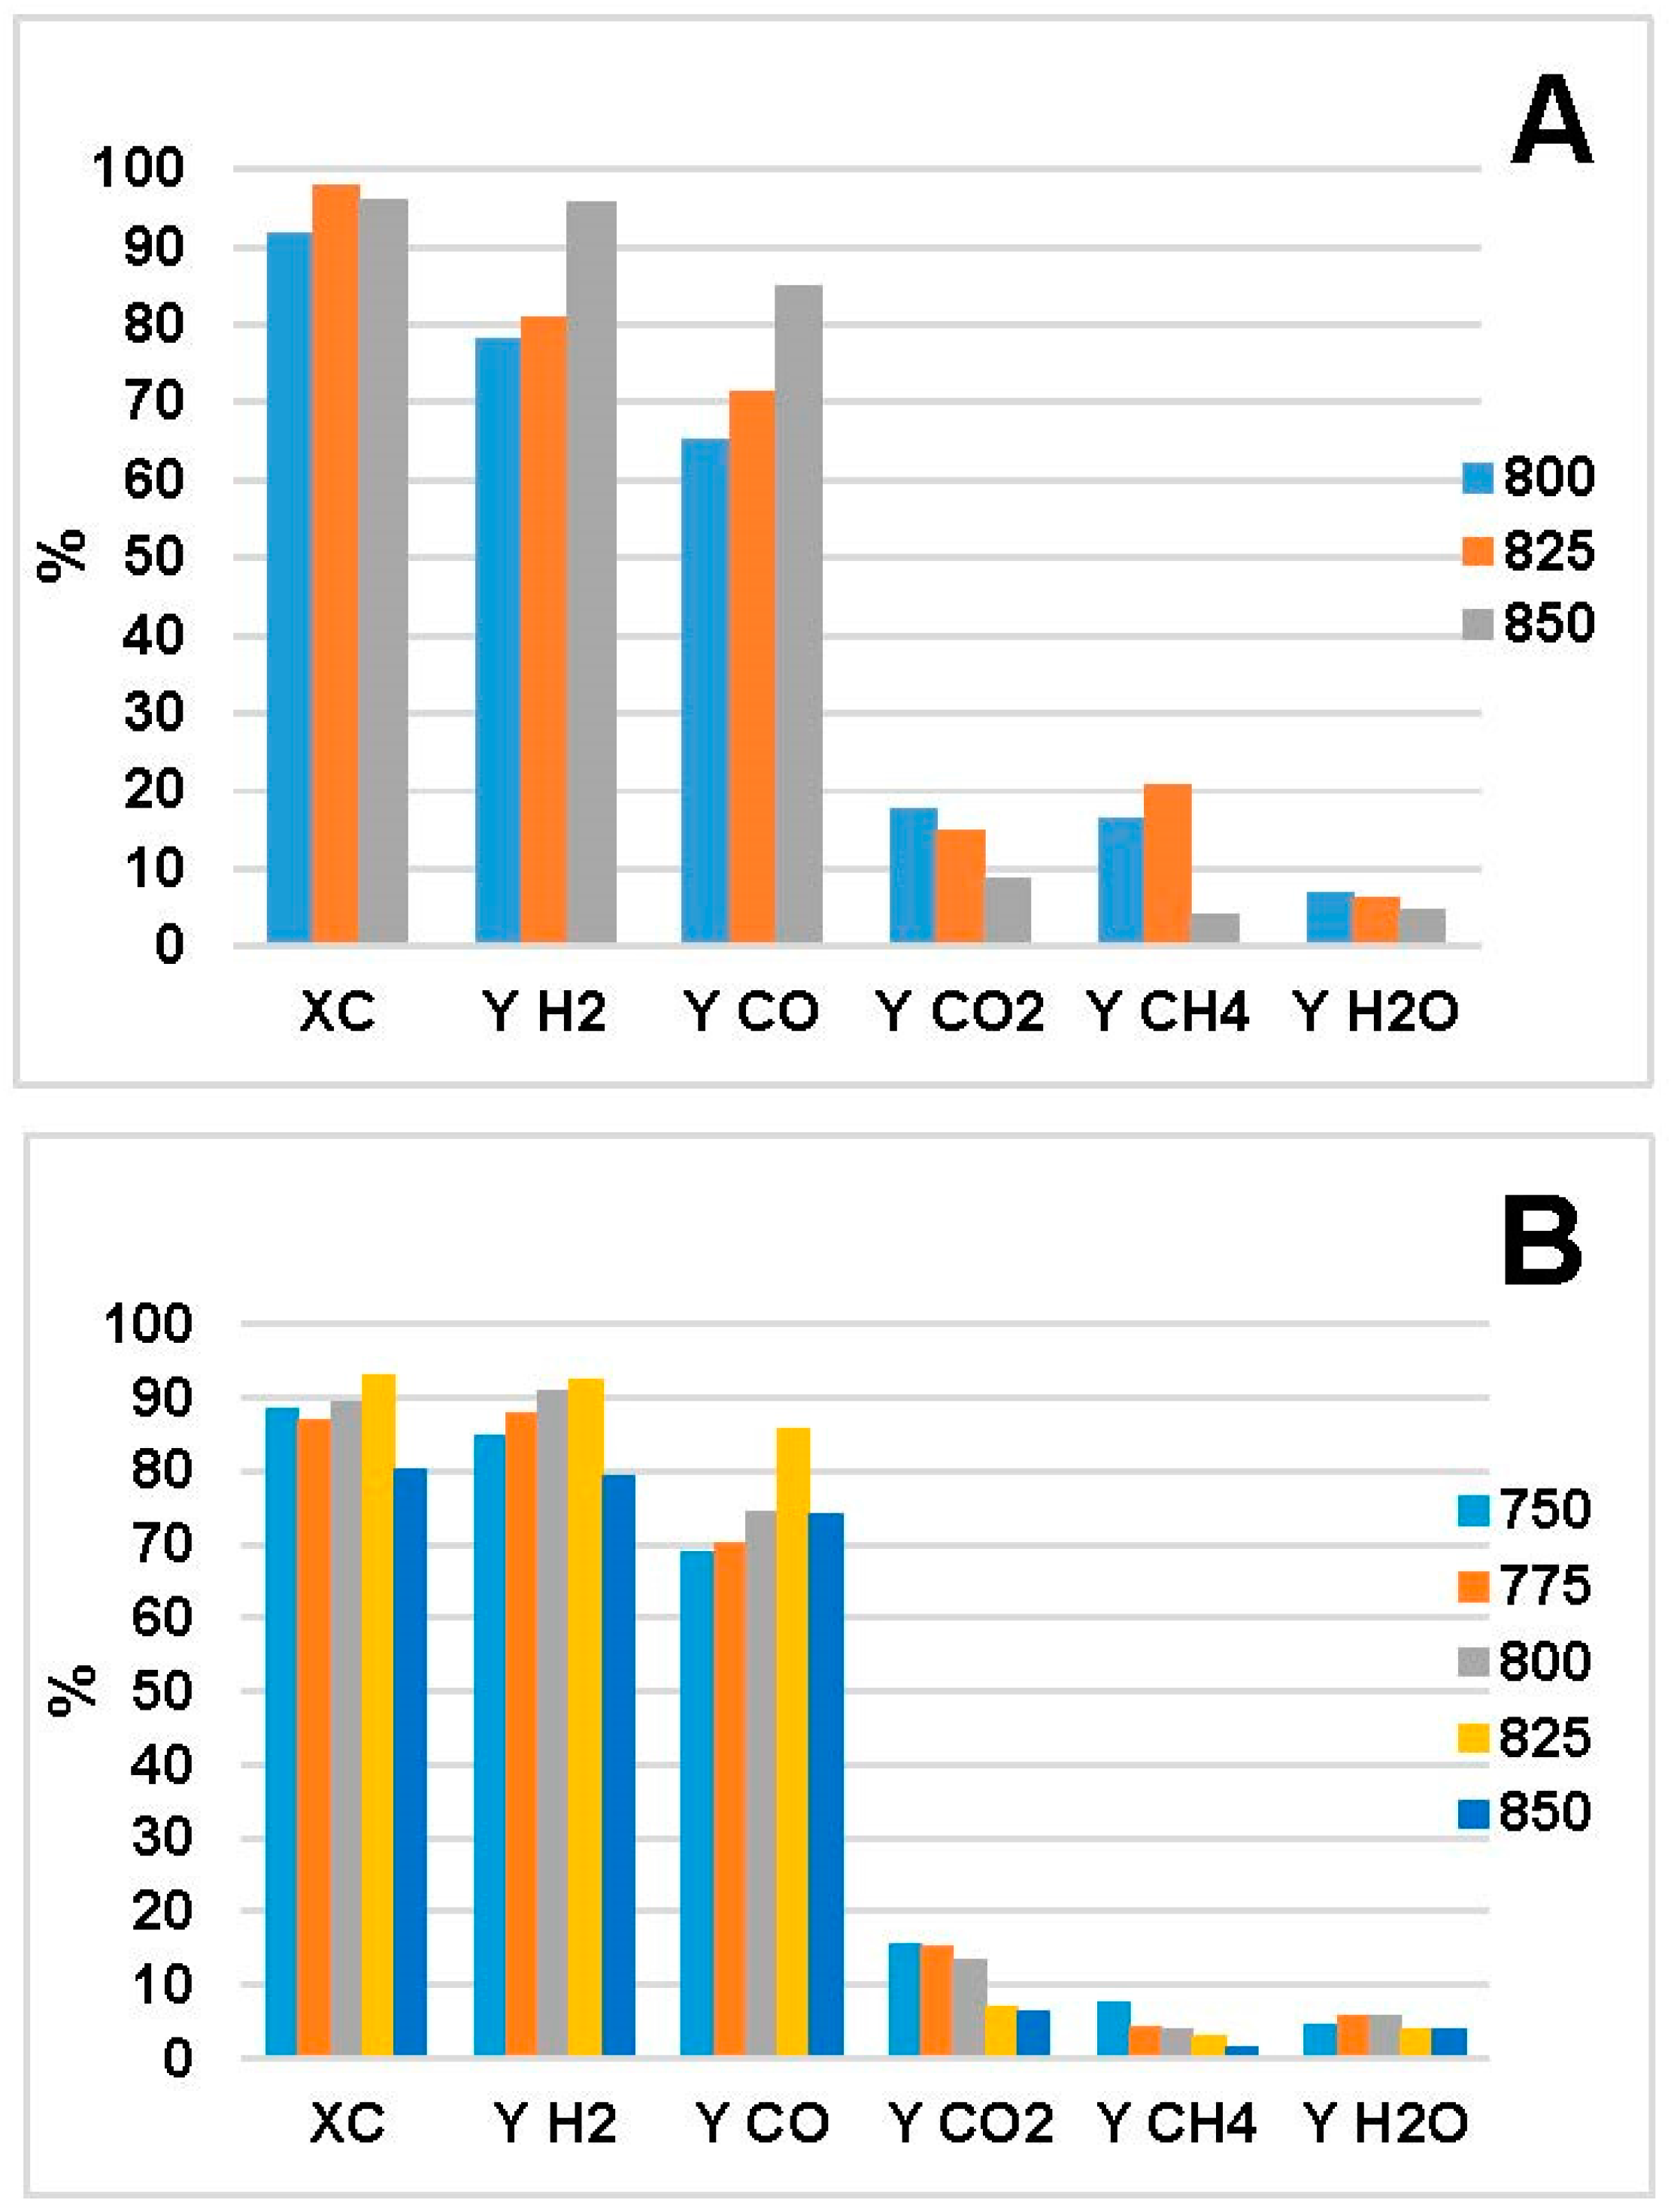
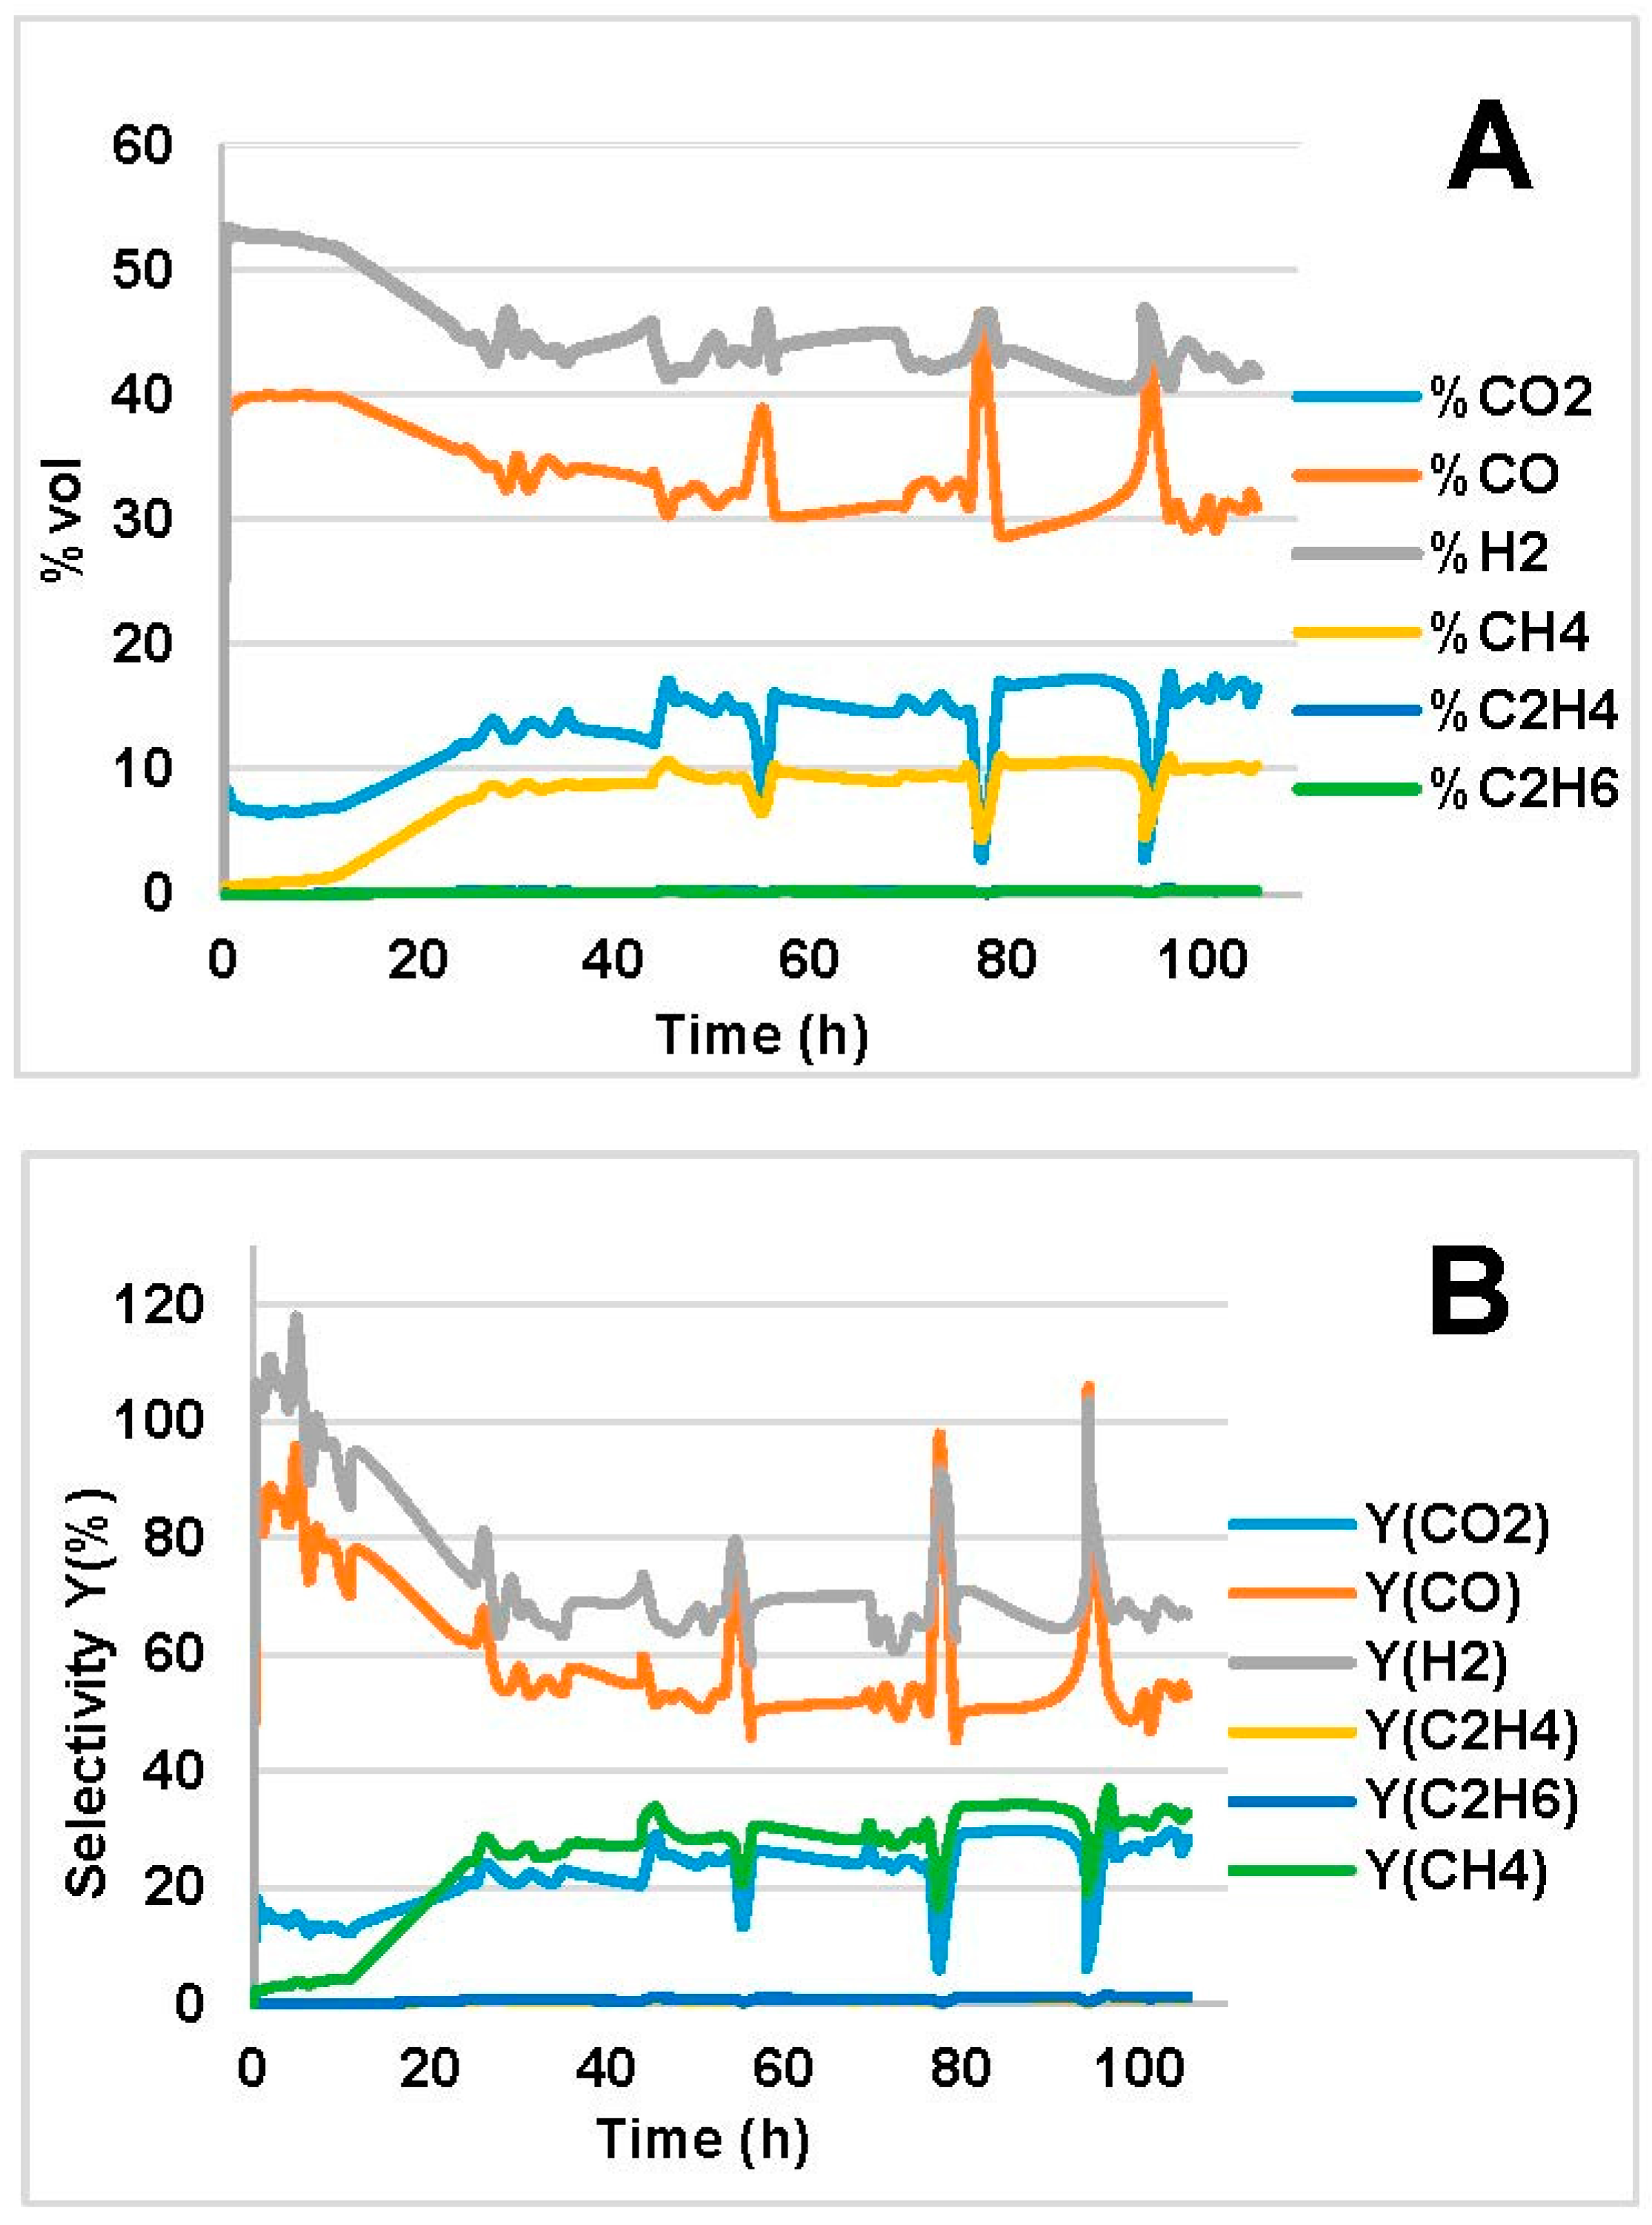
  • Increased temperature evoked higher C conversion (XC), CO and H2 yields ( Y CO , Y H 2 ) for both bio-oils. This was in agreement with the thermodynamic analysis of bio-oil model compounds studied by many authors [20,23,40] where it is found that the reaction is endothermic. The decrease in XC, Y CO and Y H 2 at 850 °C in Figure 1B is an outlier; we attribute that to experimental errors, which led to higher error in the mass balance than the average.
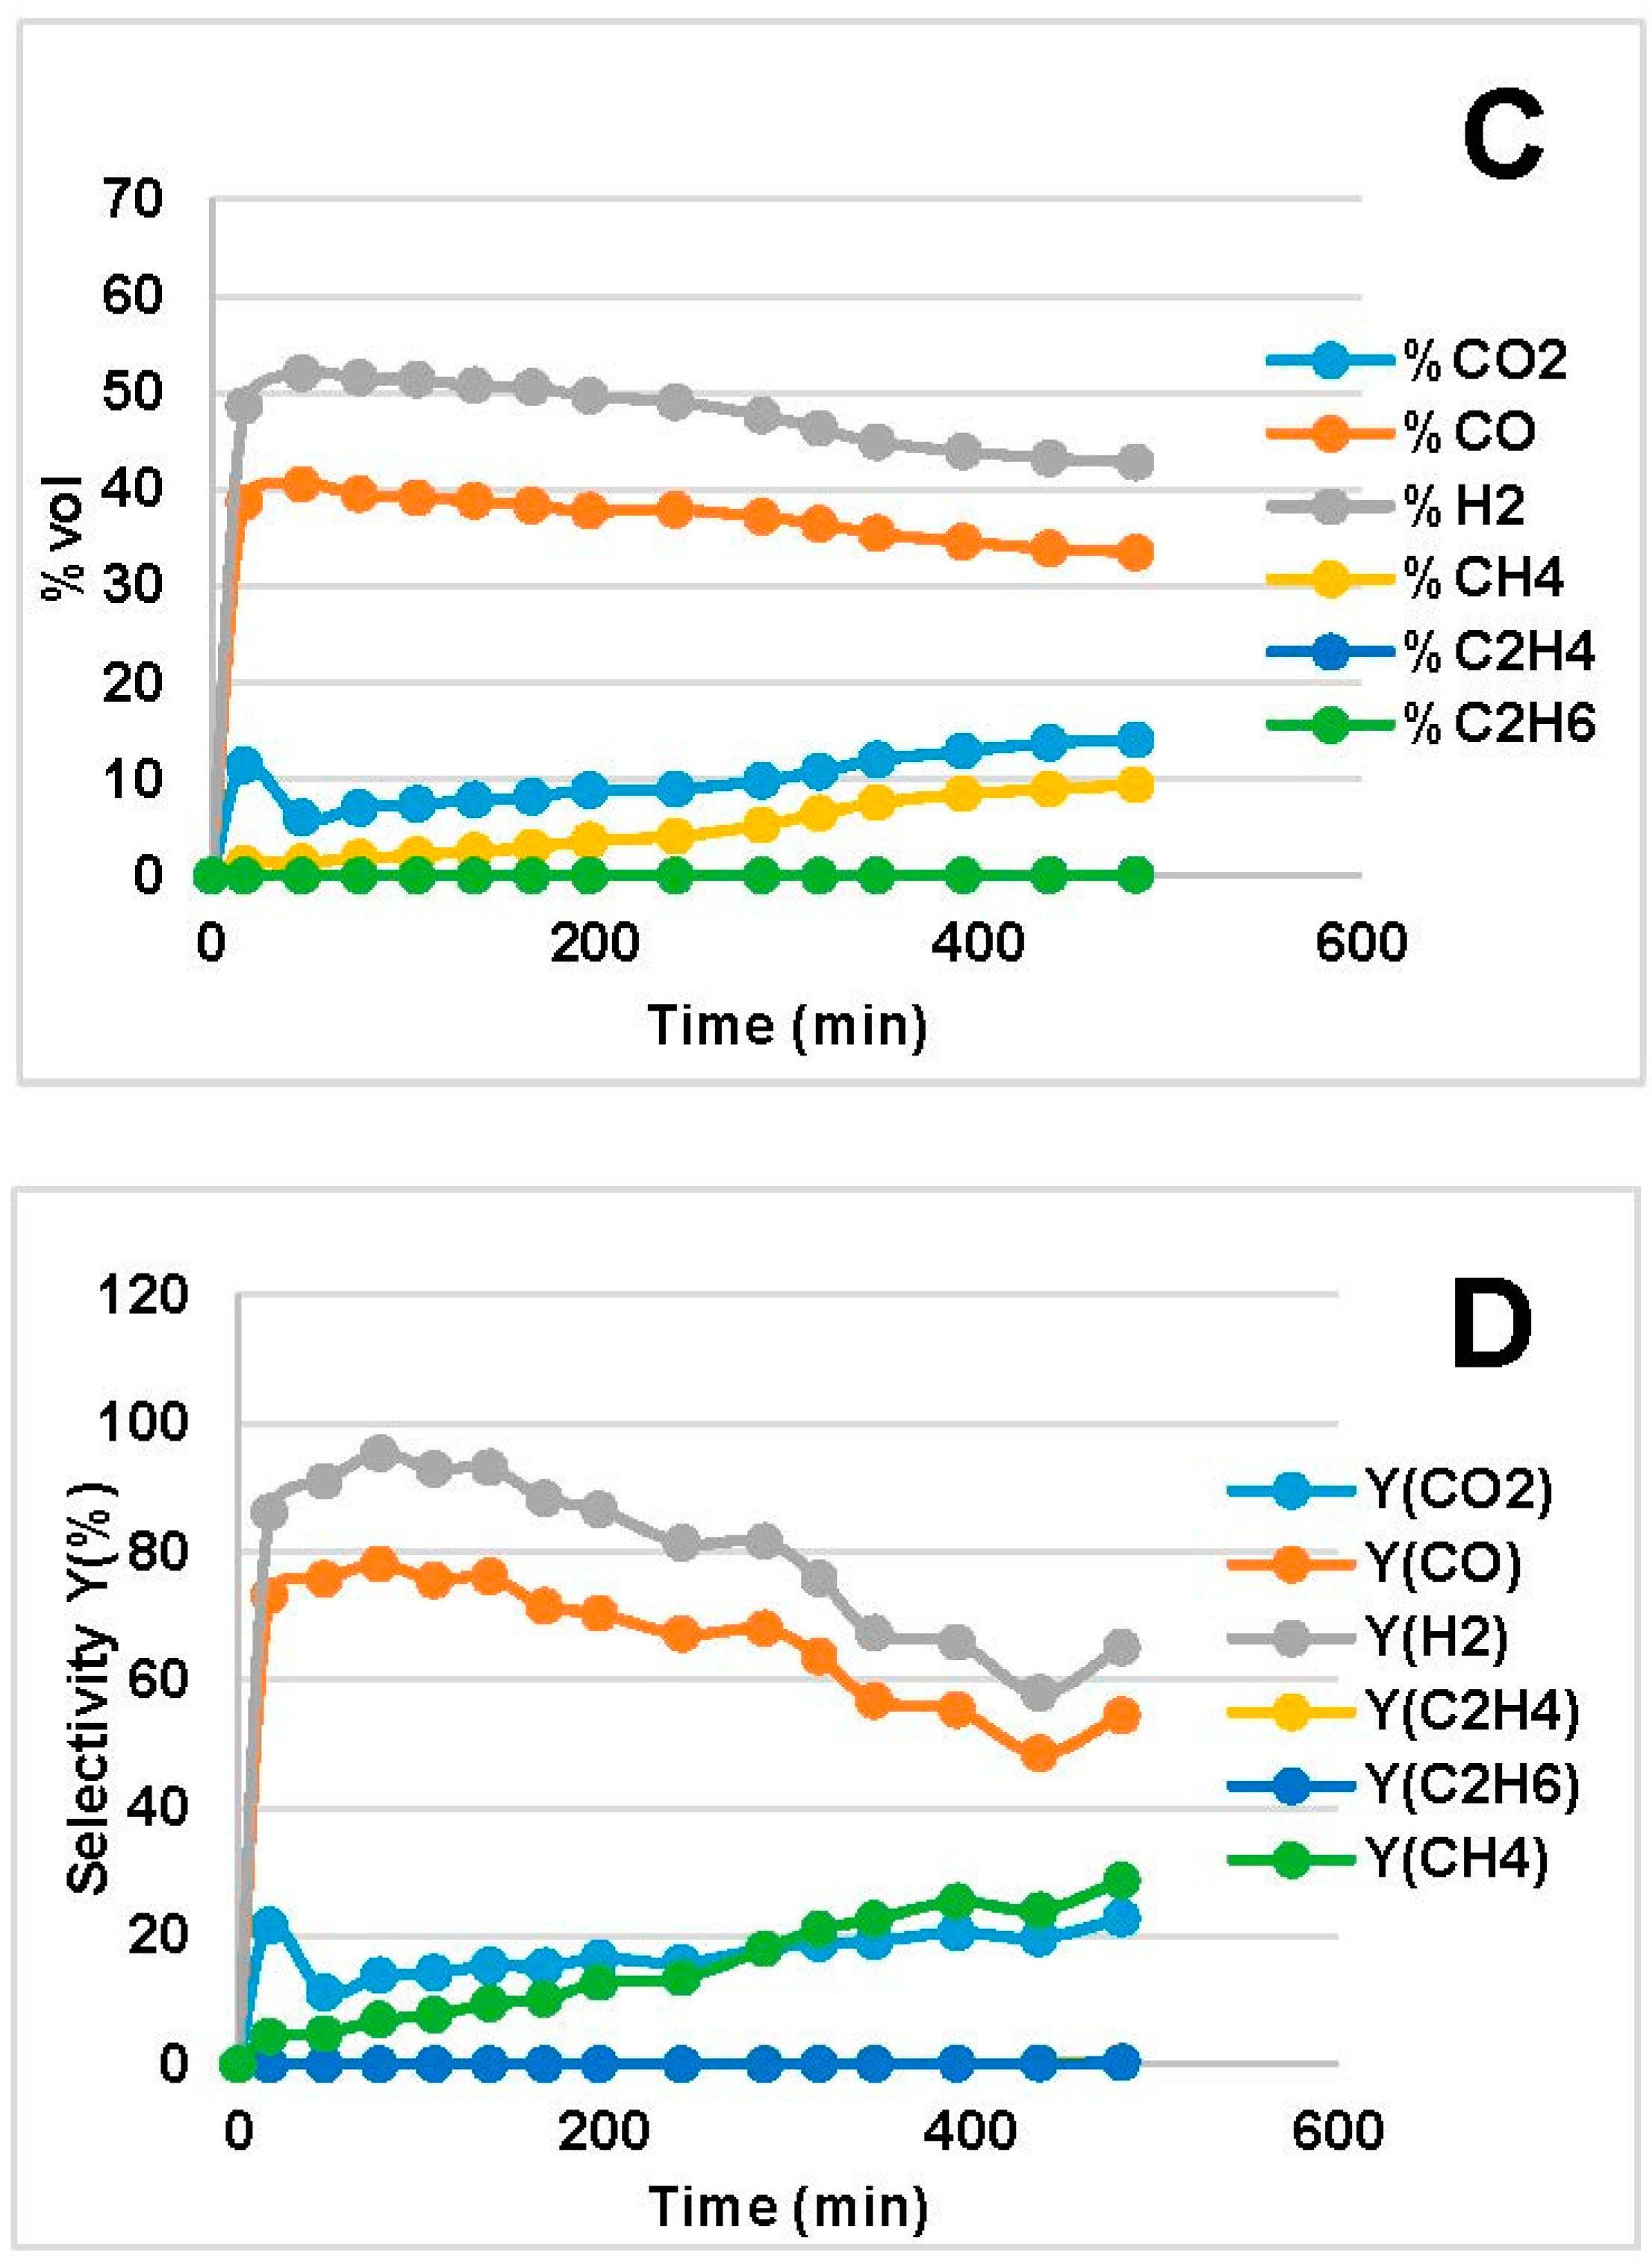
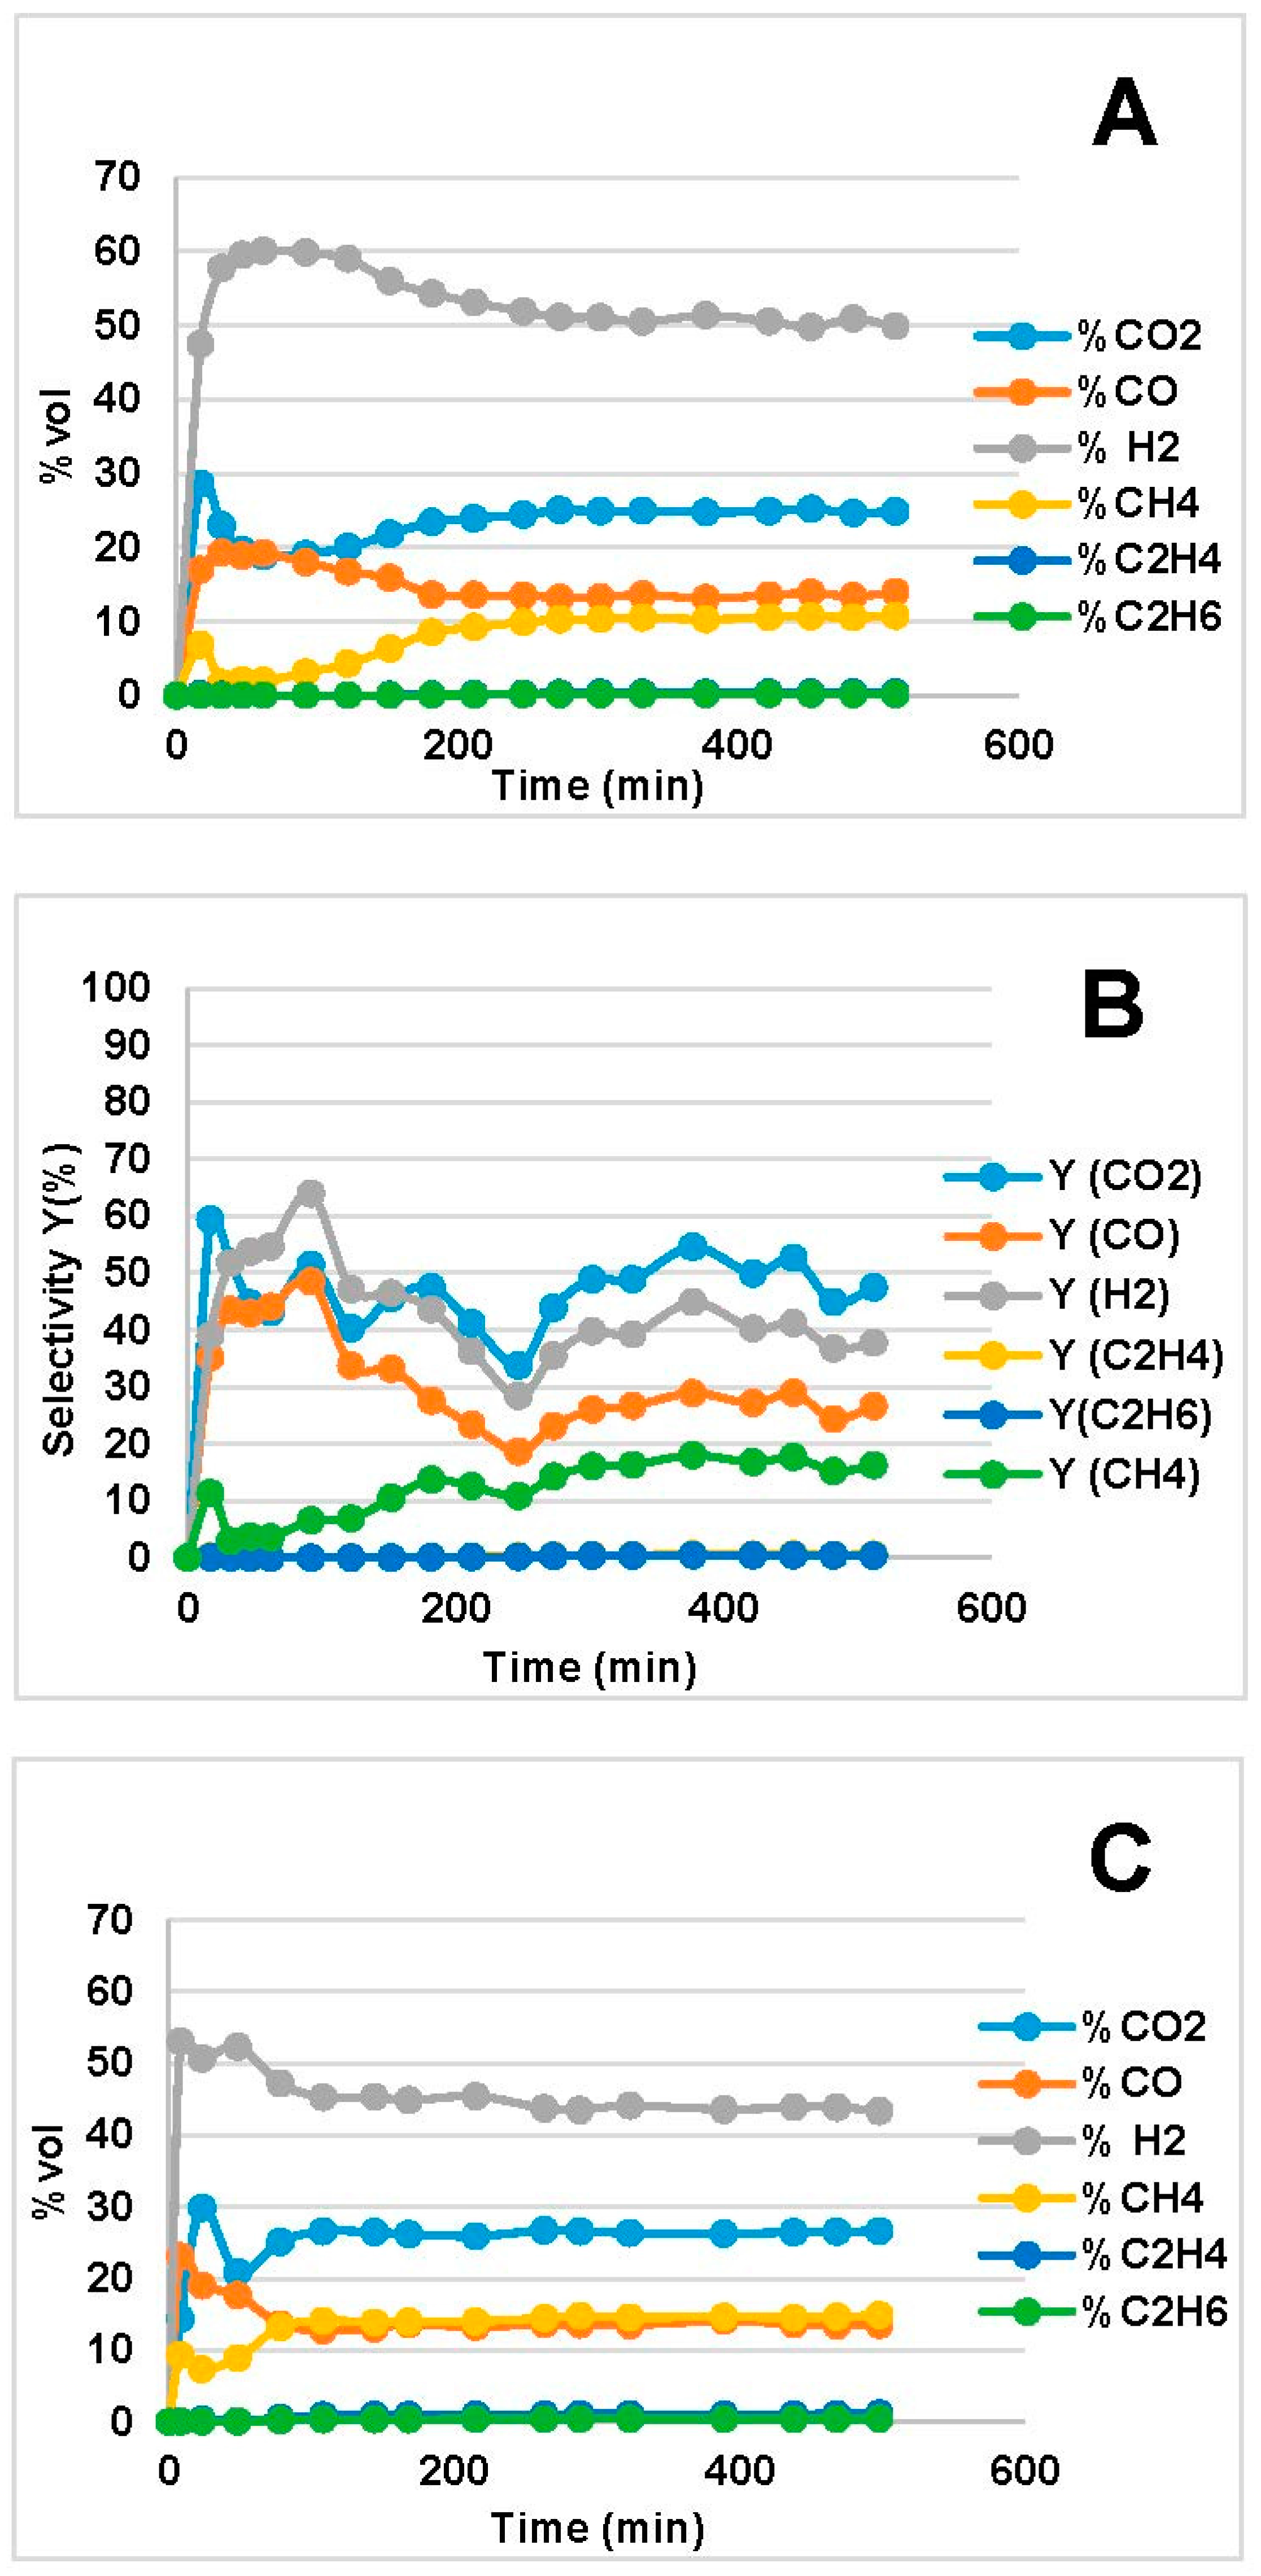
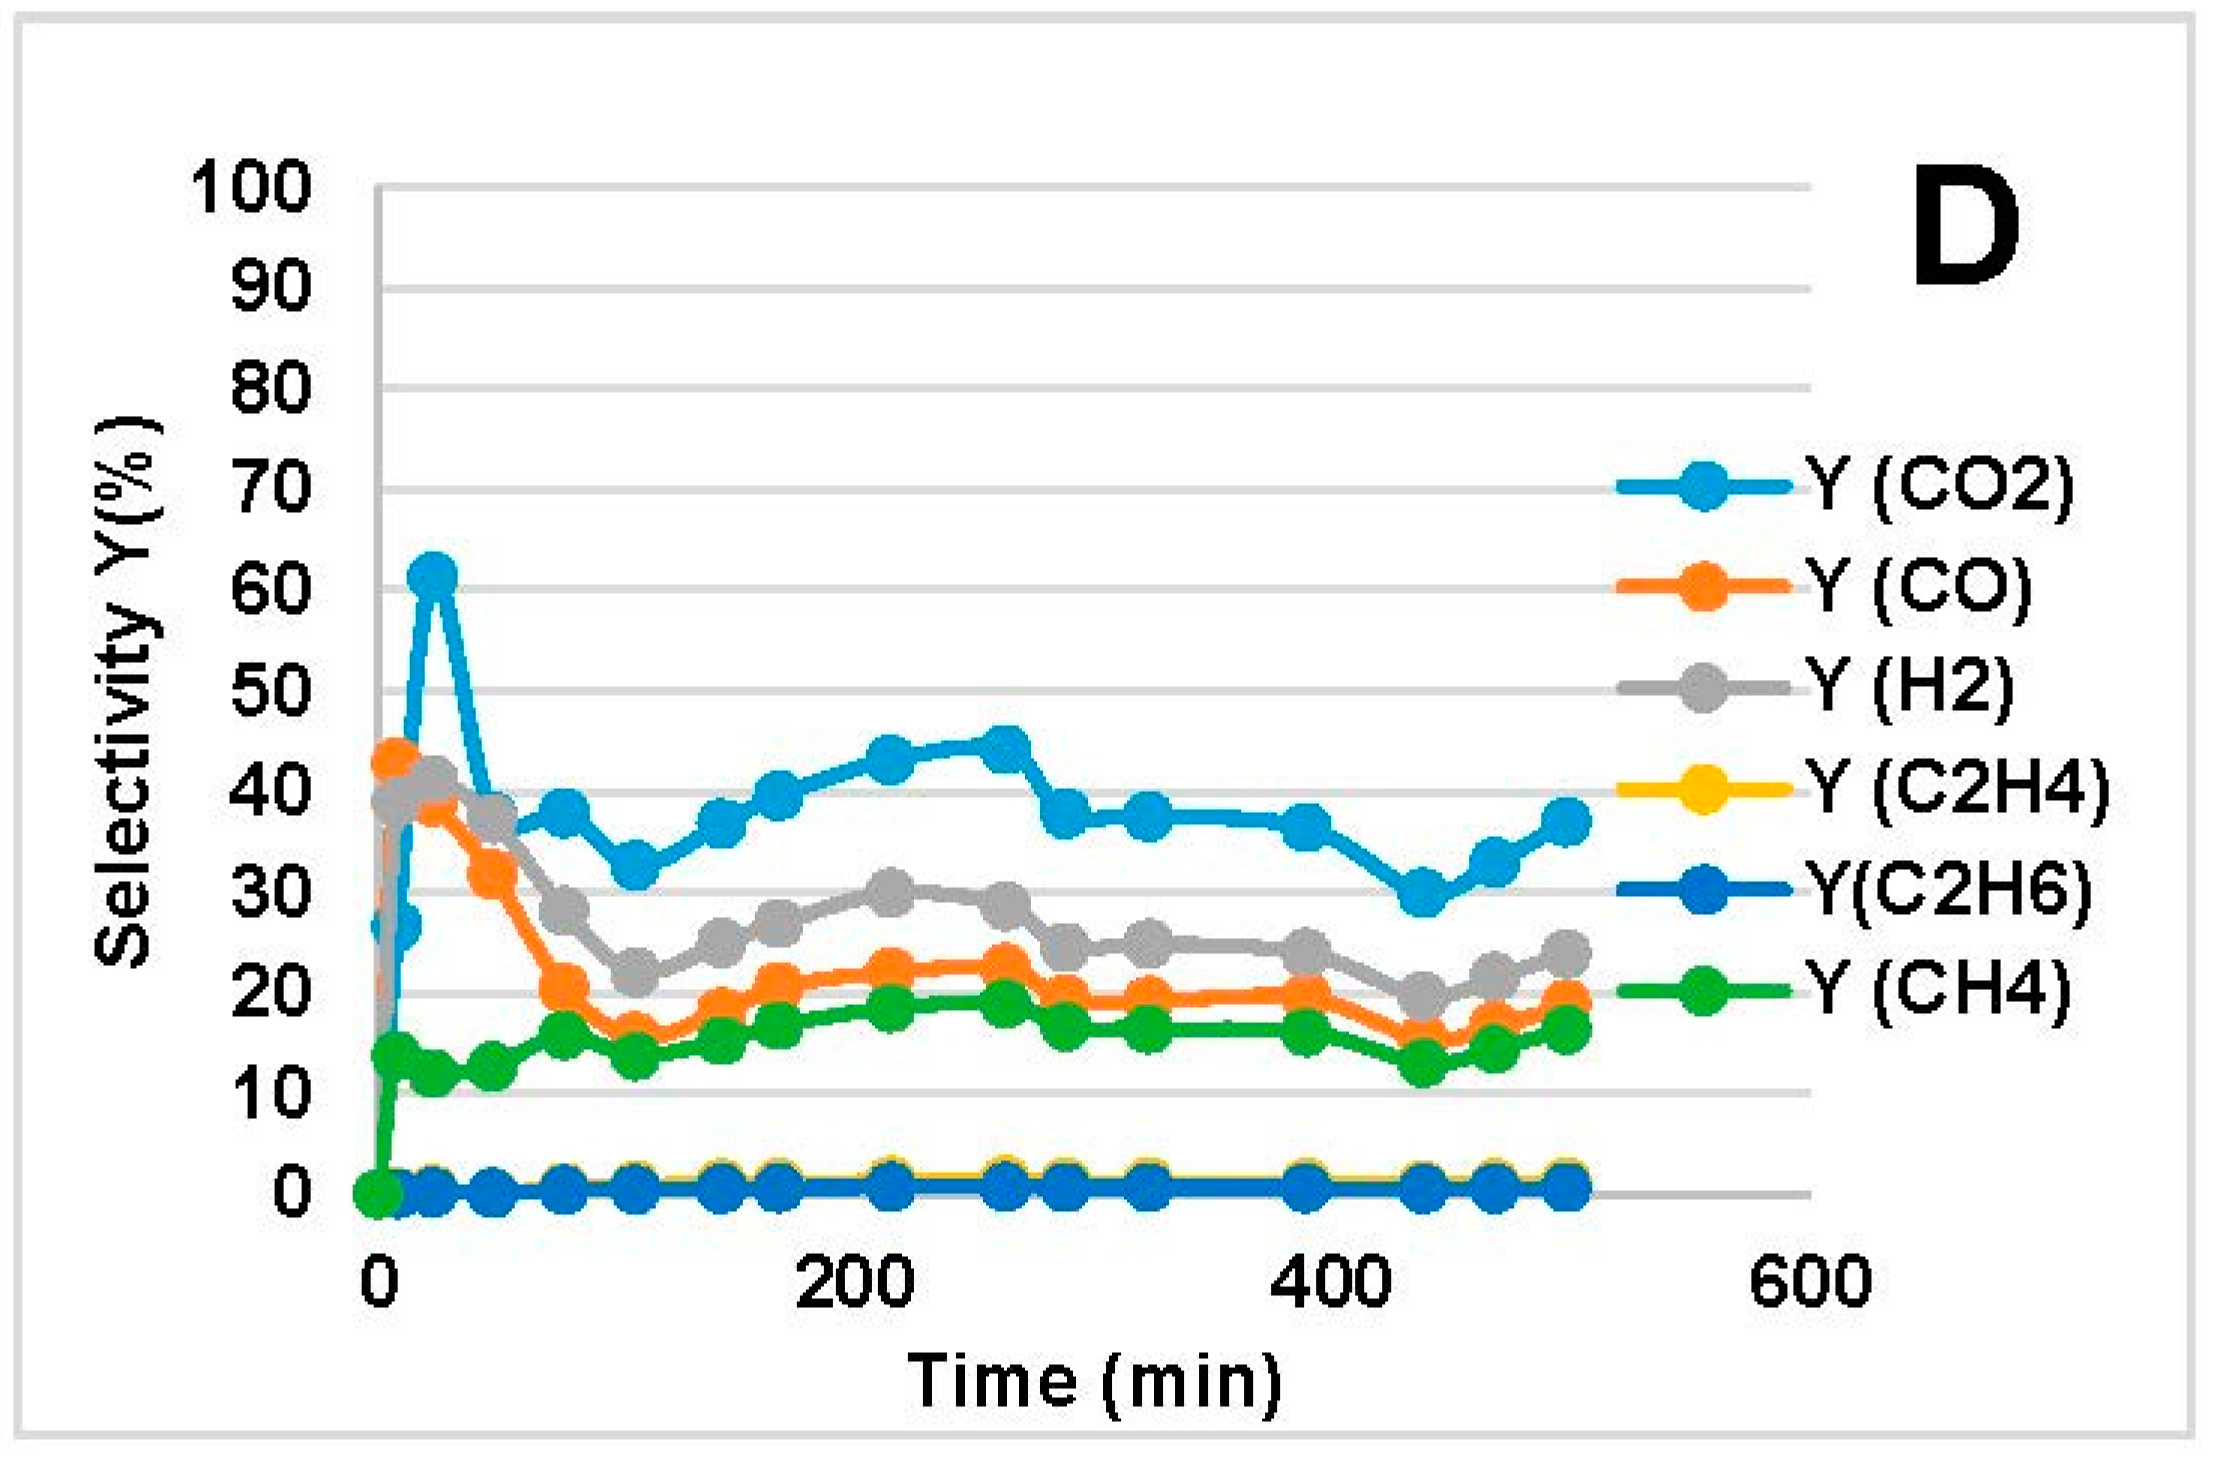
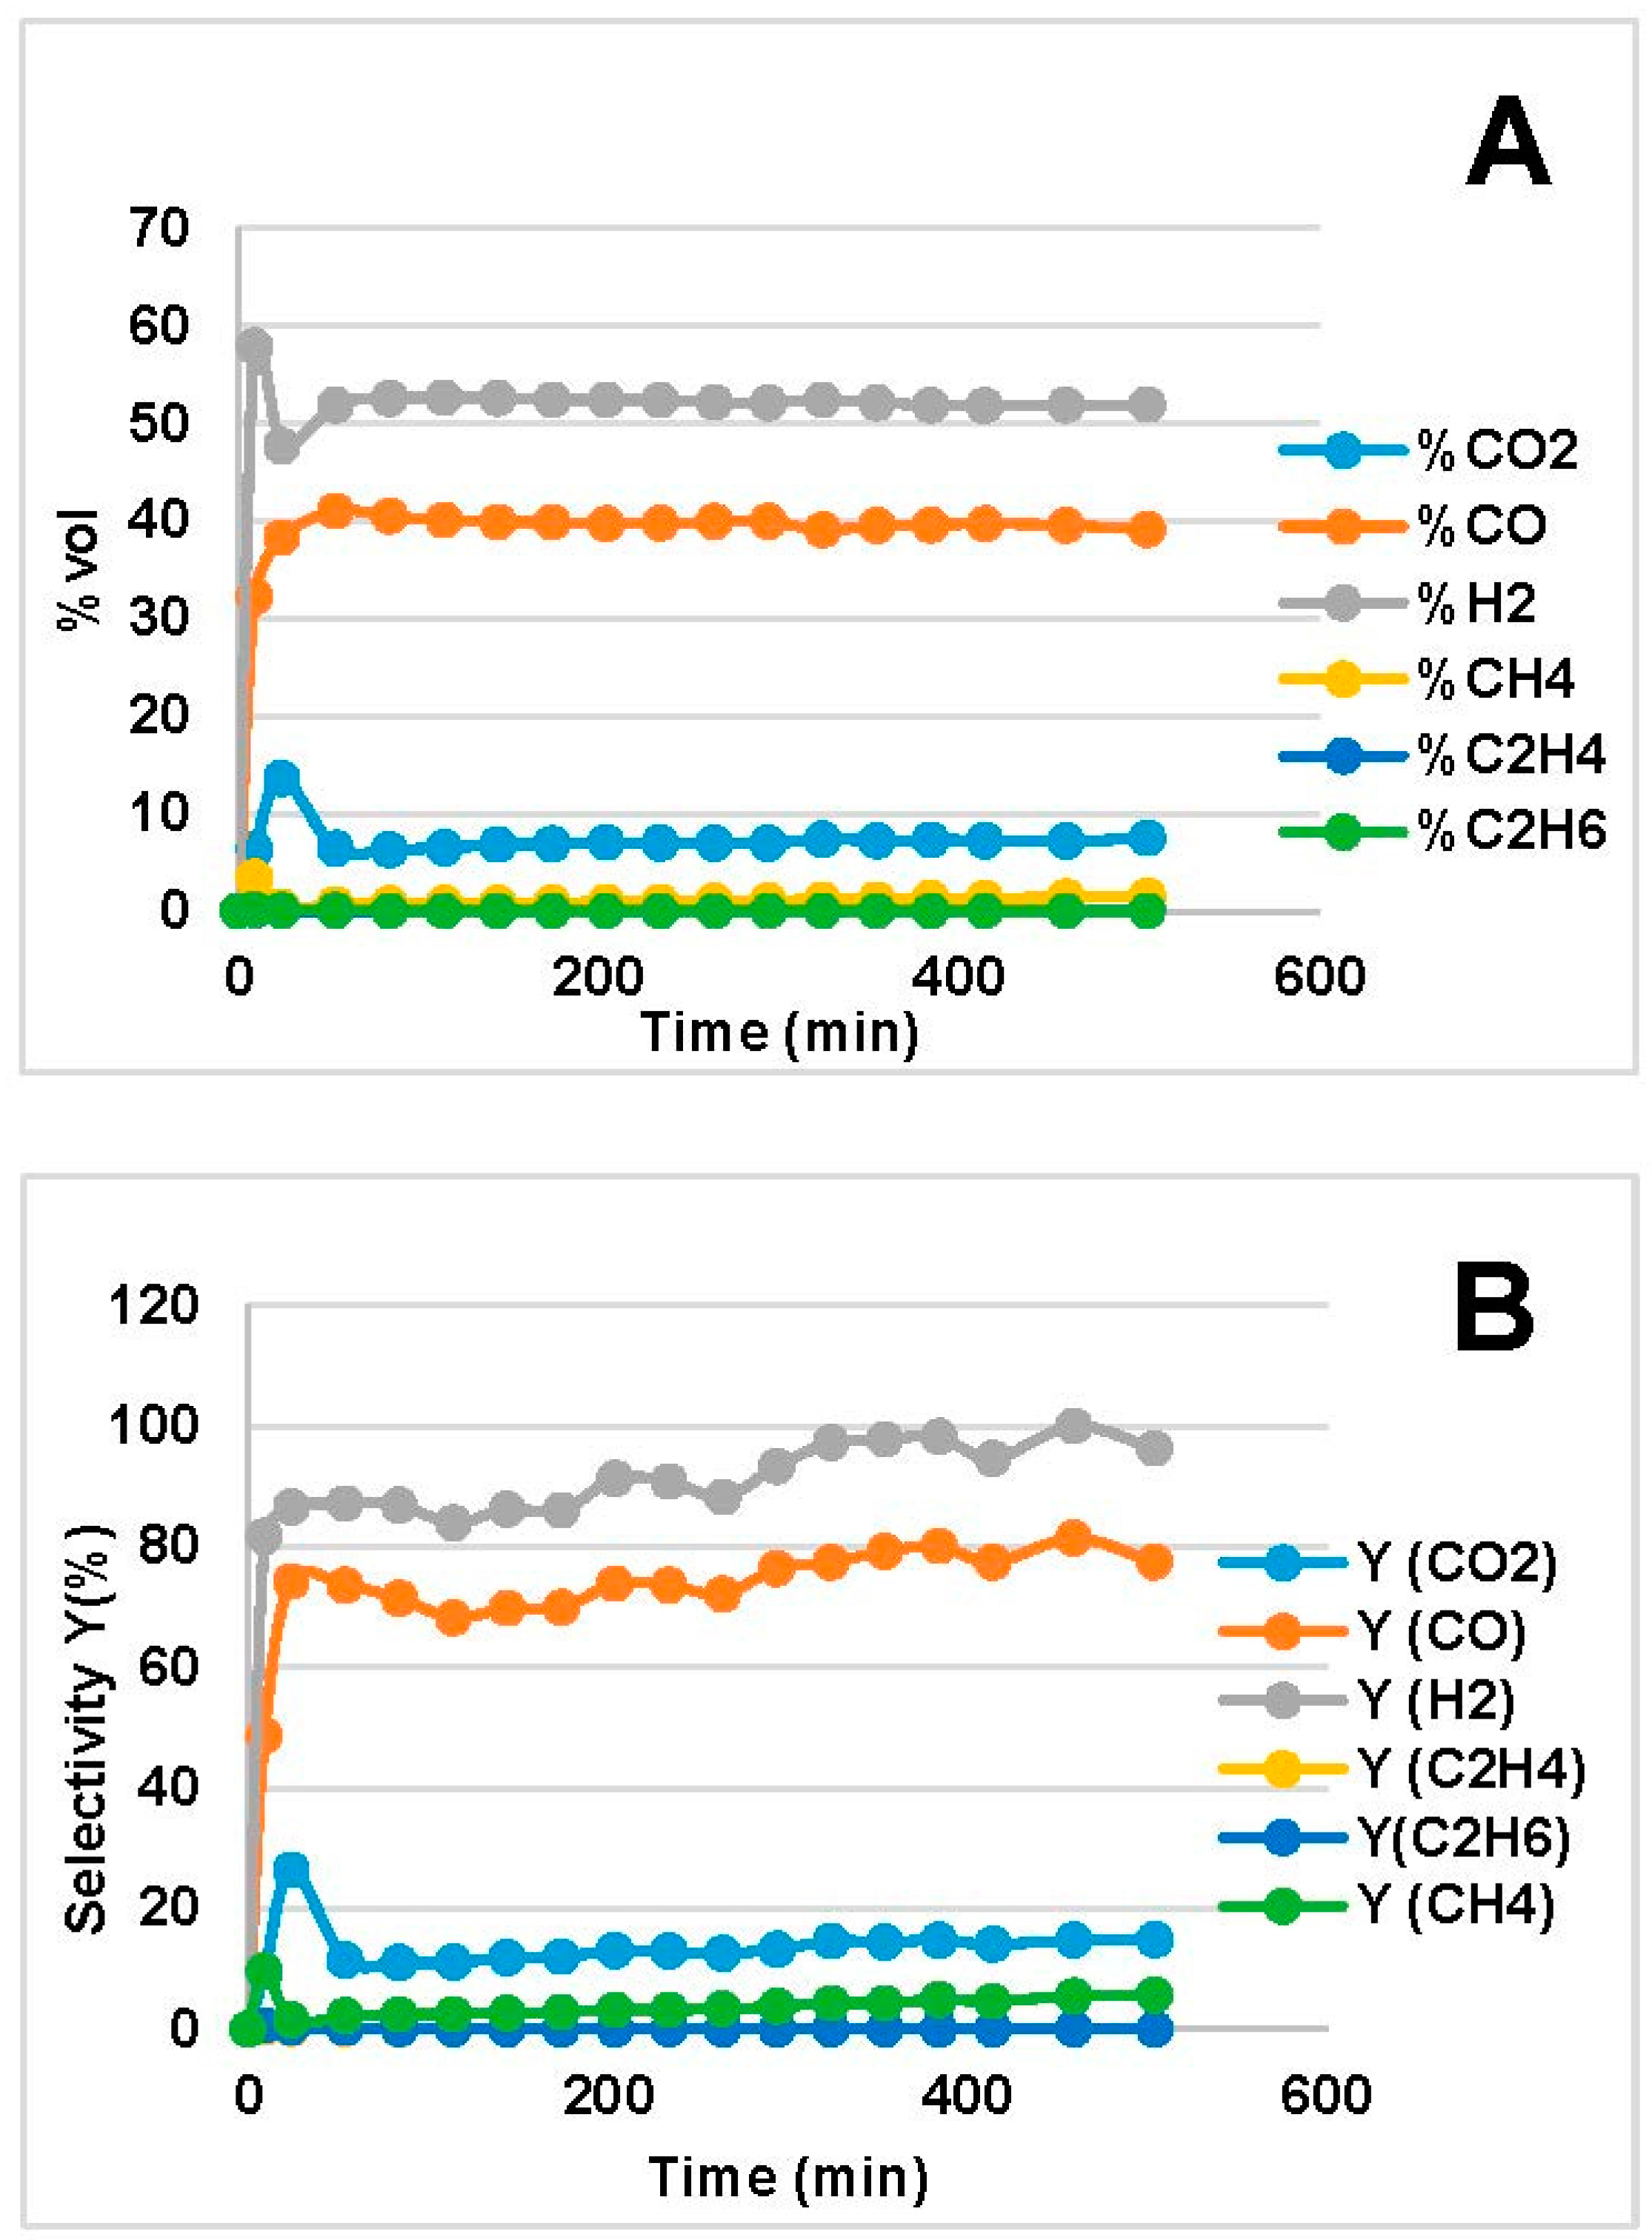
  • CO and H2 were favored at low WHSV because of increased residence time over the catalyst bed. In the MemU bio-oil (Figure 3), we observe a decrease of CO2. A higher CO, H2 production through reforming means that there is a higher H2O consumption. If the increase of CO and H2 is equal, the WGS reaction (CO + H2O = CO2 + H2) will shift in such a way to compensate the H2O decrease; this means that the CO2 will decrease. This is the case for the MemU oil whose H2O/C is low; thus, the consumption of H2O by the reforming reaction has a higher impact on WGS. In the case of WU, we do not observe this behavior because the H2O/C is much higher.
  • The amount of H2O and O in the two bio-oils had a significant impact on SR performance. Comparison of bio-oil MemU (Figure 1) and bio-oil WU (Figure 2) showed that the former gave better results in terms of H2 selectivity (up to 94%) and CO selectivity (up to 84%), while selectivity was maximum 43% and 36%, respectively, for bio-oil WU SR. It appeared that a ratio of O/C ≈ 1 (bio-oil MemU) was good enough for SR with Ni-UGSO compared to O/C ≈ 3 (bio-oil WU), which suggested that the catalyst was more active at low H2O or O content.
The low selectivity of CO and H2 after bio-oil WU SR were due to high O and H2O content (%O = 73%, %H2O = 52.3%, O/C ≈ 3). CO was converted to CO2 through WGS (Equation (2)), and the presence of Fe in the catalyst is known to catalyze the reaction. Non-converted H remained as H2O or was transformed to CH4 via cracking (Equation (4)). Moreover, the high oxygen and H2O content rather limited Ni reduction and activation because of the oxidative atmosphere, which also explained the high CH4 selectivity.
Figure 3 and Figure 4 show the evolution of concentration and selectivity over time-on-stream (TOS) for the SR of both bio-oils at 800 °C and at two different WHSV. With bio-oil WU (Figure 3), we observed that CO and H2 concentrations rapidly reached maximum, then decreased slightly to stabilize at a quasi-steady-state. At high WHSV, steady state was reached more quickly while concentration and selectivity of CO and H2 were lower; this was corroborated by higher CO2 and CH4 concentration and selectivity. Similar profiles were observed for all temperatures at high and low WHSV. A state of equilibrium between active-phase NiO and oxidized Ni2+ may explain these profiles. Indeed, in the first steps of the reaction, there was a transient state during which Ni2+ involved in the spinels was reduced partially to Ni0 by the bio-oil and syngas produced. Then, as the reaction continued over time, the amount of H2O increased inside the reactor which first re-oxidized a part of Ni0 into Ni2+ [41] and favored sintering of Ni particles [42]. We consider that this mechanism, which was explained in detail by Braidy et al. [43] for methane SR over Ni/Al2O3-YSZ spinel catalyst, also prevails in the case of the Ni-UGSO catalyst.
In the case of bio-oil MemU SR (Figure 4), the catalyst demonstrated high stability at low WHSV. Concentration and selectivity (to a lesser extent) remained constant for the entire test duration. However, at high WHSV, we observed a gradual loss of activity after a first period of stability. This deactivation was attributed to filamentous C formed over the catalyst, as it is shown in the next section of catalyst characterization.
Table 2 displays some results obtained by research groups on bio-oils catalytic steam reforming. The conditions vary which makes the comparison rather difficult. Although, in all cases found in the literature, the tests conditions are more favourable than those in our experiments (see Table 2), the catalyst tested and reported here is at least equally efficient.
Figure 5 and Table 3 display the results of long-term testing (105 h) of bio-oil MemU SR at 800 °C and WHSV = 2.0 g/gcat/h. The catalyst exhibited the highest activity in the first 12 h, during which period CO and H2 concentrations and selectivity were maximum. During the period between 12 and 30 h, the catalyst underwent a sudden loss of activity. Therefore, CO and H2 concentration and selectivity had decreased in favor of CO2 and CH4. This was attributed to C formation. Catalytic activity remained constant from 30 to 105 h. The result was atypical, because, usually, when deactivation starts, it generally progresses more rapidly over TOS. In our case, it seems that the catalyst was in a state of equilibrium which was a function of operating conditions. This was a very important result and showed that the reaction mechanism was similar to the one explained by Braidy et al. [43]. Nevertheless, further investigations are needed to confirm our highly-plausible speculation.

2.3. Catalyst Characterization

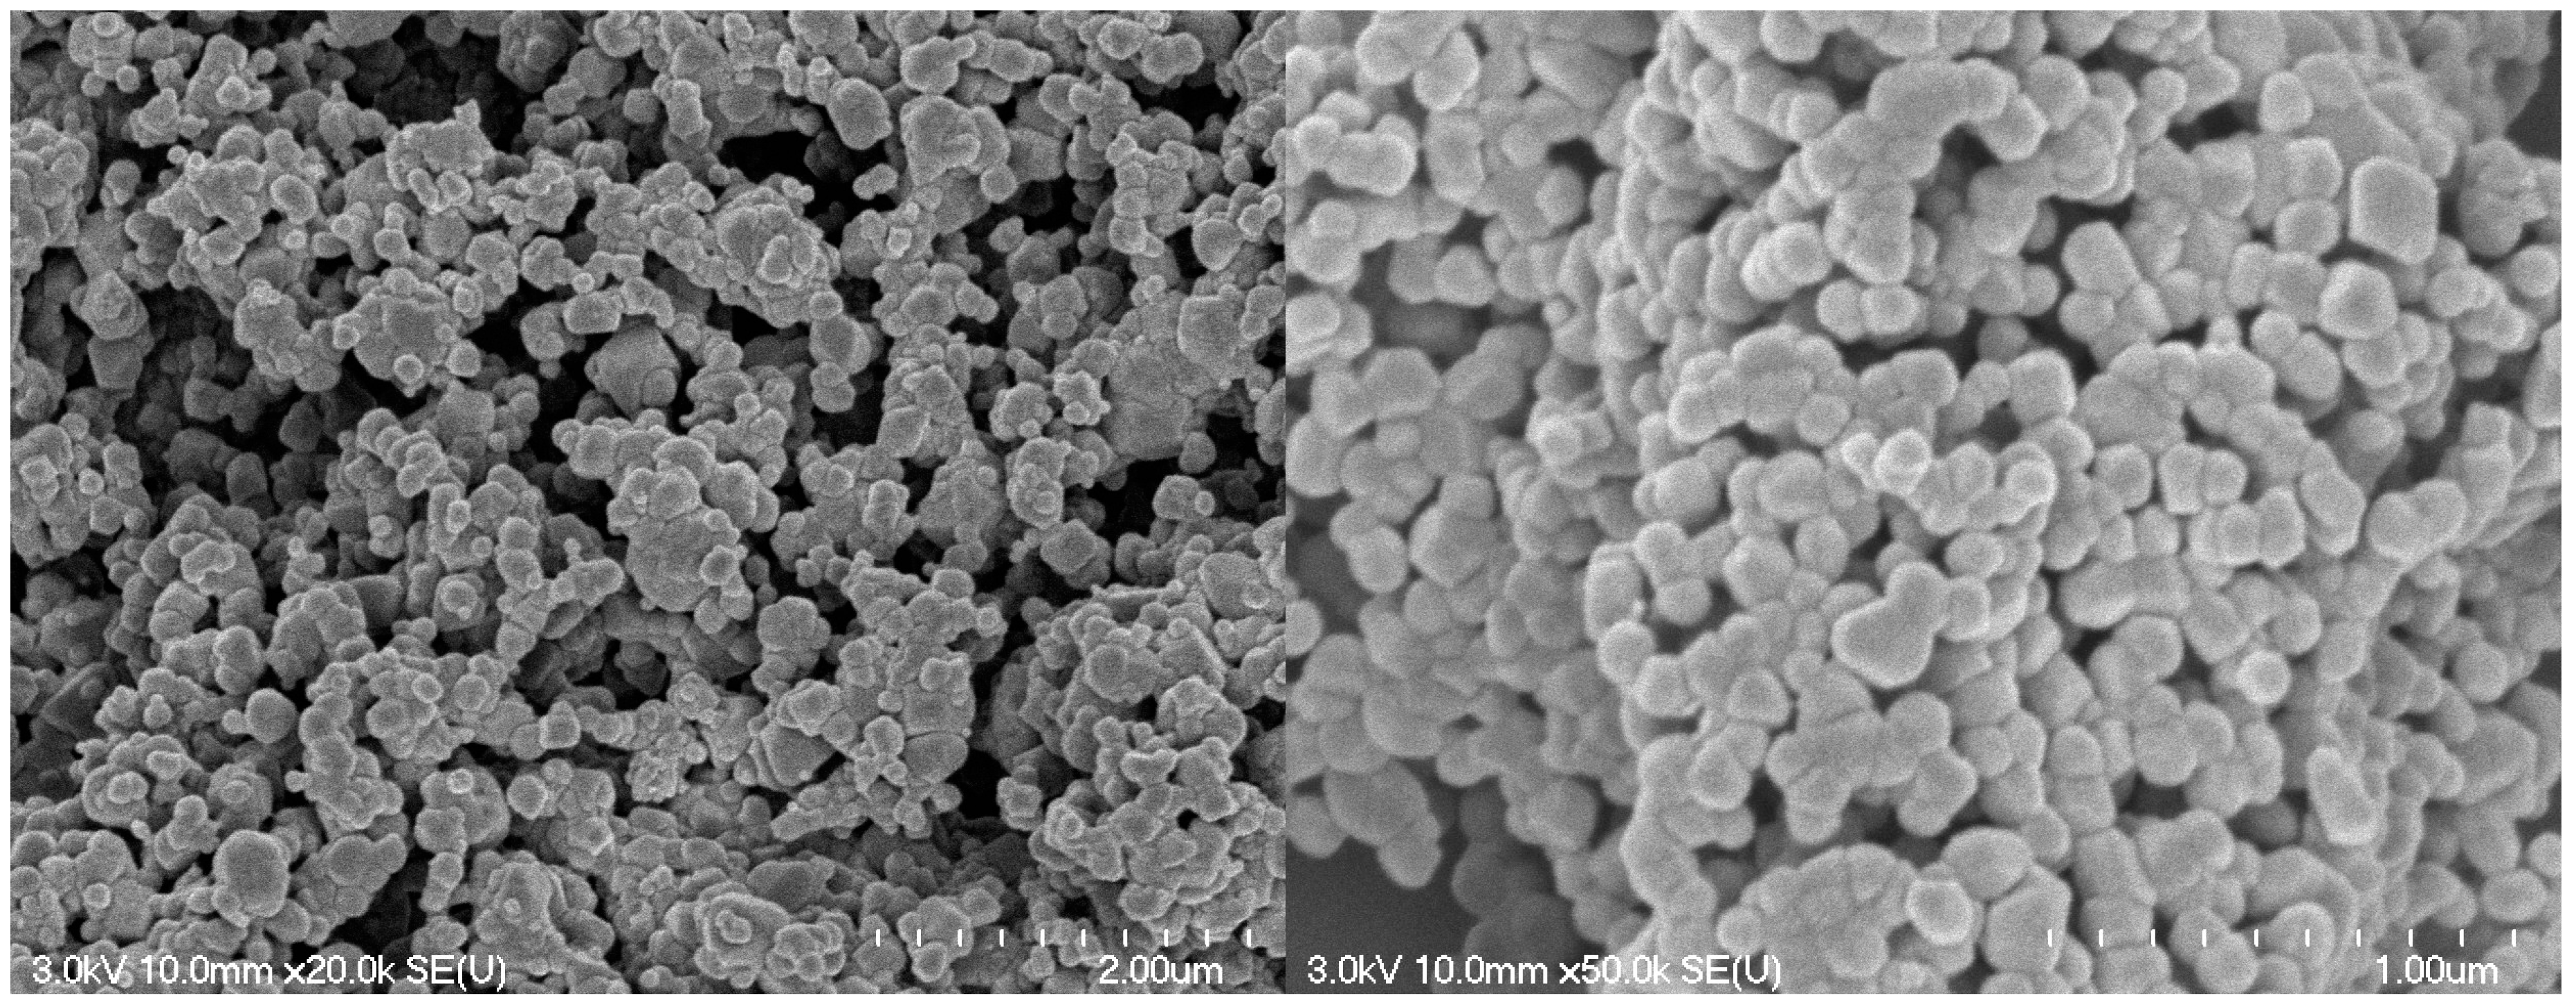
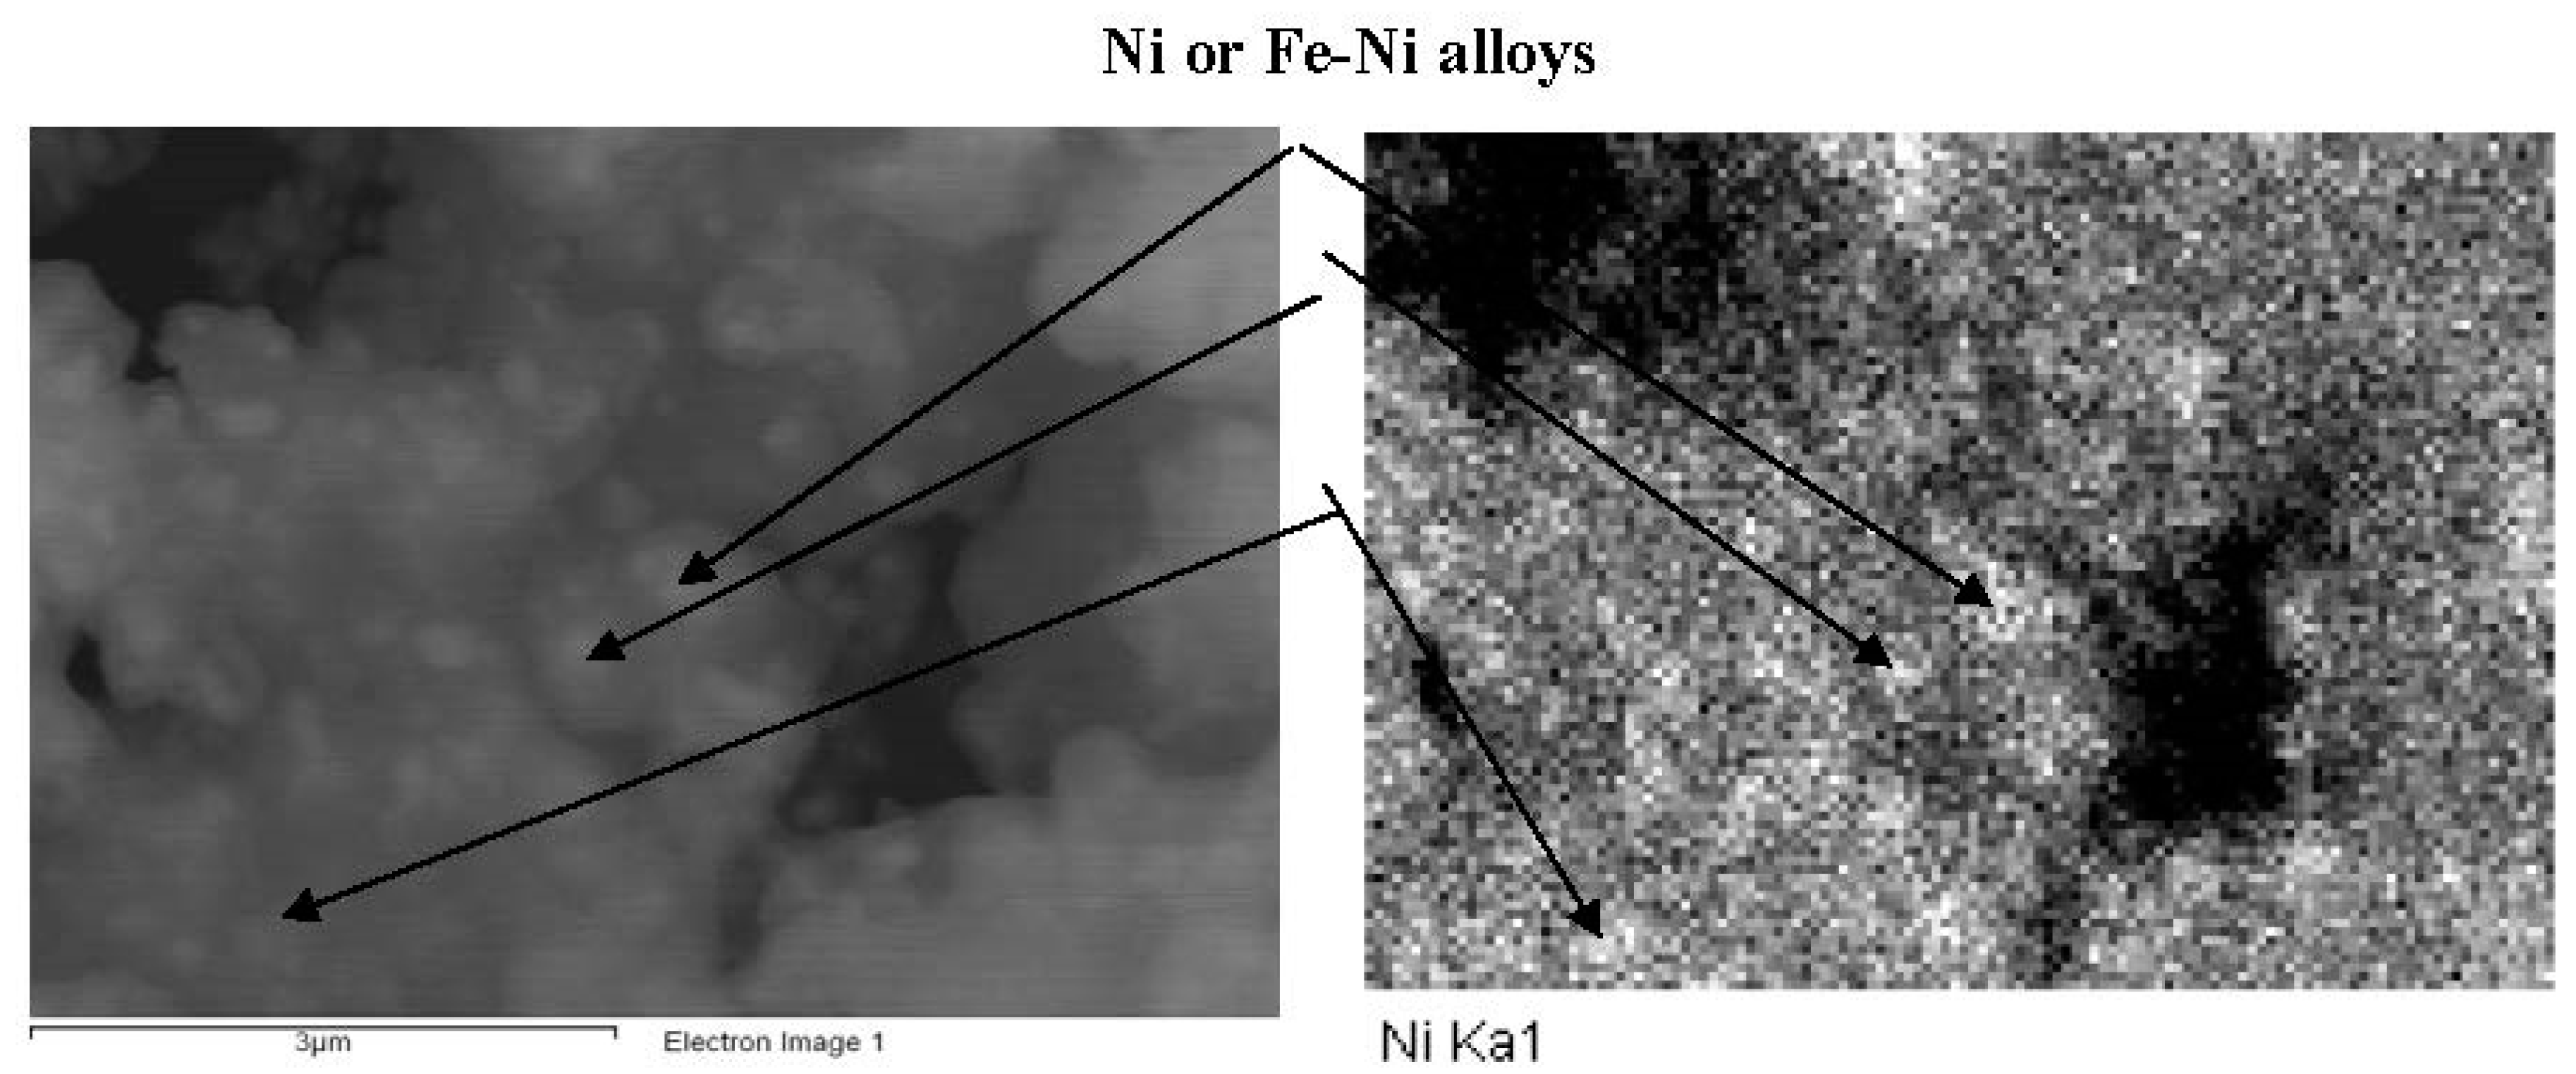
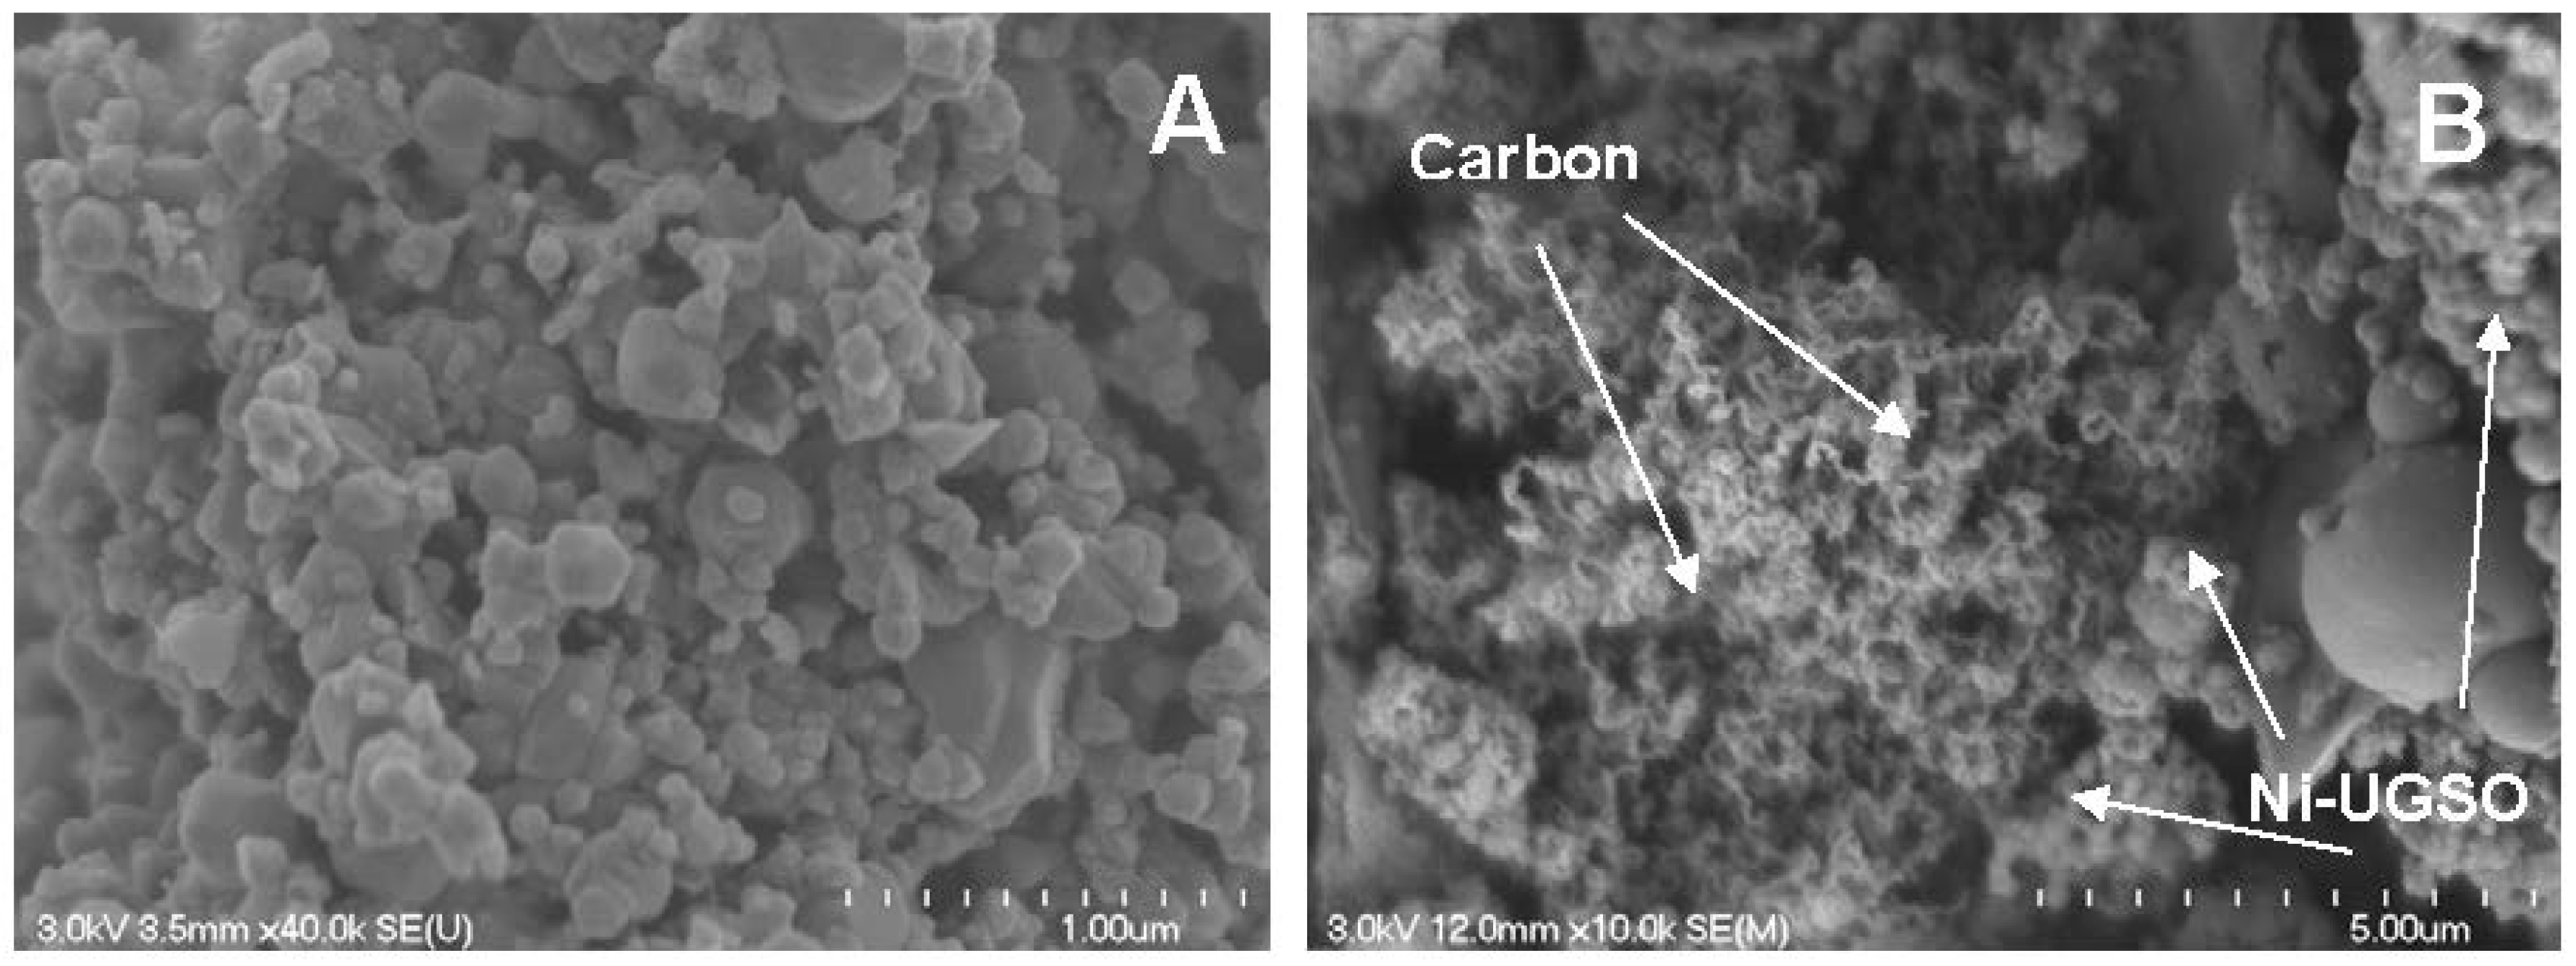
2.3.1. Scanning Electron Microscopy

Figure 6 presents SEM results of fresh catalyst Ni-UGSO, which consisted of an agglomeration of non-porous particles with an amorphous shape and grain size of D = 168 ± 59 nm [37].
Catalyst morphology seemed slightly different after reaction, and depended on the oil type injected. After bio-oil MemU SR at 800 °C and WHSV = 1.7 g/gcat/h, we observe an eruption of small crystals in the shape of nanosphere over the original platelets (Figure 7A). EDX mapping (Figure 8) showed that these small crystals were actually metallic Ni particles or Ni-Fe alloy particles, and their average size was 15.5 nm, as determined by the Sherrer equation applied to XRD analyses. A similar observation was made on the catalyst after bio-oil MemU SR at high WHSV (Figure 7B); in this case, however, we also observed C filament formation over the catalyst, which was probably the main cause of activity loss.
Micrographs of the catalyst used on bio-oil WU SR show two different morphologies at low WHSV (Figure 9A,B). Figure 9A is a micrograph of a zone where metallic Ni particles were formed, but they were not as numerous as in Figure 7 and were larger in size, 40.6 nm (with XRD and the Sherrer equation). A zone of sintering can be distinguished qualitatively in Figure 9B. The two morphologies can explain the low catalyst activity in comparison to the one used for bio-oil MemU SR. At high WHSV (Figure 9C,D), the catalyst clearly showed signs of sintering, with some of the particles coalesced or agglomerated. In both cases, no C deposits were found with high and low WHSV, as the water gasified it into CO and CO2. In general, similar observations were made with the catalyst in the various tests.
Figure 10 represents micrographs of the catalyst after the 105-h test. The morphology was the same as in Figure 7. However, it seems that there was more C deposited at the catalyst’s surface (Figure 10B) without significantly affecting catalytic activity.

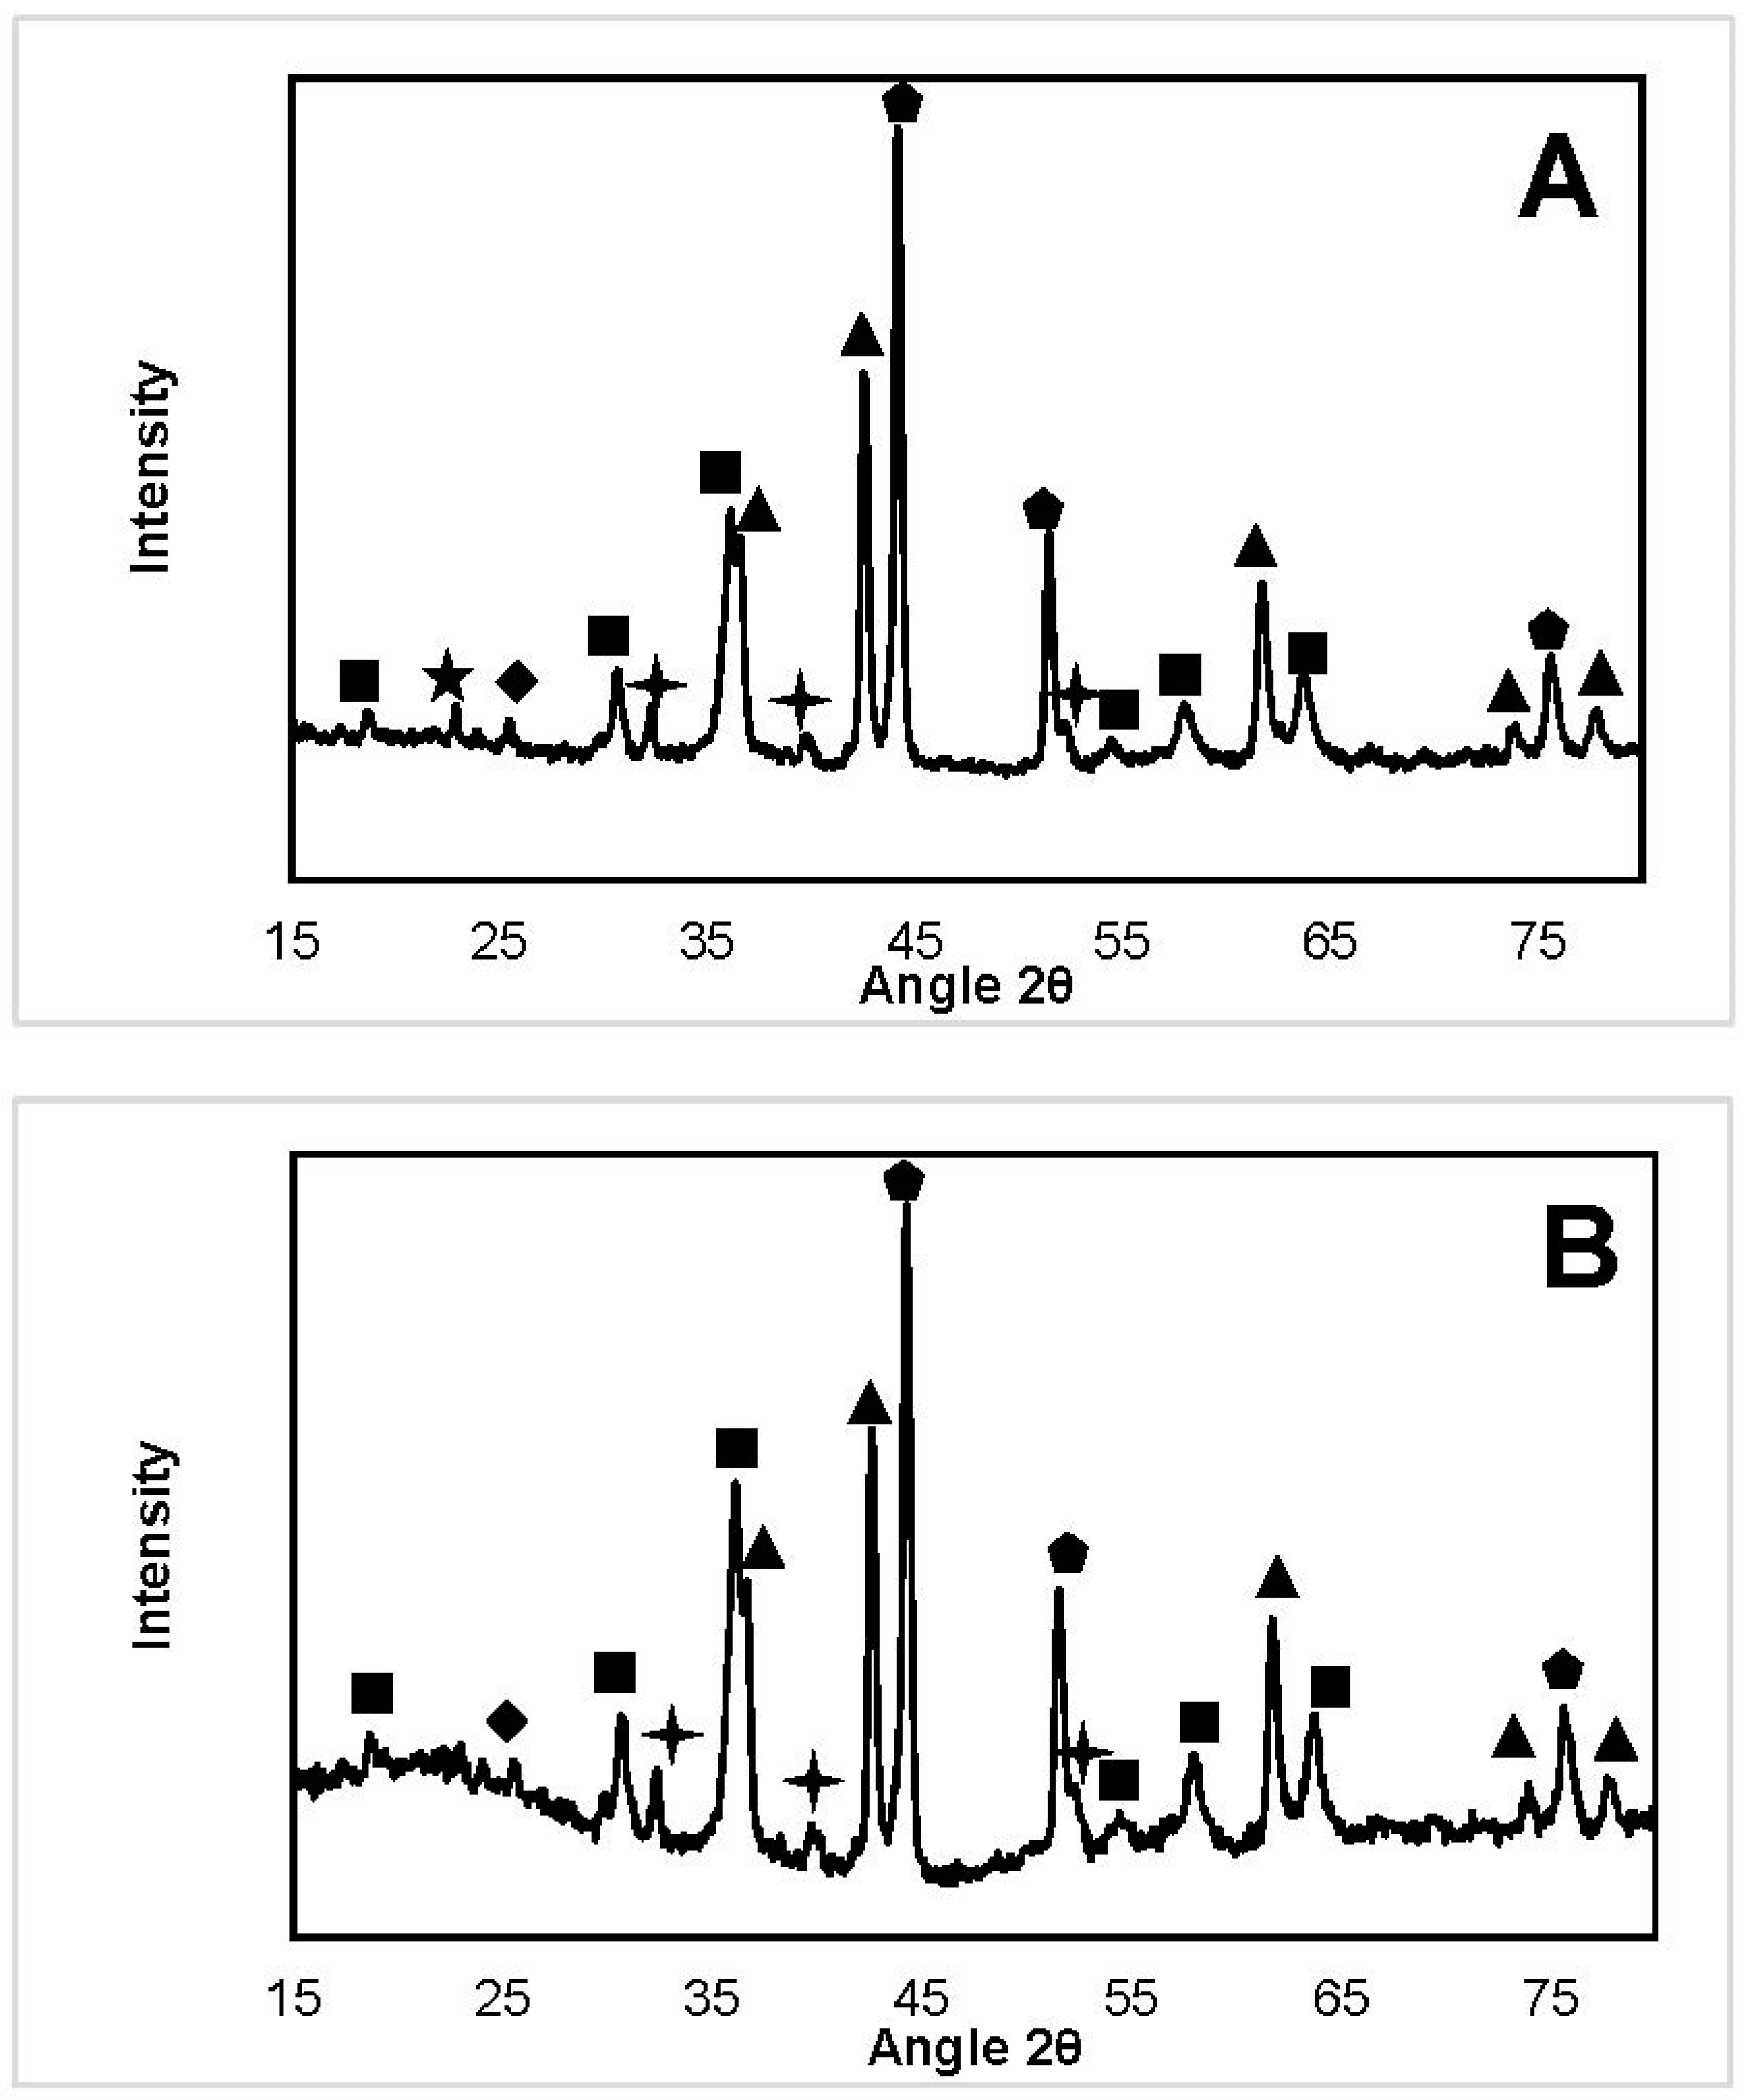
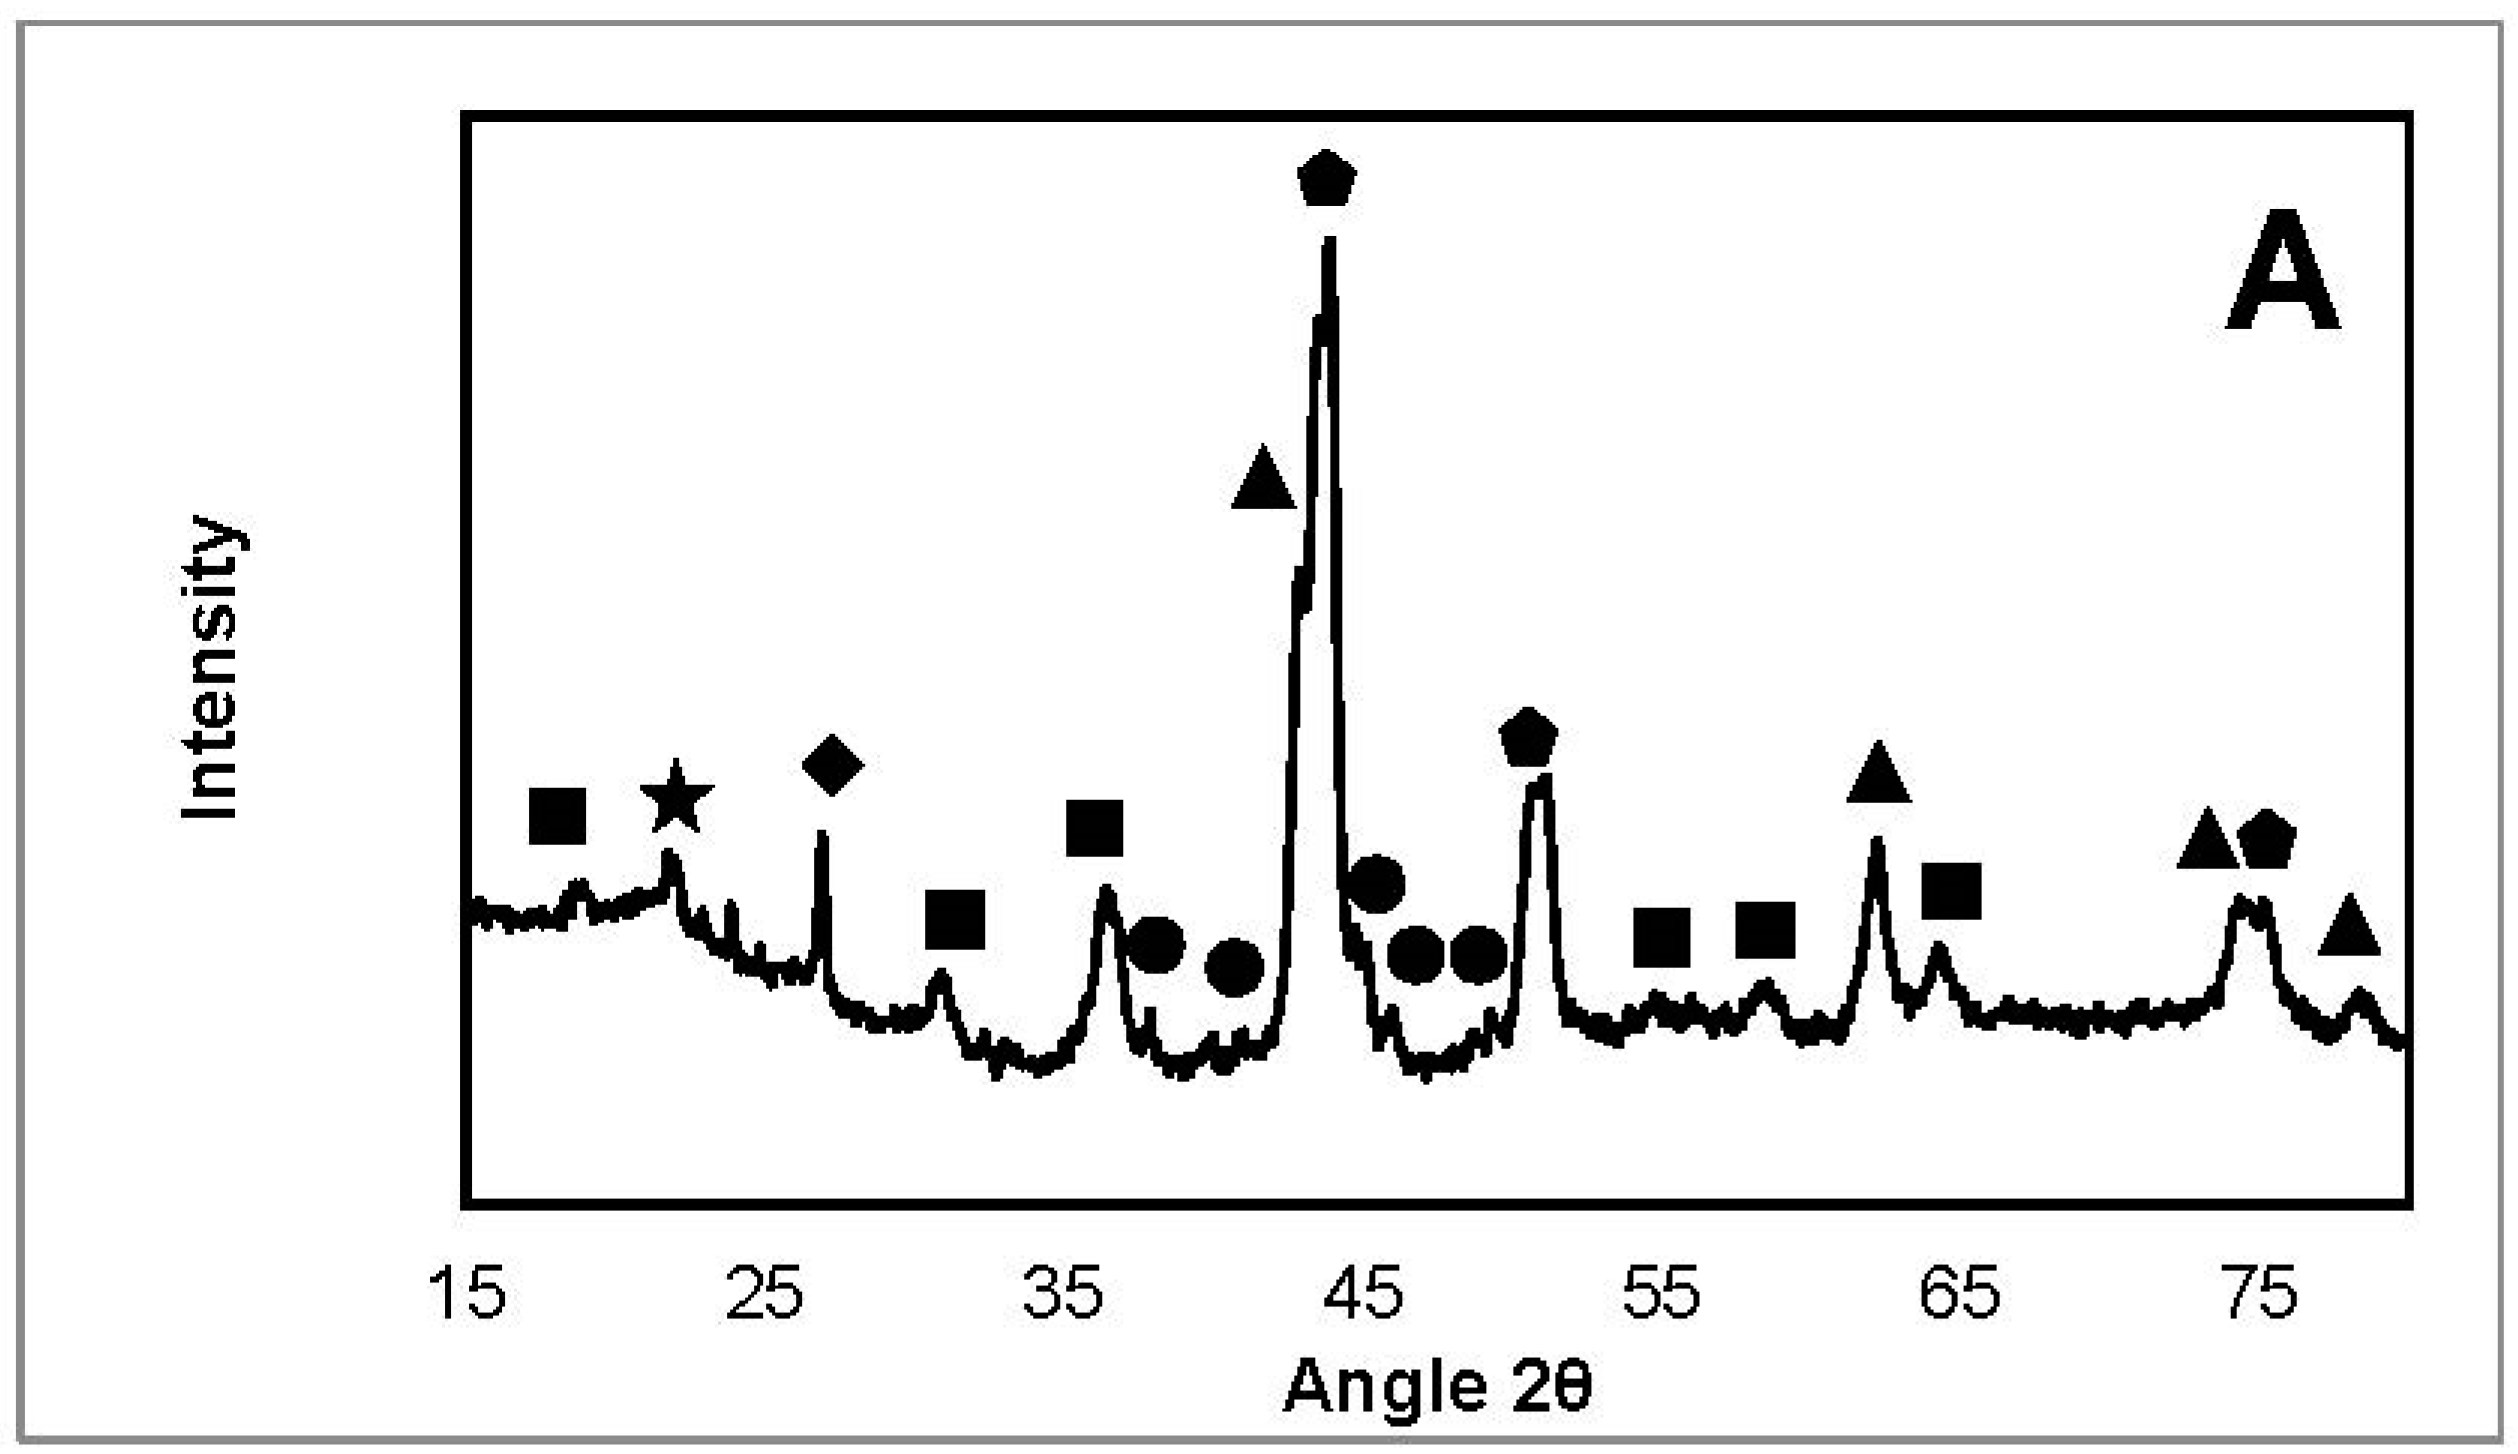
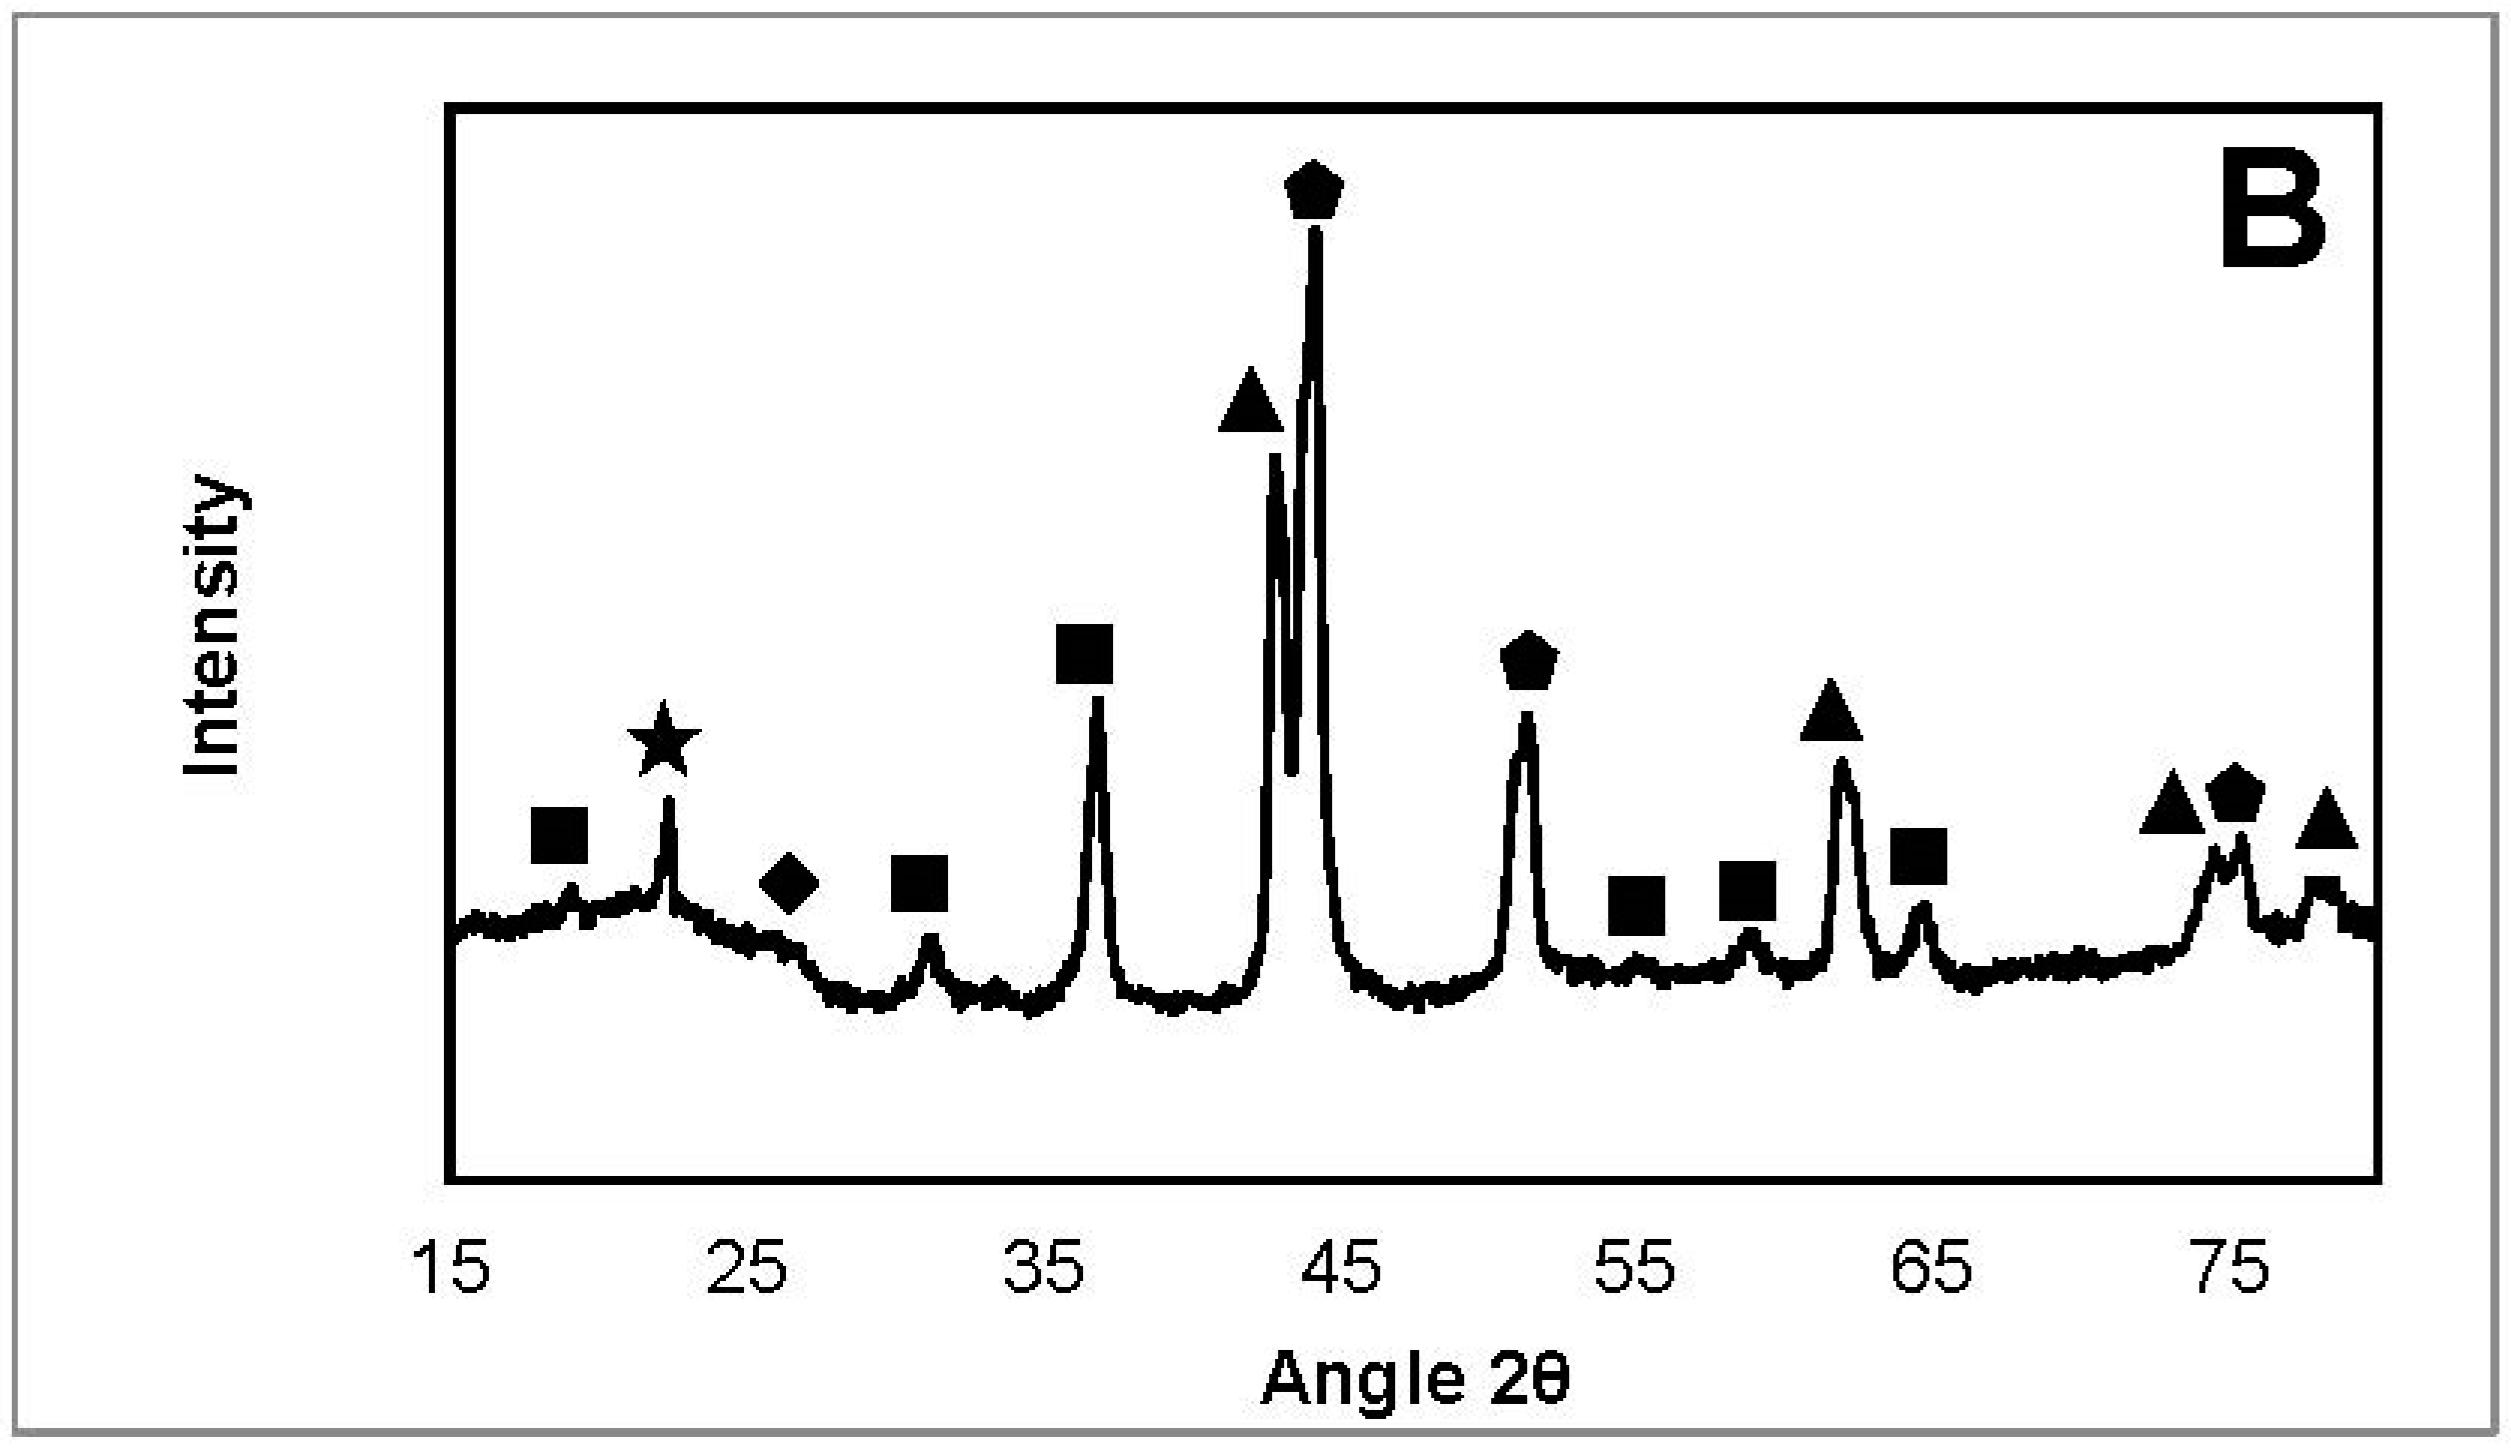
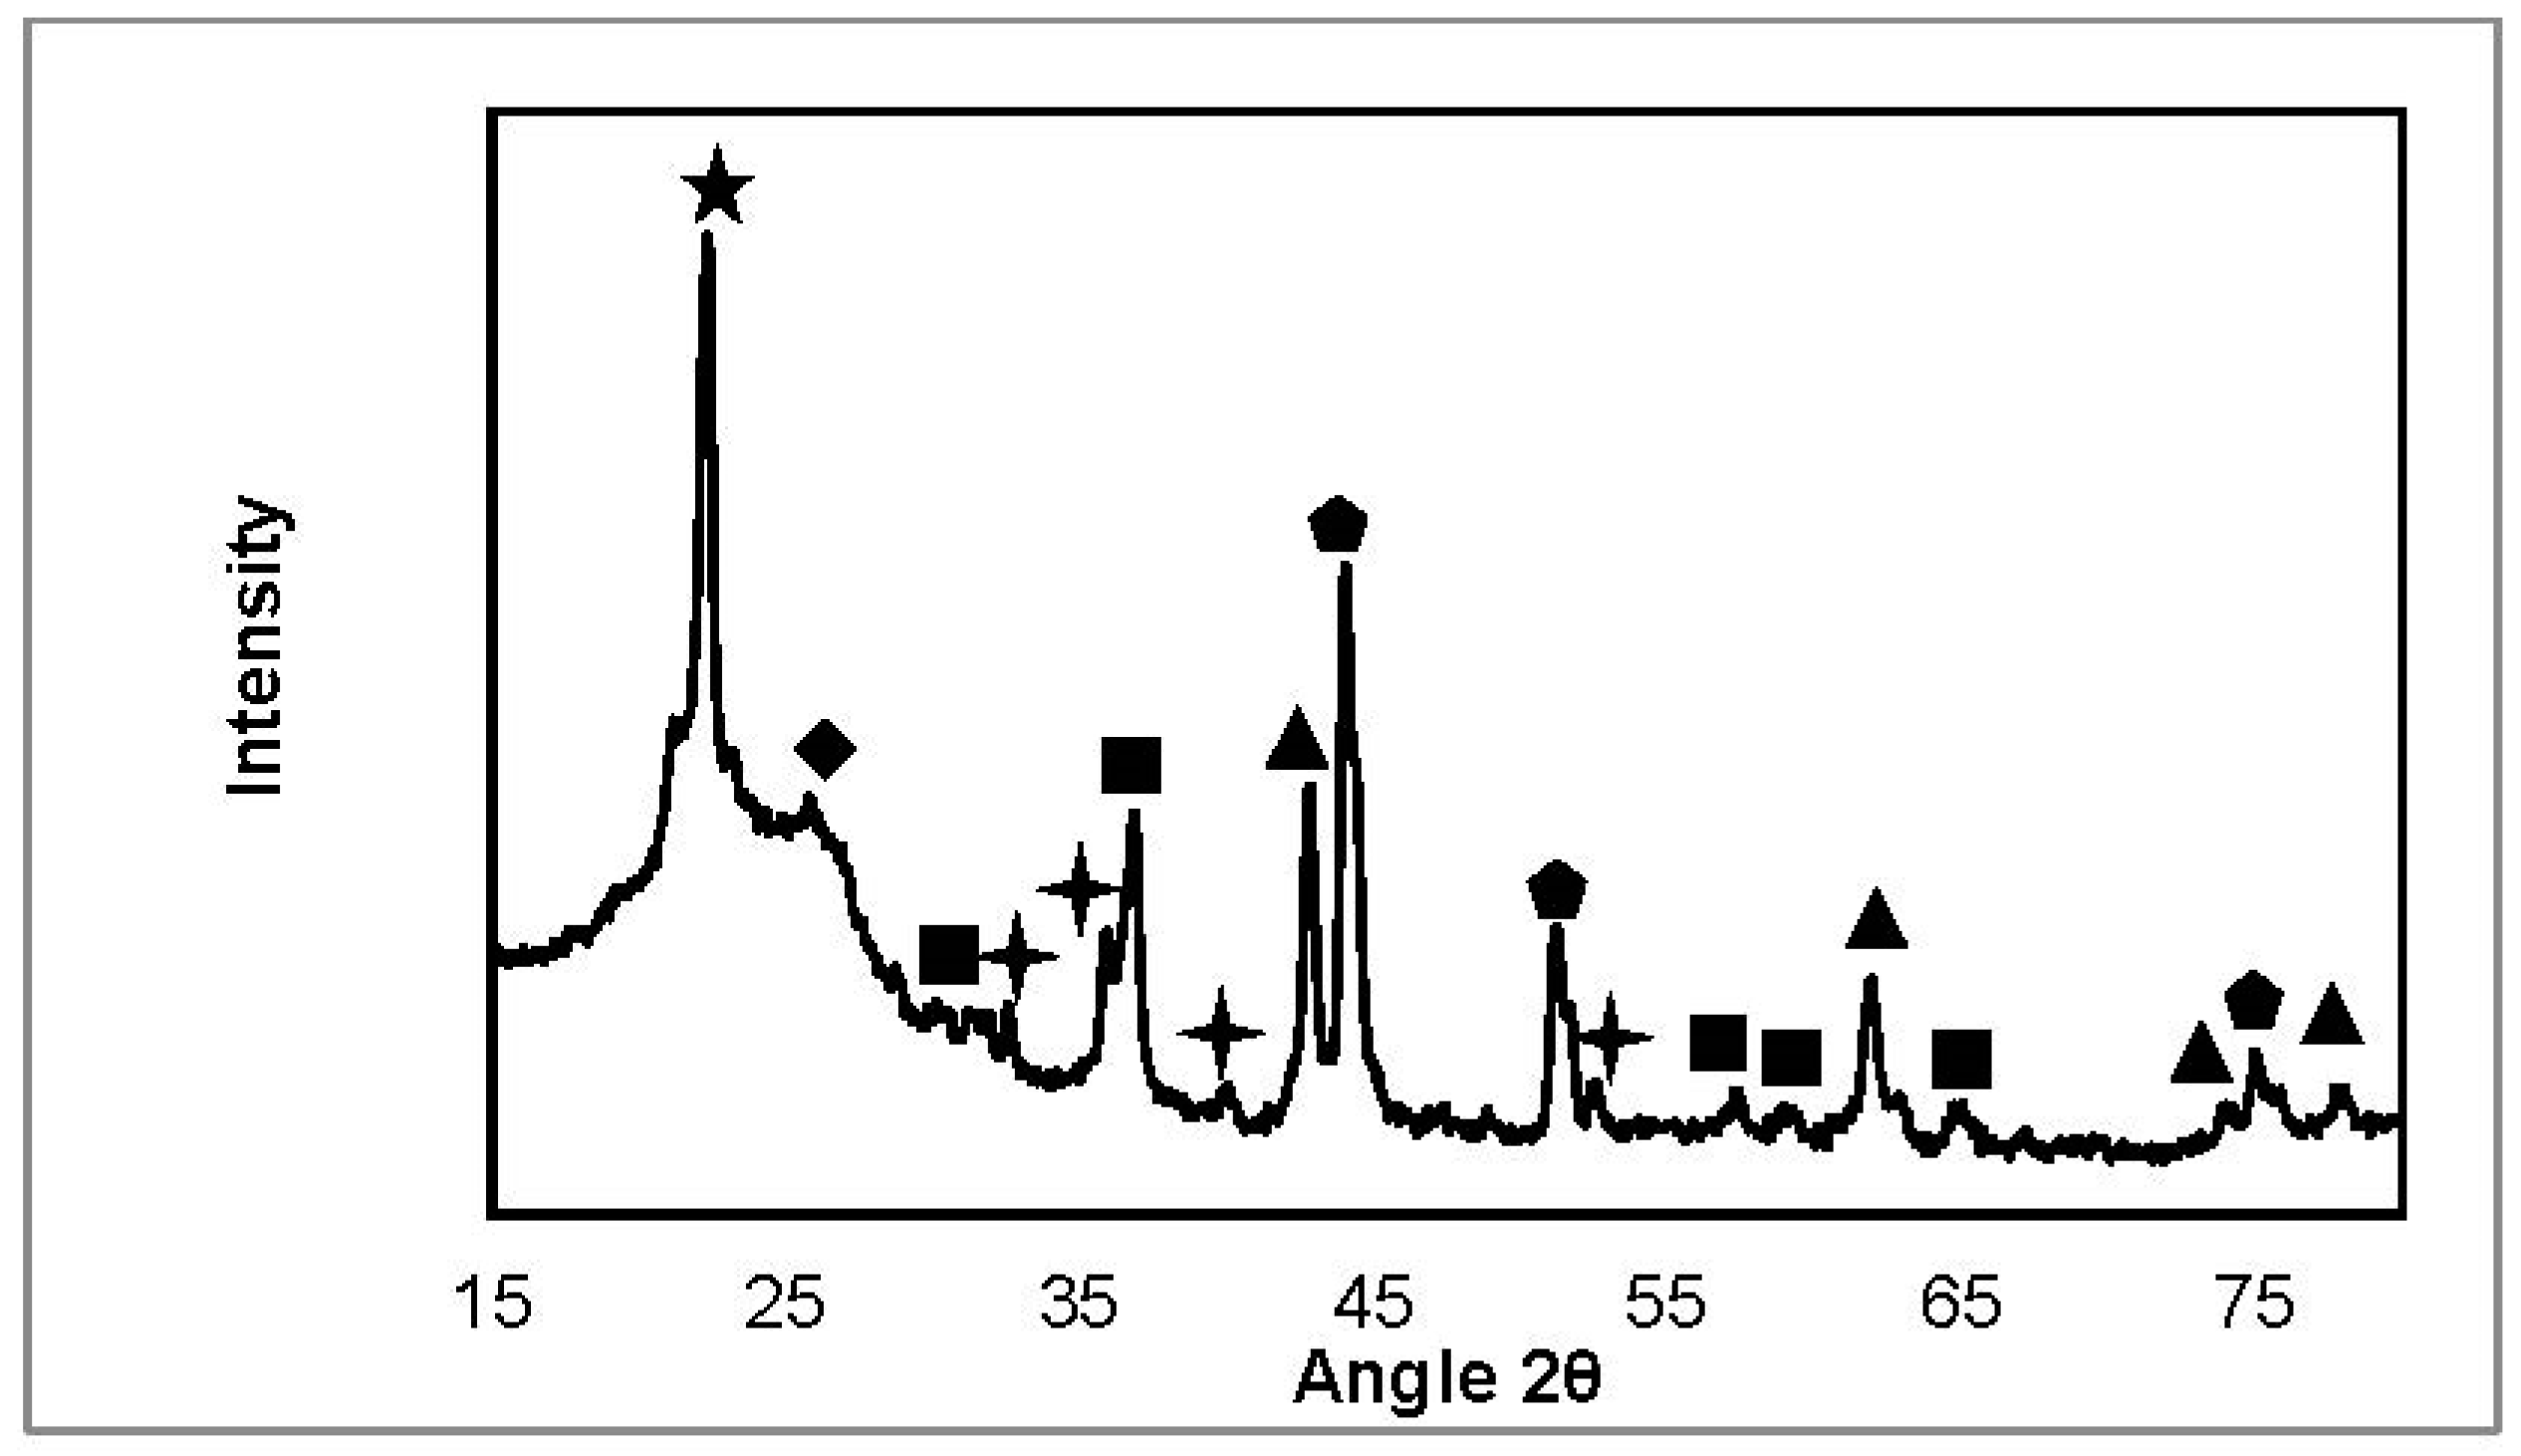
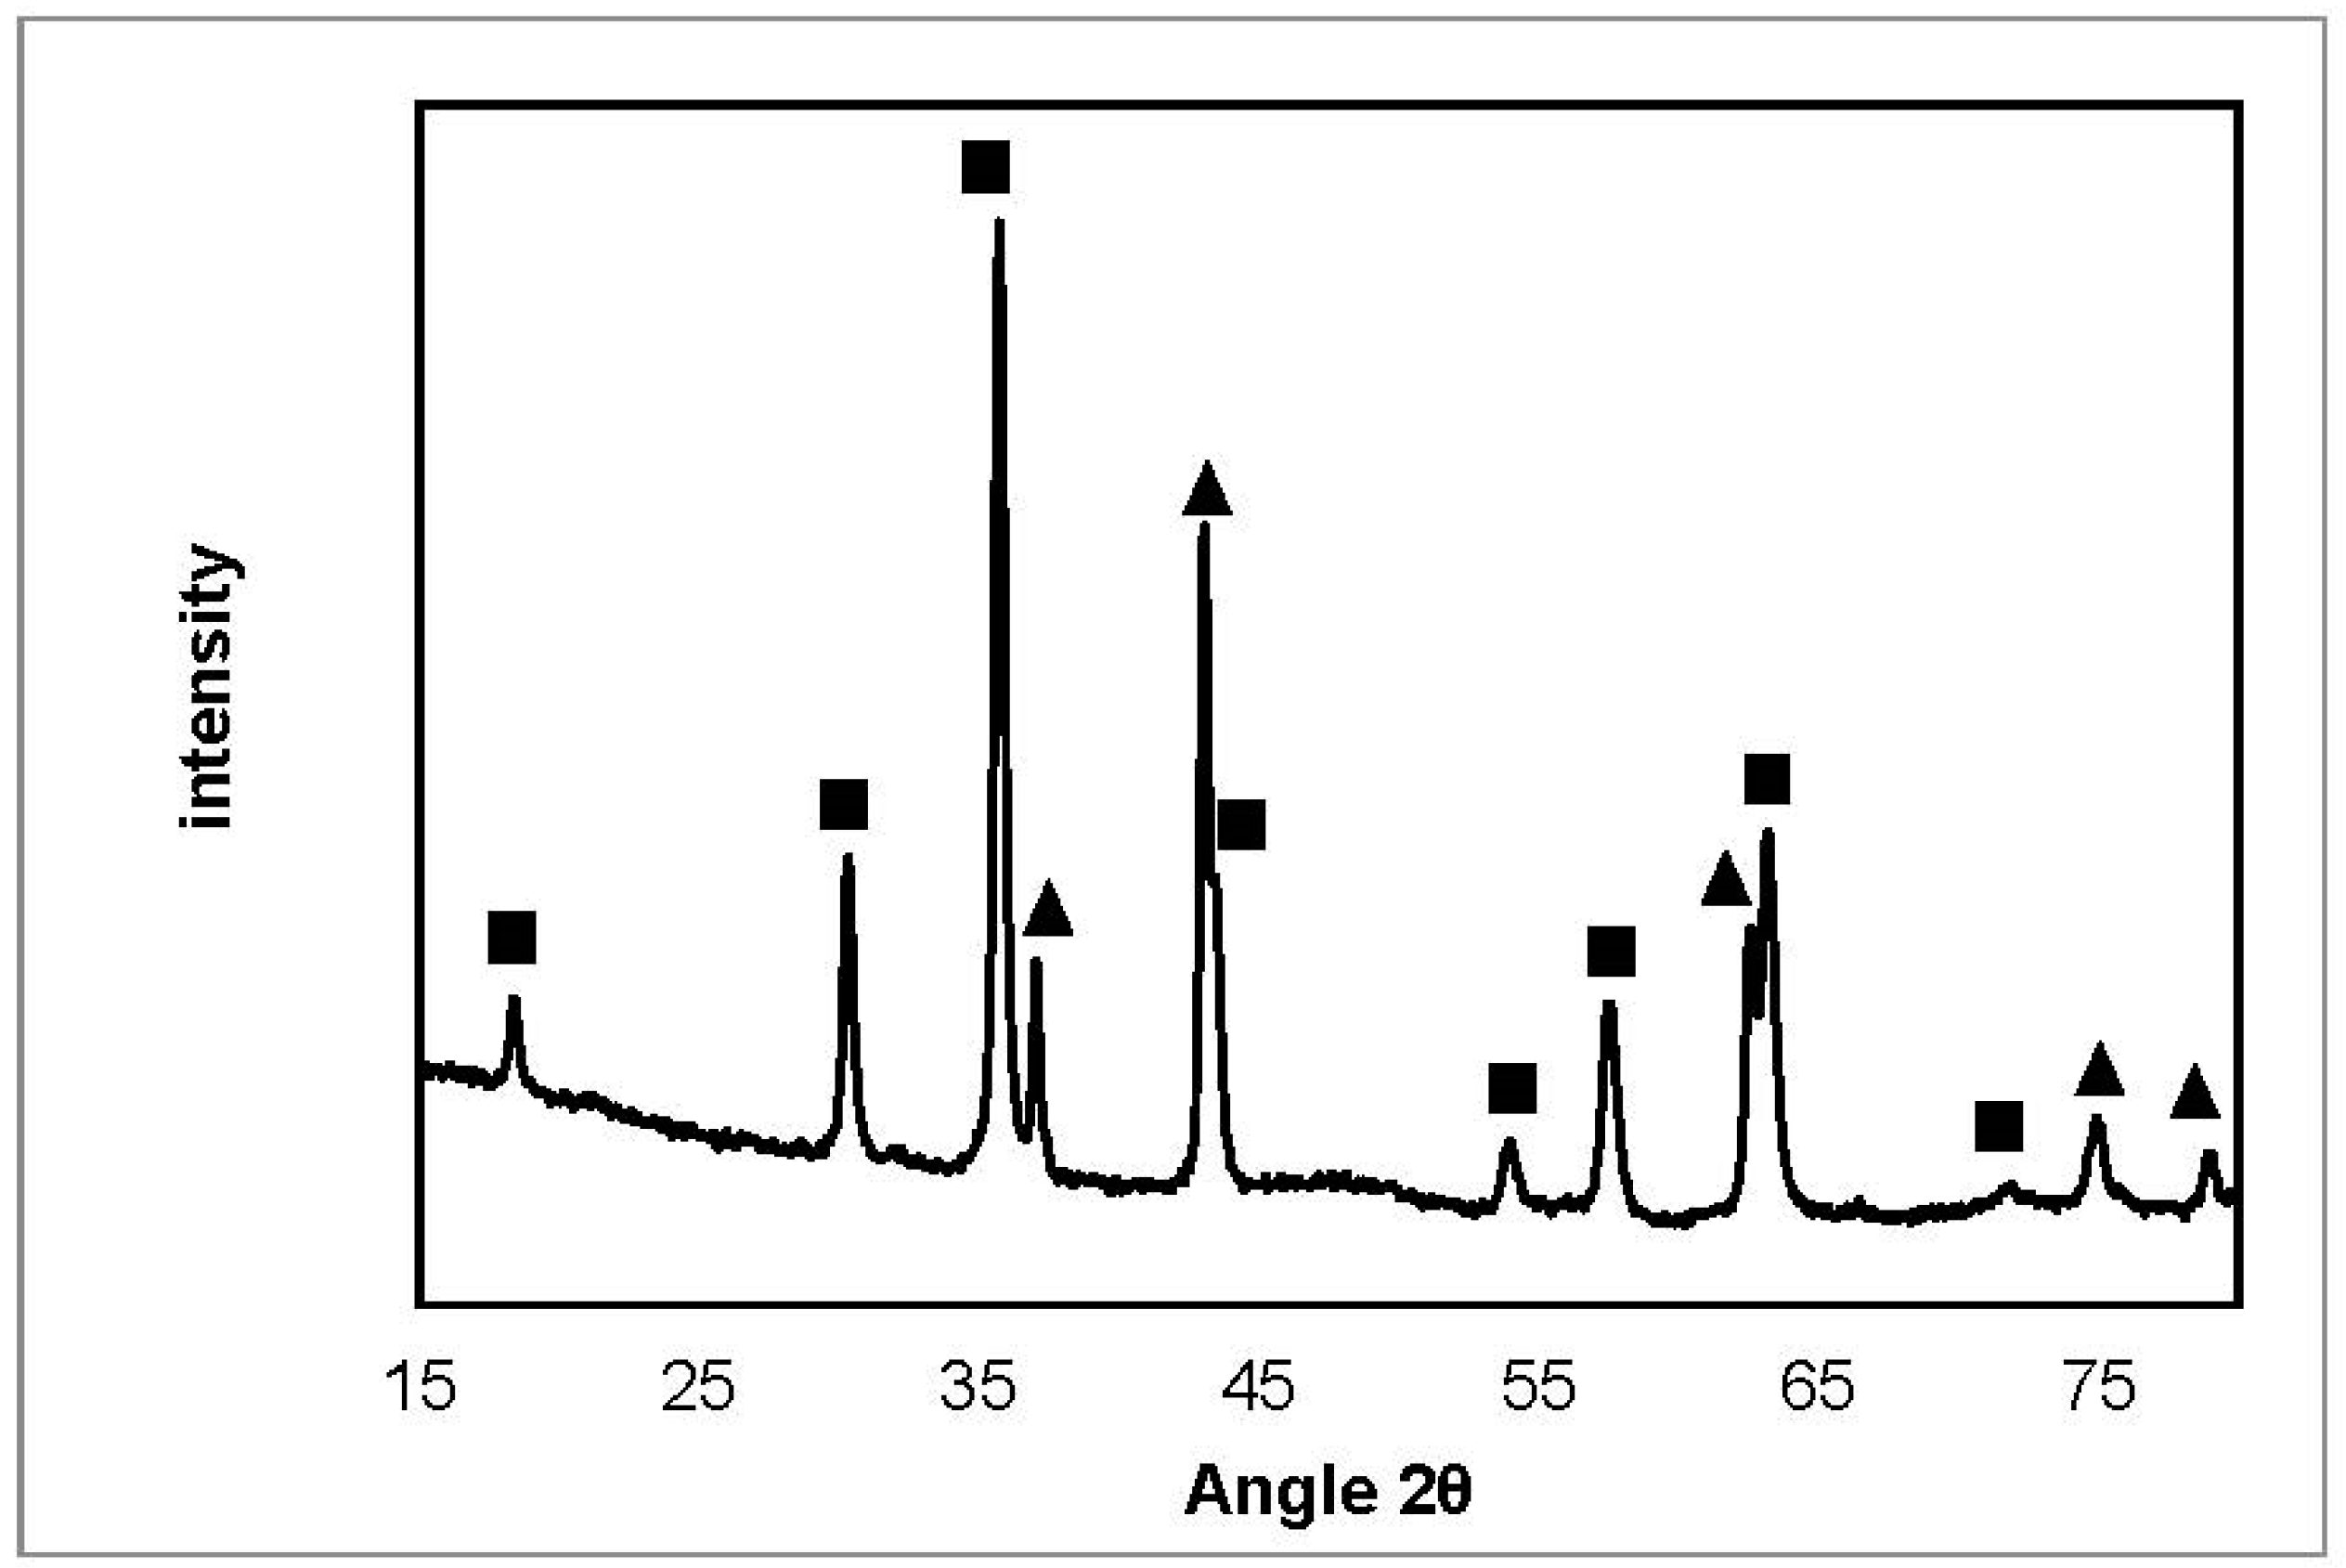
2.3.2. X-ray Diffraction
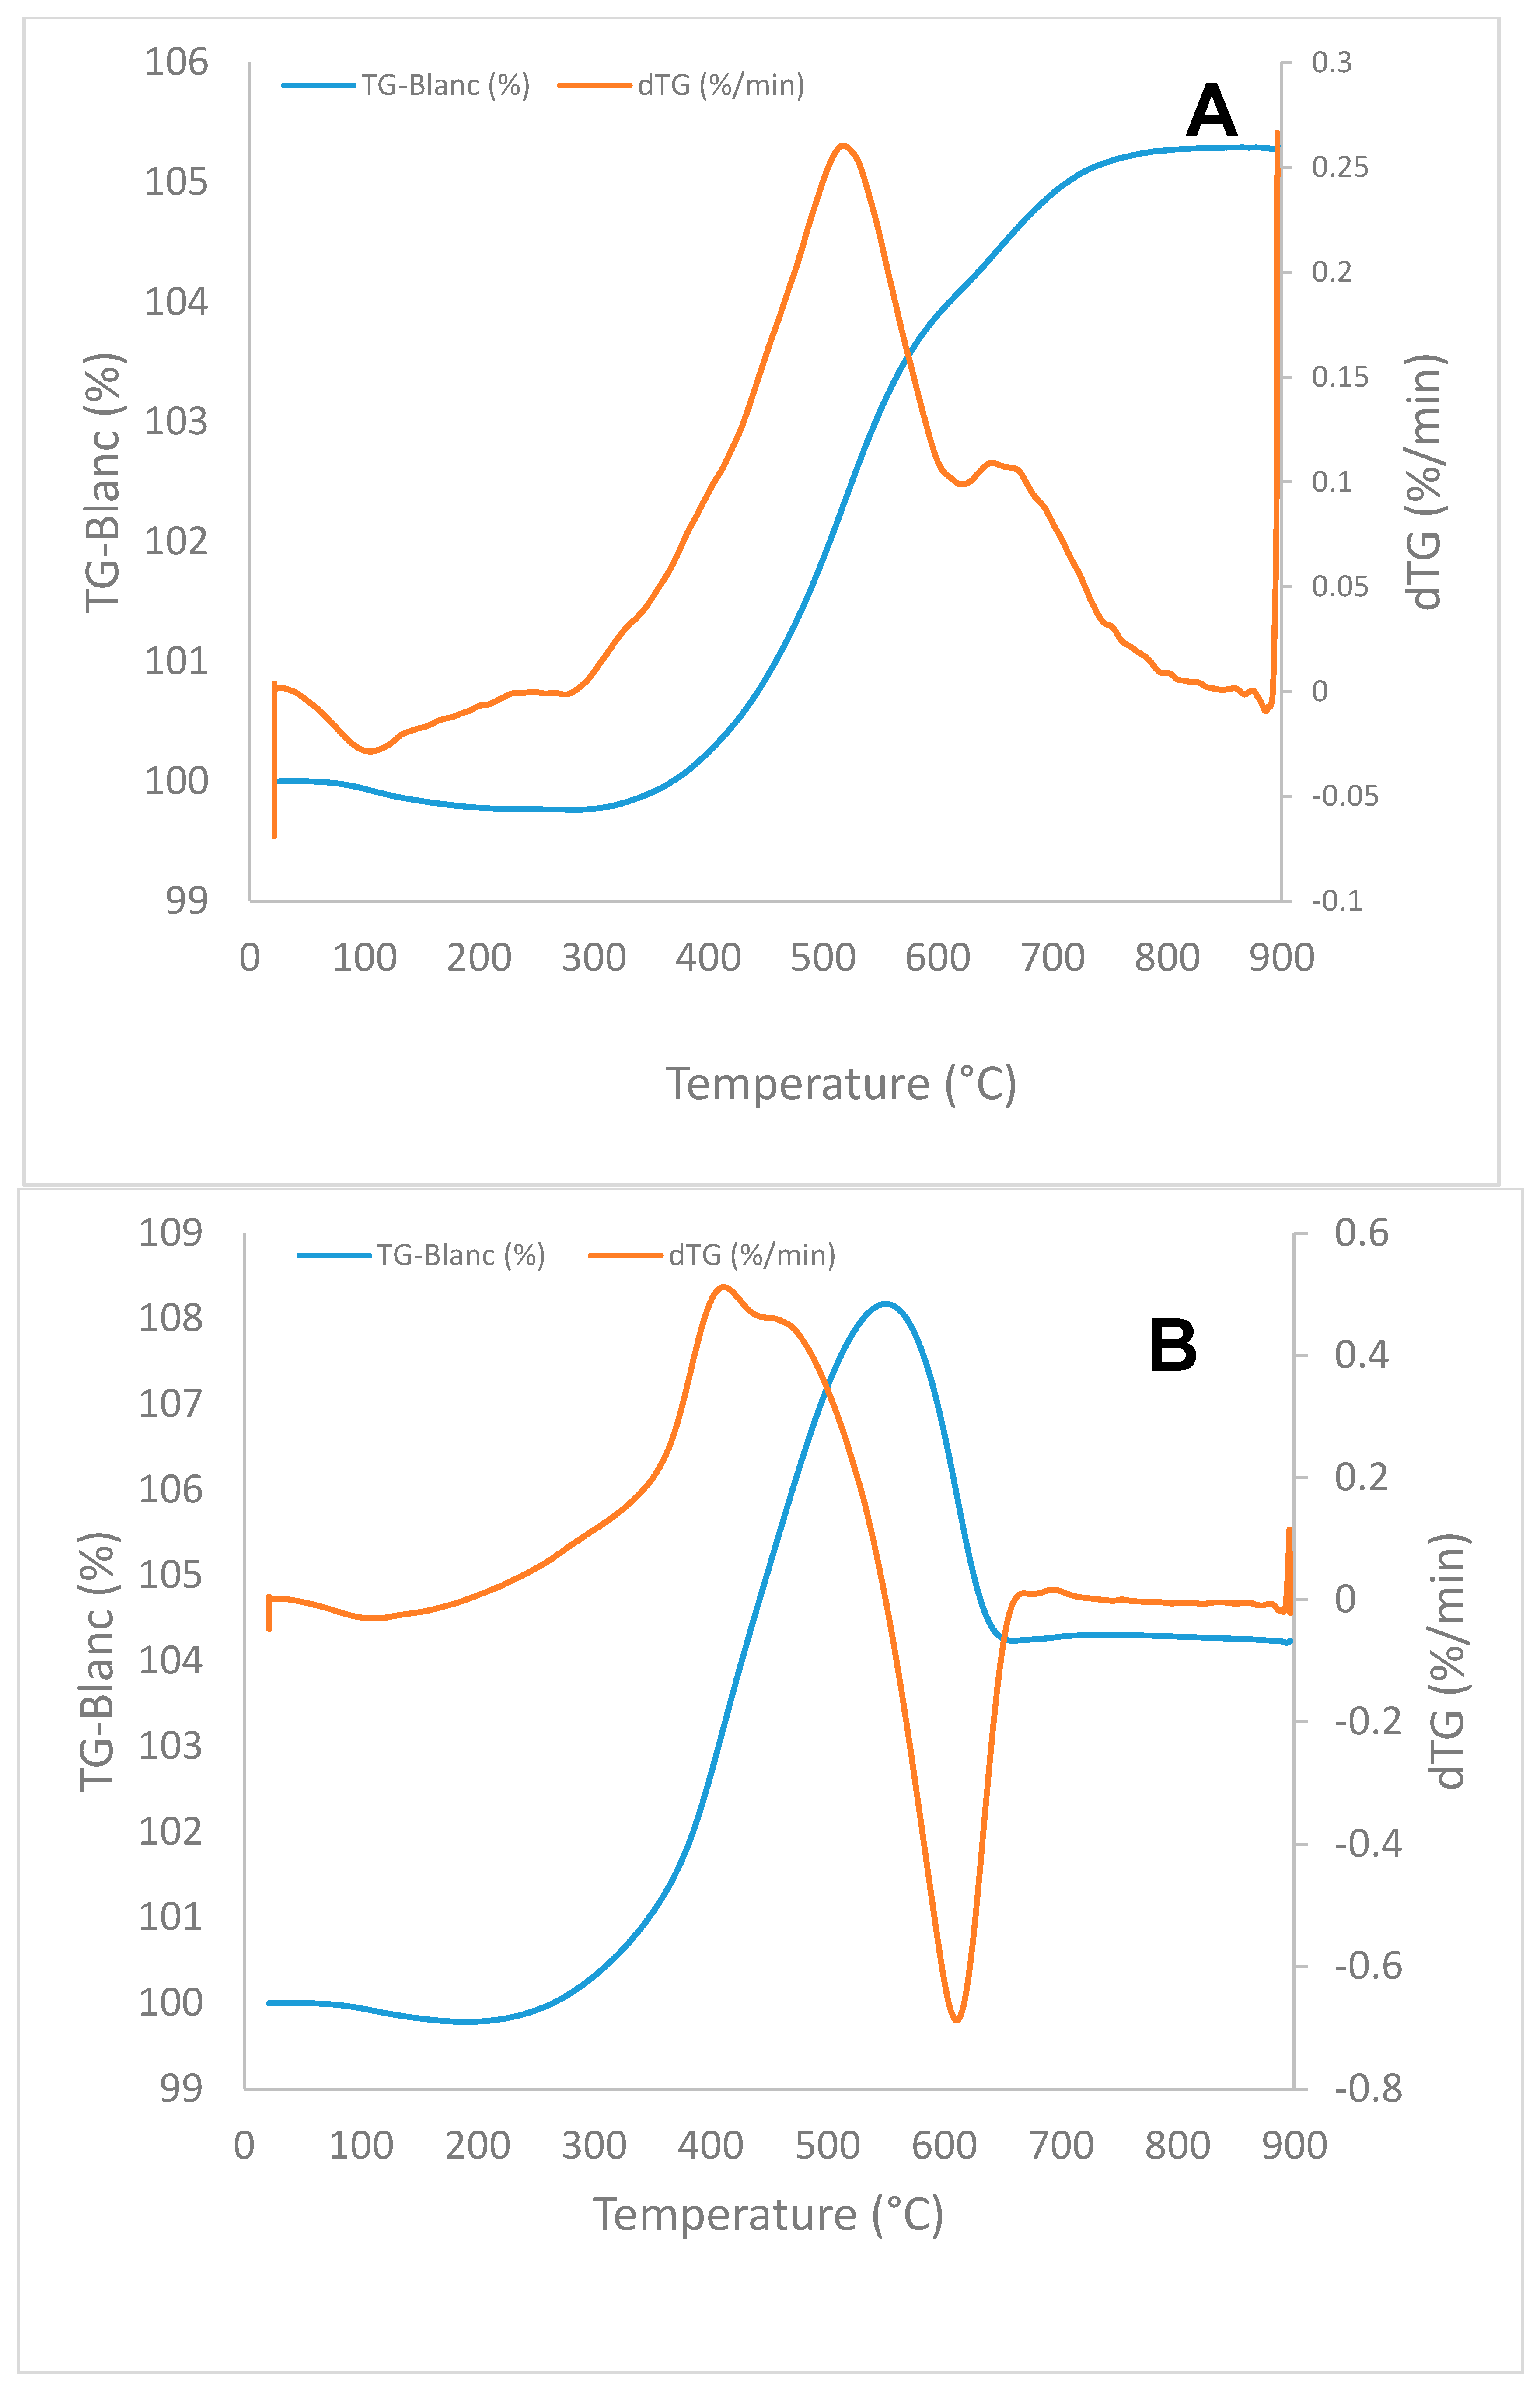
Figure 11 depicts the XRD pattern of the fresh catalyst. We can distinguish two groups of phases (Table 4): (a) one group that englobed the spinels NiFeAlO4, NiFe2O4, MgFeAlO4, AlFe2O4, Fe3O4 (2θ = 19°, 31°, 36°, 43°, 54°, 58° and 63°); and (b) another group that englobed oxides NiO, MgO and their solid solutions NiO-MgO (2θ = 37°, 43°, 63°, 74° and 79°). Such grouping is proposed because of serious peak overlapping for most of the same type phases.
In Figure 12 and Figure 13, it can be seen that, generally, the intensities of spinel peaks decreased in favor of metallic Ni or Ni-Fe alloy (2θ = 44°, 51°, 76°)-attributed peaks. Figure 13 shows peaks which are broader than those in Figure 12, implying that crystallite size was smaller in Ni-UGSO after bio-oil MemU SR, which is in agreement with the micrographs in Figure 7 and Figure 9. It also confirmed that there was more sintering after bio-oil WU SR. Peaks at 2θ = 32°, 40°, and 52° in Figure 12 are attributed to hematite (Fe2O3) formed probably after the oxidation of magnetite (Fe3O4) or Fe involved in spinel phases because of the high amount of O in bio-oil WU SR. In Figure 13A, the small peaks that appear between 38° and 49° are characteristic of cementite (Fe3C); its presence shows chemical interaction between reduced Fe and deposited C. Nevertheless, cementite was observed only in this test.
XRD spectra of the catalyst after the 105-h long test (Figure 14) was similar to those obtained with the catalyst after the 500-min test. Principal peaks of spinel and metallic phases were present. The high peak at 22° was attributed to non-efficiently removed quartz wool from the catalyst. Hematite peaks were probably due to the long exposure time.

2.3.3. TGA Analysis

Figure 15 displays TGA results for Ni-UGSO samples taken after bio-oil WU SR (Figure 15A) and bio-oil MemU SR (Figure 15B) at 775 °C and low WHSV.
In Figure 15A,B, we observe a weight loss of 0.2% starting around 90 °C. This is attributed to water evaporation and desorption of other species like CO2. Then, weight gain is observed starting at ~250 °C for the sample from bio-oil MemU SR and at ~350 °C for the sample from bio-oil WU SR. It is attributed to Ni0 nanoparticles oxidation, as demonstrated by Song et al. [45]; the authors also affirm that Ni0 nanoparticles are oxidized at lower temperature than bulk Ni materials which start oxidizing at about 600 °C. Thus, the difference in Ni particle size determined from XRD by Sherrer equation may explain the difference in oxidation temperature. Moreover, the weight gain in Figure 15B was 8.4% and 5.5% in Figure 15A, which implies that there were less Ni0 after bio-oil WU SR because of high water/oxygen content. In Figure 15B, the weight loss of 3.9% at ~600 °C was attributed to C deposited over the catalyst, this amount is low considering the ratio O/C ≈ 1 (and H2O/C = 0.6) and TOS of 500 min. No C was detected by TGA in Figure 15A.

2.3.4. BET Measurement

Table 5 displays the results of BET measurement of fresh and used catalyst after bio-oil SR at 825 °C and WHSV ~1.8 g/gcat/h. Fresh Ni-UGSO had a specific area of 6.70 m2/g. After the reaction, the surface increased due to reduction and eruption of Ni particles (see Figure 7) to reach 10.49 m2/g in the case of MemU SR and 8.98 m2/g in WU SR. The difference was attributed to the difference in particle size between the two samples because of different reduction (or oxidation) conditions. Indeed, more H2O was present in bio-oil WU, which favors sintering and, consequently, a loss of specific area. However, the amount of C deposited on the used catalyst after MemU SR (TGA in Figure 15B) may also contribute to the increase of the specific area.

3. Materials and Methods

3.1. Bio-Oils

Two different bio-oils were subjected to SR testing. They were produced and provided by Memorial University (St. John’s, NL, Canada) and Western Ontario University (London, ON, Canada), designated hereafter as MemU and WU, respectively. A description of the experimental set-up for bio-oil production can be found in [46] (for MemU) and in [47] (for WU). Before testing, the bio-oils were centrifuged in the J-20XP Avanti centrifuge (Beckman Coulter, Indianapolis, IN, USA) and filtered to remove solids. The physico-chemical properties of the resulting bio-oils were then analyzed. H2O was measured by the Karl-Fischer method, using a TOLEDO V20 KF titrator (Mettler-Toledo, Mississauga, ON, Canada), solvent HYDRANAL medium K (Honeywell Fluka, Morris Plains, NJ, USA) and the reagent HYDRANAL composite 5K (Honeywell Fluka, Morris Plains, NJ, USA) [48]. pH was measured with an OAKTON pH700 (OAKTON Instruments, Vernon Hills, IL, USA) pH-meter. Elements (C, H and O) were analyzed with a TrueSpec Micro (LECO, St. Joseph, MI, USA) apparatus. Liquid densities were quantified with a DMA 3000 density-meter (Anton Paar, Montréal, QC, Canada).

3.2. Catalyst Preparation and Characterization
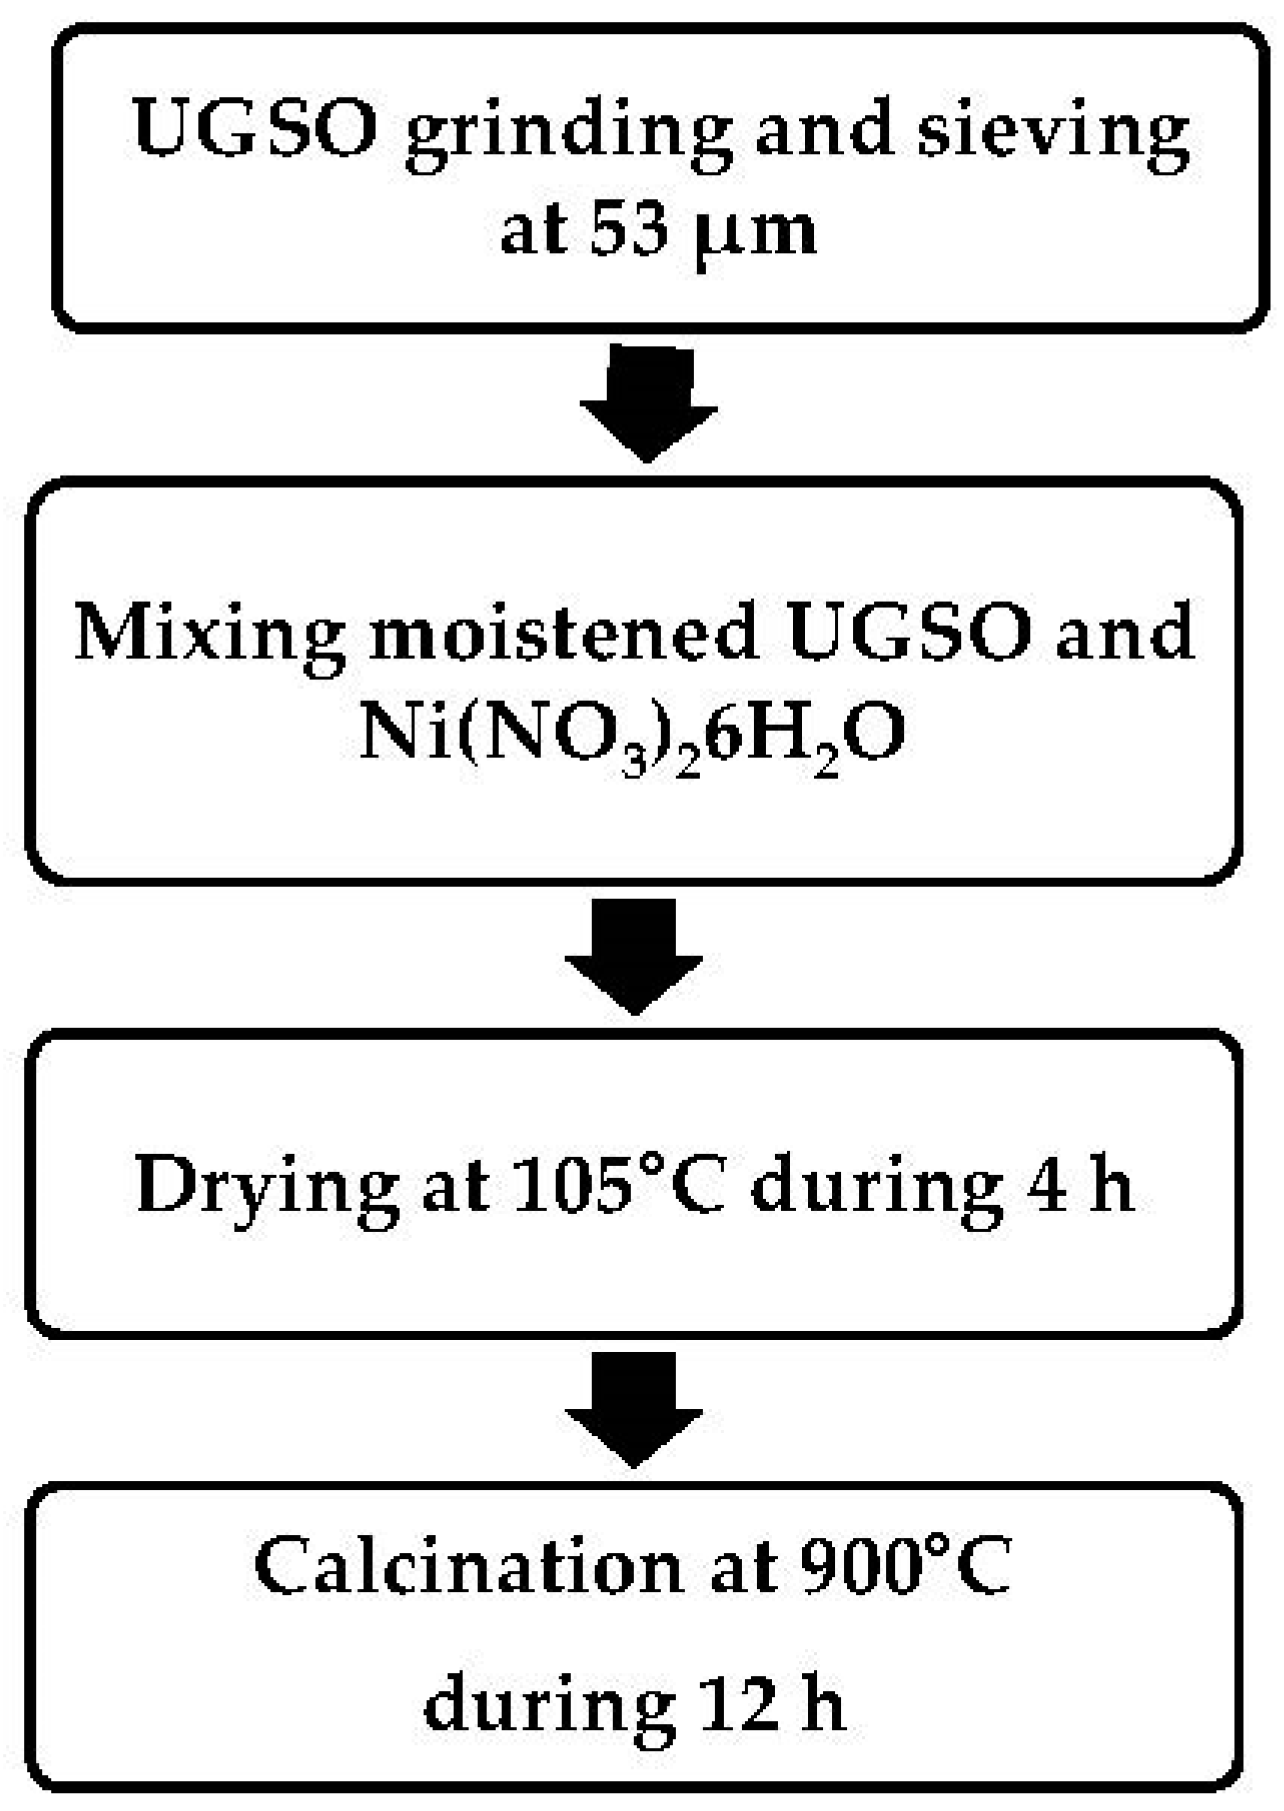
3.2.1. UGSO

UGSO is a mining residue derived from the process of upgrading titanium slag (UGS) of the company Rio Tinto Iron and Titanium (RTIT) (Sorel-Tracy, QC, Canada). It is constituted of a mixture of metal oxides, mainly Fe, Mg, Al and, to a lesser extent, Cr, V, Ti, Si, Na, Mn, Ca, K, P, Zr and Zn [34,39]. The main crystalline phases present in this residue are: MgFe2O4, FeAl2O4, and a solid solution of both Mg(Fe,Al)2O4 and MgO [49]. The mining residue was support for the Ni-UGSO catalyst. More information on it can be found in [37].

3.2.2. Ni-UGSO

The catalyst was prepared via improved solid-state reaction [50]. UGSO (RTIT) was first ground in a mortar and sieved at 53 μm, then wetted and mixed with Ni(NO3)2·6H2O (Sigma-Aldrich, Darmstadt, Germany) at a proportion such that the final dry formulation contained 13 wt % Ni loading. The mixture was then dried at 105 °C for 4 h and, finally, the catalyst was calcined at 900 °C during 12 h to decompose the nitrates and convert all Ni content into spinel phases (Figure 16). Fresh and spent catalysts (Ni-UGSO) were analyzed by X-ray diffraction (XRD), scanning electron microscopy (SEM), Brunauer–Emmett–Teller physisorption (BET), energy dispersive X-ray mapping (EDX mapping) and thermogravimetric analysis (TGA).
XRD analysis was performed with a Philips X’pert PRO diffractometer (PANalytical, Almelo, The Netherlands) which was operated with data collector analysis software (PANalytical). The radiation source was Kα of Cu (15,418 Å) produced at 40 kV and 50 mA. The anti-dispersion slit was fixed at ½° and divergent slit at ¼°. Analysis was conducted on a 2θ range of 15–80°, and overall analysis time was 47 min. XRD was undertaken with built-in software, and database research carried out with MDI JADE 2010 (Materials Data, Livermore, CA, USA, 2017).
Micrographs were taken on SEM with a field emission gun Hitachi S-4700 (Hitachi, Chiyoda-ku, Tokyo, Japan). EDX analysis was performed on the same apparatus, which also involved a X-MAX X-ray detector (Oxford Instruments, Abingdon, UK). The catalyst samples were prepared by dispersion in ethanol, followed by ultrasonic treatment; they were then deposited on silicon wafer. After a few minutes of drying at room temperature, the samples were metallized by sputter coating of a Pd-Au cathode, using Ar plasma in a Hummer VI device (Anatech Ltd., Battle Creek, MI, USA).
TGA analysis was conducted on catalyst samples after reaction using the SETSYS 24 apparatus (Setaram, Caluire, France) to assess the amount of deposited C.
Surface area analysis (BET physisorption) was undertaken with a Micromeritics ASAP 2020 apparatus (Micrometrics, Norcross, GA, USA), employing N2 at −196 °C.

3.3. Experiments and Calculations

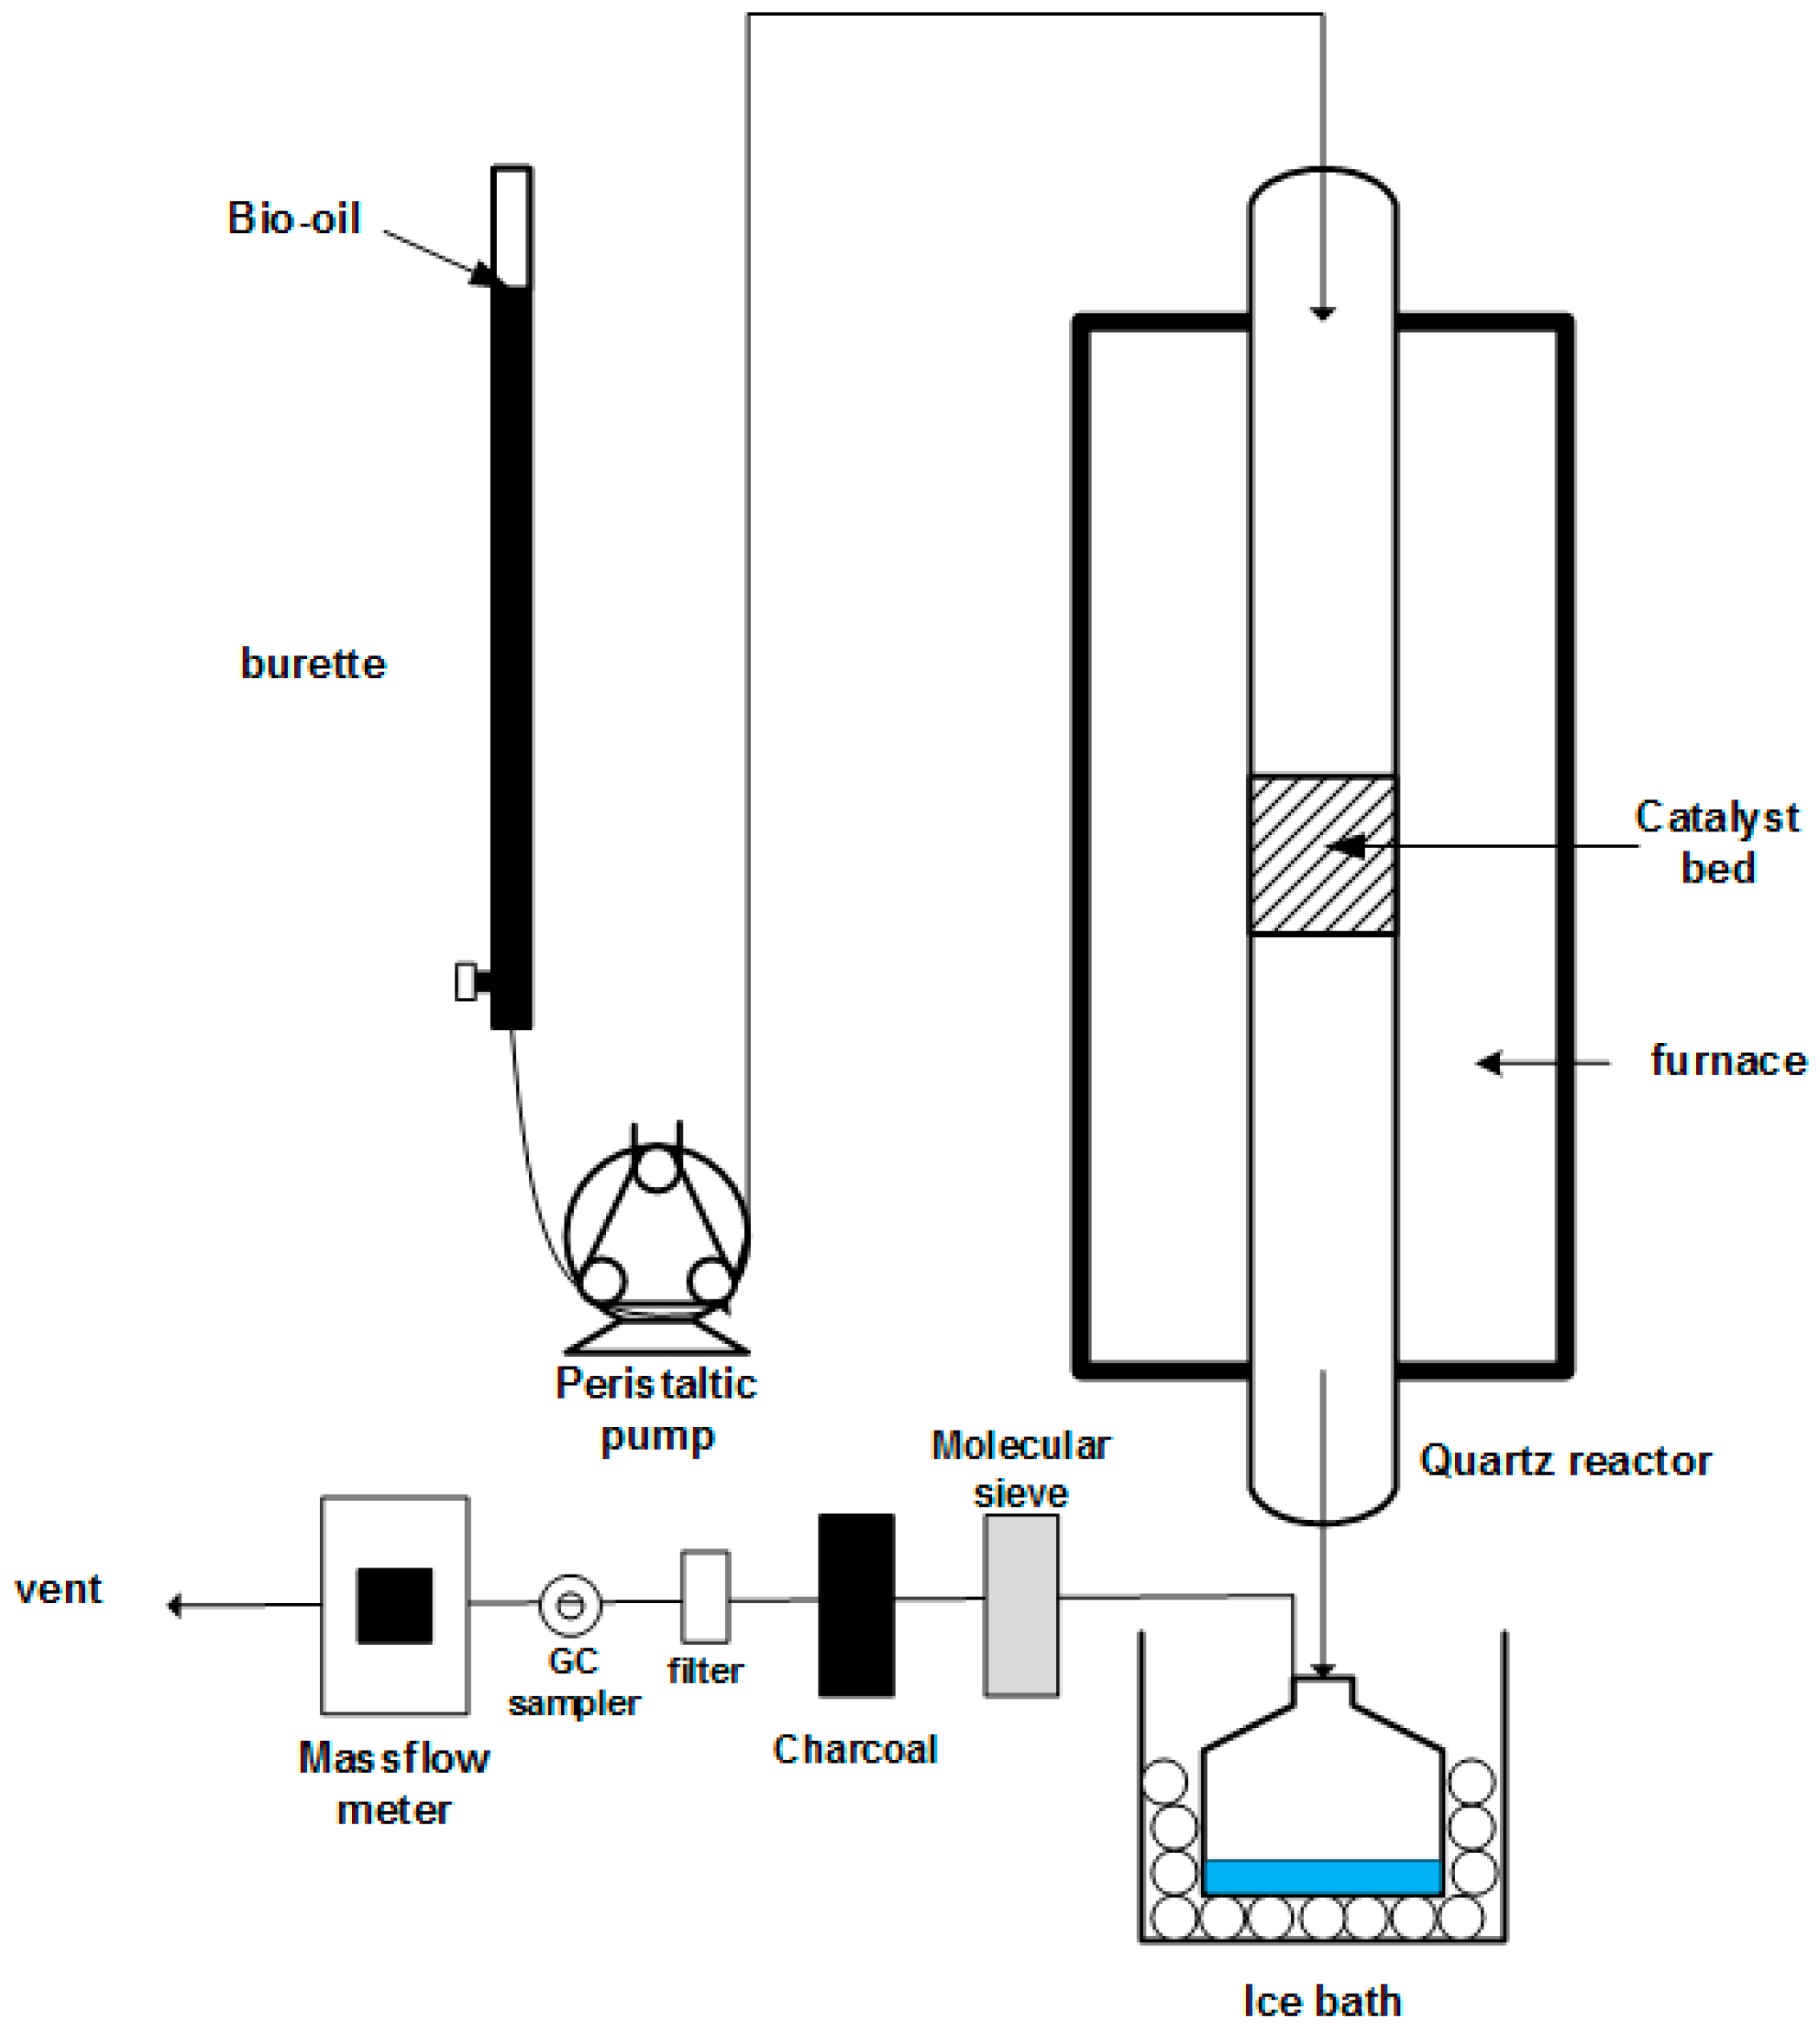
3.3.1. Experimental Set-Up

The layout of the experimental set-up is shown in Figure 17. It comprised a Quartz tube reactor (Technical Glass products, Painesville, OH, USA) (d = 40 mm) placed inside a furnace. The catalyst was positioned in the middle, over a quartz disc, and dispersed in quartz wool. Initially, the bio-oil was in a burette; it was then injected at the top of the reactor by peristaltic pump. Drops fell on the catalyst, and the gas formed after conversion left the reactor and was cooled through an ice bath to condense H2O off the gaseous products. The so-dried gas then passed through a molecular sieve and charcoal columns to remove residual H2O and other impurities, and the last filter removed entrained solids. The gas was then sampled and analyzed in a Varian CP-3800 gas chromatograph (GC). Flowrate was measured by a Delta II mass flow meter (Brooks Instruments, Hatfield, PA, USA).

3.3.2. Test Conditions

Nineteen runs were undertaken in this study. Five temperatures (750, 775, 800, 825 and 850 °C), two catalyst loads (1 and 4 g) and two bio-oils (MemU and WU) were tested: a long-term test (105 h) was also carried out with bio-oil MemU and 4 g of Ni-UGSO. All experiments were performed at atmospheric pressure and without a catalyst activation step. Indeed, as detailed by Lea-Langton et al. [44], bio-oils acted directly as Ni-reducing agents. The test conditions are summarized in Table 6.

3.3.3. Calculations

This section details the main calculation and formulae used to make the elemental mass balance. X C was the conversion of C to gaseous products: CO ,   CO 2 , CH 4 , C 2 H 4 , C 2 H 6
X C = mol   of   gaseous   C mol   of   C   in   biooil × 100
Y i   was selectivity toward the product i H 2 ,   CO ,   CO 2 ,   CH 4
Y H 2 = 2 × mol   of   H 2 mol   of   H   in   biooil × 100
Y CO = mol   of   CO mol   of   C   in   biooil × 100
Y CO 2 = mol   of   CO 2 mol   of   C   in   biooil × 100
Y CH 4 = 4 × mol   of   CH 4 mol   of   H   in   biooil × 100
Y H 2 O was H2O yield
Y H 2 O = mass   of   H 2 O   formed mass   of   biooil × 100
Moles of C, H and O in bio-oils were calculated, knowing the amount injected and the elemental analysis results, which are given in wt % and easily converted to mol %. Mole rates of the gases were calculated with ideal gas Equation (11).
P v ˙ = n ˙ R T
Combination of the GC results with total flowrate measurement allowed mass balance calculations.
An example of the methodology and calculation of elemental mass balance for the testing of bio-oil MemU SR at 800 °C and WHSV = 1.7 g/gcat/h is presented below:
  • The injection flowrate of the bio-oil was adjusted to ~0.1 mL/min; the amounts of C, H and O injected were calculated by multiplying mass flowrate, and the mass fraction of each element was determined by elemental analysis.
  • Concentration measurements of gases by GC are reported in Table 7: the interval between each measurement was 30 min.
  • The flowrate of the produced gas was measured by massflow meter and recorded.
  • Using the ideal gas equation, we calculated the molar flow of each gas at 1 atm and 20 °C, and, by multiplying the stoichiometric number, we got the amount of each element at each time t, and we then summed it to obtain the total (Table 8).
  • We weighed solid C deposited on the reactor wall and the liquid produced in the condenser, considering that it was composed 100% of H2O. In this example, mC = 1.63 g (0.135 mol) and mH2O = 3.43 g (nH = 0.38 mol, nO = 0.19 mol).
  • We calculated the yield at each time t and for each product with Equations (6)–(9) (Table 9).
  • Then, we calculated relative error between input and output and we got (Table 10).

4. Conclusions

Bio-oil SR is one of the promising routes for renewable H2 or biosyngas production. In this work, we undertook SR of two bio-oils without separate steam addition and H2O/C ratio as low as 0.6 and 1.85; we demonstrated the performance of a new spinel catalyst (Ni-UGSO) made from a mining residue via improved solid-state reaction. The catalyst exhibited performances in terms of activity and selectivity, which were close to thermodynamic equilibrium. More precisely:
  • The catalyst was activated quickly (without a pre-reduction step).
  • It was efficient at H2O/C, being 2–5 times lower than those used in industrial H2 production.
  • No severe deactivation was observed in all tests, even after C formation.
Ni-UGSO performed better at low H2O/C ratio with high yield in biosyngas. When bio-oils contained higher amounts of H2O, the catalyst’s activity was lower, mainly due to a lower level of activation through Ni reduction. Moreover, it seemed that high H2O content also enhanced sintering at the catalyst surface.
Longer testing (105 h TOS) demonstrated high resilience of the catalyst, which stayed active during the entire period (105 h) with maximum activity observed in the first 12 h.
XRD spectra showed that, after testing, spinels were reduced to metallic phases of Ni and Ni-Fe alloys.
TGA results reveal that only the catalyst used in MemU oil SR suffered C deposition; the latter accounts for 3.9%. This is considerably lower that all other referred works, despite a lower O/C ≈ 1.
SEM micrographs revealed that, in the case of MemU SR, small Ni crystals appeared, and this represented activated catalyst morphology. In the case of WU SR, the catalyst was not fully activated due to large H2O content, which also induced sintering, which was in agreement with the BET measurements. The micrographs also show some filamentous C formed in SR at low WHSV.

Acknowledgments

This work was made possible with the collaboration of Prof. Kelly Hawboldt from Memorial University (NL, Canada) and Prof. Cedric Briens from Western Ontario University (ON, Canada): they are gratefully acknowledged for supplying the bio-oils. We also acknowledge the Centre de Caractérisation de Matériaux of Université de Sherbrooke for characterization analyses and Mr. Guillaume Hudon and Mr. Yves Pépin of RioTinto Iron and Titanium (Sorel-Tracy, Quebec, Canada) for UGSO supply. The present work was supported financially by BioFuelNet Canada.

Author Contributions

This manuscript represents most of the work done by the first author in relation with his Master Thesis project. Amine Bali has performed all experimental work under the scientific supervision of Nicolas Abatzoglou. He has also produced the first draft of the manuscript. Jasmin Blanchard, second author, has contributed technically in adopting the most appropriate experimental protocols and in the scientific interpretation of the results. Mostafa Chamoumi, third author, co-inventor with Nicolas Abatzoglou of the catalytic formulations tested has also contributed technically in adopting the most appropriate experimental protocols and in the scientific interpretation of the results. Nicolas Abatzoglou, the corresponding author, is the scientific and technical Director of the R&D program, within which this project takes place. He has contributed in choosing the experimental protocols, the catalytic formulations and he followed weekly the work; he has also worked with the first author in reviewing the first draft and finalizing the manuscript.

Conflicts of Interest

The authors declare no conflict of interest.

References

  1. Bridgwater, A.V. Review of fast pyrolysis of biomass and product upgrading. Biomass Bioenergy 2012, 38, 68–94. [Google Scholar] [CrossRef]
  2. Lehto, J.; Oasmaa, A.; Solantausta, Y.; Kytö, M.; Chiaramonti, D. Fuel Oil Quality and Combustion of Fast Pyrolysis Bio-Oils; VTT Publication: Helsinki, Finland, 2013; p. 79. [Google Scholar]
  3. Abdullah, H.; Wu, H. Bioslurry as a fuel. 4. Preparation of bioslurry fuels from biochar and the bio-oil-rich fractions after bio-oil/biodiesel extraction. Energy Fuels 2011, 25, 1759–1771. [Google Scholar] [CrossRef]
  4. Chiaramonti, D.; Bonini, M.; Fratini, E.; Tondi, G.; Gartner, K.; Bridgwater, A.V.; Grimm, H.P.; Soldaini, I.; Webster, A.; Baglioni, P. Development of emulsions from biomass pyrolysis liquid and diesel and their use in engines—Part 1: Emulsion production. Biomass Bioenergy 2003, 25, 85–99. [Google Scholar] [CrossRef]
  5. Elliott, D.C. Historical developments in hydroprocessing bio-oils. Energy Fuels 2007, 21, 1792–1815. [Google Scholar] [CrossRef]
  6. Czernik, S.; Bridgwater, A.V. Overview of applications of biomass fast pyrolysis oil. Energy Fuels 2004, 18, 590–598. [Google Scholar] [CrossRef]
  7. Diebold, J.P. A Review of the Chemical and Physical Mechanisms of the Storage Stability of Fast Pyrolysis Bio-Oils; U.S. Department of Energy: Oak Ridge, TN, USA, 2000.
  8. Diebold, J.P.; Czernik, S. Additives to Lower and Stabilize the Viscosity of Pyrolysis Oils during Storage. Energy Fuels 1997, 11, 1081–1091. [Google Scholar] [CrossRef]
  9. Czernik, S.; French, R. Distributed production of hydrogen by auto-thermal reforming of fast pyrolysis bio-oil. Int. J. Hydrogen Energy 2014, 39, 744–750. [Google Scholar] [CrossRef]
  10. Wang, D.; Czernik, S.; Chornet, E. Production of hydrogen from biomass by catalytic steam reforming of fast pyrolysis oils. Energy Fuels 1998, 12, 19–24. [Google Scholar] [CrossRef]
  11. Czernik, S.; Evans, R.; French, R. Hydrogen from biomass-production by steam reforming of biomass pyrolysis oil. Catal. Today 2007, 129, 265–268. [Google Scholar] [CrossRef]
  12. Czernik, S.; French, R.; Feik, C.; Chornet, E. Hydrogen by Catalytic Steam Reforming of Liquid Byproducts from Biomass Thermoconversion Processes. Ind. Eng. Chem. Res. 2002, 41, 4209–4215. [Google Scholar] [CrossRef]
  13. Wright, M.M.; Daugaard, D.E.; Satrio, J.A.; Brown, R.C. Techno-economic analysis of biomass fast pyrolysis to transportation fuels. Fuel 2010, 89 (Suppl. 1), S2–S10. [Google Scholar] [CrossRef]
  14. Wang, D.; Czernik, S.; Montane, D.; Mann, M.; Chornet, E. Biomass to Hydrogen via Fast Pyrolysis and Catalytic Steam Reforming of the Pyrolysis Oil or Its Fractions. Ind. Eng. Chem. Res. 1997, 36, 1507–1518. [Google Scholar] [CrossRef]
  15. Garcia, L.; French, R.; Czernik, S.; Chornet, E. Catalytic steam reforming of bio-oils for the production of hydrogen: Effects of catalyst composition. Appl. Catal. A Gen. 2000, 201, 225–239. [Google Scholar] [CrossRef]
  16. Rennard, D.; French, R.; Czernik, S.; Josephson, T.; Schmidt, L. Production of synthesis gas by partial oxidation and steam reforming of biomass pyrolysis oils. Int. J. Hydrogen Energy 2010, 35, 4048–4059. [Google Scholar] [CrossRef]
  17. Marda, J.R.; DiBenedetto, J.; McKibben, S.; Evans, R.J.; Czernik, S.; French, R.J.; Dean, A.M. Non-catalytic partial oxidation of bio-oil to synthesis gas for distributed hydrogen production. Int. J. Hydrogen Energy 2009, 34, 8519–8534. [Google Scholar] [CrossRef]
  18. Hu, X.; Lu, G. Bio-oil steam reforming, partial oxidation or oxidative steam reforming coupled with bio-oil dry reforming to eliminate CO2 emission. Int. J. Hydrogen Energy 2010, 35, 7169–7176. [Google Scholar] [CrossRef]
  19. Xie, H.; Yu, Q.; Zuo, Z.; Han, Z.; Yao, X.; Qin, Q. Hydrogen production via sorption-enhanced catalytic steam reforming of bio-oil. Int. J. Hydrogen Energy 2016, 41, 2345–2353. [Google Scholar] [CrossRef]
  20. Seyedeyn-azad, F.; Abedi, J.; Sampouri, S. Catalytic Steam Reforming of Aqueous Phase of Bio-Oil over Ni-Based Alumina-Supported Catalysts. Ind. Eng. Chem. Res. 2014, 53, 17937–17944. [Google Scholar] [CrossRef]
  21. Gao, N.; Han, Y.; Quan, C.; Wu, C. Promoting hydrogen-rich syngas production from catalytic reforming of biomass pyrolysis oil on nanosized nickel-ceramic catalysts. Appl. Therm. Eng. 2017, 125, 297–305. [Google Scholar] [CrossRef]
  22. Quan, C.; Xu, S.; Zhou, C. Steam reforming of bio-oil from coconut shell pyrolysis over Fe/olivine catalyst. Energy Convers. Manag. 2017, 141, 40–47. [Google Scholar] [CrossRef]
  23. Remón, J.; Broust, F.; Volle, G.; García, L.; Arauzo, J. Hydrogen production from pine and poplar bio-oils by catalytic steam reforming. Influence of the bio-oil composition on the process. Int. J. Hydrogen Energy 2015, 40, 5593–5608. [Google Scholar] [CrossRef]
  24. Vagia, E.C.; Lemonidou, A.A. Thermodynamic analysis of hydrogen production via steam reforming of selected components of aqueous bio-oil fraction. Int. J. Hydrogen Energy 2007, 32, 212–223. [Google Scholar] [CrossRef]
  25. Vagia, E.C.; Lemonidou, A.A. Thermodynamic analysis of hydrogen production via autothermal steam reforming of selected components of aqueous bio-oil fraction. Int. J. Hydrogen Energy 2008, 33, 2489–2500. [Google Scholar] [CrossRef]
  26. González-Gil, R.; Chamorro-Burgos, I.; Herrera, C.; Larrubia, M.A.; Laborde, M.; Marino, F.; Alemany, L.J. Production of hydrogen by catalytic steam reforming of oxygenated model compounds on Ni-modified supported catalysts. Simulation and experimental study. Int. J. Hydrogen Energy 2015, 40, 11217–11227. [Google Scholar] [CrossRef]
  27. Trane-Restrup, R.; Jensen, A.D. Steam reforming of cyclic model compounds of bio-oil over Ni-based catalysts: Product distribution and carbon formation. Appl. Catal. B Environ. 2015, 165, 117–127. [Google Scholar] [CrossRef]
  28. Abatzoglou, N.; Fauteux-Lefebvre, C. Review of catalytic syngas production through steam or dry reforming and partial oxidation of studied liquid compounds. Wiley Interdiscip. Rev. Energy Environ. 2016, 5, 169–187. [Google Scholar] [CrossRef]
  29. Rostrup-Nielsen, J.R.; Sehested, J.; Noerskov, J.K. Hydrogen and Synthesis Gas by Steam- and CO2 Reforming. Adv. Catal. 2003, 34, 17. [Google Scholar] [CrossRef]
  30. Bengaard, H.S.; Nørskov, J.K.; Sehested, J.; Clausen, B.S.; Nielsen, L.P.; Molenbroek, A.M.; Rostrup-Nielsen, J.R. Steam Reforming and Graphite Formation on Ni Catalysts. J. Catal. 2002, 209, 365–384. [Google Scholar] [CrossRef]
  31. Navarro, R.M.; Guil-Lopez, R.; Gonzalez-Carballo, J.M.; Cubero, A.; Ismail, A.A.; Al-Sayari, S.A.; Fierro, J.L.G. Bimetallic MNi/Al2O3-La catalysts (M = Pt, Cu) for acetone steam reforming: Role of M on catalyst structure and activity. Appl. Catal. A Gen. 2014, 474, 168–177. [Google Scholar] [CrossRef]
  32. Christensen, K.O.; Chen, D.; Lødeng, R.; Holmen, A. Effect of supports and Ni crystal size on carbon formation and sintering during steam methane reforming. Appl. Catal. A Gen. 2006, 314, 9–22. [Google Scholar] [CrossRef]
  33. Fauteux-Lefebvre, C.; Abatzoglou, N.; Blanchard, J.; Gitzhofer, F. Steam reforming of liquid hydrocarbons over a nickel-alumina spinel catalyst. J. Power Sources 2010, 195, 3275–3283. [Google Scholar] [CrossRef]
  34. Fauteux-Lefebvre, C.; Abatzoglou, N.; Braidy, N.; Achouri, I.E. Diesel steam reforming with a nickel-alumina spinel catalyst for solid oxide fuel cell application. J. Power Sources 2011, 196, 7673–7680. [Google Scholar] [CrossRef]
  35. Achouri, I.E.; Abatzoglou, N.; Braidy, N.; Bastien, S. New insights on the role of YSZ in a NiAl2O4/Al2O3-YSZ catalyst. Appl. Catal. A Gen. 2015, 497, 42–50. [Google Scholar] [CrossRef]
  36. Abatzoglou, N.; Chamoumi, M. Process for Producing Catalysts from Mining Residue and Catalysts Produced Therefrom. WO 2017/011906 A1, 26 January 2017. [Google Scholar]
  37. Chamoumi, M.; Abatzoglou, N.; Blanchard, J.; Iliuta, M.-C.; Larachi, F. Dry reforming of methane with a new catalyst derived from a negative value mining residue spinellized with nickel. Catal. Today 2017, 2, 86–98. [Google Scholar] [CrossRef]
  38. Chamoumi, M. Nouvelle Génération de Catalyseur Supportés par Valorisation d’un Résidu D’enrichessement (Procédé UGS) D’une Scorie de TiO2: Le Catalyseur Ni-UGSO Appliqué au Reformage de Méthane; Université de Sherbrooke: Sherbrooke, QC, Canada, 2017. [Google Scholar]
  39. Arregi, A.; Lopez, G.; Amutio, M.; Barbarias, I.; Bilbao, J.; Olazar, M. Hydrogen production from biomass by continuous fast pyrolysis and in-line steam reforming. RSC Adv. 2016, 6, 25975–25985. [Google Scholar] [CrossRef]
  40. Resende, K.A.; Ávila-Neto, C.N.; Rabelo-Neto, R.C.; Noronha, F.B.; Hori, C.E. Thermodynamic analysis and reaction routes of steam reforming of bio-oil aqueous fraction. Renew. Energy 2015, 80, 166–176. [Google Scholar] [CrossRef]
  41. Rostrup-Nielsen, J.R. Catalytic Steam Reforming; Springer: Berlin, Germany, 1984. [Google Scholar]
  42. Sehested, J.; Gelten, J.A.P.; Helveg, S. Sintering of nickel catalysts: Effects of time, atmosphere, temperature, nickel-carrier interactions, and dopants. Appl. Catal. A Gen. 2006, 309, 237–246. [Google Scholar] [CrossRef]
  43. Braidy, N.; Bastien, S.; Blanchard, J.; Fauteux-lefebvre, C.; Achouri, I.E.; Abatzoglou, N. Activation mechanism and microstructural evolution of a YSZ/Ni-alumina catalyst for dry reforming of methane. Catal. Today 2017, 291, 99–105. [Google Scholar] [CrossRef]
  44. Lea-Langton, A.; Zin, R.M.; Dupont, V.; Twigg, M.V. Biomass pyrolysis oils for hydrogen production using chemical looping reforming. Int. J. Hydrogen Energy 2012, 37, 2037–2043. [Google Scholar] [CrossRef]
  45. Song, P.; Wen, D.; Guo, Z.X.; Korakianitis, T. Oxidation investigation of nickel nanoparticles. Phys. Chem. Chem. Phys. 2008, 10, 5057. [Google Scholar] [CrossRef] [PubMed]
  46. Papari, S.; Hawboldt, K.; Helleur, R. Production and Characterization of Pyrolysis Oil from Sawmill Residues in an Auger Reactor. Ind. Eng. Chem. Res. 2017, 56, 1920–1925. [Google Scholar] [CrossRef]
  47. Gooty, A.T.; Li, D.; Berruti, F.; Briens, C. Kraft-lignin pyrolysis and fractional condensation of its bio-oil vapors. J. Anal. Appl. Pyrolysis 2014, 106, 33–40. [Google Scholar] [CrossRef]
  48. Venderbosch, R.H.; Ardiyanti, A.R.; Wildschut, J.; Oasmaa, A.; Heeres, H.J. Stabilization of biomass-derived pyrolysis oils. J. Chem. Technol. Biotechnol. 2010, 85, 674–686. [Google Scholar] [CrossRef]
  49. Guéguin, M.; Cardarelli, F. Chemistry and Mineralogy of Titania-Rich Slags. Part 1—Hemo-Ilmenite, Sulphate, and Upgraded Titania Slags. Miner. Process. Extr. Metall. Rev. 2007, 28, 1–58. [Google Scholar] [CrossRef]
  50. Chamoumi, M.; Abatzoglou, N. NiFe2O4 production from α-Fe2O3 via improved solid state reaction: Application as catalyst in CH4 dry reforming. Can. J. Chem. Eng. 2016, 94, 1801–1808. [Google Scholar] [CrossRef]
Figure 1. Results of bio-oil MemU SR: (A) WHSV = 6.6 g/gcat/h; and (B) WHSV = 1.7 g/gcat/h.
Catalysts 08 00001 g001
Figure 2. Bio-oil WU results: (A) WHSV = 7.1 g/gcat/h; and (B) WHSV = 1.8 g/gcat/h.
Catalysts 08 00001 g002
Figure 3. Concentration and selectivity profiles of bio-oil WU SR at 800 °C: (A,B) WHSV = 1.8 g/gcat/h; and (C,D) WHSV = 7.1 g/gcat/h.
Catalysts 08 00001 g003aCatalysts 08 00001 g003b
Figure 4. Concentration and selectivity profiles of bio-oil MemU SR at 800 °C: (A,B) WHSV = 1.7 g/gcat/h; and (C,D) WHSV = 6.6 g/gcat/h.
Catalysts 08 00001 g004aCatalysts 08 00001 g004b
Figure 5. Concentration (A); and selectivity (B) profiles of bio-oil MemU SR at 800 °C, WHSV = 2.0 g/gcat/h and TOS = 105 h. Note: Peaks and outlier values that appear in the graph were due to burette refilling with bio-oil.
Catalysts 08 00001 g005
Figure 6. SEM of fresh Ni-UGSO.
Catalysts 08 00001 g006
Figure 7. Micrographs of Ni-UGSO after bio-oil MemU SR at 800 °C: (A) WHSV = 1.7 g/gcat/h; and (B) WHSV = 6.6 g/gcat/h.
Catalysts 08 00001 g007
Figure 8. EDX mapping of Ni particles after bio-oil MemU SR (E = 20 kV).
Catalysts 08 00001 g008
Figure 9. Micrographs of Ni-UGSO after bio-oil MemU SR at 800 °C: (A,B) WHSV = 1.7 g/gcat/h; and (C,D) WHSV = 6.6 g/gcat/h.
Catalysts 08 00001 g009
Figure 10. Micrographs of Ni-UGSO after bio-oil MemU SR at 800 °C, WHSV = 2.0 g/gcat/h and TOS = 105 h. (A) Zone without C deposits; (B) Zone with C deposits.
Catalysts 08 00001 g010
Figure 11. XRD spectra of fresh catalyst.
Catalysts 08 00001 g011
Figure 12. XRD spectra of Ni-UGSO after bio-oil WU SR at 800 °C: (A) WHSV = 1.8 g/gcat/h; and (B) WHSV = 7.1 g/gcat/h.
Catalysts 08 00001 g012
Figure 13. XRD spectra of Ni-UGSO after bio-oil MemU SR at 800 °C: (A) WHSV = 1.7 g/gcat/h; and (B) WHSV = 6.6 g/gcat/h.
Catalysts 08 00001 g013aCatalysts 08 00001 g013b
Figure 14. XRD spectra of Ni-UGSO after bio-oil MemU SR at 800 °C, WHSV = 2.0 g/gcat/h and TOS = 105 h.
Catalysts 08 00001 g014
Figure 15. TGA results of Ni-UGSO after SR at T = 775 °C and low WHSV: (A) bio-oil WU; and (B) bio-oil MemU.
Catalysts 08 00001 g015
Figure 16. Ni-UGSO synthesis by the improved solid-state reaction.
Catalysts 08 00001 g016
Figure 17. Experimental set-up.
Catalysts 08 00001 g017
Table 1. Bio-oil properties.
PropertiesBio-Oil MemUBio-Oil WU
Density1.1871.087
% C *39.418.8
% H *7.07.9
% O *53.673.3
% H2O *34.352.3
pH2.42.9
H2O/C **0.601.85
O/C **1.022.92
* Weight percentages; ** Molar ratios.
Table 2. Comparison of YH2 results obtained from different works on bio-oils SR.
CatalystFeedstockTemperature (°C)H2O/C (mol/mol)Space Velocity (h−1)ReactorTOS (h)YH2 (%)Reference
Ni-UGSORBO MemU750–8500.61.7–6.6 (W)Fixed bed8.378–95This work
RBO WU1.91.8–7.1 (W)16–43
C11-NKBOAq800–8507–90.96–2.7 (W)Fluidized bed4–9077–89[12]
Ni-MgO/Al2O3BOAq8503.2–4.230 (W)Fixed bed112–61[20]
Ni/ceramic foamRBO500–8002.61.5–4 (W)Fixed bed0.5–254.5–93.5[21]
ICI 46-1/4BOAq700–755–35760–1130 (G)Fixed bed1–676–100[10]
UCI G-91
Ce-Ni/Co/Al2O3 + CO2 sorbentRBO650–8509–150.08–0.23 (L)Fixed bed0.565–85[19]
Ni/Al2O3BOAq6000.5–3.51.5–3.8 (W)Fixed bed (CLR)0.6–1.759–83[44]
G90LDPRBO550–7003.9–9.72–24
(W) **
Fluidized bed-20–95[39]
RBO: Raw Bio-Oil; BOAq: Bio-Oil Aqueous fraction; W: WHSV; L: LHSV; G: GC1HSV; ** gvolatiles/gcat/h.
Table 3. Long TOS test results of bio-oil MemU SR.
T = 800 °C
WHSV = 2.0 g/gcat/h Δt = 105 h
Bio-Oil MemU
Period (h) X C   (%) Y H 2   (%) Y C O   (%) Y C O 2   (%) Y C H 4   (%) y H 2   (%) y C O   (%) y C O 2   (%) y C H 4   (%)
0–1296.210081.614.10.8752.639.76.80.9
30–10596.766.852.725.06.943.132.214.89.4
Table 4. XRD phase legend.
Catalysts 08 00001 i001NiFeAlO4, MgAl2O4, FeAl2O4 Catalysts 08 00001 i002SiO2 (from quartz wool)
Catalysts 08 00001 i003MgO, NiO, NiO-MgO Catalysts 08 00001 i004Fe3C
Catalysts 08 00001 i005Ni, FeNi, Fe0.5Ni0.5, FeNi3 Catalysts 08 00001 i006Fe2O3
Catalysts 08 00001 i007Carbone
Table 5. BET results.
SampleS (m2/g)Pore Volume (cm3/g)
Fresh catalyst6.700.0202
Used catalyst (MemU)10.490.0241
Used catalyst (WU)8.980.0144
Table 6. Experimental conditions.
ReactantCatalyst WeightTemperature (°C)Injection FlowrateTOS
Bio-oil WU
Bio-oil MemU
1 g and 4 g750, 775, 800, 825, 850~0.1 mL/min~500 min
Bio-oil MemU4 g800~0.1 mL/min105 h
Table 7. Gas composition from GC analysis.
Time (min)Concentration (% mol)
CO2COH2C2H4C2H6CH4
00.000.000.000.000.000.00
96.2732.2257.880.080.133.42
2413.6038.2547.650.030.050.41
546.3941.0051.890.010.030.66
846.2640.4652.520.010.020.74
1146.4940.0752.650.000.010.78
1446.7739.8552.560.000.010.81
1746.8639.8752.400.000.010.86
2047.0039.6752.400.000.010.92
2346.9639.7452.370.000.000.92
2646.9339.9152.150.000.001.00
2946.9339.9252.100.000.001.04
3247.3539.0552.420.000.001.17
3547.2239.5152.110.000.001.15
3847.2939.5751.840.010.001.29
4147.2139.6951.820.010.011.27
4597.1739.5251.870.010.011.42
5047.4639.0951.900.010.011.53
Table 8. Moles calculated for each molecule at each time t.
Time (min)Number of Moles
C inH inCO2COH2C2H4C2H6CH4
000000000
90.03470.07420.00330.01690.03030.00000.00010.0018
240.05790.12370.01530.04300.05350.00000.00010.0005
540.11580.24740.01330.08520.10780.00000.00010.0014
840.11580.24740.01280.08280.10750.00000.00000.0015
1140.11580.24740.01280.07900.10380.00000.00000.0015
1440.11580.24740.01370.08090.10670.00000.00000.0016
1740.11580.24740.01390.08100.10640.00000.00000.0017
2040.11580.24740.01510.08550.11290.00000.00000.0020
2340.11580.24740.01490.08520.11230.00000.00000.0020
2640.11580.24740.01450.08350.10920.00000.00000.0021
2940.11580.24740.01530.08840.11540.00000.00000.0023
3240.11580.24740.01690.08960.12030.00000.00000.0027
3540.11580.24740.01680.09170.12100.00000.00000.0027
3840.11580.24740.01710.09280.12150.00000.00000.0030
4140.11580.24740.01630.08970.11710.00000.00000.0029
4590.17370.37110.02560.14140.18550.00000.00000.0051
5040.17370.37110.02570.13460.17870.00000.00000.0053
ElementTotal Element Produced per MoleculeTotal
C1.9456 0.26331.4511 0.00050.00080.04001.7558
H 4.1564 3.82000.00110.00250.16023.9837
O 0.52661.4511 1.9778
Table 9. Yield of each product.
Time (min)Yield (%)
CO2COH2C2H4C2H6CH4
00.00.00.00.20.59.7
99.548.68.70.10.31.5
2426.474.286.50.00.22.2
5411.573.687.20.00.12.4
8411.171.586.90.00.12.5
11411.168.283.90.00.02.7
14411.969.886.20.00.02.8
17412.069.986.00.00.03.2
20413.073.891.30.00.03.2
23412.973.690.80.00.03.4
26412.572.188.20.00.03.7
29413.376.493.30.00.04.3
32414.677.497.30.00.04.3
35414.579.297.80.00.04.9
38414.880.198.20.00.04.6
41414.177.494.60.00.05.5
45914.881.4100.00.00.05.7
50414.877.596.30.20.59.7
Table 10. Error calculation results.
C in (mol)C out (mol)Error (%)
1.961.893.73
H in (mol)H out (mol)Error (%)
4.204.363.98
O in (mol)O out (mol)Error (%)
2.002.178.25
Bio-Oil in (g)Bio-Oil out (g)Error (%)
59.8261.763.23

