


Abstract
Volatile organic compounds (VOCs) have adverse effects on both humans and the environment. Catalytic abatement of VOC emissions is regarded as an efficient solution, and transition metal oxides, like Co3O4, are promising catalysts due to their high activity, abundance and low cost. Previous studies have correlated catalytic activity with the Co3+/Co2+ ratio, absorbed oxygen species and specific exposed facets. However, the reaction mechanism and the active oxygen species remain unclear. This work focuses on propene oxidation over Co3O4 catalysts that were synthesized by four different methods, leading to significant morphological differences. Despite variability in specific surface area, particle size/geometry and population of oxygen species, catalytic experiments showed similar specific rates but different apparent activation energies (Eapp). Propene-TPD/TPSR experiments confirmed the participation of lattice oxygen and indicated that chemisorbed oxygen is used at low reaction temperatures, while lattice oxygen is activated at higher temperatures. Detailed kinetic experiments revealed complex kinetic behavior that can be explained by the simultaneous operation of two pathways: a competitive Langmuir–Hinshelwood (LH) mechanism and a redox, Mars–van Krevelen (MvK) mechanism. Catalytic and kinetic data suggest that any structural differences observed in the prepared catalysts did not affect the intrinsic activity nor the mechanism of propene oxidation.
1. Introduction
Volatile organic compounds (VOCs) encompass a wide range of organic chemicals that are typically found in gaseous form. Important groups of VOCs, like aliphatic hydrocarbons, aromatic hydrocarbons, oxygenated and halogenated VOCs, have been linked with adverse effects on both humans and the environment due to their toxicity, carcinogenicity and ability to readily react with other substances, contributing to acid deposition, formation of ozone, organic aerosol and photochemical smog, increasing pollution rates and even exacerbating climate change effects depending on VOC type [1,2,3,4,5]. VOCs have multiple anthropogenic sources, mainly industrial processes, combustion engines, pesticides, paints and many domestic sources (e.g., perfumes, tobacco smoke, carpets, new clothing, building materials) [6,7,8,9].
Catalytic emission abatement technologies are a promising solution to control VOC emissions, and they are regarded as an efficient, low-cost alternative to thermal combustion [10,11]. Among potential catalysts, transition metal oxides have emerged as interesting candidates, owing to their abundance, low cost and resistance to sintering/poisoning compared to noble metal catalysts [10,12]. Co3O4 is one of the most active metal oxides and therefore has gathered significant scientific interest. Its spinel structure, in which Co2+ ions occupy tetrahedral sites and Co3+ ions occupy octahedral sites, promotes facile Co2+/Co3+ redox cycling, oxygen vacancy formation and the coexistence of reactive lattice and surface oxygen species [13,14,15,16]. Combined with its highly tunable morphology [17,18], these characteristics make Co3O4 an ideal model catalyst for investigating structure–activity relationships in VOC oxidation. Co3O4 has been evaluated for the oxidation of a wide range of VOCs, mainly aromatic hydrocarbons, halogenated VOCs, light alkanes and formaldehyde [19,20,21,22,23,24,25], and researchers often propose structure–activity relationships concerning the Co3+/Co2+ ratio, exposed crystal facets and surface oxygen species [26,27,28]. Despite intensive research, the role of oxygen species and the mechanism of VOC oxidation remain subjects of ongoing debate. Separate studies on toluene and styrene oxidation over Co3O4 have proposed that adsorbed oxygen is the active oxygen species at low temperatures and lattice oxygen takes over at higher temperatures [29,30]. A kinetic study on propane oxidation fitted experimental data successfully with an LH model [31], while another study on propane oxidation over Ni-doped Co3O4 concluded that the reaction proceeds via an MvK mechanism [32]. Detailed kinetic studies, including multiple temperatures and reactant concentrations, are scarce, but necessary, especially when multiple kinetic regimes may coexist.
This work aims to check for structure–activity relationships in propene oxidation over Co3O4 and elucidate the role of oxygen species in the reaction mechanism. Propene was selected as the model VOC, representing an important and under-investigated class of VOCs, that of light alkenes. Co3O4 catalysts were prepared by four different synthesis methods and were characterized extensively with N2-physisorption, XRD, SEM, XPS, H2-TPR and Raman spectroscopy. The population of oxygen species was investigated via O2-TPD, while propene-TPD/TPSR experiments shed light on the interactions between propene and the catalytic surface. Catalytic experiments were performed in order to evaluate the intrinsic activity of each catalyst, while detailed kinetic experiments, at multiple temperatures and partial pressures of reactants, provided important mechanistic clues.
2. Results and Discussion
2.1. Catalyst Preparation
Four catalysts were synthesized by four different methods. Co-HY was prepared by a hydrothermal method, Co-PR by precipitation, Co-CA by citric acid complexation and Co-CM by combustion of the cobalt nitrate precursor. The four preparation methods involve different formation environments and thermal treatment conditions, which can possibly influence the structural characteristics of the resulting Co3O4 catalysts, such as crystallite size, particle morphology, defect concentration, surface Co3+/Co2+ ratio and exposed crystallographic planes. It should be emphasized, though, that the employed synthesis methods did not include any templating or structure-directing agent that would specifically promote the exposure of specific facets.
2.2. Catalyst Characterization
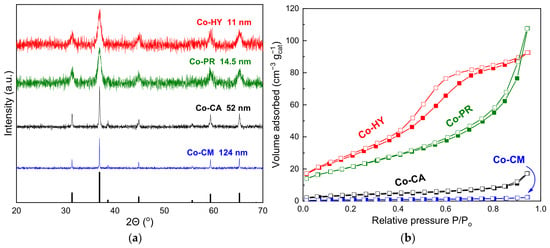
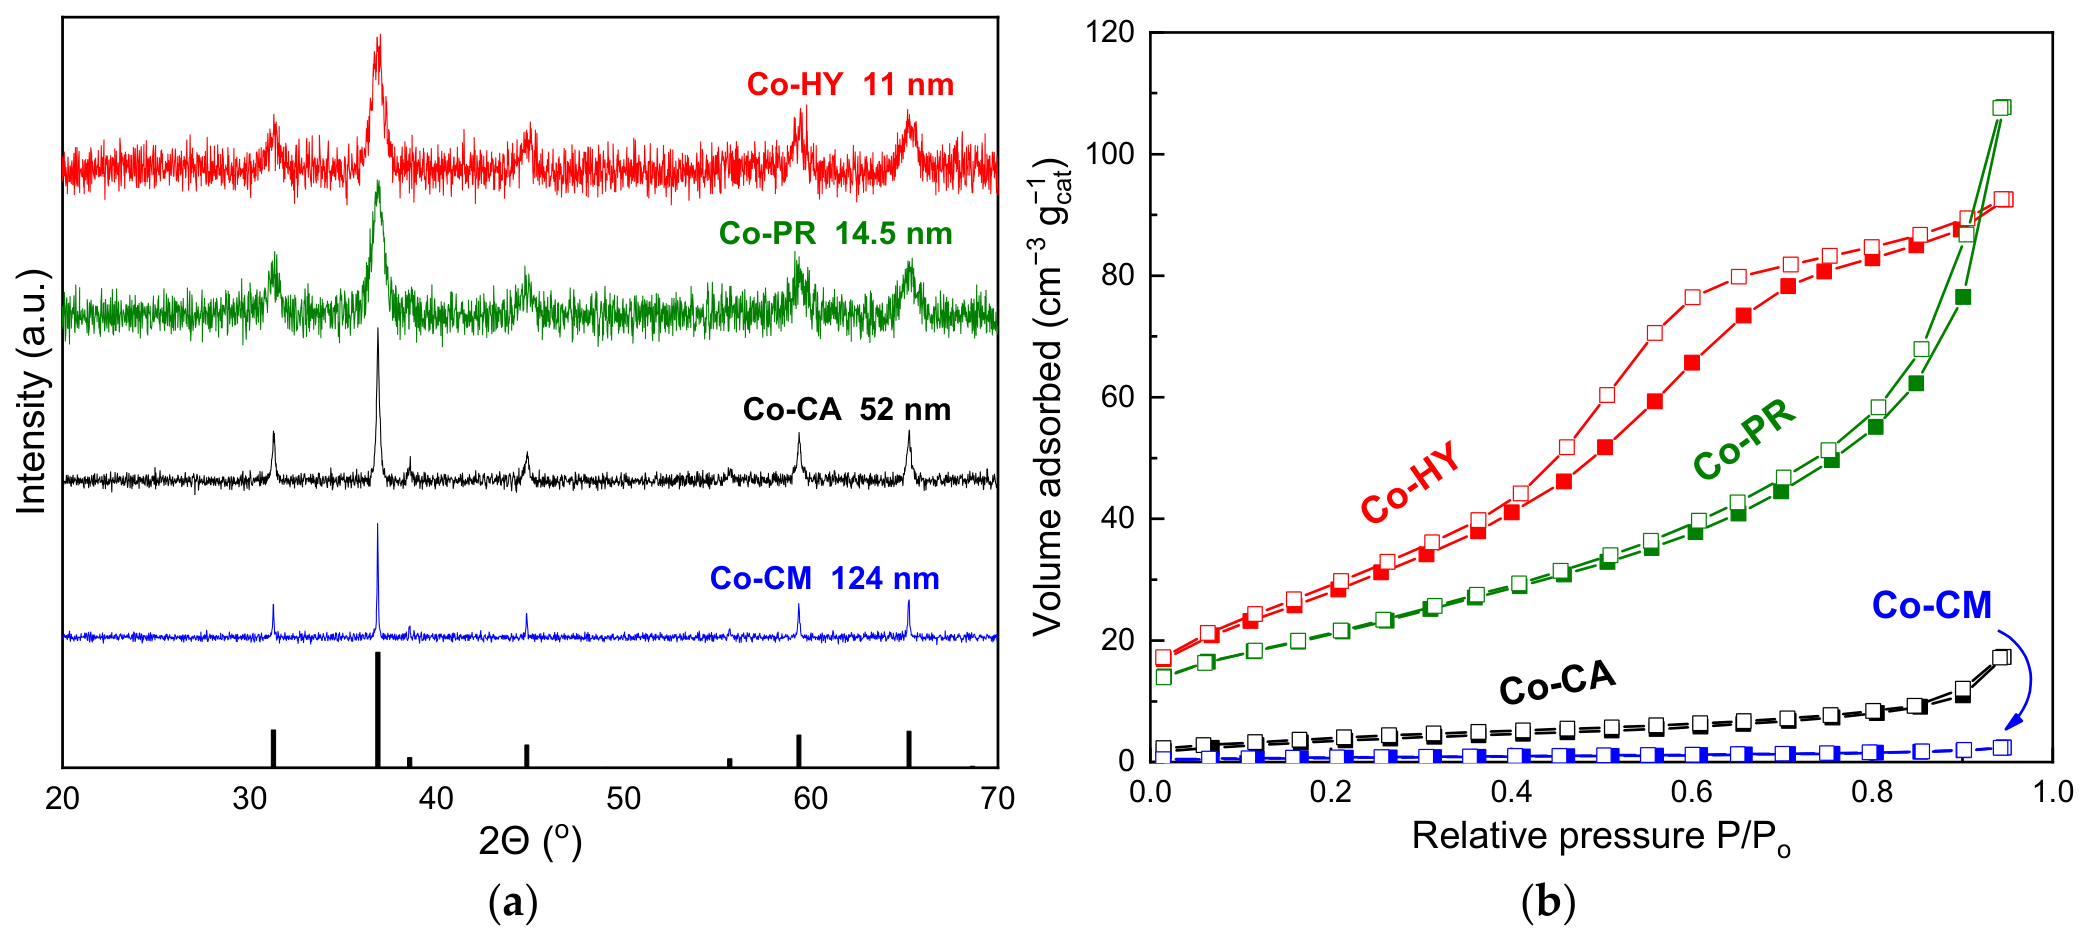
The prepared catalysts were characterised extensively in order to correlate their textural/structural properties with their intrinsic activities. Figure 1a shows the powder XRD patterns of the Co3O4 catalysts. The 2θ diffraction peaks at 19.1° (111), 31.2° (220), 36.8° (311), 38.5° (222), 44.7° (400), 55.6° (422), 58.9° (511), and 64.7° (440) correspond to spinel Co3O4 (PDF:01-080-1532 Fd3m space group) [33,34]. The average crystallite size of the samples was calculated using the Scherrer equation. The average crystallite size values fall in the range of 11–124 nm and are presented in Table 1. Figure 1b shows the N2 adsorption/desorption isotherms of all prepared Co3O4 catalysts. All isotherms are of type IV with an H3 hysteresis loop, according to the IUPAC classification [35], characteristic of mesoporous materials. The BET-specific surface area was found to be in the range of 2.4–110 m2 g−1 and was inversely related to the average crystallite size. The specific surface areas, along with the total pore volumes calculated from the isotherms, are presented in Table 1.
Figure 1.
XRD diffractograms (a) and N2-physisorption isotherms (b).
Table 1.
Structural characteristics of Co3O4 catalysts.
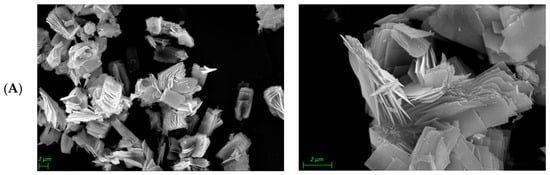
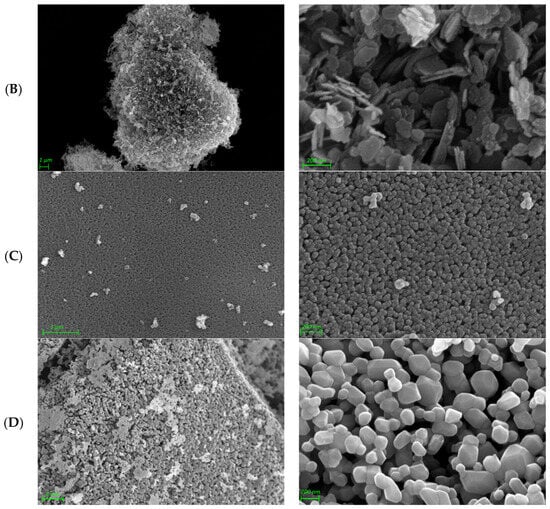
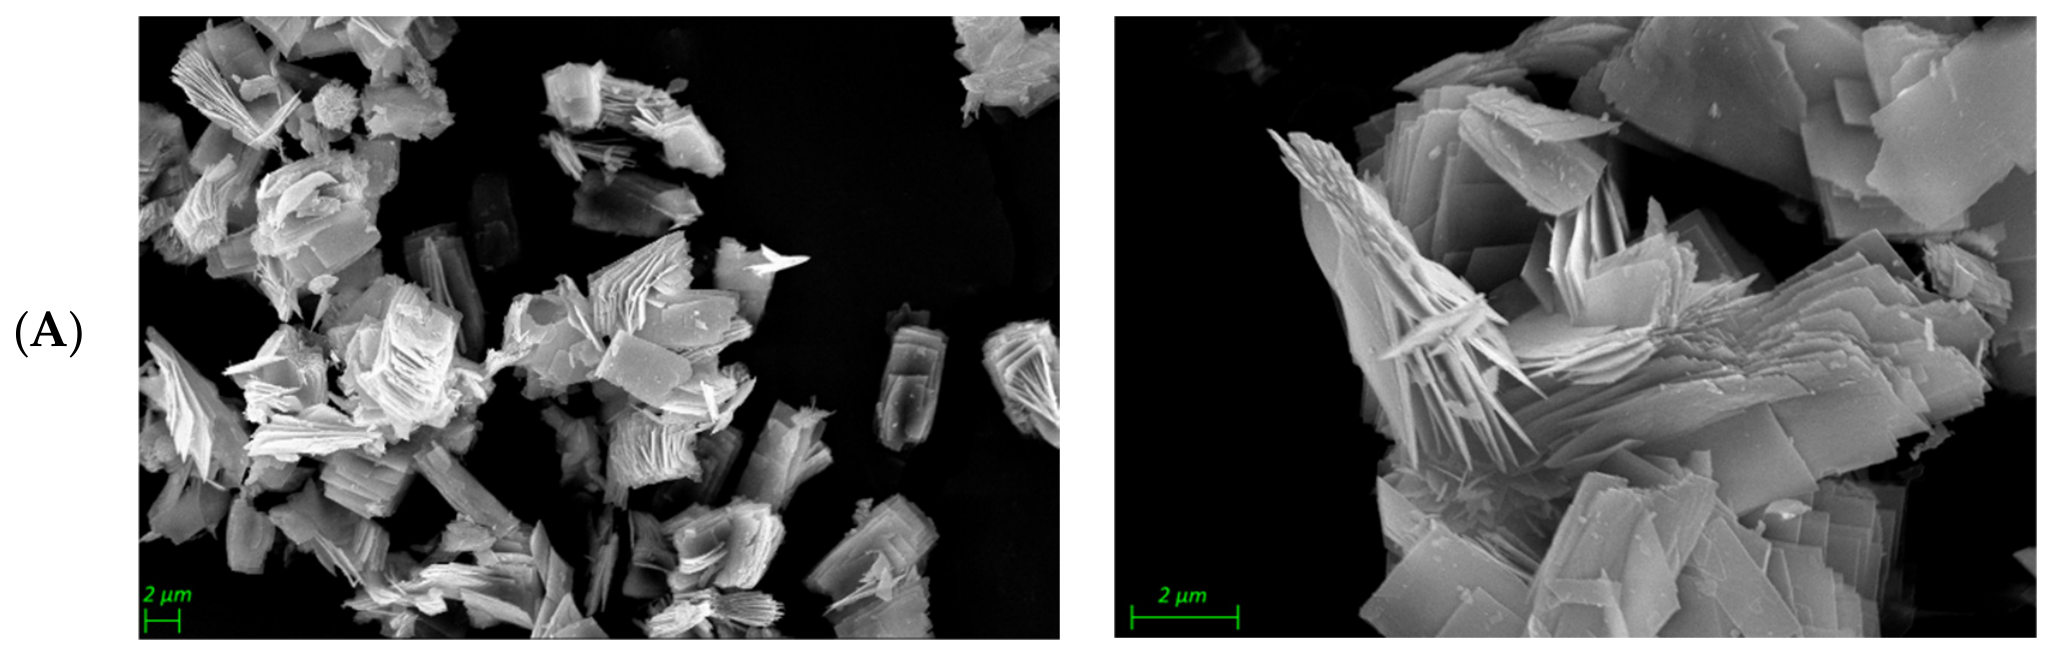
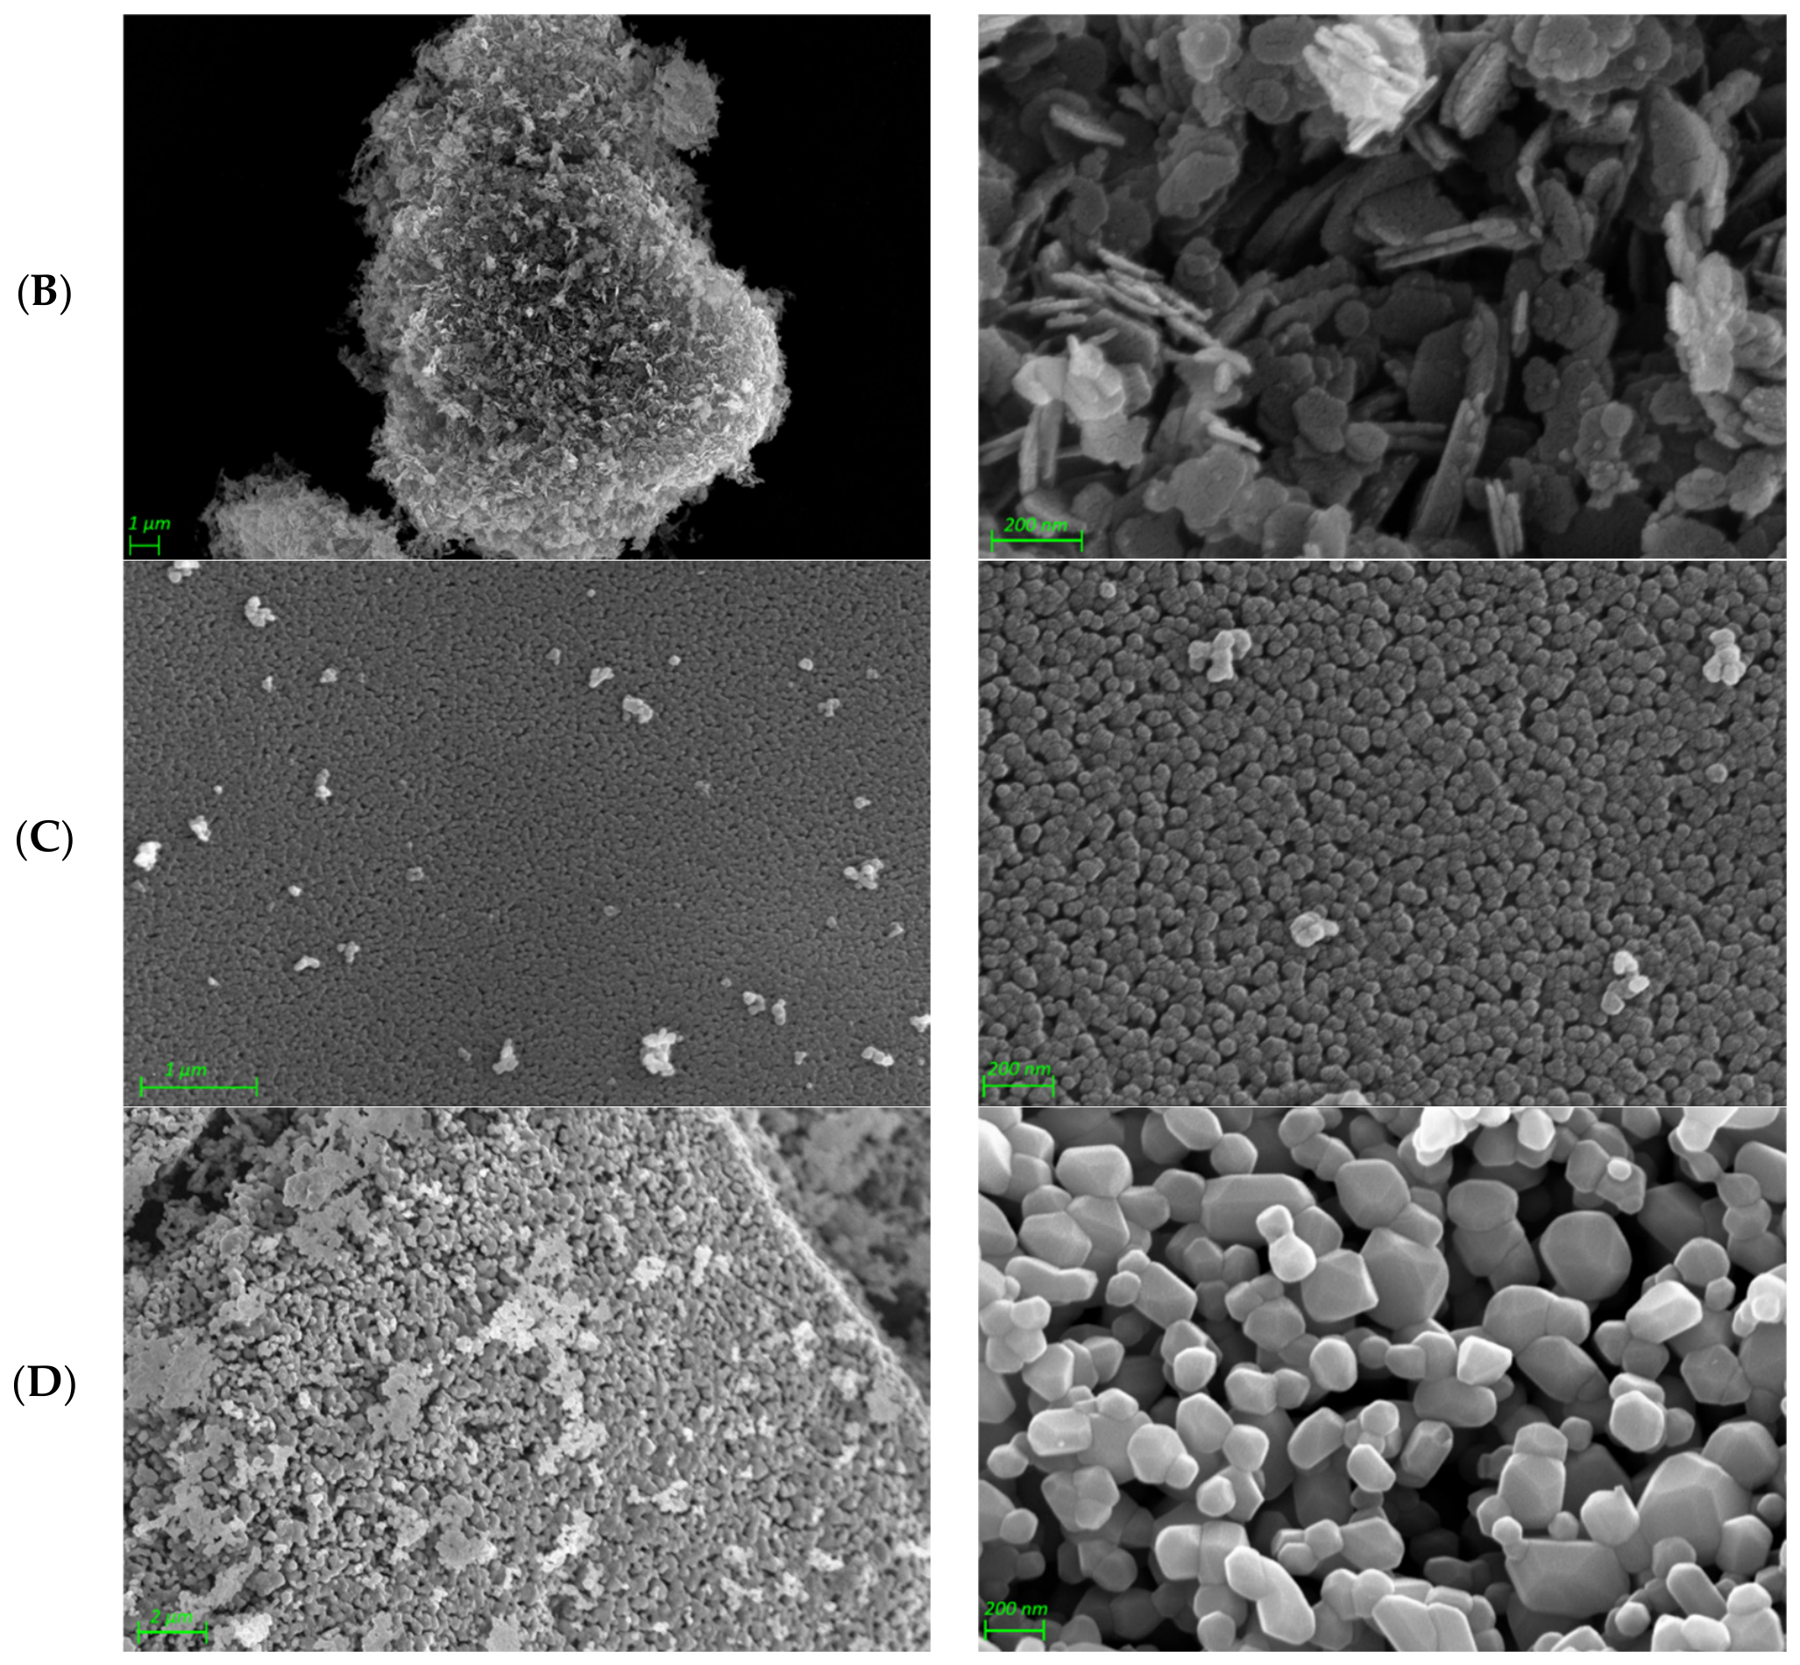
Figure 2A shows SEM images of the Co-HY catalyst. It is composed of nanosheets stacked on top of each other with a size larger than 2 μm. In Figure 2B, Co-PR forms 2D hexagonal plates with an average size close to 200 nm. In Figure 2C,D, samples Co-CA and Co-CM show highly crystalline cube-like particles ranging from 50 to 200 nm.
Figure 2.
SEM images of Co3O4 catalysts: (A) Co-HY, (B) Co-PR, (C) Co-CA and (D) Co-CM.
The Raman spectra of Co3O4 catalysts are compiled in Figure S1. They contain five bands, which can be assigned to Raman-active modes of Co3O4: A1g (657 cm−1, attributed to octahedral sites (CoO6)), F2g2 (591 and 498 cm−1), Eg (456 cm−1) and F2g1 (178 cm1, related to tetrahedral sites (CoO4)) [36,37,38].
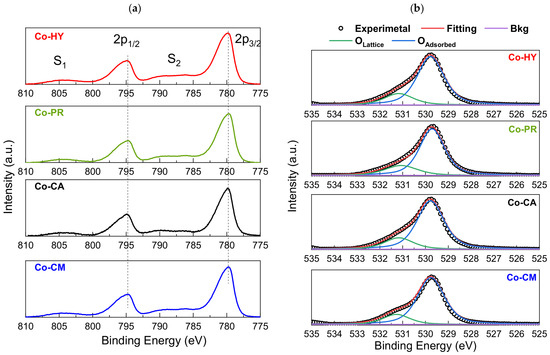
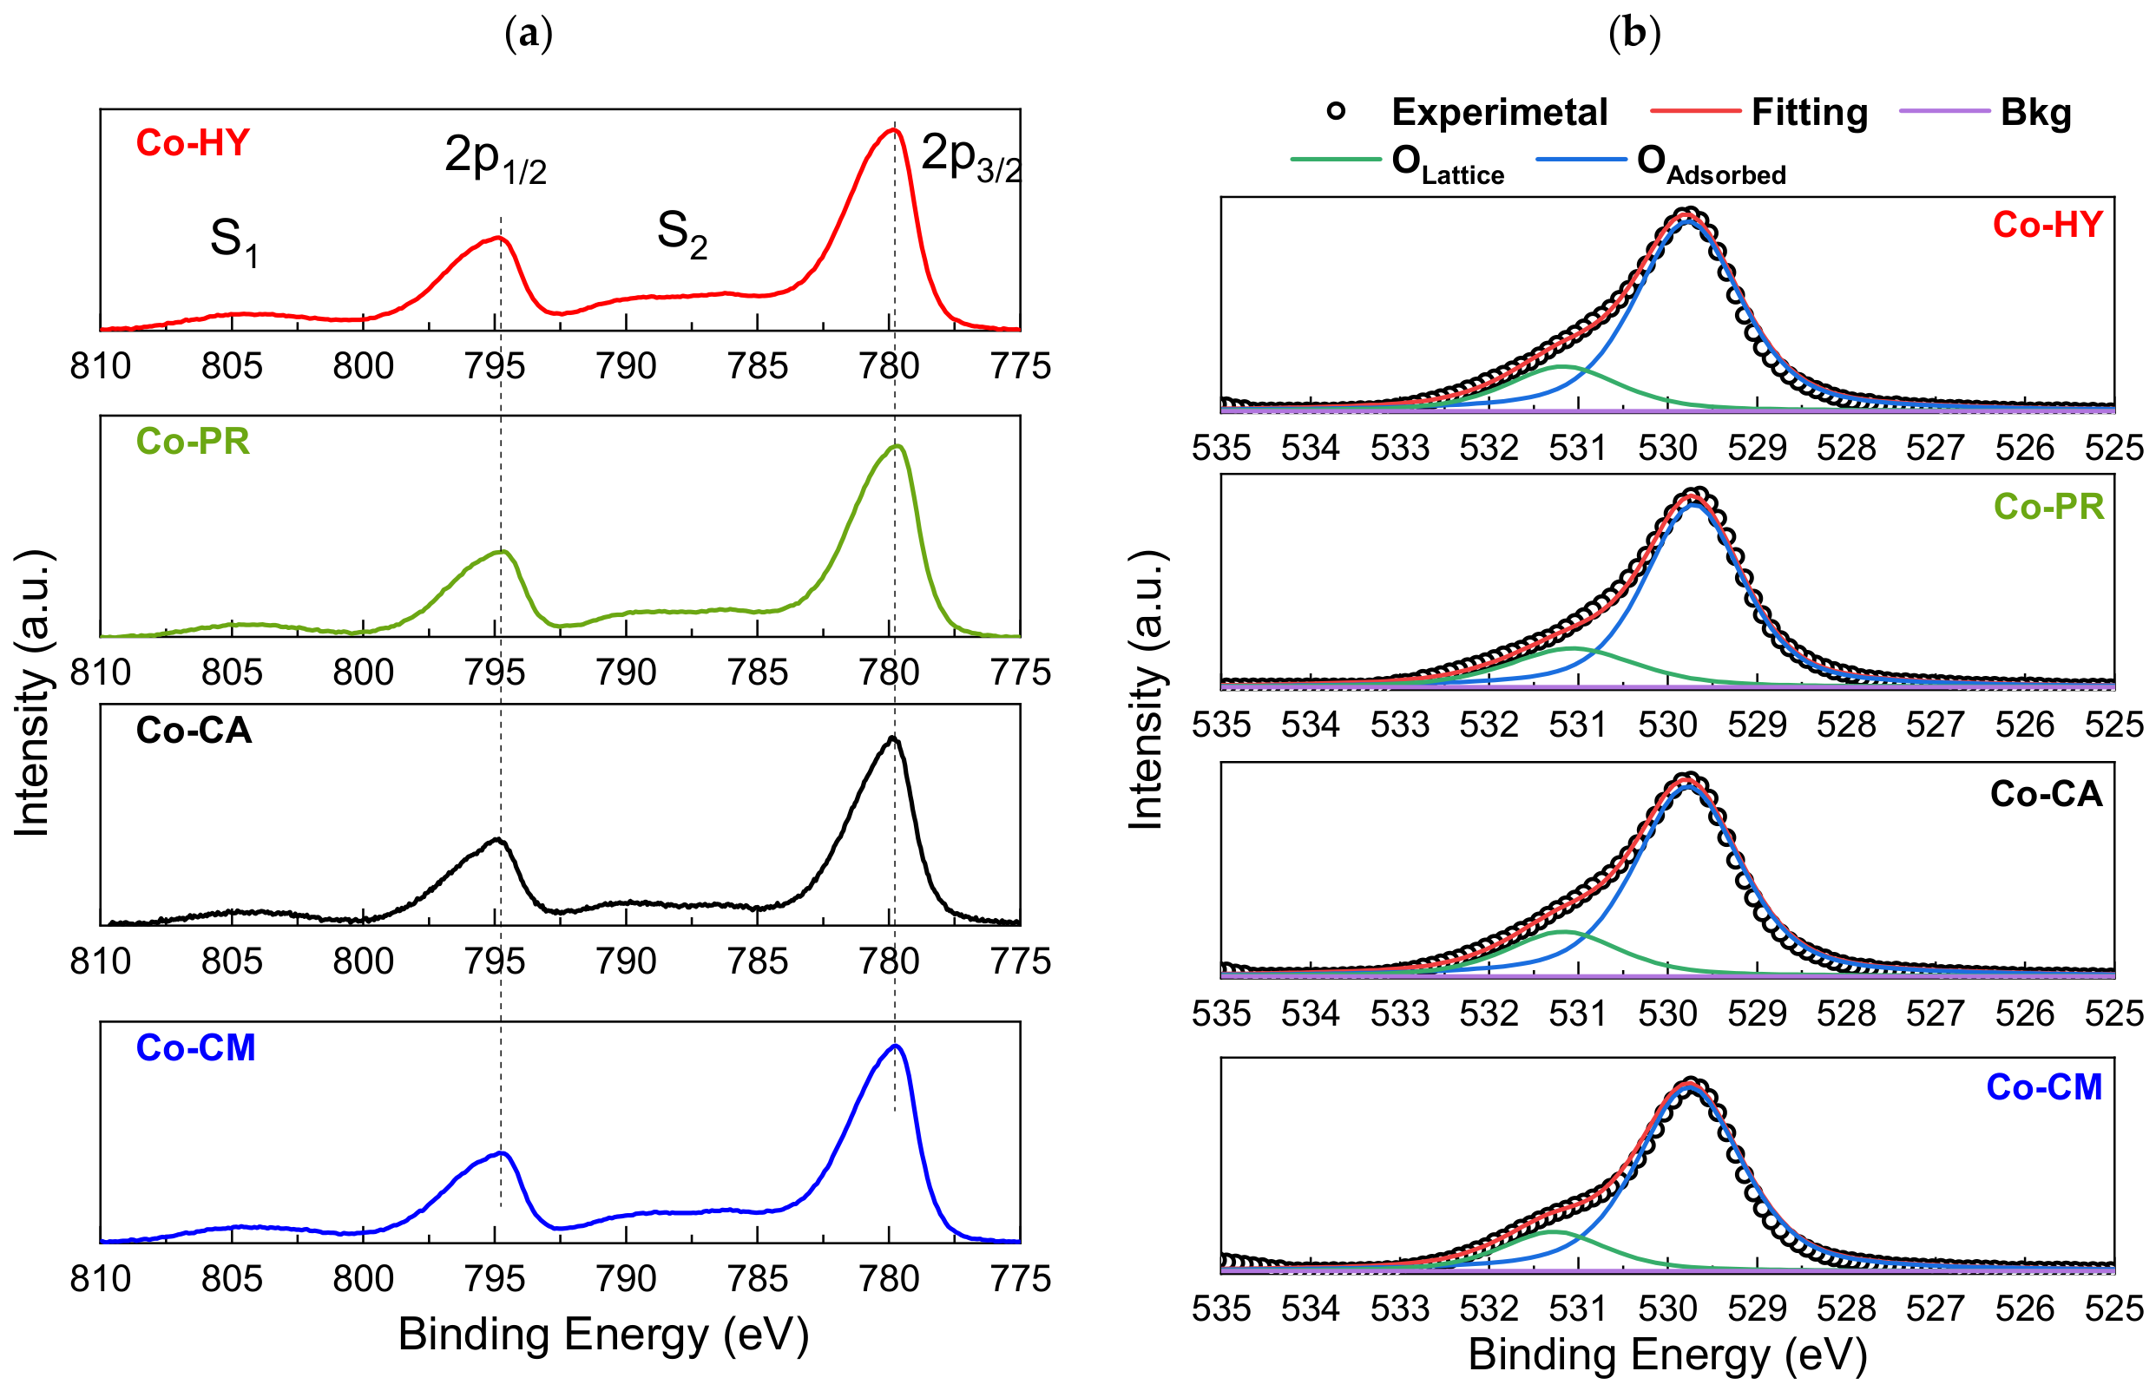
X-ray photoelectron spectroscopy was employed for the investigation of the surface oxidation state of Co3O4 catalysts. Co 2p and O 1s core level spectra are depicted in Figure 3. Co 2p XP spectra (Figure 3a) consist of two main peaks centered at 779.9–780.3 eV and 795.1–795.5 eV, with a spin–orbit separation of 15.1 eV attributed to Co 2p3/2 and Co 2p1/2, respectively. Additional satellite peaks are observed in the regions 800–810 eV and 784–792 eV, denoted as S1 and S2, respectively, in agreement with the literature [39,40,41]. The presence of the broad S2 satellite peak is characteristic of the Co3O4 phase. S2 has two constituents at 790 eV and 786 eV, which are attributed to Co3+ and Co2+, confirming the existence of both oxidation states [42,43]. Co3+ and Co2+ both contribute to the Co 2p peaks, and an approximate ratio can be calculated by deconvoluting both 2p peaks together with their satellites. Figure S3 shows the deconvolution of the 810–775 eV region into eight components, consisting of the Co2+ and Co3+ 2p3/2 and 2p1/2 doublet contributions, together with their corresponding satellite peaks. The peak positions of the deconvoluted spectra can be found in Table S1. The Co3+/(Co3+ + Co2+) surface ratio for each sample is shown in Table 2, and it was calculated from the integrated areas of the main Co3+ and Co2+ doublet components. The ratio is similar for all samples (0.48–0.50), indicating no significant differences between the samples. It should be emphasized that distinguishing between Co3+ and Co2+ oxidation states is a difficult task since their primary Co 2p peaks overlap significantly. Therefore, the calculated Co3+/Co2+ ratios should be considered primarily for relative comparison between samples rather than precise determination of the oxidation state of surface cobalt ions. O 1s XP spectra feature a main peak centered at 529.7 eV, attributed to lattice oxygen species, followed by a shoulder at a higher binding energy of 531.2 eV, which is assigned to absorbed oxygen species and surface hydroxyl groups. Nevertheless, in all samples, lattice oxygen species are the main species observed. The deconvoluted peaks assigned to OLatt and OAds are also shown in Figure 3b. By integrating the deconvoluted peaks, the ratio OAds/(OAds + OLatt) was calculated for all samples. As shown in Table 2, this ratio is similar for all samples, with its value ranging from 0.18 to 0.21.
Figure 3.
Co 2p (a) and O1s (b) XPS spectra of Co3O4 catalysts.
Table 2.
XPS peak positions and oxygen species ratio.
Figure S2 contains the H2-TPR profiles of all Co3O4 samples. All samples exhibit two main peaks that are attributed to the reduction of Co+3 to Co+2 and finally to Co0. The first peak, which pertains to the Co+3 to Co+2 reduction, is located in the low-temperature region, with centers at 295–347 °C, while the second peak, which corresponds to the Co+2-to-Co0 transition [44,45,46], is observed at a higher temperature, with peak centers at 352–447 °C, and is clearly composed of two constituents. These constituents could be attributed to surface and bulk CoO since the reduction of Co3O4 occurs first on the surface of the particle, leading to the formation of a reduced layer that hinders hydrogen penetration deeper within the particle [47]. Co-HY and Co-PR samples exhibit their peaks at considerably lower temperatures than Co-CA and Co-CM samples. The peak positions are shifted by as much as 50 °C and 70 °C for the first and second H2 consumption peaks, respectively, when comparing the Co-HY sample against Co-CM. These large temperature shifts can be attributed to differences in the particle size and morphology of each catalyst. Smaller crystallites have a higher surface-to-volume ratio, which increases the fraction of cobalt oxide directly accessible to hydrogen. In larger crystallites, a greater proportion of the oxide is located within the particle interior, requiring longer diffusion paths for hydrogen and thereby slowing the reduction process [48]. The morphology of the formed particles can also influence the reduction temperature in a similar manner. For example, nanosheets expose a greater fraction of the oxide directly to the surrounding atmosphere, whereas a smaller fraction remains within the bulk, compared to nanocubes of similar dimensions. Consequently, the order of reducibility Co-HY > Co-PR > Co-CA > Co-CM is the reverse of the crystallite sizes, as calculated from XRD. Furthermore, Co-HY and Co-PR samples that form nanosheet/hexagonal plate secondary structures are more easily reduced than Co-CA and Co-CM samples that form cube-like structures. Table 3 summarizes the H2 consumption determined through the TPR experiments. All quantities are in close agreement with the theoretical value (16.6 mmol gcat−1), which is calculated from the stoichiometry of the reaction:
Table 3.
Amounts consumed/desorbed in H2-TPR and O2-TPD experiments.
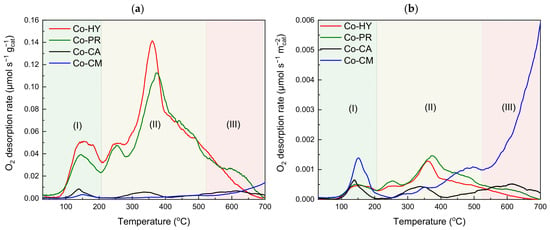
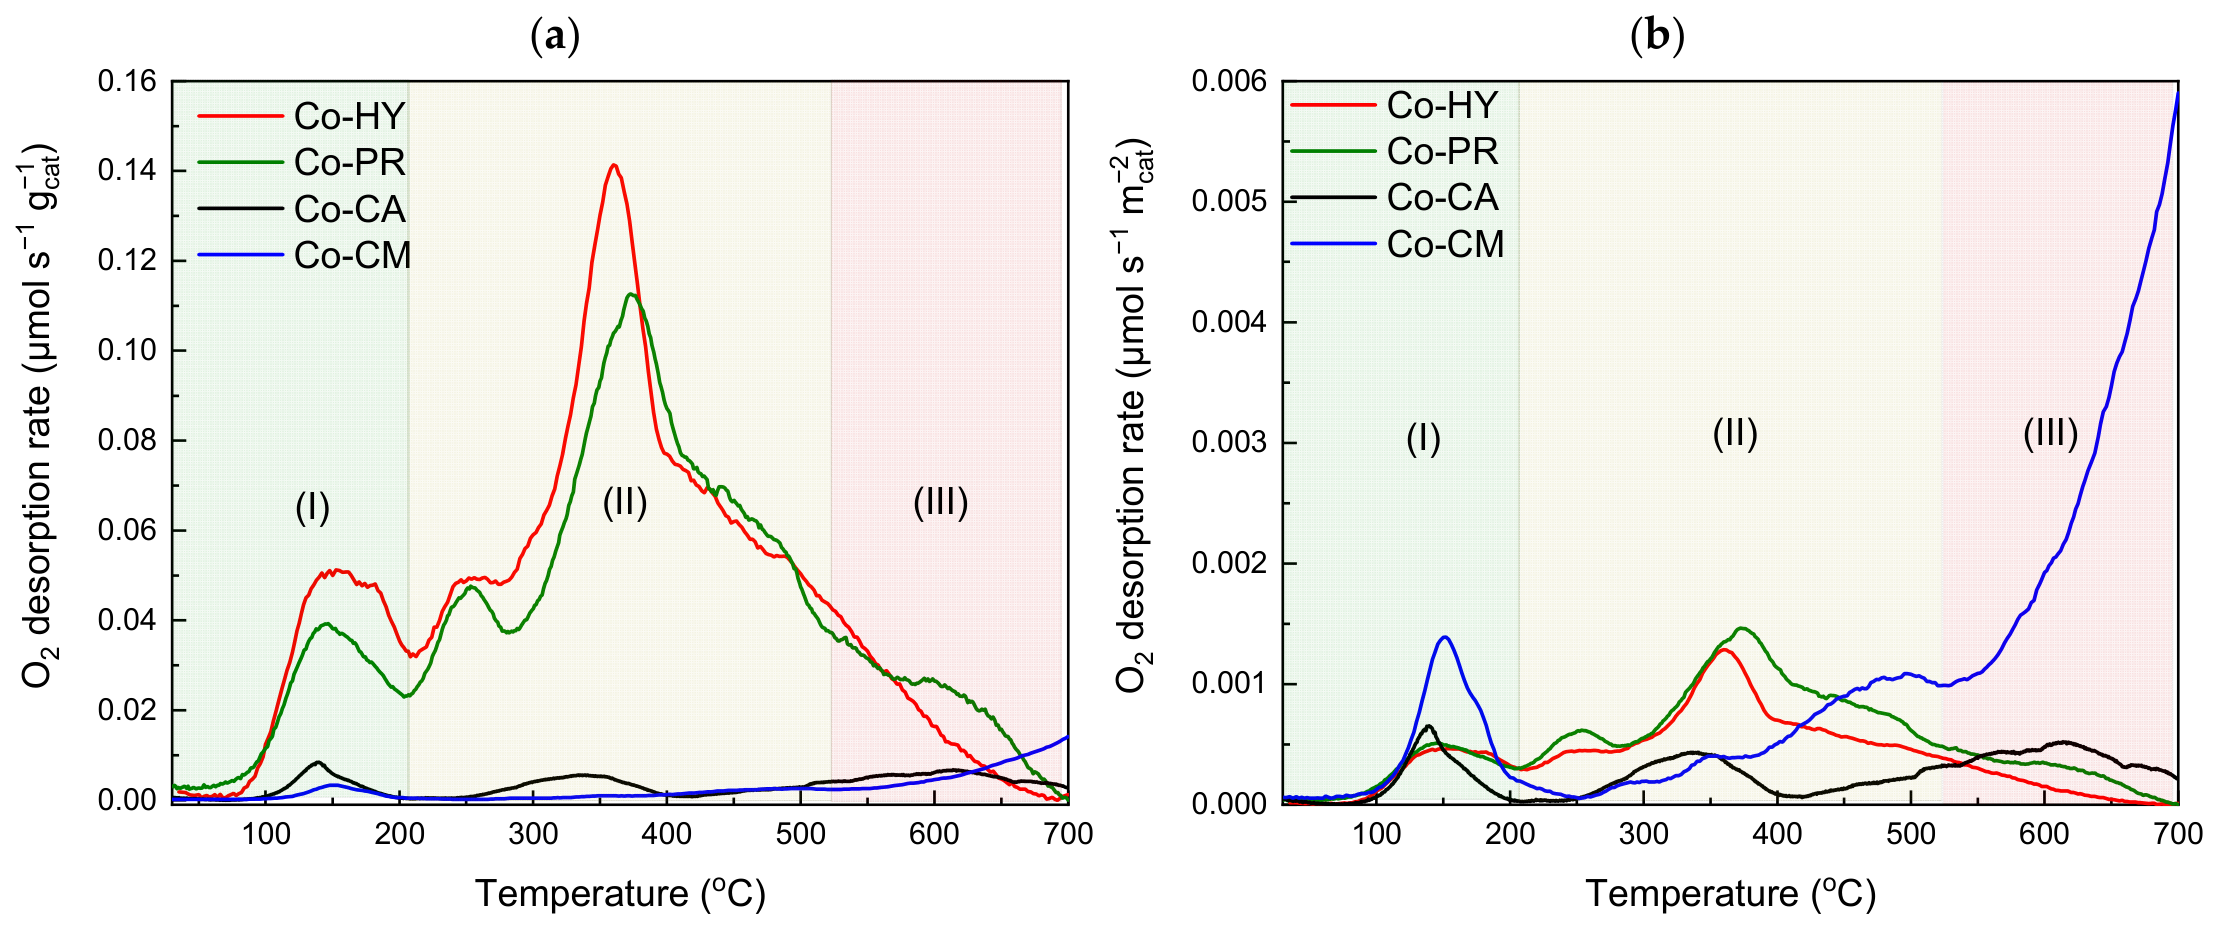
Figure 4a presents the O2-TPD profiles per gcat. Catalysts with higher SSA desorbed more oxygen per gcat, and the amounts can be seen in Table 3. When normalized per unit of surface area, the amounts of desorbed O2 do not show a clear correlation with the SSAs of the catalysts. All samples desorbed 0.96–2.06 μmol of O2 per mcat−2, as shown in Table 3. The desorption profiles of all samples consist of at least three broad desorption peaks located at three temperature regions, namely, ~30–200 °C, 200–500 °C, and 500–700 °C, which are attributed to weakly bound physisorbed oxygen, chemically adsorbed oxygen species and surface lattice/lattice oxygen, respectively [49,50,51]. This is more evident in Figure 4b, where the desorption rate of oxygen is normalized on an SSA basis. There are great differences in the O2 desorption profiles over the four samples. While all samples exhibit a peak around 150 °C, Co-CM shows the highest intensity peak in this specific region. Catalysts with high SSAs exhibit peaks of greater intensity in the middle region, which is correlated with the desorption of chemically adsorbed oxygen species (O−, O2−, O22−). Lower-SSA samples show higher peaks in the high-temperature region, which are attributed to surface lattice and bulk lattice oxygen. Interestingly, Co-CM seems to start desorbing bulk lattice oxygen due to thermal decomposition of the crystal at temperatures as low as 550 °C, in contrast to the other catalysts. These significant differences in the O2 desorption profiles are evidence that the morphology and structure of the oxide play a crucial role in shaping the type and population of surface oxygen species.
Figure 4.
O2-TPD profiles of Co3O4 catalysts per gcat (a) and m2cat (b).
2.3. Propene-TPD-TPSR
In the propene-TPD/TPSR experiments, the main carbon oxidation product detected was CO2. Trace amounts of propene were also detected in both the TPD and TPSR experiments. Assuming that three molecules of desorbed CO/CO2 correspond to one molecule of adsorbed propene, less than 4% of the total adsorbed propene desorbed intact in each experiment. The propene desorption profiles from the TPD and TPSR experiments are shown in Figure S4a,b. In both cases, an initial peak is observed at low temperatures, centered at around 60 °C, which can be attributed to weakly bound, physisorbed propene. In the TPD experiments, an additional peak centered at higher temperatures (150–225 °C) is observed, indicating the existence of a second, stronger mode of adsorption that eventually leads to the total oxidation of the molecule. This second peak is absent in the TPSR experiments, suggesting that this mode of adsorbed propene is indeed active during the reaction conditions. However, it should be noted that the amounts of propene desorbed are minimal compared to CO2 (as shown in Table 4 and Table 5).
Table 4.
Desorbed quantities during propene-TPD experiments.
Table 5.
Desorbed quantities during propene-TPSR experiments.
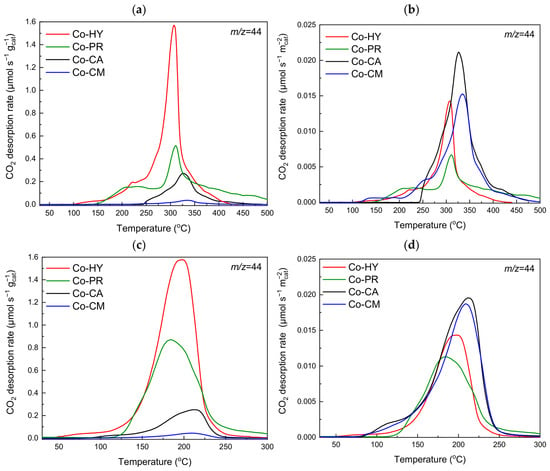
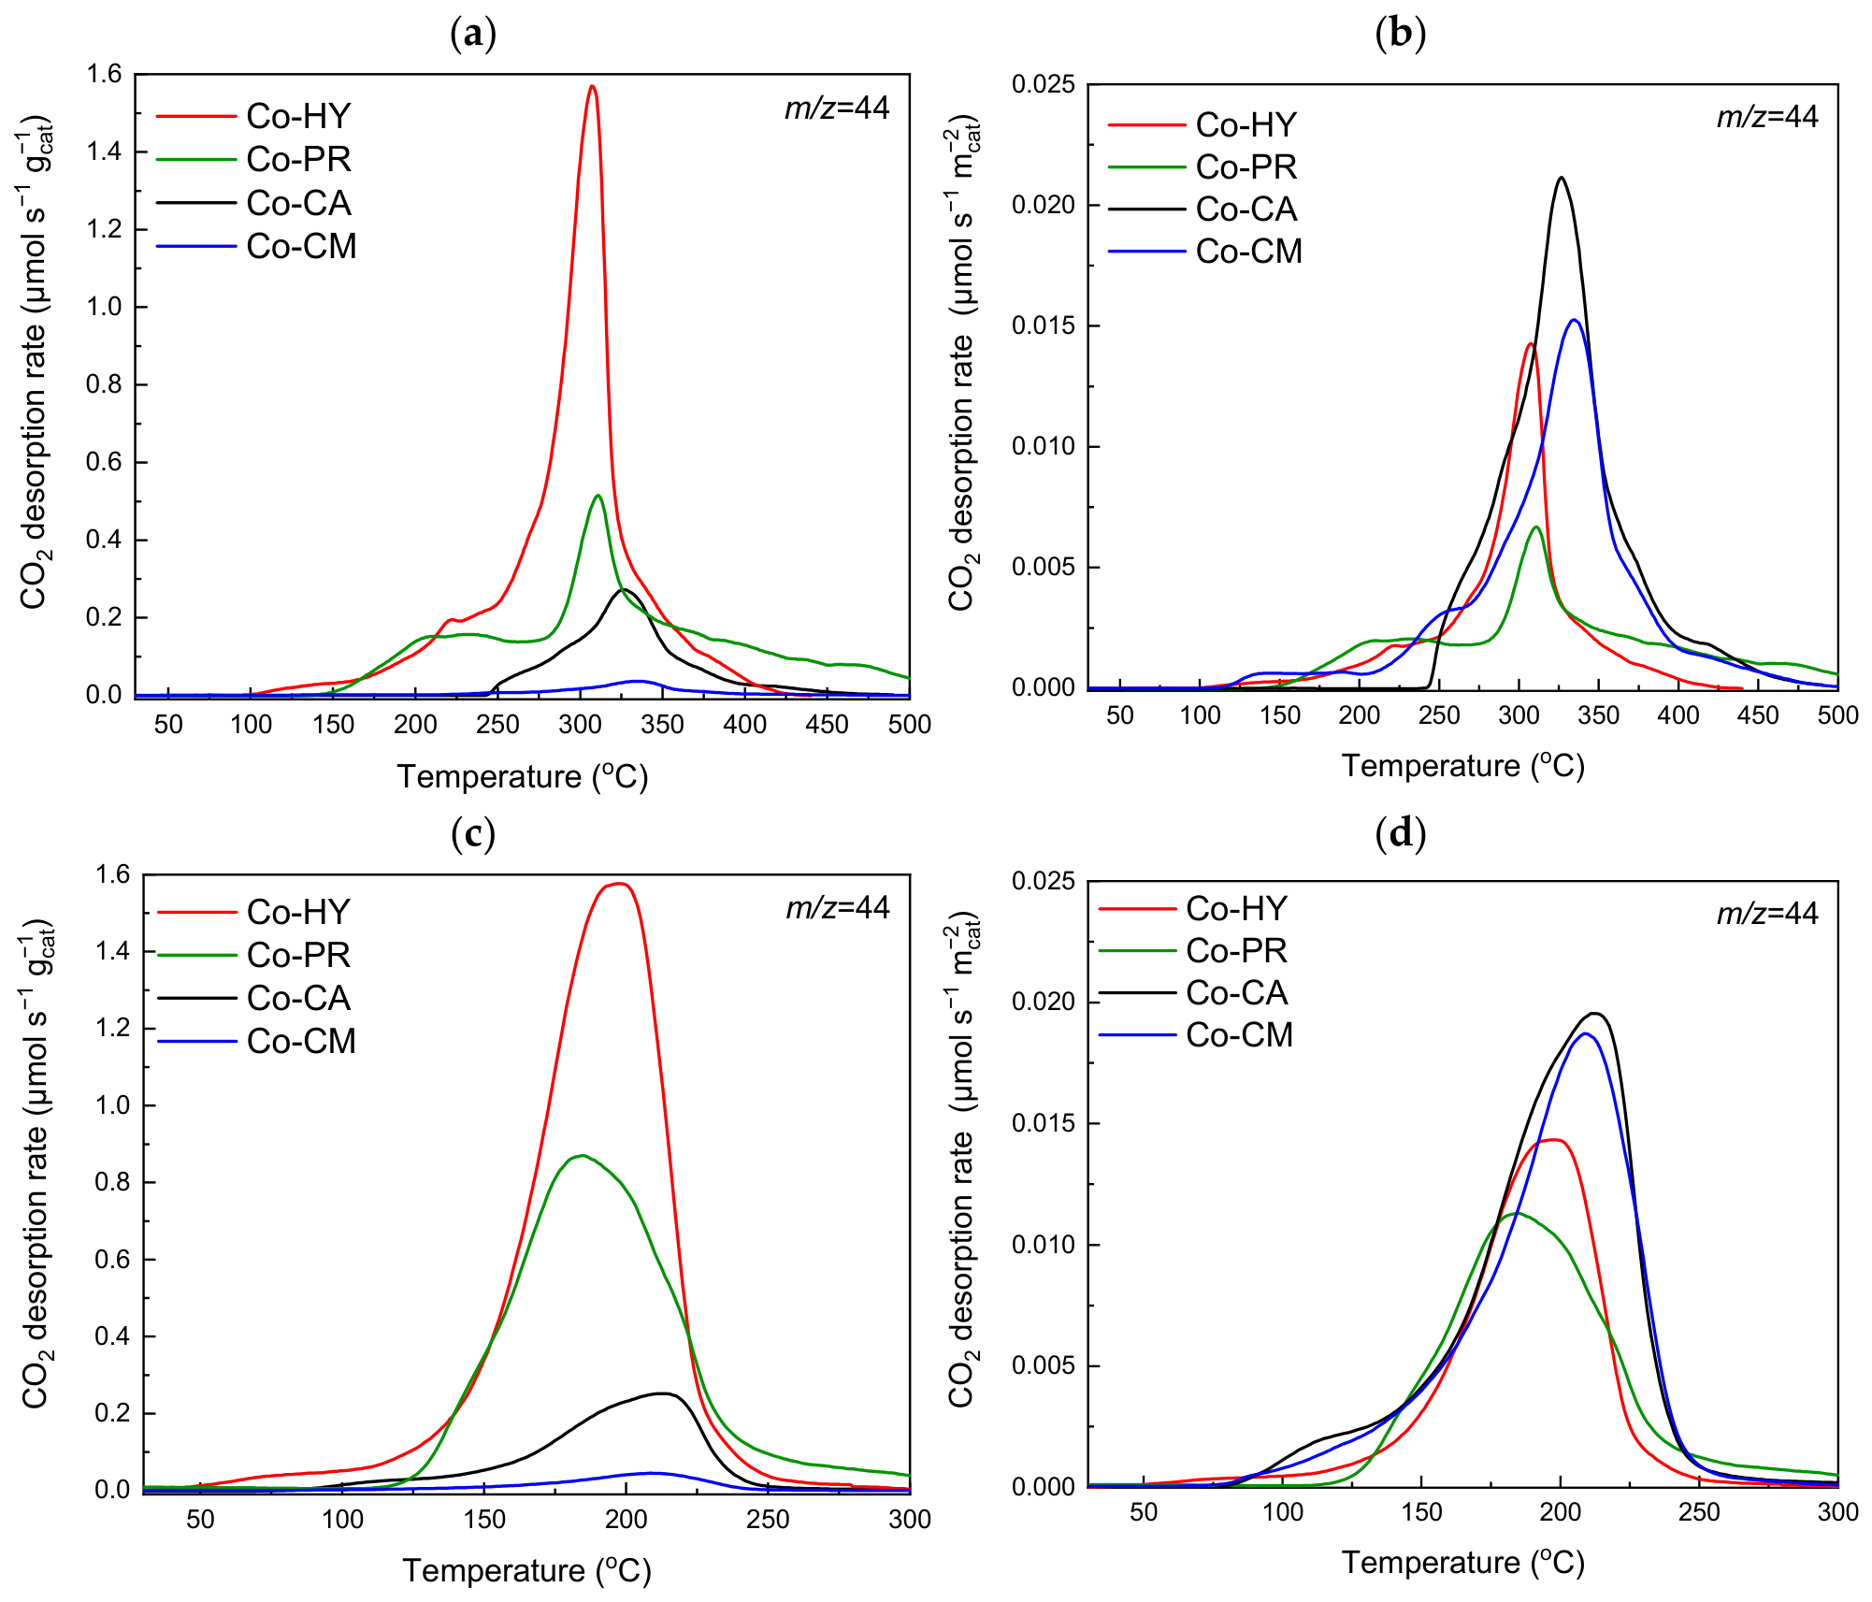
Small amounts of CO and H2 were formed during the TPD experiments (see Table 4). Desorption profiles of CO and H2 are shown in Figure S5a,b, respectively. For propene-TPD, the obtained CO2 desorption profiles, expressed on a unit mass and surface area basis, are depicted in Figure 5a,b, respectively. Even in propene-TPD, in the absence of gaseous O2, the catalysts were able to oxidize propene almost completely to CO2, utilizing the pre-adsorbed surface oxygen species and/or lattice oxygen. CO2 desorption profiles of all Co3O4 oxides are characterized by a broad, asymmetric peak centered at 300–340 °C following a shoulder located at lower temperatures (100–250 °C). These shoulders and peaks can plausibly be assigned to the oxidation of propene by adsorbed and lattice oxygen species, respectively, as demonstrated in our previous study on VOC oxidation over Mn2O3 [52] and as proposed in the literature for similar catalytic systems [30,53,54,55].
Figure 5.
CO2 desorption profiles of propene-TPD experiments per unit of mass (a) and per unit of surface area (b) of the catalysts. CO2 desorption profiles of propene-TPSR experiments per unit of mass (c) and per unit of surface area (d) of the catalysts.
Knowing the amounts of adsorbed/surface oxygen from the O2-TPD experiments, the amount of CO2 that can be produced from surface oxygen can be estimated from the stoichiometry of the reaction as:
The CO2 amounts calculated by Equation (2) are shown in Table 4. It should be emphasized that the calculated values represent the maximum amount of CO2 that can be produced from surface oxygen, assuming that all of the oxygen is consumed in the complete oxidation of propene (having taken into account the oxygen in H2O that is also produced during the reaction). When comparing these values to the CO2 produced during the TPD experiments, it is evident that surface oxygen (OSurf) is not sufficient to fully account for all the CO2 formed, indicating lattice oxygen participation. This suggests that the oxidation of propene can proceed both by a Langmuir–Hinshelwood mechanism, using surface (mainly adsorbed) oxygen species, and by a Mars–van Krevelen mechanism, using bulk lattice oxygen diffusing to the surface at higher temperatures. The CO2 amount that was produced with lattice oxygen (OLatt) can be estimated by subtracting the maximum amount of CO2 that can be produced by the pre-adsorbed oxygen species from the total CO2 produced. The ratio of the estimated CO2 produced from OSurf to the estimated CO2 produced from OSurf and OLatt is equal to the ratio of OSurf/(OLatt + OSurf) that participated in the oxidation reaction during the propene-TPD experiments. Based on the values of this ratio in Table 4, it is clear that for higher-SSA samples (Co-HY and Co-PR), surface oxygen played a more crucial role, accounting for 23–31% of the produced CO2. In comparison, lower-SSA samples (Co-CA and Co-CM) showed limited OSurf participation, corresponding to 7–13% of the produced CO2. The contributions of surface oxygen and bulk lattice oxygen to the CO2 desorption profiles are illustrated in Figure S6 and are denoted as (I) and (II), respectively. The first low-temperature shoulder observed in each profile is attributed to the more labile surface oxygen species. After the surface oxygen is depleted, bulk lattice oxygen diffuses to the surface as the temperature increases, producing the main high-temperature peak.
In the TPSR runs, CO2 was the only carbon oxidation product detected. The CO2 desorption profiles obtained from the propene-TPSR experiments, expressed on a unit mass and surface area basis, are depicted in Figure 5c,d, respectively. Therein, a broad, asymmetric peak centered at 180–220 °C is observed for all samples. This peak is shifted to lower temperatures compared to the propene-TPD run by 110–125 °C. This large shift, along with the existence of only one peak, can be explained by the fast replenishment of active OSurf by gaseous oxygen that facilitates oxidation. Although the peak position is slightly lower for the high-SSA samples, Figure 5d shows that both the onset temperature and the rise in the CO2 desorption rate (on a surface area basis) are nearly identical for all catalysts, suggesting comparable specific catalytic activity. The amounts of CO2 desorbed in the TPSR experiments are in the range of 16–535 μmol gcat−1 (see Table 5) and are in close agreement with the TPD results. Assuming that three molecules of CO2 produced correspond to one propene molecule adsorbed, the surface concentration of propene can be calculated by dividing the amount of CO2 produced by 3 and by the SSA of the sample. For all catalysts, the values calculated are listed in Table 5. Samples with lower SSA exhibited higher surface concentrations of propene (2.29–2.52 μmol mcat−2) than their higher-SSA counterparts (1.62–1.65 μmol mcat−2). Co-CA showed the highest surface concentration of adsorbed propene.
2.4. Catalytic Experiments
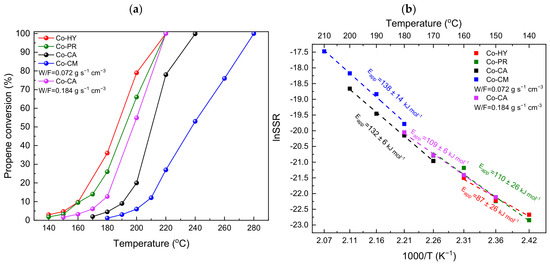
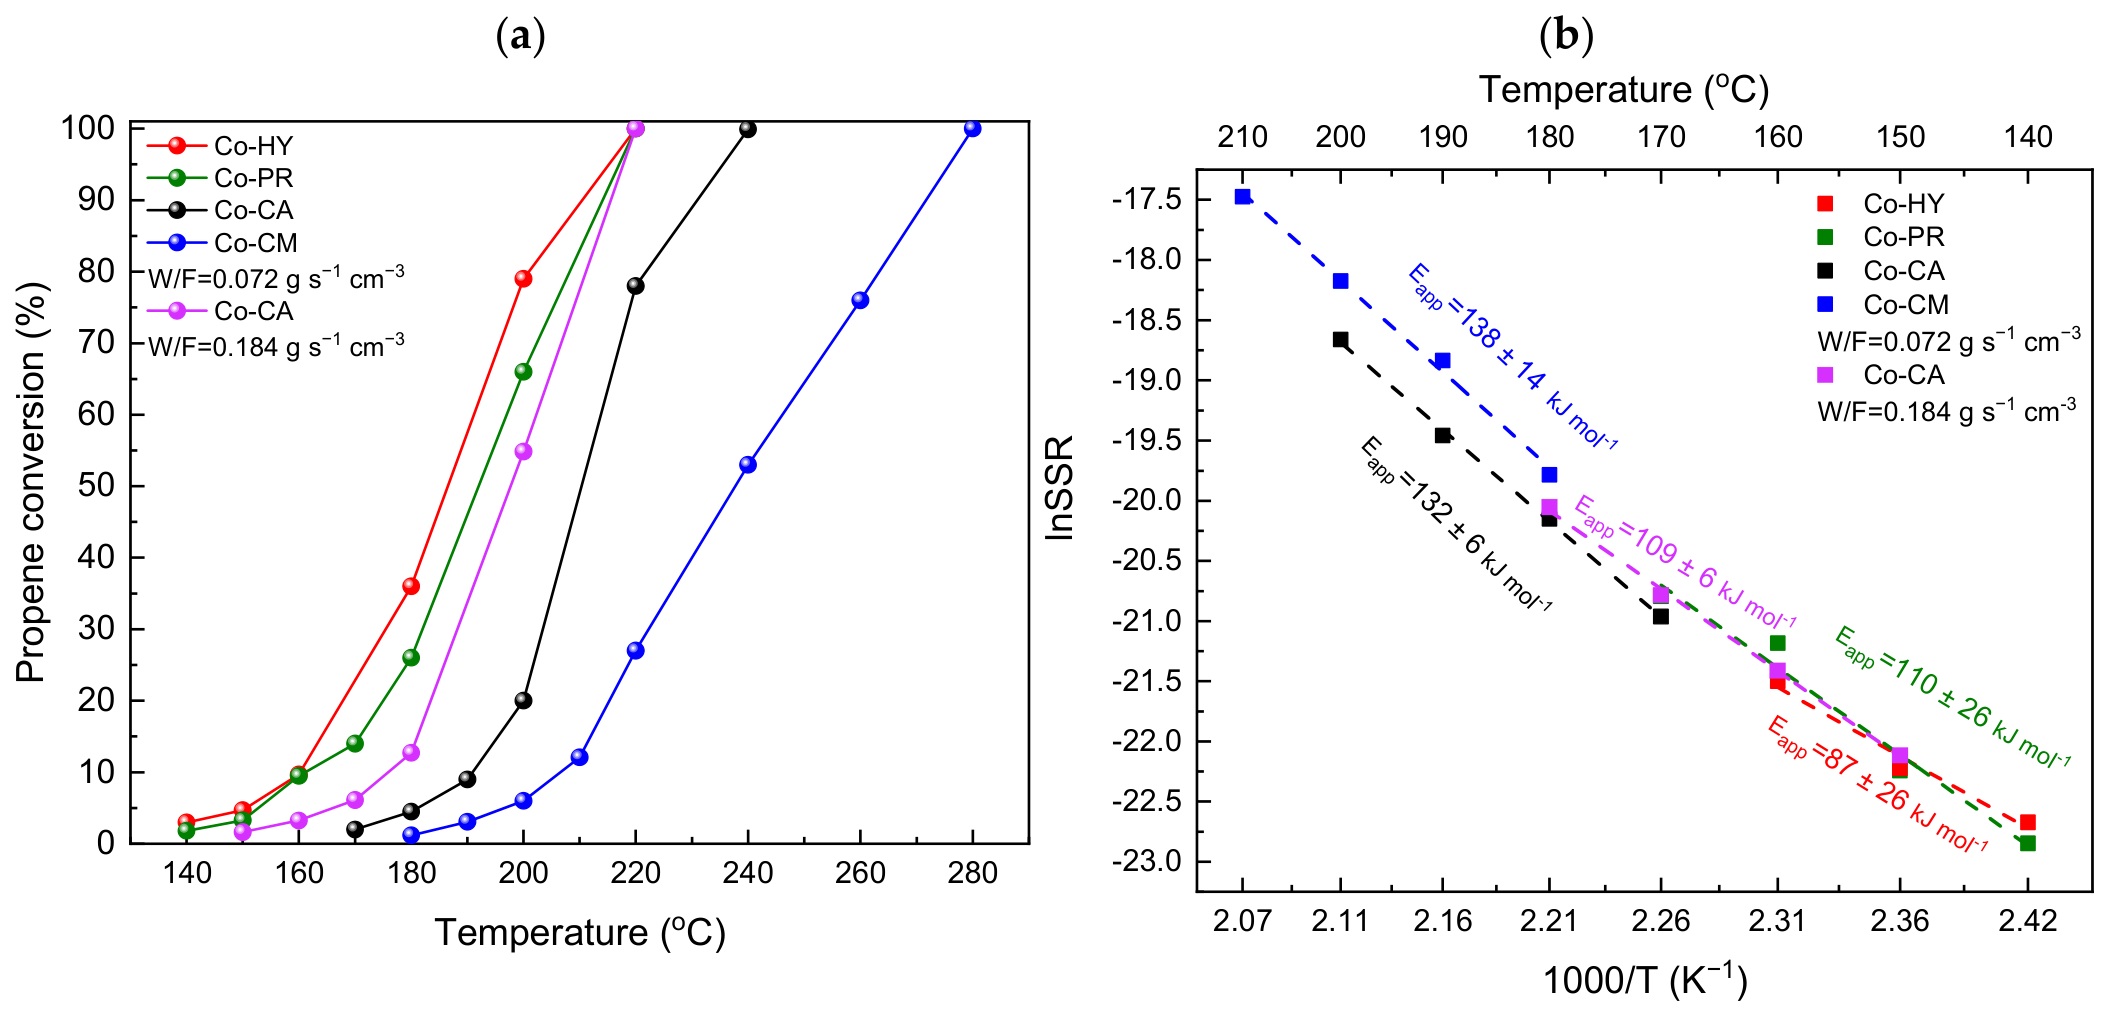
Catalytic experiments were performed on all samples, and the conversion of propene to CO2 is shown in Figure 6a. CO2 was the only carbon oxidation product detected. The experiments were performed under the same W/F ratio = 0.072 g s cm−3 for all catalysts. Catalytic activity on a unit mass basis clearly increased with increasing SSA. The onset temperature was 140 °C for Co-HY and Co-PR, 170 °C for Co-CA and 180 °C for Co-CM. Figure 6b depicts Arrhenius plots, for which only experimental points with conversions smaller than 15% were considered for each catalyst. Researchers often link higher amounts of oxygen species observed in O2-TPD [56,57,58,59], surface concentration of Co3+ [23,30,59,60] and specific exposed crystal facets [23,28,30,61] to better intrinsic catalytic performance in VOC and CO oxidation over Co3O4. In the current study, the synthesized catalysts exhibit significant differences in SSA, crystallite size, particle geometry and surface oxygen species populations. However, the specific surface rates (on a unit surface area basis) shown in Figure 6b appear quite similar for all catalysts, in agreement with the propene-TPSR results. To further emphasize this point, the specific rates at an intermediate temperature T = 170 °C are presented in Table 6. The rates are remarkably similar, falling in the range 0.76–1.19 mol s−1 mcat−2. This observation suggests that the intrinsic activity of the surface is largely independent of these structural differences.
Figure 6.
Propene conversion vs. temperature (a) and Arrhenius plot (b).
Table 6.
Apparent activation energies and SSRs at 170 °C.
Assuming the Arrhenius law, the apparent activation energy Eapp can be calculated by the slope of a linear fit. The Eapp values are listed in Table 6, and they are in the range 87–138 kJ mol−1. In the initial experiments with W/F = 0.072 g s cm−3, a distinct inverse relationship exists between SSA and Ea, where catalysts with lower surface area exhibit higher apparent activation energies. However, differences in onset temperatures and conversions made it necessary to use low-temperature data points (140–170 °C) for high-SSA catalysts and higher-temperature points (170–210 °C) for the low-SSA catalysts in the Arrhenius plot. The temperature range used can affect the apparent activation energy calculations in multiple ways. It is known that Eapp can include adsorption enthalpy contributions [52,62,63]. For example, assuming a general LH competitive mechanism, the rate expression would be:
and the apparent activation energy could be calculated as:
Both the TPD and kinetic experiments showed evidence that propene is adsorbed significantly stronger than oxygen. It is therefore reasonable to assume that at low temperatures, the catalytic surface is almost completely saturated with propene (θProp ≈ 1 and θo = 0). At low temperatures, Equation (4) could be simplified as:
As temperature rises, it is expected that the coverage of propene will decrease. Since the enthalpies of adsorption are usually negative, Equation (4) shows that the Eapp value will initially decrease at higher temperatures (until the reactants reach θ = 0.5), contrary to what was observed in this study. This decrease in Eapp with increasing temperature was also shown thoroughly in our previous work on non-competitive LH models [52]. Another way that temperature can affect the measured Eapp is by involving more active sites/oxygen species that would otherwise remain inert, sharply increasing the activity at higher temperatures. The idea that labile adsorbed oxygen species are the main active oxygen species at low temperatures while lattice oxygen is activated at higher temperatures has been suggested for styrene and toluene oxidation over Co3O4 [29,30] and is consistent with the previously shown propene-TPD results. This could explain the increase in apparent activation energy for samples with lower SSAs. In order to test this hypothesis, sample Co-CA was also evaluated at W/F = 0.184 g s cm−3, allowing for the use of lower-temperature data points (150–180 °C rather than 180–210 °C) in the Arrhenius plot. The catalytic activity data for this experiment are also shown in Figure 6a and the Arrhenius plot in Figure 6b. For sample Co-CA, the apparent activation energy was previously calculated as 132 ± 6 kJ mol−1 for W/F = 0.072 g s cm−3. However, using the measurements collected at W/F = 0.184 g s cm−3 resulted in an apparent activation energy of 109 ± 6 kJ mol−1, matching the Co-PR catalyst and shifting closer to Co-HY. These results further reinforce the notion that the differences in apparent activation energy arise from the effect of the temperature range of activity measurements and, more specifically, the activation of more oxygen species at higher temperatures, rather than any kind of structural sensitivity of the reaction over the prepared Co3O4 catalysts.
From the intercept of the Arrhenius plots, the pre-exponential factor A can be calculated for every catalyst. There is a clear linear relationship between the natural logarithm of A and Eapp, which is demonstrated as an excellent linear fit (R2 = 0.999) in Figure S7. This is called the “compensation effect”, and it is often observed in catalysis [64,65]. Common physical explanations in the literature for the compensation effect on different catalysts include differences in the enthalpy change ΔH‡ and the entropy change ΔS‡ of the transition state of the reaction, coverage effects and variations in the adsorption strength of catalysts [62,63,64,65]. This study evaluates catalysts with similar structures, as all catalysts have the same Co3O4 crystal phase. Therefore, variation in ΔH‡ and ΔS‡ should not be significant enough to explain the considerable variation in Eapp (87–138 kJ mol−1). The same applies to variation in adsorption strength between the four prepared catalysts. Furthermore, as explained earlier via Equation (4), coverage effects would decrease Eapp contrary to the observations made in the present study. The inclusion of two datasets obtained from the same Co-CA catalyst on the compensation plot effectively rules out variations in both adsorption strength and ΔH‡/ΔS‡ as the primary cause of the observed compensation effect, pointing instead to changes in the kinetic regime. Although the transition from an OAds-dominated regime at low temperatures to an OLatt-dominated regime at higher temperatures may account for the change in Eapp, it does not justify the observed linear relationship between lnA and Eapp. It is therefore possible that the compensation effect has no physical interpretation and simply stems from statistical errors in the kinetic data points and the covariance of the linear fit parameters in the Arrhenius plots [65].
2.5. Kinetic Experiments
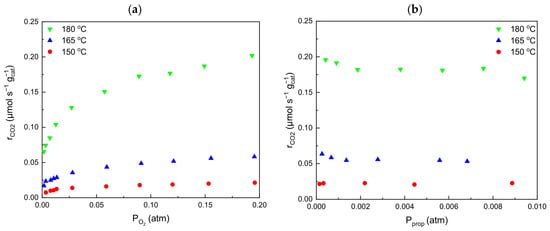
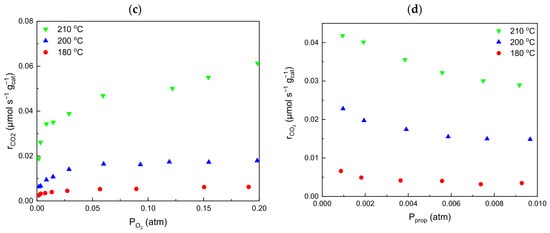
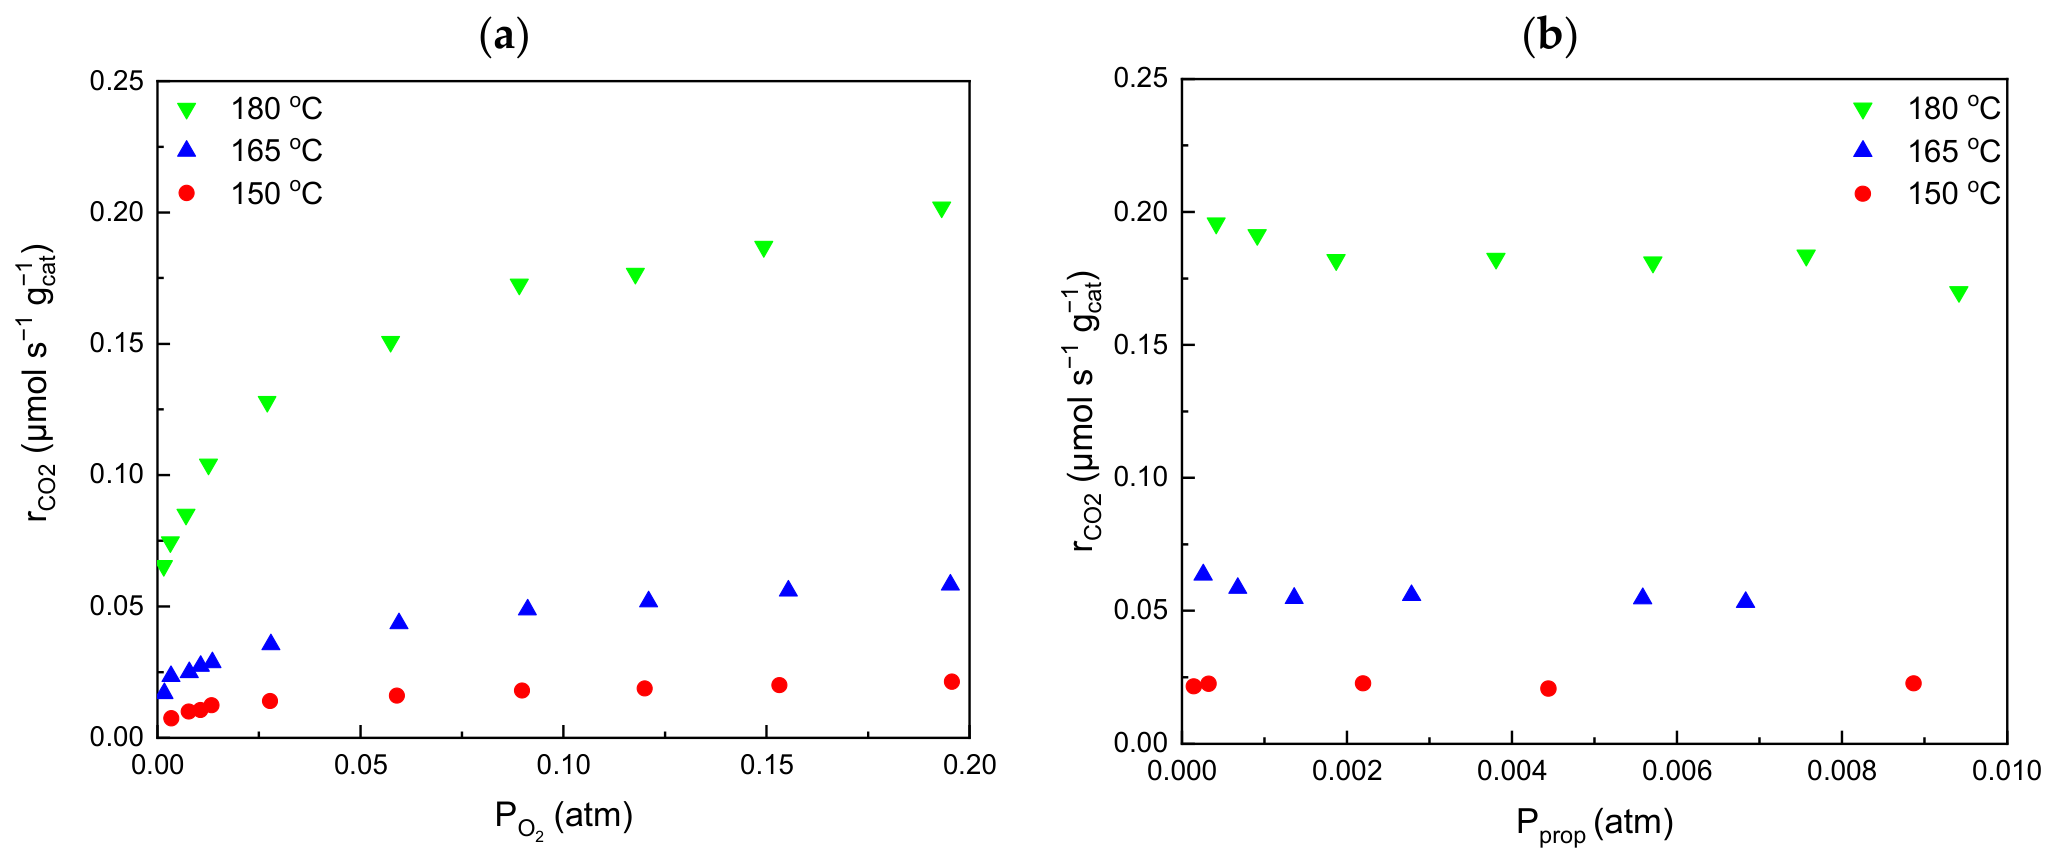
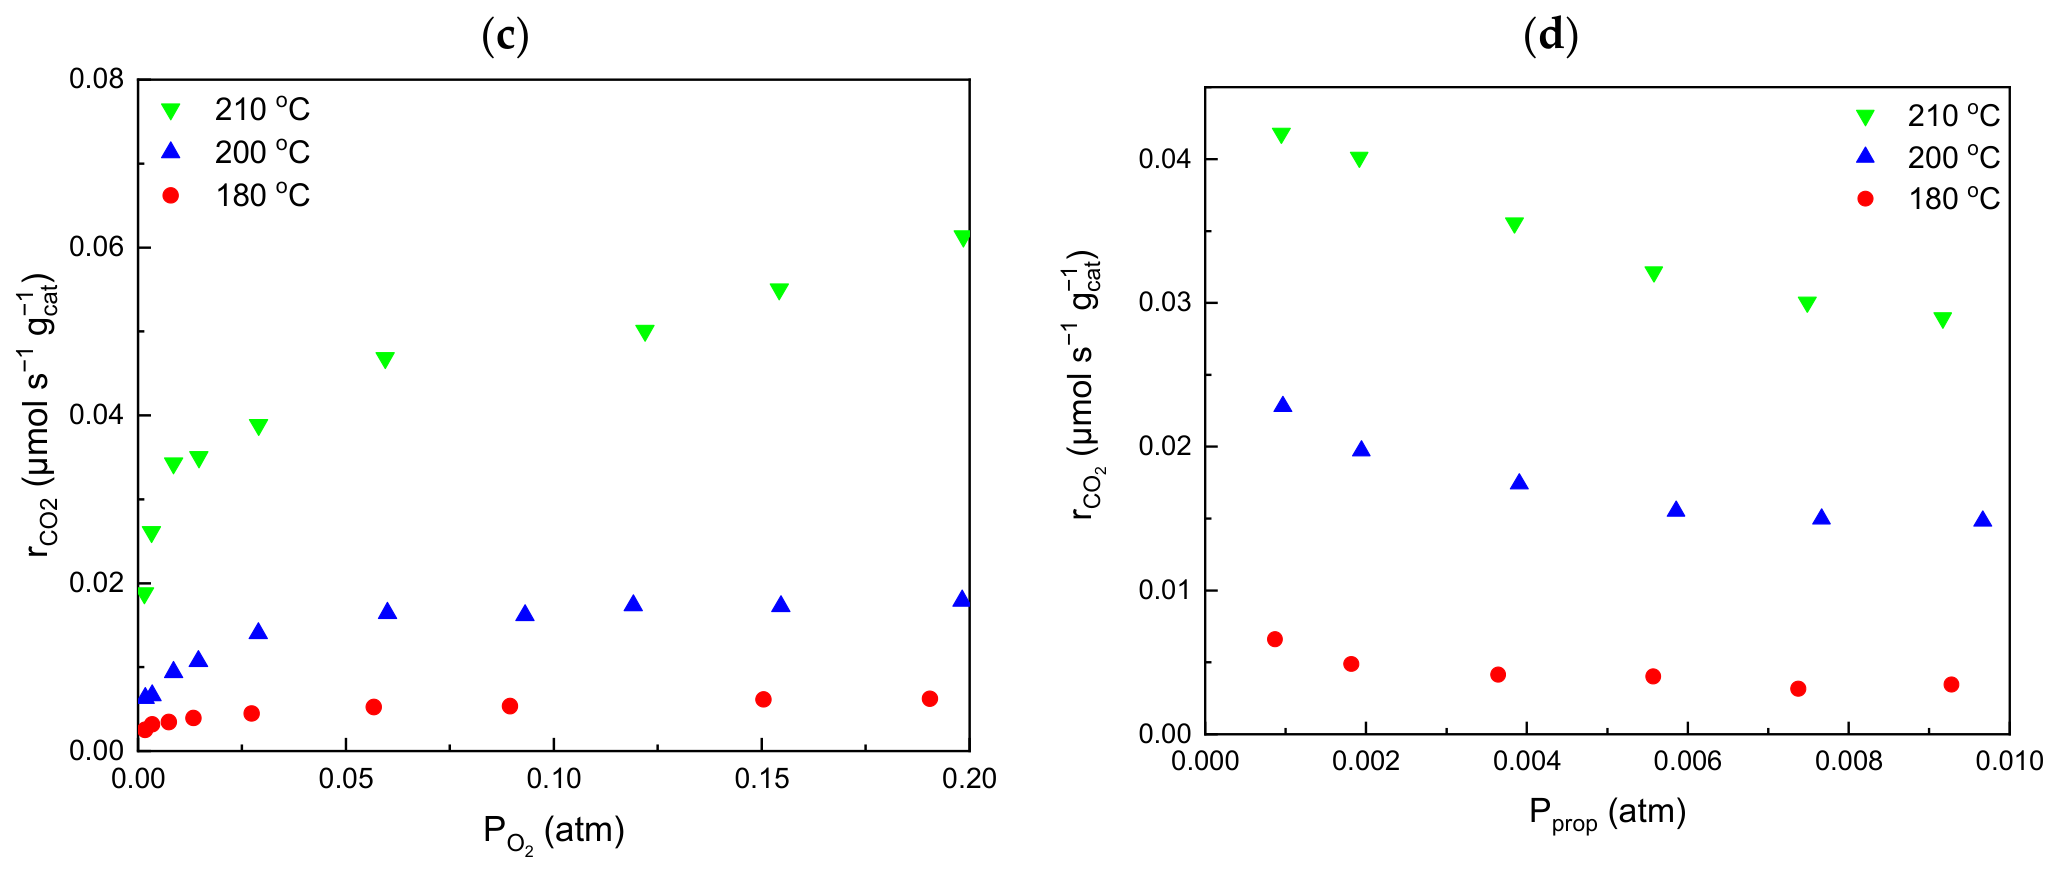
Kinetic measurements were conducted on two of the catalysts. Co-PR and Co-CM were chosen as representatives of high- and low-SSA catalysts, respectively. Measurements were carried out at three different temperatures for each catalyst (150–180 °C for Co-PR and 180–210 °C for Co-CM). Both catalysts exhibit similar trends in their rate dependency on propene and oxygen partial pressure. The rate of propene oxidation slightly decreases with an increase in propene partial pressure until it reaches a plateau at higher partial pressures (Figure 7b,d). The plateau must be a consequence of the surface being saturated with propene molecules. The initial decrease is more noticeable at higher temperatures and cannot be explained by a single kinetic model. Kinetic studies of propene oxidation over Co3O4 are scarce, and, to the best of our knowledge, this is the first time that a negative reaction order for propene has been observed in this catalytic system. This negative reaction order with respect to propene at low partial pressures points towards a competitive LH model. A previous study successfully applied the competitive LH model for propene oxidation over a Pt/Al2O3 catalyst [66]. Although this is not the same catalytic system, surface Co3+ cations could play a similar role as Pt, with propene and oxygen both competing to occupy them. The plateau cannot be a consequence of a competitive LH model since the rate would continue to decrease, approaching zero as the surface is progressively covered solely by propene molecules. Alternatively, the plateau could be the result of a second mechanism that takes over at high propene partial pressures, after the saturation of the surface with propene. The second kinetic model could be an MvK-type model that utilizes lattice oxygen instead. Figure S8 illustrates how this kinetic behavior is explained with the two aforementioned models. Increasing the temperature would lower the coverage of propene, shifting the plateau to higher partial pressures and making the initial decrease in the oxidation rate more pronounced, explaining why the initial drop in the rate is more prominent and easily observed for Co-CM, which is measured at higher temperatures than for Co-PR. After the plateau is reached, meaning the surface is saturated with propene, the MvK mechanism would prevail since propene would inhibit its oxidation with adsorbed oxygen via the competitive LH mechanism. The existence of two pathways for propene oxidation, based on different active oxygen species that dominate at different temperatures and propene partial pressure regions, is consistent with the results from both the propene-TPD/TPSR and catalytic experiments.
Figure 7.
Kinetic experiments with varying oxygen and propene partial pressures for catalyst Co-PR (a,b) and catalyst Co-CM (c,d).
In contrast, the reaction rate initially increases with increasing O2 partial pressure for both catalysts, until it reaches a plateau at higher oxygen partial pressures (Figure 7a,c). The rate reaches a plateau as a function of the partial pressure of both reactants. However, the plateau is reached at very low partial pressures of propene (p < 0.002 atm), whereas, in the case of oxygen, the rate levels off at much higher partial pressures of oxygen (p > 0.05). This is an indication that propene binds more strongly to the surface compared to oxygen. The kinetic data for different oxygen partial pressures were obtained under constant Pprop = 0.0011 atm, and it is likely that at this partial pressure, the surfaces of both Co-PR and Co-CM are close to/completely saturated with propene. The propene-TPSR results also suggest that propene binds strongly and irreversibly to the surface, only desorbing in significant quantities at temperatures 170–200 °C as CO2. The strong propene adsorption compared to oxygen could be the reason why oxygen does not exhibit the same inhibiting kinetic behavior as propene, even at higher partial pressures.
The reaction order for each reactant, i.e., the exponents of a general power law model in Equation (6), can be calculated by plotting ln r against ln P and applying a linear fit.
Figure S9 shows the kinetic data of the two catalysts as lnr vs. lnP, with linear fits applied at each temperature. The slopes of the fitted lines correspond to the reaction order of the reactants, and the calculated values are shown in Table 7 and Table 8 for the Co-PR and Co-CM samples, respectively. For the Co-PR catalyst, the reaction order with respect to oxygen is close to 0.25 for all three temperatures examined. For propene, the reaction order is close to zero or slightly negative, as a result of surface saturation with propene. Sample Co-CM exhibits oxygen reaction orders in the range 0.19–0.24, while the reaction order with respect to propene is clearly negative and changes with temperature, from −0.28 at 180 °C to −0.17 at 210 °C.
Table 7.
Reaction order from linear fits of lnr vs. lnP kinetic data for sample Co-PR.
Table 8.
Reaction order from linear fits of lnr vs. lnP kinetic data for sample Co-CM.
3. Materials and Methods
3.1. Synthesis of Catalysts
Co3O4 catalysts were prepared by four different methods.
3.1.1. Co-HY
First, 4 g of pre-dissolved urea in 20 mL of triple-distilled water was added to 20 mL of 9.5 g Co(NO3)26H2O (Sigma-Aldrich, St. Louis, MO, USA) solution and left under stirring to form a transparent homogeneous solution. Urea (Sigma-Aldrich, St. Louis, MO, USA) was added in excess of the stoichiometric amount. The solution was then transferred to a Teflon-lined stainless steel autoclave with a maximum capacity of 50 mL. The autoclave was kept at 110 °C for 8 h without shaking or stirring during the heating period and finally allowed to cool to room temperature. A pink precipitate was collected and then washed with distilled water and absolute ethanol several times. The washed product was then dried at 60 °C under vacuum overnight, and the dried sample was calcined at 300 °C under air for 1 h to obtain Co3O4.
3.1.2. Co-PR
For this synthesis, a 0.25 M cobalt nitrate solution [Co(NO3)26H2O] (Sigma-Aldrich, St. Louis, MO, USA) in an alkaline NaOH (Sigma-Aldrich, St. Louis, MO, USA) solution was used as a precipitation agent. The concentrated solution of NaOH was added drop by drop to the Co(NO3)2.6H2O solution under magnetic stirring at room temperature. Both solutions were mixed in an 8:1 ratio (50 mL of final mixture), and the NaOH concentration was 2 M. As soon as the NaOH solution was mixed with the Co(NO3)2.6H2O solution, a light pink precipitate formed. The solution was placed under magnetic stirring at 70 °C for 1 h to complete the reaction. The collected material was then re-dispersed and washed several times with triple-distilled water until pH = 7 was reached. This step was used to remove any unreacted Co2+ and Na+. The washed product was then dried at 60 °C under vacuum overnight. The resulting black powder was calcined at 300 °C for one hour to form Co3O4.
3.1.3. Co-CA
Co-CA was prepared using citric acid–cobalt nitrate salt complexation. In the preparation procedure, 10.9 g Co(NO3)2.6H2O (Sigma-Aldrich, St. Louis, MO, USA) was dissolved in triple-distilled water. A solution of citric acid monohydrate (8.645 g, Merck KGaA, Darmstadt, Germany) was added, and then the excess water was removed with a rotary evaporator at 50 °C until a gel-like viscous solution was formed, which was then dried overnight at 120 °C. During this treatment, an intense production of nitrous vapor occurred. The resulting spongy amorphous citrate was calcined at 500 °C under air for 2 h to obtain Co3O4.
3.1.4. Co-CM
A total of 10 g of Co(NO3)2.6H2O (Sigma-Aldrich, St. Louis, MO, USA) was placed in a porcelain dish and then calcined at 700 °C under air for one hour to obtain Co3O4.
3.2. Characterization
3.2.1. N2-Physisorption
A Quantachrome Autosorb IQ machine (Quantachrome Instruments, Boynton Beach, FL, USA) was used to record adsorption–desorption isotherms of nitrogen at −196 °C. Samples were degassed at 200 °C under vacuum for 2 h prior to the measurements. The isotherms were measured at relative pressures (P/P0) in the range of 0.05 to 0.95. The BET equation was applied in the range (0.05 < P/P0 < 0.30), and the total pore volume was calculated at P/P0 = 0.95.
3.2.2. X-Ray Diffraction
XRD measurements were performed on a Bruker D8 Advance X-ray powder diffractometer (Bruker AXS GmbH, Karlsruhe, Germany) operated at 40 mA and 40 kV by employing Ni-filtered Cu Ka radiation (λ = 1.5418 Å). Diffractograms were obtained in the range of 20° < 2θ < 70°, with a scan step of 0.02° and a scan speed of 1 s/step. For the calculation of the average crystallite size, the Debye–Scherrer equation was:
where dPXRD is the diameter of the crystallite, K is a constant with a value of 0.941, λ is the wavelength of radiation, β is the peak width at half height in radians and θ is the angle of reflection.
3.2.3. Raman Spectroscopy
Raman spectra were recorded using a 514.5 nm laser line as the excitation source, and the scattered light was analyzed by a T64000 micro-Raman spectrometer (HORIBA Jobin Yvon SAS, Longjumeau, France). A microscope objective of 50× magnification was used with a focused spot size of ~2–3 μm. The Raman shift was calibrated using the 520 cm−1 Raman band of crystalline Si.
3.2.4. Scanning Electron Microscopy (SEM)
SEM images were acquired using a Field Emission Scanning Electron Microscope (FE-SEM), Zeiss SUPRA 35VP (Carl Zeiss Microscopy GmbH, Jena, Germany), operating at 15 kV.
3.2.5. X-Ray Photoelectron Spectroscopy (XPS)
The experimental setup and procedure for the XPS measurements are described in detail elsewhere [52]. All powder samples were pressed into a pellet prior to XPS measurements.
3.2.6. Temperature-Programmed Reduction (H2-TPR)
Temperature-programmed reduction (H2-TPR) experiments were conducted under 3% H2/He (30 cm3 min−1) flow at a temperature range of 25–700 °C and a heating rate of 10 °C min−1. A 25 mg powdered sample was first pretreated under air flow up to its calcination temperature for 15 min. The mass signals were monitored with a mass spectrometer (Omnistar GSD 320, Pfeiffer Vacuum GmbH, Asslar, Germany).
3.2.7. Temperature-Programmed Desorption and Surface Reaction (Propene-TPD, Propene-TPSR, O2-TPD)
Propene temperature-programmed desorption (propene-TPD) experiments were carried out at atmospheric pressure in a fixed-bed reactor. The experimental setup included two independent gas lines, each equipped with mass flow controllers. The mass signals of effluent gases were monitored with a mass spectrometer (Omnistar/Pfeiffer Vacuum). Before adsorption, the sample (0.035–1 g, particle size 90–180 μm) was pretreated at the calcination temperature in an air flow of 30 cm3 min−1 for 15 min, followed by cooling to 30 °C under the same flow. Propene adsorption was performed at 30 °C under 0.05% propene/He flow (60 cm3 min−1 in total). Following the completion of the adsorption step, confirmed by stabilization of the mass signals, the reactor was purged with He. Finally, the TPD run was initiated under a He flow of 60 cm3 min−1 from room temperature up to the temperature at which CO2 production ceased, with a heating rate of 10 °C min−1. For propene-TPSR experiments, 1% O2/He flow was used instead of He during heating.
O2 temperature-programmed desorption (O2-TPD) experiments followed the same procedure as propene-TPD. The only difference was that instead of propene adsorption at room temperature, the sample remained under air flow for 30 min. After the adsorption of oxygen, the reactor was purged with He and the TPD run was initiated under a He flow of 60 cm3 min−1 from 30 °C to 700 °C, with a heating rate of 10 °C min−1.
3.2.8. Catalytic Measurements
Before catalytic tests, the catalysts were pretreated under 20 vol.% O2/He at 20 °C below the calcination temperature for 30 min and then cooled down to the lowest reaction temperature. In order to monitor the products and reactants, a gas chromatograph (Shimadzu GC-2014/Shimadzu Corporation, Kyoto, Japan) was used with both an FID and a TCD. A Hayesep Q (1/8 inch) column was used for the analysis of organic compounds and a Carboxen 1000(1/8 inch) column for O2 and CO2. The conversion (X) of propene was calculated using the following equation:
where Cin and Cout denote the feed and outlet concentrations of propene. The conversion (yield) to CO2 was calculated as:
The reactor feed consisted of: 825 ppm C3H6, 13% O2 and He at total flow rate 100 cm3 min−1. The W/F ratios were 0.072 g s cm−3 for all four samples. Sample Co-CA was also evaluated at W/F = 0.184 g s cm−3. Propene was totally oxidized to CO2 and H2O, and no partial oxidation products were detected. The measurements took place in the temperature range 140–280 °C.
3.2.9. Kinetic Measurements
Two catalysts were chosen for kinetic experiments, representative of high (Co-PR) and low (Co-CM) SSA. In the kinetic experiments, either propene partial pressure (Pprop) or oxygen partial pressure (PO2) was kept constant while varying the other. For oxygen dependence, propene pressure was kept constant at 0.0011 atm, and for propene dependence, oxygen pressure was kept constant at 0.13 atm. The total flow was 100 cm3 min−1. Kinetic measurements were carried out in a fixed-bed reactor at atmospheric pressure, with each catalyst evaluated at three different temperatures between 150 and 210 °C. Catalyst particles with a size range of 90 < dp < 180 μm were used to minimize mass/heat transfer limitations. The catalyst mass was adjusted between 20 and 450 mg depending on the experiment to maintain differential reactor conditions, with conversions kept below 15%. Overall, we did not observe any signs of major catalyst deactivation under any circumstance during catalytic and kinetic measurements.
4. Conclusions
In summary, four Co3O4 catalysts were synthesized by different preparation methods that exhibited different SSAs, crystallite sizes, particle geometries and populations of surface oxygen species. Propene-TPD/TPSR experiments confirmed the participation of lattice oxygen in propene oxidation and indicated that chemisorbed oxygen is used at low temperatures, while lattice oxygen is activated as the temperature rises. In the catalytic experiments, all catalysts exhibited similar specific reaction rates but different apparent activation energies. These differences in Eapp were attributed to a change in the kinetic regime from an LH-type mechanism, utilizing adsorbed oxygen species, to an MvK mechanism that utilizes lattice oxygen as the temperature increases. High- and low-SSA catalysts were examined kinetically, and their kinetic behavior cannot be explained by only one kinetic model. A competitive LH model that dominates at low propene partial pressures, combined with an MvK model that dominates at high propene partial pressures after saturation, was proposed to explain the kinetic results. Catalytic and kinetic data suggest that any structural differences observed in the prepared catalysts (SSA, particle size/geometry or oxygen species population) do not appreciably affect the intrinsic activity nor the mechanism of propene oxidation.
Supplementary Materials
The following supporting information can be downloaded at: https://www.mdpi.com/article/10.3390/catal16080704/s1, Figure S1: Raman spectra of Co3O4 catalysts; Figure S2: H2-TPR profiles of Co3O4 catalysts; Figure S3: Deconvolution of XPS Co 2p peak for samples Co-HY (a), Co-PR (b), Co-CA (c), Co-CM; Figure S4: Propene desorption profiles of Co3O4 catalysts during propene-TPD (a) and propene TPSR (b); Figure S5: CO (a) and H2 (b) desorption profiles of Co3O4 catalysts during propene-TPD; Figure S6: CO2 desorption profiles with surface oxygen species participation highlighted for samples Co-HY (a), Co-PR (b), Co-CA (c), Co-CM (d); Figure S7: Compensation effect; Figure S8: MvK and competitive LH model kinetics schematic; Figure S9: lnr vs ln(partial pressure of reactants) of kinetic experiments for catalyst Co-PR (a,b) and catalyst Co-CM (c,d); Table S1: Peak positions obtained from the deconvolution of XPS Co 2p spectra.
Author Contributions
Writing—original draft, methodology, investigation, formal analysis, and data curation: P.D. Methodology and formal analysis: M.S. Methodology and investigation: Y.G. Writing—original draft, supervision, resources, project administration, methodology, and conceptualization: T.I. All authors have read and agreed to the published version of the manuscript.
Funding
The research project was supported by the Hellenic Foundation for Research and Innovation (HFRI) under the “1st Call for HFRI Research Projects to support faculty members and researchers and the procurement of high-cost research equipment” (Project Number: HFRI-FM17-1876).
Data Availability Statement
The raw data supporting the conclusions of this article will be made available by the authors on request.
Acknowledgments
We would like to thank Labrini Sygellou for the XPS measurements.
Conflicts of Interest
The authors declare no conflicts of interest.
Abbreviations
The following abbreviations are used in this manuscript:
| VOCs | Volatile organic compound |
| LH | Langmuir–Hinshelwood |
| MvK | Mars–van Krevelen |
| SSA | Specific surface area |
| TPD | Temperature-programmed desorption |
| TPSR | Temperature-programmed surface reaction |
References
- Zhou, X.; Zhou, X.; Wang, C.; Zhou, H. Environmental and human health impacts of volatile organic compounds: A perspective review. Chemosphere 2023, 313, 137489. [Google Scholar] [CrossRef] [Scilit] [PubMed]
- Bauguitte, S.J.-B.; Brough, N.; Frey, M.M.; Jones, A.E.; Maxfield, D.J.; Roscoe, H.K.; Rose, M.C.; Wolff, E.W. A network of autonomous surface ozone monitors in Antarctica: Technical description and first results. Atmos. Meas. Tech. Discuss. 2011, 4, 645–658. [Google Scholar] [CrossRef] [Scilit]
- Rumchev, K.; Brown, H.; Spickett, J. Volatile Organic Compounds: Do they present a risk to our health? Rev. Environ. Health 2007, 22, 39. [Google Scholar] [CrossRef] [Scilit] [PubMed]
- Liu, N.; Bu, Z.; Liu, W.; Kan, H.; Zhao, Z.; Deng, F.; Huang, C.; Zhao, B.; Zeng, X.; Sun, Y.; et al. Health effects of exposure to indoor volatile organic compounds from 1980 to 2017: A systematic review and meta-analysis. Indoor Air 2022, 32, e13038. [Google Scholar] [CrossRef] [Scilit] [PubMed]
- Na, K.; Moon, K.-C.; Kim, Y.P. Source contribution to aromatic VOC concentration and ozone formation potential in the atmosphere of Seoul. Atmos. Environ. 2005, 39, 5517–5524. [Google Scholar] [CrossRef] [Scilit]
- Pandey, P.; Yadav, R. A Review on Volatile Organic Compounds (VOCs) as Environmental Pollutants: Fate and Distribution. Int. J. Plant Environ. 2018, 4, 14–26. [Google Scholar] [CrossRef] [Scilit]
- Liu, Y.; Shao, M.; Fu, L.; Lu, S.; Zeng, L.; Tang, D. Source profiles of volatile organic compounds (VOCs) measured in China: Part I. Atmos. Environ. 2008, 42, 6247–6260. [Google Scholar] [CrossRef] [Scilit]
- Sha, Q.; Zhu, M.; Huang, H.; Wang, Y.; Huang, Z.; Zhang, X.; Tang, M.; Lu, M.; Chen, C.; Shi, B.; et al. A newly integrated dataset of volatile organic compounds (VOCs) source profiles and implications for the future development of VOCs profiles in China. Sci. Total Environ. 2021, 793, 148348. [Google Scholar] [CrossRef] [Scilit] [PubMed]
- Liu, Y.; Song, M.; Liu, X.; Zhang, Y.; Hui, L.; Kong, L.; Zhang, Y.; Zhang, C.; Qu, Y.; An, J.; et al. Characterization and sources of volatile organic compounds (VOCs) and their related changes during ozone pollution days in 2016 in Beijing, China. Environ. Pollut. 2020, 257, 113599. [Google Scholar] [CrossRef] [Scilit] [PubMed]
- Kamal, M.S.; Razzak, S.A.; Hossain, M.M. Catalytic oxidation of volatile organic compounds (VOCs)—A review. Atmos. Environ. 2016, 140, 117–134. [Google Scholar] [CrossRef] [Scilit]
- He, C.; Cheng, J.; Zhang, X.; Douthwaite, M.; Pattisson, S.; Hao, Z. Recent Advances in the Catalytic Oxidation of Volatile Organic Compounds: A Review Based on Pollutant Sorts and Sources. Chem. Rev. 2019, 119, 4471–4568. [Google Scholar] [CrossRef] [Scilit] [PubMed]
- Lou, B.; Shakoor, N.; Adeel, M.; Zhang, P.; Huang, L.; Zhao, Y.; Zhao, W.; Jiang, Y.; Rui, Y. Catalytic oxidation of volatile organic compounds by non-noble metal catalyst: Current advancement and future prospectives. J. Clean. Prod. 2022, 363, 132523. [Google Scholar] [CrossRef] [Scilit]
- Zasada, F.; Gryboś, J.; Budiyanto, E.; Janas, J.; Sojka, Z. Oxygen species stabilized on the cobalt spinel nano-octahedra at various reaction conditions and their role in catalytic CO and CH4 oxidation, N2O decomposition and oxygen isotopic exchange. J. Catal. 2019, 371, 224–235. [Google Scholar] [CrossRef] [Scilit]
- Shojaee, K.; Montoya, A.; Haynes, B.S. Insight into oxygen stability and vacancy formation on Co3O4 model slabs. Comput. Mater. Sci. 2013, 72, 15–25. [Google Scholar] [CrossRef] [Scilit]
- Bratan, V.; Vasile, A.; Chesler, P.; Hornoiu, C. Insights into the Redox and Structural Properties of CoOx and MnOx: Fundamental Factors Affecting the Catalytic Performance in the Oxidation Process of VOCs. Catalysts 2022, 12, 1134. [Google Scholar] [CrossRef] [Scilit]
- Lyu, J.; Zhang, T.; Li, J. Comparative Study of Co3+, Co2+, and Oxygen Vacancies in Photocatalytic Ozonation of Vocs on Co3O4 Crystal Facets. Sep. Purif. Technol. 2025, 363, 132072. [Google Scholar] [CrossRef] [Scilit]
- Mingle, K.; Lauterbach, J. Synthesis-Structure-Activity Relationships in Co3O4 Catalyzed CO Oxidation. Front. Chem. 2018, 6, 185. [Google Scholar] [CrossRef] [Scilit] [PubMed]
- Chen, Z.; Wang, S.; Liu, W.; Gao, X.; Gao, D.; Wang, M.; Wang, S. Morphology-dependent performance of Co3O4 via facile and controllable synthesis for methane combustion. Appl. Catal. A Gen. 2016, 525, 94–102. [Google Scholar] [CrossRef] [Scilit]
- Li, R.; Huang, Y.; Zhu, D.; Ho, W.; Lee, S.; Cao, J. A Review of Co3O4-based Catalysts for Formaldehyde Oxidation at Low Temperature: Effect Parameters and Reaction Mechanism. Aerosol Sci. Eng. 2020, 4, 147–168. [Google Scholar] [CrossRef] [Scilit]
- Meng, W.; Song, X.; Bao, L.; Chen, B.; Ma, Z.; Zhou, J.; Jiang, Q.; Wang, F.; Liu, X.; Shi, C.; et al. Synergistic doping and de-doping of Co3O4 catalyst for effortless formaldehyde oxidation. Chem. Eng. J. 2024, 494, 153028. [Google Scholar] [CrossRef] [Scilit]
- Mei, J.; Xie, J.; Qu, Z.; Ke, Y.; Hu, X.; Yan, N. Ordered mesoporous spinel Co3O4 as a promising catalyst for the catalytic oxidation of dibromomethane. Mol. Catal. 2018, 461, 60–66. [Google Scholar] [CrossRef] [Scilit]
- de Rivas, B.; López-Fonseca, R.; Jiménez-González, C.; Gutiérrez-Ortiz, J.I. Synthesis, characterisation and catalytic performance of nanocrystalline Co3O4 for gas-phase chlorinated VOC abatement. J. Catal. 2011, 281, 88–97. [Google Scholar] [CrossRef] [Scilit]
- Georgiou, Y.; Smyrnioti, M.; Ioannides, T. Co3O4 Catalysts for Complete Toluene Oxidation: Review including Meta-Analysis of Catalyst Activity Data. Catalysts 2023, 13, 1454. [Google Scholar] [CrossRef] [Scilit]
- Sanchis, R.; García, A.; Ivars-Barceló, F.; Taylor, S.H.; García, T.; Dejoz, A.; Vázquez, M.I.; Solsona, B. Highly Active Co3O4-Based Catalysts for Total Oxidation of Light C1–C3 Alkanes Prepared by a Simple Soft Chemistry Method: Effect of the Heat-Treatment Temperature and Mixture of Alkanes. Materials 2021, 14, 7120. [Google Scholar] [CrossRef] [Scilit] [PubMed]
- Chai, G.; Du, D.; Wang, C.; Zhang, C.; Cardenas, L.; Bion, N.; Guo, Y.; Gil, S.; Giroir-Fendler, A. Spinel Co3O4 oxides-support synergistic effect on catalytic oxidation of toluene. Appl. Catal. A Gen. 2021, 614, 118044. [Google Scholar] [CrossRef] [Scilit]
- Liu, R.; Chu, Y.; Li, Y.; Li, K.; Li, T.; Yu, H.; Liang, R.; Chen, Y.; Wu, T.; Yin, H. Facet effect on nanosheet Co3O4 catalysts for toluene oxidation: Decisive role of Co3+ and reaction-induced oxygen vacancy. J. Environ. Chem. Eng. 2024, 12, 112640. [Google Scholar] [CrossRef] [Scilit]
- Yan, Q.; Li, X.; Zhao, Q.; Chen, G. Shape-controlled fabrication of the porous Co3O4 nanoflower clusters for efficient catalytic oxidation of gaseous toluene. J. Hazard. Mater. 2012, 209–210, 385–391. [Google Scholar] [CrossRef] [Scilit] [PubMed]
- Li, G.; Shui, Z.; Duan, X.; Yang, H.; Zhao, Z.; Zhao, T.; Zhang, Z.; Jiang, G.; Ren, H.; Cheng, J.; et al. Unveiling the Balance between Catalytic Activity and Water Resistance over Co3O4 Catalysts for Propane Oxidation: The Role of Crystal Facet and Oxygen Vacancy. ACS Catal. 2023, 13, 237–247. [Google Scholar] [CrossRef] [Scilit]
- Ren, Q.; Zhao, X.; Zhong, J.; Zhang, J.; Tian, J.; Yan, D.; Liu, P.; Fu, M.; Chen, L.; Wu, J.; et al. Unravelling the role of oxygen species in toluene oxidation over Co3O4-base catalysts: In situ DRIFTS coupled with quasi in situ XPS. J. Catal. 2023, 418, 130–140. [Google Scholar] [CrossRef] [Scilit]
- Chen, Y.; Zhang, Z.; Wang, X.; Lin, Y.; Zuo, J.; Yang, X.; Chen, S.; Luo, Y.; Qian, Q.; Chen, Q. Crystal Plane Effect of Co3O4 on Styrene Catalytic Oxidation: Insights into the Role of Co3+ and Oxygen Mobility at Diverse Temperatures. ACS Appl. Mater. Interfaces 2023, 15, 32404–32415. [Google Scholar] [CrossRef] [Scilit] [PubMed]
- Ma, L.; Geng, Y.; Chen, X.; Yan, N.; Li, J.; Schwank, J.W. Reaction mechanism of propane oxidation over Co3O4 nanorods as rivals of platinum catalysts. Chem. Eng. J. 2020, 402, 125911. [Google Scholar] [CrossRef] [Scilit]
- Ren, Z.; Wu, Z.; Song, W.; Xiao, W.; Guo, Y.; Ding, J.; Suib, S.L.; Gao, P.-X. Low temperature propane oxidation over Co3O4 based nano-array catalysts: Ni dopant effect, reaction mechanism and structural stability. Appl. Catal. B 2016, 180, 150–160. [Google Scholar] [CrossRef] [Scilit]
- Makhlouf, S.A.; Bakr, Z.H.; Aly, K.I.; Moustafa, M.S. Structural, electrical and optical properties of Co3O4 nanoparticles. Superlattices Microstruct. 2013, 64, 107–117. [Google Scholar] [CrossRef] [Scilit]
- Dutta, P.; Seehra, M.S.; Thota, S.; Kumar, J. A comparative study of the magnetic properties of bulk and nanocrystalline Co3O4. J. Phys. Condens. Matter 2008, 20, 015218. [Google Scholar] [CrossRef] [Scilit]
- Thommes, M.; Kaneko, K.; Neimark, A.V.; Olivier, J.P.; Rodriguez-Reinoso, F.; Rouquerol, J.; Sing, K.S.W. Physisorption of gases, with special reference to the evaluation of surface area and pore size distribution (IUPAC Technical Report). Pure Appl. Chem. 2015, 87, 1051–1069. [Google Scholar] [CrossRef] [Scilit]
- Gawali, S.R.; Gandhi, A.C.; Gaikwad, S.S.; Pant, J.; Chan, T.-S.; Cheng, C.-L.; Ma, Y.-R.; Wu, S.Y. Role of cobalt cations in short range antiferromagnetic Co3O4 nanoparticles: A thermal treatment approach to affecting phonon and magnetic properties. Sci. Rep. 2018, 8, 249. [Google Scholar] [CrossRef] [Scilit] [PubMed]
- Jiang, J.; Li, L. Synthesis of sphere-like Co3O4 nanocrystals via a simple polyol route. Mater. Lett. 2007, 61, 4894–4896. [Google Scholar] [CrossRef] [Scilit]
- Hadjiev, V.G.; Iliev, M.N.; Vergilov, I.V. The Raman spectra of Co3O4. J. Phys. C Solid State Phys. 1988, 21, L199–L201. [Google Scholar] [CrossRef] [Scilit]
- Petitto, S.C.; Marsh, E.M.; Carson, G.A.; Langell, M.A. Cobalt oxide surface chemistry: The interaction of CoO(100), Co3O4(110) and Co3O4(111) with oxygen and water. J. Mol. Catal. A Chem. 2008, 281, 49–58. [Google Scholar] [CrossRef] [Scilit]
- Petitto, S.C.; Langell, M.A. Surface composition and structure of Co3O4(110) and the effect of impurity segregation. J. Vac. Sci. Technol. A Vac. Surf. Films 2004, 22, 1690–1696. [Google Scholar] [CrossRef] [Scilit]
- Davis, E.M.; Bergmann, A.; Zhan, C.; Kuhlenbeck, H.; Cuenya, B.R. Comparative study of Co3O4(111), CoFe2O4(111), and Fe3O4(111) thin film electrocatalysts for the oxygen evolution reaction. Nat. Commun. 2023, 14, 4791. [Google Scholar] [CrossRef] [Scilit] [PubMed]
- Pan, S.; Li, H.; Wang, T.; Fu, Y.; Wang, S.; Xie, Z.; Wei, L.; Li, H.; Li, N. Er-Doping Enhances the Oxygen Evolution Performance of Cobalt Oxide in Acidic Medium. ACS Catal. 2024, 14, 13814–13824. [Google Scholar] [CrossRef] [Scilit]
- Anke, S.; Falk, T.; Bendt, G.; Sinev, I.; Hävecker, M.; Antoni, H.; Zegkinoglou, I.; Jeon, H.; Knop-Gericke, A.; Schlögl, R.; et al. On the reversible deactivation of cobalt ferrite spinel nanoparticles applied in selective 2-propanol oxidation. J. Catal. 2020, 382, 57–68. [Google Scholar] [CrossRef] [Scilit]
- Ji, Y.; Zhao, Z.; Duan, A.; Jiang, G.; Liu, J. Comparative Study on the Formation and Reduction of Bulk and Al2O3-Supported Cobalt Oxides by H2 -TPR Technique. J. Phys. Chem. C 2009, 113, 7186–7199. [Google Scholar] [CrossRef] [Scilit]
- Gorimbo, J.; Muvhiiwa, R.; Llane, E.; Hildebrandt, D. Cobalt Catalyst Reduction Thermodynamics in Fischer Tropsch: An Attainable Region Approach. Reactions 2020, 1, 115–129. [Google Scholar] [CrossRef] [Scilit]
- Wang, C.-B.; Tang, C.-W.; Gau, S.-J.; Chien, S.-H. Effect of the surface area of cobaltic oxide on carbon monoxide oxidation. Catal. Lett. 2005, 101, 59–63. [Google Scholar] [CrossRef] [Scilit]
- Pöyhtäri, S.; Heikkinen, E.-P.; Heikkilä, A. Kinetics of thermal decomposition and hydrogen reduction of Cobalt compounds: A review. Thermochim. Acta 2025, 746, 179952. [Google Scholar] [CrossRef] [Scilit]
- Pritchard, J.; Morris, L.; Walsh, D.; Sadasivan, S.; Ménard, H.; Bellabarba, R.M.; Weller, M.T.; Tooze, R.P. Synthesis of Well-Defined, Surfactant-Free Co3O4 Nanoparticles: The Impact of Size and Manganese Promotion on Co3O4 Reduction and Water Oxidation Activity. Catal. Lett. 2018, 148, 235–245. [Google Scholar] [CrossRef] [Scilit]
- Ren, Q.; Mo, S.; Peng, R.; Feng, Z.; Zhang, M.; Chen, L.; Fu, M.; Wu, J.; Ye, D. Controllable synthesis of 3D hierarchical Co3O4 nanocatalysts with various morphologies for the catalytic oxidation of toluene. J. Mater. Chem. A 2018, 6, 498–509. [Google Scholar] [CrossRef] [Scilit]
- Liu, W.; Liu, R.; Zhang, H.; Jin, Q.; Song, Z.; Zhang, X. Fabrication of Co3O4 nanospheres and their catalytic performances for toluene oxidation: The distinct effects of morphology and oxygen species. Appl. Catal. A Gen. 2020, 597, 117539. [Google Scholar] [CrossRef] [Scilit]
- Bai, B.; Arandiyan, H.; Li, J. Comparison of the performance for oxidation of formaldehyde on nano-Co3O4, 2D-Co3O4, and 3D-Co3O4 catalysts. Appl. Catal. B 2013, 142–143, 677–683. [Google Scholar] [CrossRef] [Scilit]
- Dimitropoulos, P.; Smyrnioti, M.; Georgiou, Y.; Apostolopoulos, N.; Ioannides, T. Mechanistic insights into the role of oxygen species in the catalytic oxidation of propene, butane, and toluene over Mn2O3. Mol. Catal. 2026, 599, 116023. [Google Scholar] [CrossRef] [Scilit]
- Feng, Y.; Wang, C.; Wang, C.; Huang, H.; Hsi, H.-C.; Duan, E.; Liu, Y.; Guo, G.; Dai, H.; Deng, J. Catalytic stability enhancement for pollutant removal via balancing lattice oxygen mobility and VOCs adsorption. J. Hazard. Mater. 2022, 424, 127337. [Google Scholar] [CrossRef] [Scilit] [PubMed]
- Chen, B.; Wu, B.; Yu, L.; Crocker, M.; Shi, C. Investigation into the Catalytic Roles of Various Oxygen Species over Different Crystal Phases of MnO2 for C6 H6 and HCHO Oxidation. ACS Catal. 2020, 10, 6176–6187. [Google Scholar] [CrossRef] [Scilit]
- Pan, T.; Bai, S.; Zhang, X.; Deng, H.; Lu, Y.; Shan, W.; He, H. In-Depth Understanding of the Oxidative Compatibility of Volatile Organic Compounds with Mn2O3 and Pt-Loaded Catalysts. Environ. Sci. Technol. 2024, 58, 9381–9392. [Google Scholar] [CrossRef] [Scilit] [PubMed]
- Song, L.; Liu, Y.; Zhang, S.; Zhou, C.; Ma, K.; Yue, H. Tuning Oxygen Vacancies of the Co3O4 Catalyst through an Ethanol-Assisted Hydrothermal Method for Low-Temperature CO Oxidation. Ind. Eng. Chem. Res. 2022, 61, 14783–14792. [Google Scholar] [CrossRef] [Scilit]
- Wang, Y.-Z.; Zhao, Y.-X.; Gao, C.-G.; Liu, D.-S. Origin of the High Activity and Stability of Co3O4 in Low-temperature CO Oxidation. Catal. Lett. 2008, 125, 134–138. [Google Scholar] [CrossRef] [Scilit]
- Liotta, L.F.; Ousmane, M.; Di Carlo, G.; Pantaleo, G.; Deganello, G.; Marcì, G.; Retailleau, L.; Giroir-Fendler, A. Total oxidation of propene at low temperature over Co3O4–CeO2 mixed oxides: Role of surface oxygen vacancies and bulk oxygen mobility in the catalytic activity. Appl. Catal. A Gen. 2008, 347, 81–88. [Google Scholar] [CrossRef] [Scilit]
- Zhong, J.; Zeng, Y.; Chen, D.; Mo, S.; Zhang, M.; Fu, M.; Wu, J.; Su, Z.; Chen, P.; Ye, D. Toluene oxidation over Co3+-rich spinel Co3O4: Evaluation of chemical and by-product species identified by in situ DRIFTS combined with PTR-TOF-MS. J. Hazard. Mater. 2020, 386, 121957. [Google Scholar] [CrossRef] [Scilit] [PubMed]
- Ilieva, L.; Petrova, P.; Venezia, A.M.; Anghel, E.M.; State, R.; Avdeev, G.; Tabakova, T. Mechanochemically Prepared Co3O4-CeO2 Catalysts for Complete Benzene Oxidation. Catalysts 2021, 11, 1316. [Google Scholar] [CrossRef] [Scilit]
- Song, X.; Kong, Y.; Sun, X.; Ma, S.; Zhu, S.; Liu, Z.; Liu, H.; Wang, L.; Yang, S. Facet-dependent catalytic mechanism of Co3O4 for VOCs oxidation: Role of tetra-coordinated co on (220) Planes. J. Colloid Interface Sci. 2026, 707, 139779. [Google Scholar] [CrossRef] [Scilit] [PubMed]
- Roduner, E. Understanding catalysis. Chem. Soc. Rev. 2014, 43, 8226–8239. [Google Scholar] [CrossRef] [Scilit] [PubMed]
- van Bokhoven, J.A.; Williams, B.A.; Ji, W.; Koningsberger, D.C.; Kung, H.H.; Miller, J.T. Observation of a compensation relation for monomolecular alkane cracking by zeolites: The dominant role of reactant sorption. J. Catal. 2004, 224, 50–59. [Google Scholar] [CrossRef] [Scilit]
- Bligaard, T.; Honkala, K.; Logadottir, A.; Nørskov, J.K.; Dahl, S.; Jacobsen, C.J.H. On the Compensation Effect in Heterogeneous Catalysis. J. Phys. Chem. B 2003, 107, 9325–9331. [Google Scholar] [CrossRef] [Scilit]
- Barrie, P.J. The mathematical origins of the kinetic compensation effect: 1. the effect of random experimental errors. Phys. Chem. Chem. Phys. 2012, 14, 318–326. [Google Scholar] [CrossRef] [Scilit] [PubMed]
- Benard, S.; Baylet, A.; Vernoux, P.; Valverde, J.L.; Giroir-Fendler, A. Kinetics of the propene oxidation over a Pt/alumina catalyst. Catal. Commun. 2013, 36, 63–66. [Google Scholar] [CrossRef] [Scilit]

Disclaimer/Publisher’s Note: The statements, opinions and data contained in all publications are solely those of the individual author(s) and contributor(s) and not of MDPI and/or the editor(s). MDPI and/or the editor(s) disclaim responsibility for any injury to people or property resulting from any ideas, methods, instructions or products referred to in the content. |
© 2026 by the authors. Licensee MDPI, Basel, Switzerland. This article is an open access article distributed under the terms and conditions of the Creative Commons Attribution (CC BY) license.