Article

Fluorine-Expedited Sulfur Vacancy of Mn0.6Cd0.4S Photocatalyst Enables High-Efficiency Hydrogen Production

1
Department of Chemical Engineering and Energy Technology, Shanghai Institute of Technology, Shanghai 201418, China
2
Yajiang Clean Energy Science and Technology Research (Beijing), Co., Ltd., Beijing 100038, China
3
School of Qilu Transportation, Shandong University, Jinan 250061, China
*
Author to whom correspondence should be addressed.
Catalysts 2026, 16(8), 702; https://doi.org/10.3390/catal16080702
Submission received: 20 June 2026 / Revised: 23 July 2026 / Accepted: 28 July 2026 / Published: 1 August 2026

Abstract

Developing efficient, stable, and low-cost photocatalysts is the key to achieving large-scale photocatalytic hydrogen production. Herein, a universal fluoride-induced sulfur vacancy engineering strategy is proposed for the full MnxCd1−xS solid solution series (x = 0.1–0.9), with Mn0.6Cd0.4S selected as the representative optimal sample. By introducing ammonium fluoride during the hydrothermal process, controllable sulfur vacancies are generated to enable efficient separation and transfer of photogenerated charge carriers for high-efficiency hydrogen production. Impressively, the optimal fluoride-modified Mn0.6Cd0.4S (F-MCS) photocatalyst shows the fastest hydrogen production rate up to 8.08 mmol·g−1·h−1, which is 1.5 times that of pure MCS nanoparticles, as well as enhanced photochemical stability. Quantitative EDS elemental analysis verifies that 1.2 at.% fluorine is incorporated into the lattice of F-MCS, rather than being physically adsorbed as residual ammonium fluoride precursors. Experimental results reveal that the introduction of NH4F can effectively facilitate the sulfur vacancy formation in MCS, which alters the band position of MCS nanoflakes for increased light harvesting, and serves carrier separation centers for promoting the efficient transfer of photogenerated charge carriers. This study provides valuable insights into the design of a solid solution-based photocatalyst for efficient solar-driven hydrogen production for sustainable energy applications.

Graphical Abstract

1. Introduction

Currently, the world is facing the dual challenges of energy crisis and environmental degradation, and the continuous advancement of industrialization has intensified the consumption of traditional fossil fuels such as coal, oil, and natural gas. This has led to a sharp decline in the reserves of fossil fuels year by year, making it difficult to meet the long-term energy supply needs of society [1,2,3]. More seriously, the use of these fossil fuels releases harmful gases such as carbon dioxide and nitrogen oxides. These gases not only cause increasingly severe greenhouse effects, but also lead to frequent occurrences of haze weather. Therefore, both ecological environment security and the sustainable development of human society are seriously threatened [4,5,6]. To address these pressing global challenges, developing clean, renewable and sustainable energy conversion technologies has become an urgent research priority worldwide. Among various promising strategies, photocatalytic water splitting for hydrogen production stands out due to its unique advantage of directly converting abundant solar energy into zero-emission hydrogen fuel. The performance of this technology is fundamentally determined by the efficiency of photocatalysts, which has driven researchers to explore a wide range of semiconductor materials with optimized structures and properties. Typical representatives include the RGO/CuO-ZnO Z-type heterojunction [7], PLNPs/SCN heterojunction [8], IEF-11/g-C3N4 S-Scheme heterojunction [9], Bi2S3/Bi0.5Na0.5TiO3 composite catalyst containing S vacancies [10], non-metallic hybrid two-dimensional/one-dimensional porous carbon nitride/fibrous phosphorus composite material [11], and nitrogen doped ZnIn2S4 and TPA (tungsten based polyoxometalate) [12].
Despite the remarkable progress achieved by the above-mentioned photocatalysts developed through heterojunction construction, defect engineering, and multicomponent hybridization, sulfide solid solutions stand out as one of the most promising material systems for visible-light-driven hydrogen production due to their intrinsic broad spectral response and tunable electronic structure. Among numerous candidate materials, MnxCd1−xS [13,14,15] has shown significant potential in photocatalytic hydrogen production research due to its excellent visible light absorption ability and flexible band tunability. On the one hand, by regulating the Mn/Cd ratio, its band structure can be precisely adjusted, expanding the light response range to the near-infrared region, thereby significantly improving the efficiency of solar light utilization [16,17,18,19]. On the other hand, the introduction of Mn helps to enhance the stability of the crystal structure and promote the separation and migration of photogenerated carriers [20]. The above advantages make MnxCd1−xS outstanding in sulfide photocatalysts, and its performance is usually better than that of single CdS [21] or MnS [22]. For example, the piezoelectric polarization field regulates the hydrogen evolution rate of Ni/Mn0.2Cd0.8S composite material to 72.38 mmol·g−1·h−1 [23]. The hydrogen evolution rate of the hollow spherical g-C3N4/Mn0.25Cd0.75S (HCNS/MCS) heterojunction can reach up to 31.34 mmol·g−1·h−1, which is 2.8 times that of pure MCS and 224 times that of pure HCNS [24]; Mn0.4Cd0.6S forms a heterojunction with CuS, and its hydrogen evolution rate is three times higher than that of Mn0.4Cd0.6S alone [25]. Although MnxCd1−xS exhibits outstanding performance in sulfide photocatalysts and has good application prospects, its photocatalytic efficiency is still limited by the fast recombination rate of photogenerated electron hole pairs and limited surface active sites.
Many mainstream modification routes, including noble metal cocatalyst loading, cation/anion doping and heterojunction fabrication, fail to fundamentally eliminate intrinsic charge recombination at the atomic scale. Noble metals only facilitate surface electron transfer without regulating the bulk lattice defects of the MnxCd1−xS matrix, and bulk carrier recombination inside the semiconductor cannot be thoroughly resolved. Traditional non-metal dopants tend to introduce deep impurity levels or severe lattice distortion, which evolve into new charge recombination centers and degrade catalytic performance. In contrast, fluoride possesses unique electronegativity and coordination capacity toward transition metal cations, enabling atomic-scale modulation of sulfide lattices. To address these two core bottlenecks that restrict its practical application, surface modification with fluoride has emerged as a simple and effective strategy to boost the photocatalytic performance of sulfide semiconductors. By introducing fluoride during the hydrothermal synthesis process, it can precisely modulate the surface electronic structure and defect chemistry of MnxCd1−xS without destroying its intrinsic hexagonal wurtzite crystal framework. The ionic radius of F (0.133 nm) is smaller than that of S2− (0.184 nm), which enables it to incorporate into the surface and near-surface lattice and induce only moderate lattice contraction, avoiding the severe structural distortion caused by traditional non-metal dopants at high doping levels. Aliovalent substitution of S2− by monovalent F creates lattice charge imbalance, which spontaneously generates uniform sulfur vacancies as shallow electron traps to spatially separate photogenerated carriers, while fluoride can directionally tune band alignment to strengthen hole oxidation capacity, outperforming conventional modification strategies [26,27].
Based on this, a full series of MnxCd1−xS (x = 0.1–0.9) and corresponding fluoride-modified F-MnxCd1−xS nanoflakes were fabricated by introducing NH4F into the Mn2+/Cd2+ precursor solution using hydrothermal technology. Taking Mn0.6Cd0.4S as the representative optimal sample, we systematically studied the effect of ammonium fluoride introduction on the structure, properties and photocatalytic performance of MnxCd1−xS. On this basis, the influencing factors and laws of hydrogen production behavior by F-MCS photocatalysis were investigated. Finally, a preliminary exploration was conducted on the impact mechanism of ammonium fluoride (Note: MCS is used below to represent Mn0.6Cd0.4S, and F-MCS represents the prepared Mn0.6Cd0.4S nanoflakes rich in sulfur vacancies). A comprehensive performance benchmark against state-of-the-art CdS and MnxCd1−xS photocatalysts is provided in Table S1 of the Supporting Information to quantify the competitiveness of our fluoride-modified materials.

2. Results and Discussion

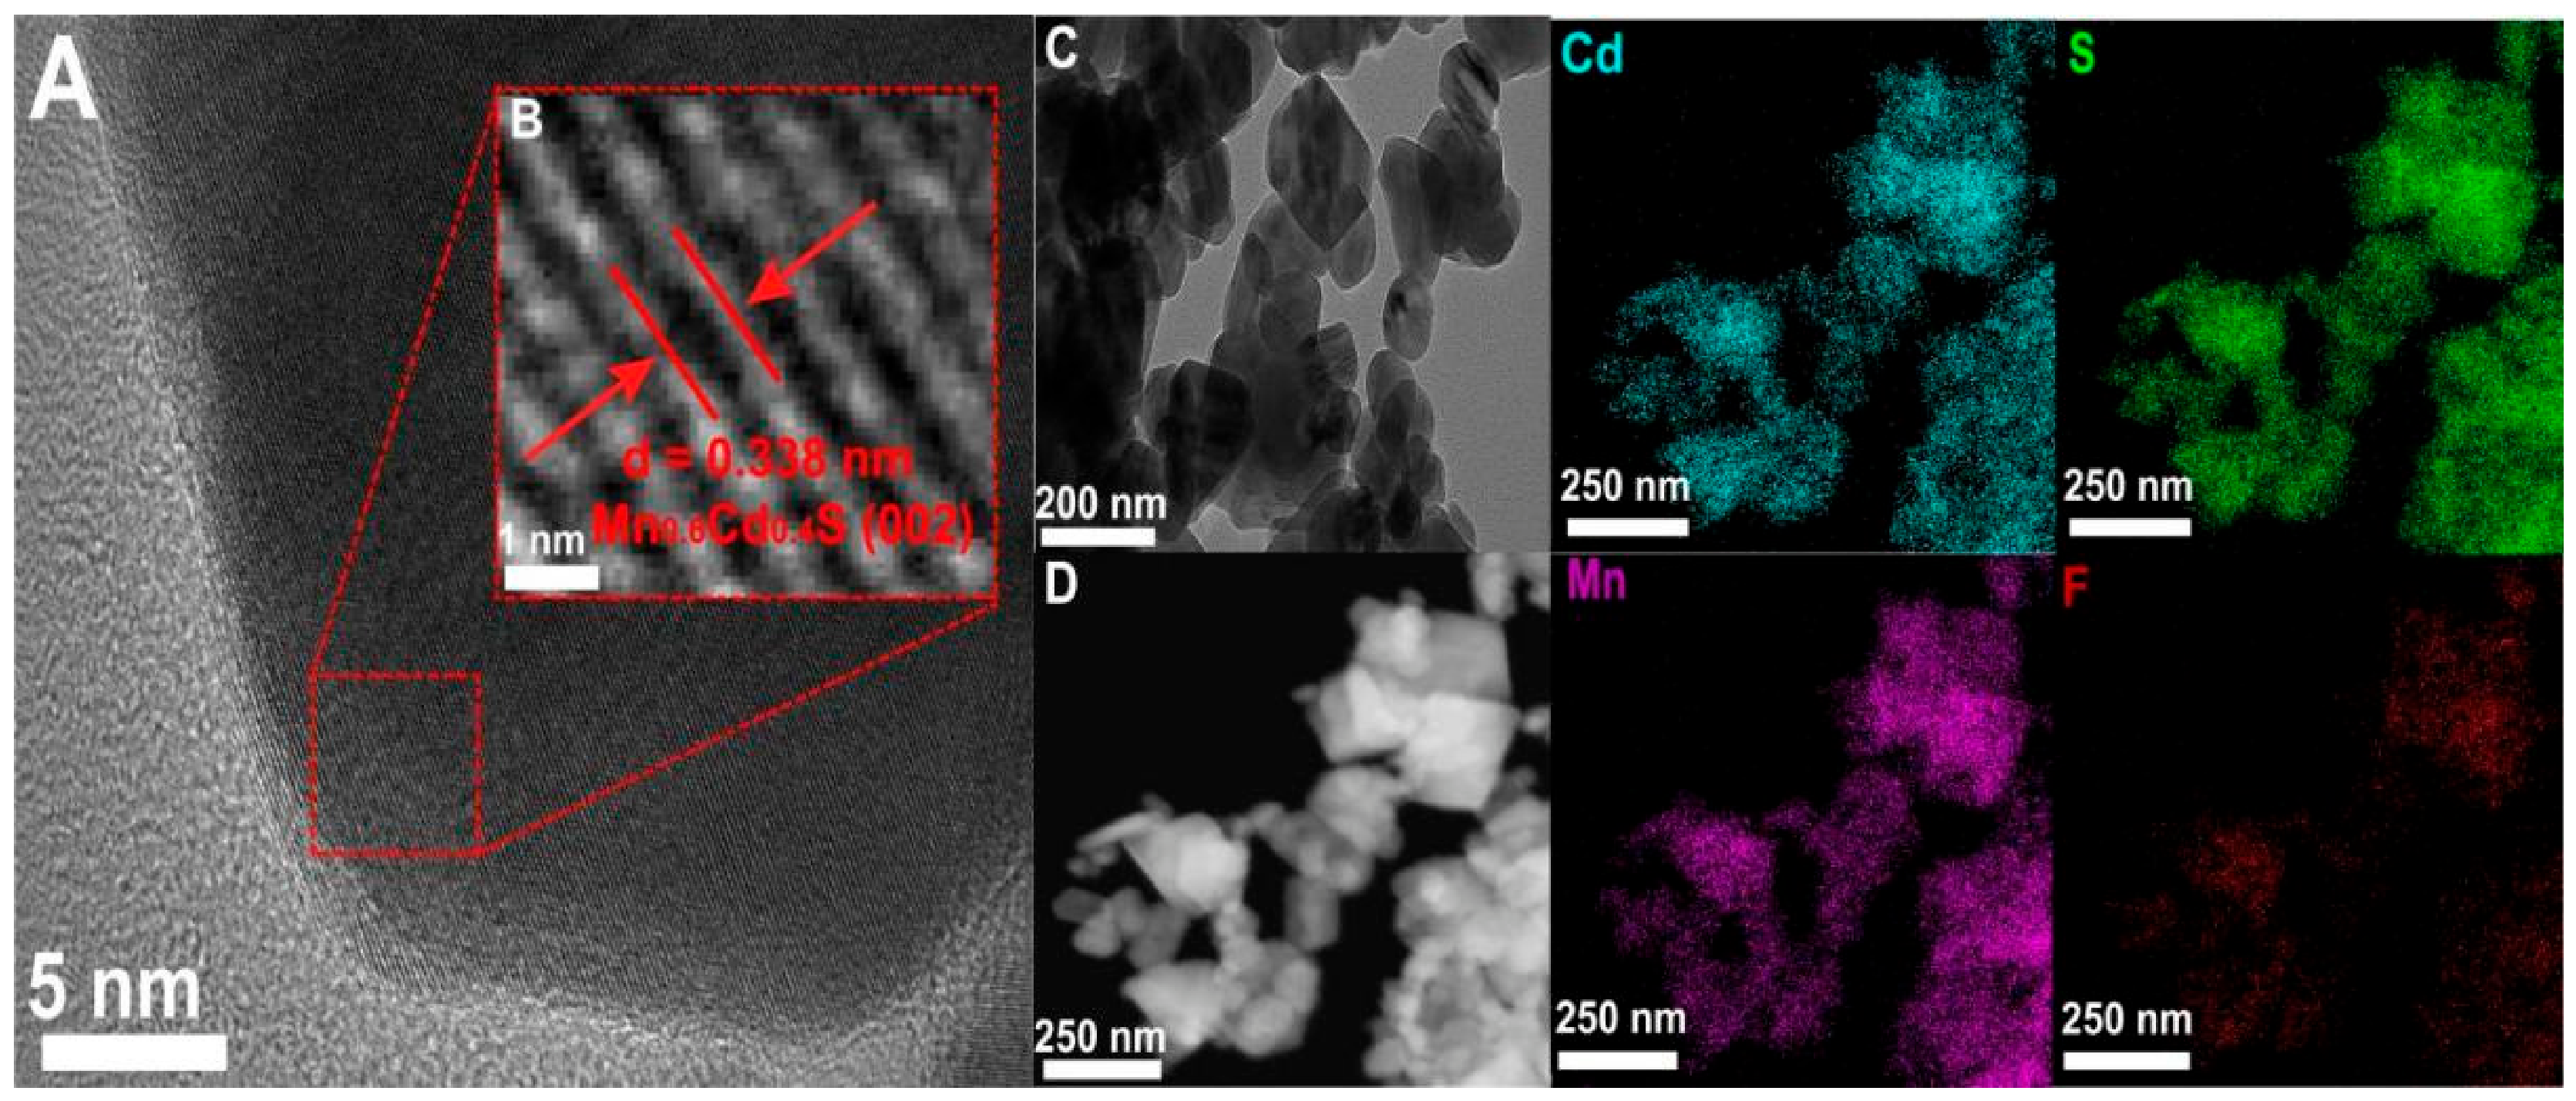
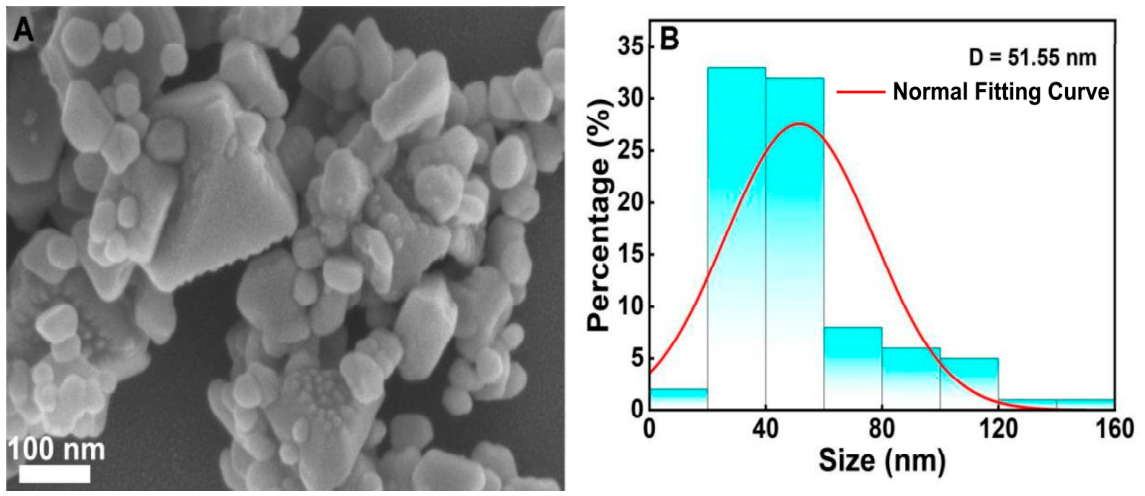
MnxCd1−xS and fluoride-modified MCS (F-MCS) samples with various Mn/Cd molar ratios were synthesized via hydrothermal routes, as illustrated in Scheme 1. The SEM image of F-MCS (Figure 1A) displays coexisting intact nanoflakes and discrete granular fragments, with particle size distribution ranging from 10 to 60 nm and an average size of ~30 nm (Figure 1B). If the nanoflakes maintained complete lamellar morphology without fragmentation, the particle size would be concentrated at hundreds of nanometers, which provides direct morphological evidence for sheet splitting. TEM (Figure 2C) clearly shows fractured edges and detached tiny particles peeled off from primary nanoflakes [28]. During hydrothermal synthesis, F with strong coordination continuously etches sheet edges; lattice contraction (0.58% confirmed by cell refinement) accumulates strain at defect sites to generate microcracks, while in situ sulfur vacancies weaken interlayer bonding and accelerate nanoflake fragmentation. HRTEM (Figure 2A,B) exhibits clear lattice fringes of 0.338 nm corresponding to the (002) plane of hexagonal MnCdS (PDF #89-0443) [29]. Elemental mapping (Figure 2D) shows uniform Mn, Cd, S, and F distribution across F-MCS; quantitative EDS testing proves that the bulk fluorine atomic percentage in F-MCS is 1.2%, far lower than the 0.73 mol L−1 NH4F precursor concentration. We stress that this value only serves as preliminary reference evidence of fluorine existence, not a reliable quantitative benchmark. We further highlighted the multi-dimensional, mutually corroborated characterization chain to validate F insertion into the MCS lattice (the core basis for our catalytic enhancement mechanism), eliminating over-reliance on the ambiguous EDS numerical value: (1) the XPS F 1s characteristic peak confirms chemical bonding between F and metal cations, proving fluorine is not physically adsorbed on the surface; (2) refinement of XRD patterns verifies 0.36% uniform lattice contraction, consistent with substitution of large S2− (0.184 nm) by smaller F (0.133 nm); and (3) new Mn–F metal–ligand vibration peaks appear in the FT-IR spectra, directly demonstrating F coordination with Mn sites in the crystal lattice.
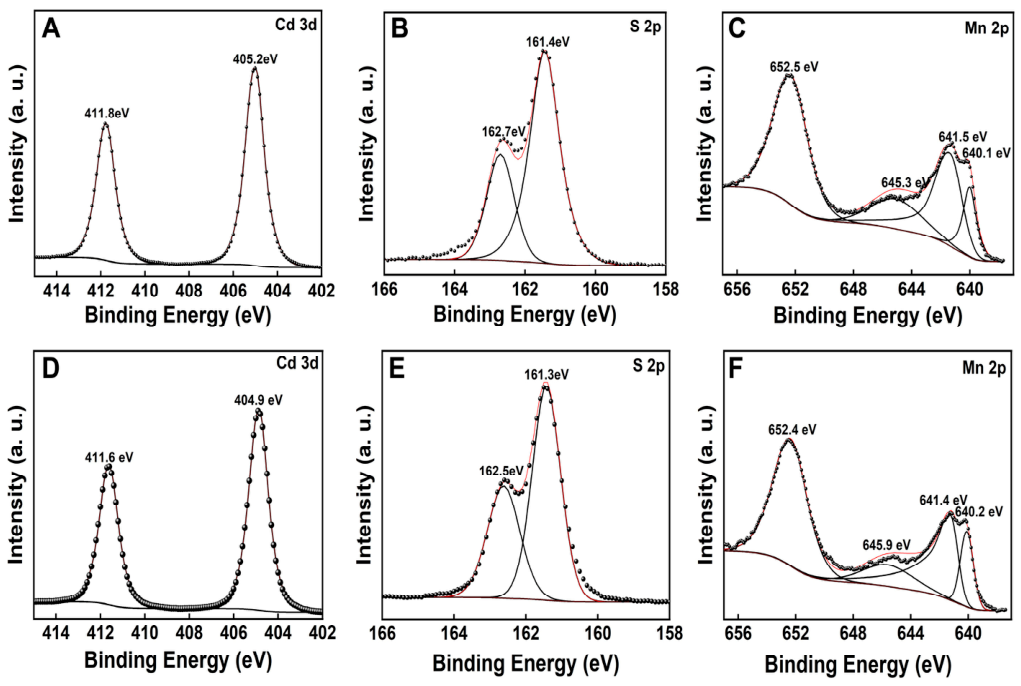
XPS survey spectra of F-MCS are provided in Figure S2 (SI). High-resolution Cd 3d, S 2p and Mn 2p spectra are shown in Figure 3 [30,31]. The Cd 3d peaks of F-MCS only shift by 0.1 eV relative to MCS, which falls within instrumental testing error and cannot be used as evidence of an altered Cd chemical environment, so the related overstated description is deleted. Deconvolution of Mn 2p spectra reveals that the Mn2+/Mn3+ ratio decreases from 3.2:1 (pristine MCS) to 2.7:1 (F-MCS), verifying partial Mn oxidation for charge compensation after F substitutes S2−.
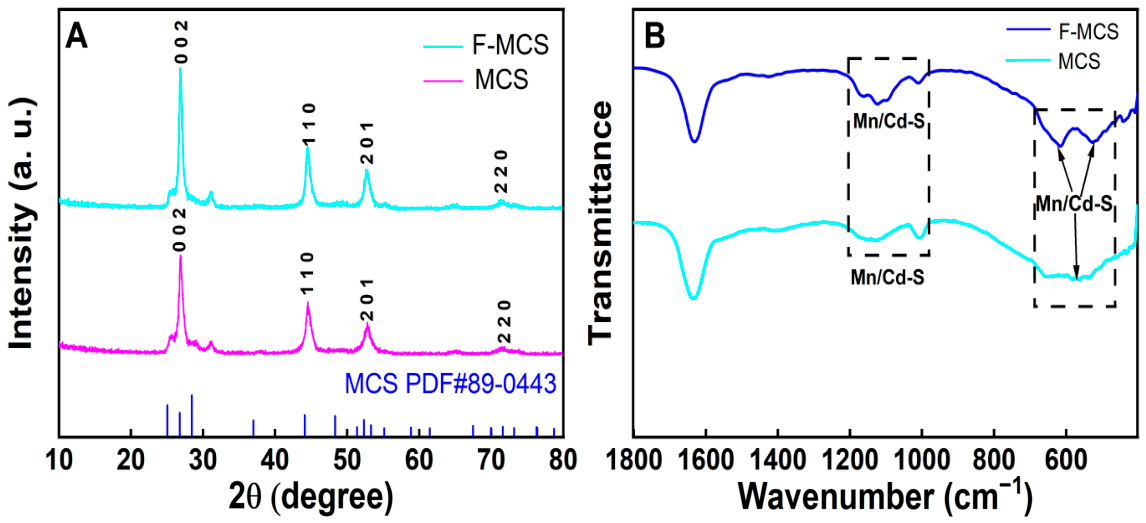
XRD patterns of MCS and F-MCS are displayed in Figure 4A [32,33]. All diffraction peaks match standard hexagonal wurtzite MnCdS without impurity signals. The cell refinement results show that the lattice parameters of F-MCS (a = 4.06 Å, c = 6.624 Å) are slightly smaller than those of pristine MCS (a = 4.068 Å, c = 6.638 Å), indicating lattice expansion after fluorine incorporation. The overall lattice contraction ratio is calculated to be 0.58%, which can be ascribed to the replacement of S2− ions with smaller F ions in the crystal lattice. Supplementary XRD patterns of Mn0.4Cd0.6S and Mn0.7Cd0.3S with/without fluoride are provided in Figures S5 and S6 (SI), which confirm that the lattice shrinkage degree positively correlates with Mn content due to stronger Mn-F coordination. FT-IR spectra (Figure 4B) show merged, shifted and new Mn/F metal–ligand vibration peaks for F-MCS, demonstrating fluoride-triggered surface structural reconstruction.
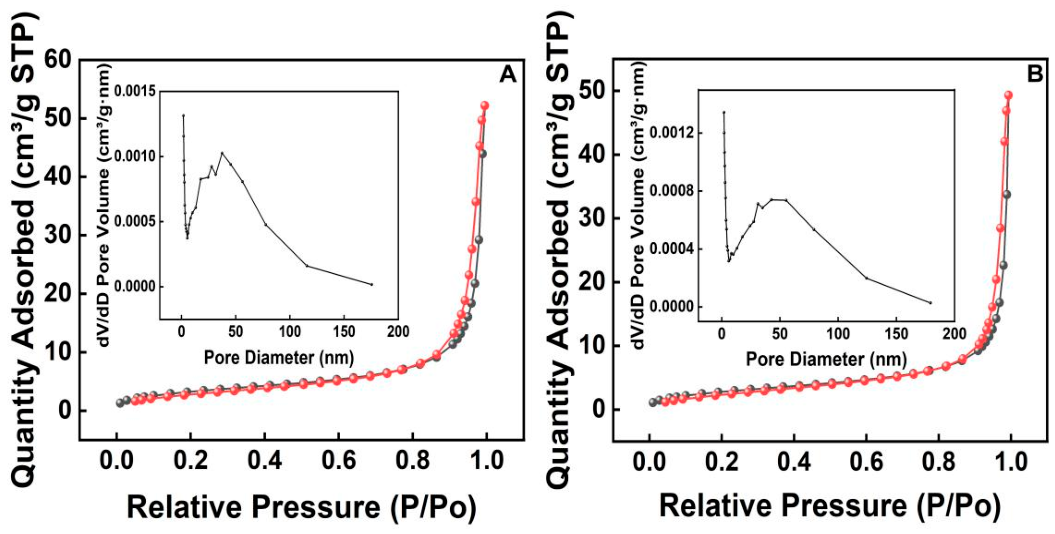
N2 adsorption–desorption isotherms (Figure 5A,B) belong to type IV mesoporous curves. The BET specific surface area of MCS is 12.4 m2 g−1, while that of F-MCS slightly reduces to 10.6 m2 g−1, which is not the dominant factor causing activity difference.
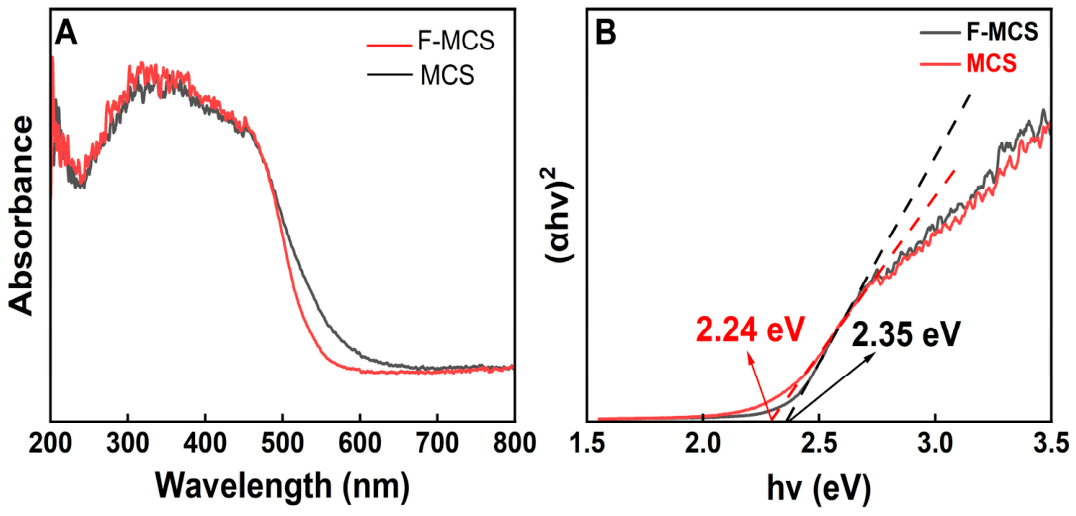
UV–Vis DRS and standardized Tauc plots are shown in Figure 6. Tangents are drawn strictly along the linear absorption edge segment instead of random points when recalculating band gaps. Eg (F-MCS) = 2.35 eV, indicating only mild band widening after fluorination rather than drastic electronic change. The absorption edge of F-MCS slightly blue-shifts from 553 nm (MCS) to 534 nm.
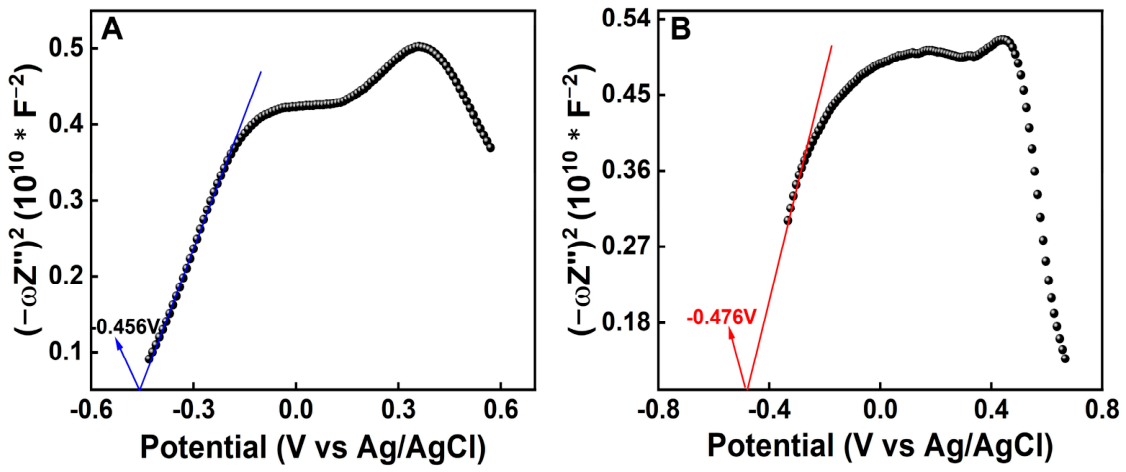
Mott–Schottky curves are re-fitted based on linear response zones (Figure 7). Both samples exhibit positive slopes, confirming n-type semiconductor character. The flat band potentials are as follows: MCS −0.476 V (vs NHE); F-MCS −0.456 V (vs. NHE). Conduction and valence band positions are recalculated accordingly, showing moderate positive shifts for F-MCS without losing the hydrogen evolution thermodynamic driving force.
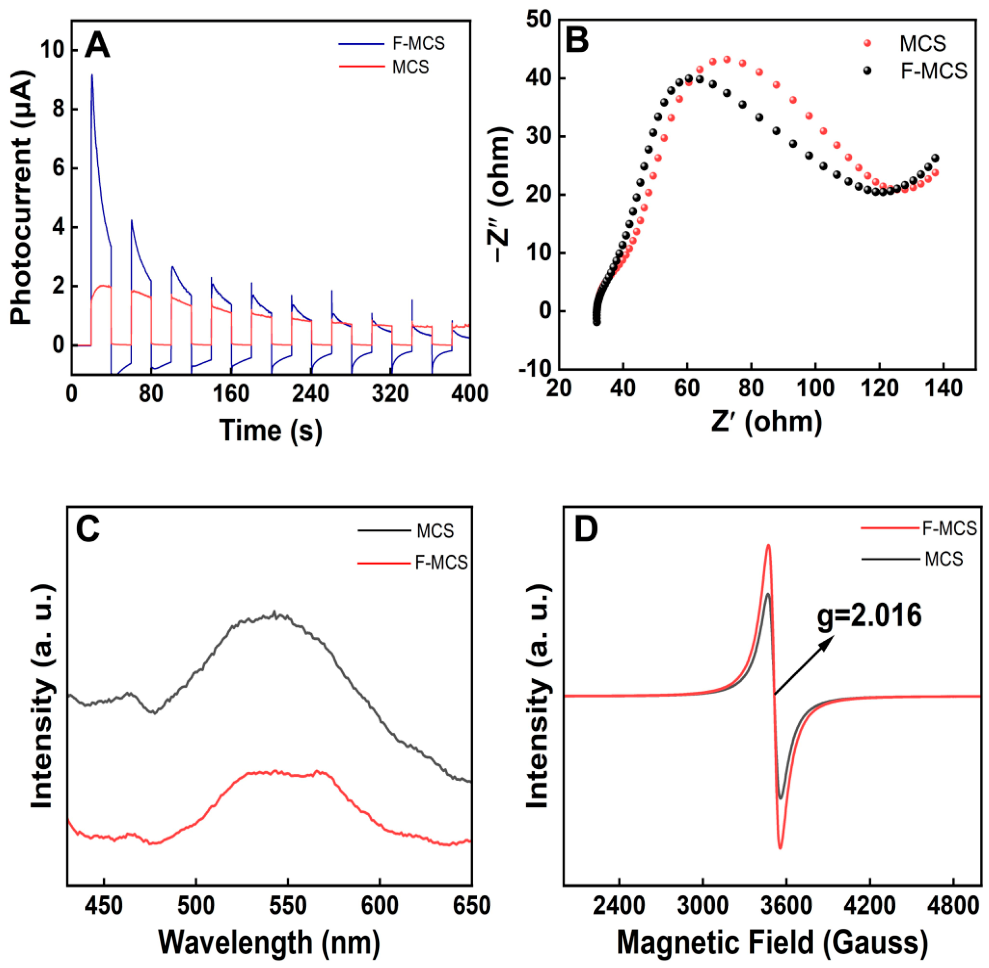
Transient photocurrent and EIS Nyquist plots (Figure 8A,B) show that F-MCS achieves a stronger photocurrent with equivalent charge transfer resistance, proving that fluoride mainly improves charge separation efficiency rather than interfacial electron mobility. The PL spectrum interpretation is revised: the broad emission band centered at ~540 nm contains two overlapping signals, including a sharp band-to-band peak (~530 nm) and a broad shoulder originating from sulfur vacancy defect recombination. The 65% PL intensity reduction in F-MCS simultaneously suppresses both recombination pathways. EPR [34,35] spectra (Figure 8D) display a characteristic g ≈ 2.016 signal for sulfur vacancies; F-MCS shows 110% higher peak intensity than MCS, providing direct quantitative proof of fluoride-induced vacancy generation. Combined XRD lattice contraction, XPS Mn valence change and EPR data form a complete evidence chain: F partial substitution → lattice strain + charge imbalance → Mn partial oxidation + abundant sulfur vacancies as electron-trapping centers.
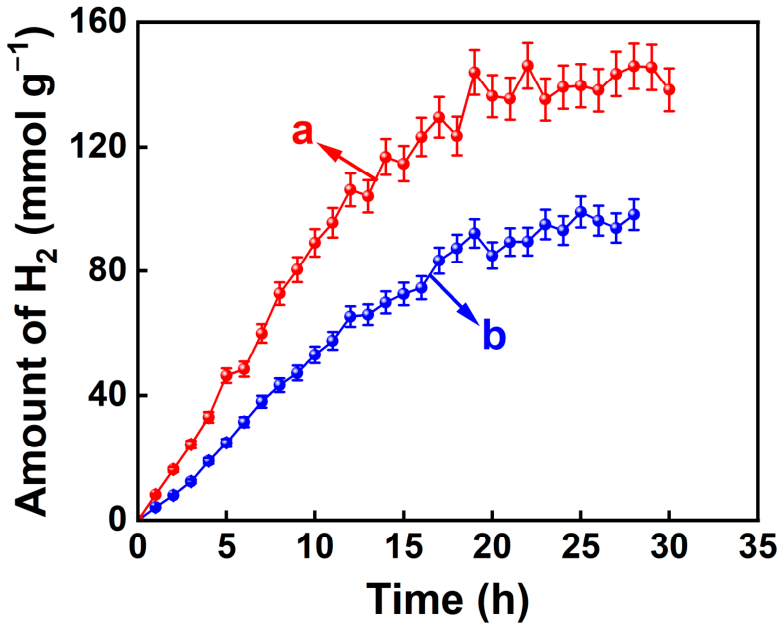
Photocatalytic hydrogen evolution kinetic curves of MCS and F-MCS are shown in Figure 9. Within 12 h of illumination, F-MCS delivers a maximum hydrogen evolution rate of 8.08 mmol·g−1·h−1, 1.5 times higher than pristine MCS. All single-factor optimization, sacrificial agent screening, catalyst dosage testing, and full MnxCd1−xS activity comparison data are condensed here, with cross-references to Figures S3, S4 and S8 in the Supporting Information instead of displaying main-body figures. Interestingly, when the initial NH4F precursor concentration was varied from 0.073 to 3.7 mol L−1 (Figure S3A), the H2 evolution rate exhibited a plateau rather than a linear increase. Although we currently have EDS analysis only for the sample prepared at 0.73 mol L−1 (approximately 1.2 at.% F, as a single-region semi-quantitative reference), based on the fundamental principles of ion substitution in solid solutions, we infer that this plateau phenomenon is most reasonably attributed to the limited solubility of F substituting S2− in the MnxCd1−xS lattice. Once the NH4F dosage exceeds a certain threshold (likely near or below 0.073 mol L−1), the lattice F incorporation approaches saturation, and further increasing the precursor concentration cannot significantly enhance the actual substitution ratio. Therefore, the density of fluoride-induced sulfur vacancies stabilizes, which reasonably explains the observed photocatalytic performance plateau. As shown in Figure S4, F-MCS exhibits negligible activity in organic sacrificial agents (methanol, lactic acid, <0.1 mmol·g−1·h−1), because its valence band potential cannot provide sufficient driving force for oxidizing organic alcohols, restricting its application to sulfide wastewater hydrogen production; future work will optimize band structure via heterojunction construction to expand biomass sacrificial agent compatibility. After six cycles (Figure S7, SI), F-MCS retains 82% initial activity versus 68% for MCS, attributed to strong Mn-F coordination inhibiting photocorrosion. Table S1 (SI) systematically compares our F-MCS with recently reported noble-metal-free MnxCd1−xS- and CdS-based photocatalysts to demonstrate its competitive performance under equivalent testing conditions.
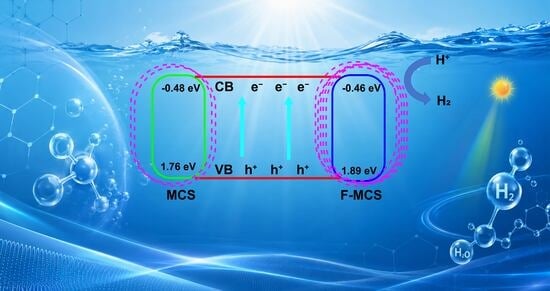
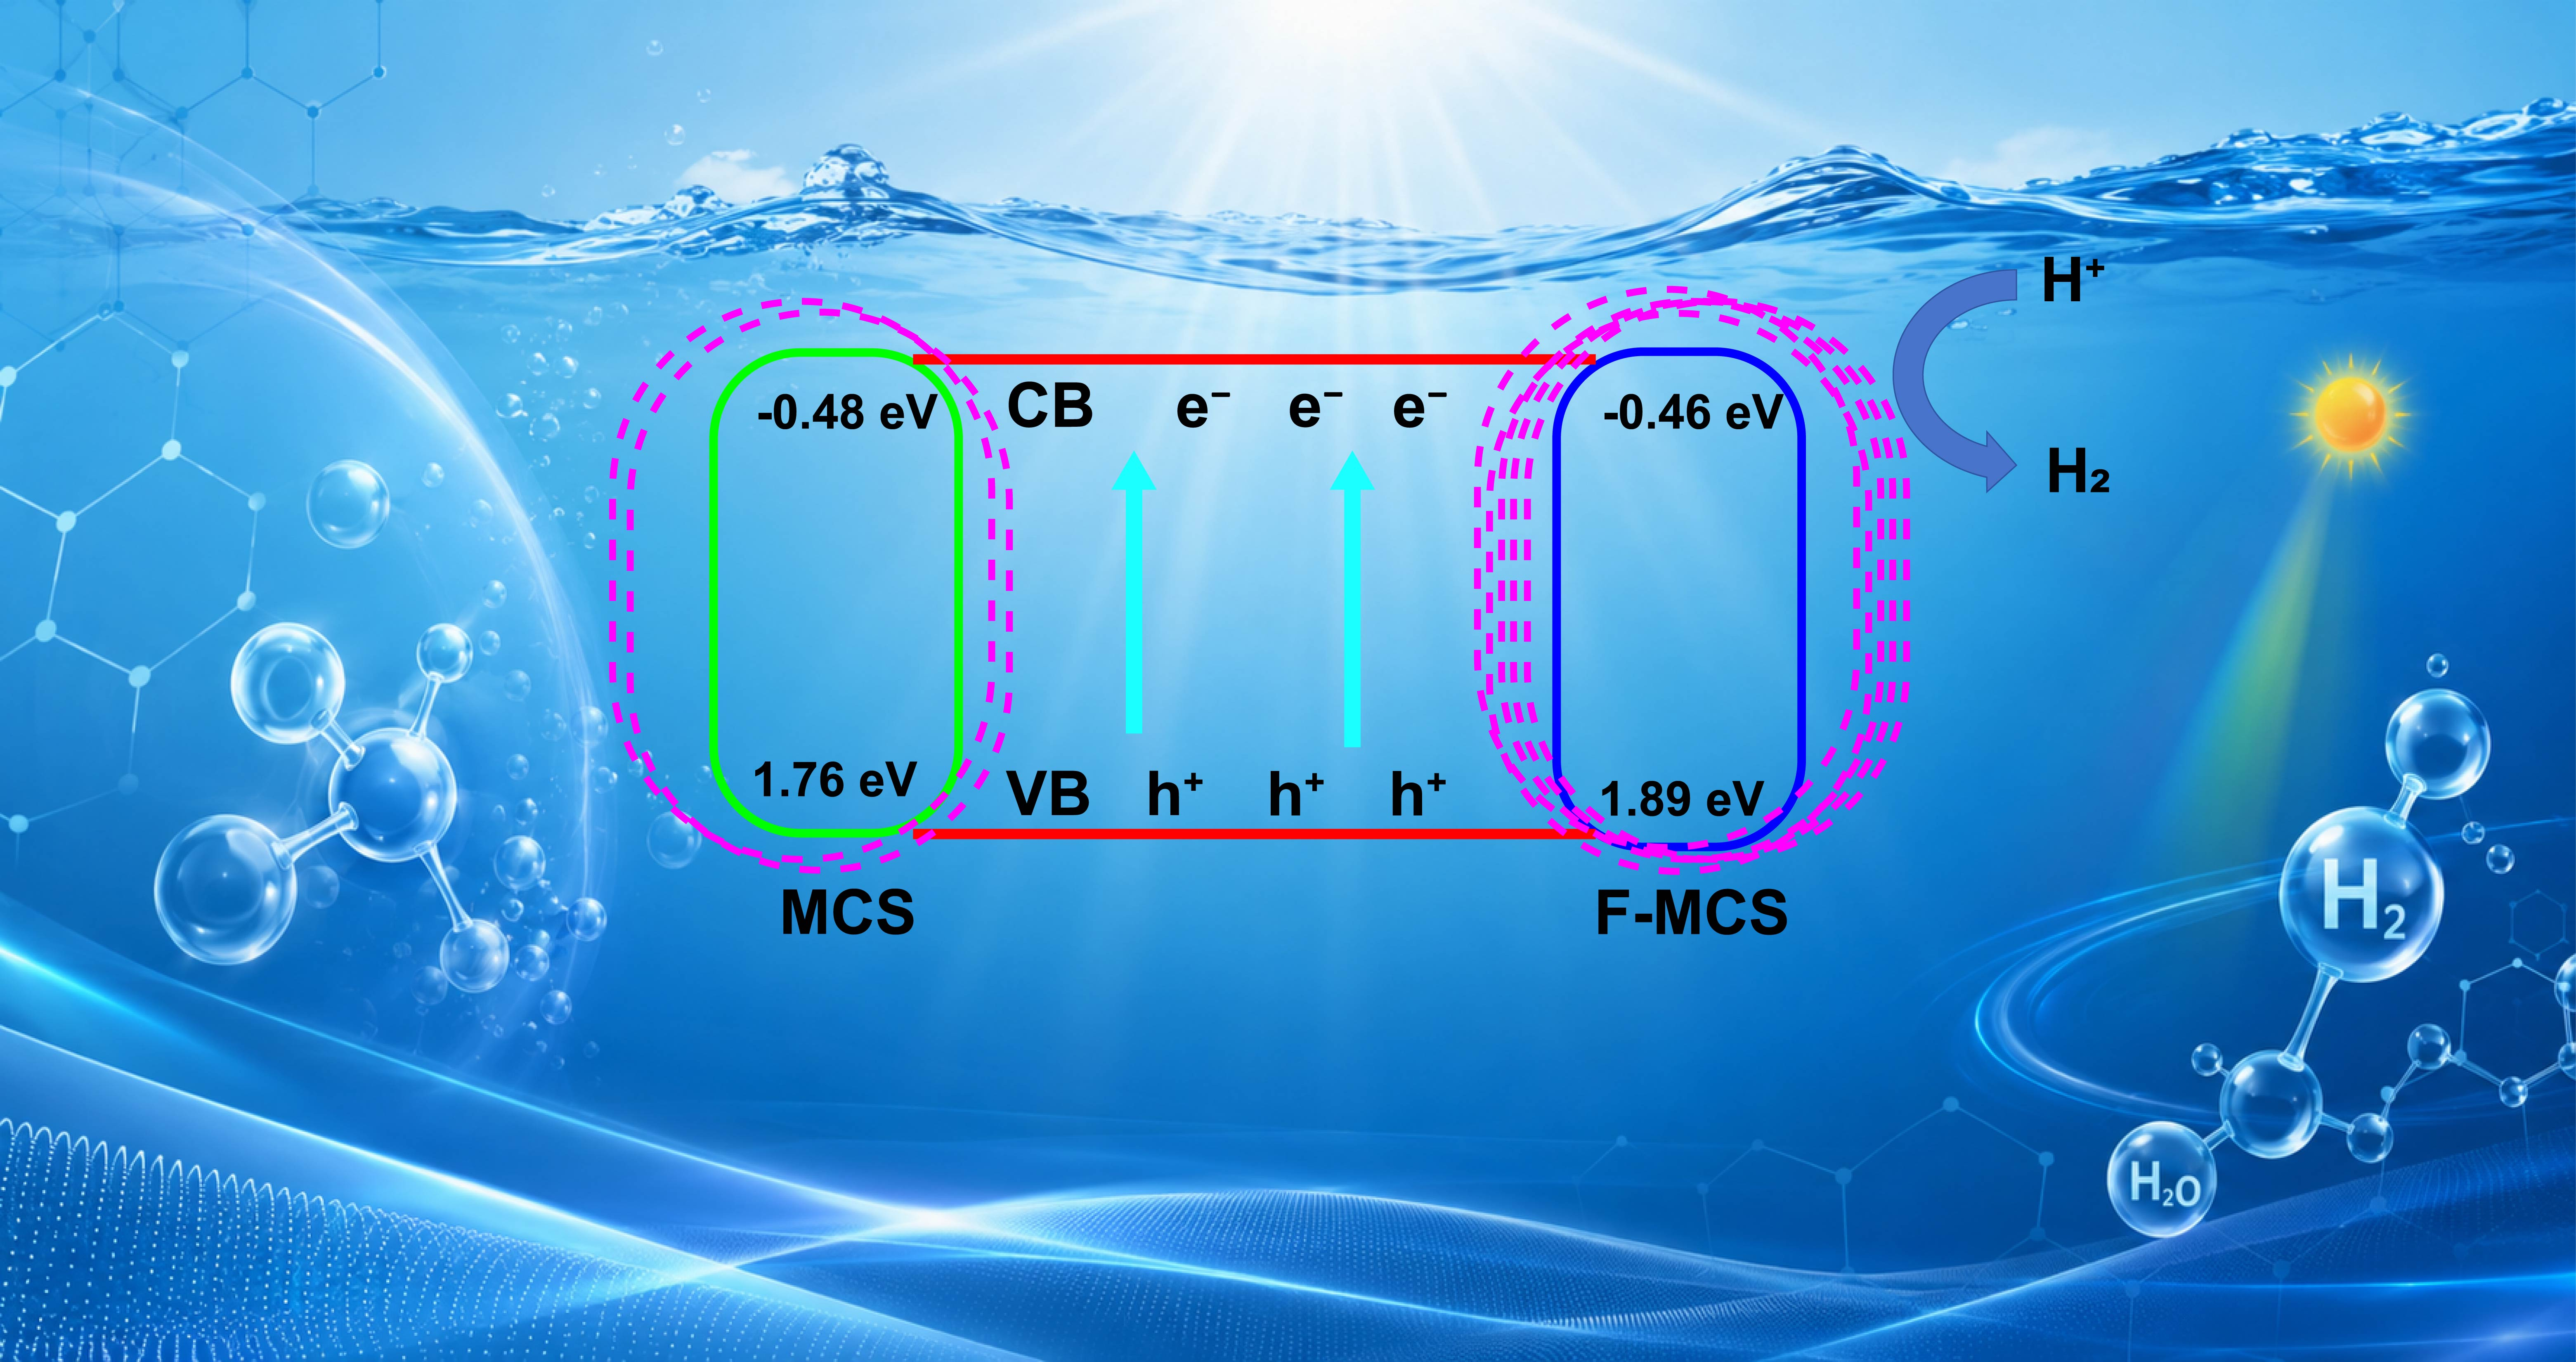
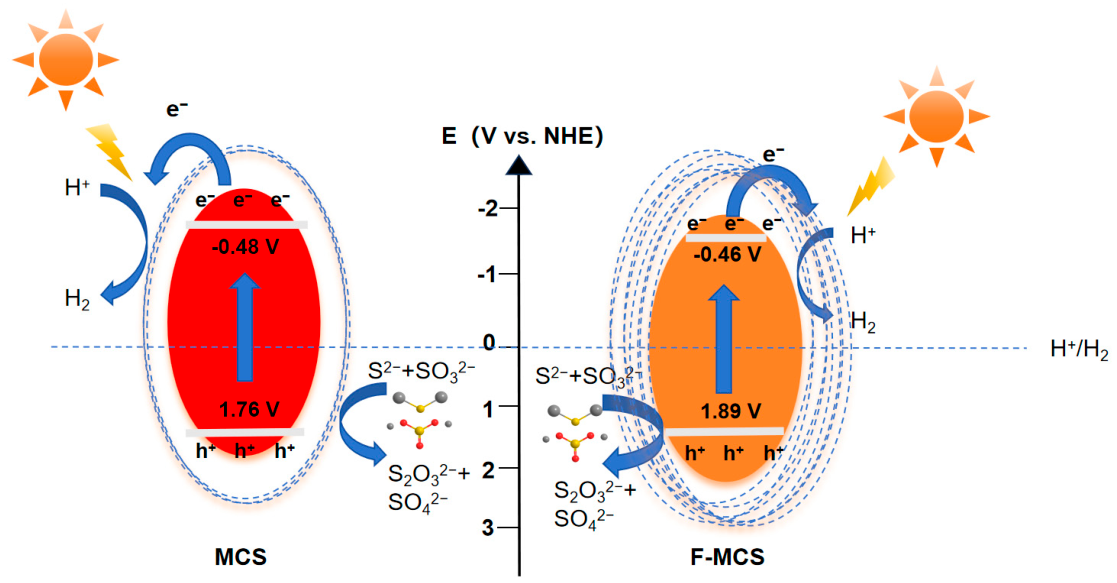
Based on all structural, defect and photoelectrochemical characterizations, a unified photocatalytic mechanism schematic is proposed (Figure 10). It is crucial to note that while both pristine MCS and F-MCS possess intrinsic sulfur vacancies (as evidenced by EPR and XPS S 2p analysis), fluoride modification dramatically increases their concentration rather than introducing fundamentally different defect types. Regarding the electronic band structure, F substitution does not create deep impurity levels within the forbidden band; instead, it induces a slight modulation of the valence band edge via F 1s-S 2p orbital hybridization, which accounts for the moderate positive shift in the valence band maximum (VBM). The abundant sulfur vacancies serve as shallow electron-accepting centers just below the CBM, which significantly boost the spatial separation and trapping of photogenerated electrons, thereby suppressing bulk recombination.

3. Experiments

3.1. Materials

All reagents used in this study were of analytical grade (A.R.) and employed as received without additional purification. These reagents include manganese acetate (Mn(CH3COO)2·4H2O, A.R., Shanghai Titan Scientific Co., Ltd., Shanghai, China), cadmium acetate (Cd(CH3COO)2·2H2O, A.R., Shanghai Titan Scientific Co., Ltd.), thioacetamide (A.R., Shanghai Titan Scientific Co., Ltd.), ammonium fluoride (A.R., Shanghai Titan Scientific Co., Ltd.), ethanol (A.R., Shanghai Titan Scientific Co., Ltd.), sodium sulfide (A.R., Shanghai Titan Scientific Co., Ltd.), and sodium sulfite (A.R., Shanghai Titan Scientific Co., Ltd.). Deionized water was prepared in-house using a laboratory purification system (Shanghai Institute of Technology, Shanghai, China) and used throughout the experiments.

3.2. Integrated Synthesis of Pristine MCS and F-MCS Nanoflakes

The two separate synthesis schematics for pure MCS and F-MCS are merged into a unified Scheme 1 to eliminate repetitive drawing, with the only difference marked as the addition of ammonium fluoride solution before hydrothermal treatment. Manganese acetate tetrahydrate, cadmium acetate dihydrate and thioacetamide were sequentially dissolved in deionized water with 10 min stirring intervals for pure Mn0.6Cd0.4S. For F-MCS, a pre-sonicated 0.73 mol L−1 NH4F (we first put 0.0407 g of ammonium fluoride into 1.5 mL of deionized water; after 10 min of ultrasonic treatment, an ammonium fluoride solution with a concentration of 0.73 mol L−1 was prepared) aqueous solution was added to the mixed precursor suspension. All precursor suspensions were transferred into PTFE-lined autoclaves and heated at 180 °C for 12 h, followed by natural cooling, centrifugation, repeated washing with water and ethanol, and vacuum drying at 60 °C for 12 h. Parallel MnxCd1−xS and F-MnxCd1−xS samples with Mn molar fractions ranging from 0.1 to 0.9 were prepared by adjusting Mn/Cd salt ratios under identical hydrothermal parameters.

3.3. Material Characterizations

XRD patterns of all representative samples (Mn0.4Cd0.6S, Mn0.6Cd0.4S, Mn0.7Cd0.3S and their fluoride-modified counterparts) were collected and processed. The lattice parameters of the samples were calculated via cell refinement of the XRD patterns using MDI JADE software (MDI JADE6), based on the indexed diffraction peaks of the hexagonal phase (space group P63mc). SEM coupled with EDS elemental mapping and quantitative atomic percentage testing was adopted to measure the actual bulk fluorine content of F-MCS, distinguishing solid-phase fluorine loading from initial precursor concentration. UV–Vis DRS and Mott–Schottky data were reprocessed by drawing tangents strictly along the linear segment of absorption/response curves rather than arbitrary single points to acquire accurate band gap and flat band potentials. EPR spectroscopy was used to quantitatively compare sulfur vacancy signal intensity between MCS and F-MCS. PL spectra were re-analyzed to separate contributions from band-to-band transition and sulfur-vacancy-mediated defect recombination.
EDS elemental analysis was performed via point scanning on a representative region of the F-MCS sample. The accelerating voltage was set to 15 kV to ensure adequate excitation of F Kα. Given the semi-quantitative nature of EDS for light elements and the limitation of single-region analysis, this result is presented only as an auxiliary reference for the presence of fluorine, rather than as a precise quantitative basis.

3.4. Photocatalytic Hydrogen Evolution Measurement

Photocatalytic tests were carried out in a sealed quartz reactor with a constant-temperature circulating cooling bath maintained at 10 °C to eliminate thermal interference from the high-power Xe light source. The incident light intensity calibrated at the liquid surface was 460 mW·cm−2; the complete structure of the photoreactor is shown in Figure S1 (Supporting Information). A 300 W Xe lamp with a λ > 400 nm cutoff filter served as the simulated sunlight source. Before irradiation, N2 purging lasted for 30 min to remove dissolved oxygen. Hydrogen yield was detected by gas chromatography with a TCD detector. All single-factor optimization experiments (NH4F concentration, pH, hydrothermal time/temperature, catalyst dosage, sacrificial agent type/concentration), cyclic stability curves, and full-series MnxCd1−xS activity comparison plots were moved to the Supporting Information (Figures S3, S4, S7 and S8) to streamline main text content. All photocatalytic experiments were performed in triplicate under identical conditions. The data are presented as mean values, and the error bars in the corresponding figures represent the standard deviation (SD) calculated from three independent measurements.

4. Conclusions

A universal fluoride-mediated sulfur vacancy engineering strategy is developed for the full MnxCd1−xS solid solution series (x = 0.1–0.9), with Mn0.6Cd0.4S selected as the optimal representative photocatalyst. Quantitative EDS characterization confirms that 1.2 at.% fluorine is incorporated into the MCS lattice via aliovalent S2− substitution rather than physical precursor adsorption. XRD refinement verifies 0.58% mild lattice contraction after fluorination, originating from smaller F ions. Charge imbalance from F/S2− exchange triggers partial Mn2+ oxidation and in situ generation of sulfur vacancies, which is quantitatively validated by 110% enhanced EPR vacancy signals and suppressed defect PL emission. Tauc and Mott–Schottky tests prove that fluoride only causes moderate band gap widening and slight positive band shifts, without severe distortion of the electronic structure. The optimized F-MCS delivers a peak hydrogen evolution rate of 8.08 mmol·g−1·h−1, and retains 82% activity after six cycles. Systematic full-series activity screening confirms that fluoride modification effectively boosts hydrogen production for Mn fractions between 0.2 and 0.7, while excessive vacancies at high Mn ratios turn into recombination centers and degrade performance. This work provides a facile one-step anion defect engineering route for sulfide photocatalysts and deepens our atomic-level understanding of fluoride–lattice interaction mechanisms.

Supplementary Materials

The following supporting information can be downloaded at: https://www.mdpi.com/article/10.3390/catal16080702/s1, Figure S1: Schematic diagram of the self-made photocatalytic reactor; Figure S2: XPS survey spectra of F-MCS; Figure S3: Effects of (A) initial NH4F precursor concentrations, (B) solution pH, (C) hydrothermal synthesis time and (D) hydrothermal synthesis temperature on the photocatalytic hydrogen evolution performance of F-MCS. Reaction conditions: photocatalyst of 10 mg, 50 mL of 0.3 mol L−1 Na2S + Na2SO3 aqueous solution, T = 10 °C, pH = 12, light intensity of 460 mW cm−2 with the irradiation time of 4 h Bar chart values are representative data; trends have been verified by repeated experiments (Unless otherwise specified in the figure, 0.73 mol L−1 NH4F was used for synthesis); Figure S4: Effects of (A) different sacrificial agents, (B) mass of photocatalyst, (C) concentration of sacrificial agent on the photocatalytic hydrogen evolution performance of F-MCS. Reaction conditions: photocatalyst of 10 mg, T = 10 °C, light intensity of 460 mW cm−2 with the irradiation time of 4 h. Bar chart values are representative data; trends have been verified by repeated experiments (Unless otherwise specified in the figure, 0.73 mol L−1 NH4F was used for synthesis); Figure S5: XRD patterns of Mn0.4Cd0.6S and F-Mn0.4Cd0.6S; Figure S6: XRD patterns of Mn0.7Cd0.3S and F-Mn0.7Cd0.3S; Figure S7: (a) Durability of F-MCS in photocatalytic hydrogen evolution reaction and (b) Durability of MCS nanoparticles in photocatalytic hydrogen evolution reaction. Reaction conditions: photocatalyst 10 mg, 50 mL of Na2S + Na2SO3 aqueous solution with a molar concentration of 0.3 mol L−1, temperature 10 °C, pH = 12, The light intensity is 460 mW cm−2. Bar chart values are representative data; trends have been verified by repeated experiments (Unless otherwise specified in the figure, 0.73 mol L−1 NH4F was used for synthesis); Figure S8: Hydrogen evolution rates of MnxCd1−xS and F-MnxCd1−xS (a) Mn0.1Cd0.9S and F-Mn0.1Cd0.9S, (b) Mn0.2Cd0.8S and F-Mn0.2Cd0.8S, (c) Mn0.3Cd0.7S and F-Mn0.3Cd0.7S, (d) Mn0.4Cd0.6S and F-Mn0.4Cd0.6S, (e) Mn0.5Cd0.5S and F-Mn0.5Cd0.5S, (f) Mn0.6Cd0.4S and F-Mn0.6Cd0.4S, (g) Mn0.7Cd0.3S and F-Mn0.7Cd0.3S, (h) Mn0.8Cd0.2S and F-Mn0.8Cd0.2S, (i) Mn0.9Cd0.1S and F-Mn0.9Cd0.1S. Reaction conditions:photocatalyst 10 mg, 50 mL of Na2S + Na2SO3 aqueous solution with a molar concentration of mol L−1, temperature 10 °C, pH = 12, The light intensity is 460 mW cm−2; The irradiation time is 4 h. Bar chart values are representative data; trends have been verified by repeated experiments (Unless otherwise specified in the figure, 0.73 mol L−1 NH4F was used for synthesis); Figure S9: Cell refinement reports of XRD data for pristine MCS (left) and F-MCS (right). The refined lattice parameters of the hexagonal crystal system (space group P63mc) and the indexed XRD profiles with corresponding Bragg peak positions are presented for each sample. Table S1: Comparison of photocatalytic hydrogen evolution performance of F-MCS with reported CdS-based and MnxCd1−xS-based photocatalysts.

Author Contributions

Z.Y.—conceptualization, methodology, validation, investigation, and writing—original draft preparation; Z.F.—writing—review and editing, methodology, and resources; Z.S.—project administration, funding acquisition, investigation, and supervision. All authors have read and agreed to the published version of the manuscript.

Funding

This research received no external funding.

Data Availability Statement

The data supporting the findings of this study are available within the article and the Supplementary Materials. Additional raw data are available from the corresponding author upon reasonable request.

Conflicts of Interest

Author Zichao Fan was employed by the Yajiang Clean Energy Science and Technology Research (Beijing), Co., Ltd. The remaining authors declare that the research was conducted in the absence of any commercial or financial relationships that could be construed as a potential conflict of interest.

References

  1. Zhang, J.; Hu, Z.; Zheng, J.; Xiao, Y.; Song, J.; Li, X.; Cheng, C.; Zhang, Z. Photothermal-assisted solar hydrogen production: A review. Energy Convers. Manag. 2024, 318, 118901. [Google Scholar] [CrossRef] [Scilit]
  2. Vasseghian, Y.; Joo, S.W.; Choo, J.; Badawi, M.; Aminabhavi, T.M. Photocatalytic materials for solar-driven hydrogen generation. Curr. Opin. Chem. Eng. 2024, 46, 101055. [Google Scholar] [CrossRef] [Scilit]
  3. Li, R.; Luan, J.; Zhang, Y.; Jiang, L.; Yan, H.; Chi, Q.; Yan, Z. A review of efficient photocatalytic water splitting for hydrogen production. Renew. Sustain. Energy Rev. 2024, 206, 114863. [Google Scholar] [CrossRef] [Scilit]
  4. Cai, M.; Huang, S.; You, Y.; Jiang, H.; Qiu, J.; Zhang, W.; Xu, Q.; Shen, S.; Hu, W.; Deng, S.; et al. Colloidal quantum dots: Surface and interface engineering for light-driven hydrogen production. RSC Adv. 2025, 15, 13812–13824. [Google Scholar] [CrossRef] [Scilit] [PubMed]
  5. Zhang, C.; Cao, D.; Cao, J.; Song, Y.; Zheng, Y.; Luo, L.; Liu, J.; Yuan, Y. Fine-Tune the Structural Components of Porous Frameworks for Photocatalytic Hydrogen Production. Chemistry 2025, 31, e202403733. [Google Scholar] [CrossRef] [Scilit] [PubMed]
  6. Bi, J.; Li, C.; Huang, X.; Ren, J.; Zhang, P.; Wang, T.; Zhao, Y.; Hao, H. One-dimensional nanotube architectures for photocatalytic hydrogen generation. Appl. Phys. Rev. 2025, 12, 031313. [Google Scholar] [CrossRef] [Scilit]
  7. Chen, L.; Zhao, J.; Li, J.; Zhuang, Y.; Guo, D.; Meng, S.; Zhang, D.; Yang, X.; Sui, G. Cu/Zn-bimetallic organic framework-derived RGO/CuO–ZnO Z-scheme heterojunction for efficient photocatalytic hydrogen production. Int. J. Hydrogen Energy 2025, 103, 45–52. [Google Scholar] [CrossRef] [Scilit]
  8. Abulimiti, A.; Yan, P.; Niu, M.; Abdukayum, A. PLNPs/SCN heterojunction composites with a green afterglow for photocatalytic hydrogen production. New J. Chem. 2024, 48, 10304–10313. [Google Scholar] [CrossRef] [Scilit]
  9. Qian, A.; Han, X.; Liu, Q.; Fan, M.; Ye, L.; Pu, X.; Chen, Y.; Liu, J.; Sun, H.; Zhao, J.; et al. Photocatalytic Hydrogen Production from Pure Water Using a IEF-11/g-C3N4 S-Scheme Heterojunction. ChemSusChem 2024, 17, e202301538. [Google Scholar] [CrossRef] [Scilit] [PubMed]
  10. Shen, P.; Li, N.; Nasser, A.M.; Zhu, B.; Xi, X.; She, L.; Liu, Y.; Ma, J. Construction of a Bi2S3/Bi0.5Na0.5TiO3 Composite Catalyst with S Vacancies for Efficient Piezo-Photocatalytic Hydrogen Production. Langmuir 2024, 40, 20228–20239. [Google Scholar] [CrossRef] [Scilit] [PubMed]
  11. Wang, X.; An, C.; Zhang, S.; Wang, S.; Li, J.; Zhu, Y. Metal-free heterostructured 2D/1D polymeric carbon nitride/fibrous phosphorus for boosted photocatalytic hydrogen production from pure water. Sep. Purif. Technol. 2024, 340, 126733. [Google Scholar] [CrossRef] [Scilit]
  12. Zeng, D.; Shen, T.; Hu, Y.; Zhang, Z.; Liu, Z.; Xu, N.; Song, J.; Guan, R.; Zhou, C. Nitrogen-doped ZnIn2S4 and TPA multi-dimensional synergistically enhance photocatalytic hydrogen production. Fuel 2025, 380, 133151. [Google Scholar] [CrossRef] [Scilit]
  13. Han, R.; Wang, K.; Jiang, Q.; Zhang, G.; Lu, Q.; Guo, E. 0D/1D CuWO4/Mn0.3Cd0.7S S-scheme heterojunctions for full-spectrum bifunctional photocatalytic degradation and hydrogen production. J. Colloid Interface Sci. 2024, 671, 680–691. [Google Scholar] [CrossRef] [Scilit] [PubMed]
  14. Li, Y.; Zhang, S.; He, C.; Yao, H.; Guo, C.; Wang, W.; Hu, Y. Modulation of Schottky Barrier Height and Electronic Structure in Transition-Metal@Nitrogen-Doped-Carbon Core–Shell Cocatalysts Loaded with MnxCd1–xS Nanorods for Enhanced Photocatalytic Hydrogen evolution. ACS Catal. 2025, 15, 2315–2327. [Google Scholar] [CrossRef] [Scilit]
  15. Yin, L.; Wang, Q.; Zhang, J.; Wu, G.; Lee, J.; Sun, P.; Mo, Z.; Chen, H.; Zhu, X.; Xu, H. Electron relay between S-Scheme heterojunction and variable-valence metals promotes photocatalytic hydrogen production over CeO2@MnxCd1−xS. Chem. Eng. J. 2025, 526, 170911. [Google Scholar] [CrossRef] [Scilit]
  16. He, Y.; Lin, Y.; Guo, Q.; Hao, X.; Jin, Z. Engineering sulfur vacancies and photothermal effects in a CoAl2O4/MnCdS S-scheme heterojunction for broad-spectrum photocatalytic hydrogen production. J. Mater. Chem. A 2025, 13, 37491–37507. [Google Scholar] [CrossRef] [Scilit]
  17. Ma, X.; Su, M.; Jin, Z. MnCdS Cluster Particles Composited with NiTiO3 Nanoparticles for Efficient Photocatalytic Hydrogen Production. ACS Appl. Energy Mater. 2025, 8, 7483–7496. [Google Scholar] [CrossRef] [Scilit]
  18. Sun, Y.; Li, Y.; He, J.; Chen, L.; Ji, H.; Qin, Z.; Su, T. Controlled synthesis of Mn Cd1–S for enhanced visible-light driven photocatalytic hydrogen evolution. Chin. J. Struct. Chem. 2023, 42, 100145. [Google Scholar] [CrossRef] [Scilit]
  19. Wang, H.; Zhao, B.; Liu, X.; Yan, L.; Guo, H.; Gong, W.; Lin, J. Noble metal-free 0D-1D CoOx/Mn0.3Cd0.7S nanocomposites for efficient visible-light hydrogen production. Int. J. Hydrogen Energy 2024, 54, 1199–1211. [Google Scholar] [CrossRef] [Scilit]
  20. Hu, Y.; Deng, P.; Wang, W.; Zhang, L.; Hou, Y. Double Type-II Heterojunction MnS/Mn–Cd–S/Ni-Polyoxometalate for Improving Visible-Light-Driven H2 Production. ACS Appl. Energy Mater. 2023, 6, 11135–11145. [Google Scholar] [CrossRef] [Scilit]
  21. Zhang, J.; Sun, P.; Mo, Z.; Zhu, X.; Shouquat Hossain, M.D.; Wu, G.; Miao, Z.; Yan, P.; Chen, Z.; Xu, H. Adjacent Mn site boosts photocatalytic hydrogen evolution of MnxCd1-xS solid solution through a dual-metal-site design. J. Colloid Interface Sci. 2023, 652, 470–479. [Google Scholar] [CrossRef] [Scilit] [PubMed]
  22. Liu, Q.; Shi, L. Recent Advances in MnxCd1−xS Solid-Solution-Based Photocatalysts for Preparation Modification and Application. Chem. Asian J. 2025, 20, e00451. [Google Scholar] [CrossRef] [Scilit] [PubMed]
  23. Feng, H.; Li, Y.; Han, Y.; Gu, Y.; Li, Z. Piezoelectric polarization field tuning Schottky barrier of Ni/Mn0.2Cd0.8S composite for hot electrons transfer to enhance photocatalytic hydrogen evolution. Appl. Catal. B 2024, 348, 123809. [Google Scholar] [CrossRef] [Scilit]
  24. Zhang, C.; Pan, D.; Zhang, Y.; Lin, L.; Wang, Y.; Zhou, M.; Li, Z.; Xu, S. Reasonably design of hollow spherical g-C3N4/Mn0.25Cd0.75S heterojunction for efficient photocatalytic hydrogen production and tetracycline degradation. J. Environ. Chem. Eng. 2024, 12, 111956. [Google Scholar] [CrossRef] [Scilit]
  25. Zhao, Y.; Sun, Y.; Chen, L.; Yang, X.; Yang, P.; Xie, X.; Qin, Z.; Ji, H.; Su, T. Boosting Photocatalytic Hydrogen Production over Mn0.4Cd0.6S/CuS p–n Heterojunction under Visible Light Irradiation. Energy Technol. 2025, 13, 2401858. [Google Scholar] [CrossRef] [Scilit]
  26. Dehnen, S.; Schafer, L.L.; Lectka, T.; Togni, A. Fluorine: A very special element and its very special impacts on chemistry. J. Org. Chem. 2021, 86, 16213–16219. [Google Scholar] [CrossRef] [Scilit] [PubMed]
  27. Pedersen, K.S.; Sørensen, M.A.; Bendix, J. Fluoride-coordination chemistry in molecular and low-dimensional magnetism. Coord. Chem. Rev. 2015, 299, 1–21. [Google Scholar] [CrossRef] [Scilit]
  28. Wang, X.; Hu, H.; Zhang, T.; Xuan, H.; Deng, C. Engineering novel MnxCd1−xS self-assembled p-n junction modified with NiS for enhanced photocatalytic hydrogen evolution. Mater. Res. Bull. 2025, 184, 113230. [Google Scholar] [CrossRef] [Scilit]
  29. Wang, C.; Guo, T.; Hu, G.; Liu, J.; Zhu, Y.; Guo, Q. Efficient hydrogen production performance of 1T-2H MoSe2/MnxCd1−xS Z-type heterojunction photocatalysts under visible light. J. Mater. Res. Technol. 2024, 32, 2433–2442. [Google Scholar] [CrossRef] [Scilit]
  30. Li, Y.; Li, W.; Ma, X.; Geng, L.; Dong, M.; Li, Y.; Fan, Y.; Yang, L. A novel noble-metal-free FeS2/Mn0.5Cd0.5S heterojunction for enhancing photocatalytic H2 production activity: Carrier separation light absorption active sites. J. Taiwan Inst. Chem. Eng. 2024, 162, 105572. [Google Scholar] [CrossRef] [Scilit]
  31. Niu, X.; Yang, G.; Kong, L.; Dou, M.; Dou, J. In situ construction of the W18O49/Mn0.45Cd0.55S S-scheme heterojunction for enhanced photocatalytic hydrogen generation. Mater. Sci. Semicond. Process. 2024, 178, 108447. [Google Scholar] [CrossRef] [Scilit]
  32. Xu, F.; Weng, B. Photocatalytic hydrogen production: An overview of new advances in structural tuning strategies. J. Mater. Chem. A 2023, 11, 4473–4786. [Google Scholar] [CrossRef] [Scilit]
  33. Wang, L.; Ma, T.; Li, H.; Zhang, Y.; Wang, Y.; Li, Z.; Xu, S. Mn0.5Cd0.5S@NiO composite for boosting visible-light-driven photocatalytic hydrogen evolution. Inorg. Chem. Commun. 2024, 160, 112000. [Google Scholar] [CrossRef] [Scilit]
  34. Li, S.; Zhang, J.; Li, Y.; Peng, Y.; Wu, H.; Deng, P.; Zhang, L.; Hou, Y. Facile construction of a Bi2WO6/Mn0.2Cd0.8S S-scheme heterojunction for enhancing the photocatalytic tetracycline degradation performance and mechanism study. J. Alloys Compd. 2025, 1026, 180391. [Google Scholar] [CrossRef] [Scilit]
  35. Wu, Y.N.; Wang, J.Z.; Zhang, J.Y.; Li, Y.K.; Huang, Q.Z. Mn0.2Cd0.8S polyhedra modified with Ni(HCO3)2 nanoflakes for enhanced visible light-driven photocatalytic H2 evolution. Int. J. Hydrogen Energy 2024, 51, 1356–1366. [Google Scholar] [CrossRef] [Scilit]
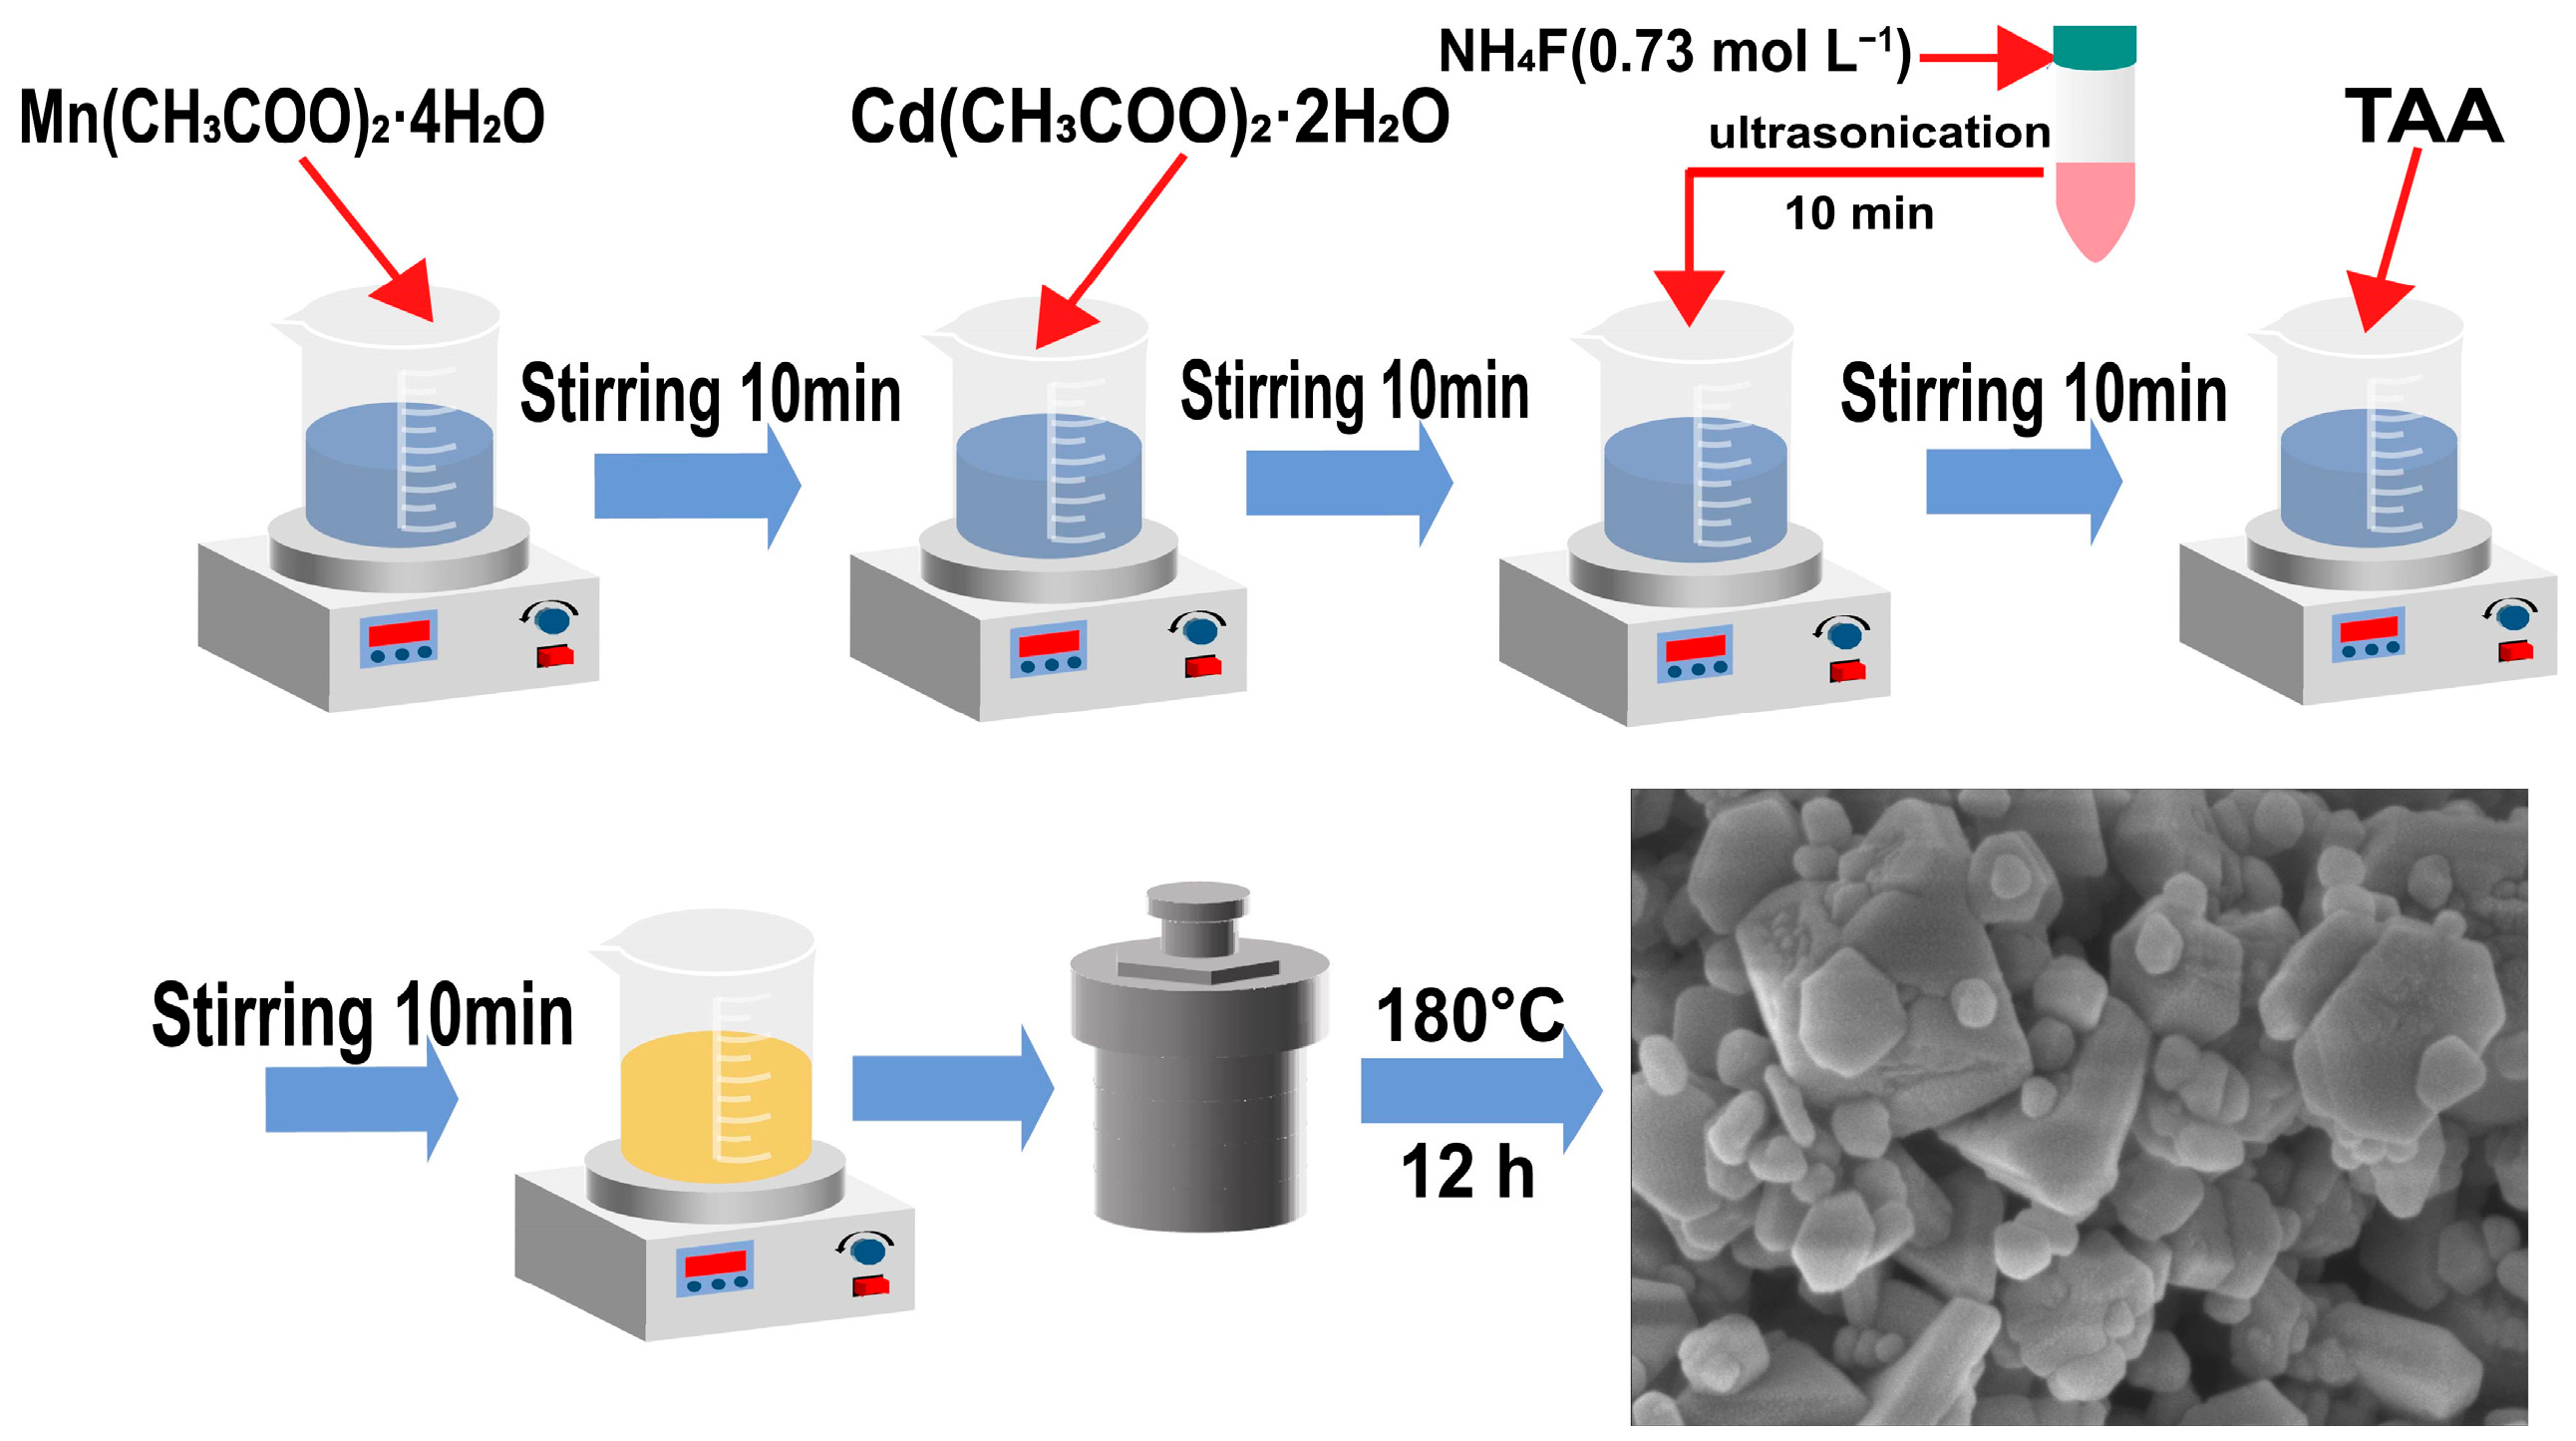
Scheme 1. Unified synthetic schematic diagram of pristine Mn0.6Cd0.4S and fluoride-modified sulfur-vacancy-rich F-MCS nanoflakes.
Catalysts 16 00702 sch001
Figure 1. (A) SEM image of F-MCS. (B) Corresponding particle size distribution histogram.
Catalysts 16 00702 g001
Figure 2. (A,B) HRTEM images of F-MCS; (C) TEM morphology of F-MCS; (D) EDS elemental mapping of Mn, Cd, S, and F for F-MCS.
Catalysts 16 00702 g002
Figure 3. XPS high-resolution spectra: (AC) MCS (Cd 3d, S 2p, Mn 2p); (DF) F-MCS (Cd 3d, S 2p, Mn 2p).
Catalysts 16 00702 g003
Figure 4. (A) XRD patterns with refined lattice parameters of MCS and F-MCS; (B) FT-IR spectra of MCS and F-MCS.
Catalysts 16 00702 g004
Figure 5. N2 adsorption–desorption isotherms of (A) MCS and (B) F-MCS. The inset shows the pore size distribution curves of MCS and F-MCS (The red curve is the desorption branch, and the black curve is the adsorption branch).
Catalysts 16 00702 g005
Figure 6. (A) UV–Vis DRS and (B) Tauc plots of MCS and F-MCS.
Catalysts 16 00702 g006
Figure 7. Mott–Schottky curves of (A) F-MCS and (B) MCS.
Catalysts 16 00702 g007
Figure 8. (A) Transient photocurrent curves of F-MCS- and MCS-modified electrodes. (B) Nyquist plots of MCS- and F-MCS-modified electrodes. (C) Fluorescence spectra of MCS and F-MCS (excitation wavelength 380 nm). (D) EPR spectrum of F-MCS and MCS.
Catalysts 16 00702 g008
Figure 9. Time-dependent photocatalytic hydrogen evolution curves of (a) F-MCS (0.73 mol L−1 NH4F was used for synthesis) and (b) MCS (representative experimental data).
Catalysts 16 00702 g009
Figure 10. Schematic illustration of the photocatalytic hydrogen evolution mechanism for (left) pristine MCS and (right) F-MCS. Both samples possess intrinsic sulfur vacancies (blue dotted circles).
Catalysts 16 00702 g010
Disclaimer/Publisher’s Note: The statements, opinions and data contained in all publications are solely those of the individual author(s) and contributor(s) and not of MDPI and/or the editor(s). MDPI and/or the editor(s) disclaim responsibility for any injury to people or property resulting from any ideas, methods, instructions or products referred to in the content.