Article

Membraneless Microfluidic Microbial Electrolysis Cell with a Biocathode for Cost-Effective Hydrogen Production


Department of Mechanical Engineering, BK21 FOUR ERICA-ACE Center, Hanyang University, 55 Hanyangdaehak-ro, Sangnok-gu, Ansan 15588, Republic of Korea
*
Author to whom correspondence should be addressed.
Catalysts 2026, 16(7), 615; https://doi.org/10.3390/catal16070615
Submission received: 25 February 2026 / Revised: 15 March 2026 / Accepted: 26 June 2026 / Published: 6 July 2026
(This article belongs to the Special Issue Microflow (Bio)Catalysis—2nd Edition)

Abstract

In this study, an ecofriendly microfluidic microbial biocathode electrolysis cell is developed for hydrogen production. Low-cost microbial catalysts are employed on single-walled carbon nanotube cathodes instead of noble metal (platinum) catalysts. The channel layer for the electrolyte flow is fabricated from polydimethylsiloxane and coated with Parylene C to minimize oxygen permeability. A miniaturized electrolysis cell is constructed by depositing electrodes onto a glass substrate and bonding them to a polydimethylsiloxane channel layer via plasma surface treatment. The establishment of the biocathode during the start-up procedure is analyzed, and the hydrogen production performance of the biocathode microbial electrolysis cell (MEC) is evaluated under various applied voltages and electrolyte flow rates. At higher applied voltages and optimal flow rates, biofilm formation is well-developed, resulting in a peak hydrogen production rate of 14.8 m3 H2 m−3 d−1. The developed MEC biocathode demonstrates significant performance, achieving a current density of 0.22 A m−2, corresponding to 69% of that of a platinum-catalyzed cathode MEC, while exhibiting a substantially longer operating duration of 12 h. These results demonstrate the potential to overcome the inherent limitations of biocathodes, thereby addressing the high cost and low durability of conventional platinum-catalyzed MECs. Compared with conventional MEC systems, the proposed microfluidic configuration enables membraneless operation with reduced internal resistance and rapid biofilm formation, demonstrating its potential as a compact and cost-effective platform for biohydrogen production.

1. Introduction

Despite steady growth in renewable energy consumption alongside increasing global energy demand, the overall share of renewables remains substantially lower than that of fossil fuels. Consequently, greenhouse gas emissions continue to rise despite the expanding adoption of renewable energy sources [1]. In this context, hydrogen energy has emerged as a promising alternative [2]. Hydrogen gas offers several advantages: it can be stored long term in various forms, is nontoxic, produces minimal greenhouse gas emissions, is applicable across multiple sectors, and has a high gravimetric energy density [3]. Although hydrogen is currently extracted from coal-based fuels, this process is limited by the simultaneous release of carbon dioxide [4]. Conventional methods, such as electrically driven water electrolysis or the hydrolysis of chemical hydrides, require substantial energy inputs or high operating temperatures [5]. In contrast, water electrolysis using microbial catalysts at the anode enables the production of clean hydrogen without carbon dioxide emissions and with reduced external energy requirements [6]. Standard water electrolysis requires a minimum applied voltage of 1.2 V, whereas a microbial electrolysis cell (MEC) can theoretically produce hydrogen at voltages as low as 0.14 V [7]. Furthermore, MECs provide the dual benefit of treating wastewater by decomposing pollutants in high-concentration organic effluents while simultaneously generating hydrogen, and they can operate effectively at room temperature [8].
Platinum is generally used as a cathode catalyst in MECs to reduce the high overpotential required for hydrogen evolution owing to its excellent catalytic activity [9]. However, platinum is costly, vulnerable to anion-induced corrosion, and has a limited operational lifespan [10]. Recently, biocathodes utilizing low-cost, environmentally friendly microorganisms as catalysts have been explored as alternatives to platinum [11,12,13,14]. Biocathodes offer advantages such as cost-effectiveness, operation at low temperatures, and self-generating capabilities [15], making them promising substitutes for noble metal catalysts. Nevertheless, improvements in hydrogen production rates (0.01–2.5 m3 H2 m−3 d−1) and start-up times (>28 d) are necessary for practical applications [16,17]. To date, research on biocathodes for hydrogen production remains limited [16]. Accordingly, this study aimed to employ electroactive microorganisms exclusively as cathode catalysts, without the use of catalysts on the anode.
Electrolyzed cells typically consist of two electrodes and a separator. However, separators are prone to several issues, including the need for moisture maintenance, counterion backflow, membrane damage, and fouling [18]. Conversely, laminar co-flow microfluidic fuel cells eliminate the need for a physical separator by forming a laminar liquid interface between the reductant and oxidant within the channel [19]. Eliminating expensive separators simplifies the fabrication process and reduces costs [20,21]. In addition, the internal resistance associated with the membrane is minimized, potentially enhancing the performance. In this study, a membrane-less co-laminar microfluidic MEC was developed for hydrogen production. The cell was designed for continuous-mode operation to ensure sustained hydrogen production compared with that of batch-type systems.
Recently, microfluidic bioelectrochemical systems have attracted increasing attention due to their reduced internal resistance, enhanced mass transfer, and rapid start-up characteristics. Several studies have reported microfluidic microbial fuel cells [22] and electrolysis cells [23]; however, most of these systems rely on noble metal catalysts or focus primarily on power generation rather than hydrogen production. Furthermore, investigations on microfluidic MECs incorporating microbial biocathodes remain limited. Despite the advantages of microfluidic electrochemical systems, the integration of microbial biocathodes into membraneless microfluidic MECs has not been sufficiently explored. In particular, the feasibility of replacing noble metal cathode catalysts with electroactive microbial biofilms in a microfluidic configuration remains unclear. Therefore, this study aims to develop a membraneless microfluidic MEC employing a microbial biocathode for cost-effective hydrogen production and to evaluate its electrochemical performance and hydrogen generation capability under various operating conditions.
The feasibility of the developed electrolysis cell as a hydrogen-generating device with an improved biocathode performance was evaluated. First, start-up experiments were conducted to establish a biofilm on the cathode, which represents the initial step in biocathode MEC operation. The optimal flow rate and applied voltage for biofilm formation were identified by monitoring the measured current. After optimal biofilm development, the electrochemical performance was compared based on the presence of platinum catalysts and the choice of electrodes for microbial catalyst application. Subsequently, MEC experiments were performed to assess the hydrogen production performance. Using the optimal conditions identified during the start-up phase, the cell output voltage was measured under various flow rates, applied voltages, and catalyst conditions, and the corresponding current values were calculated using Ohm’s law. The hydrogen yield, maximum hydrogen production rate, and coulombic efficiency were determined based on the average current density. Furthermore, the chemical oxygen demand (COD) removal rate and pH were measured to enable a comprehensive comparison of the hydrogen production performance.

2. Results and Discussion

2.1. Computational Fluid Dynamics Simulation

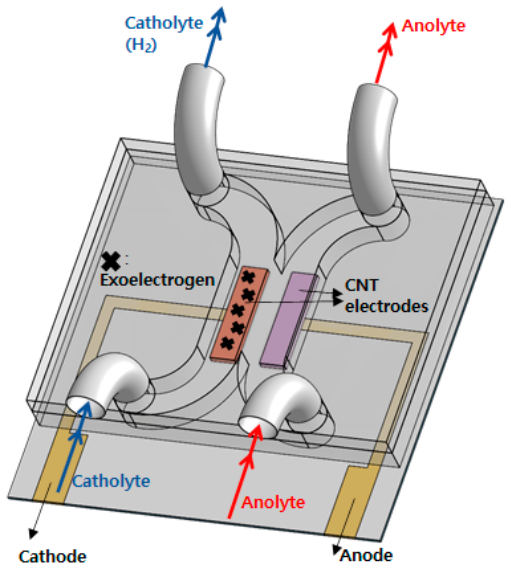
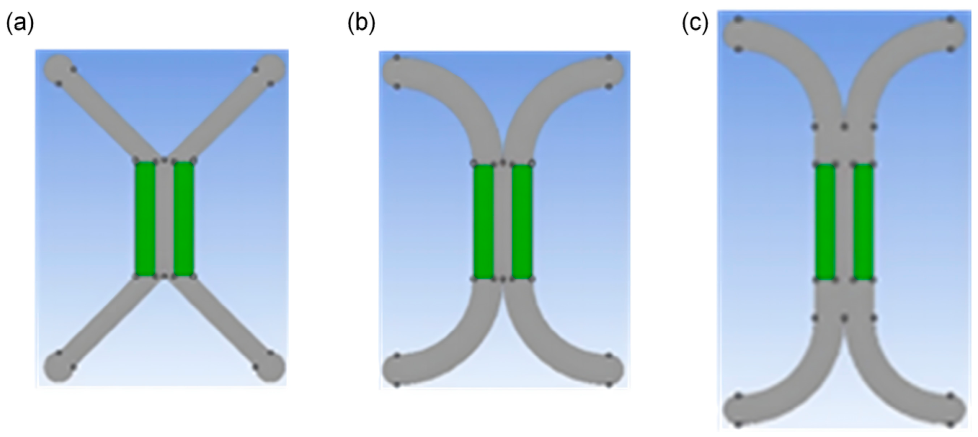
The proposed co-laminar microfluidic electrolysis cell was designed with a Y-shaped channel structure featuring two inlets and outlets, as shown in Figure 1. Reducing the interelectrode distance effectively decreases the internal resistance of the electrochemical cell. The microfluidic channel was designed to maintain a stable co-laminar flow between the anolyte and catholyte streams without the use of a physical membrane. Under the low Reynolds number conditions in the microchannel, the flow remains laminar, and the interface between the two electrolyte streams acts as a virtual separator. This configuration minimizes cross-mixing while allowing ionic transport across the liquid–liquid interface, thereby reducing internal resistance compared with conventional membrane-based MEC systems. However, when the diffusion zone between the anolyte and catholyte reaches the opposing electrode, the cell performance deteriorates. In this study, the diffusion zone was analyzed based on changes in the molar concentration, with the diffusion boundary defined as the region where the molar concentration decreased to below 99.0% of its initial value [24]. As the two liquid streams merged and flowed downstream, the diffusion zone gradually expanded. Therefore, the diffusion width was calculated from the simulated results at the downstream end of the electrode near the outlet, where the diffusion zone was maximal. Three channel geometries were analyzed: (i) straight inlet and outlet, (ii) circular-arc inlet and outlet, and (iii) circular-arc inlet and outlet with an extended channel length of 10.1 mm (Figure A1). The flow rates at the two inlets were fixed at 0.01 mL min−1. The simulation results indicate that the long-channel configuration exhibits the widest diffusion zone (0.89 mm), whereas the diffusion width in the circular-arc geometry (0.56 mm) is narrower than that in the straight geometry (0.59 mm). Consequently, the circular-arc inlet/outlet configuration without a long channel was identified as the optimal design, as its diffusion width is the smallest relative to the interelectrode distance (0.7 mm). In addition, the shear stress on the electrode surface was simulated, since excessive shear stress can cause biofilm detachment and hinder stable biocathode formation. As the flow rate increased from 0.005 to 0.03 mL min−1, the shear stress was predicted to rise linearly from 8.4 to 51.6 mPa.

2.2. Analysis of Biofilm Formation in Start-Up Procedures

Recent studies have also emphasized the importance of understanding the catalytic mechanisms of bioelectrochemical systems and the interfacial electron transfer processes occurring at biocathodes. Advanced catalyst design and mechanistic investigations have demonstrated that electrode materials and surface properties play a crucial role in facilitating microbial electron transfer and hydrogen evolution reactions [25,26]. The carbon nanotube electrode also plays a critical role in facilitating microbial attachment and extracellular electron transfer. Carbon nanotubes possess a high specific surface area, excellent electrical conductivity, and favorable biocompatibility, which collectively promote the formation of dense electroactive biofilms. The nanoscale surface structure of carbon nanotubes provides numerous anchoring sites for microorganisms, enabling stable microbial attachment during continuous flow operation. Furthermore, the conductive network formed by carbon nanotubes can enhance electron transport between microbial cells and the electrode surface, thereby improving the overall electrochemical performance of the biocathode. Such properties make carbon nanotube electrodes particularly suitable for microfluidic bioelectrochemical systems where efficient electron transfer and stable biofilm formation are essential for sustained hydrogen production.
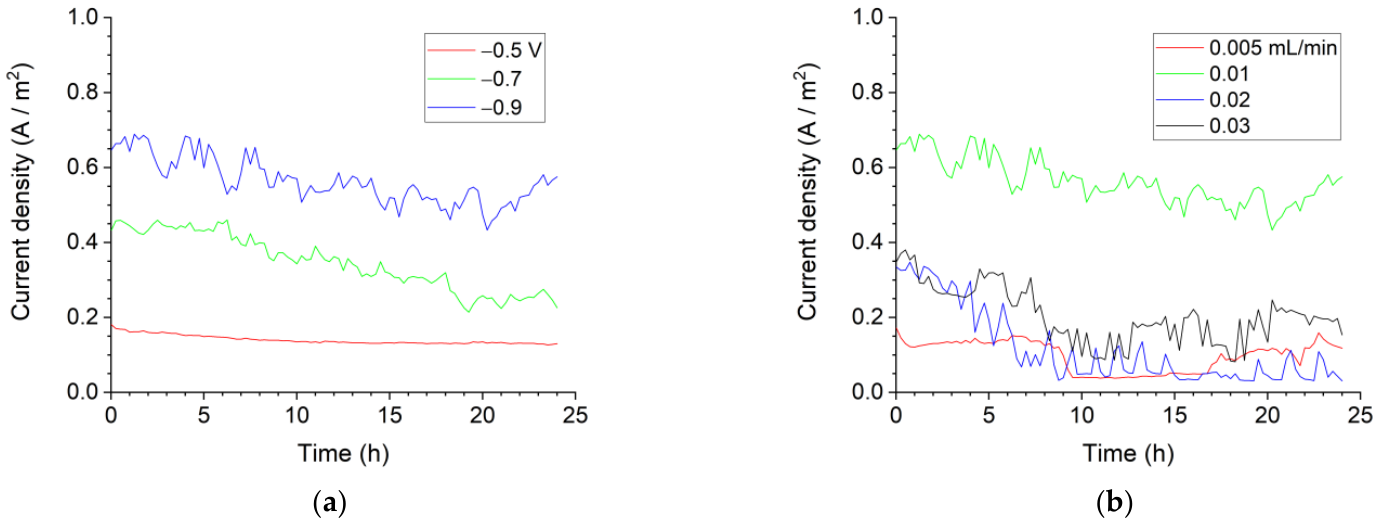
In MECs, thicker and well-developed biofilms formed on carbon electrodes improve the electron transfer efficiency, resulting in an increased current output [27]. To investigate biofilm formation during the start-up procedure, chronoamperometric current responses were compared under different voltages applied during biocathode development. The flow rate was fixed at 0.01 mL min−1, and applied voltages of −0.5, −0.7, and −0.9 V were evaluated. Experimental data recorded over 24 h under stable conditions were converted to positive values, as shown in Figure 2a. As the applied voltage becomes more negative, the measured current increased because the higher driving force more effectively overcame the activation energy barrier of the electrochemical reactions, thereby accelerating the reaction kinetics and promoting electron transfer. Among the tested conditions, the highest current density was achieved at an applied voltage of −0.9 V. However, increasing the magnitude of the applied voltage also led to larger current fluctuations, likely due to greater variations in the biofilm thickness. Overall, the results indicate that biofilm formation was most effective at −0.9 V, as evidenced by the highest measured current density.
Chronoamperometric current responses during biocathode formation in the start-up stage were monitored for 24 h while varying the electrolyte flow rate, with the applied voltage fixed at −0.9 V. Experiments were conducted at four flow rates: 0.005, 0.01, 0.02, and 0.03 mL min−1. In general, higher flow rates are expected to enhance the current output by ensuring a continuous supply of fresh electrolytes to the electroactive microorganisms. The experimental results, converted to positive current values, are shown in Figure 2b. Among the tested conditions, the highest current density was achieved at a flow rate of 0.01 mL min−1. In contrast, further increases in the flow rate to 0.02 and 0.03 mL min−1 caused a decrease in the current density. Higher flow rates increase the shear stress on biofilms, which during the start-up process can hinder biofilm attachment and development on the electrode surface, reducing the efficiency of biocathode formation [21]. Conversely, at the low flow rate of 0.005 mL min−1, the supply of acetate, the carbon-based energy source, is likely insufficient, slowing biofilm development and lowering current output. Based on these observations, biofilm formation was most effective at a flow rate of 0.01 mL min−1, where the highest current density was achieved. Therefore, in subsequent experiments, biocathodes were constructed under the optimal conditions of an applied voltage of −0.9 V and a flow rate of 0.01 mL min−1.

2.3. Comparative Analysis of the Electrochemical Performance of the Biocathode

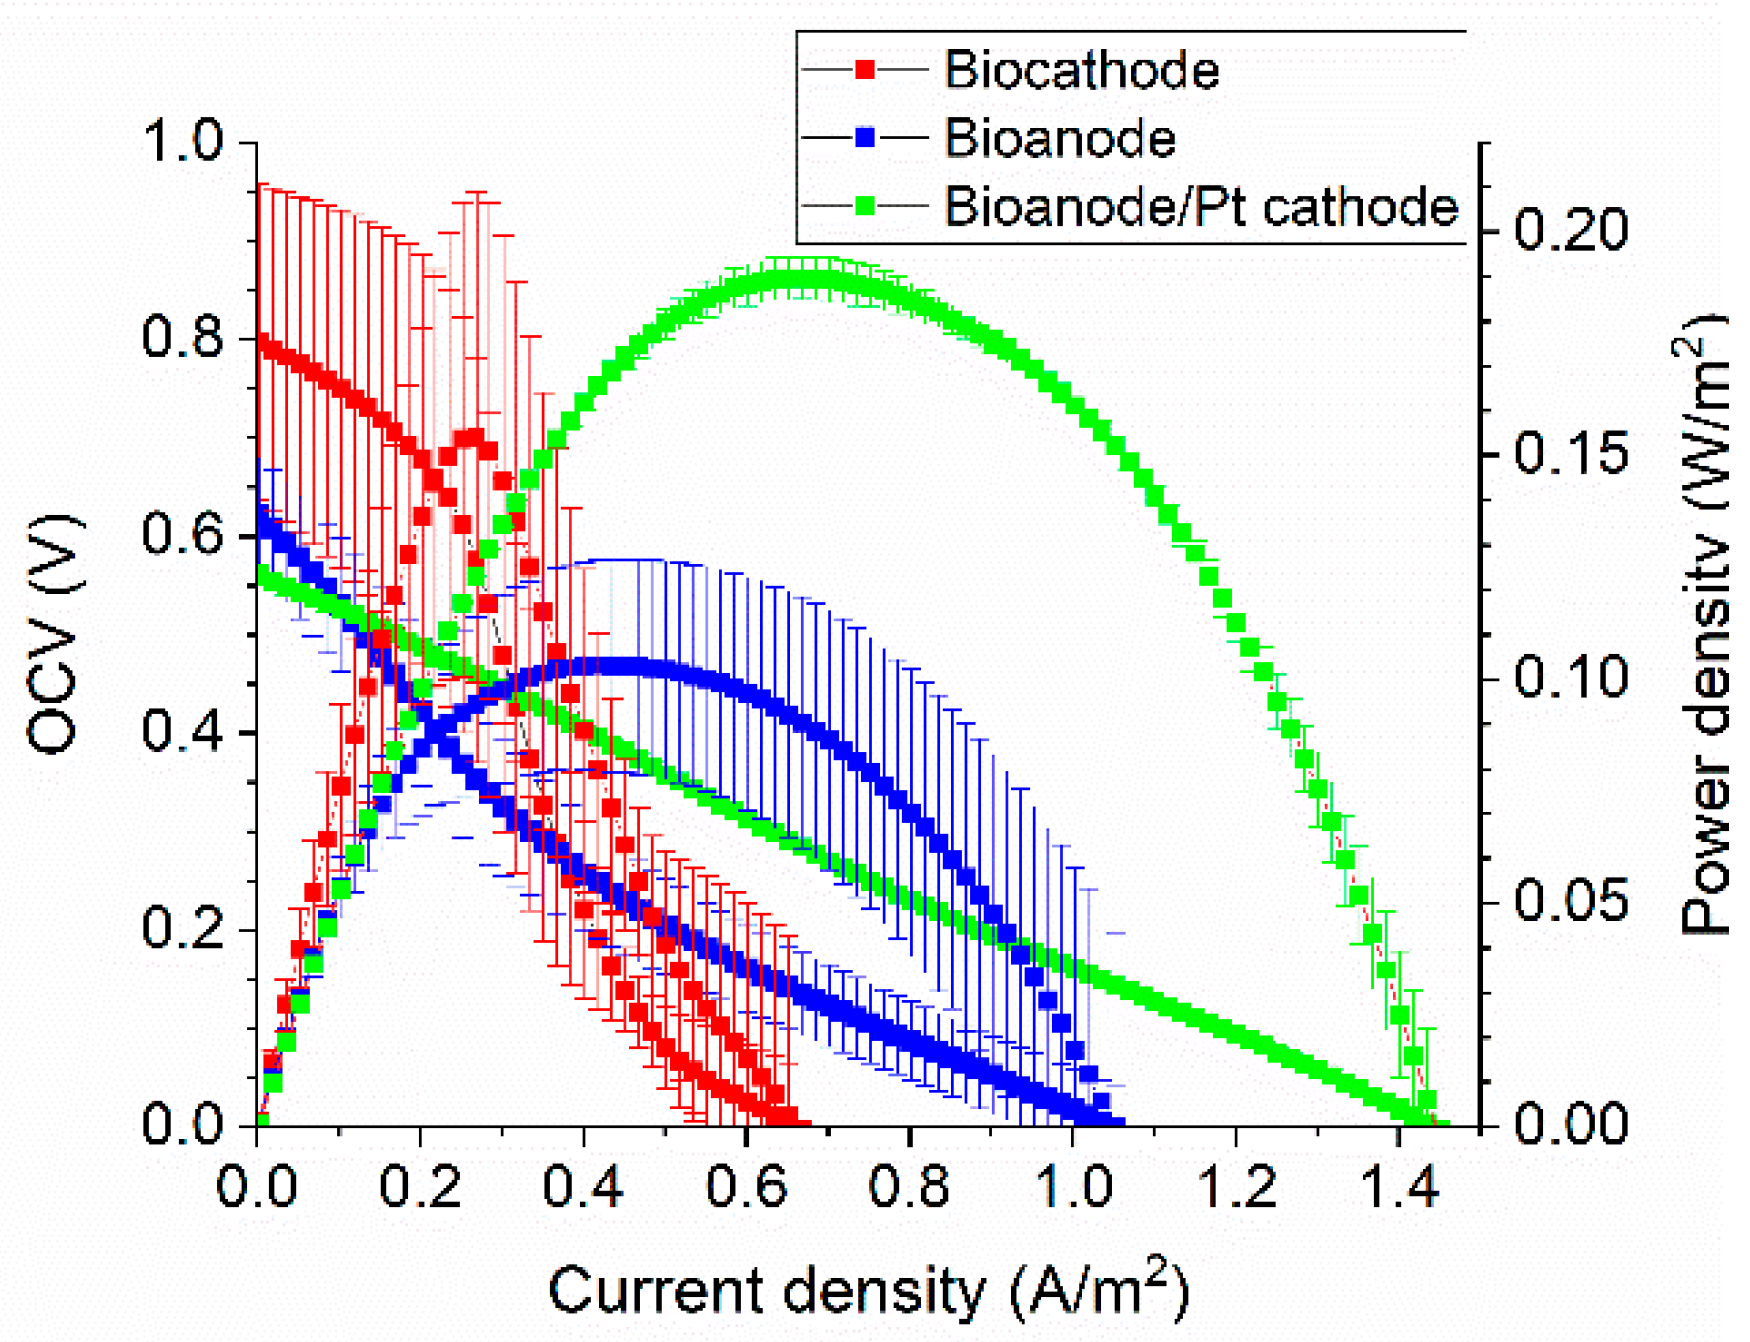
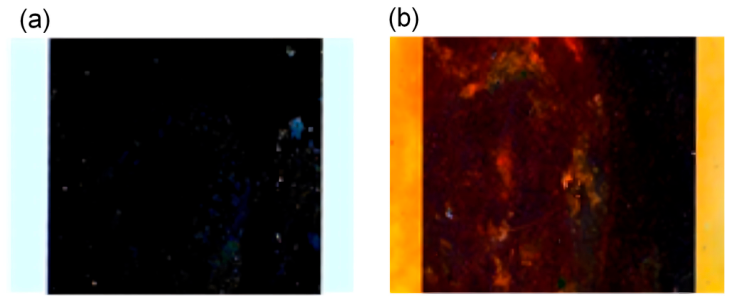
After the biocathode was established and chronoamperometric current stabilized, the electrochemical performance of the electrodes was evaluated under different catalyst configurations. Figure A2 presents optical microscopy images of the electrode surface before and after biocathode formation, confirming the successful development of a well-formed biofilm. Optical microscopy observations confirmed the successful formation of microbial biofilms on the cathode surface after the start-up procedure. The images show a dense and uniformly distributed biofilm layer covering the carbon nanotube electrode surface, indicating effective microbial attachment and growth. Such biofilm formation is essential for facilitating extracellular electron transfer between the microorganisms and the electrode. Comparative performance tests were conducted under three catalyst configurations: (i) a bioanode, with microbial catalysts applied only to the anode; (ii) a biocathode, with microbial catalysts applied only to the cathode; and (iii) a bioanode/platinum cathode, with microbial catalysts on the anode and a platinum catalyst on the cathode. For the biocathode configuration, microorganisms were first inoculated onto the anode to construct a bioanode following a previously reported method [28]. The same anolyte and catholyte compositions used for the bioanode system were applied to the bioanode/platinum cathode configuration. The open-circuit potential (OCV), maximum current density (MCD), and maximum power density (MPD) were determined from polarization curves measured using the linear sweep galvanostatic method with a potentiostat, as shown in Figure 3. The biocathode exhibited an MPD of 0.15 W m−2, MCD of 0.67 A m−2, and OCV of 0.80 V, corresponding to approximately 81%, 46%, and 142% of the MPD, MCD, and OCV values of the bioanode/platinum cathode system (MPD: 0.18 W m−2, MCD: 1.45 A m−2, OCV: 0.57 V), respectively. These results indicate that the electrochemical performance of the biocathode was not substantially inferior to that of the platinum-based cathode system. Furthermore, compared with the bioanode-only system (MPD: 0.10 W m−2, MCD: 1.05 A m−2, OCV: 0.64 V), the biocathode demonstrated a generally superior electrochemical performance. Polarization curve analysis revealed that the biocathode exhibited electrochemical activity comparable to that of the platinum cathode. Although the maximum current density of the biocathode was lower than that of the platinum catalyst, the microbial catalyst demonstrated improved operational stability and sustained current generation over a longer period. Although electrochemical impedance spectroscopy (EIS) was not conducted in the present study, EIS analysis would provide further insights into the internal resistance and charge transfer mechanisms of the microbial biocathode system. Future work will focus on detailed impedance analysis to quantitatively evaluate the contributions of solution resistance, biofilm resistance, and charge transfer resistance in the proposed microfluidic MEC.

2.4. Analysis of the Hydrogen Production Capability According to Applied Voltages and Flow Rates

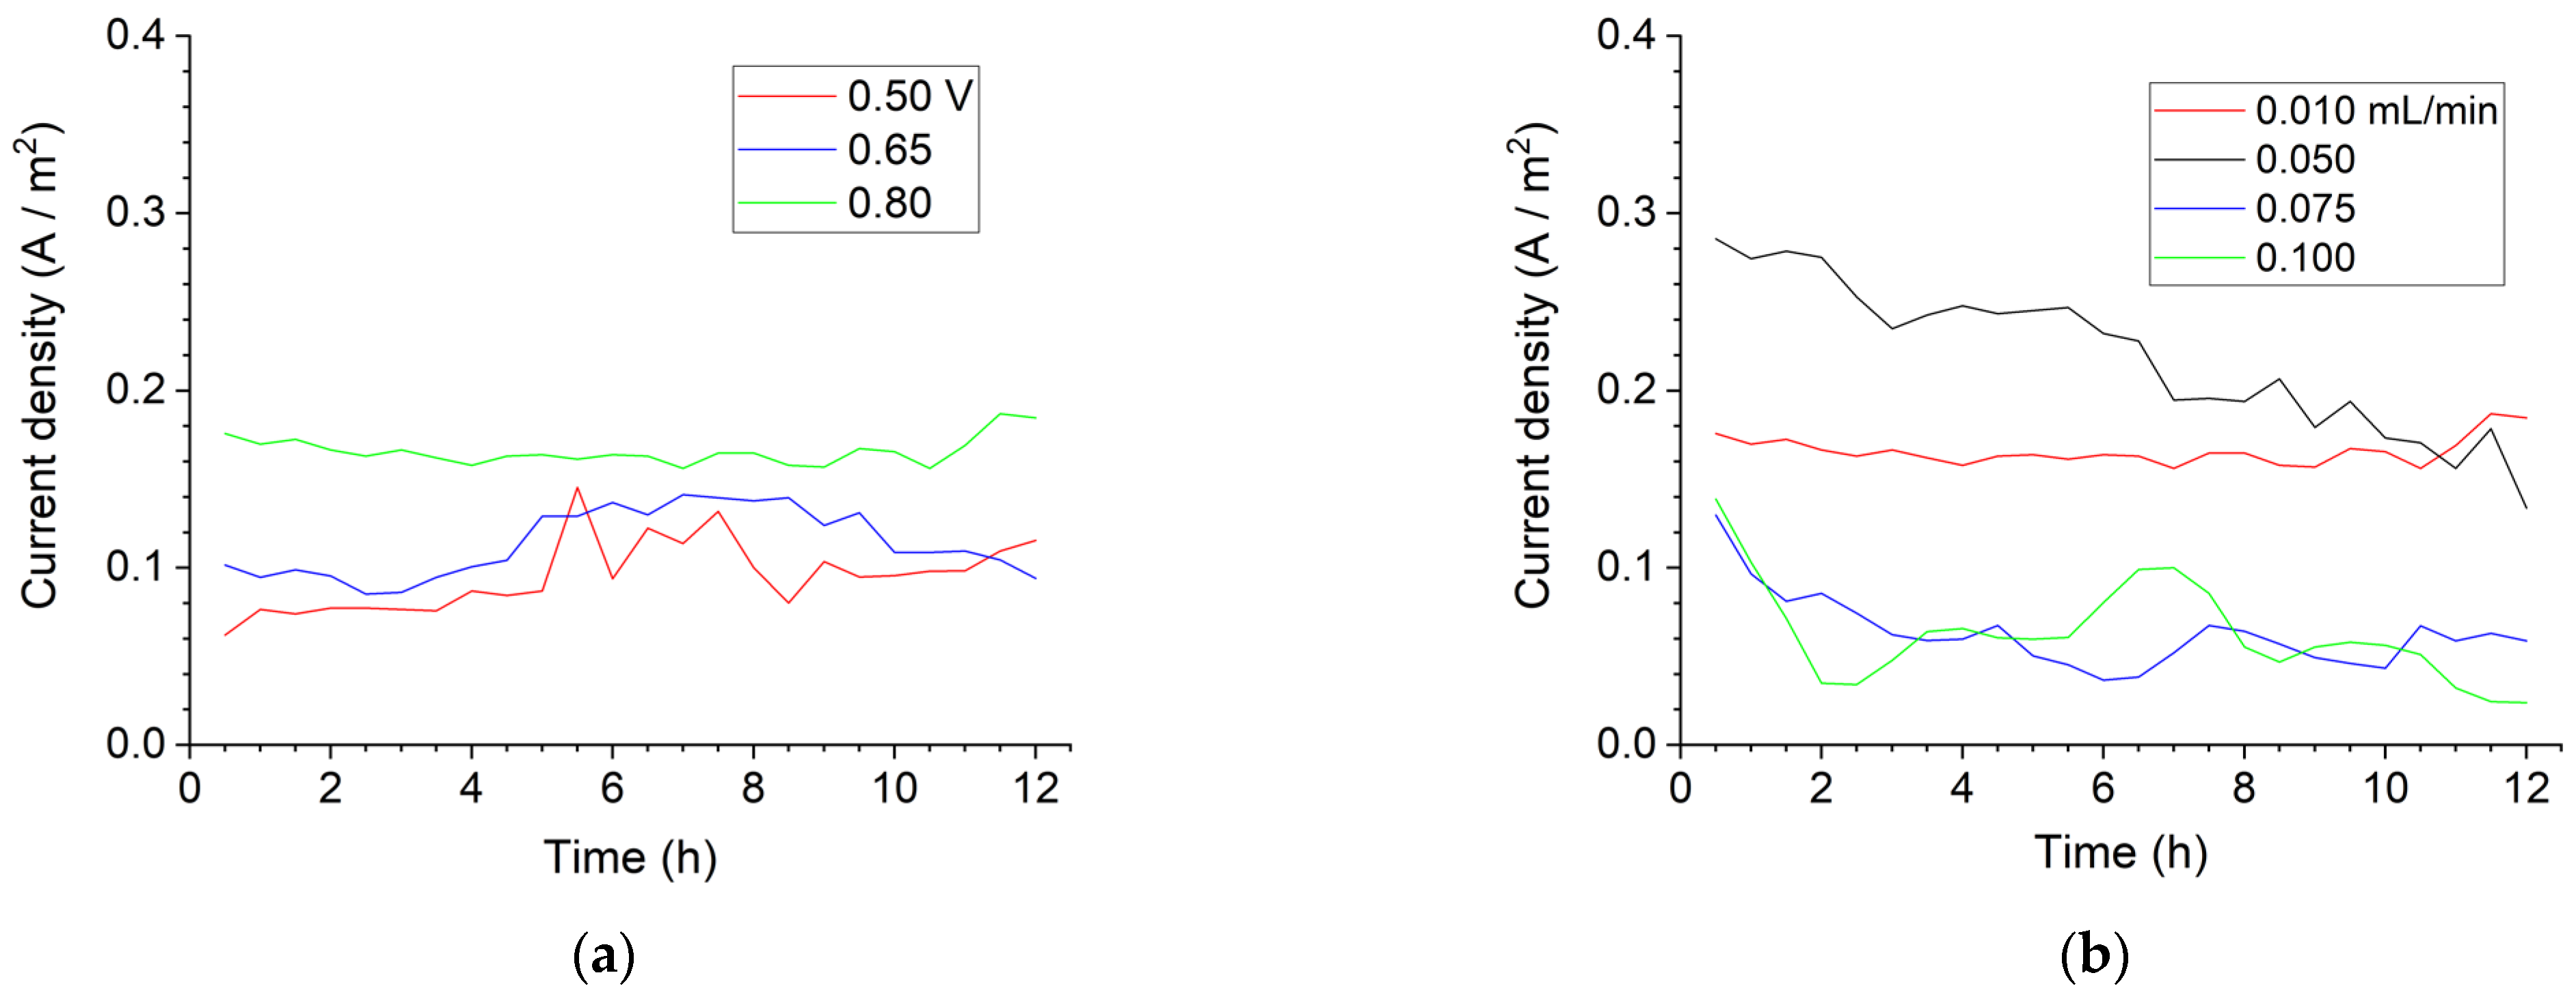
After biocathode formation, the flow rate was fixed at 0.01 mL min−1, and the applied voltage was varied to 0.5, 0.65, and 0.8 V to measure the cell current, which was used to estimate hydrogen production (Figure A3a). A higher current density indicates enhanced electron transfer from the anode to the cathode, thereby promoting the hydrogen evolution reaction. Accordingly, hydrogen production and the maximum hydrogen production rate increased proportionally with the current density. Table 1 summarizes the average current density, hydrogen production, maximum hydrogen production rate, and measured pH values obtained from current measurements over a 12 h period. As the applied voltage increased, the average current density, hydrogen production, and maximum hydrogen production rate also increased. This trend was attributed to the greater energy input required to drive hydrogen-producing reactions in the microbial electrolysis process at higher applied voltages, resulting in enhanced hydrogen generation. In addition, the pH increased with increasing applied voltage, which was attributed to proton consumption during the hydrogen evolution reaction. Based on these results, an applied voltage of 0.8 V was considered optimal for hydrogen production.
Subsequently, the current density was evaluated at different flow rates using the same procedure as in the voltage-dependent experiments (Figure A3b), with the applied voltage fixed at 0.8 V. Flow rates of 0.01, 0.05, 0.075, and 0.1 mL min−1 were tested. Table 2 lists the average MEC performance parameters obtained over approximately 12 h. As the flow rate increased, the enhanced electrolyte supply was expected to promote hydrogen production. Accordingly, increasing the flow rate from 0.01 to 0.05 mL min−1 resulted in a higher average current density, hydrogen production, and maximum hydrogen production rate. However, further increases in the flow rate to 0.075 and 0.1 mL min−1 led to a sharp decline in the MEC performance. This suggests that excessive flow rates hinder stable microbial attachment to the electrode surface. As the flow rate increased, the shear stress acting on the biofilm increased, and excessive shear stress prevented the biofilm from remaining attached to the electrode surface. Consequently, hydrogen production and the maximum hydrogen production rate decreased at higher flow rates. The pH was also highest at a flow rate of 0.05 mL min−1, which was attributed to increased proton consumption during hydrogen production. Therefore, a flow rate of 0.05 mL min−1 was identified as the most suitable for hydrogen production in this system. The applied voltage provides the additional energy required to drive the hydrogen evolution reaction in MECs. Increasing the applied voltage enhances the driving force for electron transfer, thereby increasing the current density and hydrogen production rate. Similarly, the electrolyte flow rate influences both substrate supply and shear stress on the microbial biofilm. Moderate flow rates improve mass transfer and nutrient supply, whereas excessive flow rates may cause biofilm detachment due to increased shear stress.

2.5. Comparison of the Hydrogen Production Capability According to Catalyst Type

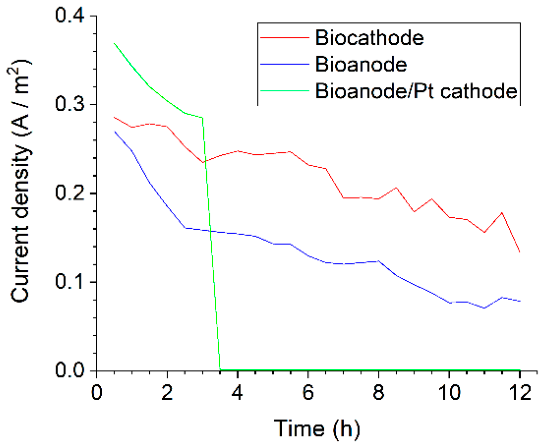
At an applied voltage of 0.8 V and a flow rate of 0.05 mL min−1, the hydrogen production performance was compared under different catalyst configurations using the following indicators: current density, hydrogen production, maximum hydrogen production rate, COD removal efficiency, Coulombic efficiency, and pH. A higher COD removal efficiency indicates that a greater fraction of organic compounds was utilized for hydrogen production. The coulombic efficiency reflects how effectively the MEC converts electrons derived from carbon-based organic materials, which serve as the energy source, into electrical current; thus, a higher coulombic efficiency corresponds to a superior hydrogen production performance. Coulombic efficiency represents the fraction of electrons derived from substrate oxidation that are recovered as electrical current. In this study, the Coulombic efficiency indicates that a portion of the electrons generated from acetate oxidation was successfully transferred to the cathode for hydrogen evolution. Further improvements in electron transfer efficiency could enhance the overall hydrogen production performance. The experimental results are presented in Figure 4, and the average values over approximately 12 h are summarized in Table 3. Although the present experiments were conducted for approximately 12 h to evaluate the electrochemical performance, longer-term stability tests will be required to fully assess the durability of the biocathode. Nevertheless, the stable current output observed during the experiment indicates that the microbial biofilm remained active under continuous operation conditions. For the platinum-based catalyst configuration, the reported values represent approximately 3 h averages because of the limited duration of stable operation. Among the tested conditions, the bioanode/platinum cathode configuration exhibited the highest average current density, hydrogen production, maximum hydrogen production rate, and pH. In addition, this configuration showed the highest COD removal efficiency and coulombic efficiency, indicating that the organic substrates were most effectively degraded and utilized for current generation and hydrogen production. The current density of the biocathode system reached approximately 69% of that of the bioanode/platinum cathode system and was 1.6 times higher than that of the bioanode-only system. Notably, in the bioanode/platinum cathode configuration, the current density decreased sharply after approximately 3 h, and the output signal disappeared after 3.5 h. In contrast, the biocathode system maintained approximately 47% of its initial current density even after 12 h of operation, whereas the bioanode-only system retained approximately 29% of its initial current density over the same period. The maximum hydrogen production rate obtained in this study (14.8 m3 H2 m−3 d−1) is comparable to those reported for the state-of-the-art MEC systems reported in the literature [29,30], which are generally below 32 m3 H2 m−3 d−1, and exceeds the values reported for previously published biocathode MEC systems, which typically range from 0.01 to 2.5 m3 H2 m−3 d−1. The enhanced performance can be attributed to the reduced electrode spacing, improved mass transfer, and low internal resistance inherent to the microfluidic configuration. Although the present study focuses on a microfluidic MEC, the proposed design concept may be extended to larger systems through parallelization or stacking of multiple microfluidic units. Such modular configurations could enable scale-up while retaining the advantages of reduced internal resistance and efficient mass transfer.

3. Materials and Methods

3.1. Design and Fabrication

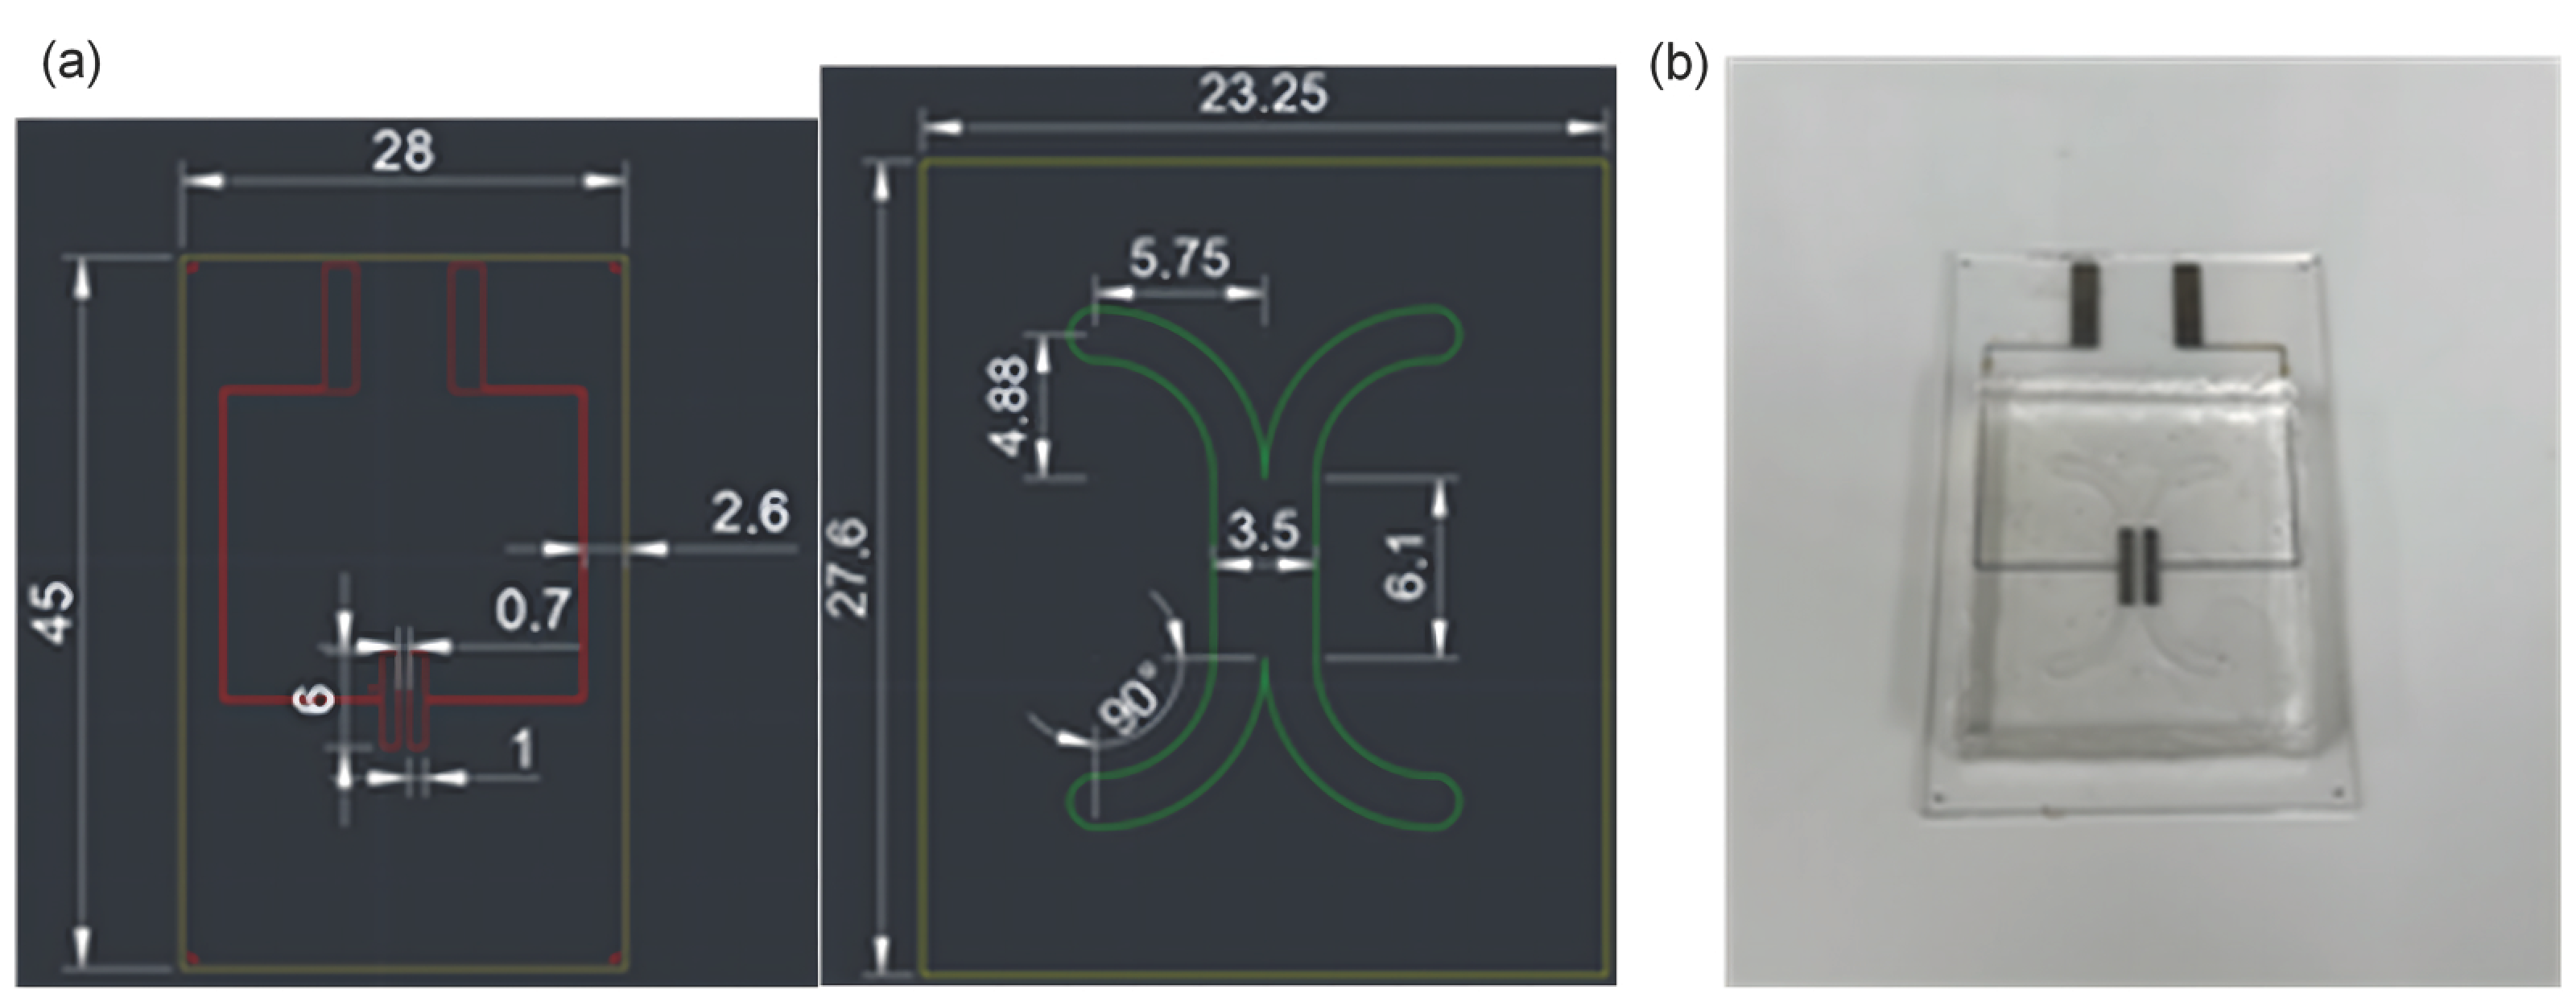
The geometric dimensions of the electrodes and flow channels were determined using computational fluid dynamics analysis (Ansys Fluent 2021 R2, Ansys, Inc., Canonsburg, PA, USA) to account for the diffusion zone between the anolyte and catholyte within the channel. For the simulations, the injected fluid was assumed to be deionized water, with properties specified as a density of 997 kg m−3, viscosity of 0.000855 kg m−1 s−1, and diffusion coefficient of 1.0 × 10⁻¹² m2 s−1. The boundary conditions were defined with an inlet velocity of 0.0044 m s−1 and outflow vents at the outlets. The fluid flow within the channel was assumed to be laminar, and all other modeling conditions were kept consistent with those reported in previous studies [31]. The electrode length, width, and inter-electrode spacing were set to 6, 1, and 0.7 mm, respectively. The total channel length was 1 mm, with a width of 6.1 mm. The overall dimensions are illustrated in Figure A4a.
The electrolysis cell was fabricated using a previously reported polydimethylsiloxane (PDMS)–glass hybrid biochip manufacturing method [28]. The cell was constructed by bonding a PDMS layer containing electrolyte channels to a glass substrate patterned with electrodes. Cr/Ni (50/200 nm) base electrodes were deposited onto glass wafers by e-beam evaporation. Carbon electrodes were subsequently formed on these base electrodes by depositing single-walled carbon nanotubes, which are known for their biocompatibility and high electrical conductivity, via electrophoresis [24]. The microchannels, with a height of 165 μm, were formed in the PDMS layer using a soft-lithography process. Since anaerobic microorganisms were used as catalysts in this study, preventing oxygen infiltration into the cells was essential. Therefore, the PDMS layer, which typically exhibits high oxygen permeability, was coated with a 2 µm layer of Parylene C, which has a considerably lower oxygen permeability of 2.8 cm2 mm m−2 d−1 atm−1. The non-coated regions of PDMS and the surface of the glass substrate with the electrodes were treated with O2 plasma to ensure strong bonding. The assembled electrolysis cell is shown in Figure A4b. The PDMS microchannel layer was fabricated using a standard soft-lithography process. The PDMS prepolymer and curing agent were mixed at a ratio of 10:1, poured onto a mold, and cured at 65 °C for 12 h. After curing, the PDMS layer was peeled from the mold and inlet and outlet ports were created using a punch. To reduce oxygen permeability, the PDMS surface was coated with Parylene C using a chemical vapor deposition process [31]. The coating thickness was approximately 2 μm, which has been reported to significantly reduce oxygen diffusion while maintaining microchannel integrity. The coating process was repeated to ensure uniform coverage and reproducibility.

3.2. Preparation of Catalyst and Electrolytes

A Geobacteriaceae-enriched culture obtained from wastewater was used as the inoculum for electroactive biofilms, serving as the biocatalyst in the electrochemical cell. The cultivation procedure and medium composition were the same as those reported in previous studies [32]. A microbial nutrient medium was used as the anolyte when microbial catalysts were applied to the anode. The medium comprised 0.74 g L−1 KCl, 0.58 g L−1 NaCl, 0.68 g L−1 KH2PO4, 0.87 g L−1 K2HPO4, 0.28 g L−1 NH4Cl, 0.1 g L−1 MgSO4·7H2O, 0.1 g L−1 CaCl2·2H2O, and 1 mL L−1 of a trace element mixture [33], supplemented with 0.82 g L−1 sodium acetate (NaC2H3O2) as the carbon and electron source [34]. A 100 mM potassium ferricyanide solution (Sigma-Aldrich, St. Louis, MO, USA) was used as the catholyte, serving as the electron acceptor. In experiments where microbial catalysts were applied to the cathode, the microbial nutrient medium described above was used as the catholyte, whereas 100 mM potassium ferricyanide, acting as the electron donor, was used as the anolyte. The pH of both the anolyte and catholyte was adjusted to 7.0 using 1 M HCl or NaOH. All chemicals were purchased from Sigma-Aldrich (St. Louis, MO, USA) unless otherwise specified. During the start-up phase of biofilm formation on the anode, the microbial nutrient medium was purged with hydrogen gas prior to injection into the electrochemical cell. Hydrogen gas stored in a gas-sampling bag (Tedlar bag, Top Trading Eng Co., Seoul, Republic of Korea) was connected to the medium via FEP tubing (IDEX Corp., Northbrook, IL, USA), and hydrogen was continuously bubbled through the medium for purging. For all subsequent experiments, the microbial nutrient medium was purged with nitrogen gas before being introduced into the electrochemical cell.
Platinum catalysts were deposited onto single-walled carbon nanotube electrodes using the drop-casting method [35]. A platinum catalyst (10 wt% Pt/C, Sigma-Aldrich, USA) was mixed with a chemical binder, Nafion solution (5% Nafion solution, Thermo Fisher Scientific, Waltham, MA, USA), at a ratio of 7 μL per mg of catalyst to form a homogeneous paste. An OHP film with laser-cut electrode patterns was placed over the electrode area on the substrate, and the platinum paste was drop-cast onto the electrode at a loading of 0.5 mg Pt cm−2. The coated electrodes were dried at room temperature for 24 h before use.

3.3. Experimental Set-Up

Reagents in the syringes were injected into the electrochemical cell using a syringe pump (NE-4000; New Era Pump Systems, Inc., Farmingdale, NY, USA). FEP tubing with an outer diameter of 1/16″ was connected to a 50 mL gastight syringe (ILS, Ilmenau, Germany) for fluid delivery. To prevent gas leakage, a Female Luer to 1/4-28 Female flangeless fitting and 1/16″ flangeless ferrule (IDEX Corp., Northbrook, IL, USA) were used to securely connect the syringe and tubing. The COD was measured using a COD kit (HR Digestion Solution for COD 20–1500 mg L−1, HACH, Loveland, CO, USA) in combination with a COD reactor (DRB200, HACH, Loveland, CO, USA). Absorbance measurements were performed using a spectrophotometer (DR3900, HACH, Loveland, CO, USA), and the COD removal efficiency was calculated from the measured values. The pH was measured using a portable pH meter (pHTestr 30; EUTECH, Singapore).

3.4. Biocathode Start-Up Procedures

To generate hydrogen from an MEC, a start-up procedure is first performed to establish an electroactive biofilm on the cathode. In the initial stage, acetate- and hydrogen-oxidizing biofilms are formed on the anode. Subsequently, a hydrogen-producing biocathode is constructed by reversing the electrode polarity. In the first stage, an anolyte containing the cultured inoculum (microbial nutrient medium) was introduced into the anode channel, and a catholyte consisting of 100 mM potassium ferricyanide was injected into the cathode channel. After sealing both the inlet and outlet ports, the system was operated in the batch mode under an applied voltage of 0.2 V. After 24 h, while maintaining the applied voltage at 0.2 V, the anolyte and catholyte were continuously supplied at a constant flow rate. Chronoamperometry was performed using a potentiostat (Ivium Stat, Ivium Technologies, Eindhoven, The Netherlands). The bioanode formation was considered complete when the chronoamperometric current response under the applied voltage reached a stable output, with a lag time of approximately 10 h for current stabilization. Following bioanode formation, the electrode polarity was reversed, and the corresponding electrolytes were exchanged accordingly, while maintaining the same flow rate used during bioanode development. The biocathode was considered successfully established once the chronoamperometric current stabilized.

3.5. MEC Performance Experiments

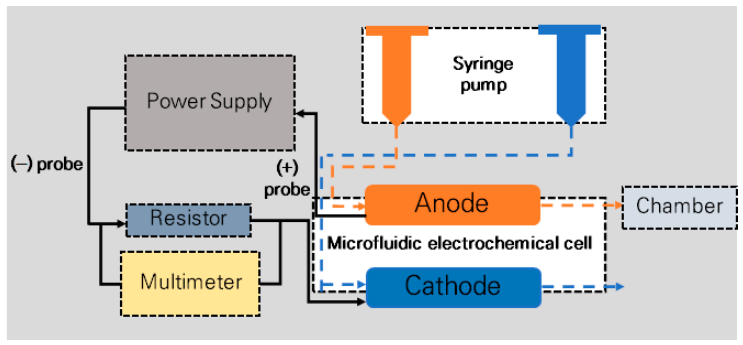
After electroactive biofilms were formed under the optimized voltage and flow rate conditions determined during the start-up experiments, MEC performance tests were conducted. As illustrated in Figure A5, an external resistor (10 Ω) was connected to the circuit, and a constant voltage was applied using a power supply (MK3003D, MK POWER, Seoul, Republic of Korea). The voltage across the resistor was measured using a multimeter (Fluke 189; Fluke, Everett, WA, USA), and the current was calculated using Ohm’s law. The current density was calculated based on the geometric surface area of the electrode (0.06 cm2) and serves as a key indicator for predicting both the hydrogen production rate and maximum hydrogen generation capability. Using the calculated current, the MEC performance, including the total hydrogen production volume, maximum hydrogen production rate, and coulombic efficiency, was evaluated following previously established methods [36,37]. All experiments were conducted at room temperature, with measurements taken every 30 min over a total duration of 12 h. Each experiment was repeated more than ten times to ensure reproducibility.

4. Conclusions

In this study, a biocathode MEC with a microfluidic configuration was developed. Through miniaturization, key limitations of conventional biocathode MECs, including the need for an ion-exchange membrane and high internal resistance, were partially alleviated. As a result, the developed biocathode MEC achieved a superior hydrogen production rate of 14.8 m3 H2 m−3 d−1 and a short start-up time of less than 2 d compared with those of previously reported biocathode MEC systems. Higher applied voltages promoted more effective biocathode formation and enhanced the hydrogen production performance. In contrast, optimal biofilm formation and the maximum MEC performance were achieved at intermediate electrolyte flow rates rather than at excessively low or high flow conditions. These results indicate that both the electrical and hydrodynamic conditions play critical roles in stabilizing electroactive biofilms and maximizing hydrogen production.
Based on polarization curve measurements, the maximum power density followed the order: bioanode/platinum cathode > biocathode > bioanode. The developed biocathode MEC exhibited a higher current density than that of the bioanode MEC, indicating greater effectiveness for hydrogen production. However, a notable limitation is that biofilm formation on the cathode requires a longer time than biofilm development on the anode. Although the biocathode MEC exhibited a slightly lower current density than the bioanode/platinum cathode MEC employing a platinum catalyst, it demonstrated significantly superior operational stability over extended periods. Therefore, this study suggests that microbial biocathodes are promising alternatives to platinum-based cathode catalysts, with the potential to address the high costs and environmental concerns associated with precious metal catalysts. Nevertheless, further research is required to evaluate long-term operational stability and to explore the scalability of the proposed microfluidic MEC system. Future work will focus on improving the durability of the microbial biocathode and developing strategies for integrating multiple microfluidic units for large-scale hydrogen production.

Author Contributions

Conceptualization, Y.A.; methodology, H.K. and Y.A.; validation, H.K.; investigation, H.K.; resources, S.H.L.; writing—original draft preparation, H.K.; writing—review and editing, I.S. and Y.A.; visualization, H.K., I.S. and S.H.L.; supervision, Y.A.; project administration, Y.A. All authors have read and agreed to the published version of the manuscript.

Funding

This research received no external funding.

Data Availability Statement

All the data were reported in the paper.

Conflicts of Interest

The authors declare no conflicts of interest.

Appendix A

Figure A1. Schematic diagrams of the three configurations used in the fluidic flow simulations: (a) straight inlet/outlet, (b) circular-arc inlet/outlet, and (c) circular-arc inlet/outlet with a long channel.
Catalysts 16 00615 g0a1
Figure A2. Photographs of the cathode surface (a) before and (b) after the start-up procedure.
Catalysts 16 00615 g0a2
Figure A3. Current density profiles of the microbial electrolysis cell under (a) different voltages at a flow rate of 0.01 mL min−1 and (b) different flow rates at an applied voltage of 0.8 V.
Catalysts 16 00615 g0a3
Figure A4. (a) Design drawings of the electrolysis cell (left: glass substrate; right: polydimethylsiloxane layer). All dimensions are in millimeters. (b) Photographs of the fabricated electrolysis cell.
Catalysts 16 00615 g0a4
Figure A5. Schematic of the experimental setup used for microbial electrolysis cell performance testing.
Catalysts 16 00615 g0a5

References

  1. Energy Institute. Statistical Review of World Energy 2023; Energy Institute: London, UK, 2023; Volume 72, pp. 4–12. [Google Scholar]
  2. Parkhey, P.; Gupta, P. Improvisations in structural features of microbial electrolytic cell and process parameters of electrohydrogenesis for efficient biohydrogen production: A review. Renew. Sustain. Energy Rev. 2017, 69, 1085–1099. [Google Scholar] [CrossRef]
  3. Acar, C.; Dincer, I. The potential role of hydrogen as a sustainable transportation fuel to combat global warming. Int. J. Hydrogen Energy 2020, 45, 3396–3406. [Google Scholar] [CrossRef]
  4. Hosseini, S.E.; Wahid, M.A. Hydrogen production from renewable and sustainable energy resources: Promising green energy carrier for clean development. Renew. Sustain. Energy Rev. 2016, 57, 850–866. [Google Scholar] [CrossRef]
  5. Gautam, R.; Nayak, J.K.; Ress, N.V.; Steinberger-Wilckens, R.; Ghosh, U.K. Bio-hydrogen production through microbial electrolysis cell: Structural components and influencing factors. Chem. Eng. J. 2023, 455, 140535. [Google Scholar] [CrossRef]
  6. Kim, L.S.; Yang, E.; Choi, M.-J.; Chae, K.-J. Bioelectrochemical production of hydrogen from organic waste. In Production of Hydrogen from Renewable Resources; Springer: Berlin/Heidelberg, Germany, 2015; pp. 249–281. [Google Scholar]
  7. Yang, E.; Mohamed, H.O.; Park, S.-G.; Obaid, M.; Al-Qaradawi, S.Y.; Castaño, P.; Chon, K.; Chae, K.-J. A review on self-sustainable microbial electrolysis cells for electro-biohydrogen production via coupling with carbon-neutral renewable energy technologies. Bioresour. Technol. 2021, 320, 124363. [Google Scholar] [CrossRef] [PubMed]
  8. Arun, J.; SundarRajan, P.; Pavithra, K.G.; Priyadharsini, P.; Shyam, S.; Goutham, R.; Le, Q.H.; Pugazhendhi, A. New insights into microbial electrolysis cells (MEC) and microbial fuel cells (MFC) for simultaneous wastewater treatment and green fuel (hydrogen) generation. Fuel 2024, 355, 129530. [Google Scholar] [CrossRef]
  9. Conway, B.E.; Jerkiewicz, G. Nature of electrosorbed H and its relation to metal dependence of catalysis in cathode H2 evolution. Solid State Ion. 2002, 150, 93–103. [Google Scholar] [CrossRef]
  10. Ivanov, I.; Ahn, Y.; Poirson, T.; Hickner, M.A.; Logan, B.E. Comparison of cathode catalyst binders for the hydrogen evolution reaction in microbial electrolysis cells. Int. J. Hydrogen Energy 2017, 42, 15739–15744. [Google Scholar] [CrossRef]
  11. Jeremiasse, A.W.; Hamelers, H.V.M.; Buisman, C.J.N. Microbial electrolysis cell with a microbial biocathode. Bioelectrochemistry 2010, 78, 39–43. [Google Scholar] [CrossRef] [PubMed]
  12. Crose, E.; Pereira, M.A.; Euverink, G.-J.W.; Stams, A.J.M.; Geelhoed, J.S. Analysis of the microbial community of the biocathode of a hydrogen-producing microbial electrolysis cell. Appl. Microbiol. Biotechnol. 2011, 92, 1083–1093. [Google Scholar] [CrossRef]
  13. Croese, E.; Jeremiasse, A.W.; Marshall, I.P.G.; Spormann, A.M.; Euverink, G.-J.W.; Geelhoed, J.S.; Stams, A.J.M.; Plugge, C.M. Influence of setup and carbon source on the bacterial community of biocathodes in microbial electrolysis cells. Enzym. Microb. Technol. 2014, 61–62, 67–75. [Google Scholar] [CrossRef]
  14. Lim, S.S.; Fontmorin, J.-M.; Izadi, P.; Daud, W.R.W.; Scott, K.; Yu, E.H. Impact of applied cell voltage on the performance of a microbial electrolysis cell fully catalysed by microorganisms. Int. J. Hydrogen Energy 2020, 45, 2557–2568. [Google Scholar] [CrossRef]
  15. Xu, Y.; Jiang, Y.; Chen, Y.; Zhu, S.; Shen, S. Hydrogen production and wastewater treatment in a microbial electrolysis cell with a biocathode. Water Environ. Res. 2014, 86, 649. [Google Scholar] [CrossRef] [PubMed]
  16. Jafary, T.; Daud, W.R.W.; Ghasemi, M.; Kim, B.H.; Jahim, J.M.; Ismail, M.; Lim, S.S. Biocathode in microbial electrolysis cell; Present status and future prospects. Renew. Sustain. Energy Rev. 2015, 47, 23–33. [Google Scholar] [CrossRef]
  17. Jeremiasse, A.W.; Hamelers, H.V.M.; Croses, E.; Buisman, C.J.N. Acetate enhances startup of a H2-producting microbial biocathode. Biotechnol. Bioeng. 2012, 109, 657–664. [Google Scholar] [PubMed]
  18. De, B.S.; Singh, A.; Dixit, R.J.; Khare, N.; Elias, A.; Basu, S. Hydrogen generation in additively manufactured membraneless microfluidic electrolysis cell: Performance evaluation and accelerated stress testing. Chem. Eng. J. 2023, 452, 139433. [Google Scholar] [CrossRef]
  19. Jung, D.-G.; Ahn, Y. Microfabricated paper-based vanadium co-laminar flow fuel cell. J. Power Sources 2020, 451, 227801. [Google Scholar]
  20. Hong, D.Y.; Cha, Y.W.; Ahn, Y. Flexible single-layer fabric-based co-laminar flow photosynthetic microbial fuel cell. Adv. Mater. Technol. 2025, 10, 2401399. [Google Scholar]
  21. Lee, S.W.; Ahn, Y. Upscaling of microfluidic fuel cell using planar single stacks. Int. J. Energy Res. 2019, 43, 5027–5037. [Google Scholar] [CrossRef]
  22. Kim, T.H.; Song, I.; Lee, S.H.; Ahn, Y.; Lui, H. Textile-based three electrode microbial electrochemical cell-based biosensor for toxicant detection in water. Int. J. Precis. Eng. Manuf. 2026, 27, 1601–1610. [Google Scholar]
  23. De, B.S.; Cunningham, J.; Khare, N.; Luo, J.-L.; Elias, A.; Basu, S. Hydrogen generation and utilization in a two-phase flow membraneless microfluidic electrolyzer-fuel cell tandem operation for micropower application. Appl. Energy 2022, 305, 117945. [Google Scholar] [CrossRef]
  24. Cho, H.-M.; Ha, H.; Ahn, Y. Co-laminar microfluidic microbial fuel cell integrated with electrophoretically deposited carbon nanotube flow-over electrode. ACS Sustain. Chem. Eng. 2022, 10, 1839–1846. [Google Scholar] [CrossRef]
  25. Lei, G.; Wang, Y.; Xiao, G.; Su, H. CoMo/SS cathode catalyst for enhanced hydrogen production in microbial electrolysis cells. Catalysts 2025, 15, 439. [Google Scholar] [CrossRef]
  26. He, X.; Li, Z.; Yao, Y.; Luo, F.; Sun, X.; Tang, B. Surface and interfacial engineering of electrocatalysts for seawater electrolysis. Acc. Chem. Res. 2026, 59, 518–528. [Google Scholar] [CrossRef] [PubMed]
  27. Lee, C.H.; Ha, H.; Ahn, Y.; Liu, H. Performance of single-layer paper-based co-laminar flow microbial fuel cells. J. Power Sources 2023, 580, 233456. [Google Scholar] [CrossRef]
  28. Ko, Y.-J.; Maeng, J.-H.; Ahn, Y.; Hwang, S.-Y.; Cho, N.-G.; Lee, S.-H. Real-time immunoassay with a PDMS-glass hybrid microfilter electro-immunosensing chip using nanogold particles and silver enhancement. Sens. Actuator B Chem. 2008, 132, 327–333. [Google Scholar] [CrossRef]
  29. Du, H.; Kim, D.; Rossi, R. Zero-gap microbial electrolysis cells for efficient hydrogen production from real liquid waste streams. Bioresour. Technol. 2026, 443, 133830. [Google Scholar] [CrossRef] [PubMed]
  30. Vikash, N.B. Optimum biohydrogen production by combination of fermentation and microbial electrolysis cell: Bioreactor design, scale-up, and technology readiness level analysis. Biochem. Eng. J. 2026, 228, 110066. [Google Scholar] [CrossRef]
  31. Yoon, J.Y.; Ahn, Y.; Schröder, U. Parlylene C-coated PDMS-based microfluidic microbial fuel cells with low oxygen permeability. J. Power Sources 2018, 398, 209–214. [Google Scholar] [CrossRef]
  32. Choi, T.; Park, N.N.; Ahn, Y. Planar co-laminar flow microbial fuel cell with flow-through porous electrodes. Int. J. Energy Res. 2021, 45, 14071–14079. [Google Scholar] [CrossRef]
  33. Zehnder, A.J.B.; Huser, B.A.; Brock, T.D.; Wuhrmann, K. Characterization of an acetate-decarboxylating, non-hydrogen-oxidation methane bacterium. Arch. Microbiol. 1980, 124, 1–11. [Google Scholar] [CrossRef] [PubMed]
  34. Rozendal, R.A.; Jeremiasse, A.W.; Hamelers, H.V.M.; Buisman, C.J.N. Hydrogen production with microbial biocathode. Environ. Sci. Technol. 2008, 42, 629–634. [Google Scholar] [CrossRef] [PubMed]
  35. Cheng, S.; Liu, H.; Logan, B. Power densities using different cathodic catalysts (Pt and CoTMPP) and polymer binders (Nafion and PTFE) in single chamber microbial fuel cells. Environ. Sci. Technol. 2006, 40, 364–369. [Google Scholar] [PubMed]
  36. Gandu, B.; Rozenfeld, S.; Hirsch, L.O.; Schechter, A.; Cahan, R. Immobilization of bacterial cells on carbon-cloth anode using alginate for hydrogen generation in a microbial electrolysis cell. J. Power Sources 2020, 455, 227986. [Google Scholar] [CrossRef]
  37. Liu, H.; Grot, S.; Logan, B.E. Electrochemically assisted microbial production of hydrogen from acetate. Environ. Sci. Technol. 2005, 39, 4317–4320. [Google Scholar] [CrossRef] [PubMed]
Figure 1. Schematic diagram of the proposed microbial electrolysis cell.
Catalysts 16 00615 g001
Figure 2. Start-up current density profiles under (a) different applied voltages at a flow rate of 0.01 mL min−1 and (b) different flow rates at an applied voltage of −0.9 V.
Catalysts 16 00615 g002
Figure 3. Polarization and power density curves for different electrode types.
Catalysts 16 00615 g003
Figure 4. Current density profiles of the microbial electrolysis cell under different catalyst conditions.
Catalysts 16 00615 g004
Table 1. Biocathode microbial electrolysis cell performance at various applied voltages.
Voltage [V]Current Density (Areal)
[A m−2]
Volume of H2 Production
[×10−14 m3 s−1]
Maximum H2 Production Rate
[m3 m−3 d−1]
pH
0.500.10 ± 0.0147.34 ± 1.0836.41 ± 0.9467.41 ± 0.058
0.650.11 ± 0.0138.77 ± 0.9747.66 ± 0.8507.44 ± 0.071
0.800.17 ± 0.03412.8 ± 2.6911.2 ± 2.347.75 ± 0.059
Table 2. Biocathode microbial electrolysis cell performance at various flow rates.
Flow Rate
[mL min−1]
Current Density (Areal)
[A m−2]
Volume of H2 Production
[×10−14 m3 s−1]
Maximum H2 Production Rate
[m3 m−3 d−1]
pH
0.0100.17 ± 0.03412.8 ± 2.6911.2 ± 2.3447.75 ± 0.059
0.0500.22 ± 0.09417.0 ± 7.2514.8 ± 6.3287.78 ± 0.229
0.0750.063 ± 0.0074.88 ± 0.5484.26 ± 0.4787.32 ± 0.027
0.1000.063 ± 0.0154.86 ± 1.1854.24 ± 1.0347.11 ± 0.059
Table 3. Microbial electrolysis cell performance under various catalyst conditions.
TypeCurrent Density (Areal)
[A m−2]
Volume of H2 Production
[×10−14 m3 s−1]
Maximum H2 Production Rate
[m3 m−3 d−1]
Chemical Oxygen Demand Removal
[%]
Coulombic Efficiency
[%]
pH
Bioanode0.14 ± 0.03010.6 ± 2.369.22 ± 2.06212.6 ± 6.557.3 ± 2.007.36 ± 0.380
Biocathode0.22 ± 0.09417.0 ± 7.2514.8 ± 6.3318.5 ± 1.867.4 ± 1.407.78 ± 0.229
Bioanode/
platinum cathode
0.32 ± 0.04624.6 ± 3.5421.5 ± 3.0924.8 ± 7.498.2 ± 1.867.86 ± 0.049
Disclaimer/Publisher’s Note: The statements, opinions and data contained in all publications are solely those of the individual author(s) and contributor(s) and not of MDPI and/or the editor(s). MDPI and/or the editor(s) disclaim responsibility for any injury to people or property resulting from any ideas, methods, instructions or products referred to in the content.