1. Introduction
The pursuit of efficient, sustainable, and cost-effective methods for hydrogen production has driven extensive research into photocatalytic and electrocatalytic materials, particularly titanium dioxide (TiO
2) due to its chemical stability, low toxicity, and favorable band structure for water splitting and related reactions [
1,
2,
3,
4]. TiO
2 nanostructures, especially nanotube arrays, have attracted significant attention because their high surface area, tunable geometry, and directional electron transport can enhance charge separation and improve reaction kinetics [
5,
6,
7]. These characteristics make them promising materials for various applications, including photocatalysis, photoelectrochemical systems, sensors, and energy conversion devices. The ordered architecture produced through electrochemical anodization provides direct electron transport pathways and tunable morphological parameters such as tube length, diameter, and wall thickness, which strongly influence their electrochemical and photoelectrochemical behavior. Previous studies have demonstrated that modifying TiO
2 nanotubes with functional materials can significantly enhance their performance. For example, hybrid electrodes consisting of polyaniline encapsulated within highly ordered TiO
2 nanotube arrays have shown improved photoelectrochemical properties due to enhanced charge separation and conductivity. Similarly, TiO
2 nanotube arrays have been successfully employed as photoanodes in dye-sensitized solar cells using metal phthalocyanine dyes, where their well-organized morphology facilitates efficient electron transport and dye loading. These studies also highlight the influence of anodization conditions on the structural characteristics of the nanotubes, which is consistent with morphological and structural observations obtained from SEM and XRD analyses.
Despite these advantages, pristine TiO
2 exhibits limited electrical conductivity and a wide bandgap (~3.0–3.2 eV for anatase), which restricts visible light absorption and electrocatalytic efficiency [
8,
9]. Consequently, various strategies have been explored to modify TNTs, including thermal annealing, hydrogenation, heteroatom doping, and surface decoration with metals or metal oxides, each targeting specific limitations such as poor conductivity, slow charge transfer, and low density of active sites [
10,
11,
12].
Thermal annealing is a widely employed method to improve TiO
2 crystallinity, converting amorphous nanotubes into predominantly anatase or mixed-phase anatase-rutile structures [
13]. This process stabilizes the lattice and reduces defects that act as recombination centers, but its effect on electrocatalytic performance alone is often modest [
14]. In contrast, the hydrogenation of TNTs induces oxygen vacancies and Ti
3+ defect states, effectively introducing mid-gap states that enhance electrical conductivity and carrier density [
15,
16]. Hydrogenated TiO
2, often termed “black TiO
2,” exhibits improved charge transport and reduced cathodic Tafel slopes, yet the overpotential at high current densities and charge-transfer resistance may not decrease substantially if hydrogenation is applied in isolation [
17]. These observations highlight that bulk defect engineering through hydrogenation alone provides partial benefits, necessitating additional surface modifications to achieve significant electrocatalytic enhancement.
Surface decoration with copper species on TNTs represents a promising approach to augment catalytic activity by increasing the density of active sites and facilitating electron transfer [
18,
19,
20]. Copper, present as metallic Cu or CuO, forms intimate contacts with the TiO
2 surface, which can lower the energy barrier for hydrogen evolution and improve reaction kinetics [
21]. Experimental studies indicate that decorating hydrogenated TNTs with copper dramatically reduces overpotentials at relevant current densities and lowers charge-transfer resistance while maintaining high carrier densities [
12,
21]. The synergistic effect of hydrogenation and surface decoration emerges because hydrogenation enhances the intrinsic conductivity of TiO
2 and introduces defect states, while copper decoration provides additional catalytic centers and promotes charge separation. This dual strategy often surpasses the performance achievable by either method alone, demonstrating the importance of combining bulk and surface modifications for high-performance electrocatalysts.
Electrochemical studies of such modified TNTs have reported substantial improvements in hydrogen evolution reaction performance. For example, previous studies have shown that electrodes optimized through hydrogenation followed by copper decoration can exhibit overpotentials as low as ~ 102 mV at 10 mA.cm
−2 and ~ 550 mV at 100 mA.cm
−2 in alkaline media [
12,
21]. These findings highlight the beneficial role of defect engineering and metal decoration in enhancing the catalytic activity of TiO
2 nanotube-based electrodes. Surface analyses, including X-ray photoelectron spectroscopy, confirm the coexistence of metallic Cu and CuO species on the TiO
2 surface, which collectively facilitate electron transport and enhance the availability of active sites for catalysis [
20]. The structural versatility of TNTs, combined with defect engineering and metal decoration, allows fine-tuning of the electronic structure and surface chemistry, enabling tailored performance for electrocatalytic applications beyond water splitting, including energy storage, CO
2 reduction, and photoelectrochemical sensing [
22].
Overall, the synergistic modification of TNTs via hydrogenation and copper decoration provides a highly effective strategy for designing advanced electrocatalysts. This approach leverages the complementary roles of bulk defect engineering and surface catalytic enhancement to overcome the intrinsic limitations of TiO
2, producing electrodes with high conductivity, increased active site density, and improved charge transfer characteristics [
15]. The combined effects of these modifications are critical in pushing the boundaries of TiO
2-based nanomaterials toward practical, scalable, and efficient electrocatalytic devices. As the field progresses, further optimization of hydrogenation parameters, metal loading, and nanostructure morphology could unlock new levels of performance, establishing TNTs as a versatile platform for next-generation electrocatalytic applications [
22].
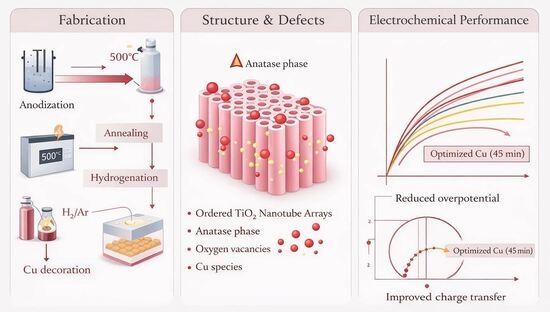
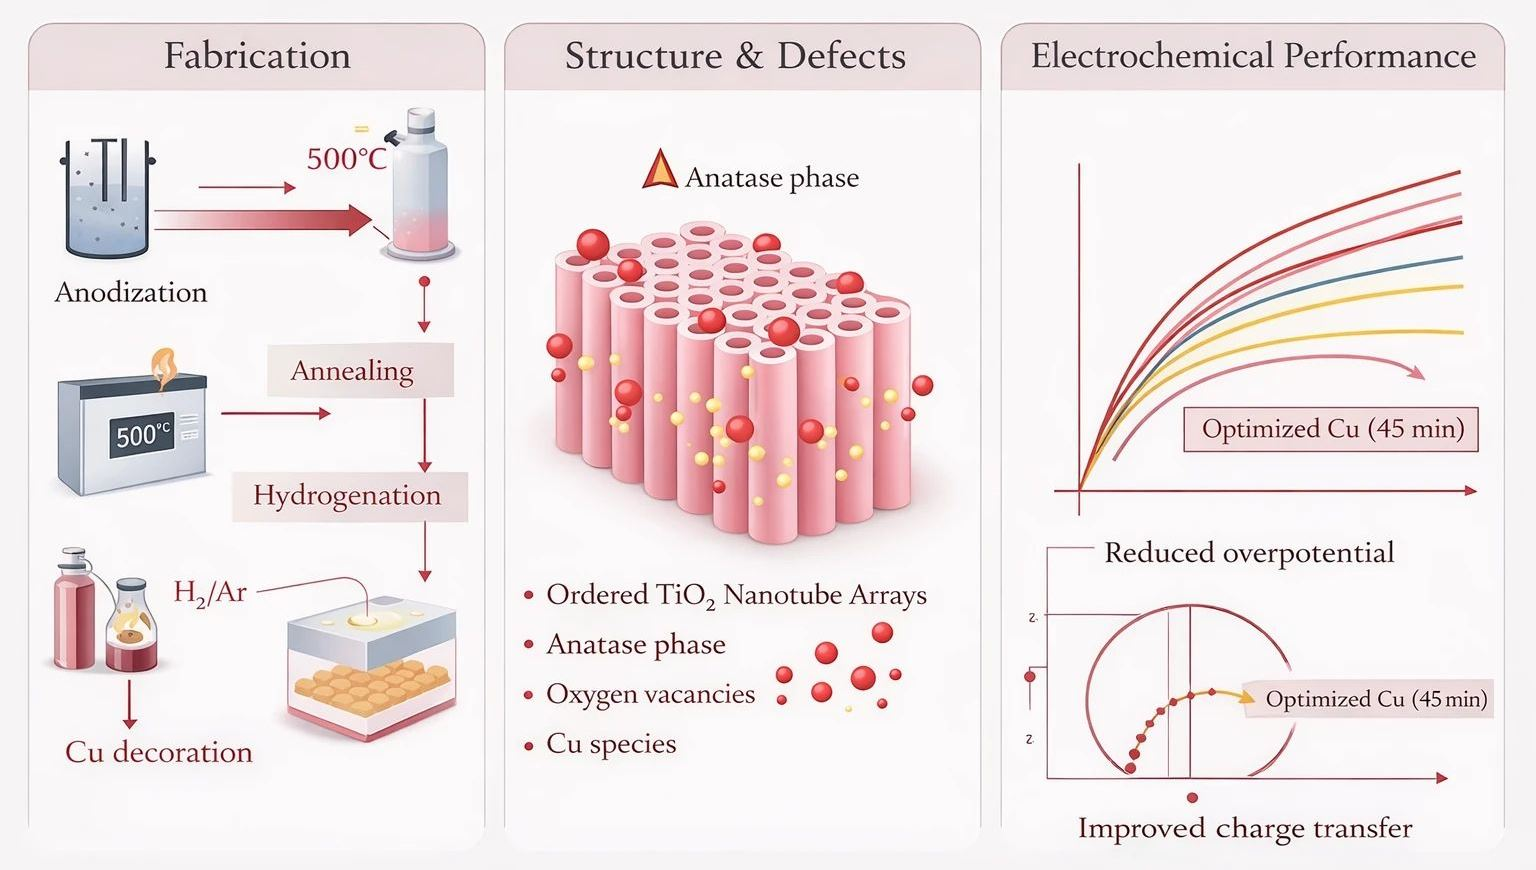
In previously reported studies, the modification of TiO2 nanotubes by hydrogenation and copper incorporation has been primarily investigated in the context of photocatalytic or photoelectrocatalytic applications. In contrast, the present work focuses exclusively on the electrocatalytic performance of TiO2 nanotube arrays toward the hydrogen evolution reaction (HER). Specifically, this study advances beyond earlier reports by systematically combining hydrogenation treatment with copper decoration to tailor both the electronic structure and the surface chemistry of TiO2 nanotubes for HER activity. The hydrogenation process introduces defect states and improves electrical conductivity, while the subsequent copper decoration provides additional catalytic active sites and facilitates charge transfer at the electrode–electrolyte interface. Through this synergistic strategy, the density of active sites and the overall catalytic efficiency are enhanced. Therefore, this work provides a distinct electrocatalytic perspective and contributes to a deeper understanding of how coupled bulk and surface modifications of TiO2 nanotube arrays can be utilized to improve HER performance in alkaline media.
The objective of this study is to systematically investigate the combined effects of hydrogenation and copper-based surface decoration on the electrocatalytic performance of TNT arrays. While thermal annealing primarily promotes crystallinity with limited impact on electrocatalytic activity, hydrogenation introduces oxygen vacancies and Ti3+ defect states, enhancing charge carrier density and modifying the cathodic Tafel slope. However, hydrogenation alone provides only minor improvements at high current densities. Therefore, this work aims to evaluate how the synergistic integration of bulk defect engineering through hydrogenation and surface catalytic modification via copper species can optimize overpotential, charge-transfer resistance, and overall electrocatalytic efficiency. By comparing annealed, hydrogenated, and copper-decorated hydrogenated TNTs, the study seeks to elucidate the underlying mechanisms responsible for enhanced electrocatalytic activity and provide insights for designing high-performance TiO2-based electrocatalysts for energy conversion applications.
2. Results and Discussion
2.1. X-Ray Diffraction Analysis of the Specimens After Electrochemical Anodization
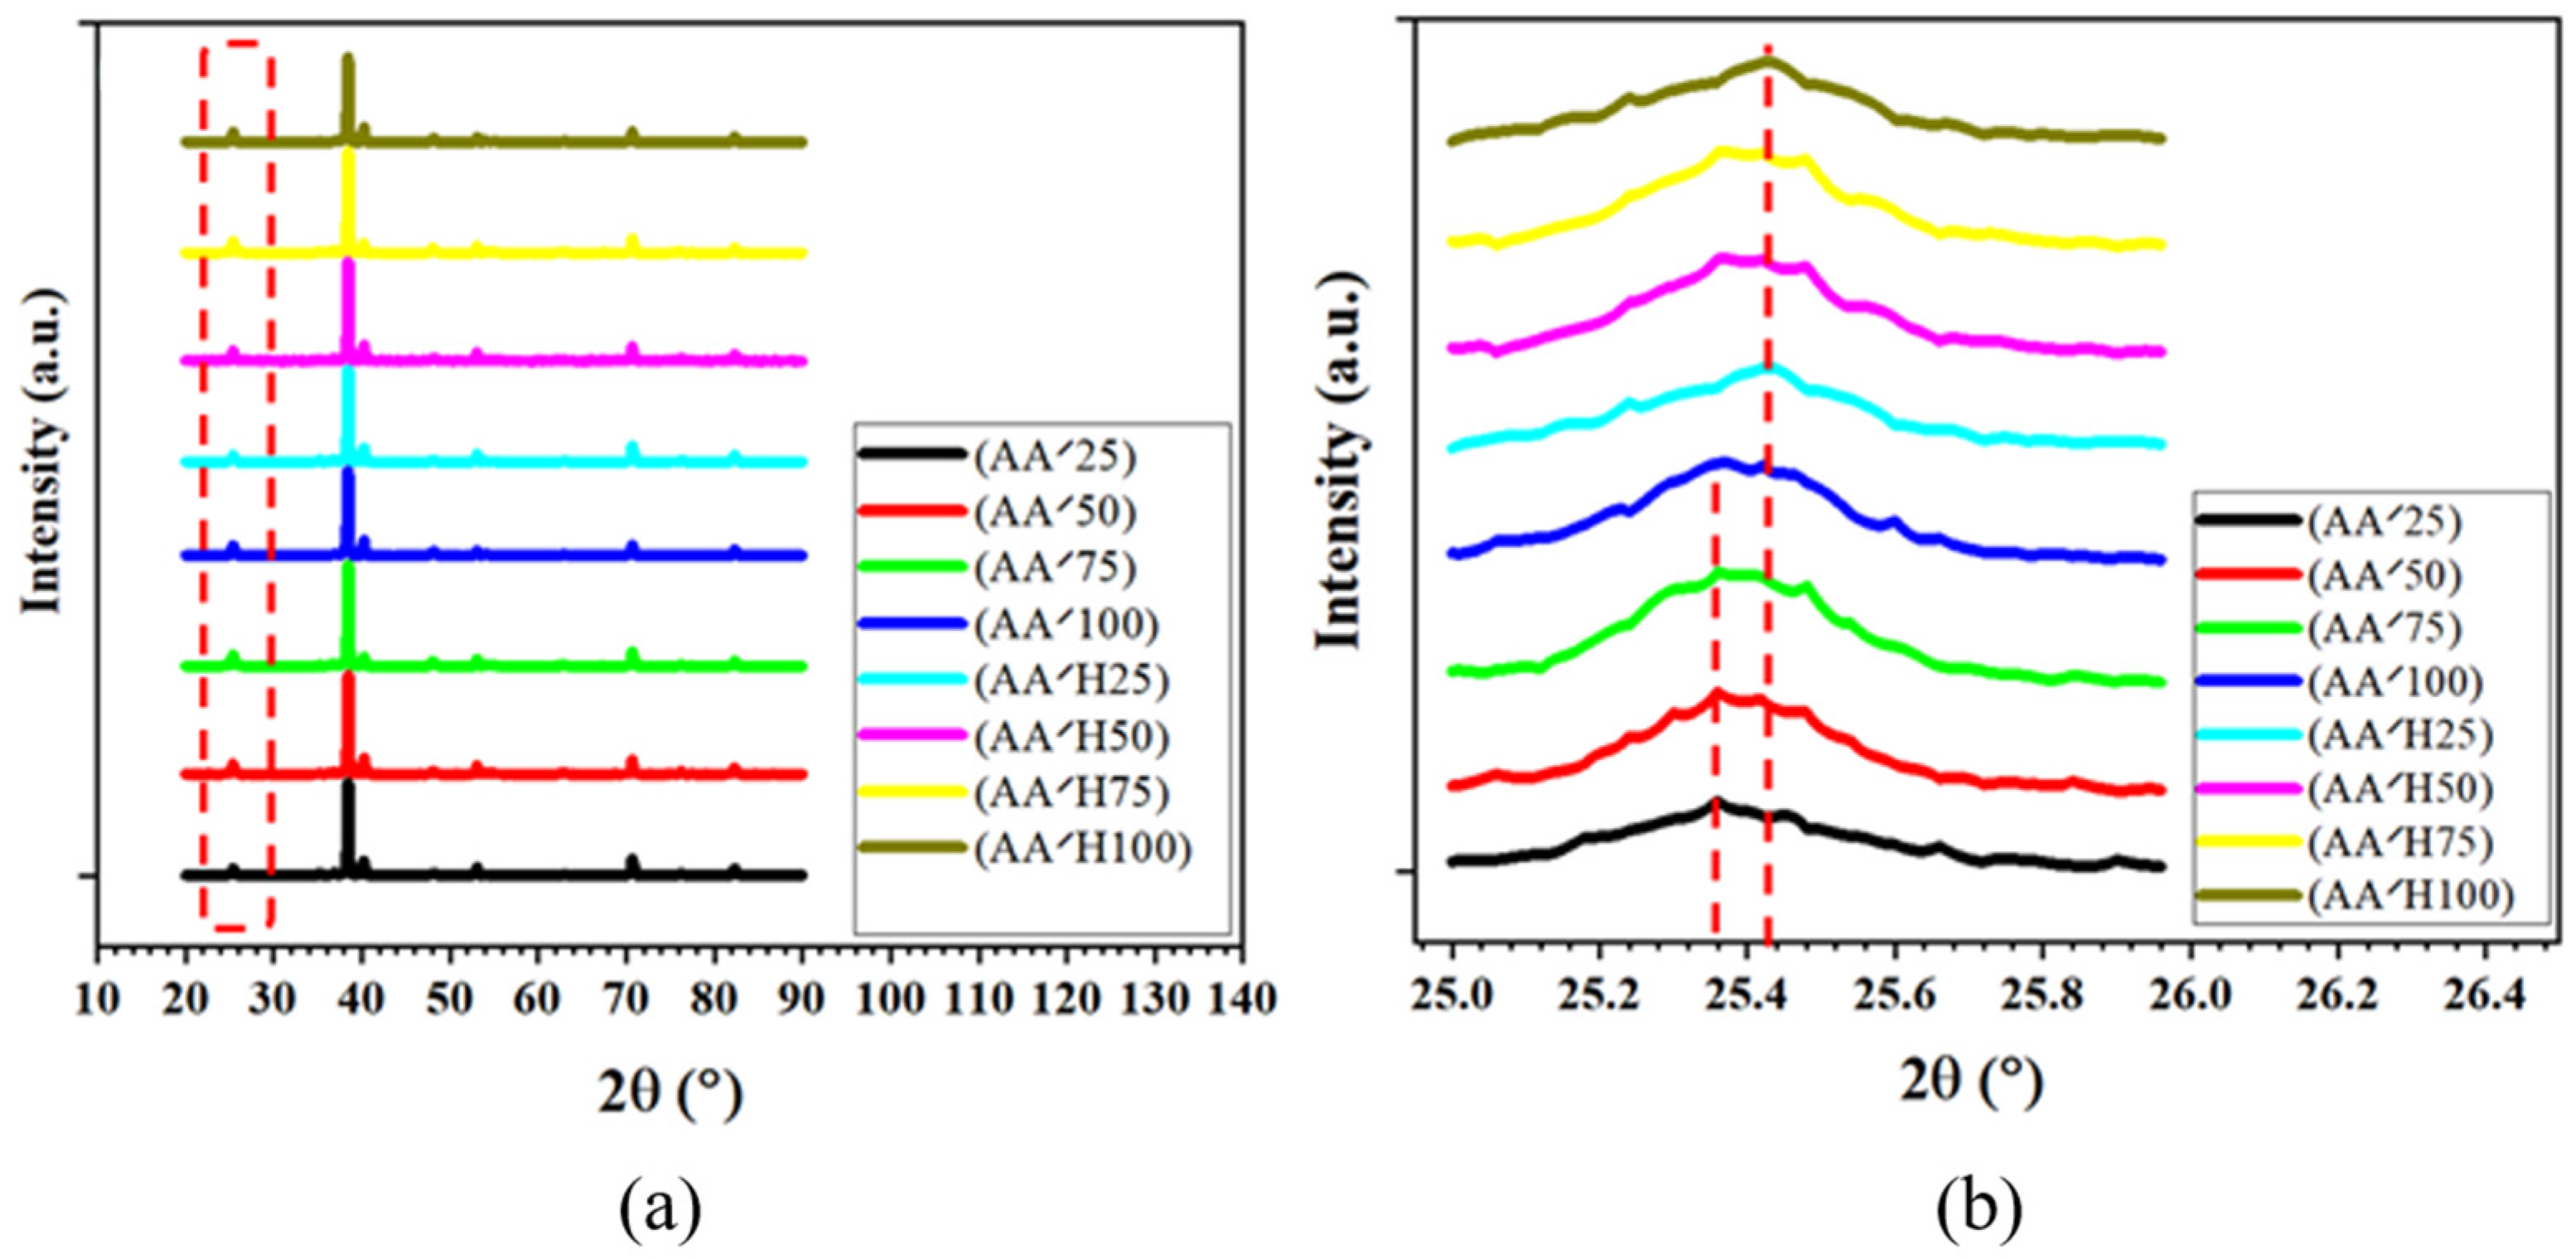
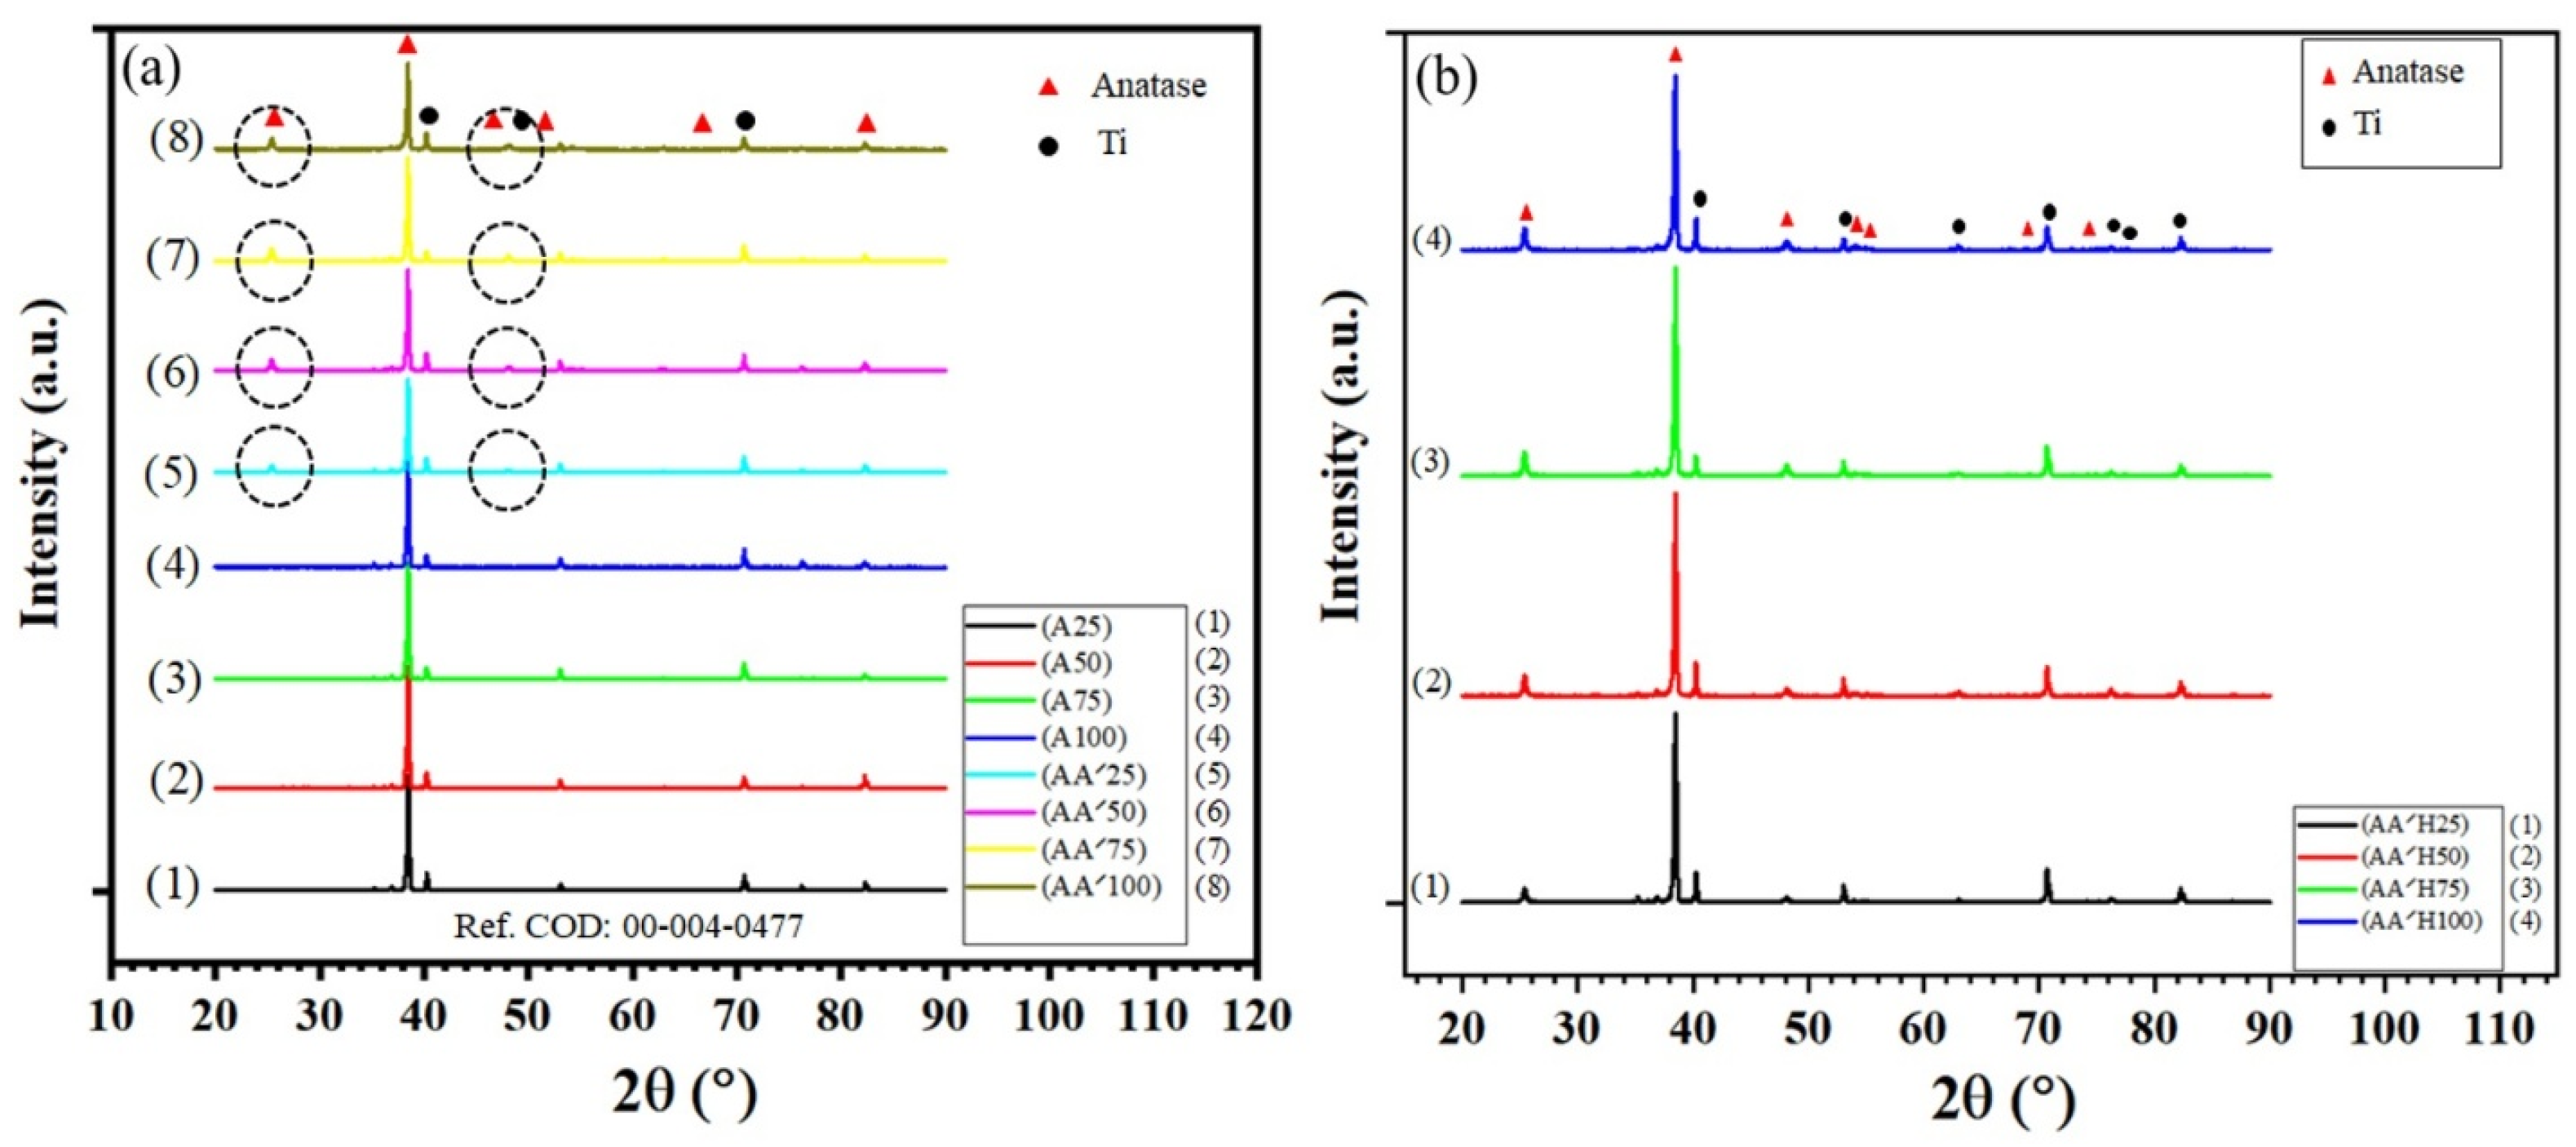
To determine the crystalline phase of the TNTs, XRD analysis was carried out at different stages of the fabrication process. According to
Figure 1a, the XRD patterns of the electrochemically anodized specimens prepared at various anodization times reveal that all detected diffraction peaks correspond to metallic titanium, while no characteristic peaks related to TiO
2 are observed, indicating that the as-anodized TNTs are predominantly amorphous. To induce crystallization, the anodized specimens were subsequently subjected to thermal annealing at 450 °C for 1 h. After this heat treatment, XRD analysis was repeated for the annealed specimens anodized for different durations. In contrast to the as-anodized state, the post-annealing XRD patterns exhibit several additional diffraction peaks at 2θ values of 25.35°, 38.50°, 48.07°, 53.90°, 55.11°, 68.59°, and 76.08°, in addition to the peaks associated with the titanium substrate. These newly emerged peaks can be indexed to the (101), (112), (200), (105), (211), (116), and (301) crystallographic planes of the anatase phase of TiO
2. The appearance of these characteristic reflections clearly confirms that thermal annealing at the specified temperature effectively transforms the TNTs from an amorphous structure into a crystalline anatase phase. After the hydrogenation heat treatment, XRD analysis was performed again on the specimens. As shown in
Figure 1b, no new diffraction peaks are observed, indicating that the anatase phase remains unchanged and structurally stable after this treatment. However, since the hydrogenation process is intended to generate oxygen vacancy defects, a slight deviation from oxygen stoichiometry is expected, even if only to a very small extent. According to Bragg’s law, such a reduction in oxygen content can lead to a decrease in the interplanar spacing, which consequently results in a subtle shift in the diffraction peaks toward higher angles; see
Figure 2.
Table 1 presents a quantitative comparison of the XRD parameters of the TiO
2 nanotube samples before and after hydrogenation. The analysis includes the diffraction peak position (2θ), full width at half maximum (FWHM), calculated interplanar spacing (d spacing), and the corresponding lattice parameters. The d spacing values were calculated using Bragg’s law, while the lattice parameters were estimated based on the tetragonal crystal structure of anatase TiO
2. A slight shift in the diffraction peaks toward lower 2θ values is observed after hydrogenation, indicating a small expansion of the lattice that may be attributed to the introduction of defects and oxygen vacancies during the hydrogenation process. Additionally, the slight increase in FWHM for the hydrogenated samples suggests increased lattice distortion or reduced crystallite coherence length. These structural modifications are consistent with the formation of defect-rich TiO
2, which can enhance the electrical conductivity and contribute to improved electrocatalytic activity toward the hydrogen evolution reaction (HER).
The observed diffraction peaks were indexed according to the standard anatase TiO2 phase and matched with the reference data from the JCPDS/ICDD database (card No. 21 1272). The characteristic diffraction peaks corresponding to the (101), (004), (200), (105), and (211) crystallographic planes were clearly identified, confirming the formation of the anatase phase. No additional peaks related to secondary phases were detected, indicating the high phase purity of the synthesized TiO2 nanotubes. The comparison with the standard reference pattern further confirms that the anodization and subsequent treatment processes did not alter the fundamental crystal structure of TiO2.
2.2. FE-SEM Analysis of the Specimens After Electrochemical Anodization
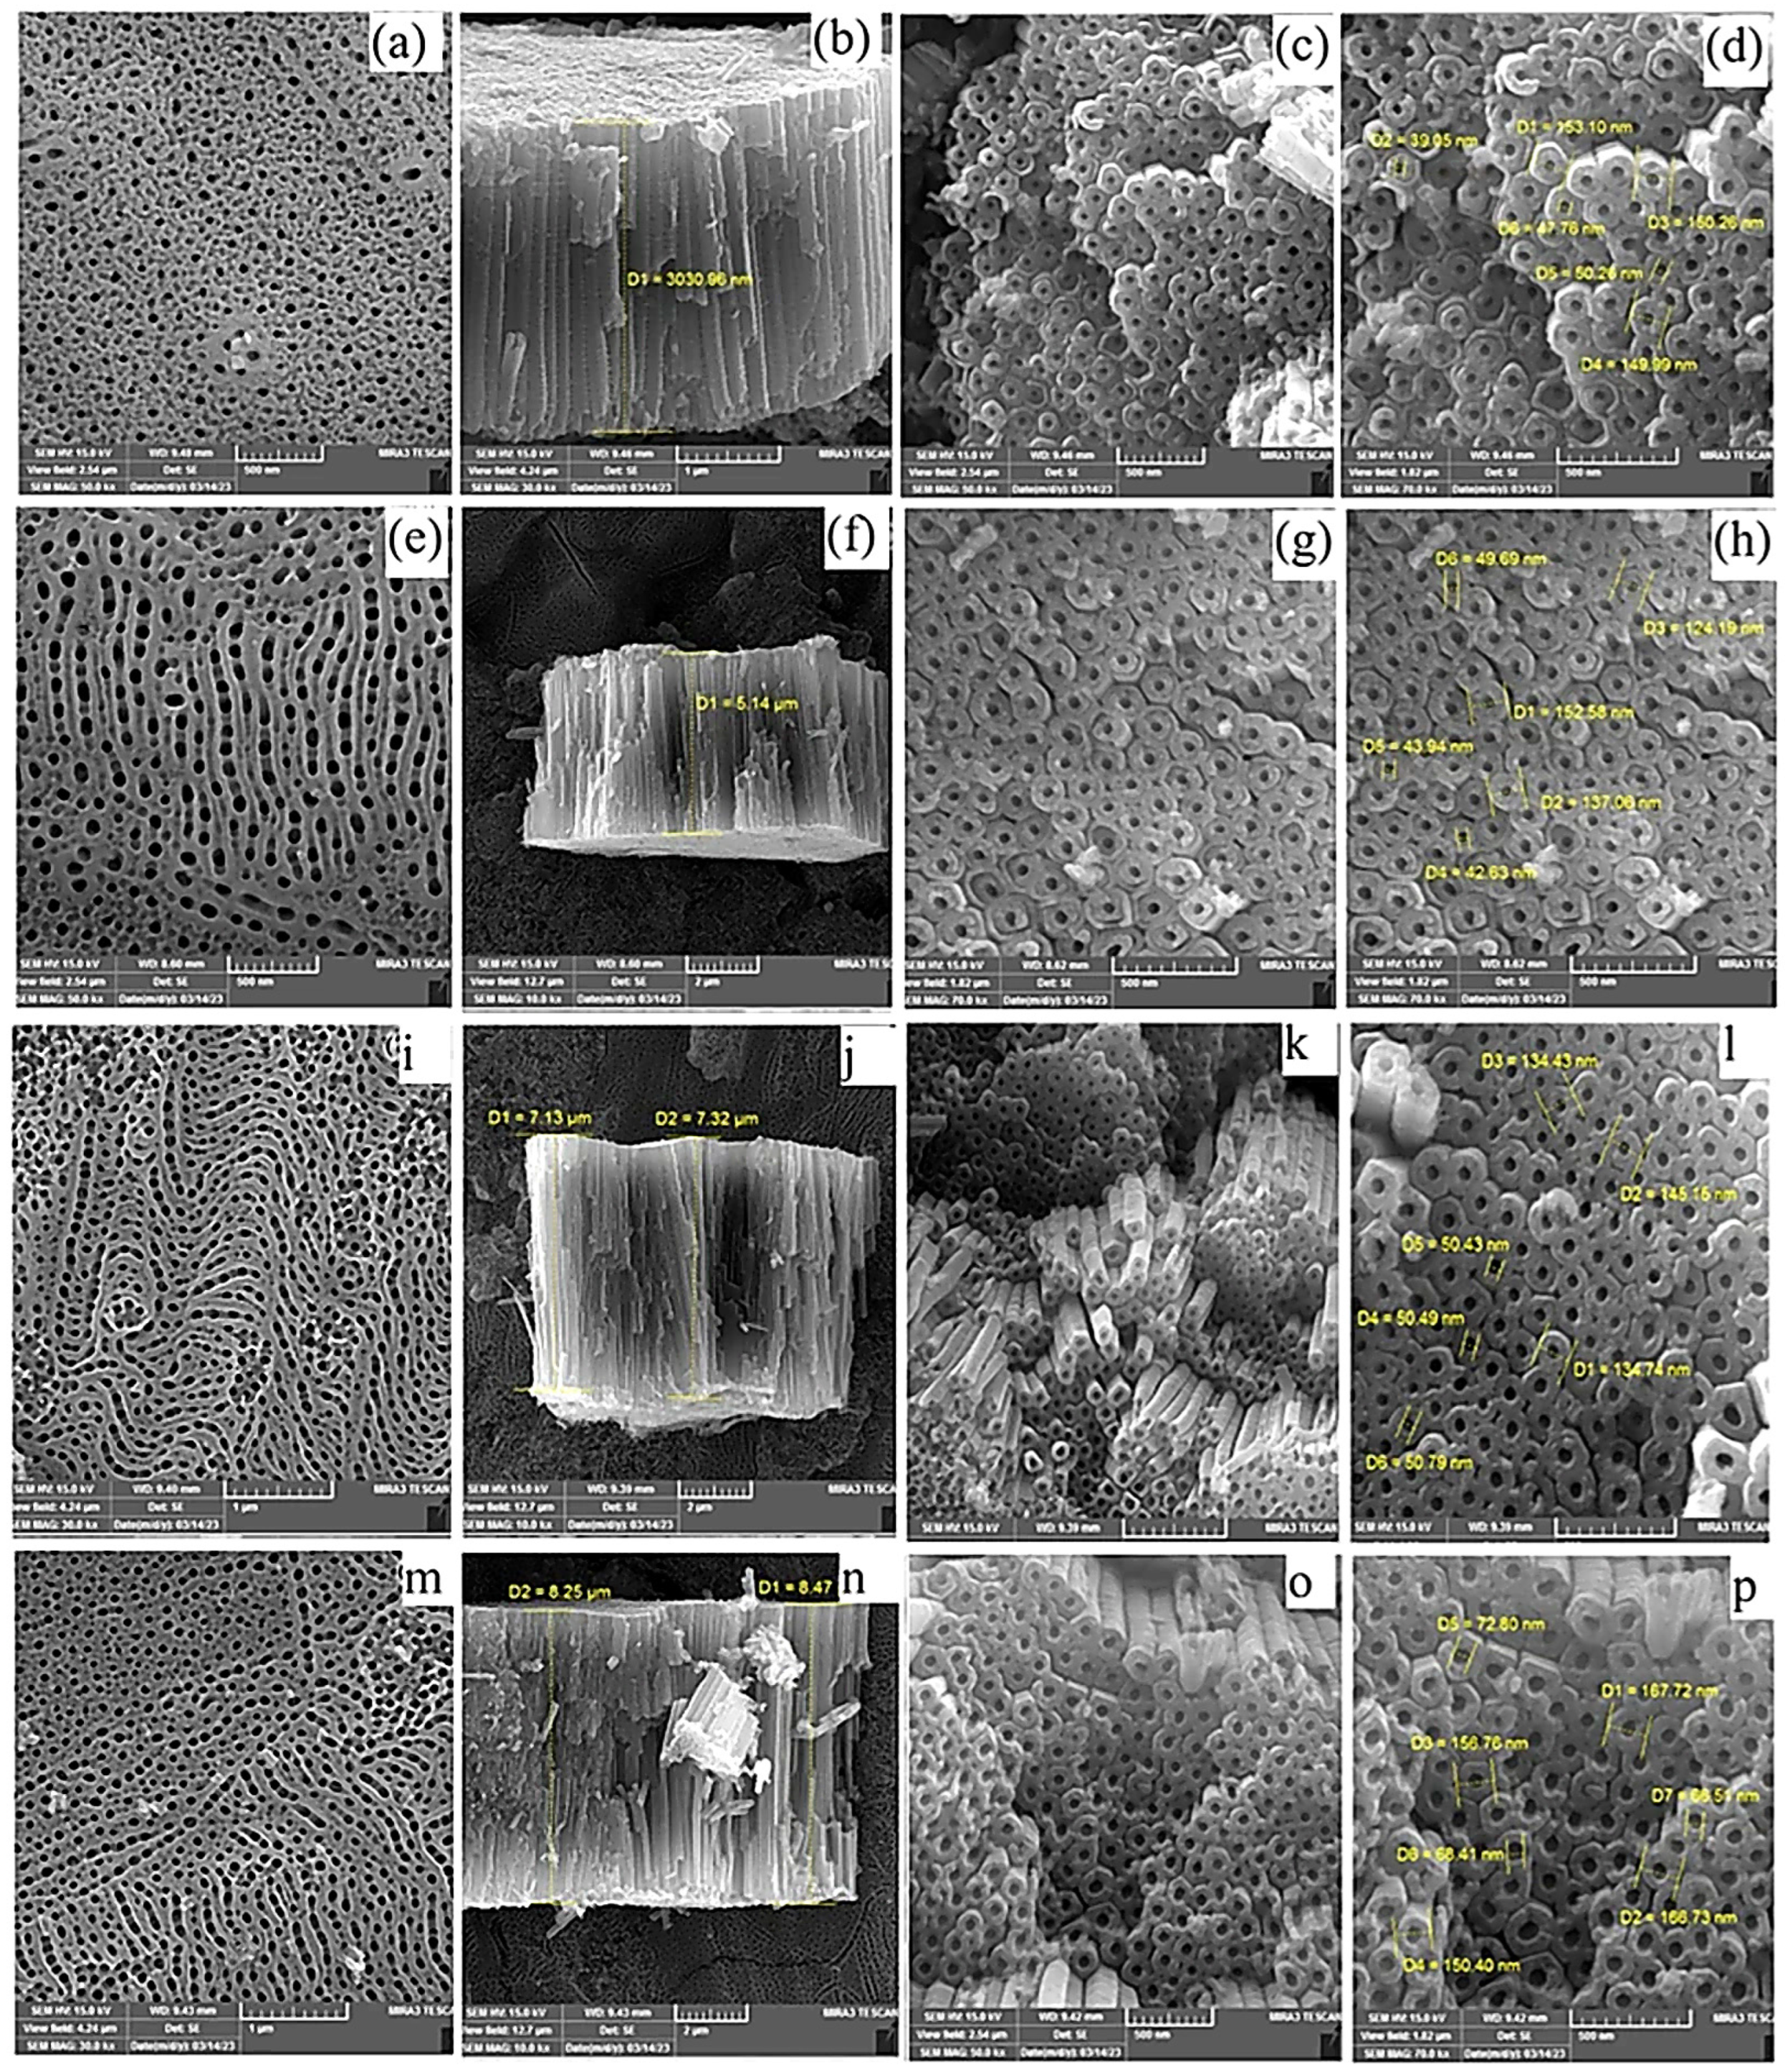
FE-SEM images were employed to examine the morphology of TNT arrays formed after electrochemical anodization followed by thermal annealing at different anodization times, as illustrated in
Figure 3a–p. The images clearly confirm the successful formation of highly ordered and vertically aligned TNTs for all specimens. The top-view images reveal a uniform and densely packed nanotubular structure with well-defined and open tube mouths, indicating homogeneous oxide growth over the titanium substrate. Cross-sectional images further demonstrate that the nanotubes are vertically oriented and firmly anchored to the substrate, forming continuous and mechanically stable layers. In addition, the scratched-region views provide clear evidence of the structural integrity of the nanotube arrays and allow reliable measurement of the nanotube lengths. A comparison of the FE-SEM images before and after thermal annealing shows that the annealing treatment does not cause any noticeable changes in nanotube morphology, shape, or alignment. The nanotube walls remain smooth and intact, and no collapse, cracking, or sintering effects are observed, indicating that the annealing conditions are appropriate for preserving the nanotubular architecture while enabling phase transformation.
Quantitative analysis of the nanotube dimensions, summarized in
Table 2, reveals a clear dependence of nanotube length on anodization time. The average nanotube length increases progressively from approximately 3.03 μm for the specimen anodized for 25 min to about 8.36 μm for the specimen anodized for 100 min, which is in good agreement with previously reported results [
23]. This increase can be attributed to sustained oxide growth and prolonged field-assisted dissolution during extended anodization. In contrast, the average inner diameter and wall thickness of the nanotubes show only slight variations with anodization time, suggesting that these parameters are mainly controlled by the applied voltage and electrolyte composition rather than anodization duration. Overall, the results indicate that thermal annealing has a negligible influence on the morphological features and dimensional characteristics of the TNTs and primarily serves to convert the amorphous nanotubes into the crystalline anatase phase, which is known to exhibit superior photocatalytic and electrocatalytic performance.
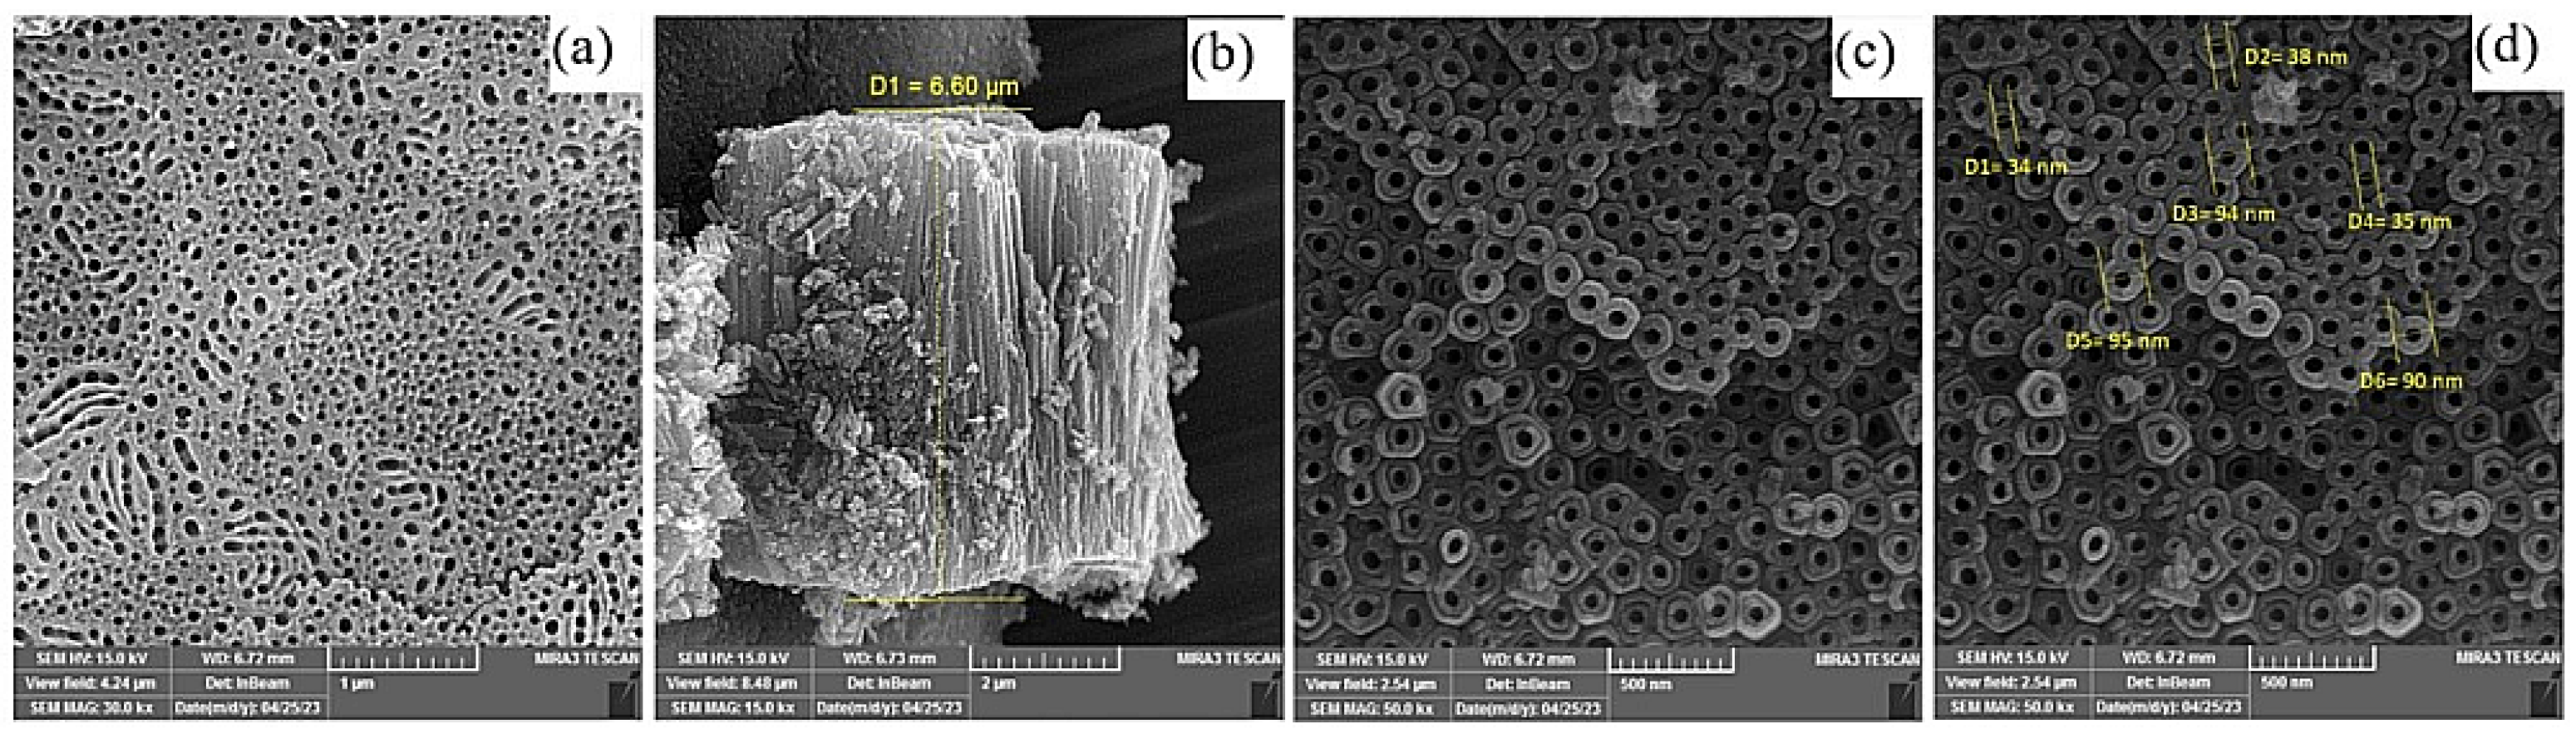
To avoid an excessive number of SEM images, only
Figure 4a–d, corresponding to different views, are presented for the specimen anodized for 75 min after thermal annealing and subsequent hydrogenation heat treatment. The images clearly indicate that the morphology of the nanotubes is altered after hydrogenation. Specifically, due to the reaction between hydrogen and oxygen, nanotubes that previously exhibited relatively smooth side surfaces now show a noticeably roughened surface. Furthermore, by comparing
Table 1 with
Table 3, it can be observed that the nanotube length decreases significantly after hydrogenation heat treatment. This reduction in length can be attributed to partial degradation of the nanotube structure induced by the hydrogenation process.
2.3. Raman Spectroscopy Analysis of Treated Specimens
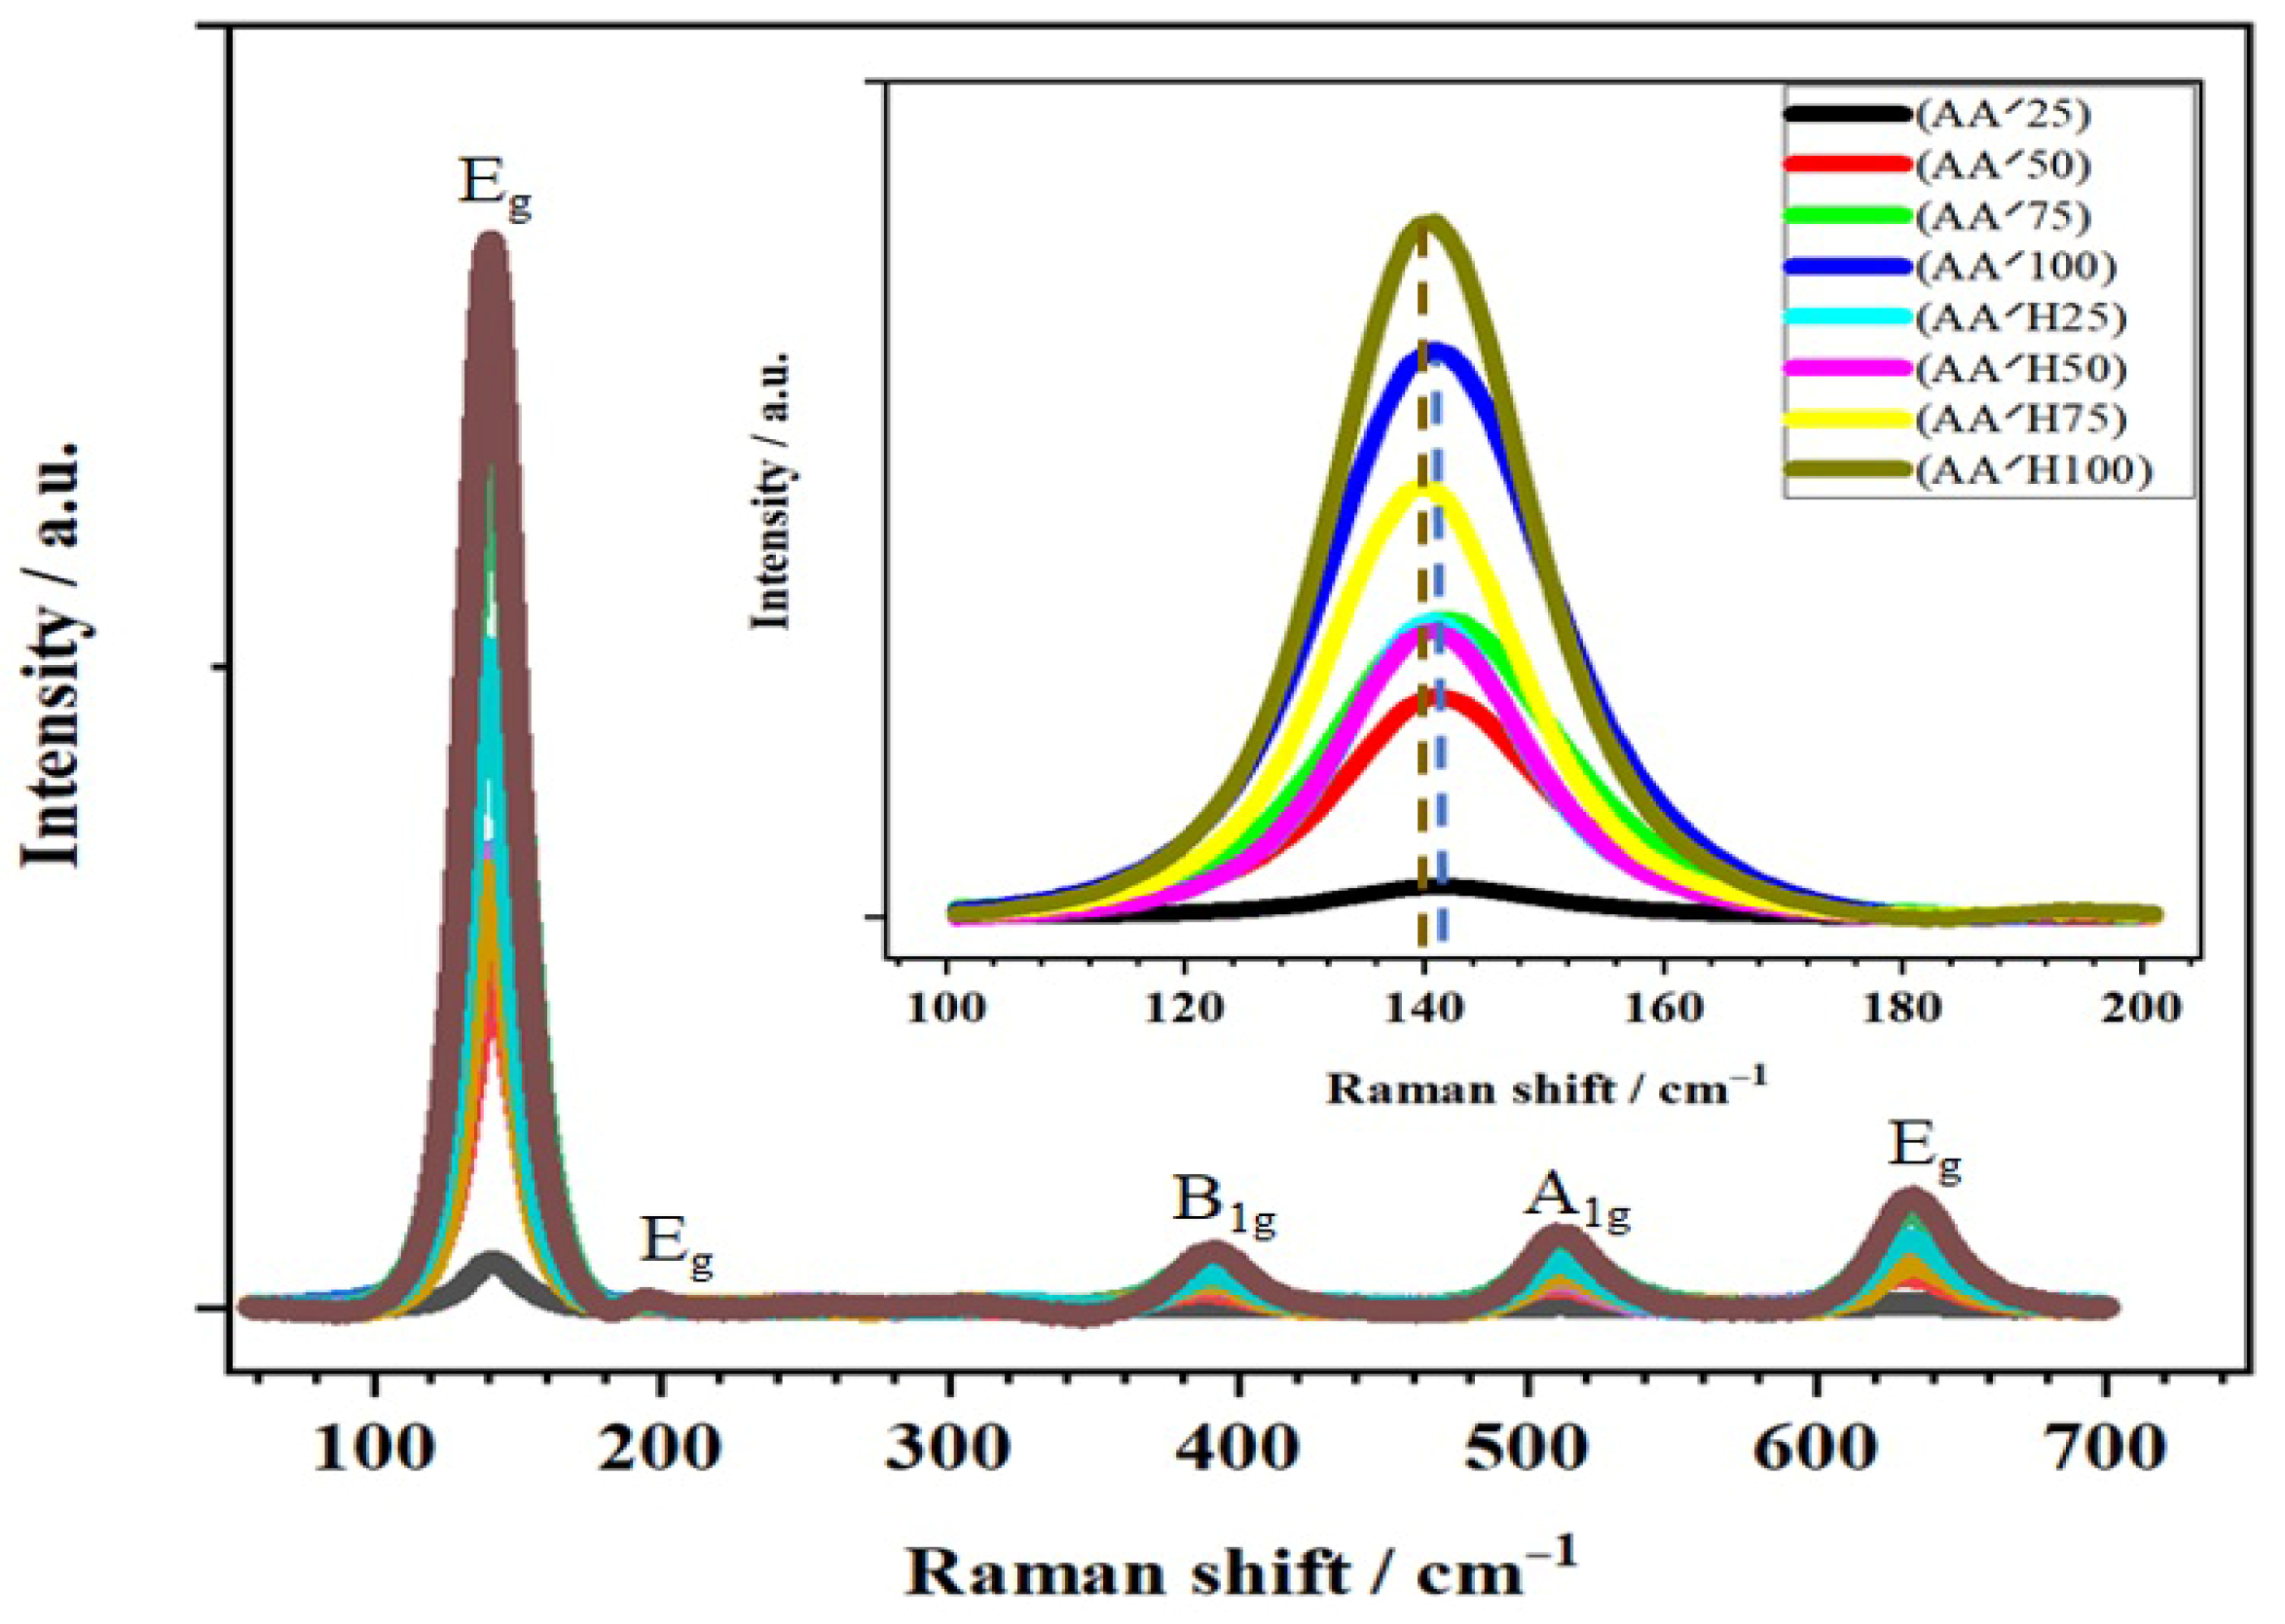
Figure 5 presents a comparative Raman analysis of the TNTs specimens after thermal annealing and subsequent hydrogenation. As observed in this comparative figure, all specimens exhibit the characteristic Raman modes of the tetragonal anatase phase, confirming that the crystal structure remains stable throughout both heat treatments [
24]. A comparison of peak intensities indicates that increasing the anodization time enhances the intensity of the anatase-related Raman peaks in both annealed and hydrogenated specimens, reflecting improved structural ordering. More importantly, the hydrogenated specimens consistently show higher peak intensities than their annealed counterparts, suggesting an additional increase in crystallinity induced by the hydrogenation process. Furthermore, a subtle shift in the Raman peaks toward lower wavelengths is evident in the hydrogenated specimens, which can be attributed to lattice distortion caused by the formation of defects such as oxygen vacancies. This shift is most pronounced for the AA′H75 specimen, indicating a higher defect density compared to the other specimens.
2.4. Electrochemical Analysis of the Treated Specimens
Based on
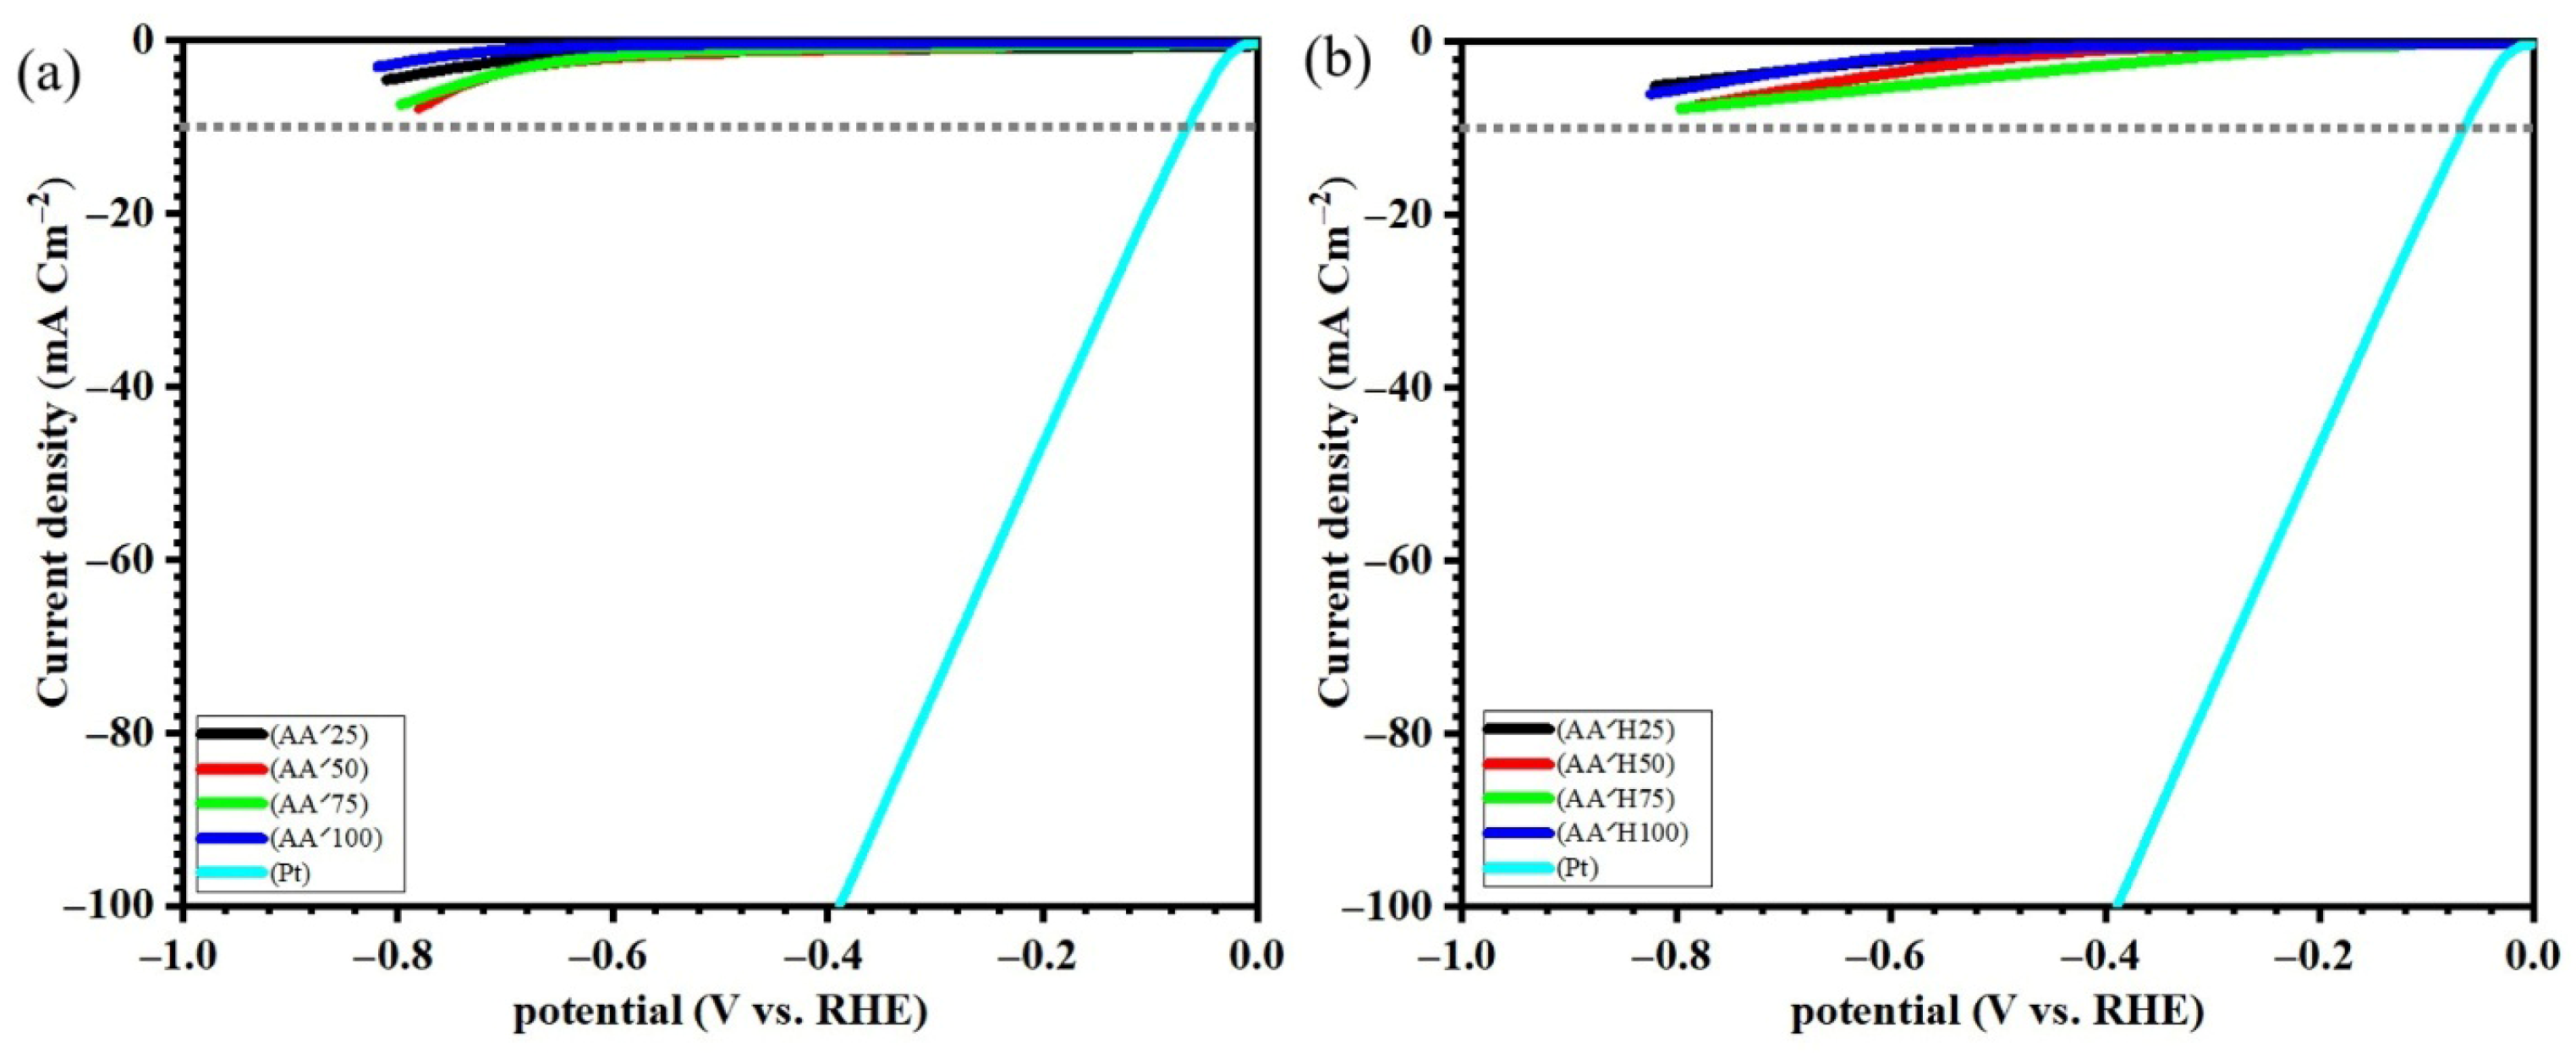
Figure 6a, which presents the LSV behavior of the thermally annealed specimens, it is observed that these specimens do not exhibit favorable electrochemical performance compared with the platinum reference electrode. Specifically, the overpotentials η
10 and η
100 are not clearly achieved, and the onset potentials of the specimens are significantly higher than that of platinum. Among the investigated specimens, AA′50 shows a lower onset potential compared to the others. Therefore, this test confirms that the studied specimens are not suitable for electrocatalytic applications. Moreover, based on
Figure 6b, which presents the LSV results of the hydrogen-treated specimens, it is observed that, similar to the thermally annealed specimens, they do not exhibit good electrochemical behavior when compared with the platinum reference electrode, as also reported by other researchers [
25]. In these specimens, the overpotentials η
10 and η
100 are not achieved at all. Although the onset potentials of the specimens remain significantly higher than that of platinum, their performance is noticeably improved compared to the thermally annealed specimens. Among the hydrogen-treated specimens, AA′H75 shows the lowest onset potential, and for this reason, it was selected as the optimal specimen for the subsequent stages. Therefore, this test confirms that the studied specimens experience a slight improvement in onset potential after hydrogen thermal treatment; however, they still lack the necessary characteristics of an efficient electrocatalyst.
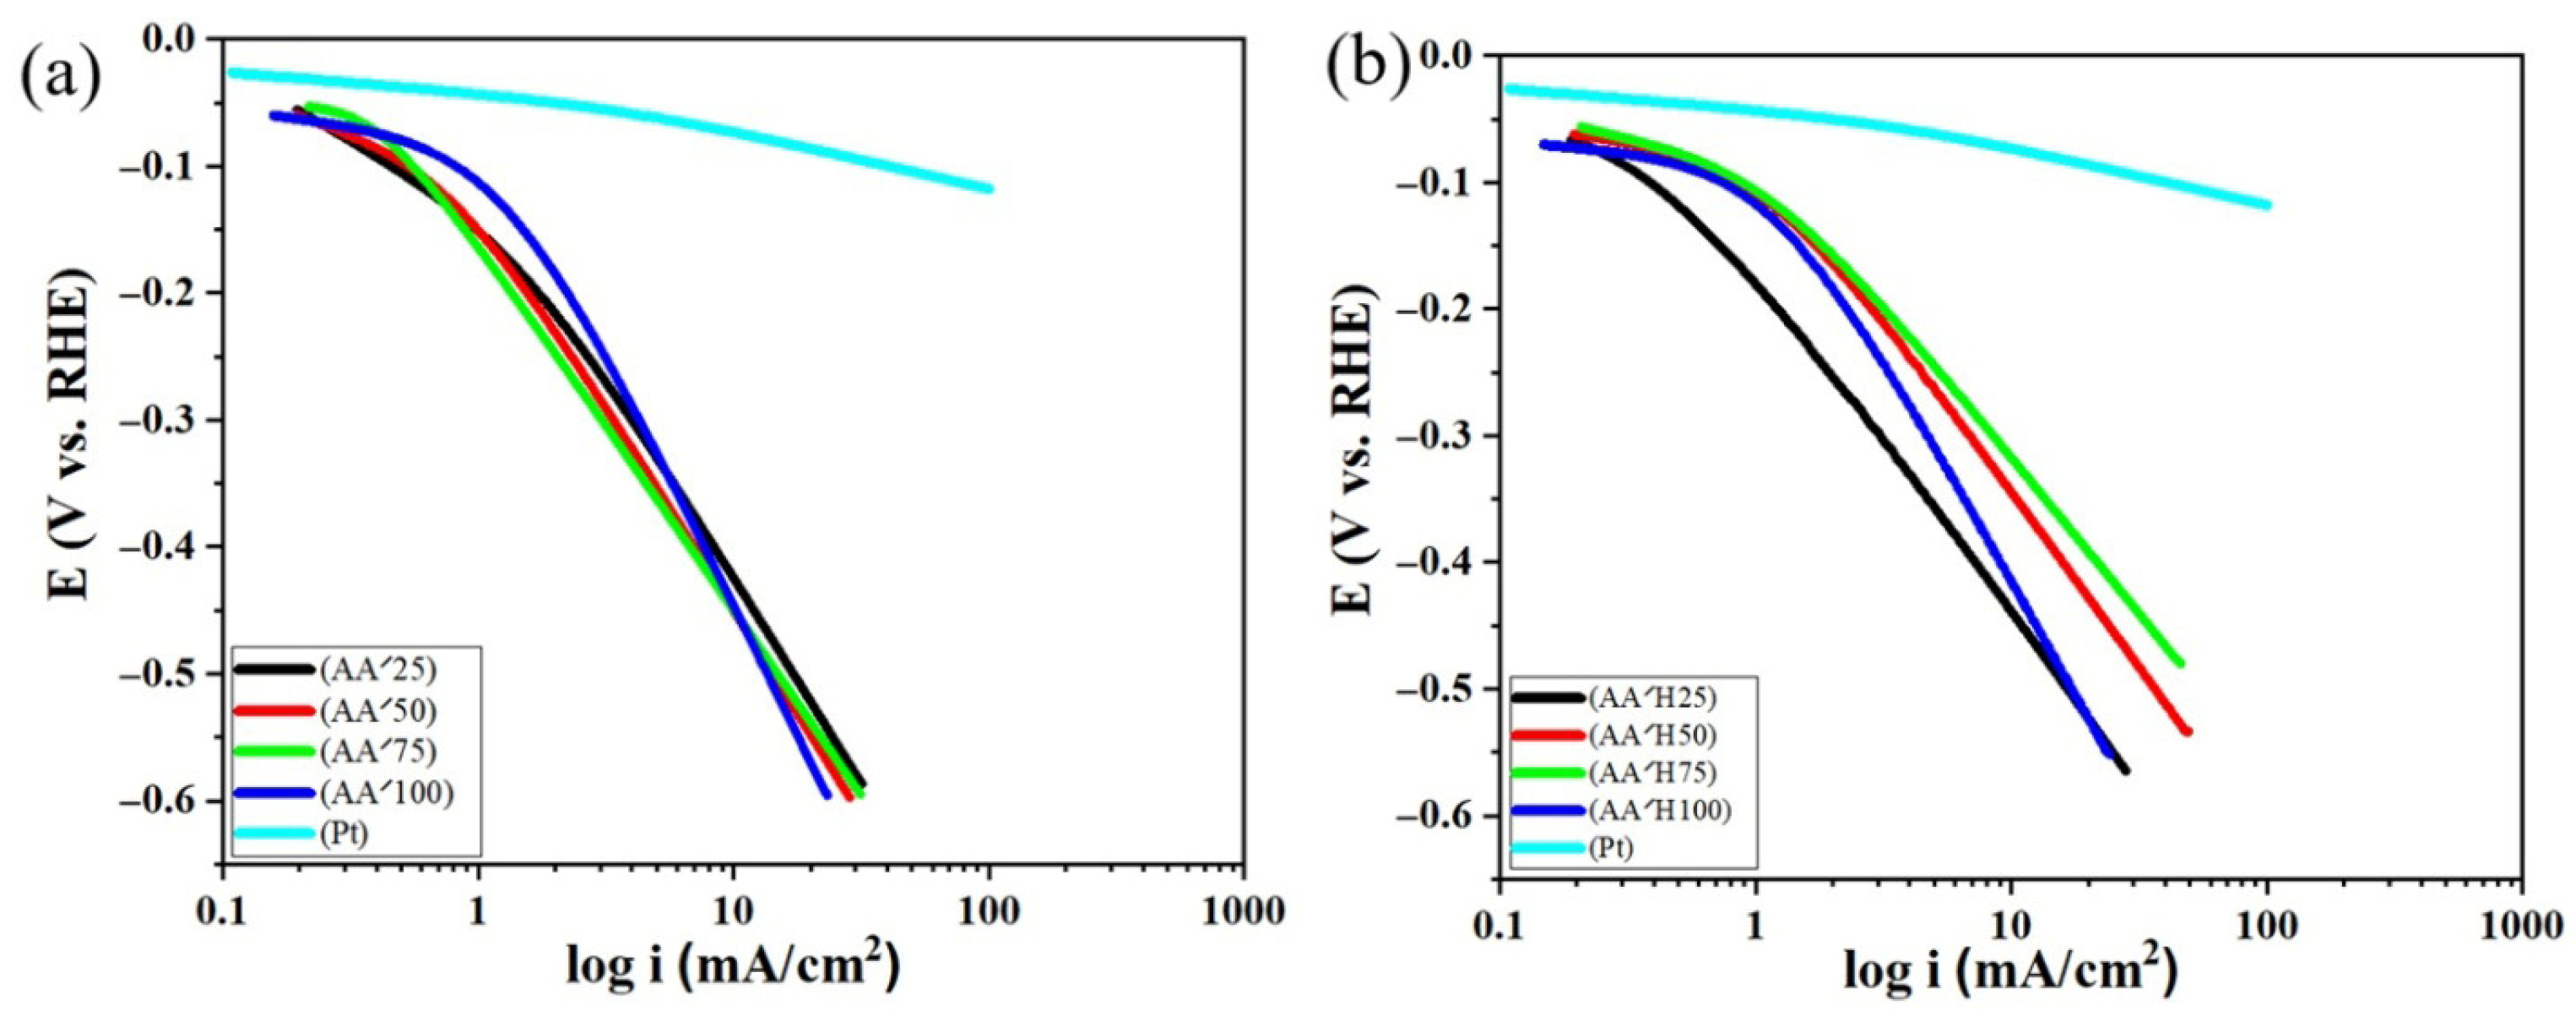
Figure 7a,b illustrate the potentiodynamic polarization curves of the anodized TNT electrodes subjected to different post-treatments, in comparison with a platinum reference electrode. As expected, the Pt electrode shows the most favorable electrochemical behavior, exhibiting a much lower overpotential and a significantly gentler cathodic branch over the entire current density range, which reflects its superior catalytic activity. In contrast, all TiO
2-based electrodes display higher overpotentials and steeper cathodic slopes, indicating slower reaction kinetics and limited electrocatalytic efficiency. A detailed comparison of the annealed specimens (AA′25–AA′100) reveals that thermal annealing has no pronounced influence on the cathodic slope, as the polarization curves of these specimens are closely clustered and show only minor differences, regardless of anodization time, which is consistent with the quantitative parameters reported in
Table 4. This suggests that although annealing transforms the amorphous nanotubes into the crystalline anatase phase, it does not substantially enhance charge-transfer kinetics. In contrast, the hydrogen-treated specimens (AA′H25–AA′H100) exhibit a noticeable, albeit modest, improvement in electrochemical performance, manifested by a slight reduction in the cathodic slope and a relative shift toward lower overpotentials compared with their annealed counterparts. Among these, the AA′H75 specimen demonstrates the lowest cathodic slope and the most favorable polarization behavior, indicating enhanced electron-transfer kinetics. This improvement is commonly attributed to hydrogen-induced modifications such as the generation of oxygen vacancies and other crystal defects, which increase charge-carrier density and electrical conductivity, together with a more optimal nanotube geometry.
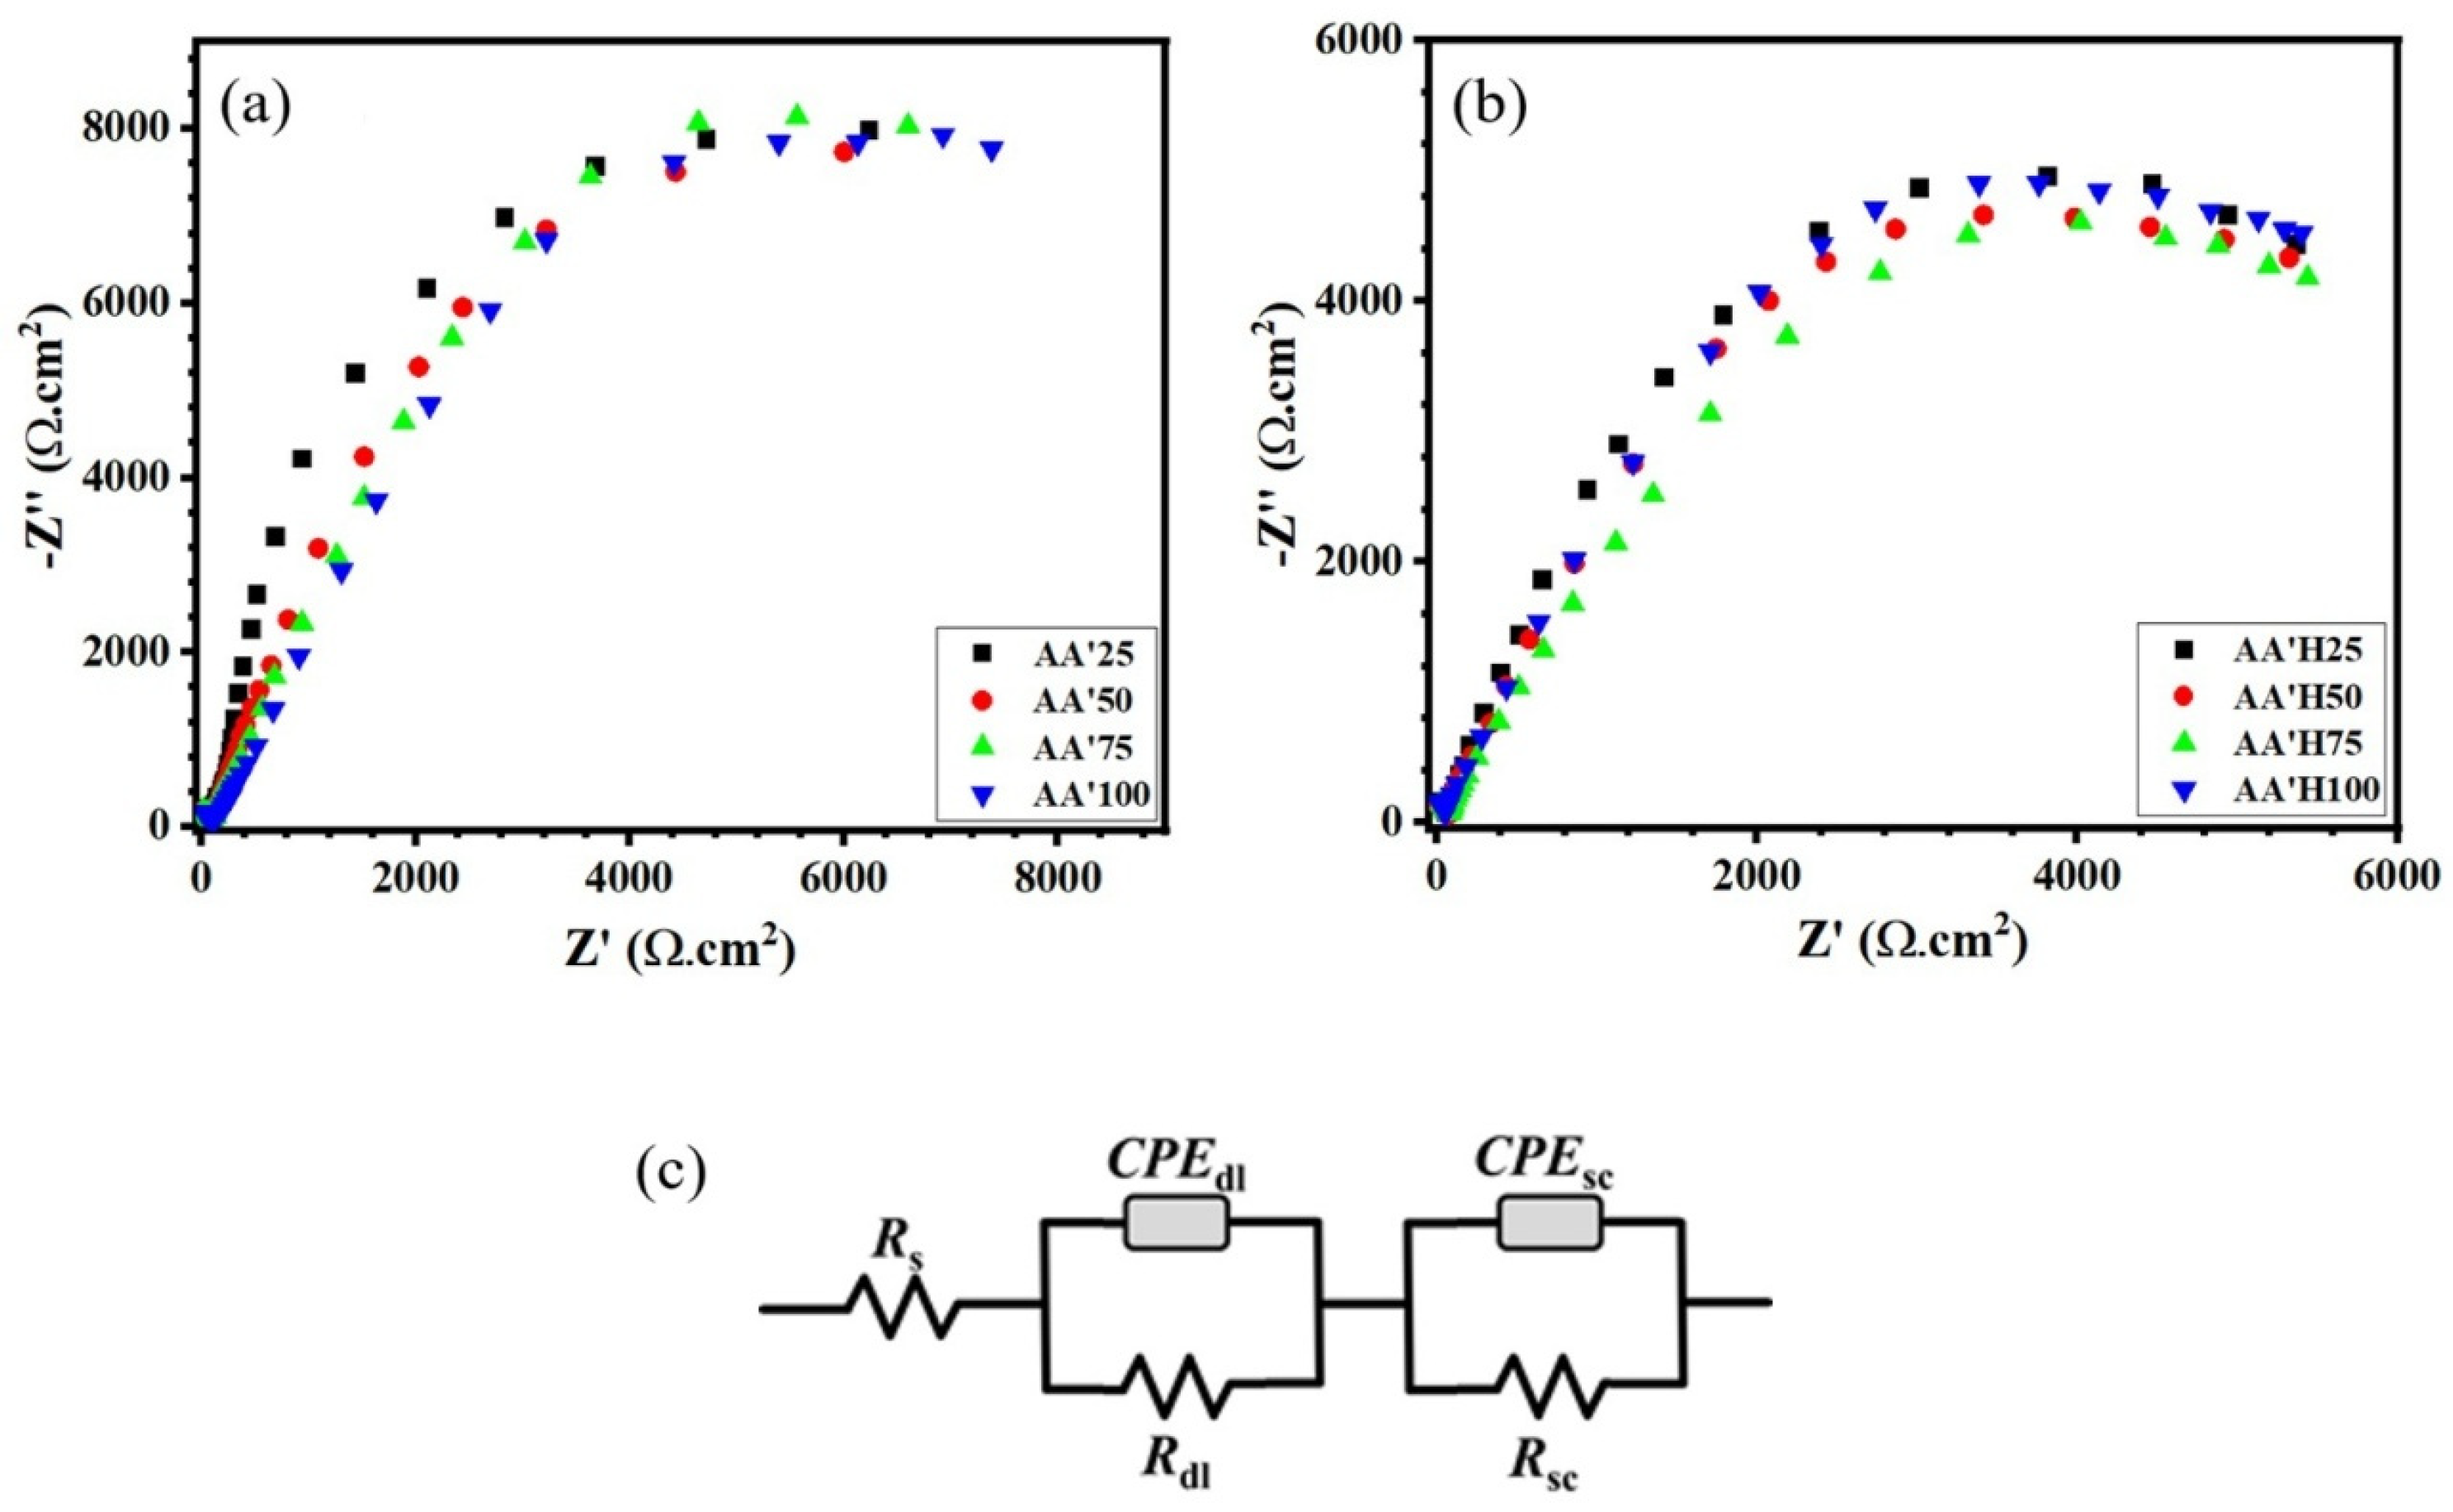
Figure 8 presents the Nyquist plots obtained from EIS measurements for the thermally annealed specimens, as shown in
Figure 8a; the hydrogenated specimen, as illustrated in
Figure 8b; and the experimental data fitted using the equivalent electrical circuit, as shown in
Figure 8c. In both cases, the Nyquist spectra are characterized by depressed semicircles, which are typically associated with charge-transfer processes at the electrode/electrolyte interface combined with capacitive behavior of the space-charge layer. A direct comparison between
Figure 8a, b clearly shows that the diameter of the Nyquist semicircle becomes noticeably smaller and more compact after the hydrogen thermal treatment. This reduction in semicircle size indicates a significant decrease in the charge-transfer resistance, which in turn reflects a lower space-charge layer resistance and enhanced interfacial charge transport. Consequently, the hydrogenation process effectively improves ionic and electronic conductivity, likely due to the introduction of oxygen vacancies and defect states that facilitate charge migration. According to the fitted parameters summarized in
Table 5 and
Table 6, among the annealed specimens shown in
Figure 8a, specimen AA′50 exhibits relatively lower charge-transfer resistance and better conductivity compared to the other annealed specimens. Similarly, in
Figure 8b, the hydrogenated specimen AA′H75 demonstrates the most favorable electrochemical behavior, showing the lowest resistance values and the highest charge-transfer efficiency among the hydrogen-treated specimens. Therefore, based on the EIS analysis, AA′H75 was therefore selected as the optimal specimen for subsequent chemical decoration and further electrochemical investigations.
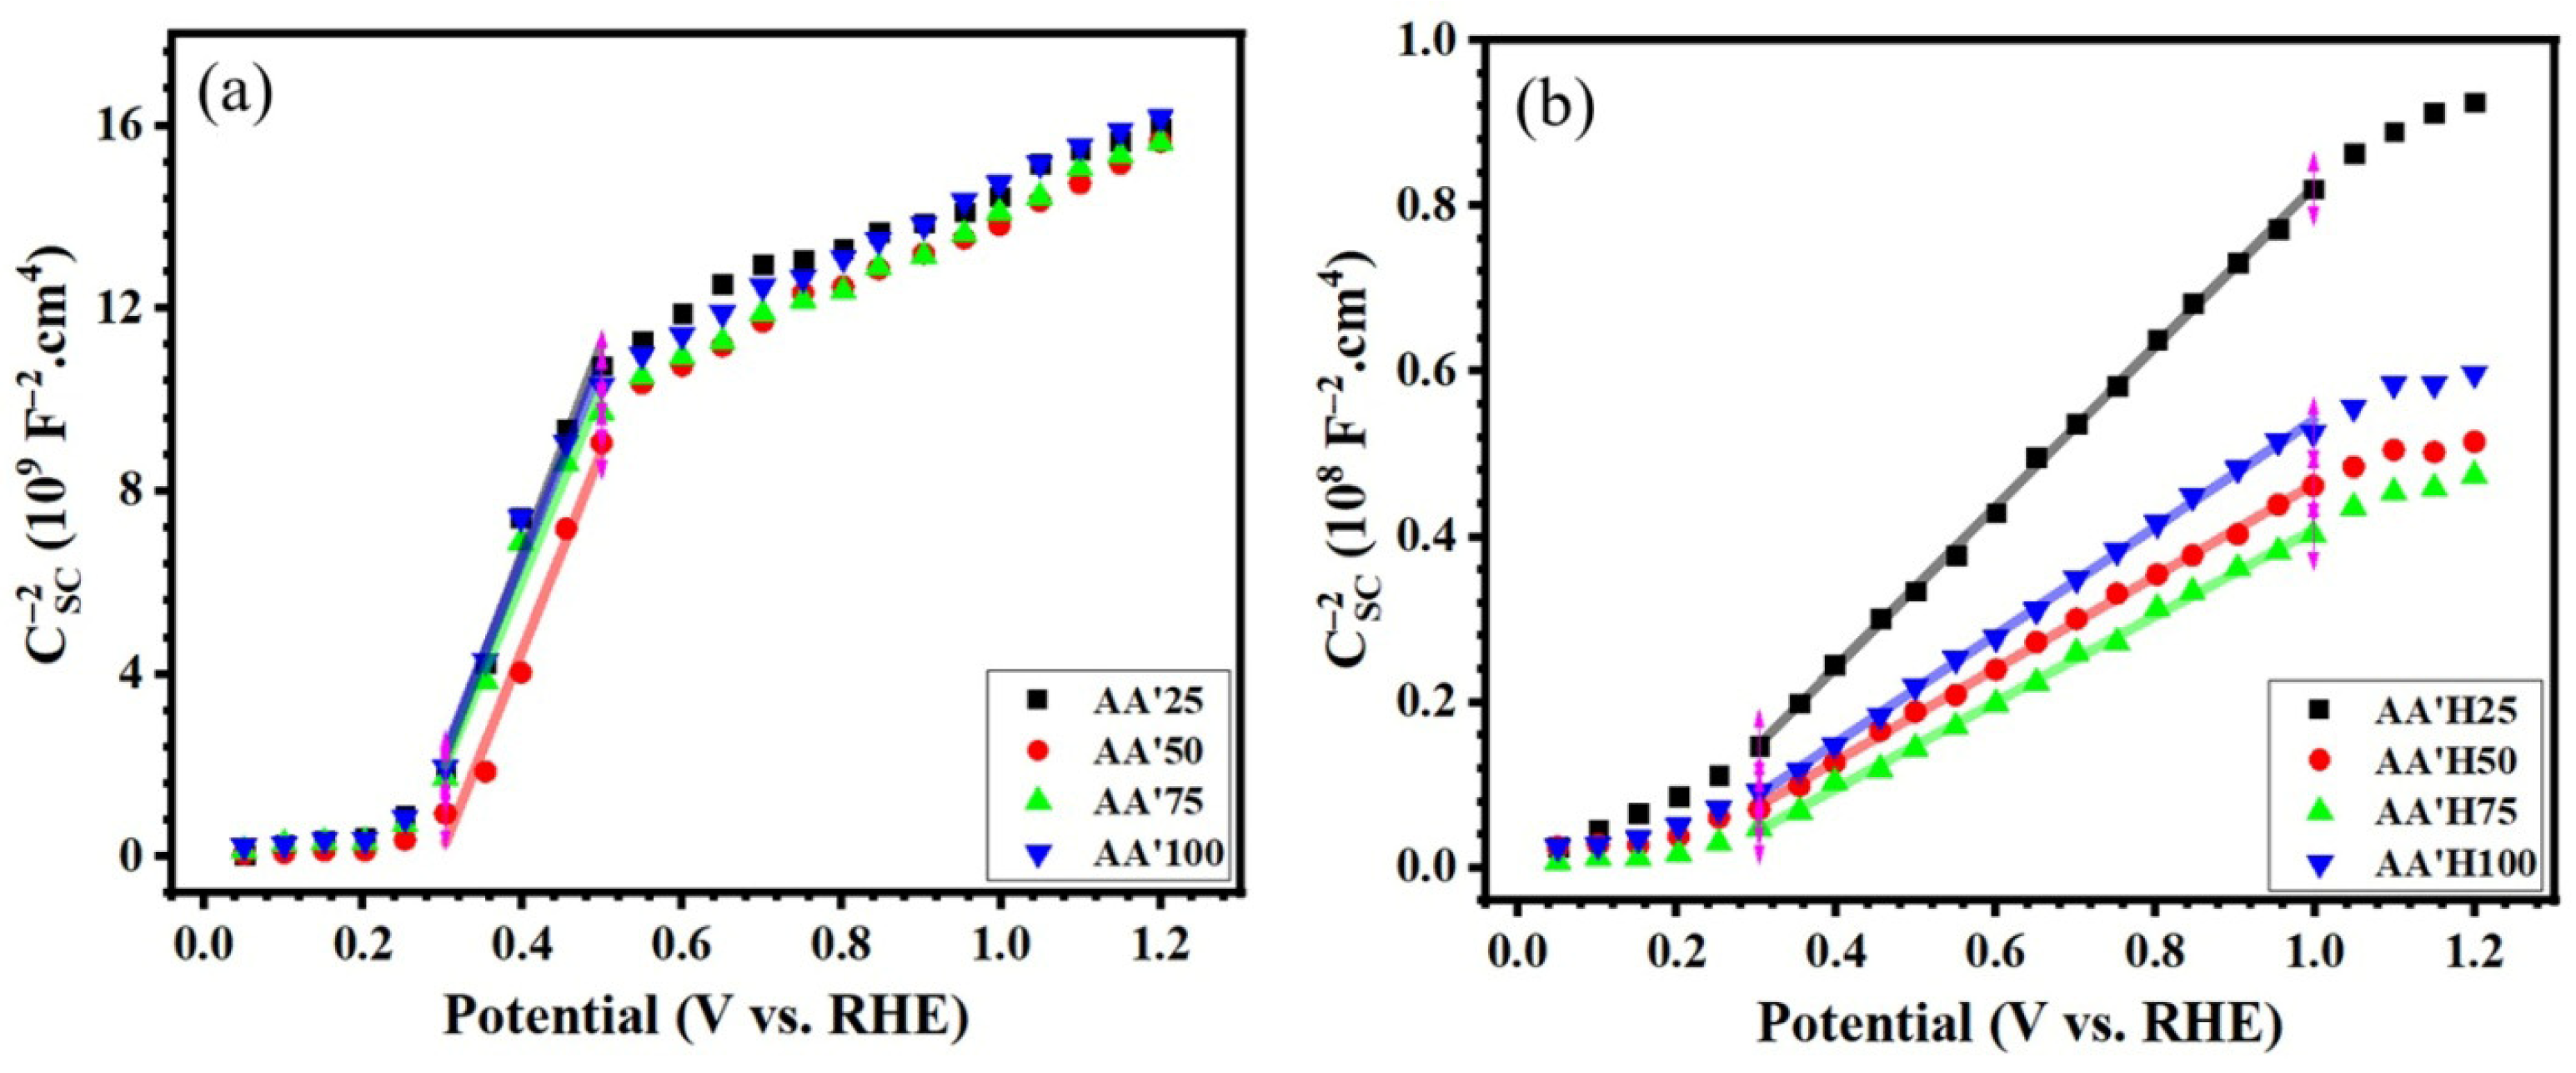
Mott–Schottky analysis is performed to investigate the semiconducting properties and to evaluate the presence of crystalline defects in oxide films. This analysis essentially describes the changes occurring at an electrochemical interface as a function of the applied DC voltage. Accordingly, Mott–Schottky measurements were carried out for all thermally annealed, hydrogen-treated, and Cu-decorated specimens; see
Figure 9a,b. The relationship between the space-charge capacitance (C) and the applied potential (E) can be determined using the Mott–Schottky equation, which is commonly employed to calculate the charge carrier density and the flat-band potential (Efb). In general, the Mott–Schottky relations for n-type and p-type oxide semiconductors are expressed by Equations (1) and (2), respectively.
In these equations, e is the elementary charge of an electron (1.602 × 10
−19 C), ε
0 is the permittivity of free space (8.854 × 10
−14 F.cm
−1), ε is the dielectric constant of the TiO
2 oxide film (55), A is the exposed surface area of the working electrode (cm
2), Na and ND are the acceptor and donor densities, respectively, kB is the Boltzmann constant (1.38 × 10
−23 J.K
−1), Efb is the flat-band potential, and T is the absolute temperature in Kelvin.
Figure 9 illustrates the Mott–Schottky plots obtained for the TiO
2 oxide layers under different treatment conditions. As observed from
Figure 9a,b, all samples exhibit nearly similar trends, with the main difference being the slope of the linear regions. Since a negative slope in Mott–Schottky plots indicates p-type behavior, whereas a positive slope corresponds to n-type behavior, the positive slopes observed for all samples confirm that the formed TiO
2 oxide layers exhibit n-type semiconducting behavior.
It should be noted that the slope of the Mott–Schottky plot is a critical parameter, as the donor density (ND) is directly calculated from this value. According to Equation (3), a lower slope corresponds to a higher ND, which in turn indicates more efficient charge and electron transport across the electrode/electrolyte interface and lower interfacial resistance.
Based on the data summarized in
Table 7, hydrogen thermal treatment significantly increases the donor density compared to the thermally annealed samples, with the highest ND observed for the AA′H75 specimen. Consequently, this sample was selected as the standard specimen for the subsequent stages of the research.
Based on the results obtained from the tests performed, especially the electrochemical tests, the AA′H75 specimen showed better electrocatalytic properties than the other specimens. Accordingly, the aforementioned specimen was selected as the optimal specimen and the chemical decoration operation of copper species was performed on this specimen for 15, 30, 45, and 60 min. In the following, the results of the aforementioned operation by conducting characterization and electrochemical tests are examined.
2.5. Analysis of FE-SEM Images of Specimens After Chemical Decoration of Copper Species
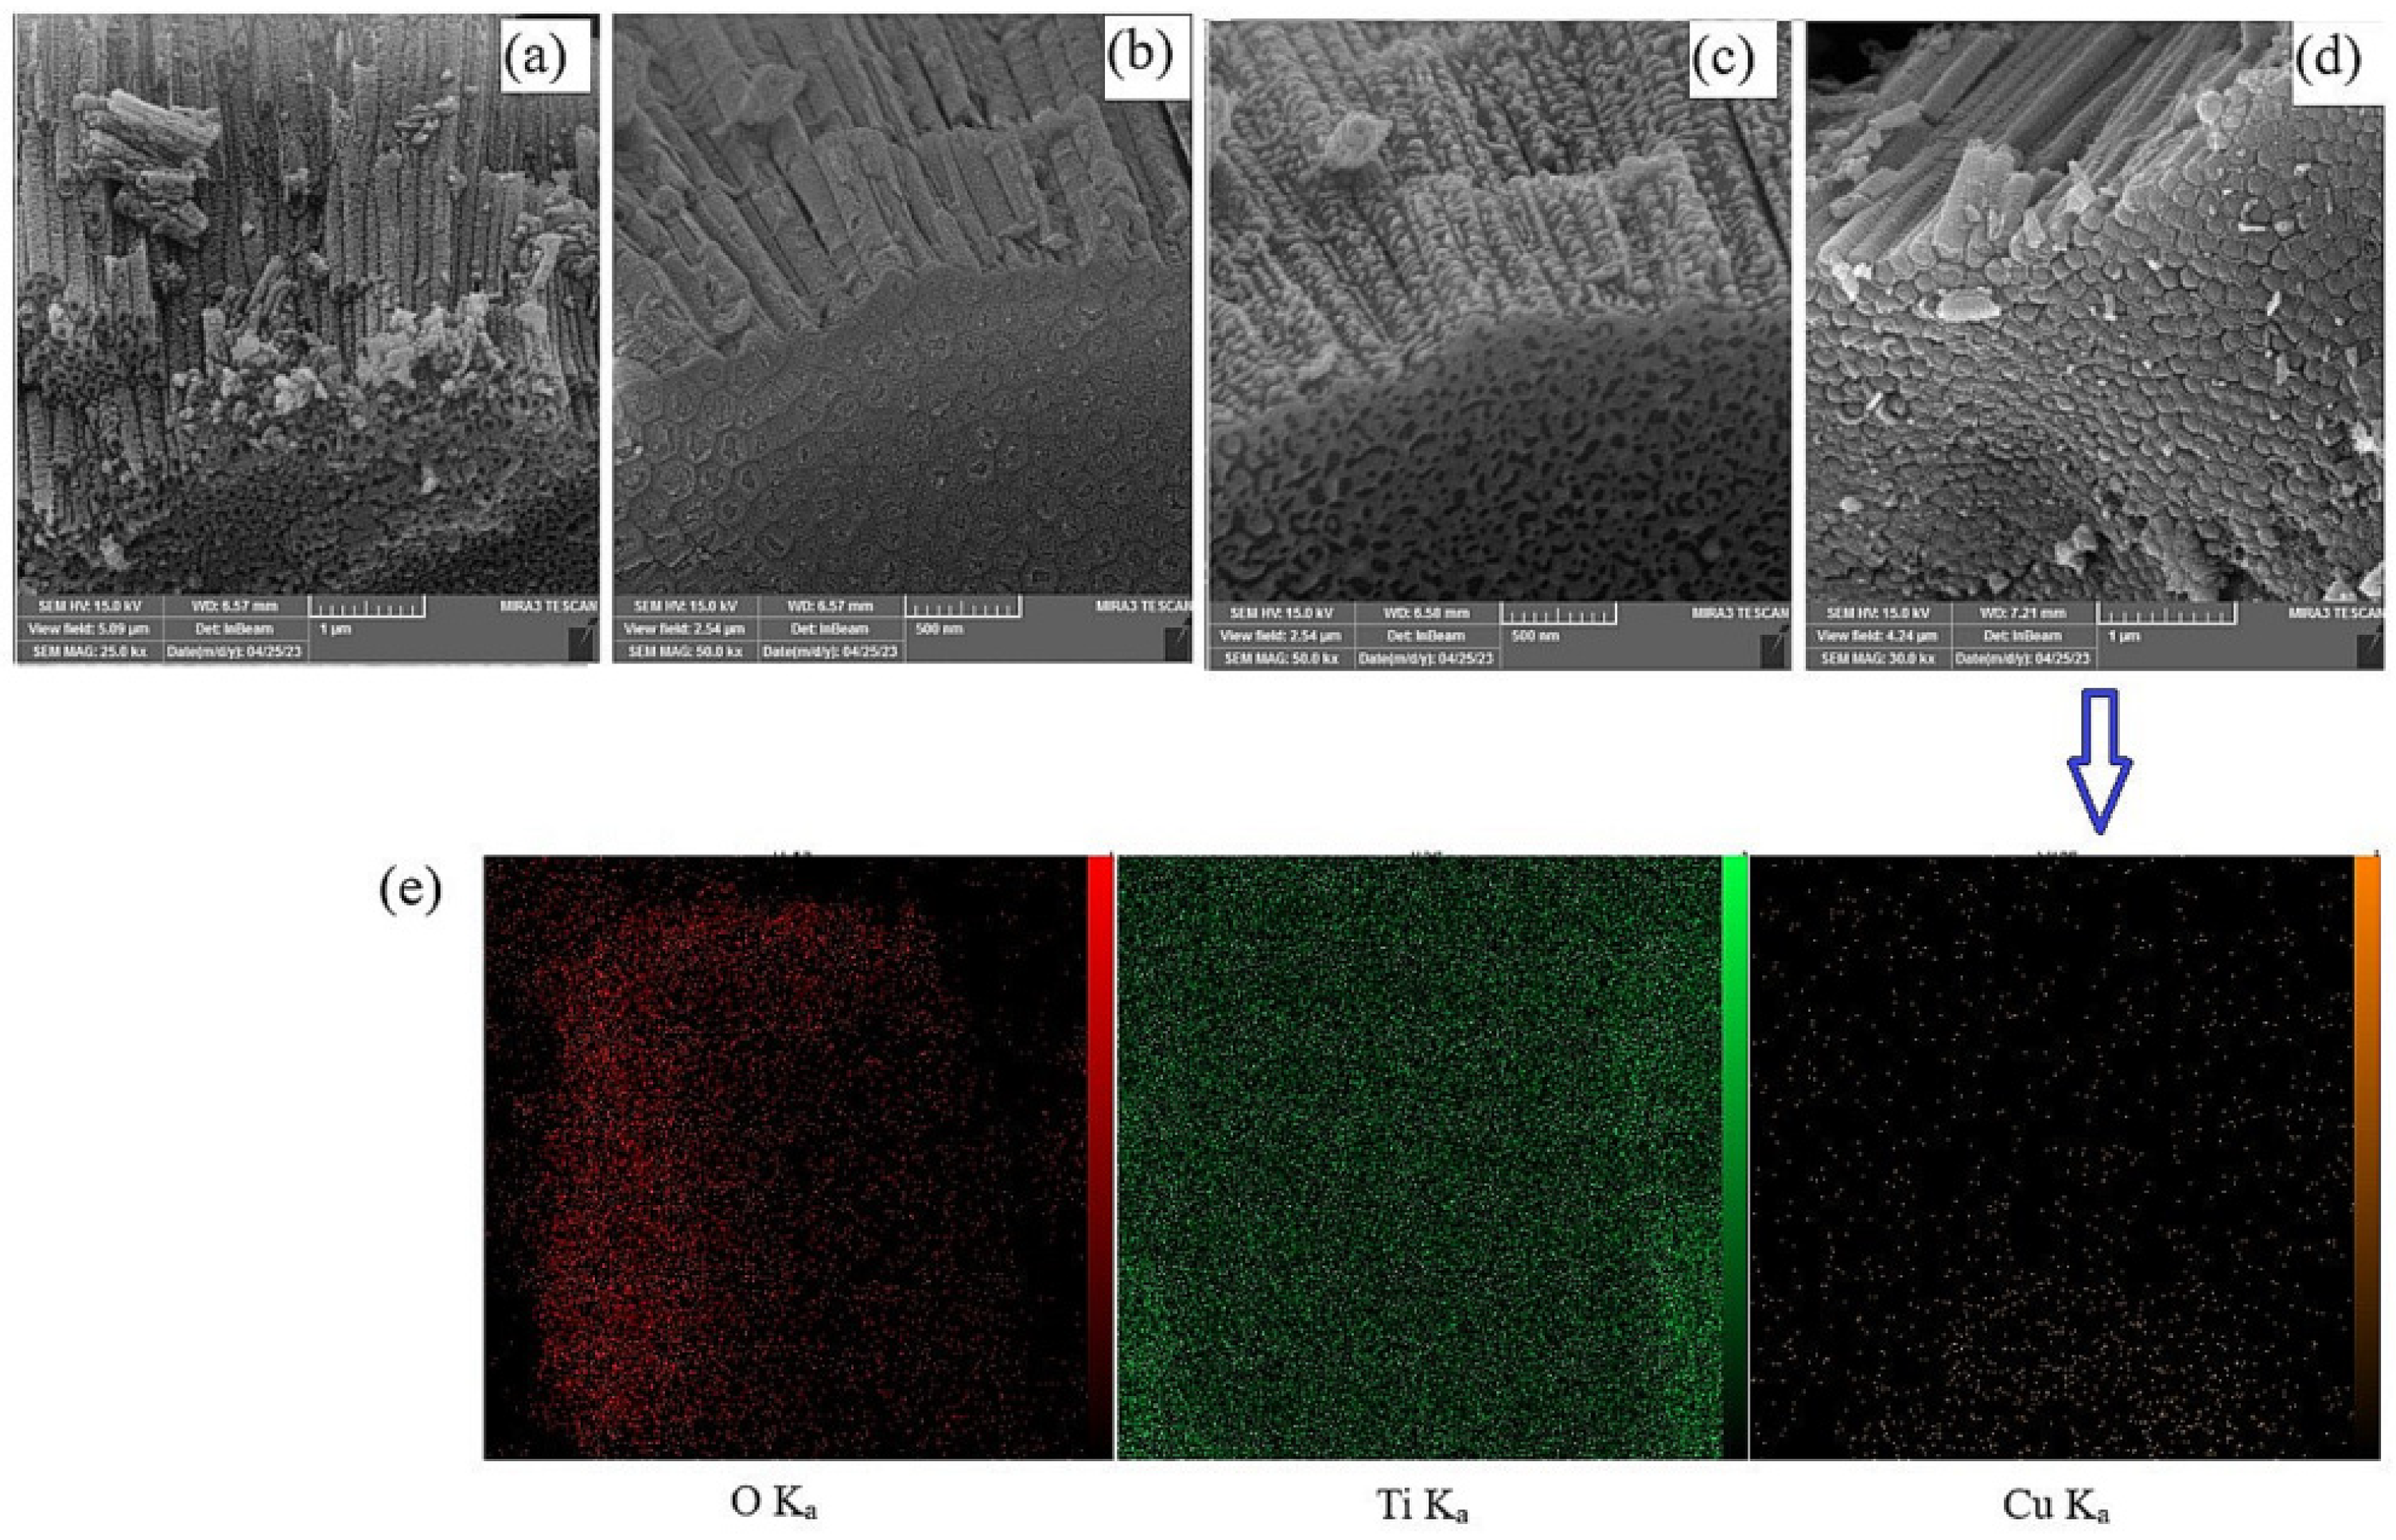
Figure 10 presents the FE-SEM images of TNT arrays formed on titanium after electrochemical oxidation for 75 min, followed by thermal annealing, hydrogenation heat treatment, and chemical decoration with copper species for 45 min (AA′HD45). As observed in
Figure 10a–d, the nanotubular structure is well preserved after all post-treatments, indicating that the chemical decoration process does not collapse or block the TNTs. Compared with specimens decorated at other immersion times, the AA′HD45 specimen exhibits a more homogeneous surface morphology, where copper species are finely and uniformly deposited along the top surface and partially on the walls of the nanotubes, without forming large agglomerates. This uniform distribution suggests an optimal balance between nucleation and growth of copper species at the 45 min decoration time. Furthermore, the EDS map scan shown in
Figure 10e, taken from the region marked in
Figure 10d, confirms the presence and distribution of O, Ti, and Cu elements. The Ti and O maps indicate a continuous TiO
2 matrix, while the Cu Kα map reveals a well-dispersed copper signal over the analyzed area, corroborating the successful chemical decoration of the TNTs. In addition, the EDS analysis detects copper-containing deposited particles originating from the chemical decoration stage, further validating the incorporation of copper species. As a result, the combined FE-SEM and EDS results demonstrate that the AA′HD45 specimen possesses the most uniform copper decoration among the investigated specimens, which is expected to play a key role in enhancing its electrochemical performance.
2.6. Raman Spectroscopy Analysis of Specimens After Chemical Decoration of Copper Species at Different Times
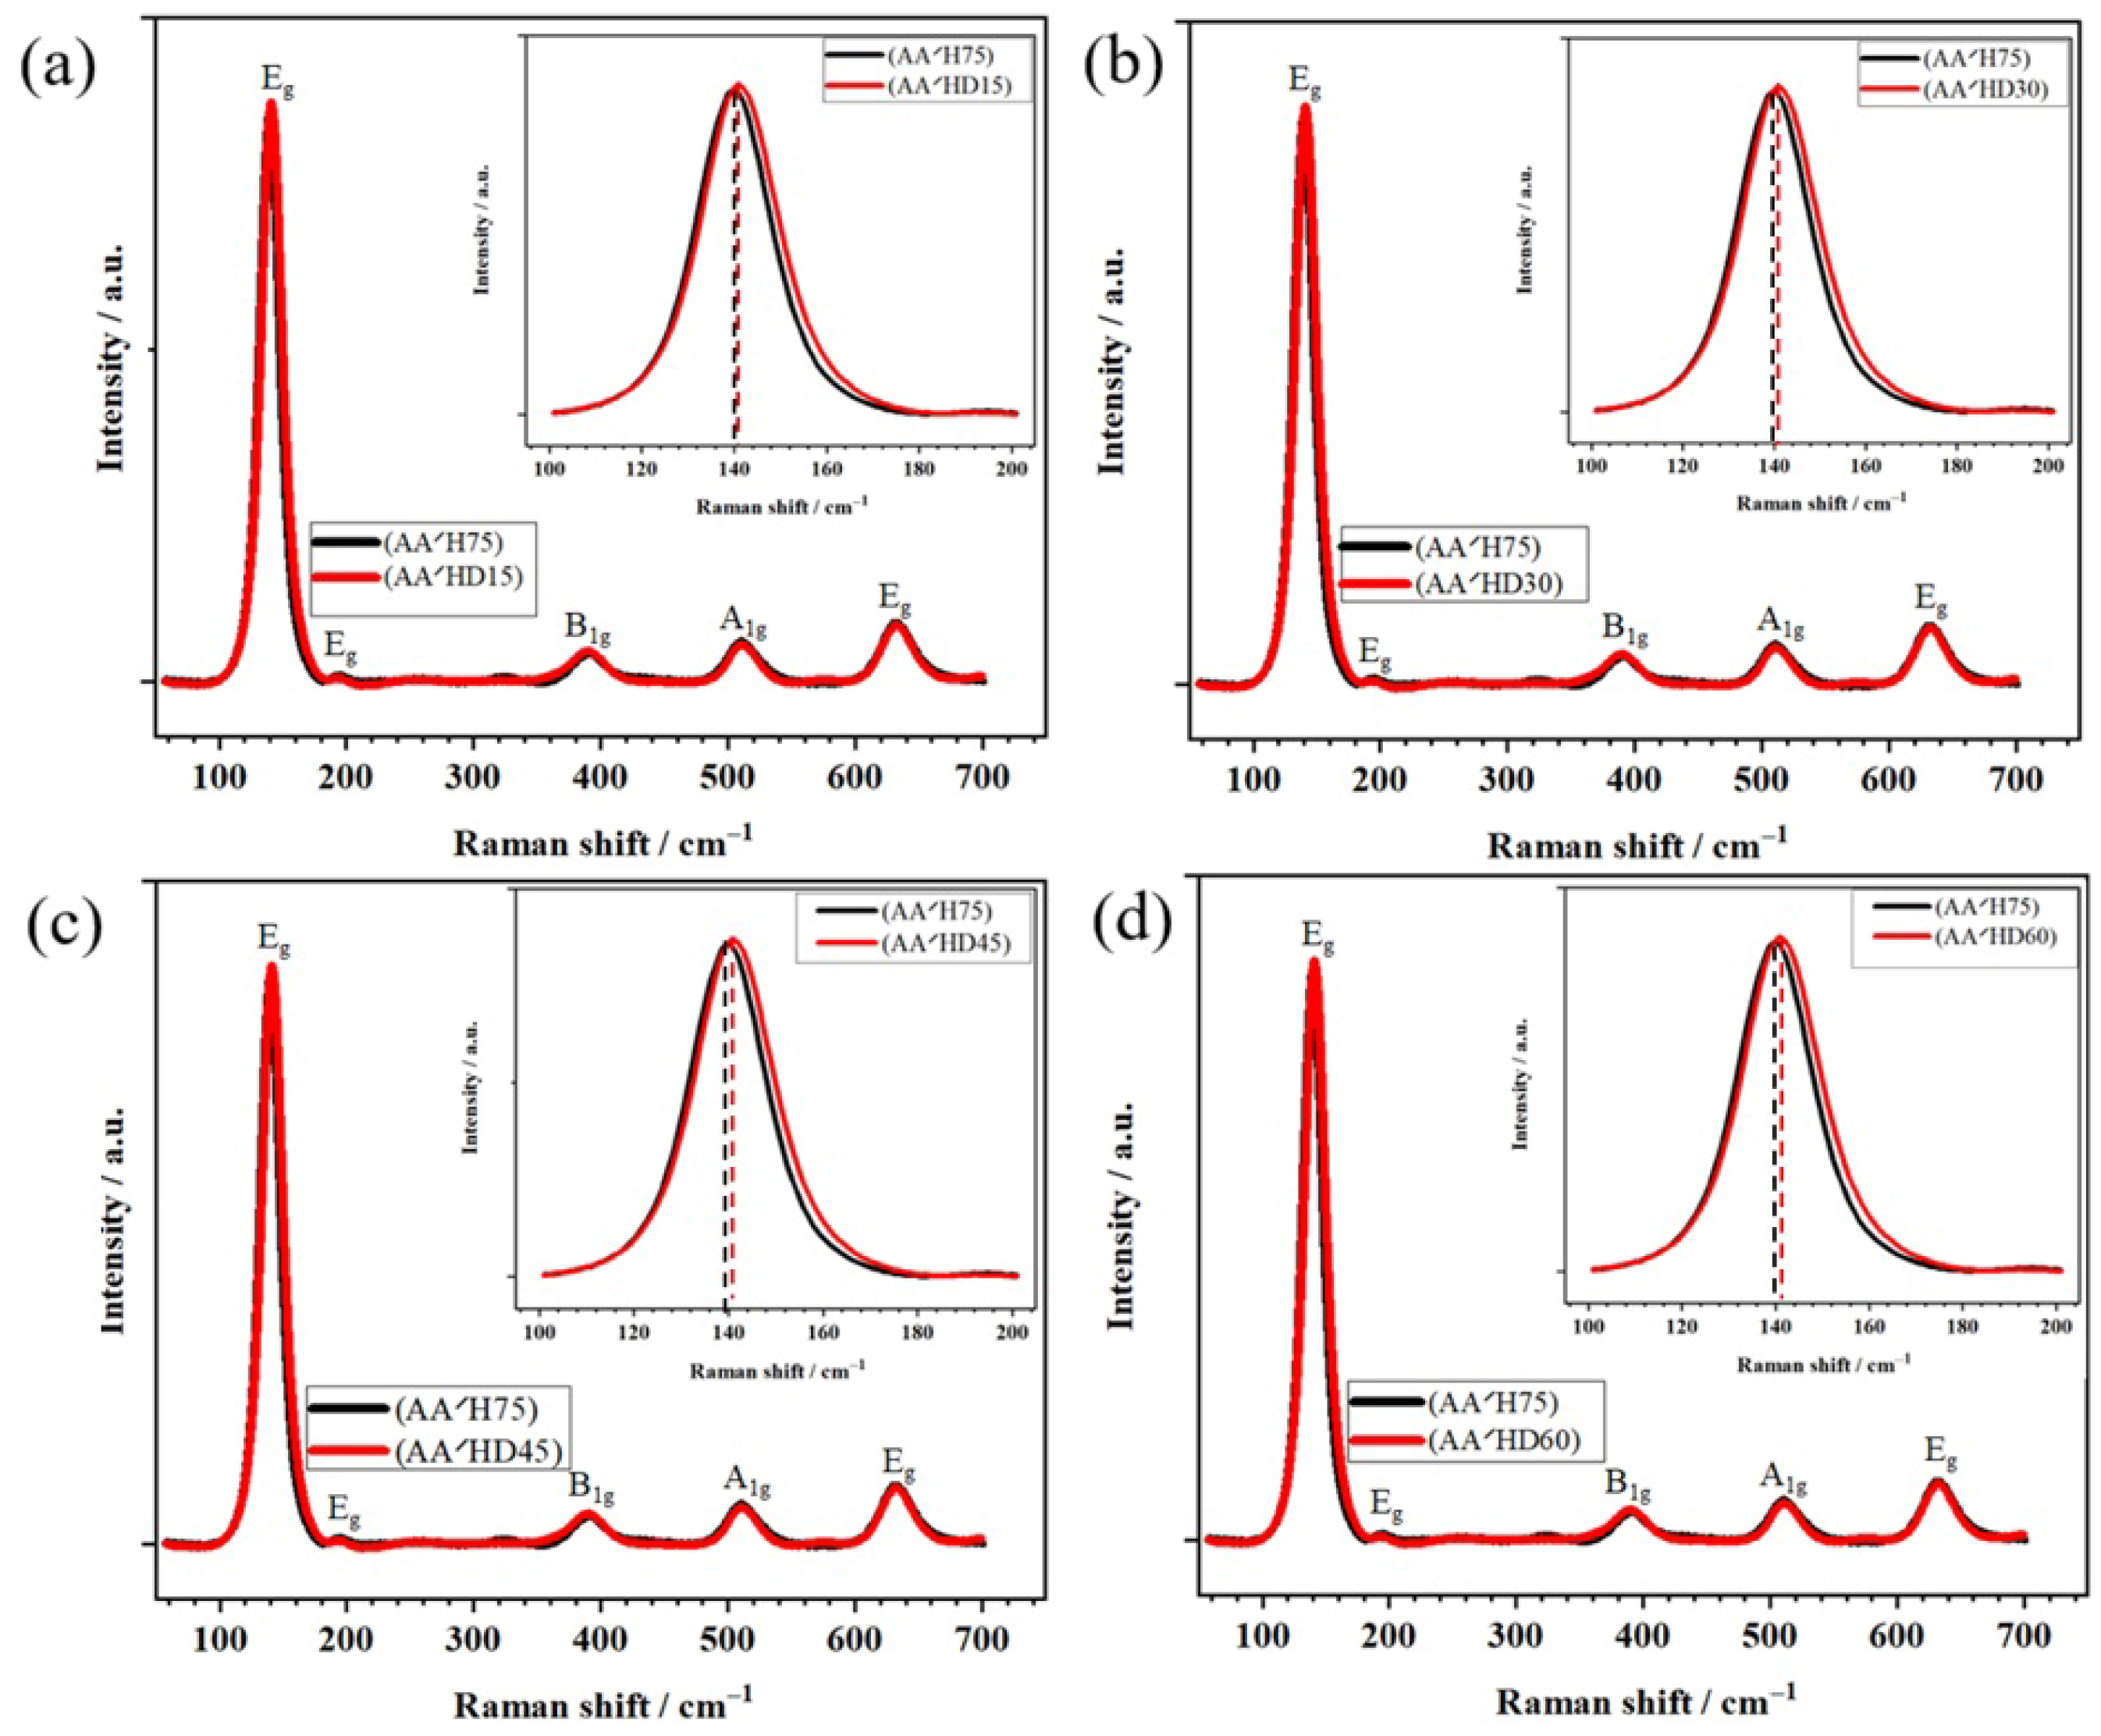
Figure 11a–d show the Raman spectra of the specimens after chemical decoration with copper species at different treatment times. As observed in
Figure 11, the Raman pattern corresponding to the tetragonal crystalline anatase phase remains unchanged compared to the previous stage and thus demonstrates good phase stability. The comparison of the peak intensities of the chemically decorated specimens with those of the hydrogenated specimens indicates that the chemical decoration process leads to a slight increase in the intensity of the characteristic anatase peaks, which may be attributed to factors such as the incidence angle of the laser, the amount of deposited material, and other experimental conditions. In addition, a very small shift toward higher wavenumbers is observed in the decorated specimens; this shift becomes more pronounced with increasing immersion time. This behavior can be ascribed to the disruption of O–Ti–O bond symmetry, suggesting a slight reduction in the crystallinity of the samples.
2.7. Electrochemical Analysis of Specimens After Chemical Decoration of Copper
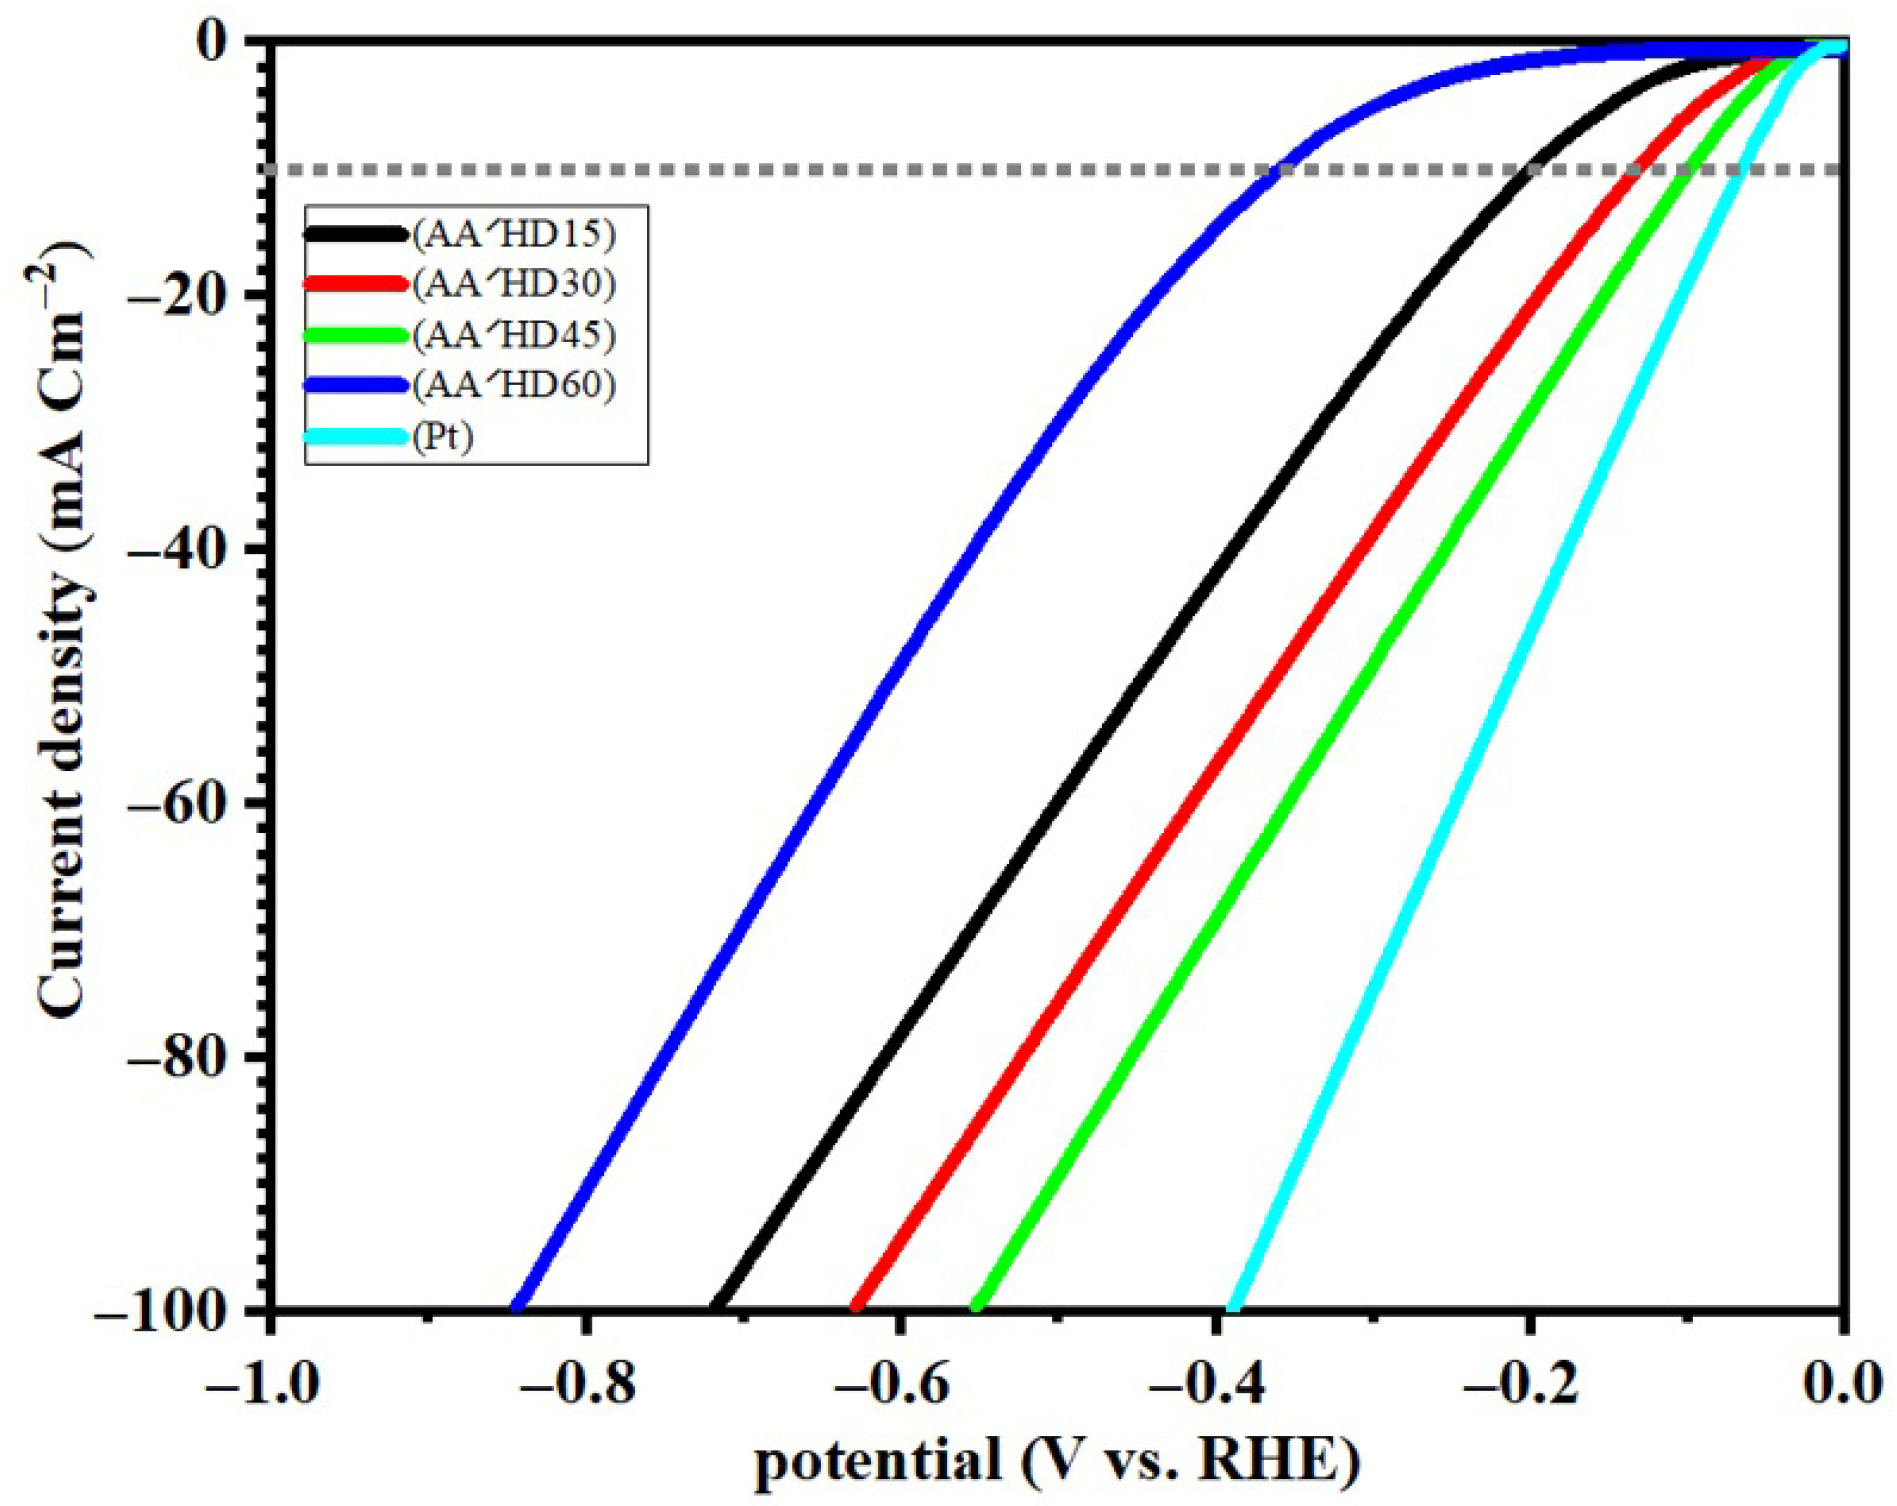
According to
Figure 12 and
Table 8, which present the LSV results of the chemically decorated specimens, it is observed that all decorated samples exhibit markedly improved electrochemical behavior compared with the thermally annealed specimens and the hydrogenated samples, in agreement with similar reports in the literature [
25]. As shown in
Figure 12, unlike the specimens in the previous stages that did not reach the η
10 and η
100 overpotentials, the electrodes decorated with copper species display significantly enhanced electrochemical performance. Among the decorated specimens, the highest electrochemical activity is obtained for the specimen with a chemical decoration time of 45 min. Accordingly, in this test, the AA′HD45 specimen was selected as the optimal electrode.
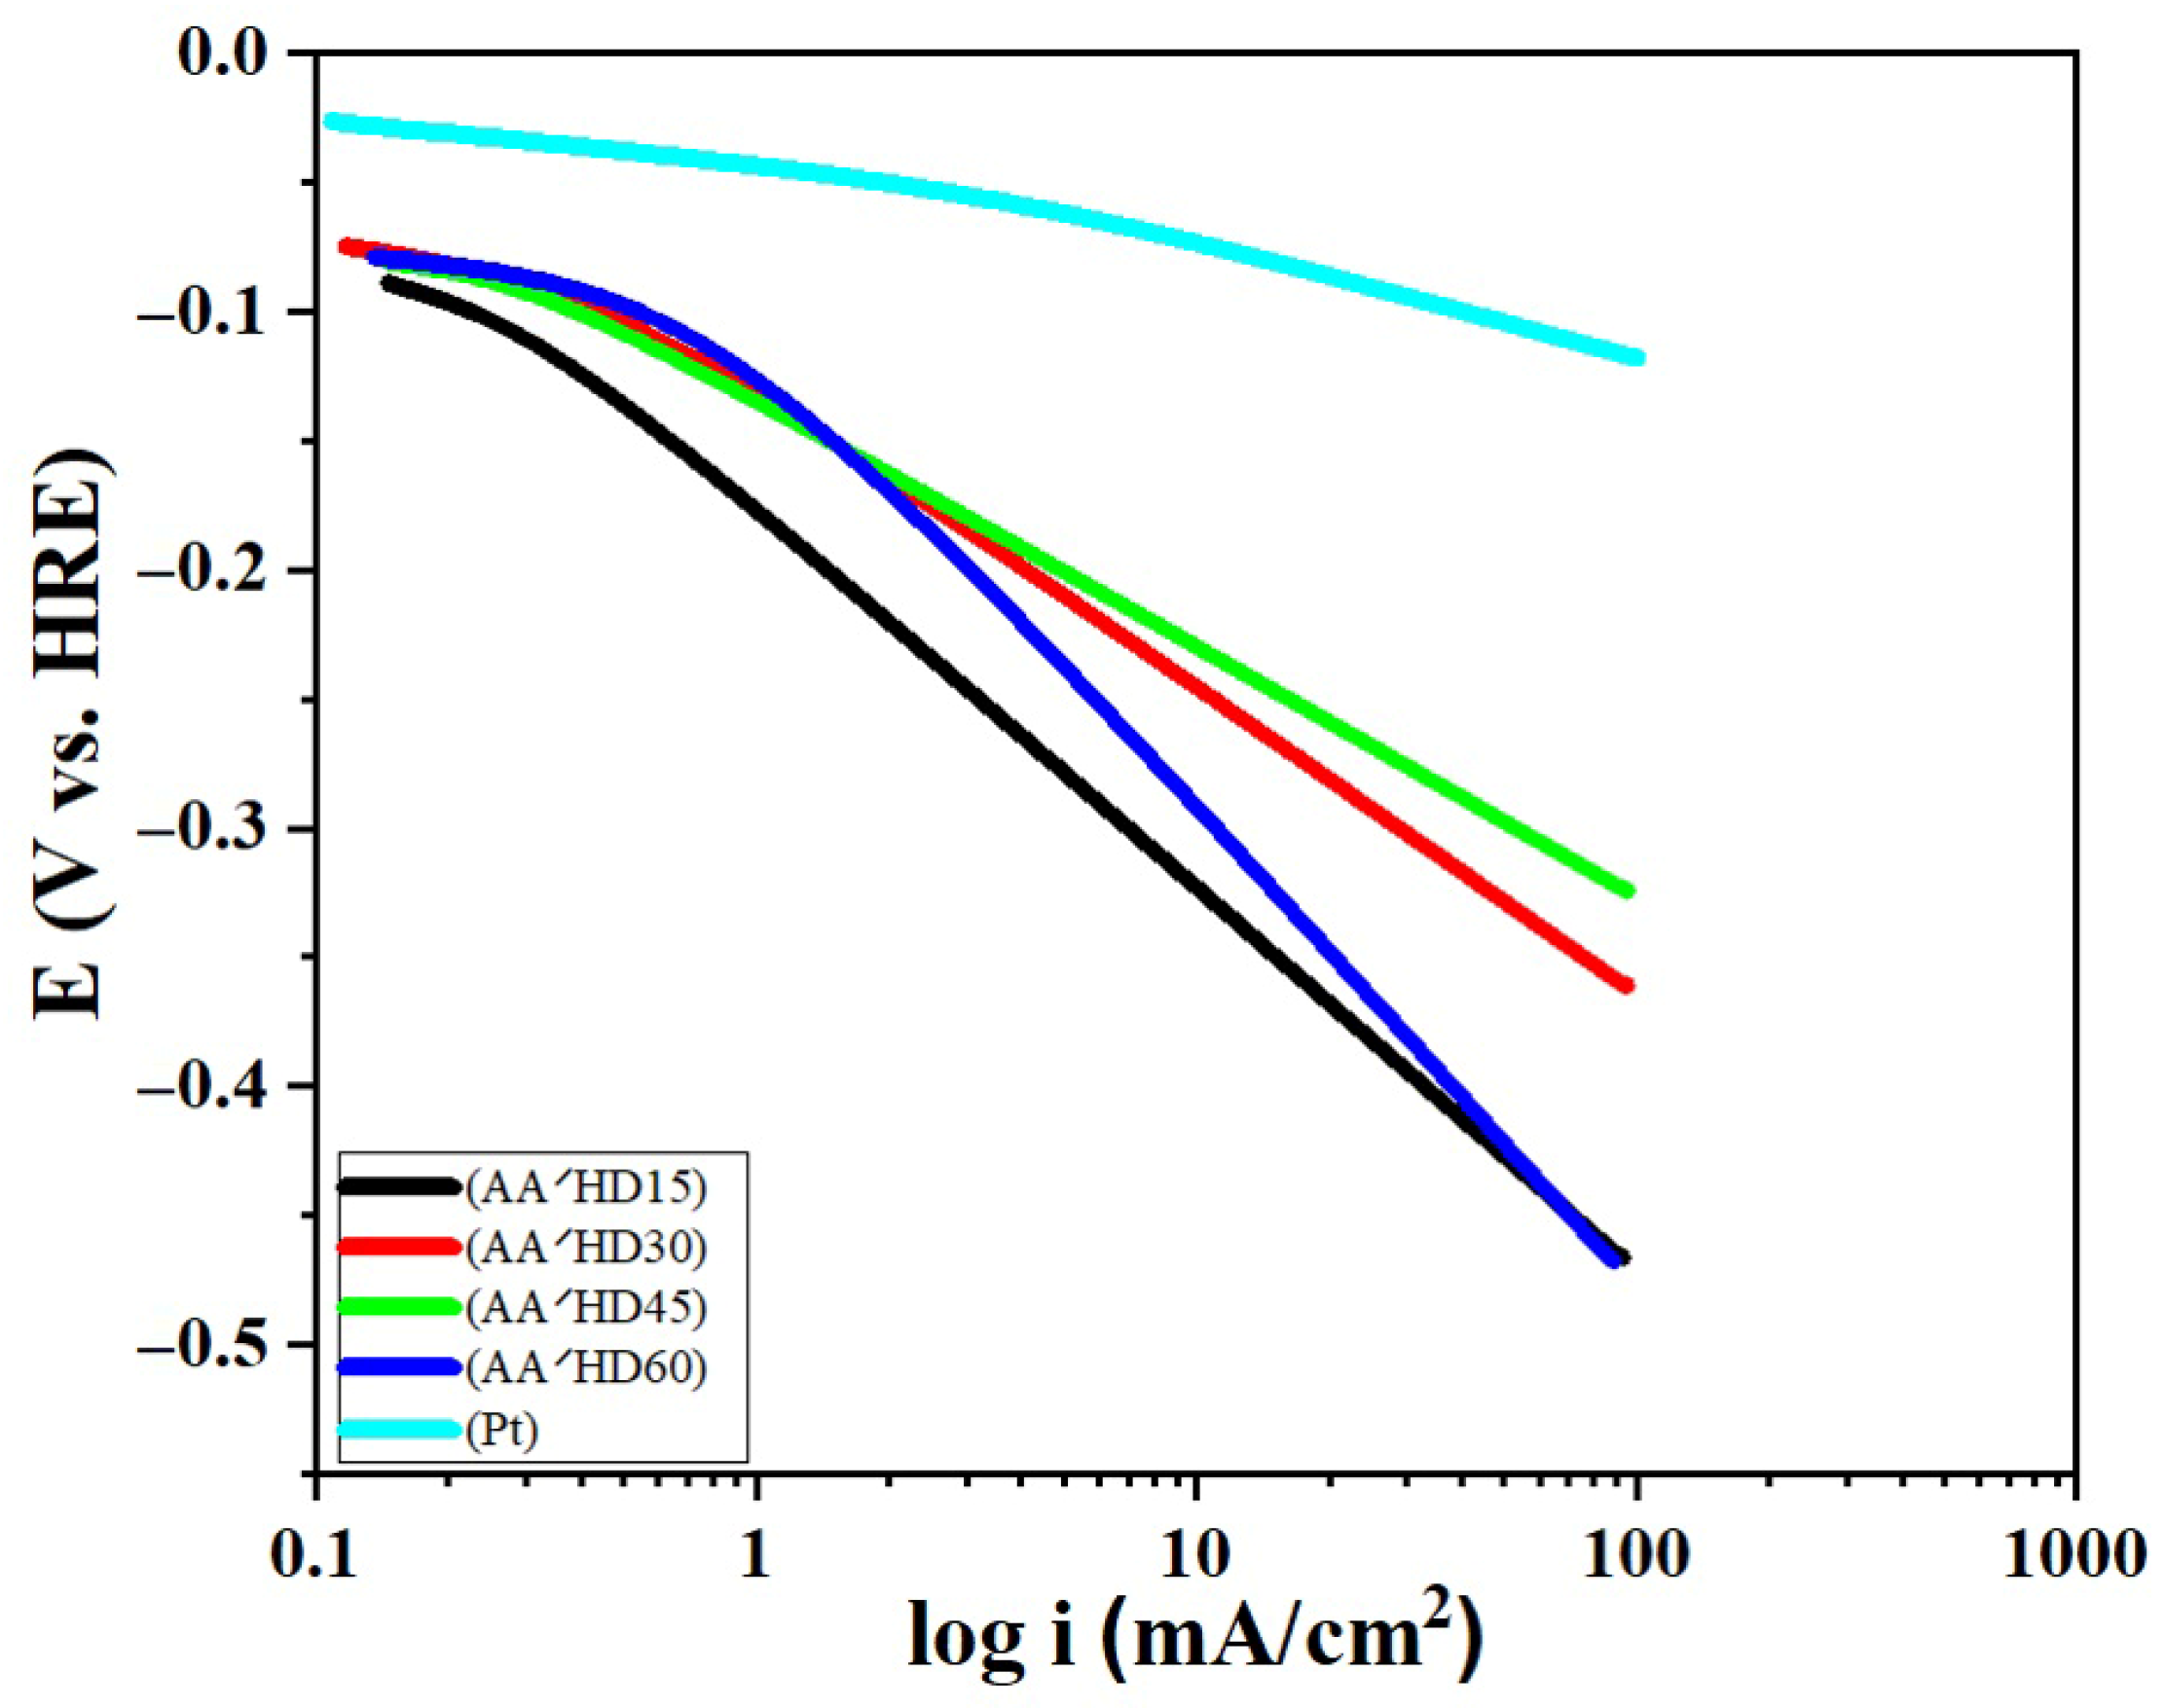
According to
Figure 13 and
Table 9, after chemical decoration with copper species, the cathodic slope of all samples subjected to different immersion times exhibits a significant decrease. A comparison between the polarization curves of the samples shown in
Figure 7 and the data listed in
Table 4 indicates that thermal annealing does not lead to a noticeable improvement in the slope of the cathodic branch. After hydrogenation heat treatment, a gradual decrease in the cathodic slope is observed up to sample AA′H75. In contrast, chemical decoration with copper species results in an overall enhancement of the electrochemical performance of the samples, such that a pronounced reduction in the cathodic slope occurs up to sample AA′HD45, followed by a slight increase at longer decoration times. This trend is consistent with previously reported results in the literature [
26]. Accordingly, the best electrocatalytic efficiency is achieved for the sample decorated with copper species for 45 min. Therefore, AA′HD45 was selected as the optimum sample in this test.
The Tafel slope obtained from the HER polarization curves provides important insight into the reaction kinetics and mechanism occurring at the electrode surface. In general, a lower Tafel slope indicates more favorable reaction kinetics, often associated with a Volmer–Heyrovsky mechanism in which the adsorption of hydrogen on the catalyst surface is the rate-limiting step. In contrast, a higher Tafel slope suggests slower kinetics and may indicate a Volmer–Tafel pathway where hydrogen desorption becomes the rate-determining step. The hydrogen evolution reaction typically proceeds through a sequence of elementary steps beginning with the Volmer step, where protons are adsorbed onto the catalyst surface to form adsorbed hydrogen species (H+). This is followed either by the Heyrovsky step, involving electrochemical desorption to form molecular hydrogen (H2), or by the Tafel step, where two adsorbed hydrogen atoms combine to produce H2. The relative contribution of these pathways determines the overall reaction kinetics and is reflected in the experimentally measured Tafel slope. Understanding this relationship is essential for interpreting HER activity and for designing more efficient electrocatalysts for sustainable hydrogen production.
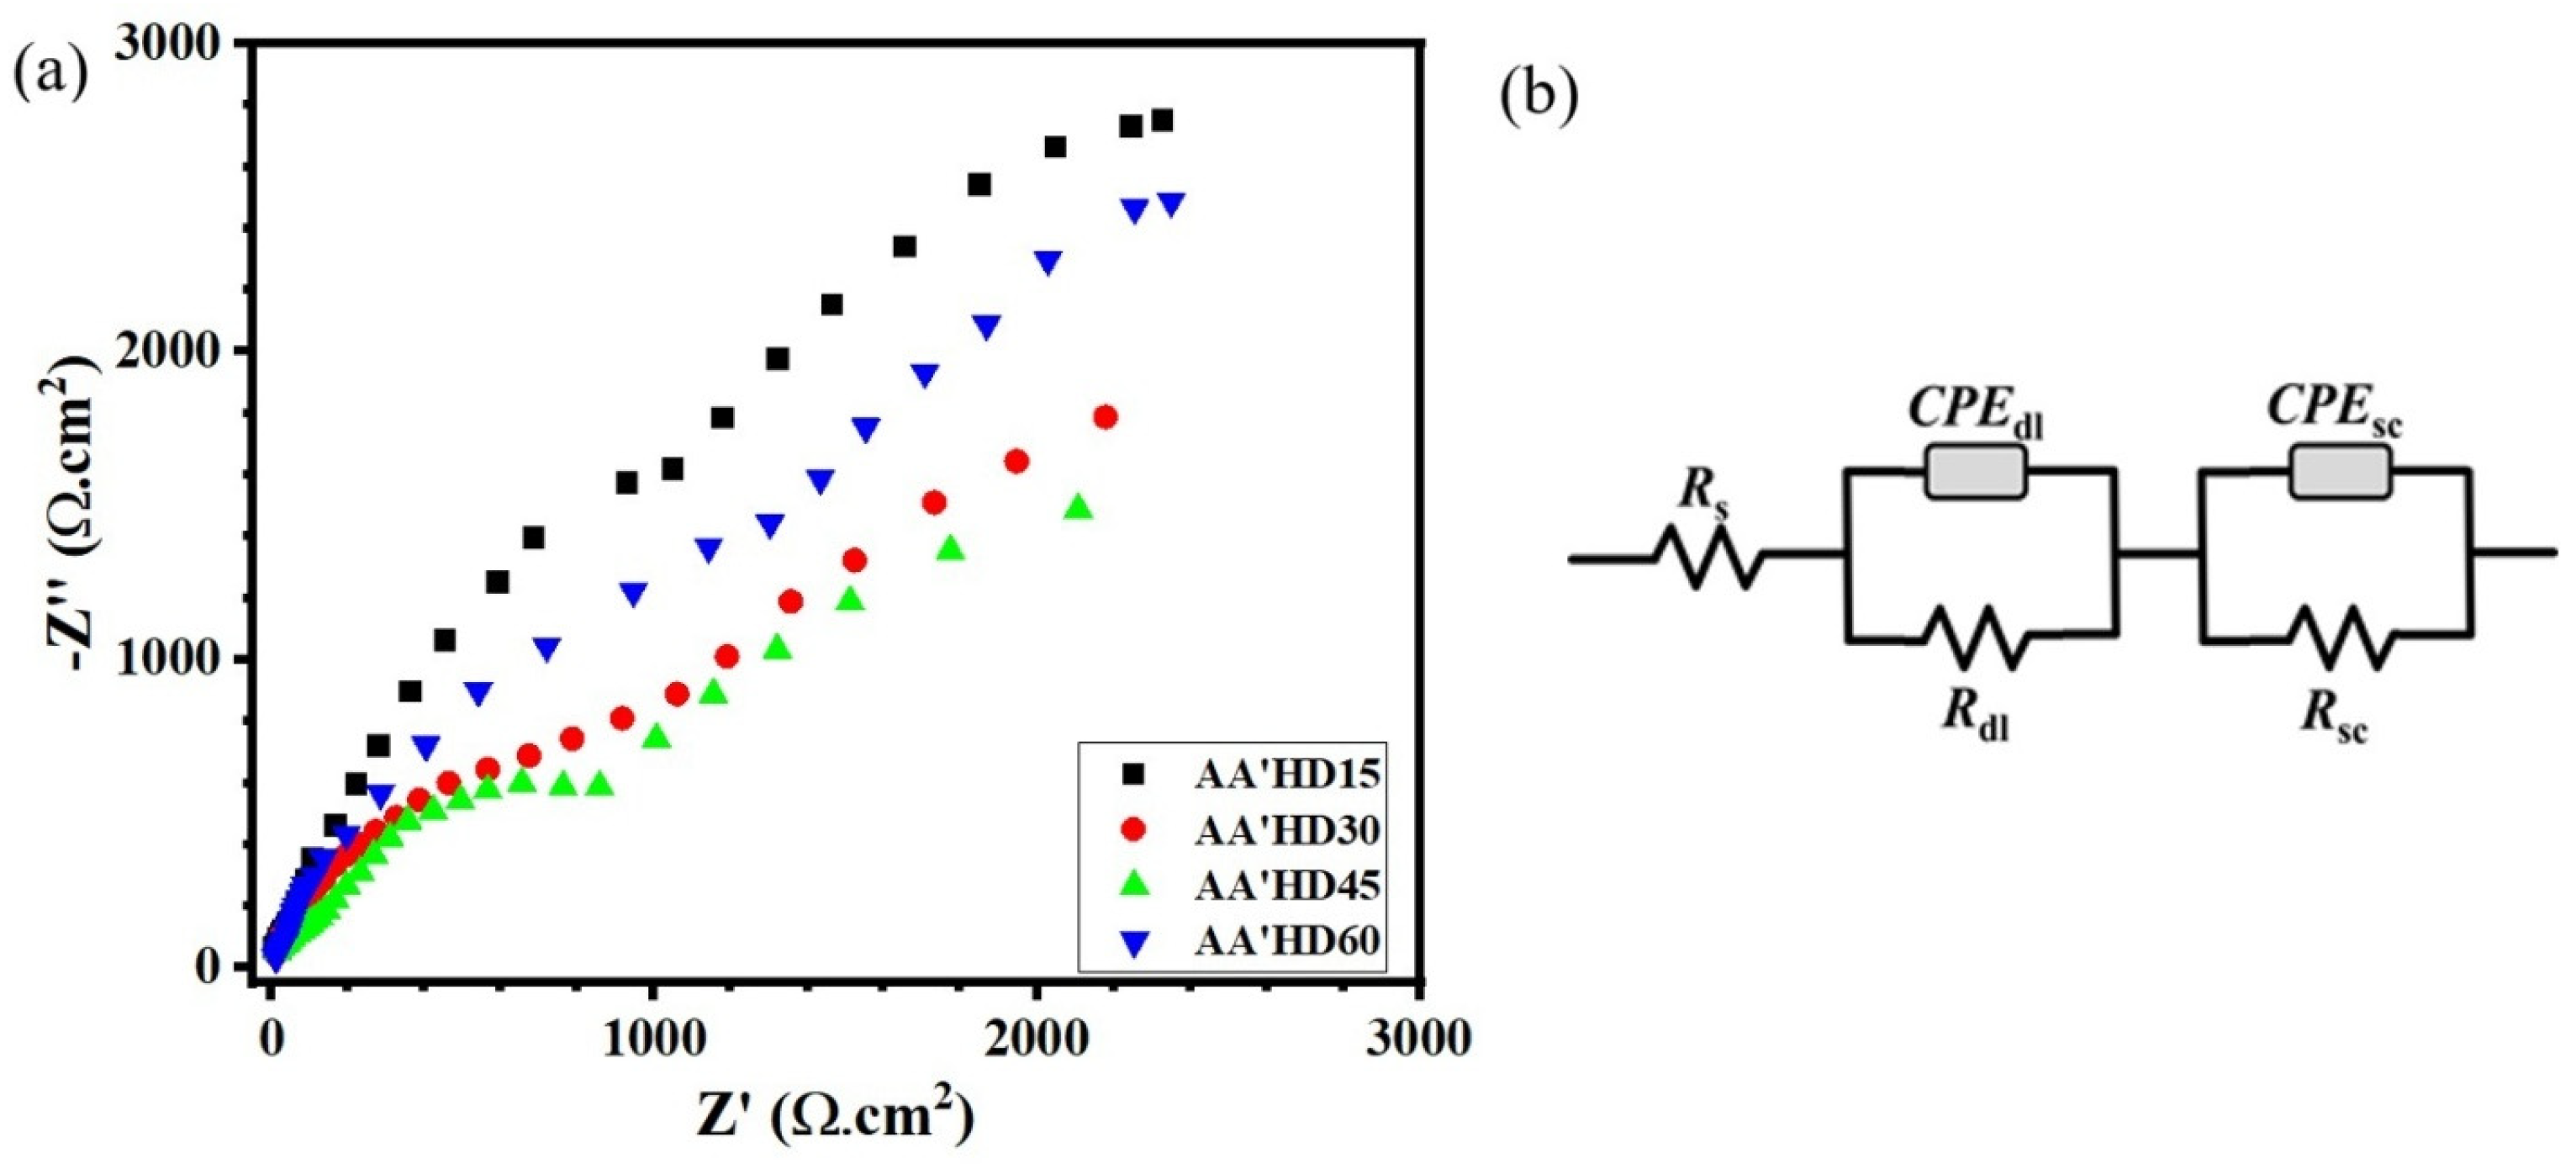
With reference to
Figure 14 and its comparison with
Figure 8, which correspond to the Nyquist plots of the chemically decorated samples with Cu species and the hydrogenated specimens, respectively, it is observed that the Nyquist semicircles of the Cu-decorated samples are significantly compressed compared to those of the hydrogenated specimens. This behavior clearly indicates superior charge-transfer characteristics for the Cu-decorated specimens. Such an improvement can be attributed to the enhanced electrical conductivity of the electrode induced by the presence of Cu species. This assertion is further confirmed by the Mott–Schottky analysis, which demonstrates that the applied treatment leads to an increase in electron donor density, thereby enhancing electrical conductivity and reducing the charge-transfer resistance. The results obtained from this test are in good agreement with those reported by other researchers [
25,
27]. Based on the above discussion, as well as
Figure 14 and the data presented in
Table 10, and their comparison with
Figure 8 and
Table 5, it can be concluded that among the samples chemically decorated for 15, 30, 45, and 60 min, the specimen decorated for 45 min exhibits a markedly more ideal performance in the EIS measurements.
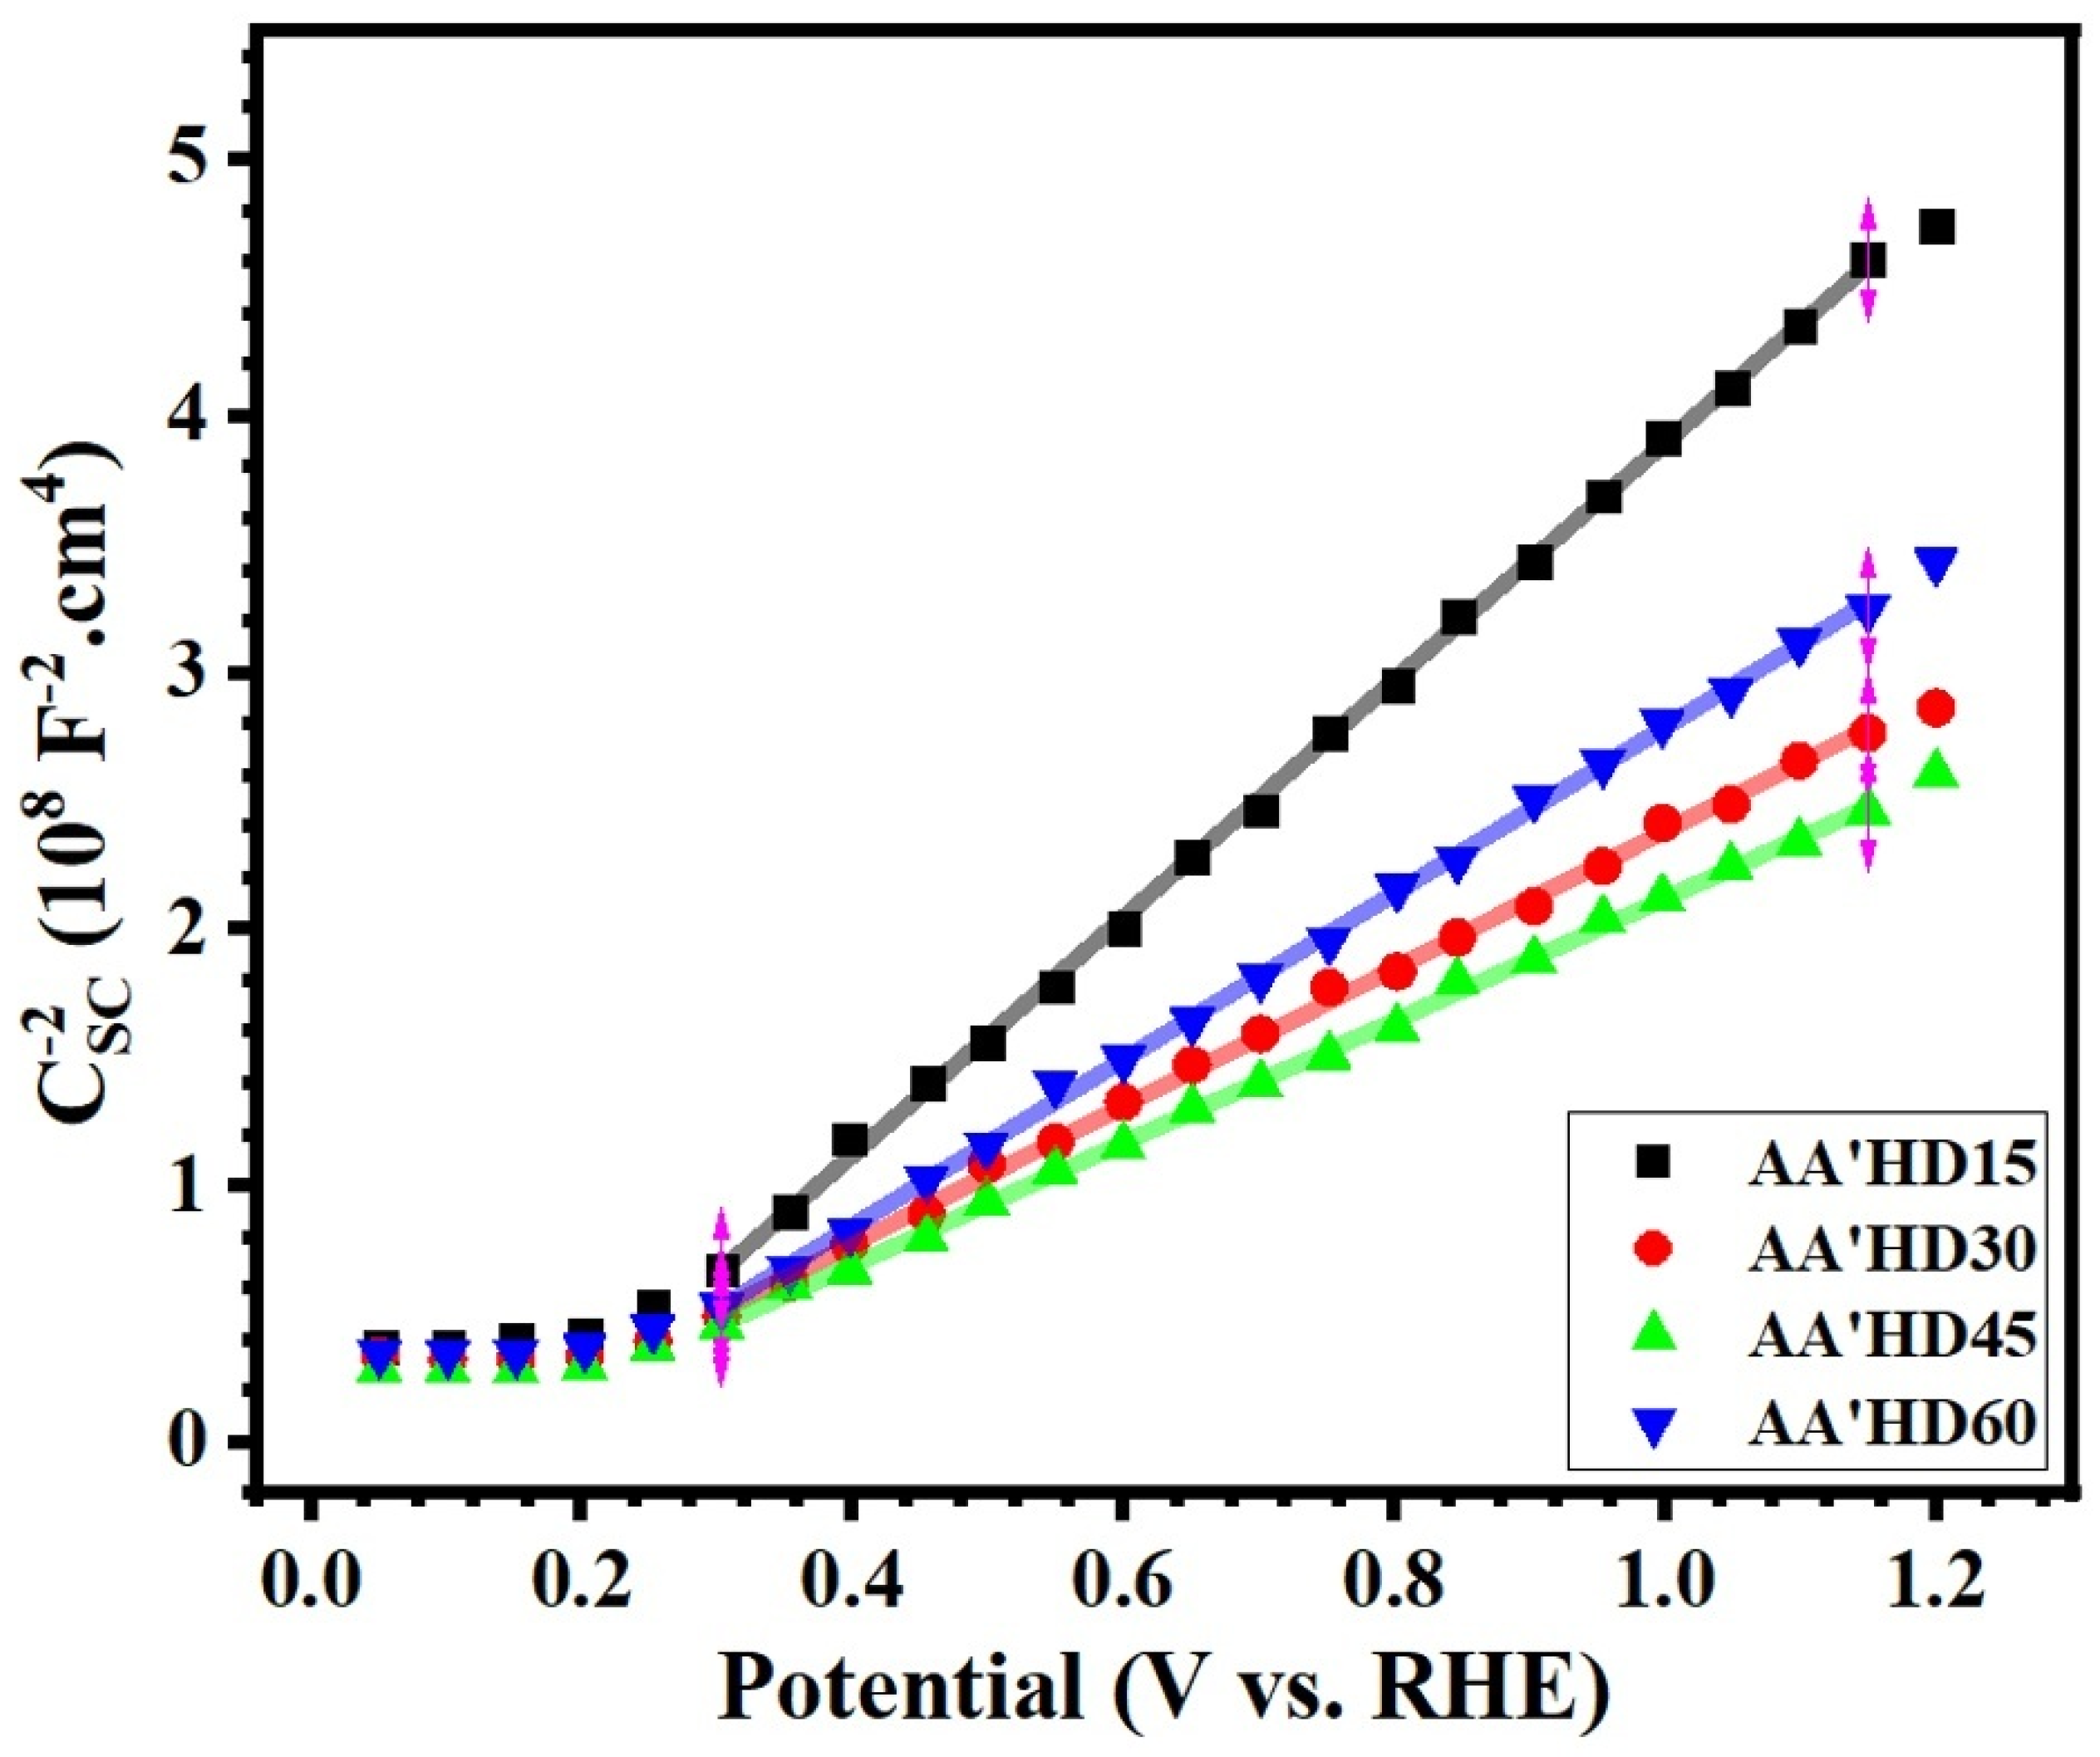
Figure 15 presents the Mott–Schottky plots of the chemically decorated specimens at different decoration times. By comparing this figure with
Figure 9, it can be observed that the donor density (ND) increases after the hydrogenation step relative to the thermally annealed specimens; however, following the chemical decoration process, a slight decrease in ND is evident for all decorated specimens. This reduction can be attributed to the fact that the deposited copper species partially replace charge carriers such as oxygen vacancies, leading to a decrease in their concentration [
28]. In addition, EDS analyses confirm that the copper species are mainly deposited on the TNTs in the form of copper oxides, which further reduces the effective charge carrier density. These oxides are typically p-type semiconductors and can form a p–n heterojunction with n-type TiO
2. As a result, an interfacial depletion region may be created at the junction, influencing the local charge distribution and charge transfer behavior at the interface rather than directly modifying the bulk donor density of TiO
2. The Mott–Schottky analysis shows that the donor density (ND) of the copper decorated samples slightly decreased compared with the hydrogenated samples. This behavior may be associated with the interaction between copper oxide species and charge carriers generated by oxygen vacancies. Nevertheless, the optimized sample (AA H45) exhibited the highest donor density of 1.022 × 10
7 cm
−3, suggesting that the combined effects of hydrogenation and copper decoration can still enhance the electronic properties of the TiO
2 nanotube electrodes. Despite this overall decreasing trend after decoration, the slopes of the Mott–Schottky plots clearly indicate that all specimens retain n-type semiconducting behavior, as evidenced by the positive slopes. Based on the quantitative data summarized in
Table 11, the specimen decorated for 45 min exhibits the highest ND among the chemically decorated specimens, indicating a more favorable balance between copper incorporation and charge carrier preservation. This optimized donor density suggests improved charge transport characteristics for the AA′HD45 specimen compared to the other decoration times.
For benchmarking purposes, the electrocatalytic HER performance of the prepared TiO2 nanotube electrodes was compared with that of a commercial Pt/C catalyst, which is widely regarded as the state-of-the-art catalyst for hydrogen evolution. Owing to its near-optimal hydrogen adsorption energy and superior electrical conductivity, Pt/C typically exhibits significantly lower overpotentials and faster reaction kinetics. Although the Pt/C catalyst demonstrates higher intrinsic activity, the hydrogenated and Cu-decorated TiO2 nanotube arrays investigated in this study show notable HER activity and improved charge transfer characteristics compared with pristine TiO2 electrodes. Considering their low cost, chemical stability, and the abundance of titanium-based materials, these modified TiO2 nanotube electrodes represent a promising alternative platform for developing efficient and sustainable electrocatalysts for hydrogen evolution.
The mechanistic interpretation has been refined to account for the possible formation of a p–n heterojunction between the p-type copper oxides (CuO/Cu2O) and the n-type TiO2 nanotube array. This junction is expected to facilitate charge separation by promoting electron transfer from TiO2 to the copper species, thereby influencing the band structure and interfacial charge distribution. The observed decrease in donor density (ND) after copper decoration can be attributed to the interaction of copper species with charge carriers associated with oxygen vacancies, leading to partial compensation of donor states. Such heterojunction formation is consistent with the improved electrocatalytic activity observed for the optimized sample. Although complementary techniques such as X ray photoelectron spectroscopy (XPS) and frequency-dependent Mott–Schottky analysis would provide further quantitative insights into the oxidation states and band alignment, these measurements could not be conducted at this stage. Nevertheless, the current results strongly support the proposed mechanism based on established semiconductor behavior and previous literature findings.
It is worth-mentioning that the long-term stability of the Cu decorated TiO2 nanotube electrodes was evaluated by monitoring the time-dependent current response under a constant applied potential in 1 M KOH solution. During the continuous operation period, the current density remained nearly constant, with only a slight decrease observed over time, indicating that the electrode preserves its electrocatalytic activity for the hydrogen evolution reaction under prolonged use. This small decay can be attributed to minor surface rearrangements or partial blocking of active sites during continuous gas evolution. No sudden current drops or signs of severe degradation were detected, suggesting that the nanotube architecture and the adhered copper species retain their structural and electrochemical integrity under operating conditions. Overall, these results confirm that the optimized Cu decorated TiO2 nanotube electrode exhibits satisfactory durability and is suitable for long-term HER applications.
3. Materials and Methods
3.1. Fabrication of TiO2 Nanotube Arrays
Highly ordered TNT arrays were fabricated on commercially pure titanium foils (99.9% purity, 0.1 mm thickness) via electrochemical anodization. Prior to anodization, titanium substrates were cut into 15 × 15 mm
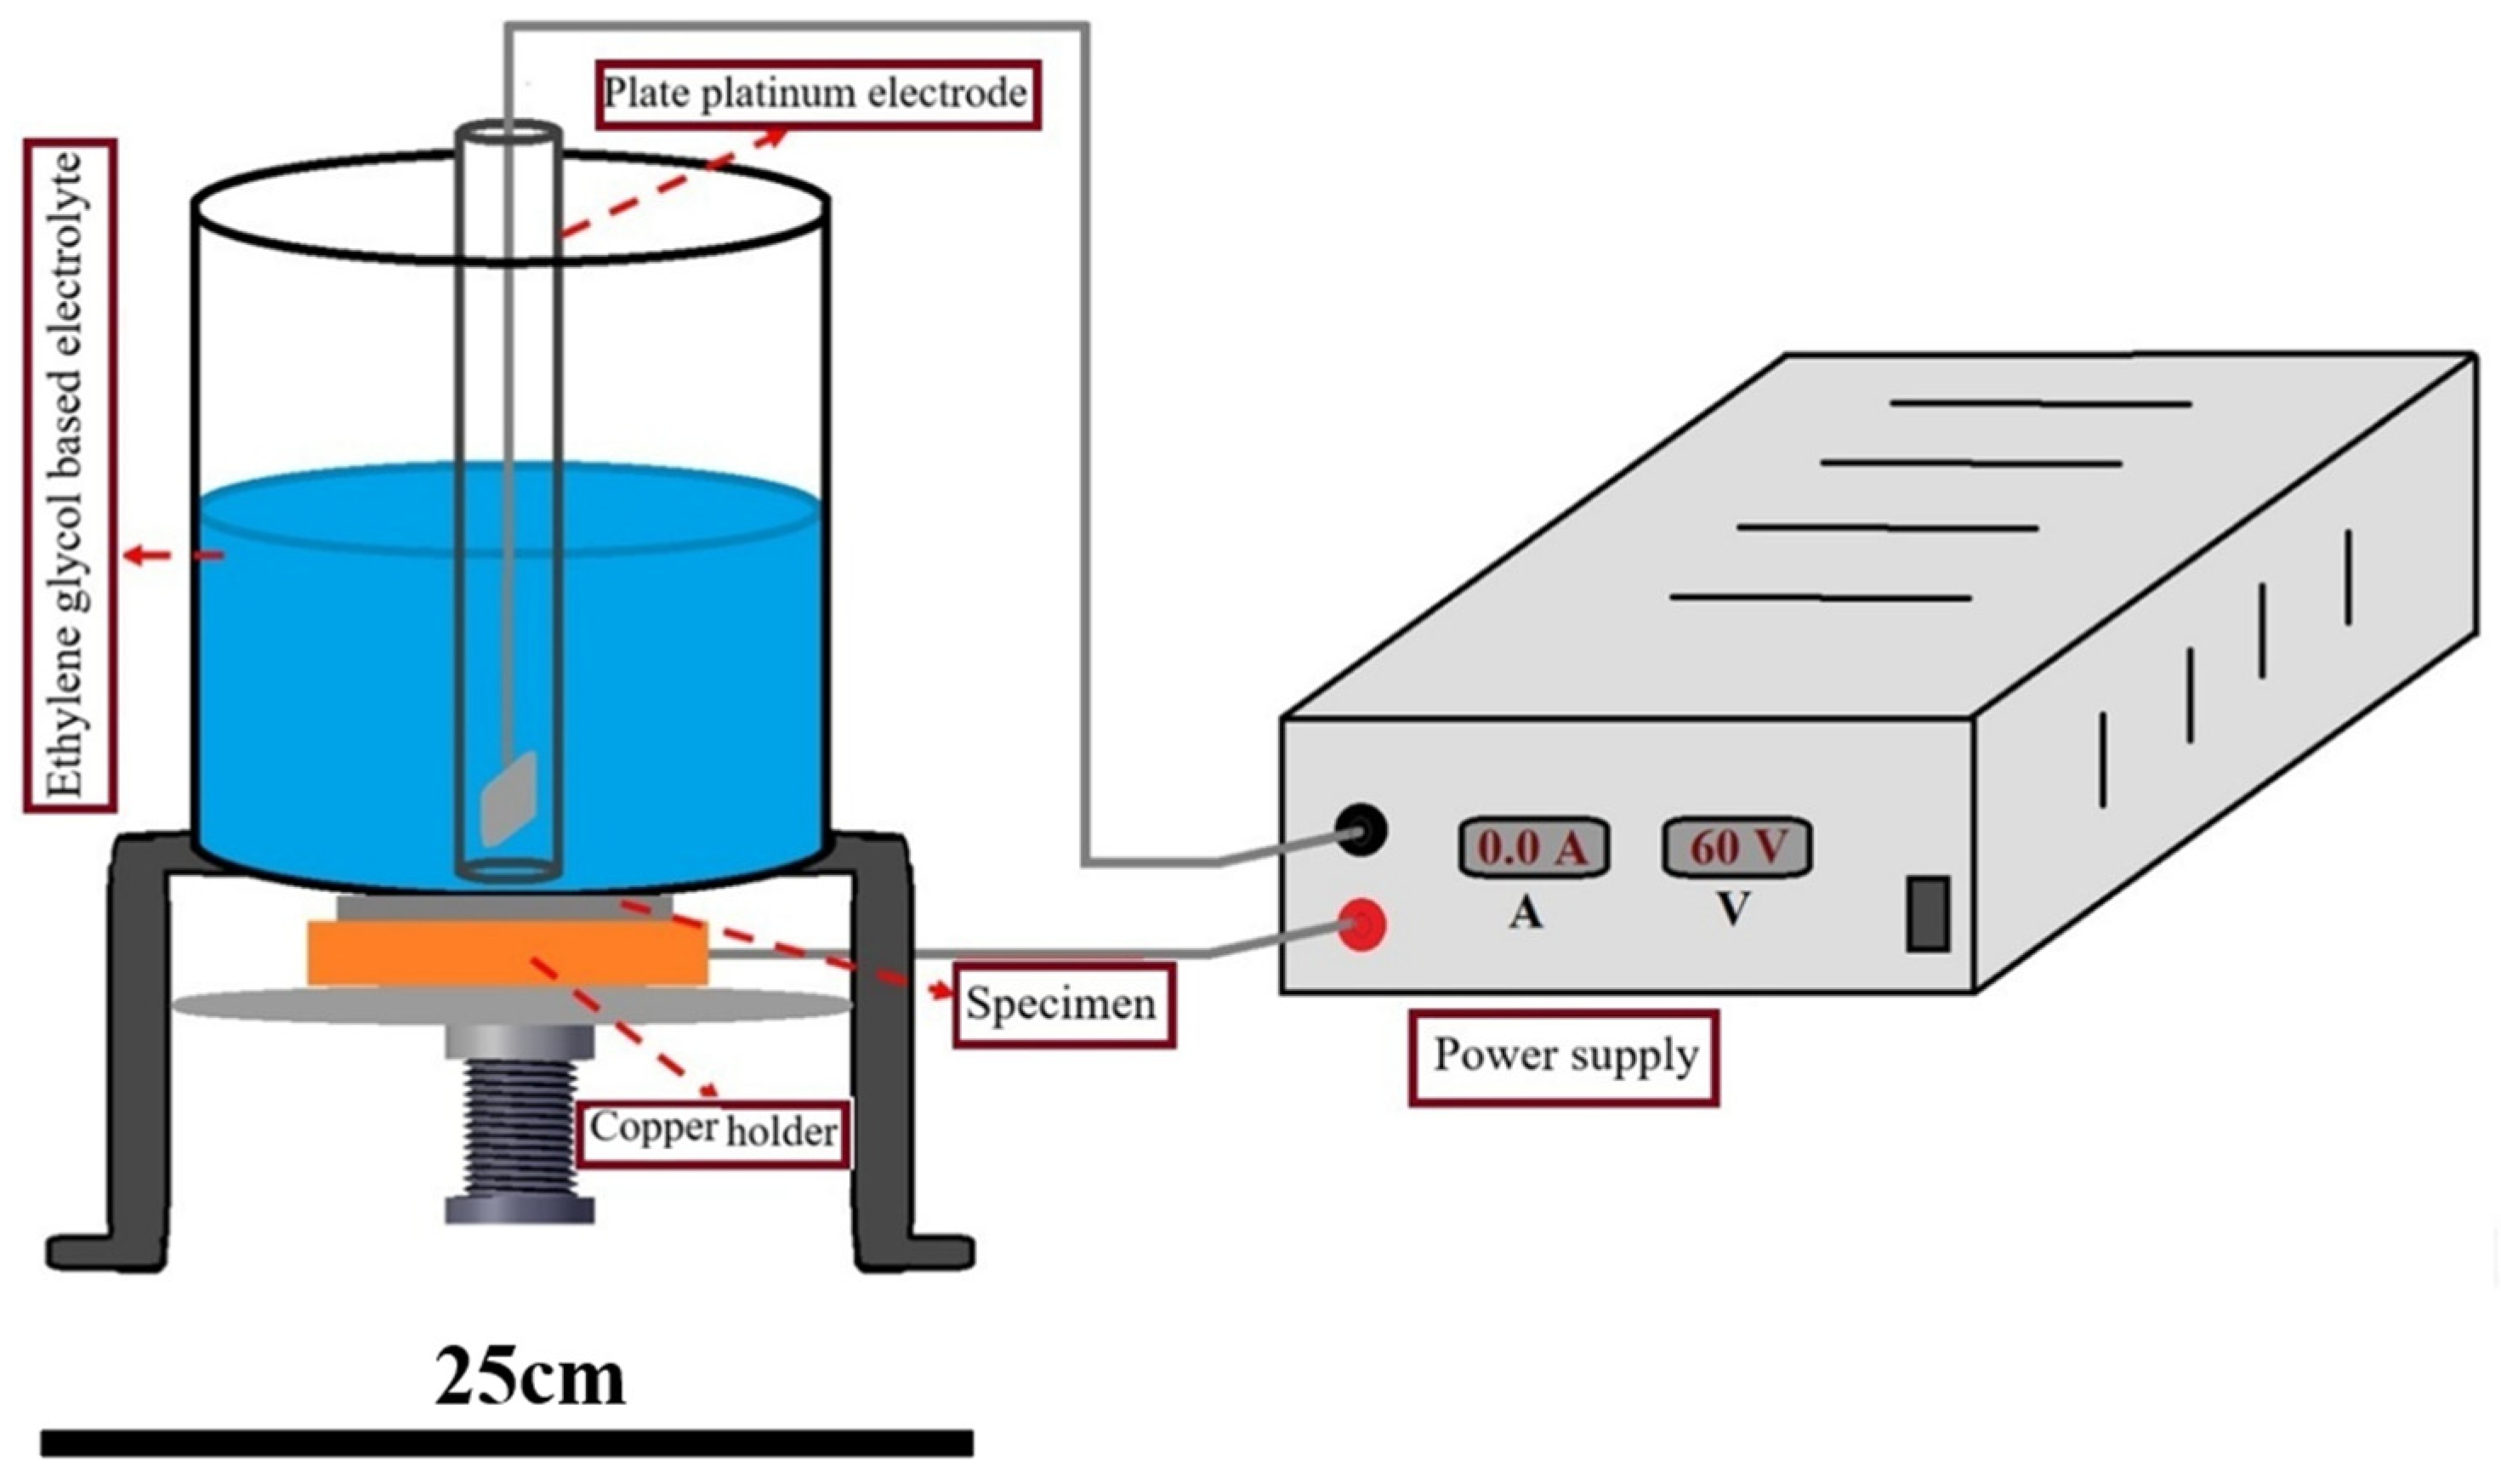
2 specimens and ultrasonically cleaned in acetone, ethanol, and deionized water for 10 min each, followed by drying under cold air. In our two-electrode system, as shown in
Figure 1, the sample is fixed at the bottom during the anodization process. The lower portion of the Ti foil is connected to the anode through a copper sheet, while only the upper portion is exposed to the electrolyte containing ammonium fluoride and ethylene glycol. A platinum sheet serves as the cathode, as illustrated in
Figure 16. In practice, the effective exposed region where anodization occurs corresponds to an approximately circular area of about 1 cm
2. Therefore, this active area was considered in all current density calculations to simplify the analysis. Although the geometric size of the Pt counter electrode (0.27 cm
2) is smaller than the total size of the Ti foil, the effective anodized region is limited to ~1 cm
2, which helps maintain a stable current distribution within the electrochemical cell during the anodization and hydrogenation processes.
According to
Figure 16, the anodization was performed in a two-electrode electrochemical cell using titanium foil as the anode and a platinum sheet (0.27 cm
2) as the cathode. The electrolyte consisted of ethylene glycol containing 5 vol.% deionized water and 0.15 M NH
4F. A constant DC voltage of 60 V was applied at room temperature for different anodization times (25, 50, 75, and 100 min) to investigate the influence of nanotube geometry on electrochemical performance. After anodization, the specimens were thoroughly rinsed with deionized water and dried. The obtained nanotube layers were initially characterized and preserved for subsequent modification steps [
29,
30].
3.2. Thermal Annealing and Defect Engineering via Hydrogenation
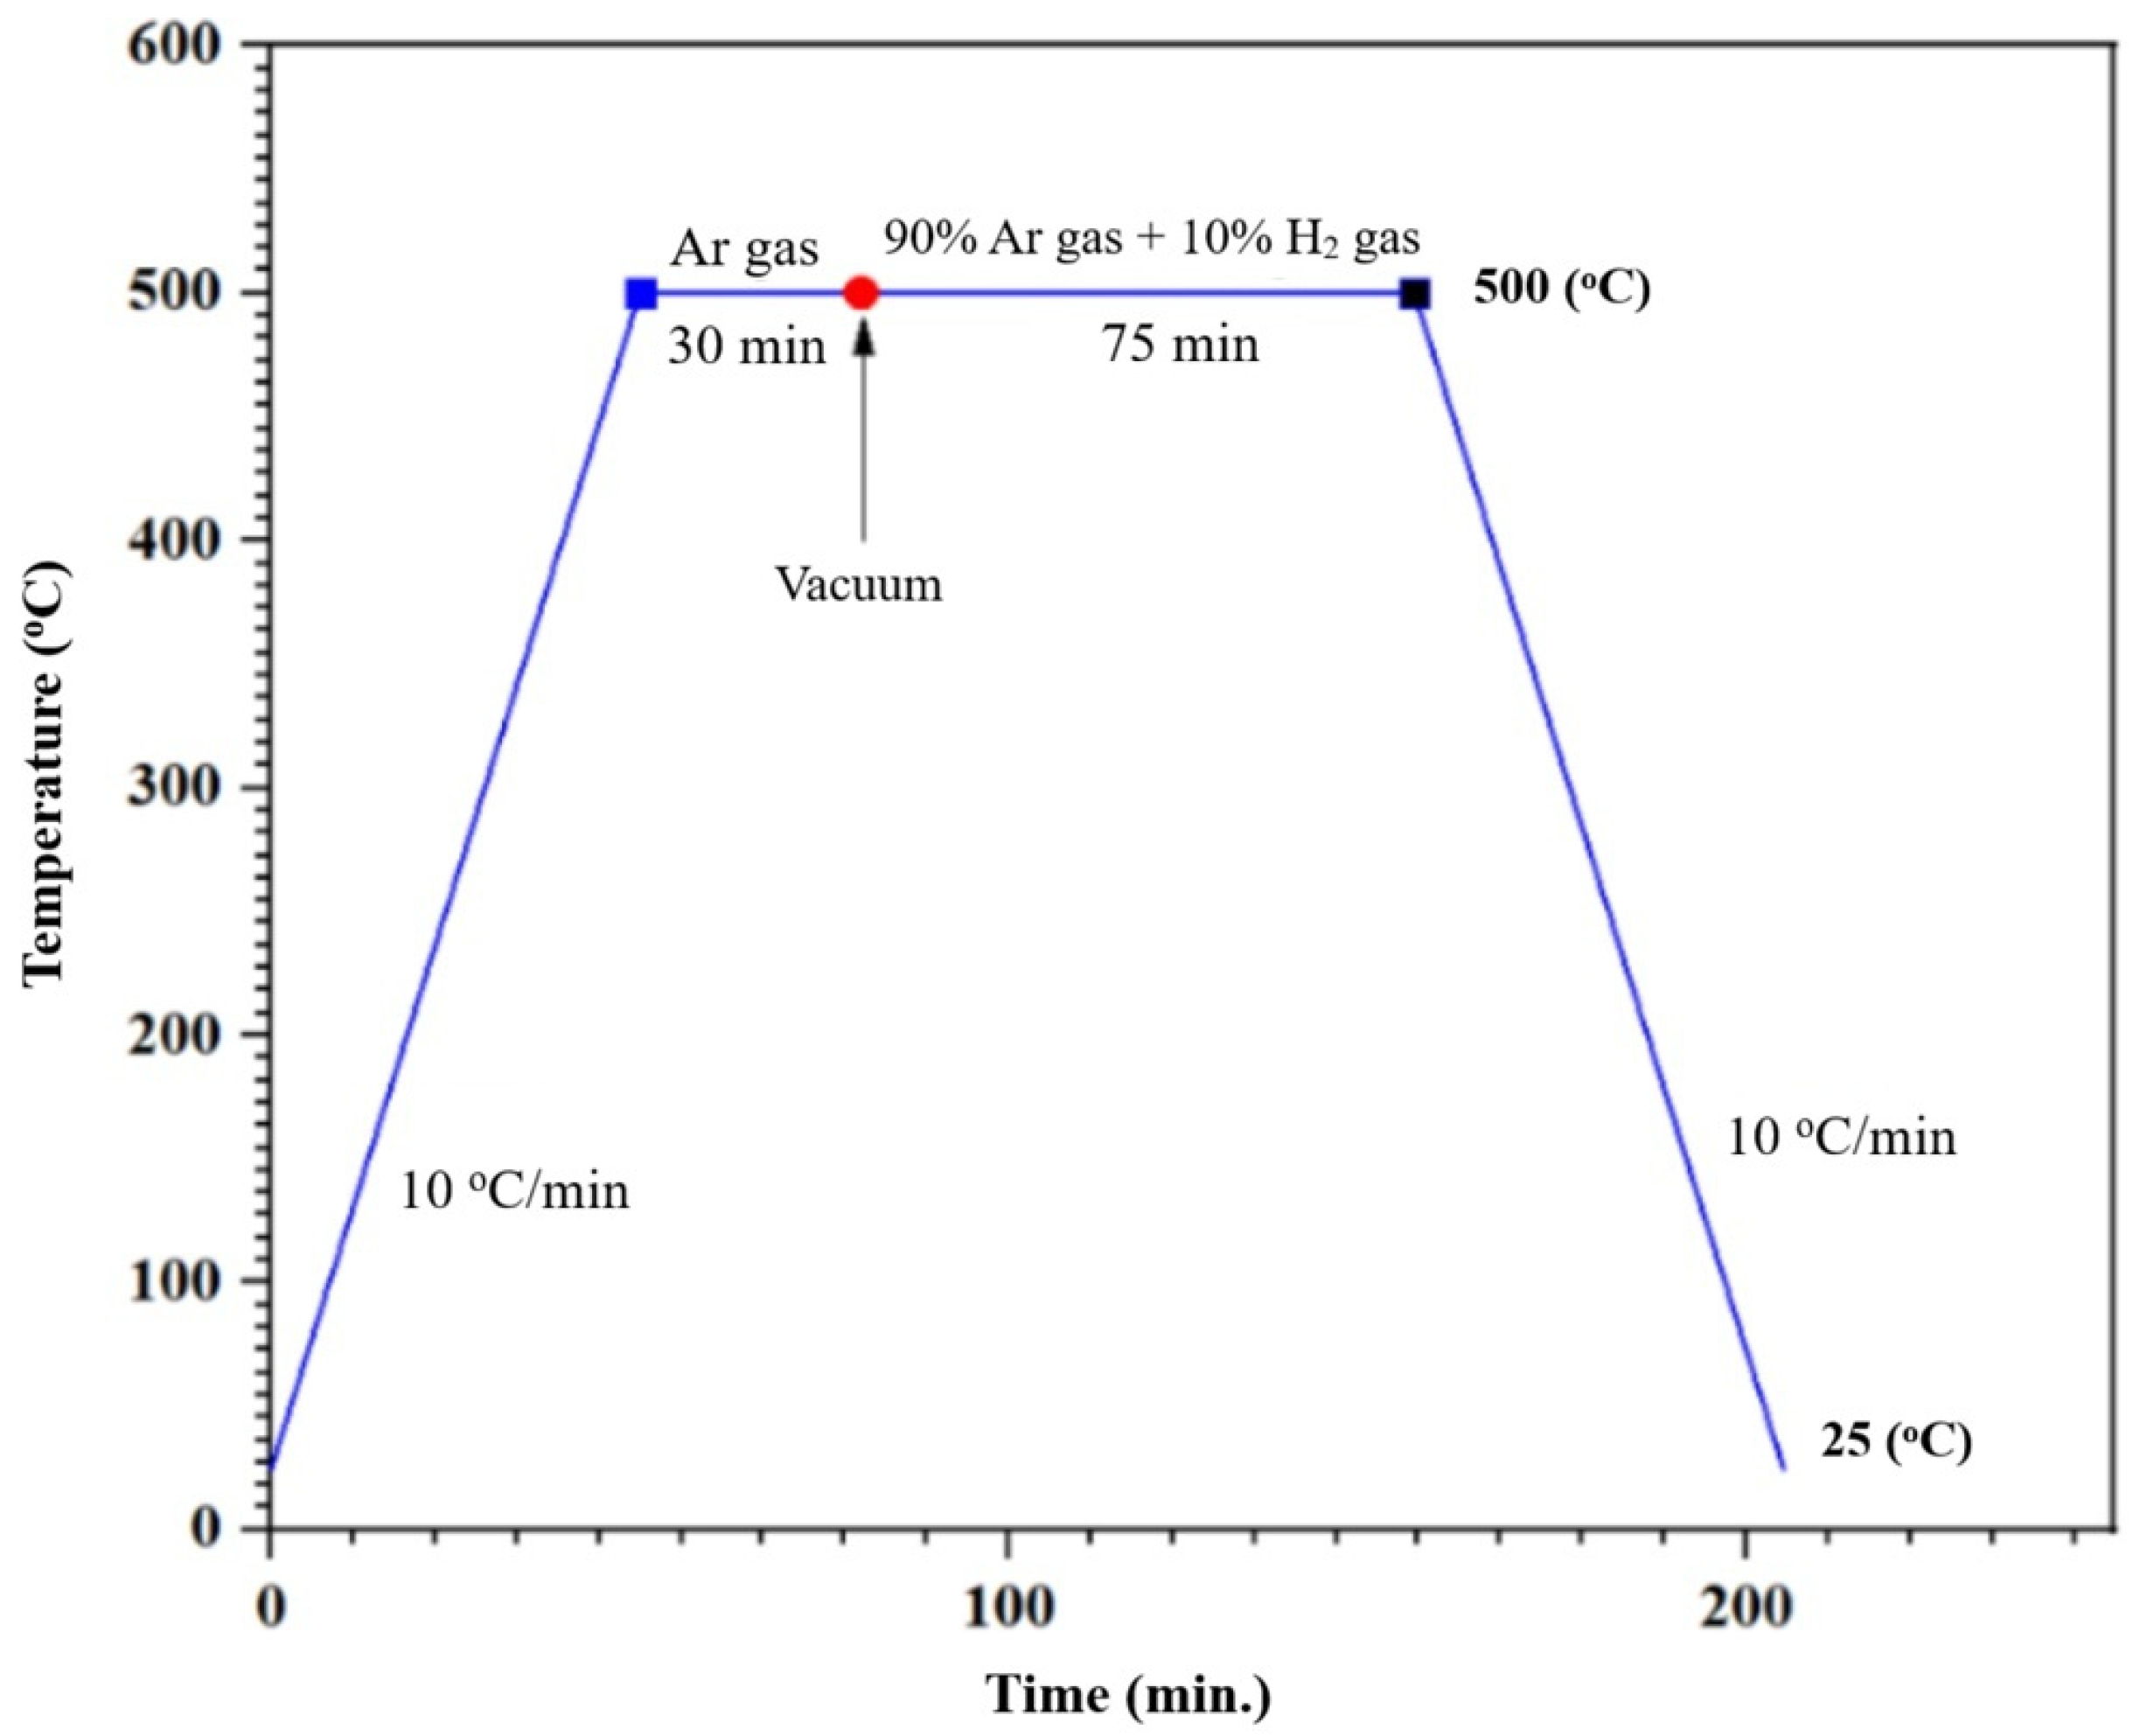
As illustrated in
Figure 17, to enhance the crystallinity and electrochemical activity of the anodized TNTs, a thermal annealing treatment was conducted to transform the amorphous structure into the anatase phase. The specimens were annealed at 450 °C for 1 h in air using an electric furnace and then cooled naturally to room temperature.
To further improve the electronic conductivity and introduce catalytically active defect states, the annealed TNTs were subjected to hydrogenation treatment. The specimens were thermally treated at 500 °C for 75 min under a reducing atmosphere composed of 90% Ar and 10% H2, with a gas flow rate of 50–70 mL min−1. Prior to hydrogenation, the furnace chamber was purged with argon for 30 min to eliminate residual oxygen. This process was designed to generate oxygen vacancies and Ti3+ species within the TiO2 lattice, thereby facilitating charge transport and enhancing electrocatalytic activity toward hydrogen evolution.
3.3. Chemical Decoration of Defective TNTs with Copper Species
To further promote the electrocatalytic hydrogen evolution reaction (HER), the hydrogenated TNTs were chemically decorated with copper species. Based on preliminary electrochemical screening, the most active hydrogenated specimen was selected for copper decoration.
For this purpose, 0.25 g of Cu(NO3)2 was dissolved in 100 mL of distilled water under magnetic stirring. Separately, 0.4 g of NaOH was dissolved in 10 mL of distilled water, and 0.2 g of NaBH4 was dissolved in 5 mL of distilled water without stirring. During the decoration process, the TNTs specimens were immersed in the Cu(NO3)2 solution, followed by dropwise addition of NaOH and subsequently NaBH4, leading to in situ reduction and deposition of copper species on the nanotube surfaces. The decoration was carried out for different durations (15, 30, 45, and 60 min) to control copper loading. After completion, the specimens were rinsed repeatedly with deionized water and ethanol and dried prior to characterization.
3.4. Structural, Surface, and Electrochemical Characterization
The crystalline structure and phase evolution of the specimens at different processing stages were examined by X-ray diffraction (XRD) using a Bruker D8 Advance diffractometer (Billerica, MA, USA) with Cu Kα radiation (λ = 1.5406 Å) over a 2θ range of 20–90°. Surface morphology, nanotube dimensions, and copper distribution were investigated using field-emission scanning electron microscopy (FE-SEM, TESCAN MIRA3, Brno, Czech Republic) equipped with energy-dispersive X-ray spectroscopy (EDS). Raman spectroscopy (532 nm Nd:YAG laser) was employed to analyze vibrational modes and structural defects.
Electrochemical measurements were carried out using a standard three-electrode configuration connected to a potentiostat/galvanostat. The Cu-decorated TiO2 nanotube electrode served as the working electrode, while a platinum mesh was used as the counter electrode and an Ag/AgCl electrode acted as the reference electrode. The electrolyte consisted of 1 M KOH aqueous solution. Prior to measurements, the electrolyte was purged to remove dissolved gases and ensure stable conditions. Linear sweep voltammetry (LSV) was performed at a slow scan rate to evaluate the hydrogen evolution reaction (HER) activity, and all measured potentials were converted to the reversible hydrogen electrode (RHE) scale according to the standard equation. Long-term stability was evaluated using chronoamperometric measurements under a constant applied potential. These conditions were selected to ensure reliable evaluation and comparison of the electrocatalytic HER performance. Linear sweep voltammetry (LSV), potentiodynamic polarization (PDP), electrochemical impedance spectroscopy (EIS), and Mott–Schottky analysis were performed using a PalmSense 4 potentiostat. For benchmarking purposes, a commercial Pt/C catalyst was tested under identical conditions. It is important to note that in order to facilitate the data presentation, the specimens were coded. For instance, in the AA′H75 specimen, A, A′, H and 75 are related to anodizing, annealing, hydrogenation and anodizing time (min), respectively. In the case of AA′HD60 specimen, A, A′, H, D and 60 are related to anodizing, annealing, hydrogenation and decoration time (min), respectively.
All electrodes were connected to a potentiostat system (PalmSens4 instrument) for the linear sweep voltammetry (LSV) and amperometry measurements. LSV (J–V) curves were recorded at a scan rate of 5 mV/s, while chronoamperometric measurements (J–t) were conducted at 1.23 V vs. the reversible hydrogen electrode (RHE), with an illumination on/off cycle of 20 s. The electrolyte used for all electrochemical measurements was 1 M KOH. These experimental details have now been clearly specified in the revised manuscript to ensure clarity and reproducibility.






 ,
,