
Article

Oxytetracycline Removal in a PLA-Immobilized Laccase Bioreactor: Experimental Evaluation and Diffusion–Convection–Reaction Modeling

1
Departamento de Matemática, Facultad de Ciencias Naturales, Matemática y Medio Ambiente, Universidad Tecnológica Metropolitana, Las Palmeras 3360 Ñuñoa, Santiago 7800003, Chile
2
Departamento de Biotecnología, Facultad de Ciencias Naturales, Matemática y Medio Ambiente, Universidad Tecnológica Metropolitana, Las Palmeras 3360 Ñuñoa, Santiago 7800003, Chile
*
Author to whom correspondence should be addressed.
Catalysts 2026, 16(5), 398; https://doi.org/10.3390/catal16050398
Submission received: 6 March 2026 / Revised: 11 April 2026 / Accepted: 13 April 2026 / Published: 30 April 2026
(This article belongs to the Special Issue Enzyme Design, Engineering and Applications in Efficient Biocatalysis)

Abstract

This work presents a novel integrative approach to the design and computational modeling of a bioreactor system for the enzymatic removal of antibiotics from aquatic environments. The study focuses on a three-dimensional mathematical model developed to resolve the diffusion–convection–reaction dynamics within the system. Programmed in MATLAB R2025a, the model integrates theoretical equations to determine the diffusion and convection coefficients, while the reaction rate constant was precisely determined through the experimental degradation data of oxytetracycline. To support this modeling, laccase was covalently immobilized on a chemically modified polylactic acid (PLA) matrix, achieving a 95.6% immobilization yield. Simulation results revealed that the system is primarily governed by the convection constant and that degradation efficiency is significantly optimized by reducing the reactor’s internal diameter. These findings demonstrate that the coupling of theoretical transport phenomena with experimentally derived kinetics provides a high-resolution tool for predicting bioreactor performance. By combining biocatalysis, materials science, and computational modeling, this research offers a scalable and environmentally friendly solution with direct implications for the development of advanced water treatment technologies.

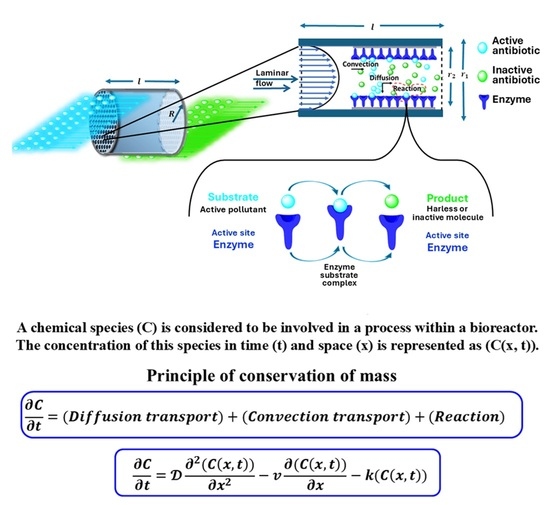
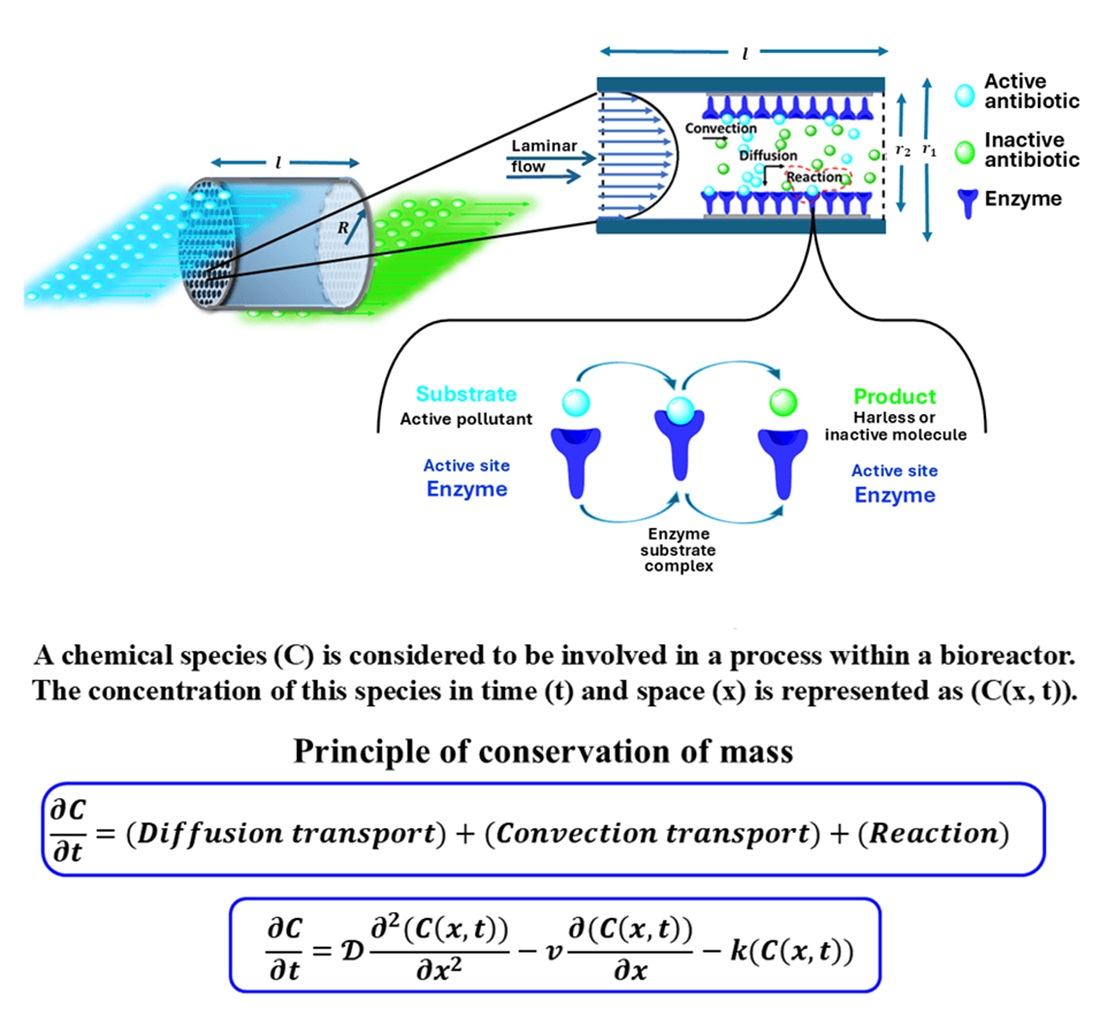
Graphical Abstract

1. Introduction

The hydrosphere is a vital system for life on the planet, supporting social and economic needs globally, with industrial fishing being a prime example. However, uncontrolled exploitation and anthropogenic activities have introduced a range of pollutants that, despite their low concentrations, pose fatal risks to ecosystems due to their high chronic toxicity and bioaccumulation potential. These pollutants are known as emerging contaminants, originating from various sources and encompassing agrochemicals, microplastics, hormones, dioxins, phenolic compounds, nanomaterials, and perfluorinated substances [1]. Among the most concerning emerging contaminants are antibiotics, which are commonly used to combat bacterial infections in human and veterinary medicine. Their excessive use significantly contributes to the development of genetic resistance [2,3], posing a public health issue and a threat to modern medicine in combating infectious diseases. In 2015, the European Union sold a total of 8298.7 tons of antibiotics for veterinary purposes, with tetracyclines (2722.8 tons), penicillins (2072.2 tons), and sulfonamides (978.4 tons) being the most utilized [4]
The salmon farming industry, in particular, is characterized by the extensive use of antibiotics, with oxytetracycline being one of the most frequently employed due to its pharmacological properties and cost-effectiveness [5]. This compound is administered via fish feed and disperses into the aquatic environment through uneaten feed, as well as residues in urine and feces, ultimately accumulating in marine sediments [6]. To mitigate the impact of these contaminants on water supplies and food chains, bioremediation represents a viable solution. This biotechnological approach utilizes living organisms or their components to degrade or decompose such substances, converting them into less toxic or environmentally benign compounds [7]. In this context, enzyme-based processes have become one of the most effective methods for removing emerging contaminants.
One of the enzymes with the greatest potential for use in bioremediation is laccase, an oxidoreductase that has garnered significant interest due to its ability to oxidize a wide range of substrates, including phenolic compounds, aromatic amines, diamines, thiol groups, and related substances [8], most of which are considered emerging contaminants. These substrates include several antibiotics, such as oxytetracycline, which can be toxic to marine microbiota, even at concentrations below 0.1 mg L−1 (0.0002 mol m−3) [9].
The enzyme laccase can be used in either free or immobilized form; however, immobilization is considered an essential step in water treatment. It offers several advantages for the catalyst, including enhanced stability, ease of separation from the reaction mixture, reusability, reduced inhibition, increased activity across a wide pH range, thermal stability, and the ability to be utilized in various types of industrial reactors [10,11].
In recent years, a wide range of enzymes have been immobilized onto various materials, with ion exchange resins, agarose gels, synthetic polymers, alumina, membranes, and nanoparticles being the most commonly used. Synthetic chemistry has played a pivotal role in developing new materials with enhanced properties applicable to this field. Today, the chemical functionalization of many polymers and thermoplastic materials has enabled the design of 3D-printed scaffolds for diverse applications in medicine and analysis [12,13]. Polylactic acid (PLA) is a biodegradable polymer widely utilized in fused deposition modeling technology, which can be chemically modified to incorporate new chemical groups capable of covalently binding to the functional groups of enzymes, including laccase [14,15].
This research proposes the design of a cylindrical scaffold with small orifices, using a PLA material modified with surface-immobilized laccase, with the aim of developing a bioreactor with the potential to be used in uncontrolled environments for the removal of emerging contaminants. To this end, a transient diffusion–convection–reaction model is employed, and the solution is obtained using numerical methods. Such models are commonly used in chemical engineering for the design of reactors involving heterogeneous reactions, where transport phenomena occur under laminar flow conditions. In this context, the present study gains relevance by integrating mathematical modeling with experimental data, enabling the optimization of the bioreactor design and the prediction of its performance under real conditions, thereby contributing to the development of efficient and sustainable strategies for the removal of emerging contaminants in aquatic systems.

2. Results and Discussion

The mathematical model developed with the principles of mass transfer and enzymatic reactions describes the change in concentration C within a given volume V based on the hypothetical data described in Table 1. The concentration C is determined by the sum of the inputs, outputs, generation, and consumption occurring within the volume over time.
The processes involved in enzymatic reactions are highly varied, and there are several operational conditions that need to be simplified when developing the mathematical model. For this system, an ideal and fully homogeneous regime is assumed. Furthermore, experimental data is limited or taken from hypothetical external sources, which often deviate from the issue at hand or produce unexpected results.
In this study, the coefficients were obtained using different techniques: the chemical group contribution method was employed to obtain the diffusion coefficient, while fluid mechanics equations were used to determine the convection coefficient (see Appendix A for details). Additionally, the kinetic parameters for the equation were experimentally obtained.

2.1. Diffusion Coefficient

The diffusion coefficient 𝒟 is a fundamental transport property that depends on solute size, solvent viscosity, and system temperature. Several experimental techniques have been developed to measure 𝒟 with high accuracy, including optical methods, nuclear magnetic resonance spectroscopy [16], and capillary-based UV-VIS spectrophotometric HPLC [17]. While these methods yield precise results, they are experimentally demanding and require sophisticated, high-cost instrumentation.
Alternatively, empirical correlations have been proposed to estimate 𝒟 based on the physicochemical properties of both the solute and the solvent. Among these, the Wilke–Chang equation remains one of the most widely applied models for estimating diffusivity in dilute liquid systems [17,18,19]. However, its applicability is restricted to non-electrolyte solutes within a limited range of solvents, typically yielding estimates within ±10% of experimental values [20]. Another commonly used correlation is the Nernst–Haskell equation, which applies to aqueous systems at infinite dilution but requires knowledge of ionic charge and molar conductivity [20]. Soriano et al. employed this approach to estimate the diffusion coefficients of various antibiotics, reporting values on the order of 9 × 10⁻⁹ m2/s [21]; nevertheless, these estimations were based on pharmaceutical formulations containing additional components such as vitamins, which potentially introduced systematic overestimation.
Beyond empirical models, theoretical approaches based on hydrodynamic and activated-state theories offer a more comprehensive framework for predicting diffusivity in liquids [20]. These models correlate D with intrinsic molecular properties such as viscosity, temperature, and molar volume. Specifically, the Stokes–Einstein equation is well-suited for estimating the diffusivity of large, approximately spherical molecules in low-molecular-weight solvents or suspensions. In the present work, the Stokes–Einstein relation was utilized to calculate the diffusion coefficient of oxytetracycline in a dilute aqueous solution. The hydrodynamic radius required for this estimation was determined via the group contribution method. Based on Equation (2) and the data presented in Table 2, the resulting diffusion coefficient was 5.7 × 10⁻¹¹ m2/s. This value is notably lower than those reported by Soriano et al. for similar antibiotics [21]; this discrepancy is attributable to methodological differences—specifically, Soriano’s reliance on conductivity data from multi-component pharmaceutical formulations, which may not accurately reflect the behavior of the analyte.
More recently, Miyamoto and Shimono compared theoretical and experimental diffusion coefficients for various biomolecules, applying the Stokes–Einstein equation using both effective and simple molecular radii [22]. Their results ranged from 3 × 10⁻¹⁰ to 8 × 10⁻¹⁰ m2/s, approximately an order of magnitude higher than the value obtained in the present study. This discrepancy is primarily attributed to the larger molecular radius estimated for oxytetracycline via group contribution analysis (Table 2), which significantly affects the calculated diffusivity.

2.2. Convective Velocity

Convection velocity, also referred to as fluid velocity, represents the speed at which substrates move through the bioreactor channel, and it is essential for determining how these molecules interact with the enzymes immobilized on the surface. It is directly related to the formation of the boundary layer on the surface of a solid over which a fluid moves and has been utilized to model the response of enzymatic sensors [23,24]. Therefore, fluid velocity significantly impacts the formation of a concentration gradient within the flow channel.
In the simulations conducted by Sikavitsas (2002), various flow velocities were evaluated, namely 0.066, 1.33, and 3.33 cm·s−1, corresponding to low, medium, and high flow regimes, respectively [25]. As flow velocity increases, boundary layer thinning occurs, reducing mass transport limitations and promoting a higher interaction frequency between bulk-phase and immobilized molecules. As a result, simulations at higher flow velocities (e.g., 3.33 cm·s−1) tend to exhibit greater efficiency in bioremediation processes. Conversely, excessively low flow velocities exacerbate mass transport resistance, thereby hindering the overall reaction rate.
Table 2 presents the convective velocity, calculated using the fluid mechanics equations, i.e., Equations (8)–(12), detailed in Table 3. The resulting velocity falls within the upper range, leading to more consistent responses and providing valuable insights for optimizing bioreactor variables. For the mathematical model, the mean convective velocity was employed under the assumption of a fully developed laminar flow regime within a cylindrical tube. This approach considered a Reynolds number of 29.7 according to Equation (7), where the velocity profile is characterized as parabolic.

2.3. Determination of Kinetic Parameters of the Biocatalyst

To determine the kinetics of the immobilized enzymatic reaction, the polylactic acid (PLA) support was first chemically functionalized following the procedure detailed in the Methodology section. The success of this modification was confirmed by FT-IR spectroscopy, identifying characteristic signals of unmodified PLA and distinctive spectral shifts in the functionalized derivative (Figure 1). The infrared spectrum of the unmodified PLA exhibited intense absorption bands at 1745.2 cm−1, corresponding to the carbonyl stretching (C=O); in the modified PLA, this signal was significantly accentuated. Additionally, a new signal at 1182 cm−1 in the modified PLA was ascribed to the stretching vibrations of the (C–O–C) group, which was absent in the pristine material. Furthermore, more intense signals were observed for the modified PLA at 1454 cm−1 and 1047 cm−1, related to asymmetric bending of the methyl group (–CH3) and alkoxy (C=O) stretching, respectively. The absorption peak at 2880.6 cm−1 is associated with the methine stretching bond [26]. Notably, the absence of broad absorption bands around ∼3400 cm−1 suggests a reduction in terminal hydroxyl groups, consistent with their involvement in the covalent functionalization process [27].
Laccase was successfully immobilized onto the chemically modified PLA pellets. The process was monitored by comparing the enzymatic activity of the supernatant before and after the procedure. The initial activity was 795.4 ± 9.4 IU L−1, which significantly decsubstancesreased to 34.7 ± 3.2 IU L−1 upon completion. This reduction corresponds to an immobilization yield (I%) of 95.6%, indicating a high affinity of the enzyme for the functionalized support and an almost complete removal of the protein from the solution. Furthermore, the retained activity (RA%) was found to be 34.1%. This value represents the fraction of the initial enzyme activity that is expressed by the biocatalyst after being bound to the support. The difference between the immobilization yield (amount of enzyme attached) and the retained activity (catalytic effectiveness) is a common phenomenon in covalent immobilization, often attributed to steric hindrance or partial conformational changes in the enzyme upon binding to the PLA surface.
Crucially, the successful immobilization of laccase is further evidenced by the FTIR spectra shown in Figure 1. The appearance of the Amide I and Amide II bands in the functionalized PLA spectrum confirms the presence of the protein structure on the support. The Amide I band, observed as a shoulder near 1655 cm−1, is primarily associated with the carbonyl group (C=O) stretching of the enzyme’s peptide bonds. Additionally, the Amide II band at ~1545 cm−1, derived from N–H bending and C–N stretching, provides definitive chemical evidence of the laccase presence on the PLA surface, thereby validating the immobilization process through both functional and structural analysis.
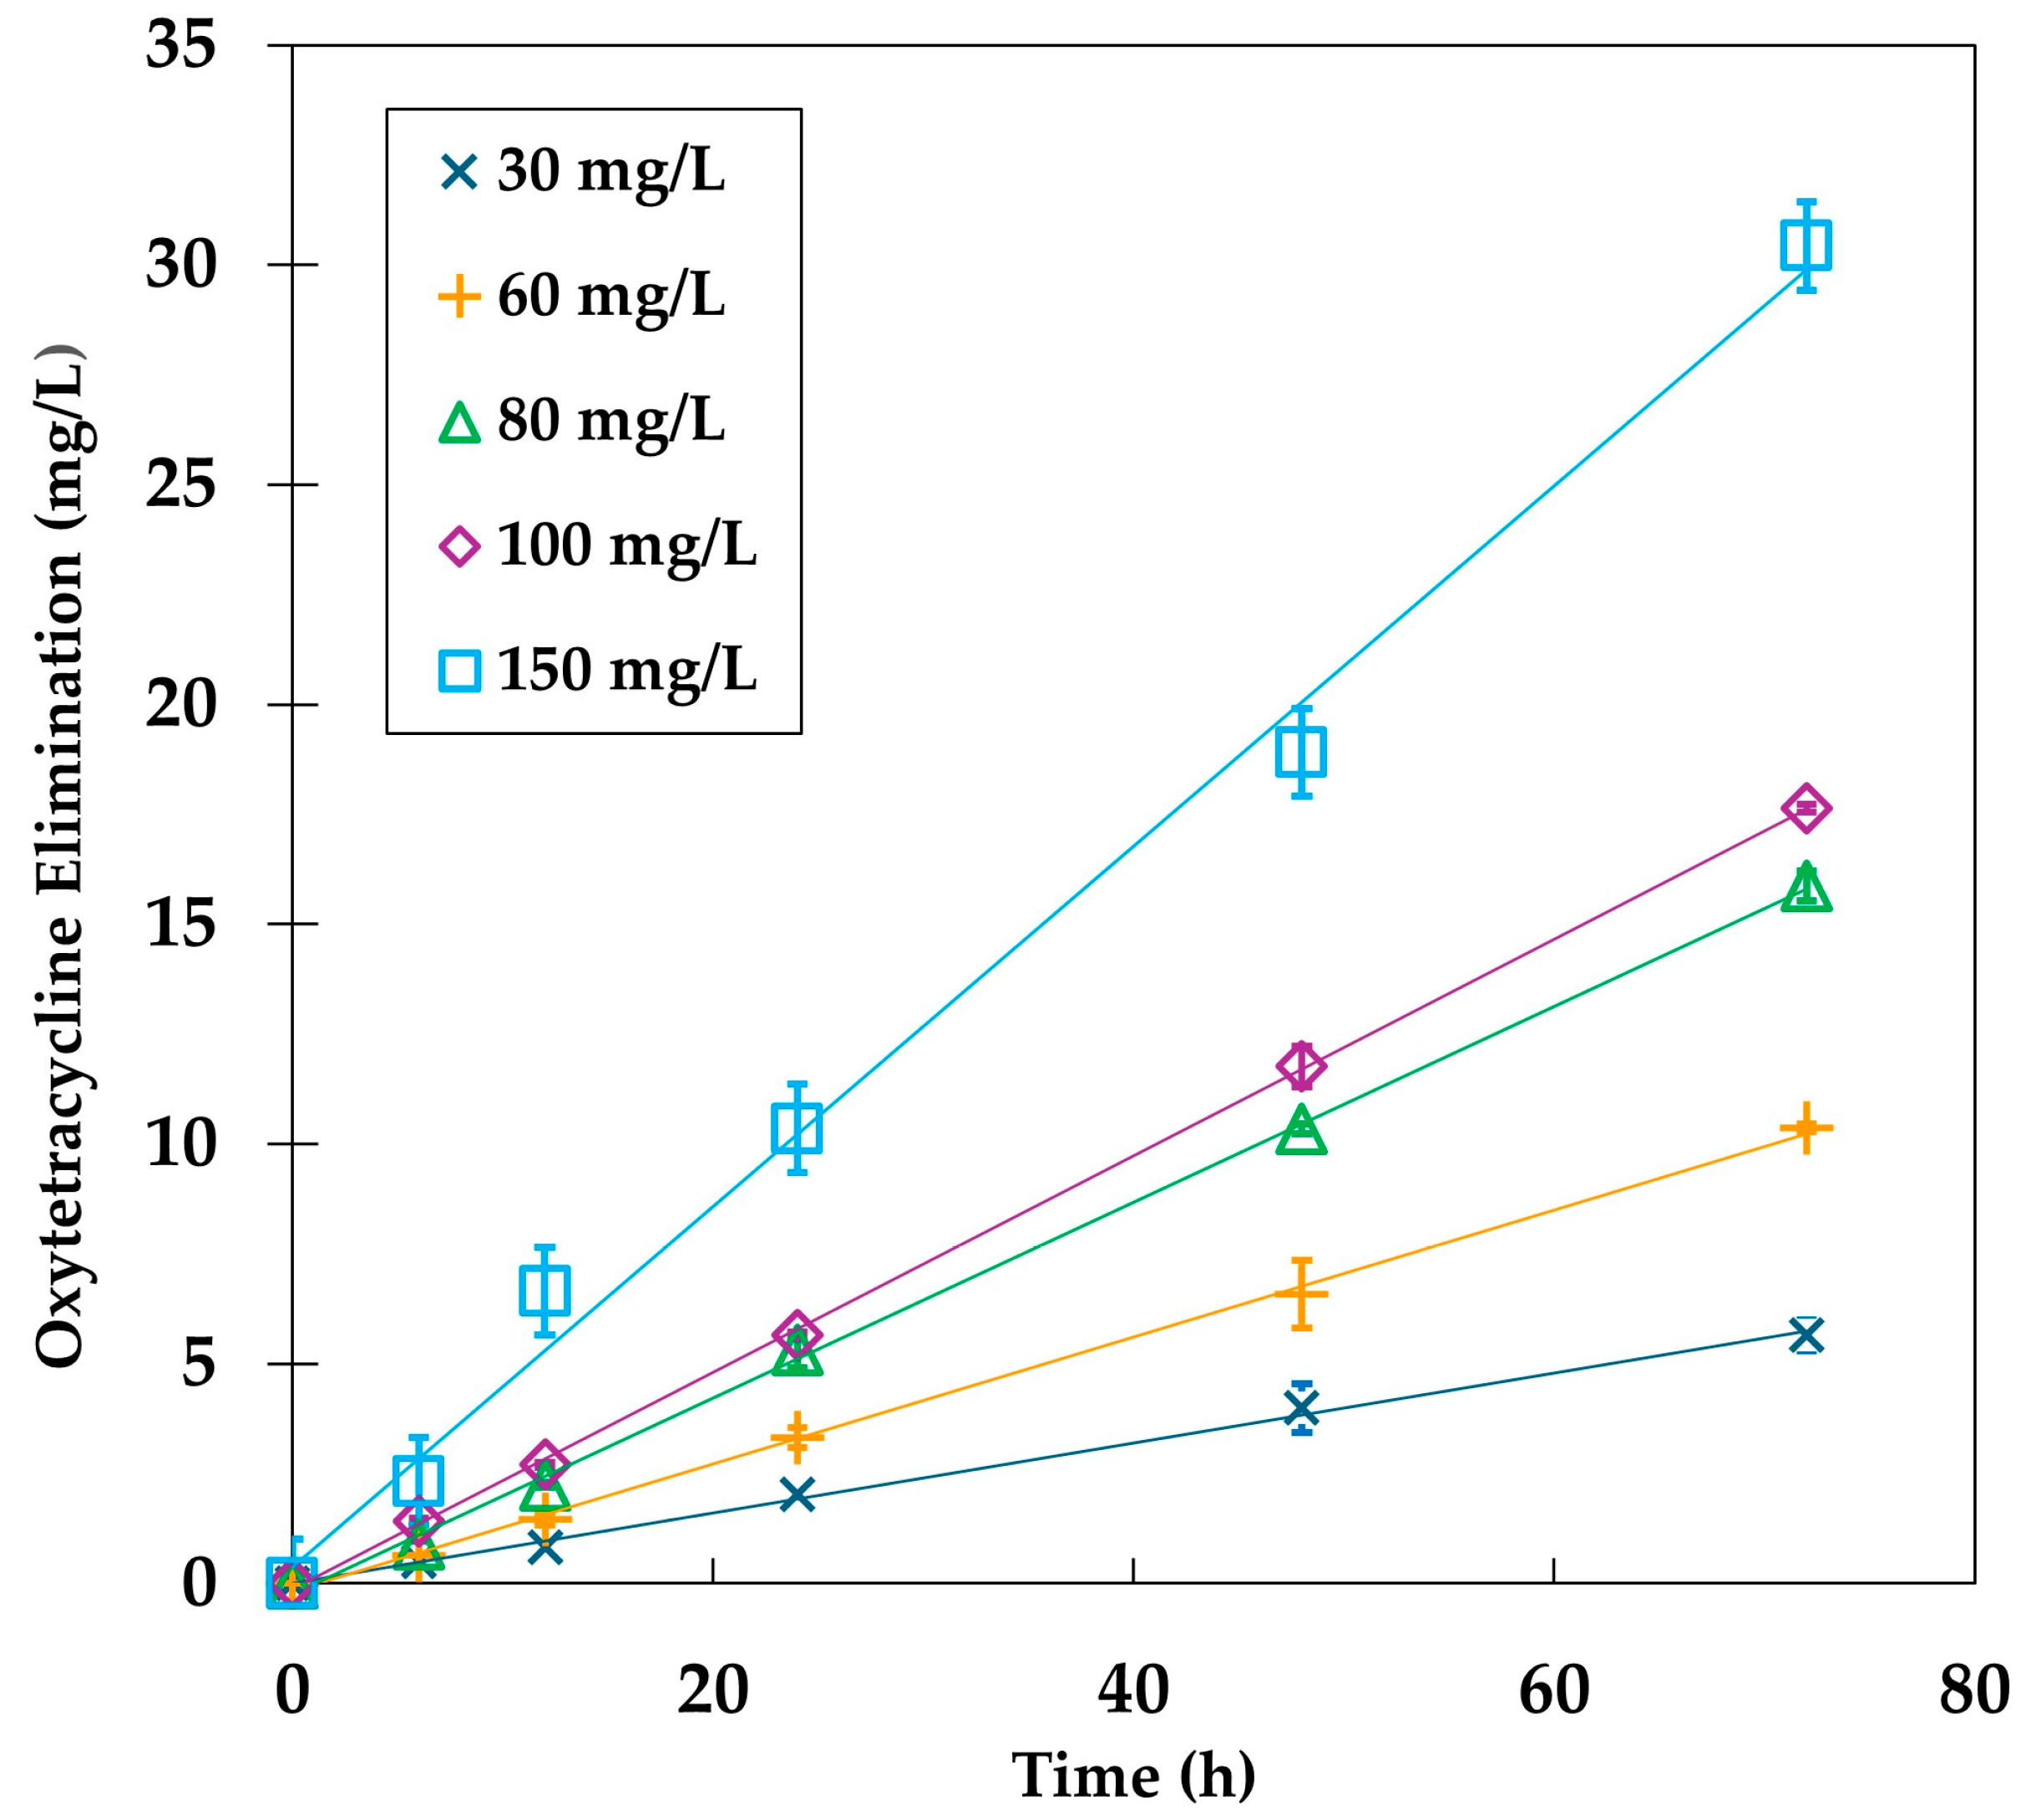
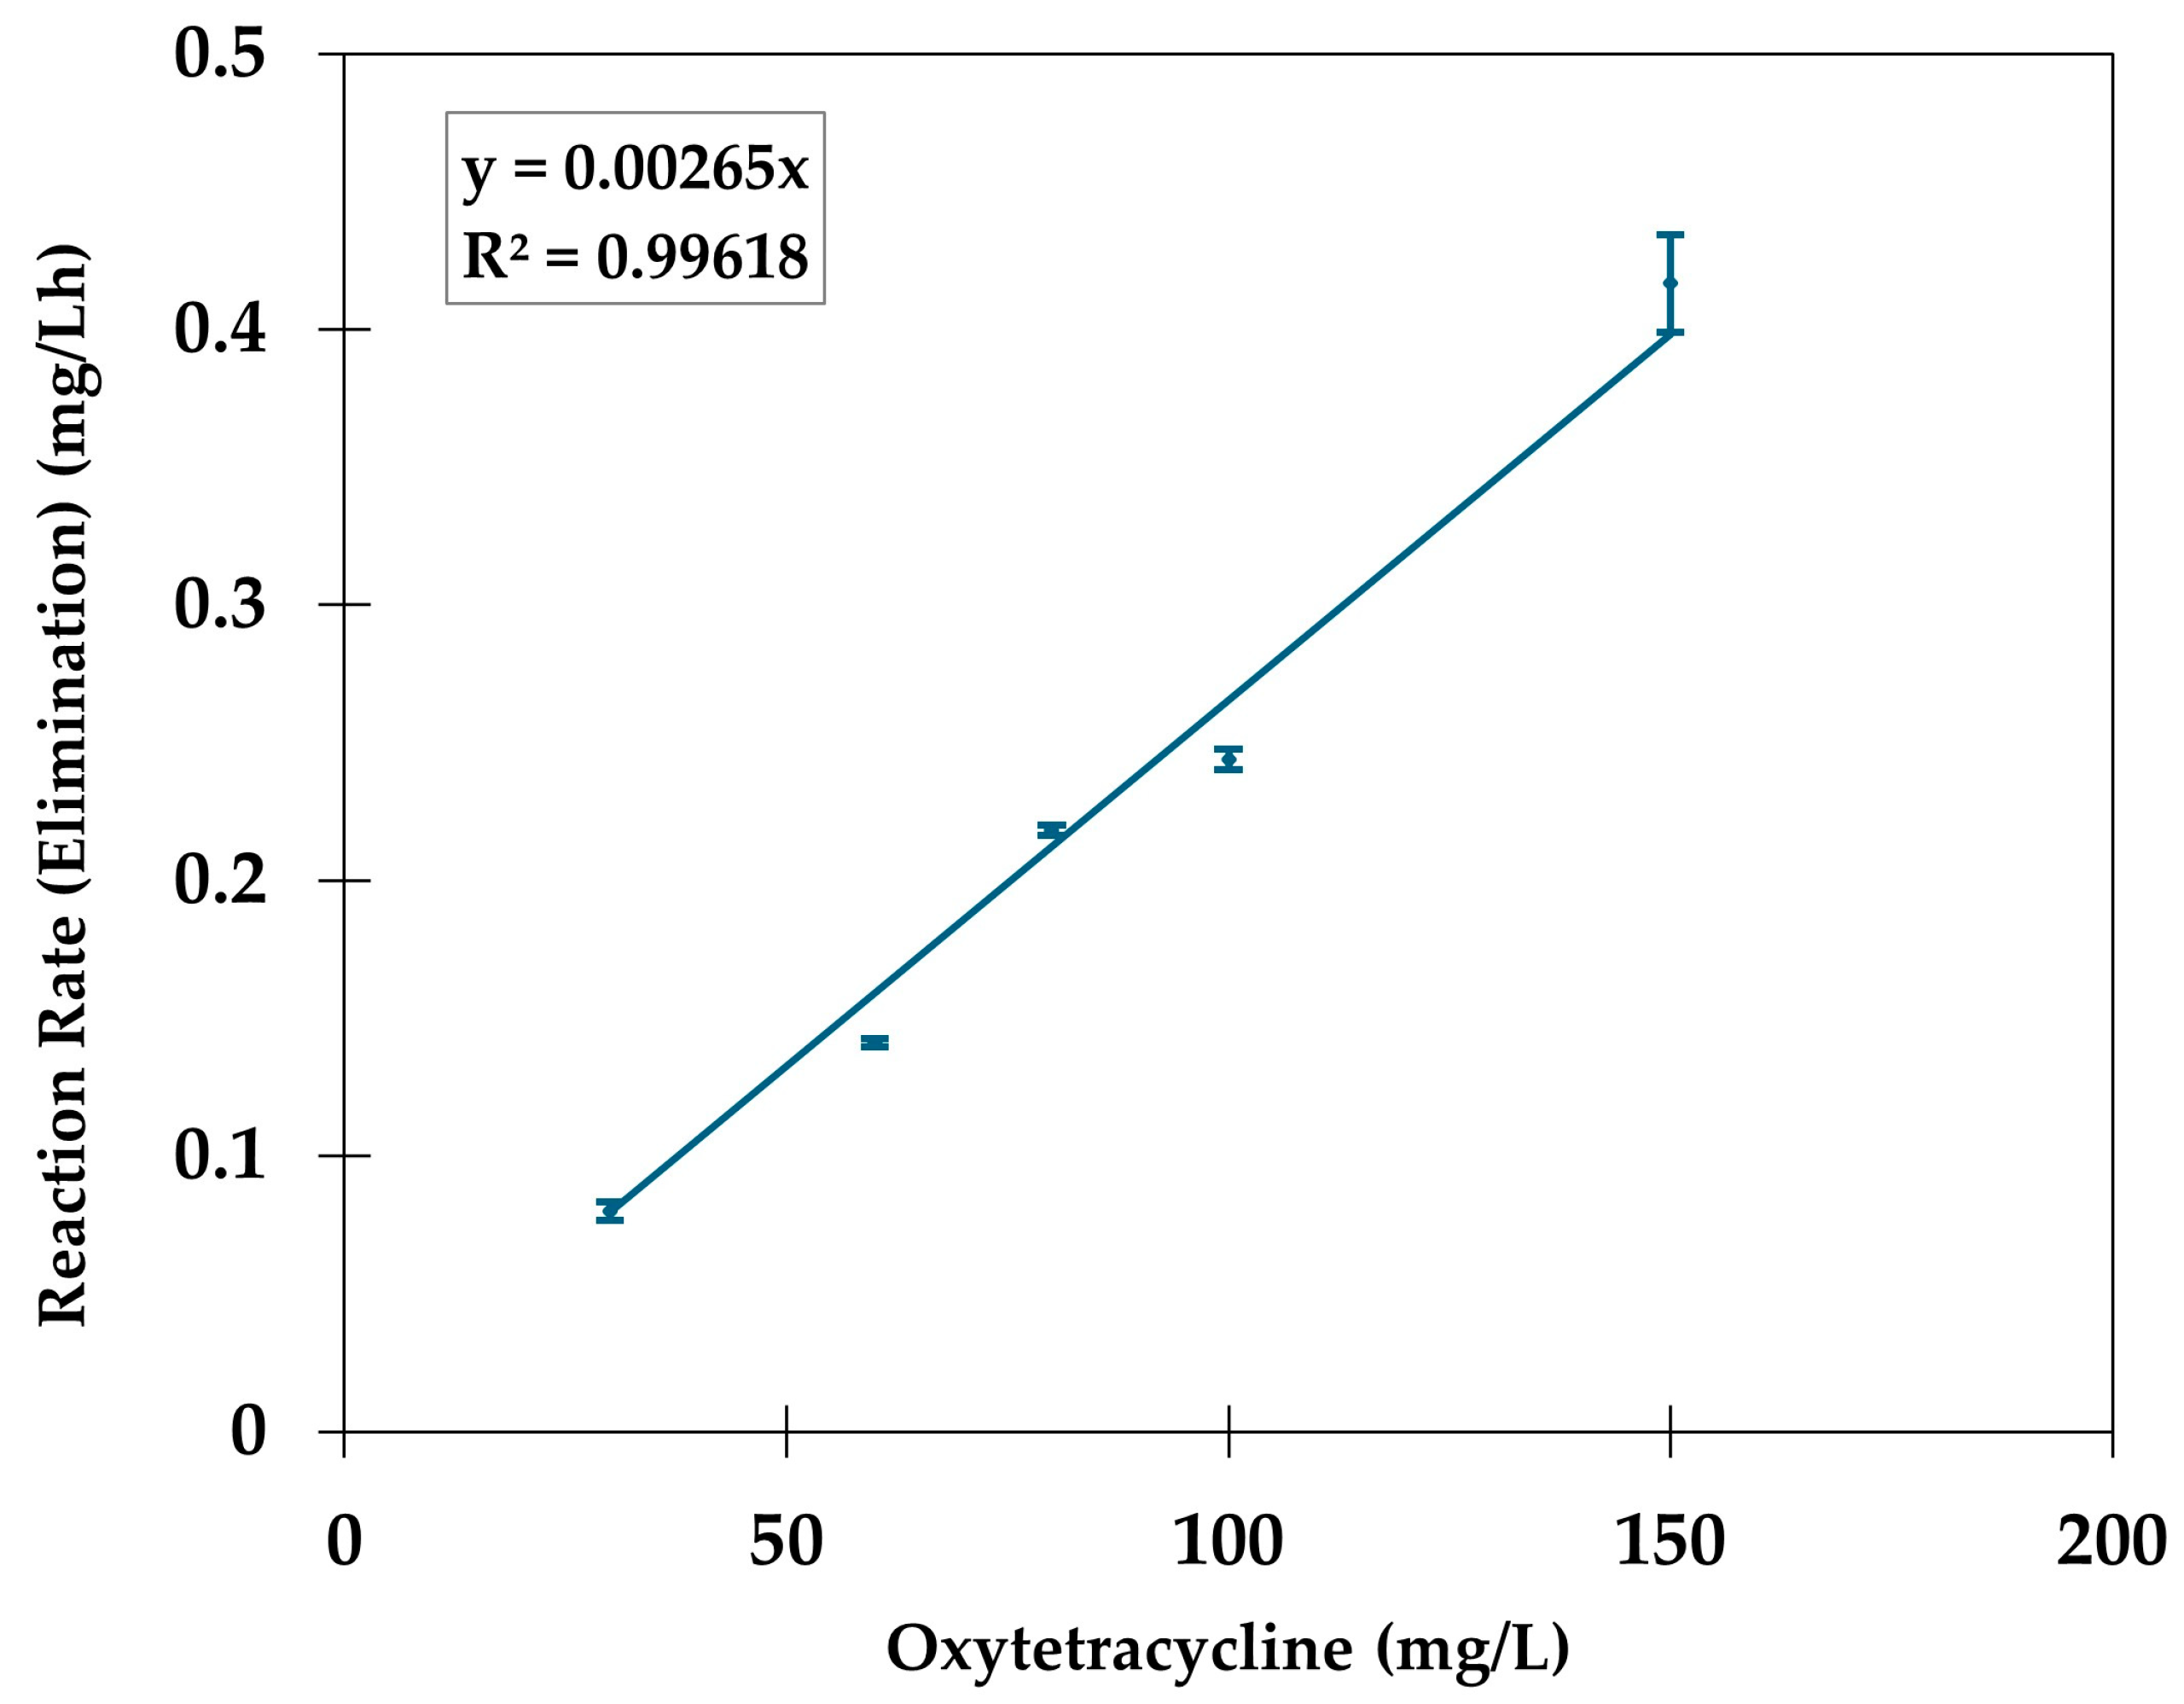
The catalytic performance of the laccase-functionalized PLA was subsequently evaluated by determining the elimination reaction rates across a range of initial oxytetracycline concentrations. This approach aimed to identify the governing kinetic model by monitoring oxytetracycline elimination over time (Figure 2). The results strictly adhered to a first-order kinetic model, indicating that the reaction rate is linearly dependent on the initial substrate concentration within the evaluated range. The elimination rates were derived from the slopes of the concentration-versus-time plots, with all calculated values exhibiting high precision (standard errors < 5%). Based on these experimental datasets, the elimination rate constant (k) was determined (Figure 3), yielding a value of 2.6 × 10⁻³ ± 0.06 × 10⁻³ h−1. The obtained constant is significantly lower than values reported for the soluble enzyme, aligning with observations by other authors [28]. It is hypothesized that the immobilization process affects the kinetic constants, generally leading to a decrease in their values due to mass transfer limitations, external diffusional restrictions, and enzyme aggregation on the support surface [29]. Furthermore, Galodiya and Chakma [28] determined kinetic parameters at concentrations ten times lower than those used in this study and employed Michaelis–Menten kinetics, in contrast to the pseudo-first-order kinetics observed in the present work.
The PLA material with immobilized laccase enzyme was used to carry out the removal of the antibiotic oxytetracycline in solution at different initial concentrations. This approach aimed to identify the kinetics that best fit the experimental data by measuring oxytetracycline removal at various reaction times, as shown in Figure 2. The results allow the parameters to be adjusted to a first-order kinetic model, indicating that the reaction rate increases with higher initial substrate concentrations.
The graph in Figure 3 presents the linear equation and its corresponding slope, which enables the calculation of the rate constant k, yielding a value of 7.361 × 10⁻⁷ s−1.
The obtained constant is 0.0026 h−1, which is significantly lower than the values obtained for the soluble enzyme, as predicted by other authors [28]. It is likely that the immobilization process affects the kinetic constants, generally leading to a decrease in their values due to external diffusional restrictions and enzyme aggregation on the surface, as shown in other kinetic studies [29]. Furthermore, Galodiya and Chakma [28] determined kinetic parameters at concentrations ten times lower than those used in this study and modeled them using Michaelis–Menten kinetics, in contrast to the first-order kinetics assumption employed in the calculations presented here.

2.4. Model Result

Using the identified parameters, Equation (7) is transformed into Equation (1), which serves as the one-dimensional model for describing the temporal variation in oxytetracycline concentration within a reactor featuring surface-immobilized enzymes. The solution to this partial differential equation was computed using numerical methods implemented in MATLAB.
C   t = 5.713 × 10 11 2 C x 2 0.025 C x 7.361 × 10 7 C      
The modeling results are illustrated for two initial oxytetracycline concentrations: 1 and 100 [mg L−1]. These values are significantly higher than those reported under real contamination conditions in water bodies, such as rivers and lakes near salmon farming cages [30].
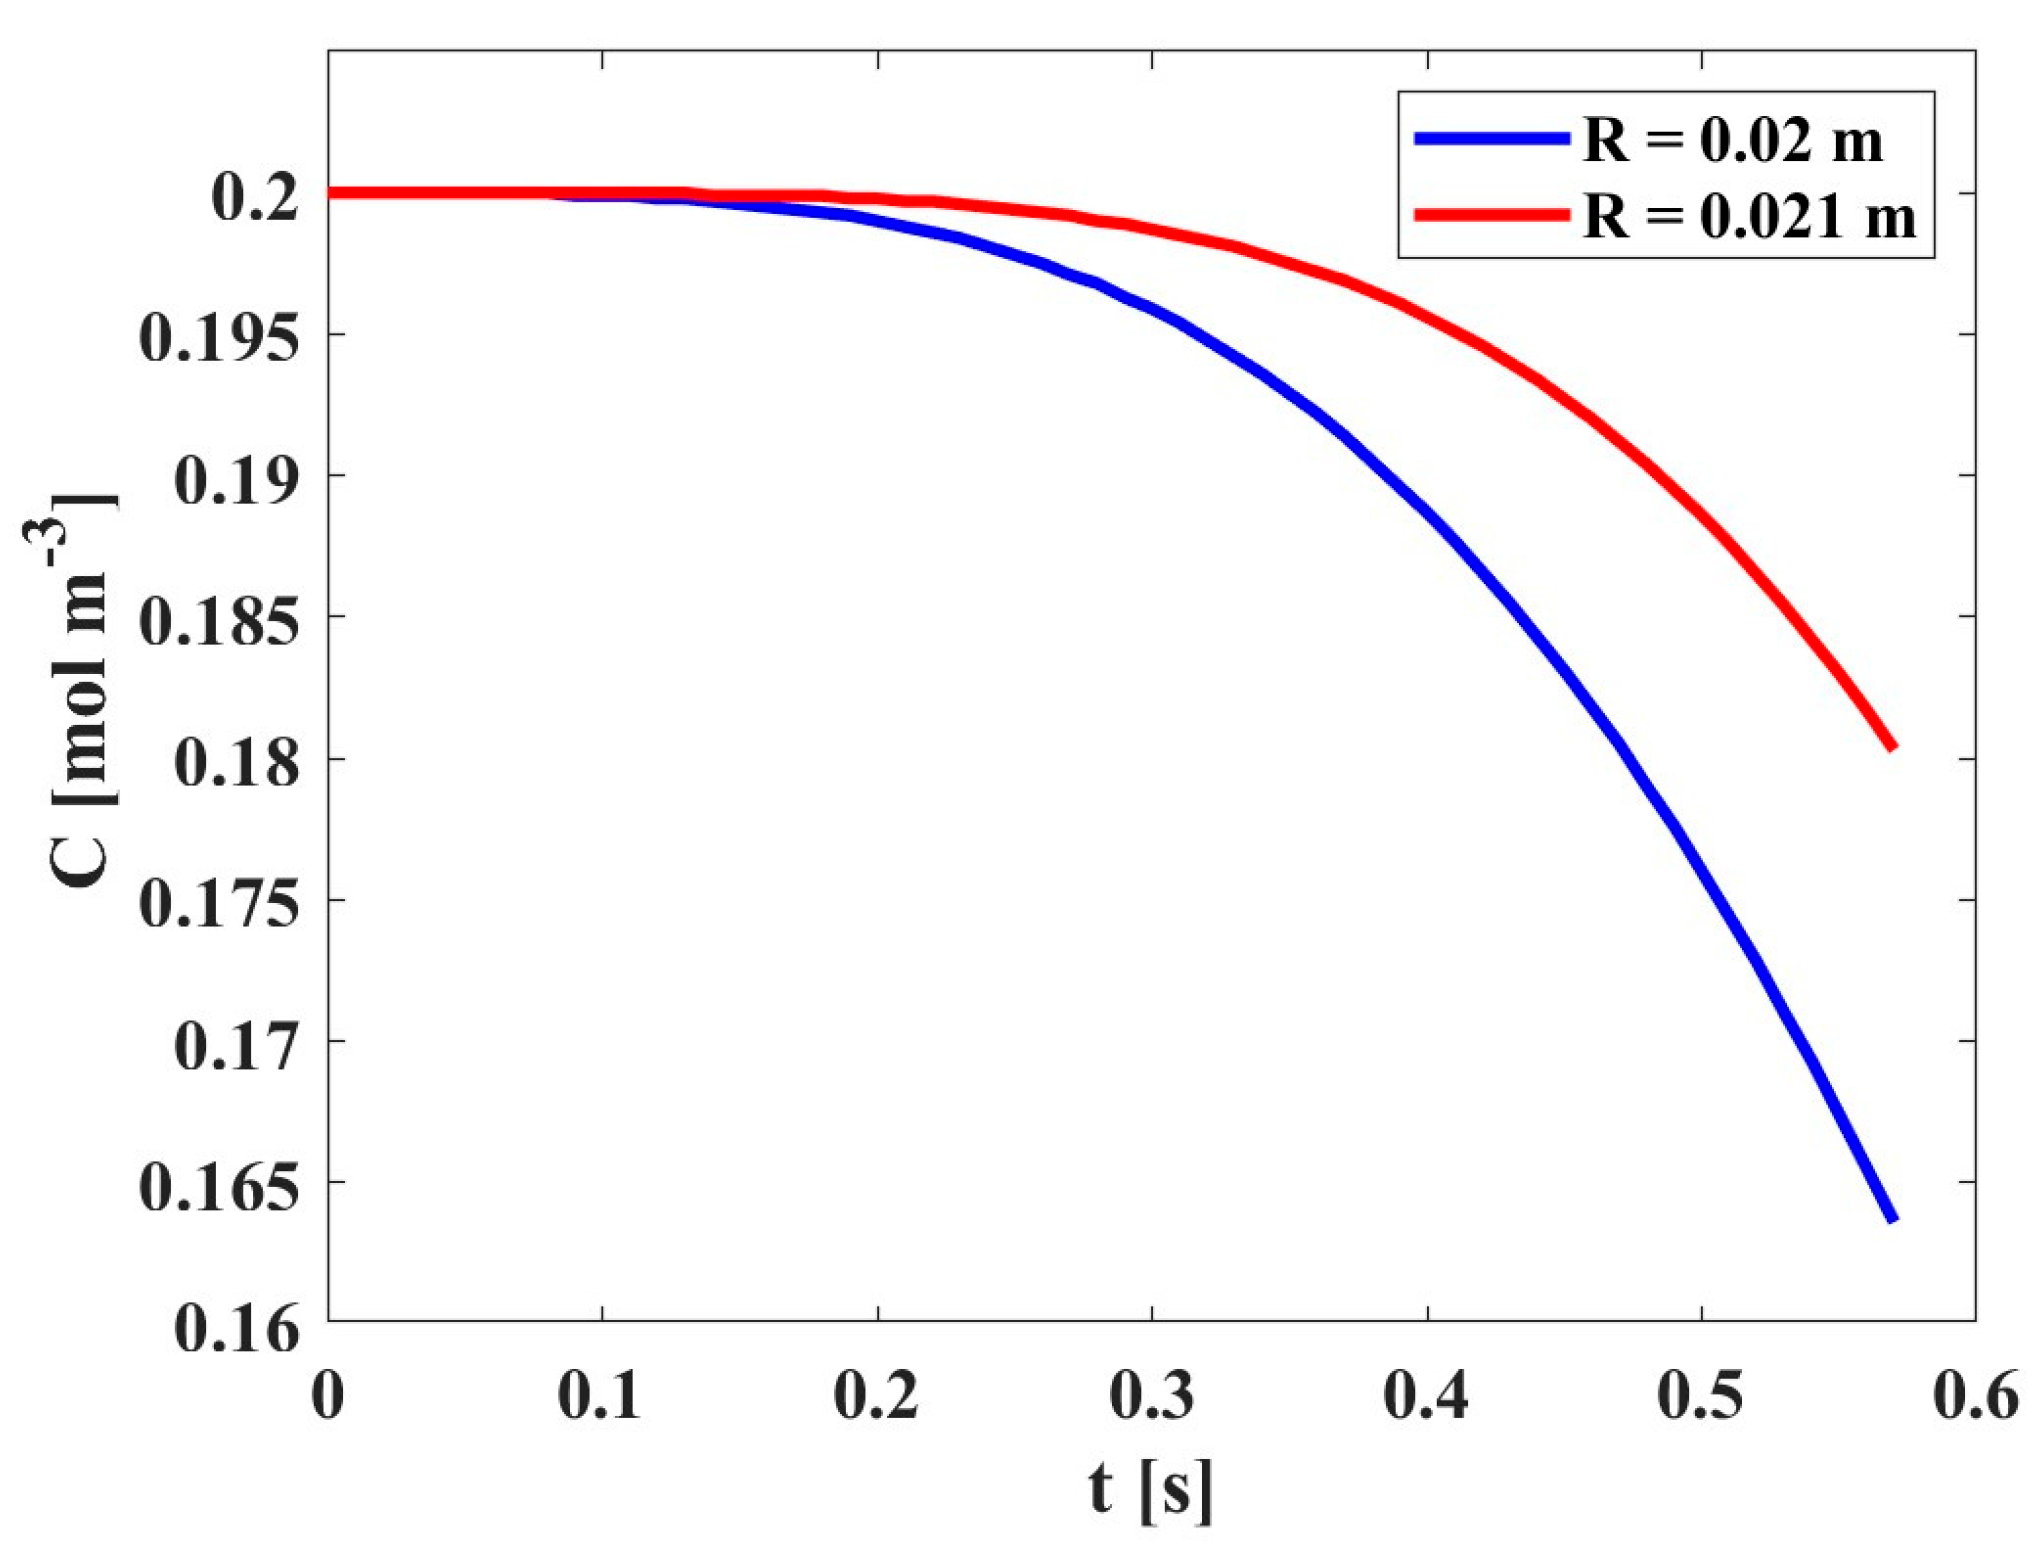
Figure 4 depicts the concentration profiles for the specific case in which the initial contaminant concentration is 0.217 [mol m−3] (corresponding to 100 mg L−1) as a function of time (t) for two distinct radii. As shown, the concentration decreases over time across both scenarios; however, the reduction is more pronounced for the smaller radius. This suggests that the channel radius (r) significantly influences the degradation kinetics, whereby a smaller diameter enhances the pollutant degradation rate.
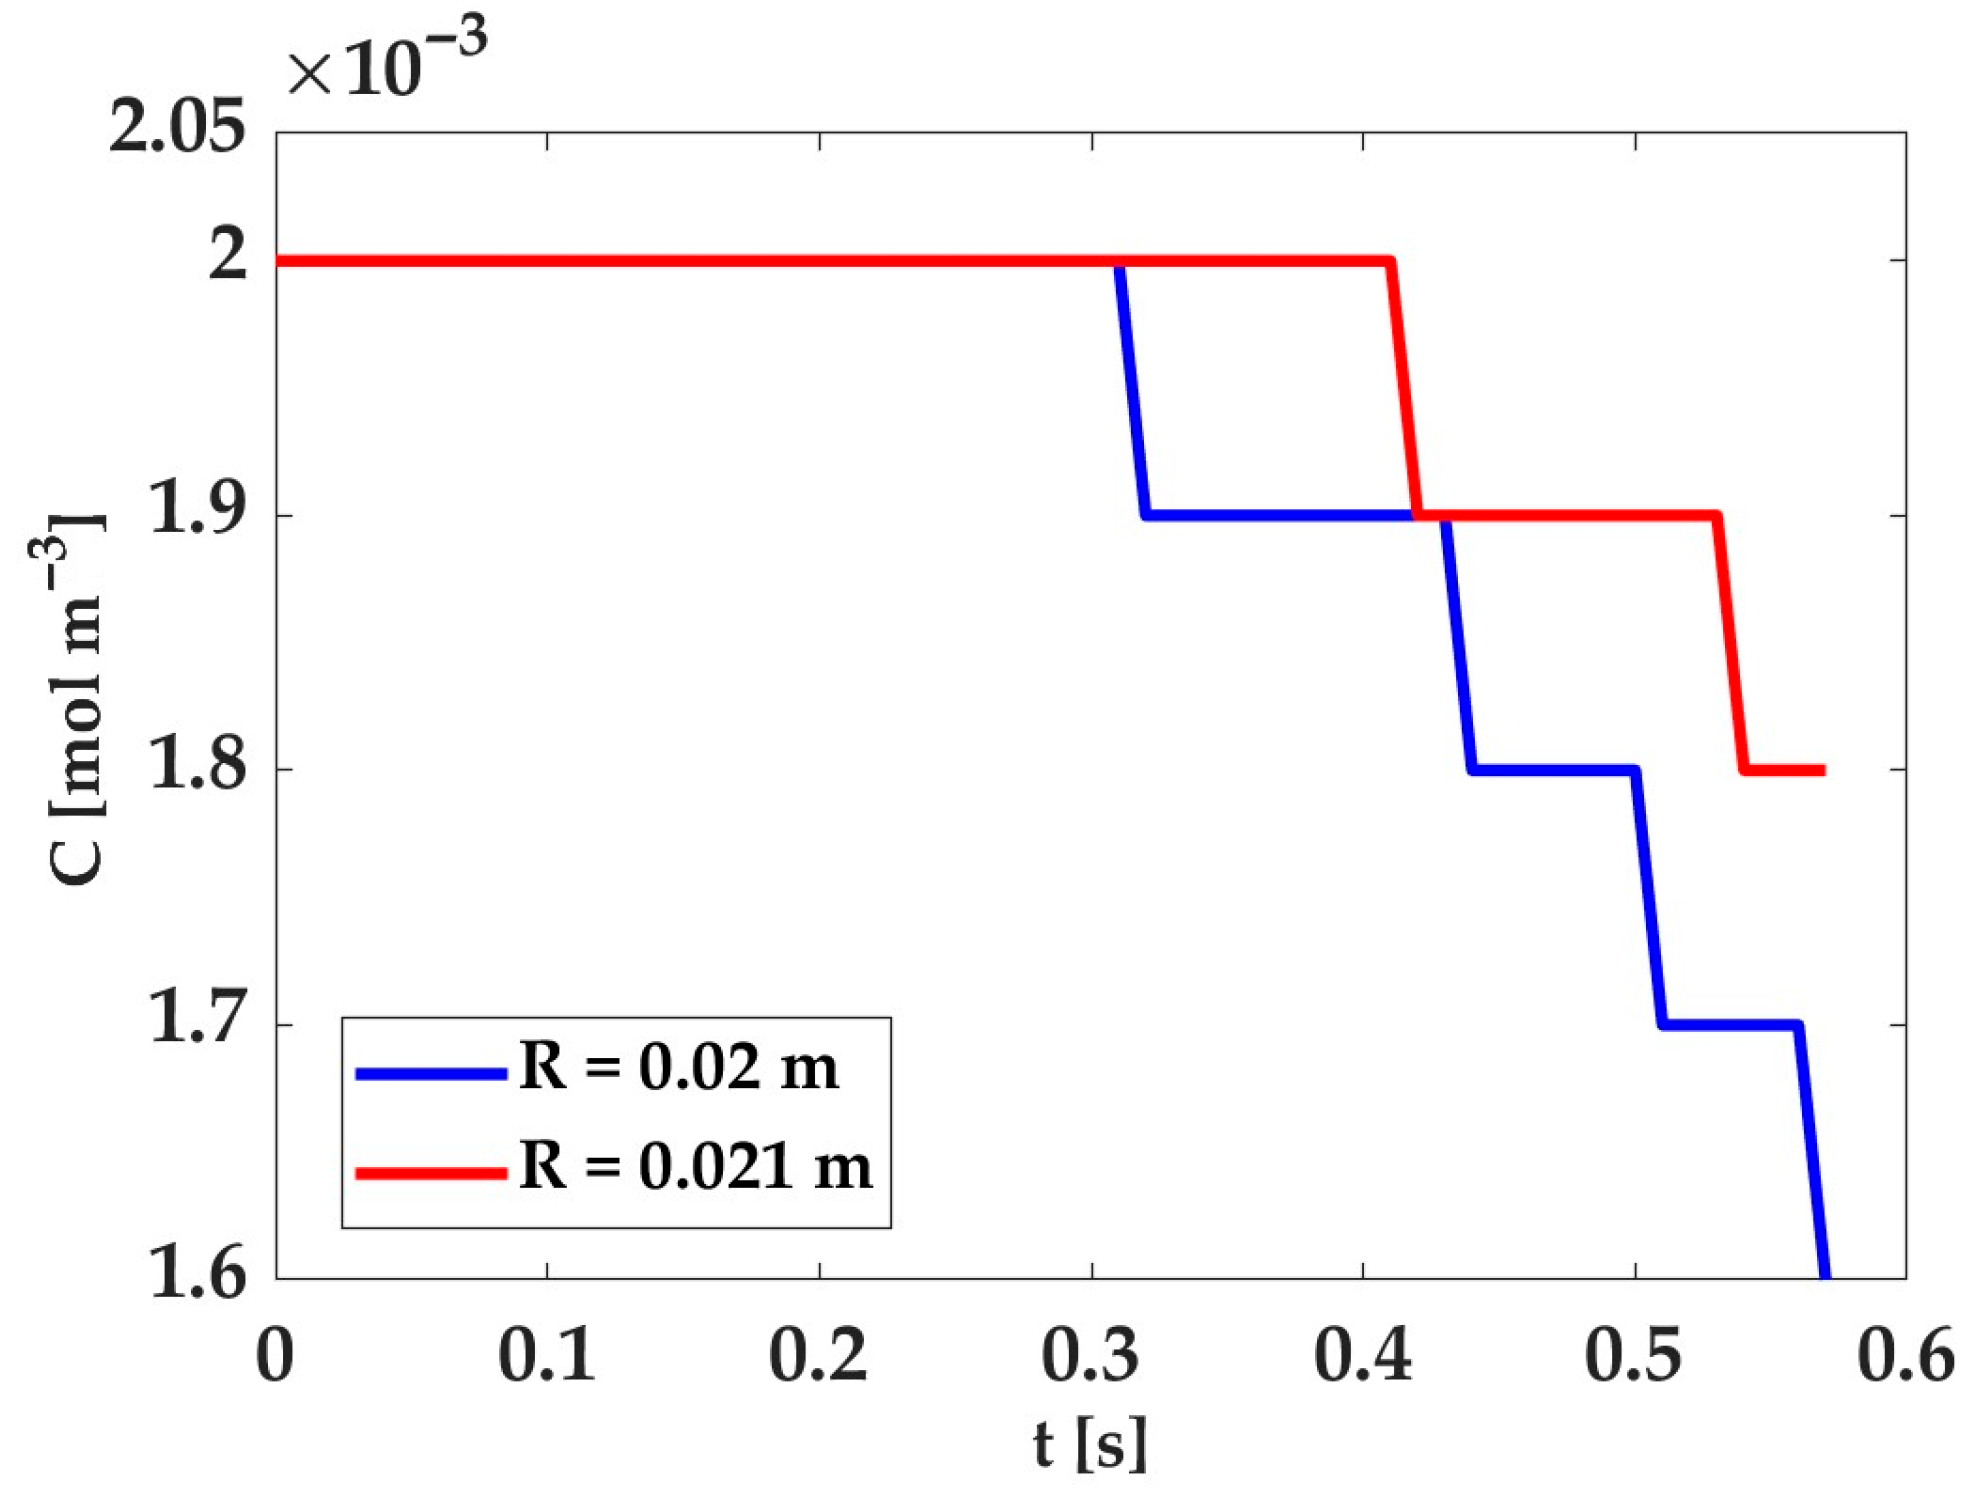
For the case of a significantly lower initial concentration of 0.00217 [mol m−3] (1 mg L−1), Figure 5 illustrates the concentration decay as a function of time (t) under identical pore size conditions. The graph illustrates a stepwise decrease in the substrate concentration over time for both curves, reflecting the numerical approximation calculated at discrete time intervals. Despite this discretization effect, the model accurately captures the overall degradation trend, confirming its predictive robustness at lower concentration scales where sensitivity to time-steps is more pronounced.
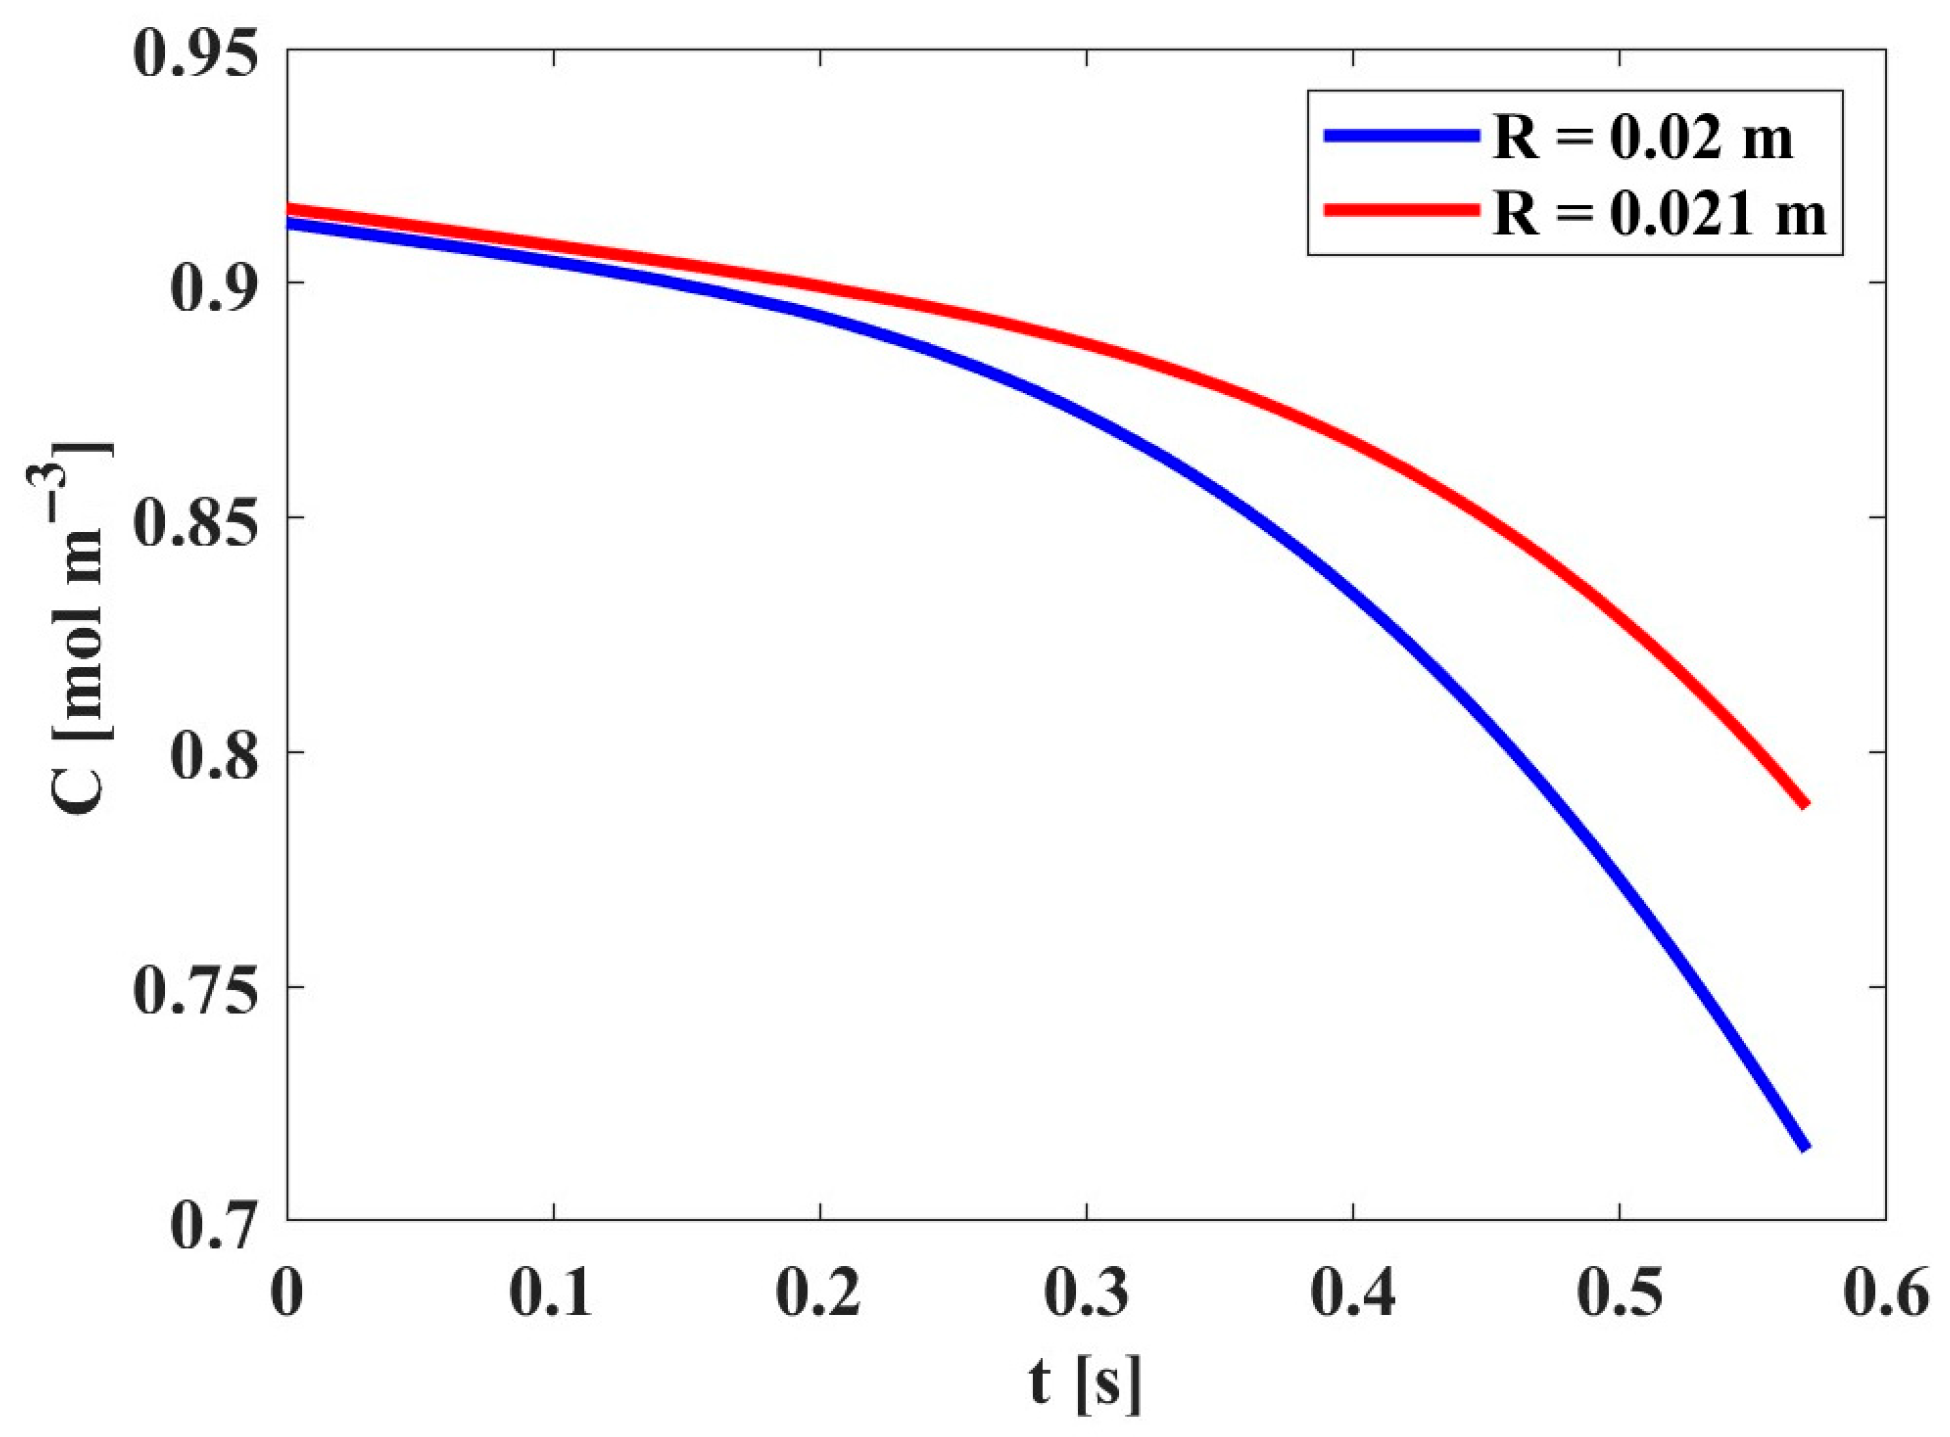
Additionally, this analysis includes a specific scenario where the initial contaminant concentration follows a sinusoidal function. Such models are typically employed to monitor pollutants in aquatic ecosystems, as they allow for contamination path predictions that are more representative of environmental conditions than conventional models [31]. The chosen equation is sin (πx) + 0.217 [mol m−3] where the constant term represents the baseline concentration. As shown in Figure 6, the system starts at a peak concentration (approx. 0.917 mol m−3) and subsequently decays over time. Notably, the smaller radius (R = 0.02 m) exhibits a significantly sharper decrease compared to the larger radius (R = 0.021 m). This enhanced performance can be attributed to the reduction in the characteristic diffusion length. In a laminar flow regime, the time required for a pollutant molecule to reach the functionalized surface scales with the square of the radius (tR2/D). Therefore, a smaller diameter effectively minimizes mass transfer resistance, ensuring that a larger fraction of the oxytetracycline molecules interacts with the immobilized enzymes within a shorter residence time.
The results obtained for the diffusion, convection, and reaction constants suggest that the bioremediation time is primarily governed by the convection constant. Although diffusion in the flow direction is lower, it remains non-negligible; and under specific conditions—such as rapid substrate depletion due to binding to the functionalized scaffold near the channel inlet—diffusion plays a critical role that must be accounted for in the model to provide a comprehensive and accurate description of the system’s behavior [32].
These comparisons are fundamental for understanding realistic scenarios through a mathematical framework. Unlike field-based monitoring programs, simulations can mitigate high budgetary costs, both spatially and temporally, while overcoming the scarcity of human resources, among other factors [33].

3. Materials and Methods

3.1. Experimental Methodology

3.1.1. Materials

D850 PLA filament 1.75 mm (0.03 mm) natural color (SMARTFIL®, Smart Materials 3D, Alcalá la Real, Spain). From Sigma Aldrich (St. Louis, MO, USA): Trametes Versicolor laccase enzyme (≥0.5 U/mg 1,6-hexanediamine (HDA), absolute ethanol, 1-propanol, 2,2-azino-bis-(3-ethylbenzothiazoline-6-sulfonate) (ABTS), KH2PO4, K2HPO4, C6H8O7·H2O, glutaraldehyde. Solutions were prepared using distilled water.

3.1.2. Modification of a PLA Matrix

A PLA material was modified by adding amino groups through an aminolysis reaction, following the procedure described by Gonçalves et al. [34], with some modifications. First, 1 cm thick pieces of the material were cut and then immersed in an HDA/1-propanol solution at a concentration of 32 mg/mL for 40 min at 40 °C with gentle agitation. Subsequently, the material was subjected to sonication in distilled water for 10 min and dried in an oven at 60 °C for 3 h. Next, the amino-functionalized material was activated using a glutaraldehyde solution similar to the method described by Lopez-Gallego [35]. The aminated supports were suspended in 8% glutaraldehyde at pH 6.0 for 16 h at 25 °C with agitation at 180 rpm. After this process, the material was sonicated again and dried for 3 h before proceeding with enzyme immobilization.
To confirm the chemical modification of the material, FT-IR spectroscopy analysis was performed, identifying the signals of the main functional groups present in the PLA material throughout the various stages of the process. The equipment used was a Thermo Fisher Scientific Nicolet™ iS™ 5 FT-IR spectrometer (Waltham, MA, USA).

3.1.3. Immobilization of Laccase Enzyme in Modified PLA Matrix

For the immobilization of laccase on the modified PLA material, 1 g of functionalized PLA was weighed and placed in 50 mL of a phosphate–citrate buffer solution 100 mM at pH 4.5. The appropriate amount of enzyme was added to this solution to achieve a final concentration of 1 mg/mL. The mixture was kept under mechanical agitation at 50 rpm for 24 h. Subsequently, the PLA pellets with immobilized enzyme were immersed in a phosphate buffer solution at pH 7 for 10 min. Finally, the pellets were stored at 5 °C, keeping them moist in the last buffer solution.
To validate the enzyme immobilization on the PLA pellets, the immobilization yield (I%) and the retained activity (RA%) were determined. The enzymatic activity was measured following the protocol described by Addorisio et al. [36], based on the oxidation of ABTS at 25 °C and pH 4 for 3 min. For the soluble enzyme (supernatant), the activity was monitored by measuring the increase in absorbance at 420 nm (εABTS = 36,000 M−1 cm−1) in a 1 cm path length spectrophotometric cell. To determine the activity of the immobilized biocatalyst, approximately 1 g of the functionalized PLA pellets was placed in a 3 mL cell. The reaction was carried out under constant stirring for 3 min at 25 °C and pH 4, using ABTS as substrate, and the activity was measured at 420 nm. In both cases, one international unit (IU) of laccase activity was defined as the amount of enzyme required to oxidize 1 μmol of ABTS per minute under these conditions.
Immobilization yield (I%), representing the efficiency of enzyme removal from the solution, was calculated as
I % = A l i A l f A l i 100
where Ai and Af are the initial and final enzymatic activities in the supernatant, respectively. To ensure that the reduction in supernatant activity was due to the immobilization process rather than protein degradation, a control (blank) of the soluble enzyme was maintained under the same conditions for 24 h without PLA pellets; this confirmed no significant loss of activity during the process.
Furthermore, the percentage of retained activity (RA%) was determined to evaluate the catalytic mass balance on the support:
R A % = A s 2 A s 1 100
where As1 corresponds to the initial activity offered per gram of support (U/g), and As2 is the final activity expressed by the immobilized pellets (U/g).

3.1.4. Determination of the Kinetic Constant of Oxytetracycline Hydrolysis

A total of 1 g of PLA pellets (approximately 1 cm), with an immobilized enzyme, was immersed in a 100 mM phosphate buffer at pH 7 and 20 °C. These specific conditions of pH and temperature were selected based on preliminary optimization studies, which identified them as the most suitable for the enzymatic reaction with oxytetracycline while ensuring no loss of enzyme activity during the process. A predetermined amount of solubilized oxytetracycline was added to achieve final concentrations of 30, 60, 80, 100 and 150 mg L−1 in a 10 mL solution, maintaining agitation at 50 rpm and bubbling oxygen. The disappearance of oxytetracycline in the solution with immobilized enzyme was monitored by taking aliquots of the supernatant at determined time intervals and measuring the residual concentration of oxytetracycline using high-performance liquid chromatography (HPLC). The HPLC system used was a Thermo Fisher Scientific model Ultimate 3000, with a Kromasil 100-5-C18 column (4.6 × 150 mm, 5 μm). The mobile phase consisted of 0.01 M oxalic acid and acetonitrile in an 80/20 (v/v) ratio, with an injection flow rate of 1 mL/min in isocratic flow. The injection volume was 20 μL, the column temperature was maintained at 25 °C, and the detection wavelength was 365 nm. The running time between samples was 6 min.
The initial reaction rates and first-order elimination constants (k) were determined by linear regression analysis of the concentration-time data. All experiments were performed in triplicate, and the results are expressed as the mean ± standard error (SE). Statistical significance between the different substrate concentrations was evaluated using one-way analysis of variance (ANOVA), followed by Tukey’s post hoc test for multiple comparisons, with a confidence level of 95% (p < 0.05).

3.2. Mathematical Methodology

3.2.1. Mathematical Model

A mathematical model was employed to describe the transient processes of diffusion, convection, and reaction, integrating various physical and chemical laws. The transport of the contaminant or solute through the reactor’s pores can be described by diffusion processes, governed by Fick’s law [37]. The velocity of the solute within the fluid flowing through the reactor is represented by convection, governed by Darcy’s law [38]. Finally, the removal or hydrolysis of the target compound is defined by the reaction rate catalyzed by the enzyme, which is typically described using a Michaelis–Menten-type equation [39]:
C t = D 2 C x 2 v C x V m a x C K m + C
The proposed model (2) enables the analysis and modification of dimensions and physicochemical properties to optimize results, which are obtained through numerical methods using finite element techniques. These techniques involve spatial discretization to solve parabolic equations in one variable, where C represents the antibiotic concentration, t represents the time, and x represents the spatial coordinate [40].
In Equation (2), D corresponds to the diffusivity coefficient. For this case, as the enzyme is immobilized on the surface, it is assumed that the substrate is immersed in a solution. Since the contaminant is present in very low concentrations, the Stokes–Einstein model (3) can be applied, which assumes a spherical solute A moving in a viscous solvent B:
D AB 0 = κ T 6 π μ B r A
where κ is the Boltzmann constant, κ = 1.38066 × 10⁻²³ J K−1, μB is the viscosity of solvent B, and rA is the hypothetical radius of the solute [41].
Meanwhile, the transport due to fluid movement in solutions through porous media is described using Darcy’s law (4):
Q = K p a C x
where Q is the volumetric flow rate of the fluid, Kp is the permeability of the porous medium, a is the cross-sectional area through which the fluid flows, and dC/dx is the concentration gradient along the flow.
The convection velocity v can be obtained by dividing the volumetric flow rate Q by the cross-sectional area a:
v = Q a  
Substituting Darcy’s equation into expression (5), we obtain
ζ = v   C x  
Finally, the reaction rate related to the substrate concentration can be expressed in various ways depending on the reaction kinetics and enzyme efficiency. However, considering that the substrate concentration is very low, the reaction rate can be simplified using first-order kinetics. Equation (2) becomes
C   t = D 2 C x 2 v   C x k C  
where k is the reaction rate constant.
To numerically analyze the model, the diffusion coefficient, fluid velocity, and rate constant were determined to generate an equation representing the real conditions under study.

3.2.2. Determination of the Diffusion Coefficient

The diffusion coefficient was determined using the Stokes–Einstein model via Equation (2). The radius r is obtained through the group contribution method, which establishes that the physical and physicochemical properties of substances are directly related to their chemical structure, as well as the physical and chemical characteristics of the atoms and functional groups that made up a molecule. This method assumed that the contribution of a chemical group was constant in any compound where that group was present [42].

3.2.3. Determination of the Convection Coefficient

The flow velocity, related to convection, was determined based on Fluid Mechanics equations under the assumption of laminar flow. To confirm this, the Reynolds number (7) was calculated to be less than 2100 [20,43]. Thus, the approximations made are valid as long as the system is dominated by viscous forces:
R e = D   v ρ H 2 O μ        
Additionally, it is necessary to account for the flux density distribution (9) and Newton’s law of viscosity (10), which together yield the maximum velocity Equation (11). The Hagen–Poiseuille equation defines the mass flow rate ω (12), determined by the maximum velocity, fluid density, and the reactor’s cross-sectional area, thereby obtaining the average velocity (13). The physical constants and hypothetical dimensions used for the calculations are specified in Table 1. Equations (9)–(13) are defined as follows:
τ r = P 0 P L 2 L r
τ r = μ d v d r    
v = ( 0 L ) 4 μ L   R 2   = ω ρ A  
ω = π 0 L R 4 ρ 8 μ L
v 1 / 2 = 0 L 8 μ L   R 2  
It is important to highlight that the length of the tube should be much greater than its radius. In other words, the smaller the diameter of a fluid channel, the faster the changes can occur.

3.3. Software

To implement the mathematical model and solve the optimization and numerical solution of the analyte concentration in this study, MATLAB R2025a software is used. The numerical simulation, with the necessary calculations to solve the parabolic differential equations, is executed using the Galerkin method. Its interactive nature and easy-to-use syntax make it ideal for this type of application. The main advantage is that it works on a wide range of hardware and operating systems [35,44].

4. Conclusions

The chemical modification of the Polylactic Acid (PLA) support via aminolysis and subsequent activation with aldehyde groups ensured a high immobilization yield for the laccase enzyme. The enzymatic degradation of oxytetracycline was successfully modeled using experimental data, resulting in a first-order kinetic parameter that enabled simulations across diverse operational conditions.
The results demonstrated that the efficiency of the oxytetracycline degradation process is significantly influenced by the reactor channel diameter, with smaller diameters providing superior performance. Furthermore, the model reveals that the system is primarily governed by the convection constant, identifying it as the critical determinant of the overall remediation timeframe. Although axial diffusion is lower, its inclusion remains essential for a comprehensive description of the system’s behavior, particularly near the channel inlet.
The implementation of computational tools, specifically MATLAB, facilitated the numerical resolution of the model and the visualization of realistic scenarios, thereby minimizing the requirement for extensive experimental trials. This approach not only enhances sustainability but also reduces operational costs and environmental footprints.
Overall, this work demonstrates how the integration of biotechnology, materials engineering, and mathematical modeling can offer innovative and sustainable solutions, promoting the development of clean technologies aligned with the principles of green chemistry and environmental preservation.

Author Contributions

Conceptualization, C.B., P.G. and H.B.; methodology, P.G. and I.C.; software, P.G. and H.B.; validation, C.B., P.G. and H.B.; formal analysis, C.B., P.G., H.B. and I.C.; investigation, C.B., P.G. and I.C.; resources, C.B.; data curation, I.C.; writing—original draft preparation, C.B., P.G. and H.B.; writing—review and editing, C.B.; visualization, C.B. and H.B.; supervision, C.B. and H.B.; project administration, C.B.; funding acquisition, C.B. All authors have read and agreed to the published version of the manuscript.

Funding

This research was funded by the National Agency for Research and Development (ANID) of Chile through FONDECYT Initiation Project No. 11230783. Additionally, this work was supported by the Fund for Scientific and Technological Equipment year 2022, code LE22-01, Universidad Tecnológica Metropolitana.

Data Availability Statement

The data presented in this study are available within the article.

Acknowledgments

This research is framed within the FONDECYT project N° 11230783 and the project supported by the Fund for Scientific and Technological Equipment year 2022, code LE22-01, Universidad Tecnológica Metropolitana.

Conflicts of Interest

The authors declare no conflicts of interest.

Nomenclature

SymbolParameter
ASolute
BSolvent
𝒟0Diffusion coefficient in infinite dilution
D A B 0 Diffusion coefficient of A to infinite diffusion of B
𝒞Convection coefficient
CConcentration
TTime
DBioreactor diameter
eReynolds number

Appendix A. Determination of Kinetic Constants

Appendix A.1. Determination of the Average Velocity from the Mass Flux

The mass flux (ω) is calculated using the “Hagen–Poiseuille” equation, which determines the modified pressure difference ( Δ ) as a function of the pressure ( P ); the fluid density ( ρ ); the acceleration due to gravity ( g ), which has an approximate value of 9.81   m   s 2 at sea level on Earth; and the geometric dimensions of the cylindrical tube, described by L 0 and L T at the beginning and end, respectively. The pressure P exerted by the PLA tube on the water flow is calculated with P = F / A P where F is the force exerted by the material and A is the cross-sectional area of the pore (p. 1). Furthermore, it is known that force equals mass times gravity ( F = m g ), the value of gravity is known, and the mass can be calculated from the density ρ of the material and the volume V of the tube ( m = ρ V ).

Appendix A.1.1. Volume Calculation (VT)

V T = V 2 V 1 = π r 2 2 L T π r 1 2 L V T = π L r 2 2 r 1 2
Substituting
V T = π 10000   m m ( 0.4   m m ) 2 ( 0.1   m m ) 2 V T = π 10000   m m 0.16   m m 2 0.01   m m 2 V T 4712.4   m m 3 1   c m 10   m m 3 V T 4.71   c m 3

Appendix A.1.2. Mass Calculation (m)

m = p V m = 1.25 g   c m 3 4.71   c m 3 m = 5.89   g = 0.00589   k g

Appendix A.1.3. Determination of the Force (F)

F = m g = 0.00589   K g 9.8 m s 2 F = 0.0577   N

Appendix A.1.4. Determination of the Internal Cross-Sectional Area of the Cylinder ( A )

A = 2 π r 2 r 1 L
Substituting
A = 2 π ( 0.0004   m 0.0001   m ) 10   m A 0.01885   m 2

Appendix A.1.5. Determination of Pressure (P)

Thus, using the previously obtained area and force,
P = F A = 0.0577 k g   m s 2 0.0189 m 2 P = 3.0625 k g m s 2 = 3.06   P a

Appendix A.1.6. Determination of the Modified Pressure Difference (Δ P )

Δ P = 3.0625 kg m   s 2 + ( 998 kg m 3 9.8 m s 2 10   m ) 3.0625 kg m   s 2 + ( 998 kg m 3 9.8 m s 2 0.01   m )
Δ P = ( 97.807 100.9 ) kg s 2 m
Δ P = 97706   Pa

Appendix A.1.7. Determination of the Mass Flow Velocity (ω), Considering That the Tube Length Is Much Greater than the Tube Radius

The mass flux ω is calculated as follows:
ω = π ( 97.706 g s 2 m ) 8 0.001003 kg s   m 0.08   m 4 ( 998 kg m 3 )
ω = 0.061391   kg / s

Appendix A.1.8. Calculation of Maximum and Mean Velocity

v m a x = ω ρ A = 0.061394 k g   s 998 k g   m 3 0.001257   m 2 v m a x = 0.05   m / s v = 0.025   m / s

Appendix A.2. Calculation of the Reynolds Number to Determine Whether the Flow Is Laminar

R e = D v m a x ρ μ R e = 0.6 × 10 3   m 0.05   m   s 998 k g   m 2 0.00102 k g s m R e = 29.35

References

  1. Bilal, M.; Adeel, M.; Rasheed, T.; Zhao, Y.; Iqbal, H.M.N. Emerging contaminants of high concern and their enzyme-assisted biodegradation—A review. Environ. Int. 2019, 124, 336–353. [Google Scholar] [CrossRef] [PubMed]
  2. Chaturvedi, P.; Shukla, P.; Giri, B.S.; Chowdhary, P.; Chandra, R.; Gupta, P.; Pandey, A. Prevalence and hazardous impact of pharmaceutical and personal care products and antibiotics in environment: A review on emerging contaminants. Environ. Res. 2021, 194, 110664. [Google Scholar] [CrossRef]
  3. Timmerer, U.; Lehmann, L.; Schnug, E.; Bloem, E. Toxic effects of single antibiotics and antibiotics in combination on germination and growth of Sinapis alba L. Plants 2020, 9, 107. [Google Scholar] [CrossRef] [PubMed]
  4. European Medicines Agency. Sales of Veterinary Antimicrobial Agents in 30 European Countries in 2015. 2017. Available online: https://www.ema.europa.eu/en/documents/report/seventh-esvac-report-sales-veterinary-antimicrobial-agents-30-european-countries-2015_en.pdf (accessed on 5 November 2025).
  5. Lozano-Muñoz, I.; Wacyk, J.; Kretschmer, C.; Vásquez-Martínez, Y.; Martin, M.C.-S. Antimicrobial resistance in Chilean marine-farmed salmon: Improving food safety through One Health. One Health 2021, 12, 100219. [Google Scholar] [CrossRef]
  6. Hargrave, B.T.; Doucette, L.I.; Haya, K.; Friars, F.S.; Armstrong, S.M. A micro-dilution method for detecting oxytetracycline-resistant bacteria in marine sediments from salmon and mussel aquaculture sites and an urbanized harbor in Atlantic Canada. Mar. Pollut. Bull. 2008, 56, 1439–1445. [Google Scholar] [CrossRef]
  7. Bittencourt, G.A.; Vandenberghe, L.P.d.S.; Martínez-Burgos, W.J.; Valladares-Diestra, K.K.; de Mello, A.F.M.; Maske, B.L.; Brar, S.K.; Varjani, S.; Pereira, G.V.d.M.; Soccol, C.R. Emerging contaminants bioremediation by enzyme and nanozyme-based processes—A review. iScience 2023, 26, 106785. [Google Scholar] [CrossRef] [PubMed]
  8. Copete, L.S.; Chanagá, X.; Barriuso, J.; López-Lucendo, M.F.; Martínez, M.J.; Camarero, S. Identification and characterization of laccase-type multicopper oxidases involved in dye-decolorization by the fungus Leptosphaerulina sp. BMC Biotechnol. 2015, 15, 74. [Google Scholar] [CrossRef]
  9. Kolar, B.; Arnuš, L.; Jeretin, B.; Gutmaher, A.; Drobne, D.; Durjava, M.K. The toxic effect of oxytetracycline and trimethoprim in the aquatic environment. Chemosphere 2014, 115, 75–80. [Google Scholar] [CrossRef]
  10. Fernández-Fernández, M.; Sanromán, M.Á.; Moldes, D. Recent developments and applications of immobilized laccase. Biotechnol. Adv. 2013, 31, 1808–1825. [Google Scholar] [CrossRef]
  11. Bayramoglu, G.; Arica, M.Y. Biodegradation of methylene blue and carbaryl by Trametes versicolor laccase preparations in the presence of a mediator compound. J. Macromol. Sci. Part A 2019, 56, 277–285. [Google Scholar] [CrossRef]
  12. Prasad, L.K.; Smyth, H. 3D printing technologies for drug delivery: A review. Drug Dev. Ind. Pharm. 2016, 42, 1019–1031. [Google Scholar] [CrossRef]
  13. Krujatz, F.; Lode, A.; Seidel, J.; Bley, T.; Gelinsky, M.; Steingroewer, J. Additive Biotech—Chances, challenges, and recent applications of additive manufacturing technologies in biotechnology. New Biotechnol. 2017, 39, 222–231. [Google Scholar] [CrossRef]
  14. Manzanares-Palenzuela, C.L.; Hermanova, S.; Sofer, Z.; Pumera, M. Proteinase-sculptured 3Dprinted graphene/polylactic acid electrodes as potential biosensing platforms: Towards enzymatic modeling of 3D-printed structures. Nanoscale 2019, 11, 12124–12131. [Google Scholar] [CrossRef]
  15. Li, S.; Zhao, S.; Hou, Y.; Chen, G.; Chen, Y.; Zhang, Z. Polylactic Acid (PLA) Modified by Polyethylene Glycol (PEG) for the Immobilization of Lipase. Appl. Biochem. Biotechnol. 2020, 190, 982–996. [Google Scholar] [CrossRef]
  16. Stejskal, E.O.; Tanner, J.E. Spin diffusion measurements: Spin echoes in the presence of a time-dependent field gradient. J. Chem. Phys. 1965, 42, 288–292. [Google Scholar] [CrossRef]
  17. Miyabe, K.; Isogai, R. Estimation of molecular diffusivity in liquid phase systems by the Wilke–Chang equation. J. Chromatogr. A 2011, 1218, 6639–6645. [Google Scholar] [CrossRef]
  18. Miložič, N.; Lubej, M.; Novak, U.; Žnidaršič-Plazl, P.; Plazl, I. Evaluation of diffusion coefficient determination using a microfluidic device. Chem. Biochem. Eng. Q. 2014, 28, 215–223. [Google Scholar] [CrossRef]
  19. Olander, D.R. The diffusivity of water in organic solvents. AIChE J. 1961, 7, 175–176. [Google Scholar] [CrossRef]
  20. Bird, R.B.; Stewart, W.E.; Lightfoot, E.N. Fenómenos de Transporte, 2nd ed.; Reverte: Barcelona, Spain, 2007. [Google Scholar]
  21. Soriano, A.N.; Adamos, K.G.; Bonifacio, P.B.; Adornado, A.P.; Bungay, V.C.; Vairavan, R. Determination of diffusion coefficients of various livestock antibiotics in water at infinite dilution. EPJ Web Conf. 2017, 162, 01083. [Google Scholar] [CrossRef][Green Version]
  22. Miyamoto, S.; Shimono, K. Molecular Modeling to Estimate the Diffusion Coefficients of Drugs and Other Small Molecules. Molecules 2020, 25, 5340. [Google Scholar] [CrossRef] [PubMed]
  23. Hansen, R.; Bruus, H.; Callisen, T.H.; Hassager, O. Transient convection, diffusion, and adsorption in surface-based biosensors. Langmuir 2012, 28, 7557–7563. [Google Scholar] [CrossRef]
  24. Lebedev, K.; Mafé, S.; Stroeve, P. Convection, diffusion and reaction in a surface-based biosensor: Modeling of cooperativity and binding site competition on the surface and in the hydrogel. J. Colloid Interface Sci. 2006, 296, 527–537. [Google Scholar] [CrossRef]
  25. Sikavitsas, V.; Nitsche, J.M.; Mountziaris, T.J. Transport and kinetic processes underlying biomolecular interactions in the BIACORE optical biosensor. Biotechnol. Prog. 2002, 18, 885–897. [Google Scholar] [CrossRef]
  26. Stuart, B.H. Infrared Spectroscopy: Fundamentals and Applications; John Wiley & Sons: Hoboken, NJ, USA, 2004. [Google Scholar]
  27. Keikha, M.; Entekhabi, E.; Shokrollahi, M.; Nazarpak, M.H.; Hassannejad, Z.; Akbari, S.; Vaccaro, A.R.; Rahimi-Movaghar, V. Fabrication and characterization of methylprednisolone-loaded polylactic acid/hyaluronic acid nanofibrous scaffold for soft tissue engineering. J. Ind. Text. 2022, 52, 15280837221116593. [Google Scholar] [CrossRef]
  28. Galodiya, M.N.; Chakma, S. Immobilization of enzymes on functionalized cellulose nanofibrils for bioremediation of antibiotics: Degradation mechanism, kinetics, and thermodynamic study. Chemosphere 2024, 349, 140803. [Google Scholar] [CrossRef] [PubMed]
  29. Bahamondes, C.; Álvaro, G.; Wilson, L.; Illanes, A. Effect of enzyme load and catalyst particle size on the diffusional restrictions in reactions of synthesis and hydrolysis catalyzed by α-chymotrypsin immobilized into glyoxal-agarose. Process Biochem. 2017, 53, 172–179. [Google Scholar] [CrossRef]
  30. Suga, N.; Ogo, M.; Suzuki, S. Risk assessment of oxytetracycline in water phase to major sediment bacterial community: A water-sediment microcosm study. Environ. Toxicol. Pharmacol. 2013, 36, 142–148. [Google Scholar] [CrossRef]
  31. Biazar, J.; Farrokhi, L.; Islam, M. Modeling the pollution of a system of lakes. Appl. Math. Comput. 2006, 178, 423–430. [Google Scholar] [CrossRef]
  32. Christensen, L.L. Theoretical analysis of protein concentration determination using biosensor technology under conditions of partial mass transport limitation. Anal. Biochem. 1997, 249, 153–164. [Google Scholar] [CrossRef]
  33. Wang, X.; Zhang, J.; Babovic, V. Improving real-time forecasting of water quality indicators with combination of process-based models and data assimilation technique. Ecol. Indic. 2016, 66, 428–439. [Google Scholar] [CrossRef]
  34. Gonçalves, F.; Bentini, R.; Burrows, M.C.; Carreira, A.C.O.; Kossugue, P.M.; Sogayar, M.C.; Catalani, L.H. Hybrid Membranes of PLLA/Collagen for Bone Tissue Engineering: A Comparative Study of Scaffold Production Techniques for Optimal Mechanical Properties and Osteoinduction Ability. Materials 2015, 8, 408–423. [Google Scholar] [CrossRef]
  35. López-Gallego, F.; Guisan, J.M.; Betancor, L. Immobilization of Enzymes on Supports Activated with Glutaraldehyde: A Very Simple Immobilization Protocol; Guisan, J., Bolivar, J., López-Gallego, F., Rocha-Martín, J., Eds.; Springer: New York, NY, USA, 2020; Volume 2100, pp. 119–127. [Google Scholar]
  36. Addorisio, V.; Sannino, F.; Mateo, C.; Guisan, J.M. Oxidation of phenyl compounds using strongly stable immobilized-stabilized laccase from Trametes versicolor. Process Biochem. 2013, 48, 1174–1180. [Google Scholar] [CrossRef]
  37. Fick, A. Ueber Diffusion. Ann. Phys. 1855, 170, 59–86. [Google Scholar] [CrossRef]
  38. Darcy, H. Les Fontaines Publiques de la Ville de Dijon: Exposition et Application des Principes ‘a Suivre et des Formules ‘a Employer Dans les Questions de Distribution D’eau; Dalmont, V., Ed.; Universidad de Gante: Ghent, Belgium, 1856; Volume 1. [Google Scholar]
  39. Johnson, K.A.; Goody, R.S. The original Michaelis constant: Translation of the 1913 Michaelis–Menten paper. Biochemistry 2011, 50, 8264–8269. [Google Scholar] [CrossRef] [PubMed]
  40. Skeel, R.D.; Berzins, M. A method for the spatial discretization of parabolic equations in one space variable. SIAM J. Sci. Stat. Comput. 1990, 11, 1–32. [Google Scholar] [CrossRef]
  41. Baer, A.; Wawra, S.E.; Bielmeier, K.; Uttinger, M.J.; Smith, D.M.; Peukert, W.; Walter, J.; Smith, A. The Stokes–Einstein–Sutherland equation at the nanoscale revisited. Small 2024, 20, e2304670. [Google Scholar] [PubMed]
  42. Fierro, E.N.; Faúndez, C.A.; Valderrama, J.O. Método de Contribución de Grupos: Una Herramienta Fundamental en cursos Avanzados de Termodinámica y Física de Fluidos para la Estimación de Propiedades de Sustancias. Form. Univ. 2016, 9, 99–108. [Google Scholar]
  43. Brody, J.P.; Yager, P.; Goldstein, R.E.; Austin, R.H. Biotecnología con números de Reynolds bajos. D. Biofísico 1996, 71, 3430–3441. [Google Scholar]
  44. Rust, J. Gauss and Matlab: A comparison. J. Appl. Econ. 1993, 8, 307–324. [Google Scholar] [CrossRef]
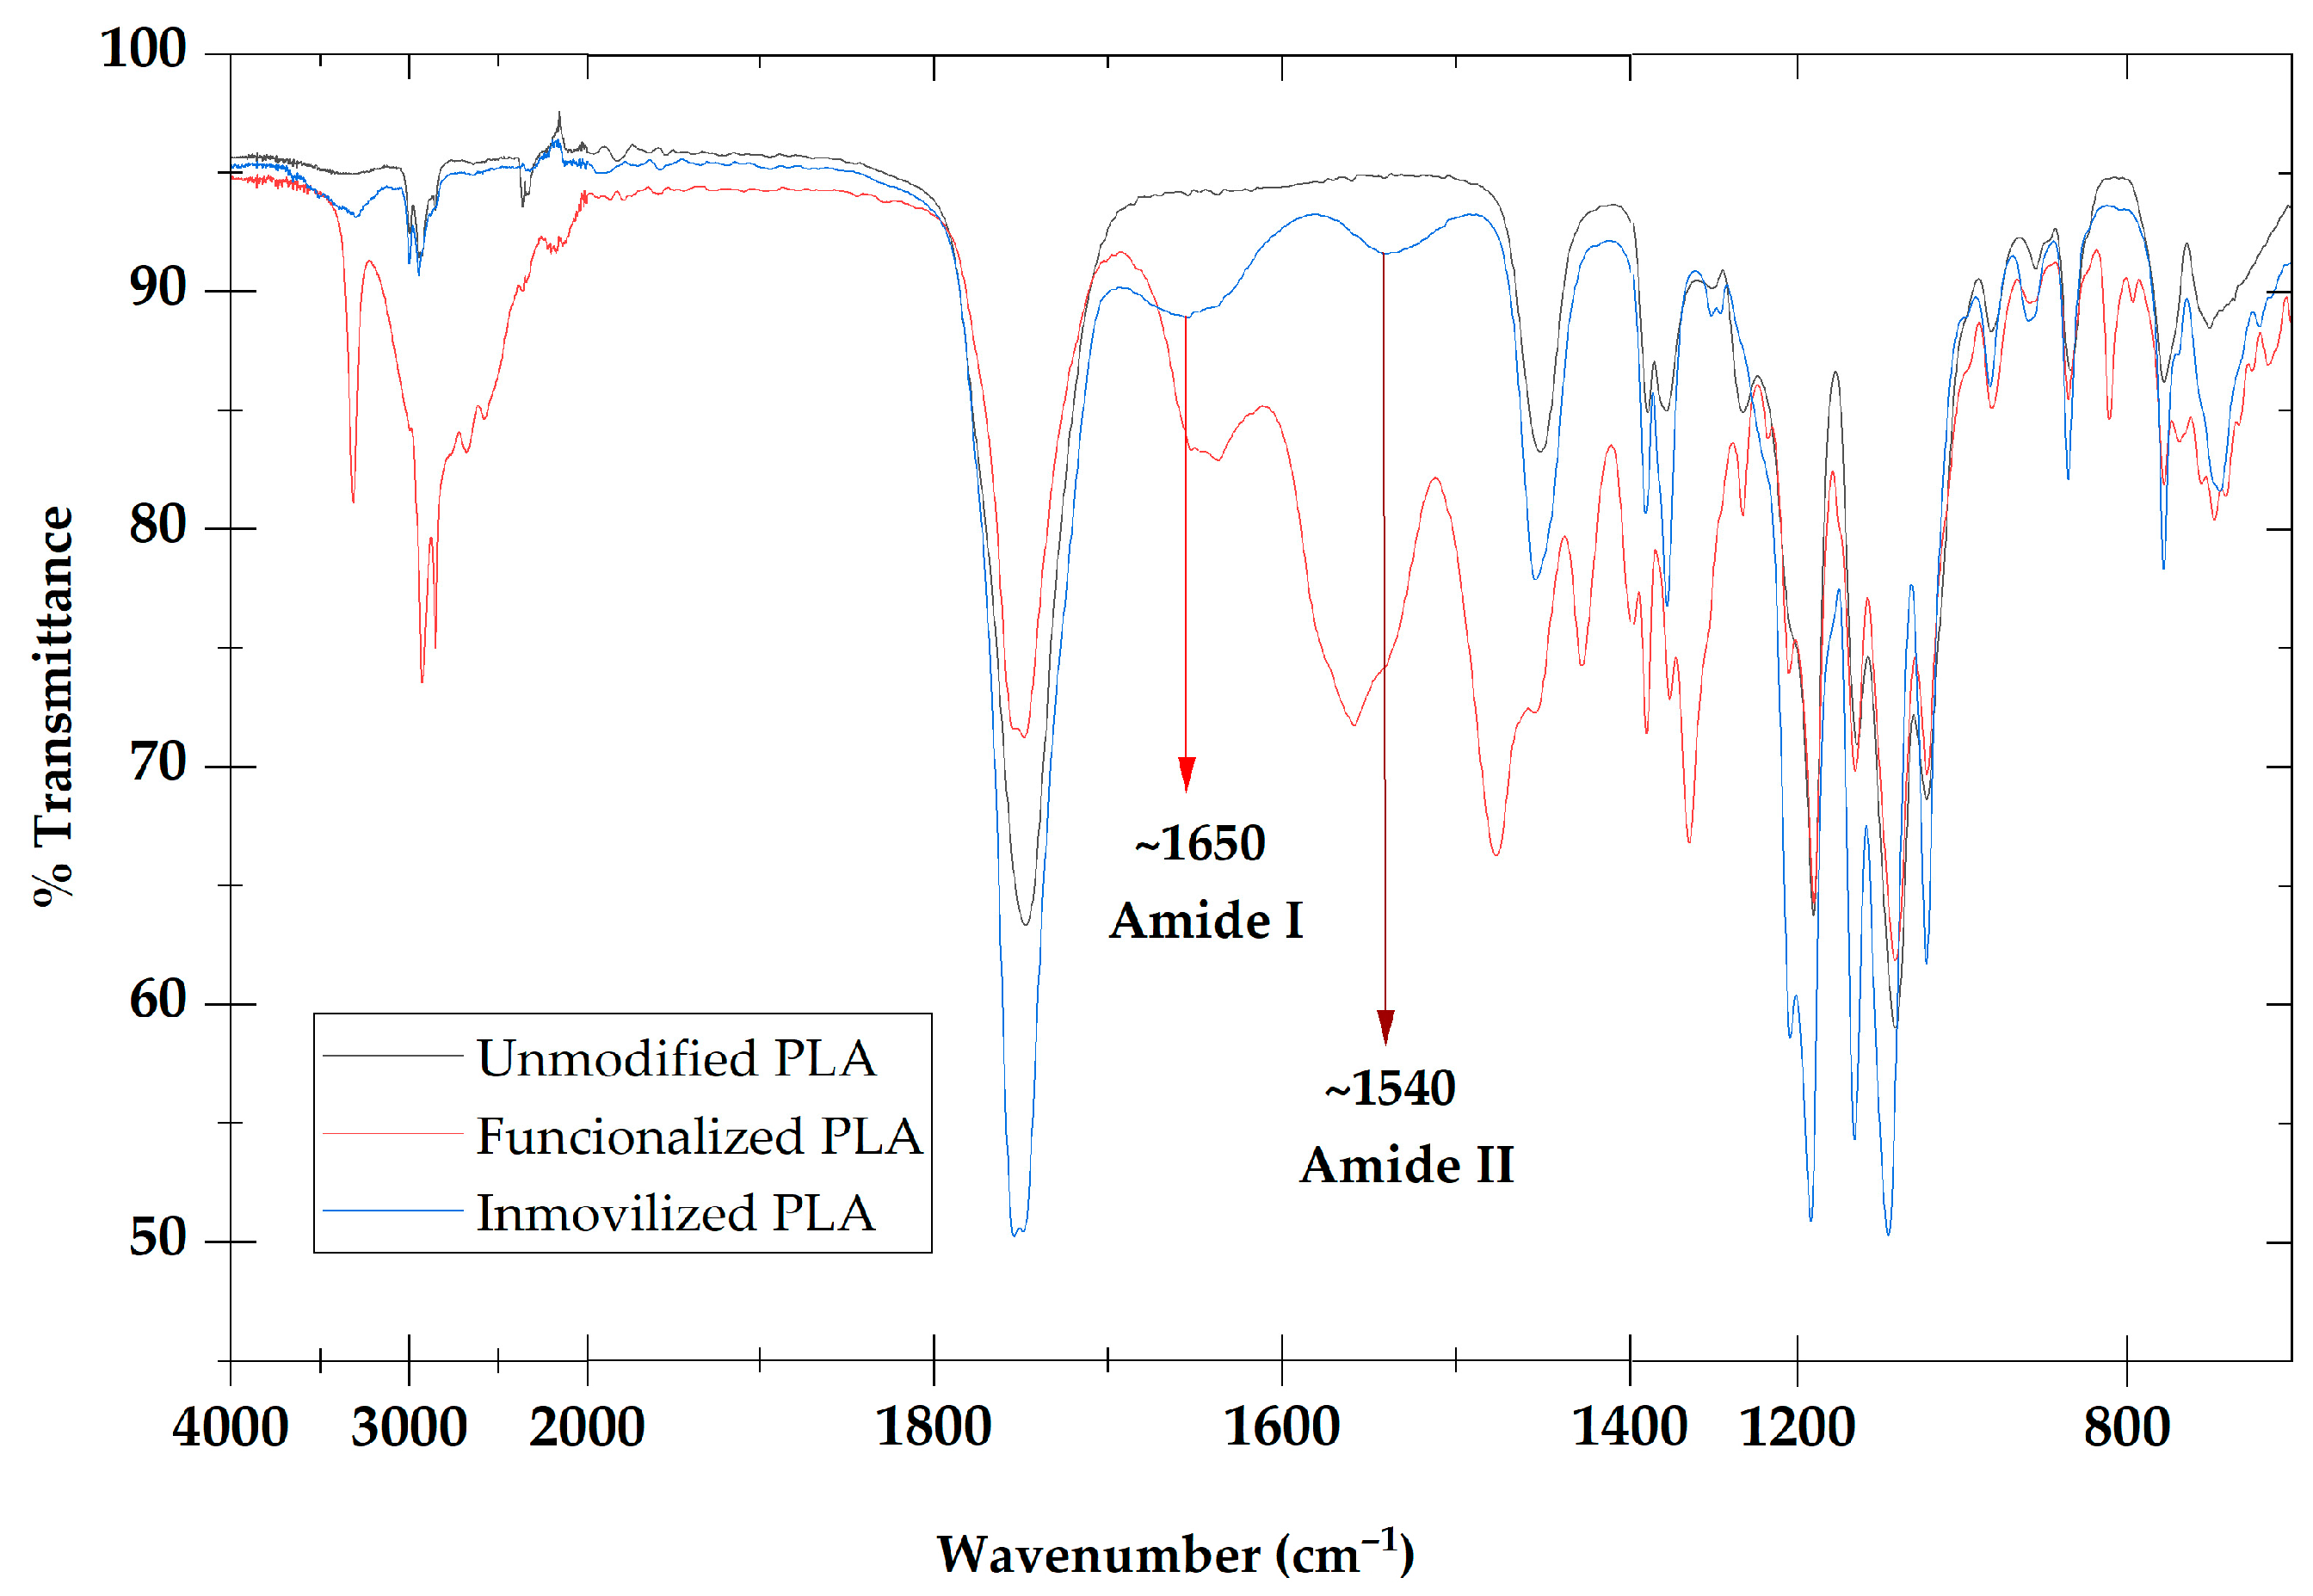
Figure 1. FT-IR spectra comparison of unmodified PLA (gray line), chemically modified PLA (blue line), and laccase-immobilized PLA (red line).
Catalysts 16 00398 g001
Figure 2. Reaction rates for different substrate concentrations. Experimental data for the elimination of oxytetracycline at various concentrations.
Catalysts 16 00398 g002
Figure 3. Determination of the reaction constant. The reaction rates were used to obtain the equation of the line and its slope, which allowed the calculation of the rate constant k.
Catalysts 16 00398 g003
Figure 4. Numerical simulation 1. Comparison of contaminant reduction behavior, with a pore radius difference of 1 [mm] and an initial concentration of 0.217 [mol m−3].
Catalysts 16 00398 g004
Figure 5. Numerical simulation 2. Comparison of contaminant reduction behavior, with a pore radius difference of 1 [mm] and an initial concentration of 0.002 [mol m−3].
Catalysts 16 00398 g005
Figure 6. Numerical simulation 3. Comparison of the contaminant reduction behavior, with a pore radius difference of 1 [mm] and an initial concentration of sin(πx) + 0.217.
Catalysts 16 00398 g006
Table 1. Physical constants and hypothetical dimensions used for convection velocity calculations.
SymbolParameterValueUnit
r1Internal radius of pore0.100Mm
r2External radius of pore0.400Mm
LTotal length1.00M
ρ P L A Density of PLA1.250g cm−3
ρ H 2 O Density of water0.998g cm−3
μ H 2 O Viscosity of water1.002g s−2 m−1
RBioreactor total radius2.0cm
PPressure0.613g s−1 m−1
Table 2. Calculated and experimental kinetic and transport parameters.
SymbolParameterValueUnit
K *Reaction constant7.361 × 10−7 ± 1.4 × 10⁻⁸s−1
v 1 / 2 Velocity medium0.025m s−1
𝒟Diffusion coefficient5.713 × 10−11m2 s−1
* Experimental Value.
Table 3. Preliminary results for the determination of diffusion and convection constants.
SymbolParameterValueUnit
Diffusion
rARadius of oxytetracycline37.47Å
Convection
0 Modified inlet pressure9.781kg s−2 m−1
L Modified outlet pressure0.098kg s−2 m−1
ΔModified pressure difference9.683kg s−2 m−1
MMass5.891G
FForce1.155 × 10−5N
VRTotal Volume4.712cm3
ωMass flow rate61.39g s−1
v Velocity constant0.050m s−1
VATotal Volume4.712cm3
Disclaimer/Publisher’s Note: The statements, opinions and data contained in all publications are solely those of the individual author(s) and contributor(s) and not of MDPI and/or the editor(s). MDPI and/or the editor(s) disclaim responsibility for any injury to people or property resulting from any ideas, methods, instructions or products referred to in the content.