Article

Functional Expression of the Aromatic Prenyltransferase NphB in Chlamydomonas reinhardtii Highlights Challenges in Cannabinoid Biocatalysis

by
Serge Basile Nouemssi
,
Ayoub Bouhadada
,
Rémy Beauchemin
,
Alexandre Custeau
,
Sarah-Ève Gélinas
,
Natacha Merindol
,
Fatma Meddeb-Mouelhi
,
Hugo Germain
and
Isabel Desgagné-Penix
*
Department of Biochemistry, Chemistry, Physics, and Forensic Science, Université du Québec à Trois-Rivières, 3351 Boulevard des Forges, Trois-Rivières, QC G9A 5H7, Canada
*
Author to whom correspondence should be addressed.
Catalysts 2026, 16(4), 346; https://doi.org/10.3390/catal16040346
Submission received: 13 March 2026 / Revised: 2 April 2026 / Accepted: 10 April 2026 / Published: 13 April 2026
(This article belongs to the Special Issue Biocatalysis and Biosynthesis: Opportunities and Challenges)

Abstract

Cannabinoids are high-value bioactive compounds whose sustainable production remains challenging, prompting interest in biocatalytic and microbial platforms as alternatives to plant extraction. In this study, we investigated the heterologous expression and functionality of two key cannabinoid-related enzymes in the photosynthetic microalga Chlamydomonas reinhardtii: the aromatic prenyltransferase, NphBG286S/Y288A from Streptomyces sp., and the plant-derived cannabidiolic acid synthase (CBDAS) from Cannabis sativa. Codon-optimized genes were introduced into the nuclear genome of C. reinhardtii using several construct configurations and promoters, and stable transformants were generated and characterized for genomic integration, transcript accumulation, protein production, enzymatic activity, and cannabinoid-related metabolite formation. While NphB protein accumulation was achieved under the PSAD promoter control, CBDAS was not detected at the protein level under any condition tested. In vitro enzymatic assays using soluble algal protein extracts from NphB-expressing lines confirmed catalytic activity, yielding cannabigerolic acid (CBGA), reaching up to 633 ± 58 µg L−1. However, no CBGA production was detected in vivo, despite substrate supplementation. These results indicate that, although bacterial prenyltransferase can be functionally expressed in C. reinhardtii, efficient metabolic conversion in vivo is limited by cellular and biochemical constraints, including substrate availability, intracellular compartmentalization, and potential competition with endogenous pathways. In contrast, the absence of detectable CBDAS highlights the challenges associated with expressing complex plant oxidocyclases in this photosynthetic host. Overall, this work provides mechanistic insights into enzyme compatibility and metabolic bottlenecks in microalgal systems and outlines key considerations for the future development of photosynthetic platforms for cannabinoid biocatalysis.

1. Introduction

Cannabinoids (CB) are a diverse class of specialized metabolites produced by Cannabis sativa L. that have attracted significant pharmaceutical and economic interest due to their documented bioactivities, including analgesic, antiemetic, anti-inflammatory, and neuroprotective effects [1,2,3,4,5,6,7,8]. With the expanding legalization of cannabis-derived products for medical and recreational use, global demand for CB continues to increase and is projected to reach $58 billion by 2028, with pharmaceutical CB accounting for about one-third of total revenue [9]. However, current CB production relies primarily on plant extraction, which poses challenges due to variable metabolite abundance and the presence of multiple CB analogs in plant extracts [1,10,11]. Chemical synthesis offers an alternative route but remains limited by environmental concerns and the structural complexity of CB [12,13].
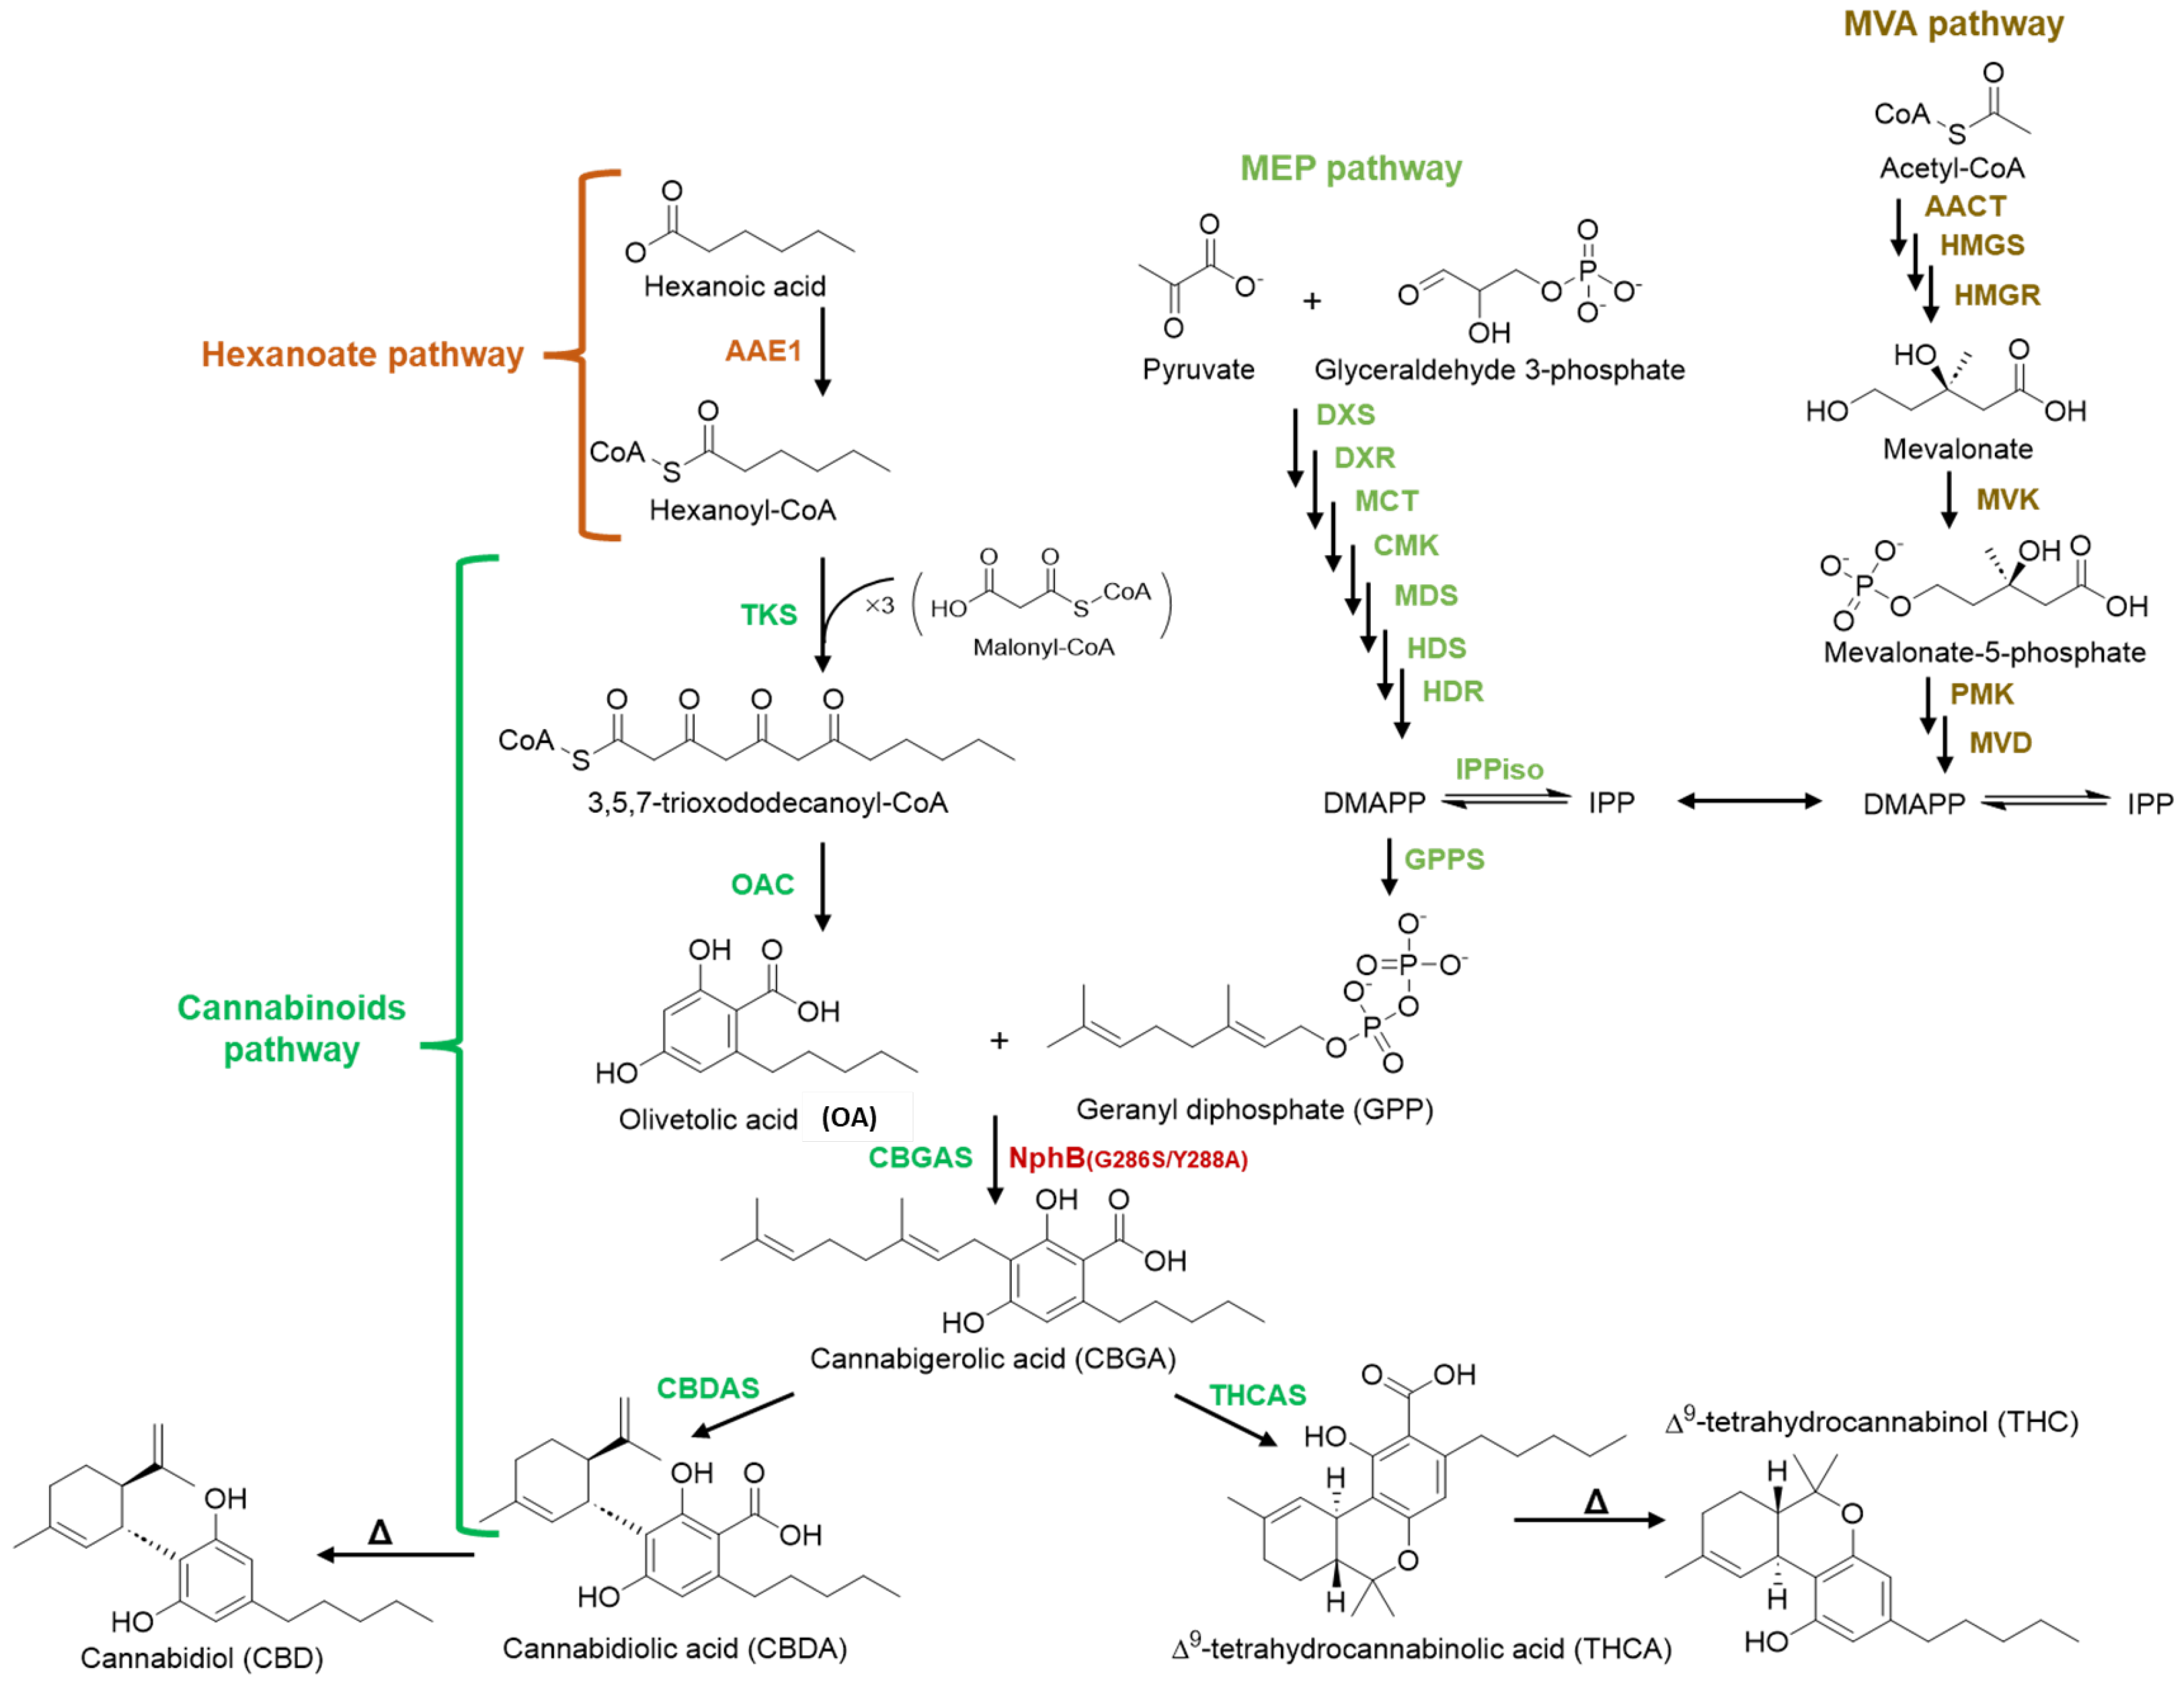
Advances in pathway elucidation have enabled heterologous CB biosynthesis in alternative biological hosts, including microbes and photosynthetic organisms [2,14,15,16,17,18,19,20,21,22,23]. This became feasible following the characterization of enzymes involved in CB biosynthesis [24,25,26,27,28] (Figure 1). In C. sativa, cannabigerolic acid (CBGA), the central CB intermediate, is synthesized by C. sativa prenyltransferase (CsPT or CBGA synthase), which prenylates olivetolic acid (OA) using geranyl diphosphate (GPP) in the plastids. CBGA is then converted in the apoplast by Δ9-tetrahydrocannabinolic acid synthase (THCAS) or cannabidiolic acid synthase (CBDAS) to produce THCA and CBDA, respectively, the most abundant CB [2,3,10,29,30,31,32,33,34]. The compartmentalized nature of this pathway presents a major challenge for heterologous reconstruction.
Heterologous expression of CBGA biosynthetic enzymes, such as CsPT1 and CsPT4, in yeast and E. coli has proven challenging due to their transmembrane plastidial localization, misfolding, and improper compartmentalization [16,17,35,36,37,38]. To circumvent these limitations, the soluble bacterial aromatic prenyltransferase NphB from Streptomyces sp. strain CL190 has emerged as a functional alternative and has been utilized to biologically synthesize CBGA [39,40,41,42,43,44,45]. While wild-type NphB exhibits low activity and substrate specificity, engineered variants have demonstrated enhanced catalytic efficiency [42,43,44,45]. Notably, Valliere et al. identified the NphBG286S/Y288A variant, which exhibited an over 100-fold increase in CBGA synthesis, making it a strong candidate for biocatalytic CB production [39].
Among photosynthetic hosts, the green microalga Chlamydomonas reinhardtii represents an attractive platform for biocatalysis and synthetic biology due to its well-annotated genome, genetic tractability, and plant-like protein processing machinery [14,46,47,48,49]. Although early attempts at nuclear transgene expression in C. reinhardtii were limited by epigenetic silencing [50], substantial progress has been achieved through improved promoter and terminator selection, intron incorporation, strain optimization, and chemical treatments that enhance transgene expression [50,51,52,53,54,55]. Furthermore, C. reinhardtii has been successfully engineered to accumulate high levels of isoprenoids without compromising cellular fitness, indicating its potential to support prenyl-dependent biosynthetic pathways [47,56,57,58], supporting its potential for CB biosynthesis.
In this study, we investigated the heterologous expression of a bacterial aromatic prenyltransferase NphBG286S/Y288A variant and the plant-derived oxidocyclase CBDAS in the nuclear genome of C. reinhardtii. We assessed transgene integration, transcript accumulation, protein production, and enzymatic activity across multiple construct designs, promoters, and host strains. By directly contrasting a functional bacterial prenyltransferase with a non-functional plant oxidocyclase in the same photosynthetic host, this work provides a biocatalytic evaluation of enzyme compatibility and highlights key constraints associated with deploying complex plant enzymes in microalgal expression systems.

2. Results

2.1. Production of NphB and CBDAS Enzymes in E. coli

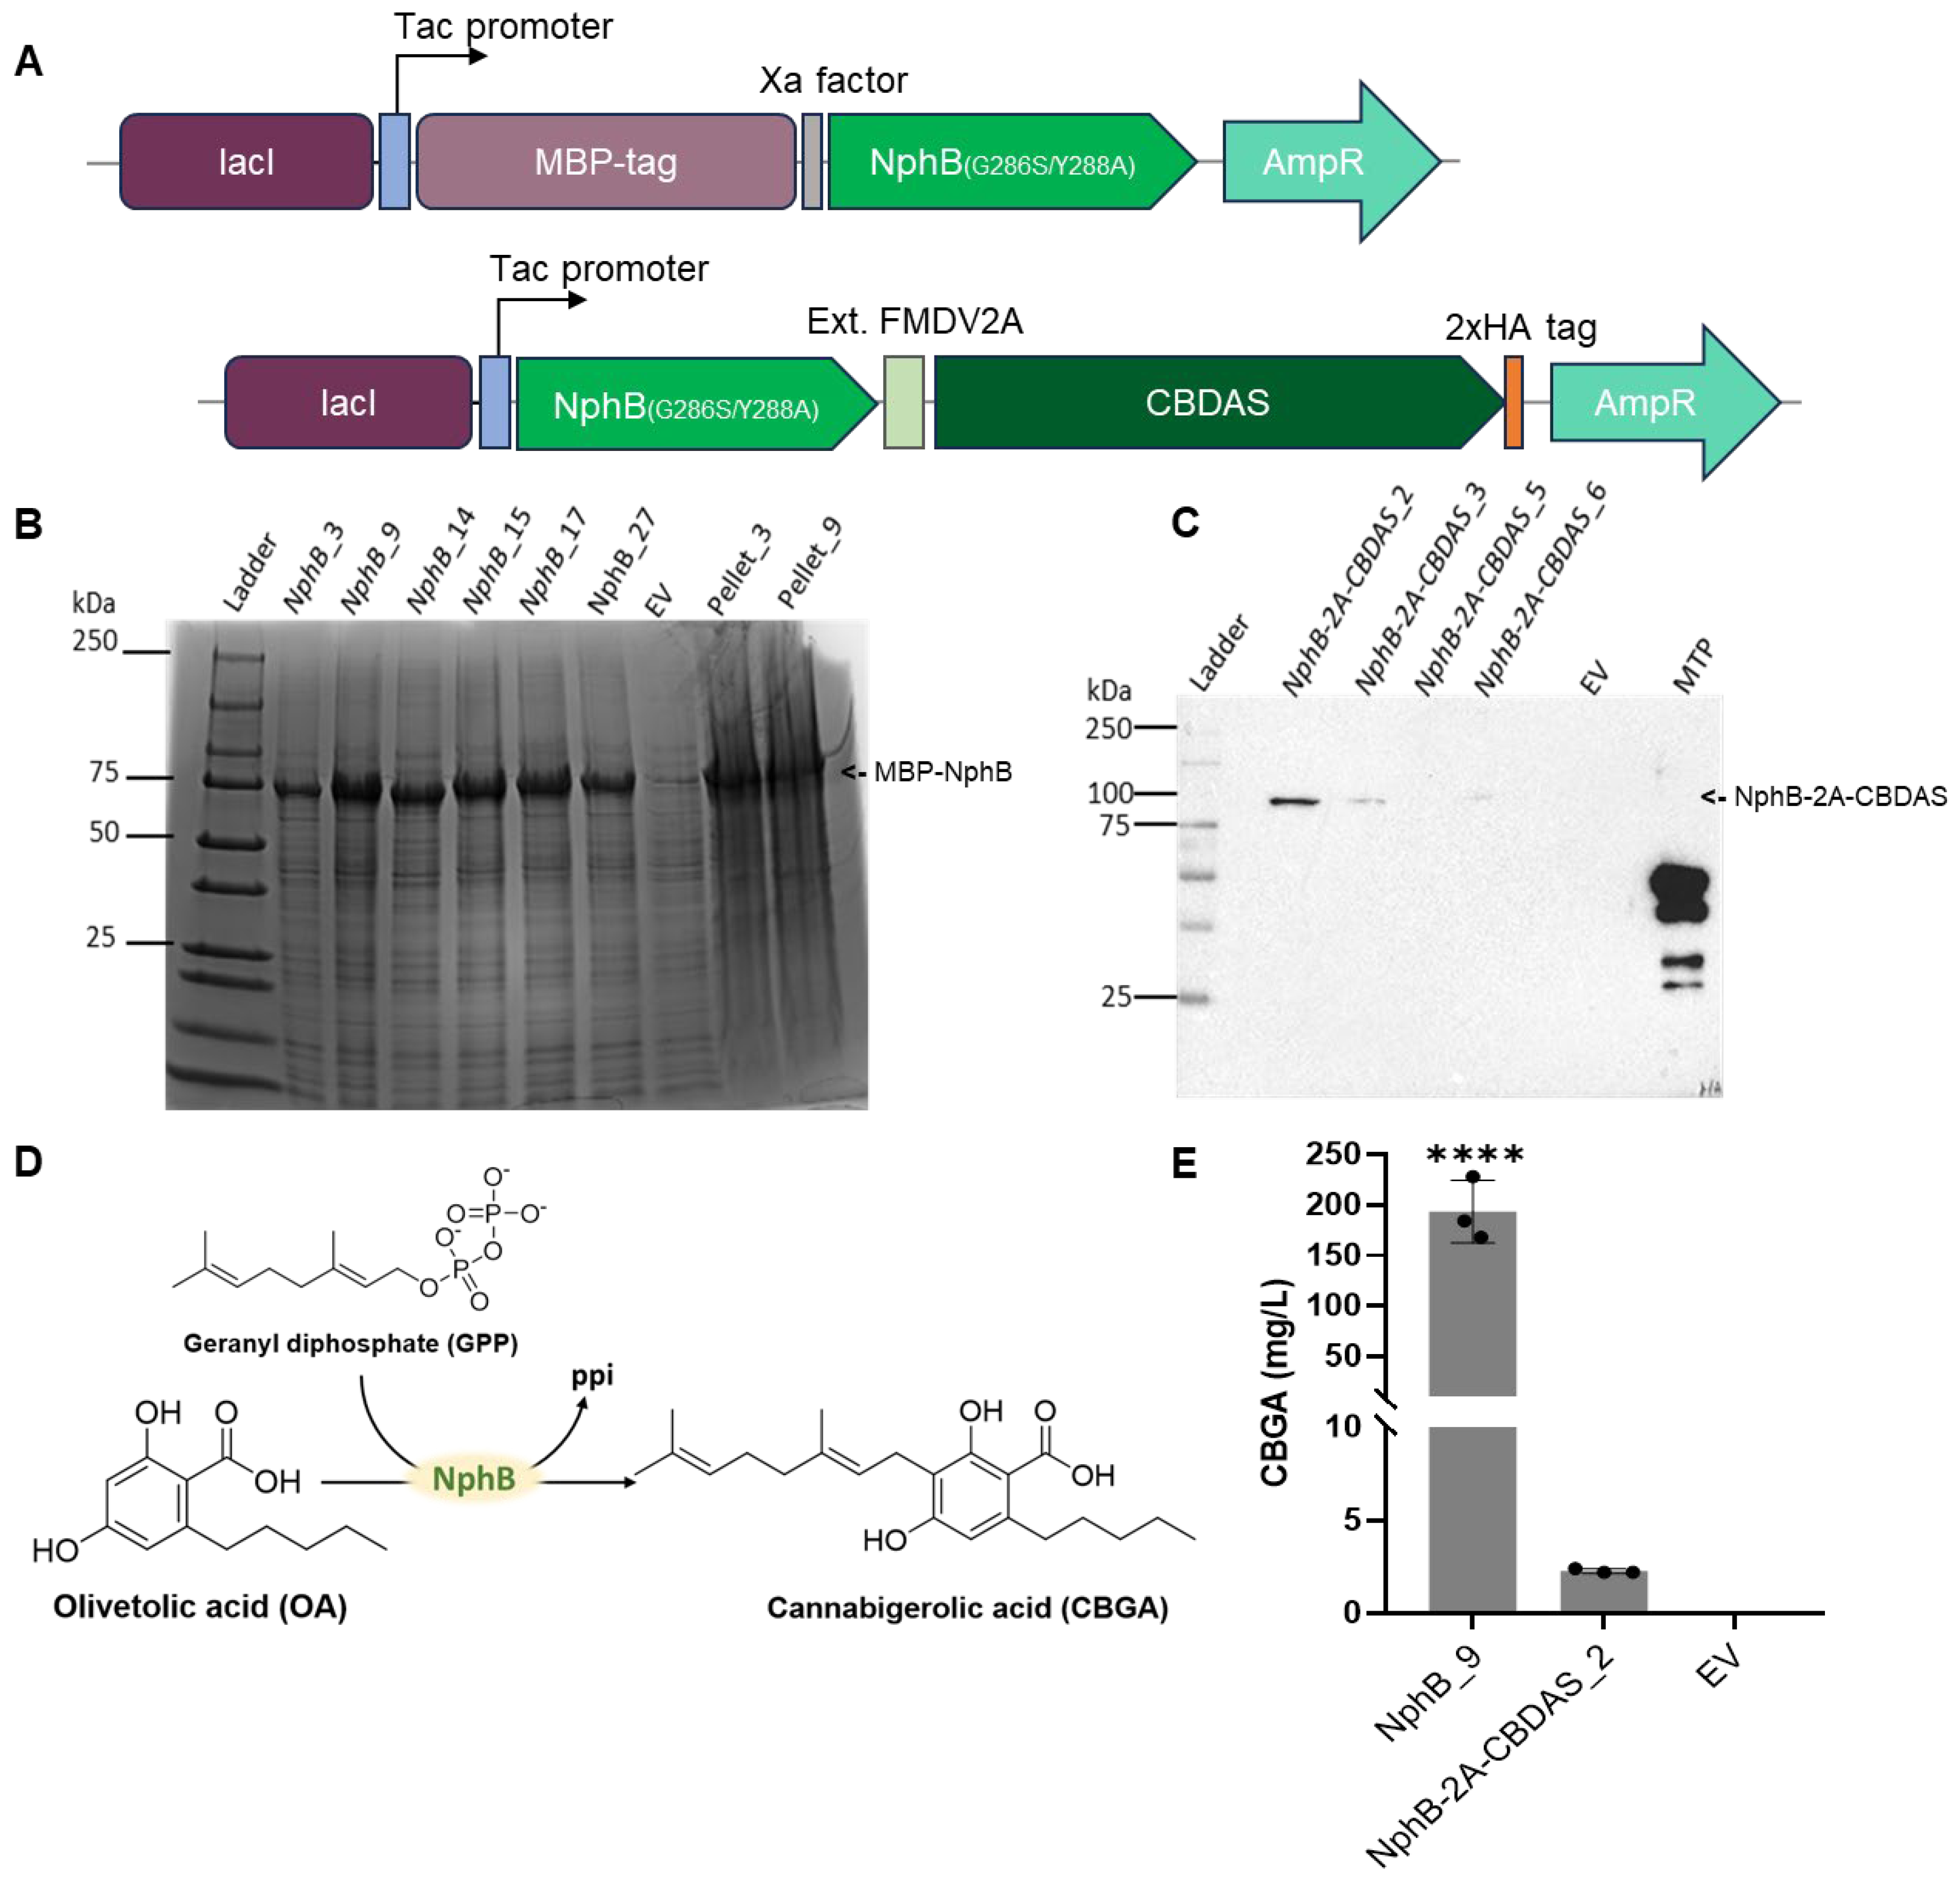
Prior to transformation of C. reinhardtii, the codon-optimized NphBG286S/Y288A (hereafter NphB) from Streptomyces sp. strain CL190 [39] and CBDAS from Cannabis sativa [59] coding sequences were evaluated for expression and enzymatic activity in E. coli. Two expression constructs were generated: one encoding NphB alone and a second encoding a fused NphB-2A-CBDAS (both genes were expressed from a single open reading frame by linking the NphB to the N-terminus of the CBDAS using an extended FMDV2A self-cleaving peptide [60]) (Figure 2A). Recombinant proteins were expressed in E. coli Rosetta BL21 (DE3) pLysS and analyzed using soluble protein extracts.
SDS–PAGE analysis confirmed the accumulation of NphB when expressed alone, while the NphB–2A–CBDAS fusion protein was detected by Western blot using an anti-HA antibody (Figure 2B,C). The fusion protein was predominantly present as an uncleaved product, consistent with incomplete processing of the 2A peptide.
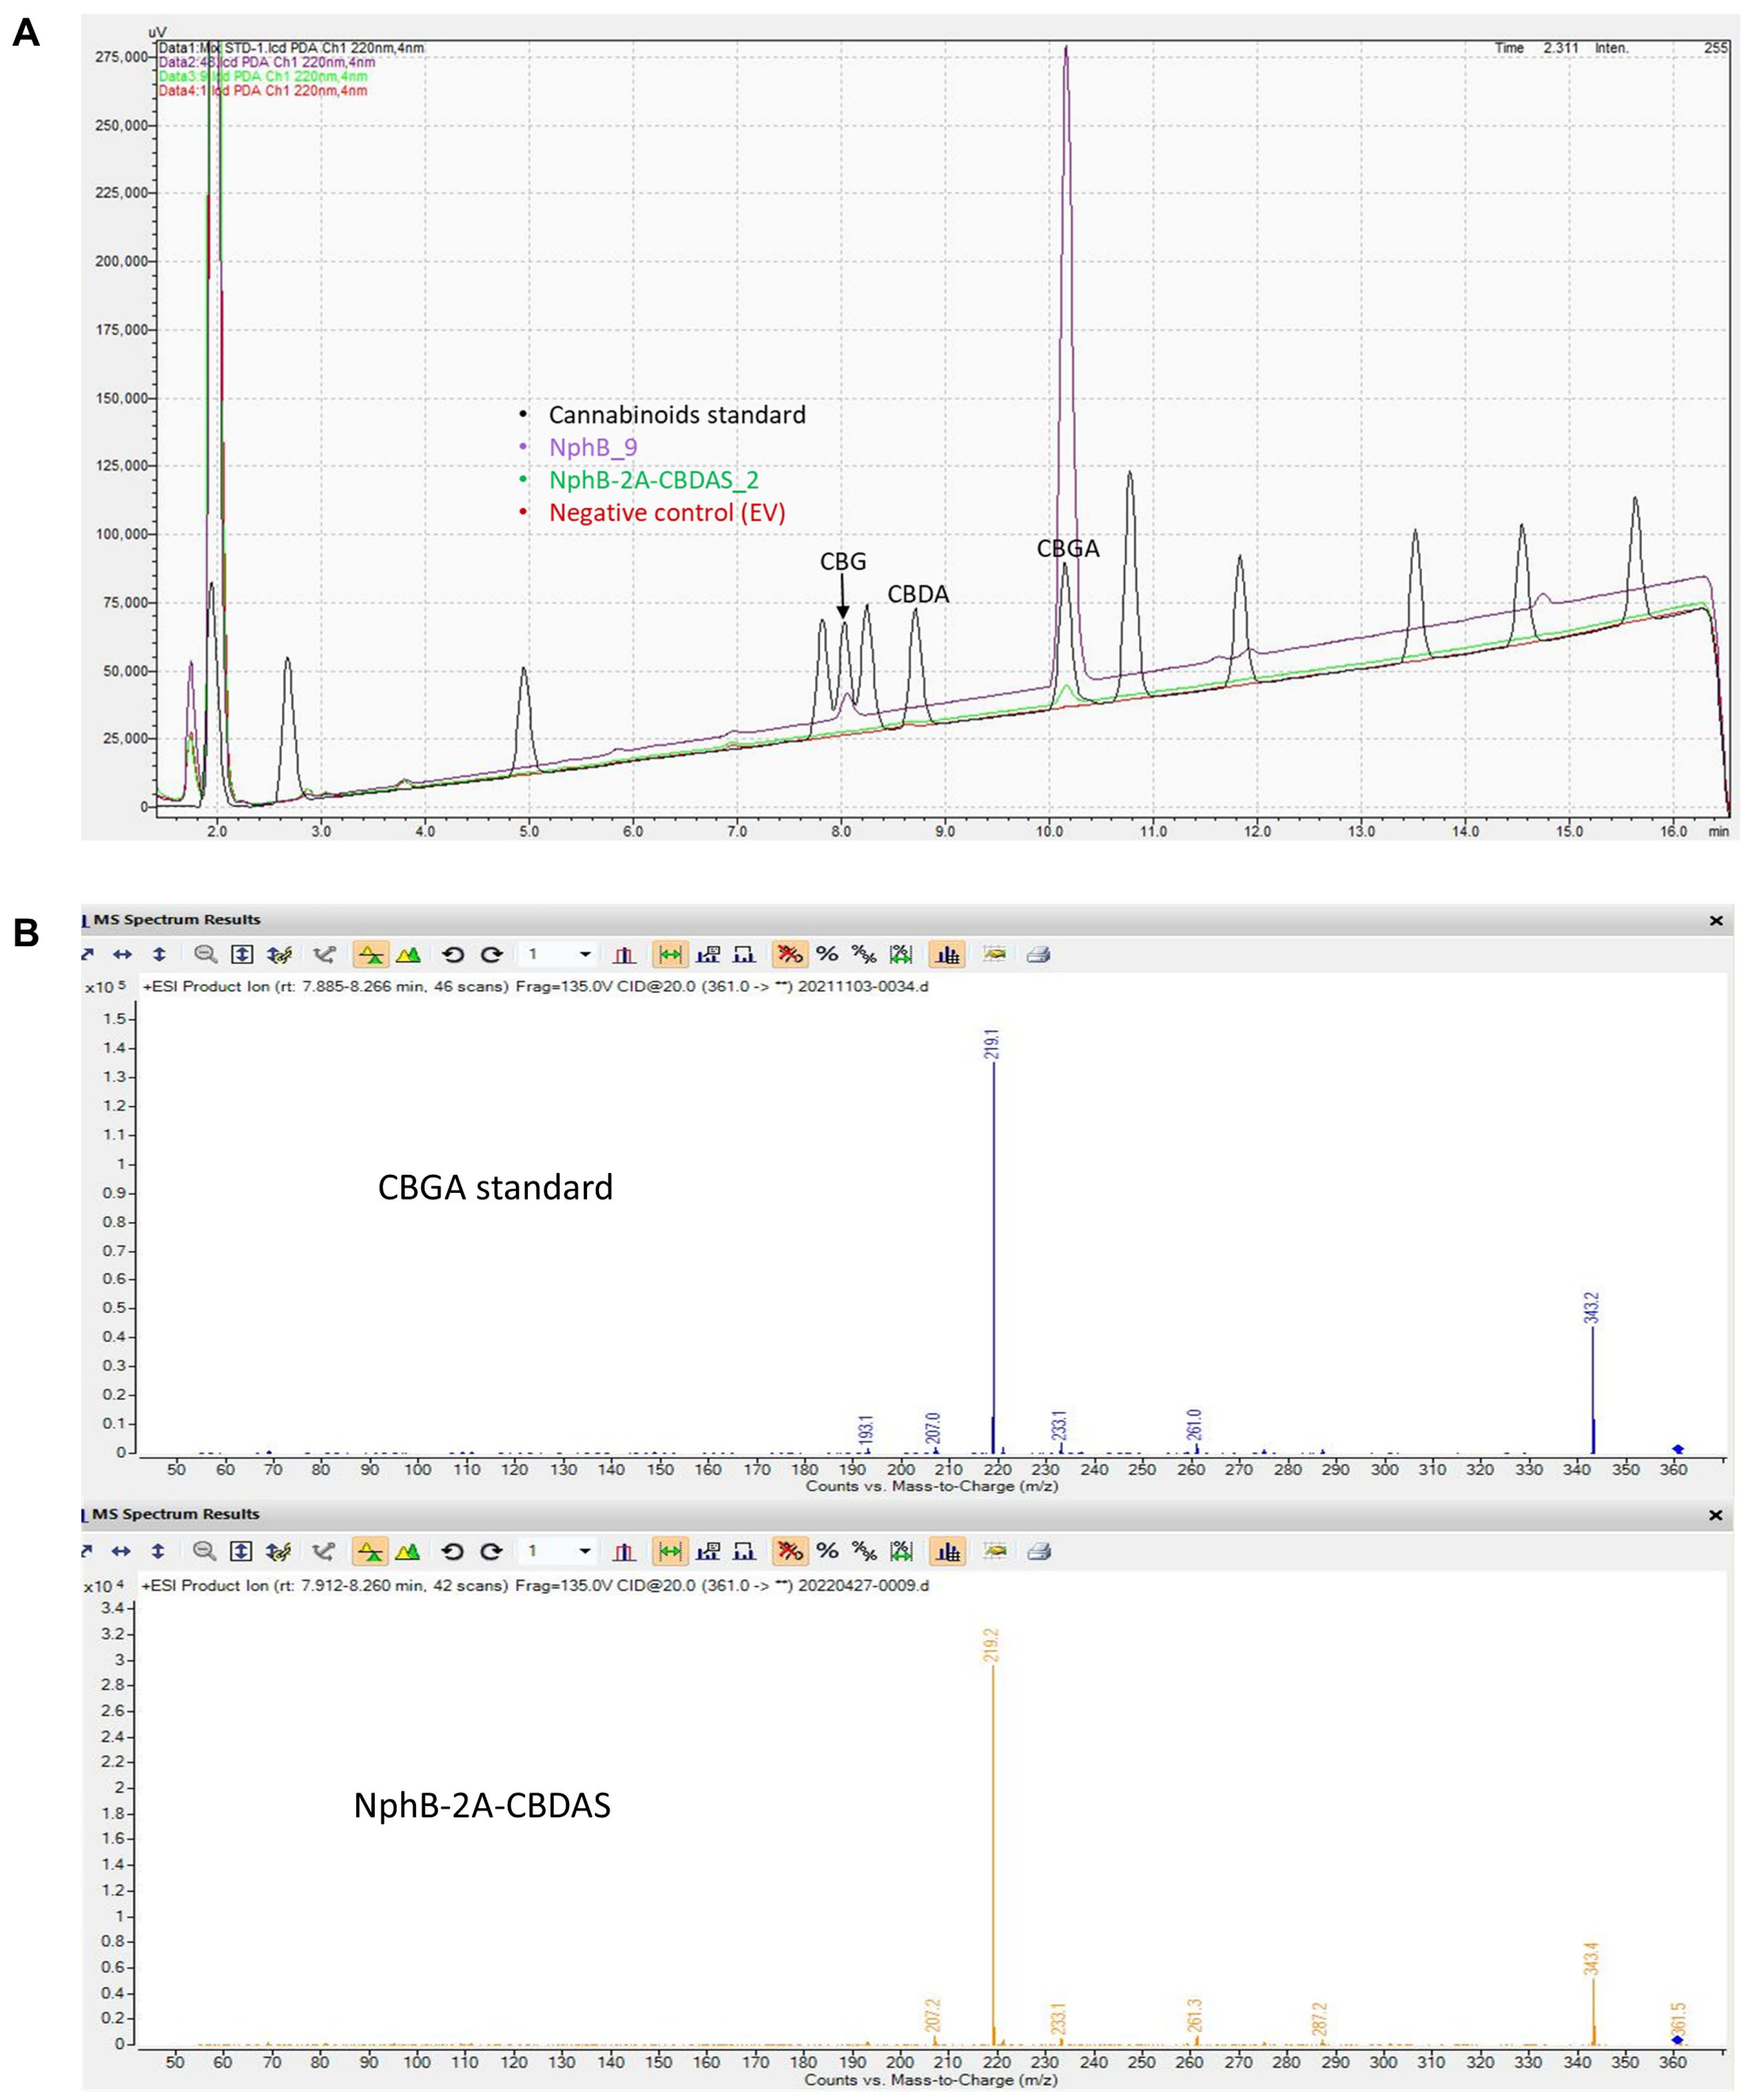
In vitro enzymatic assays were performed using GPP and OA as substrates (Figure 2D) and analyzed by HPLC-DAD, followed by confirmation with HPLC-MS/MS (Appendix AFigure A1). The NphB enzyme showed in vitro activity in both constructs but produced significantly more CBGA when expressed alone (193 ± 31 mg/L) compared to co-expression with CBDAS (2.3 ± 0.1 mg/L) (Figure 2E, p < 0.0001). Although CBDAS protein accumulated in the fusion construct, CBDA was not detected under these conditions (Appendix AFigure A1).
These results confirm that the codon-optimized NphB sequence encodes a functional prenyltransferase capable of CBGA synthesis in vitro, while CBDAS did not exhibit detectable activity in this heterologous prokaryotic system. Based on these observations, subsequent experiments focused on evaluating enzyme expression and functionality in the photosynthetic host C. reinhardtii.

2.2. Co-Expression of NphB and CBDAS Transgenes as a Single ORF in the Microalga C. reinhardtii

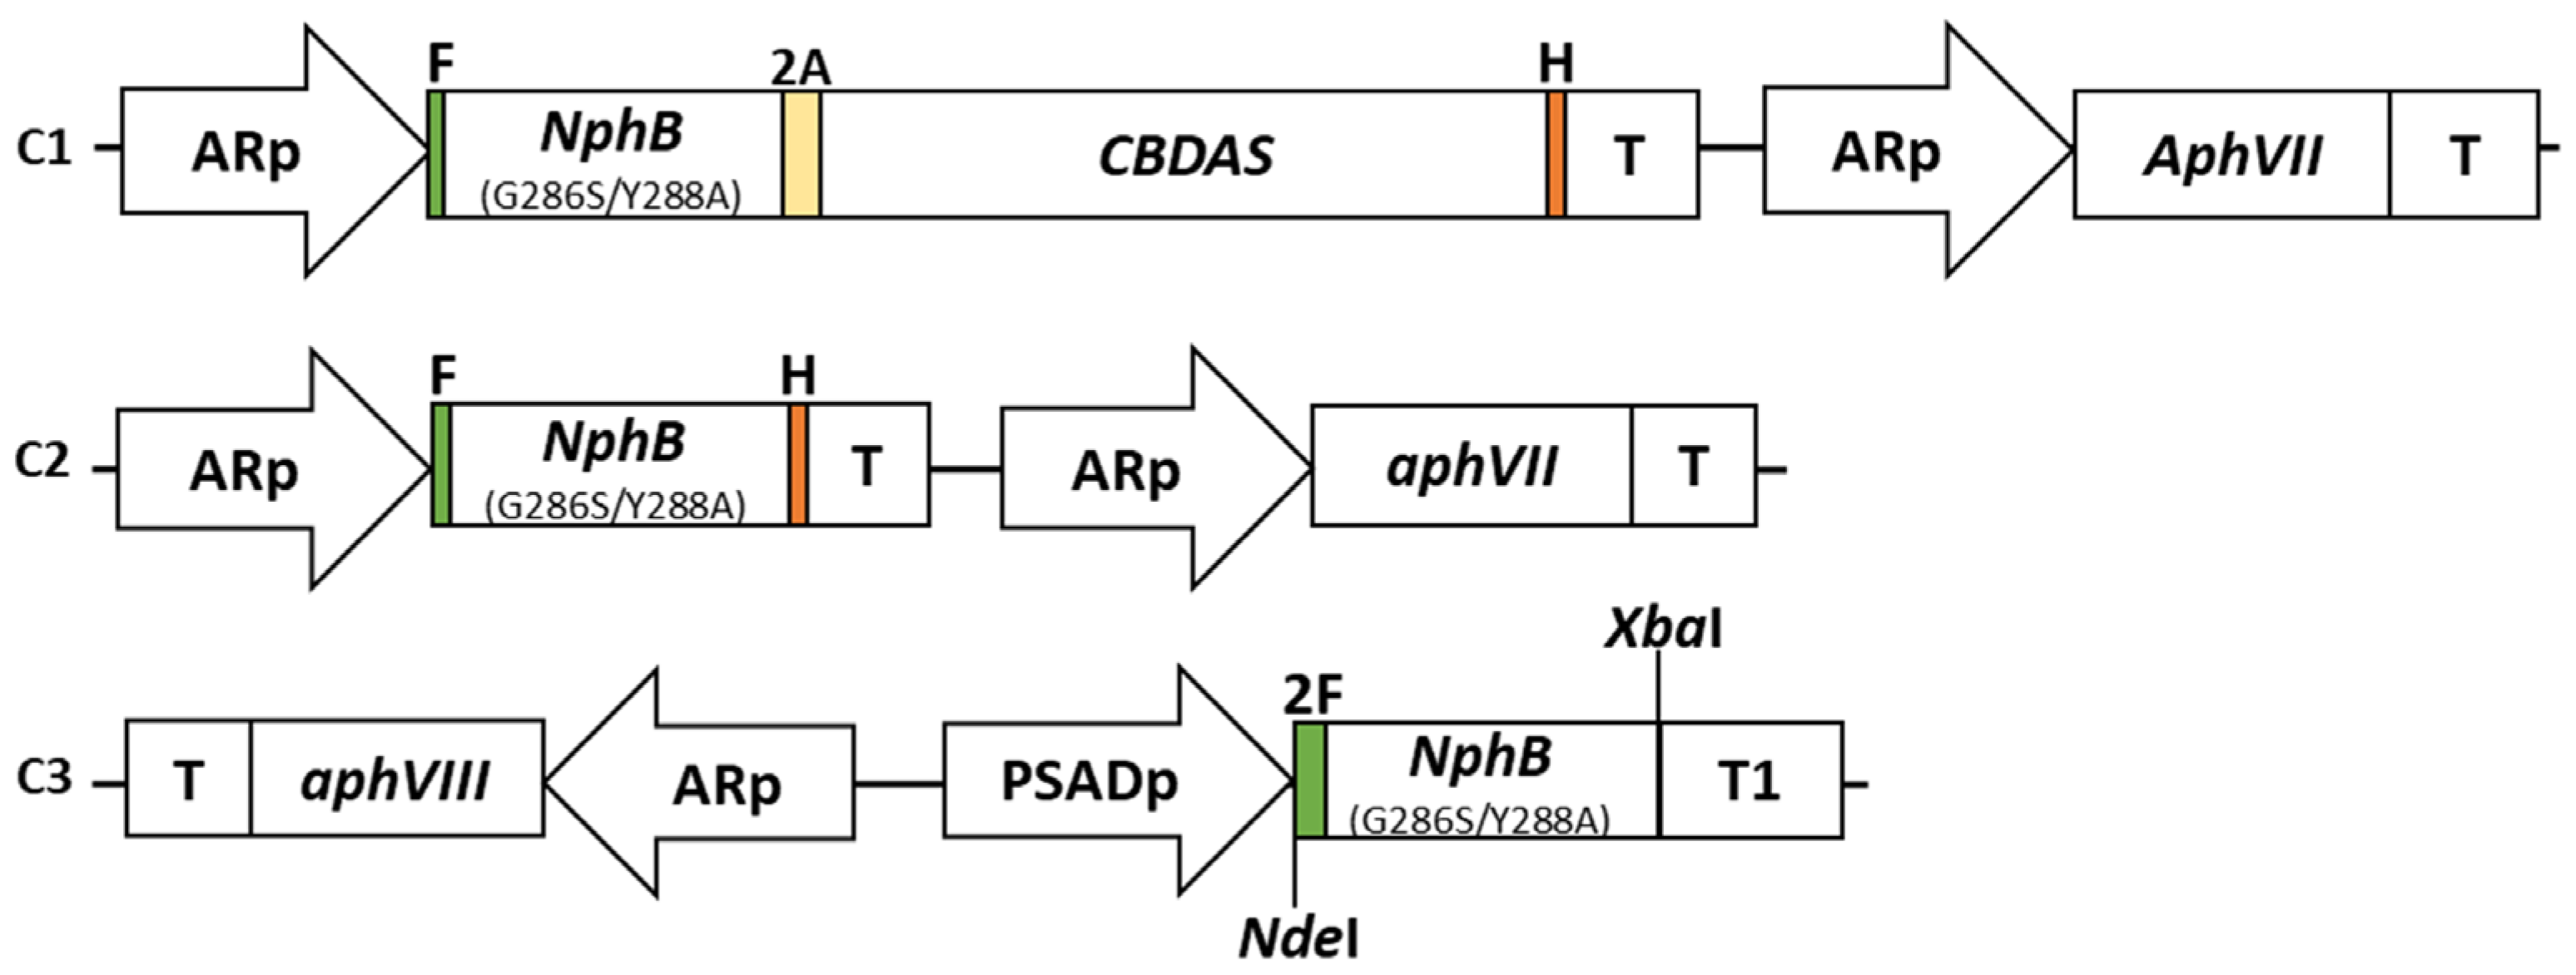
To evaluate whether a photosynthetic eukaryotic host could support the co-expression of CB-related enzymes, a bicistronic construct (C1) encoding NphB linked to CBDAS via an extended FMDV2A peptide was introduced into the nuclear genome of C. reinhardtii (Figure 3). Expression of the fused open reading frame was driven by the chimeric HSP70A–RBCS2 promoter (ARp) [61]. Transformations were performed in the wild-type strain CC-125 by electroporation and in the high-expression strains UVM4 and UVM11 using the glass bead method (Appendix AFigure A2 and Table A1).
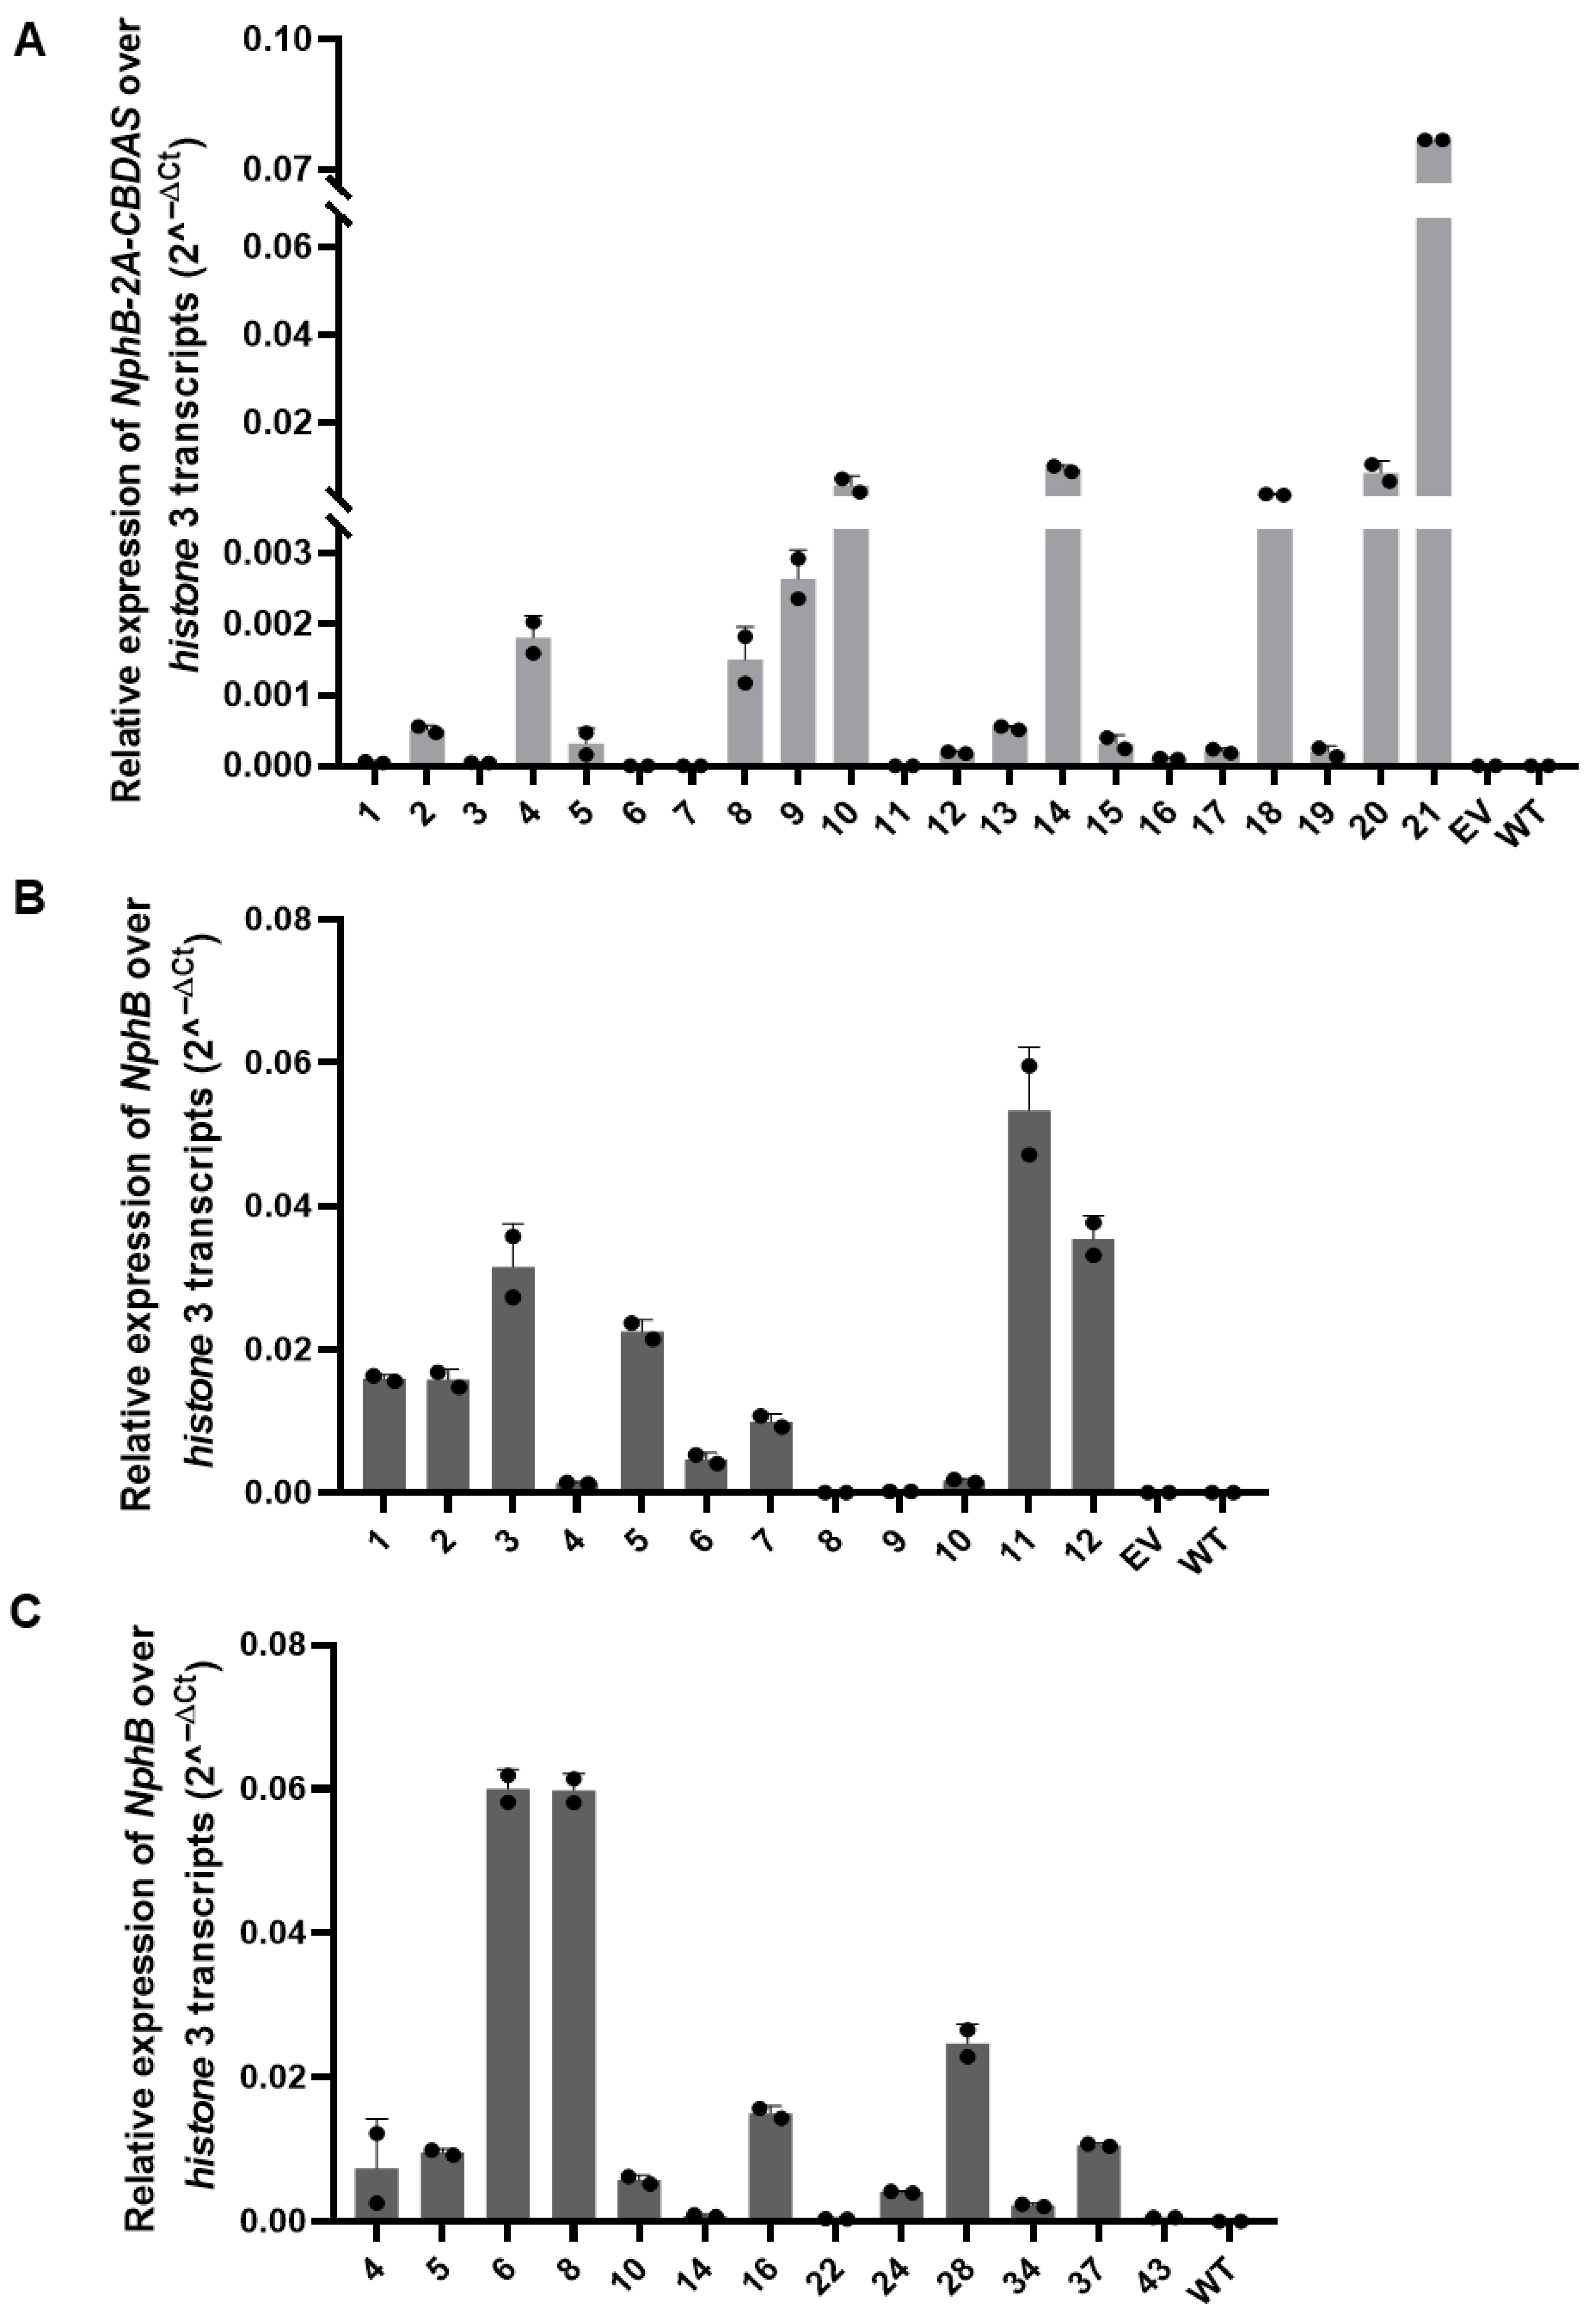
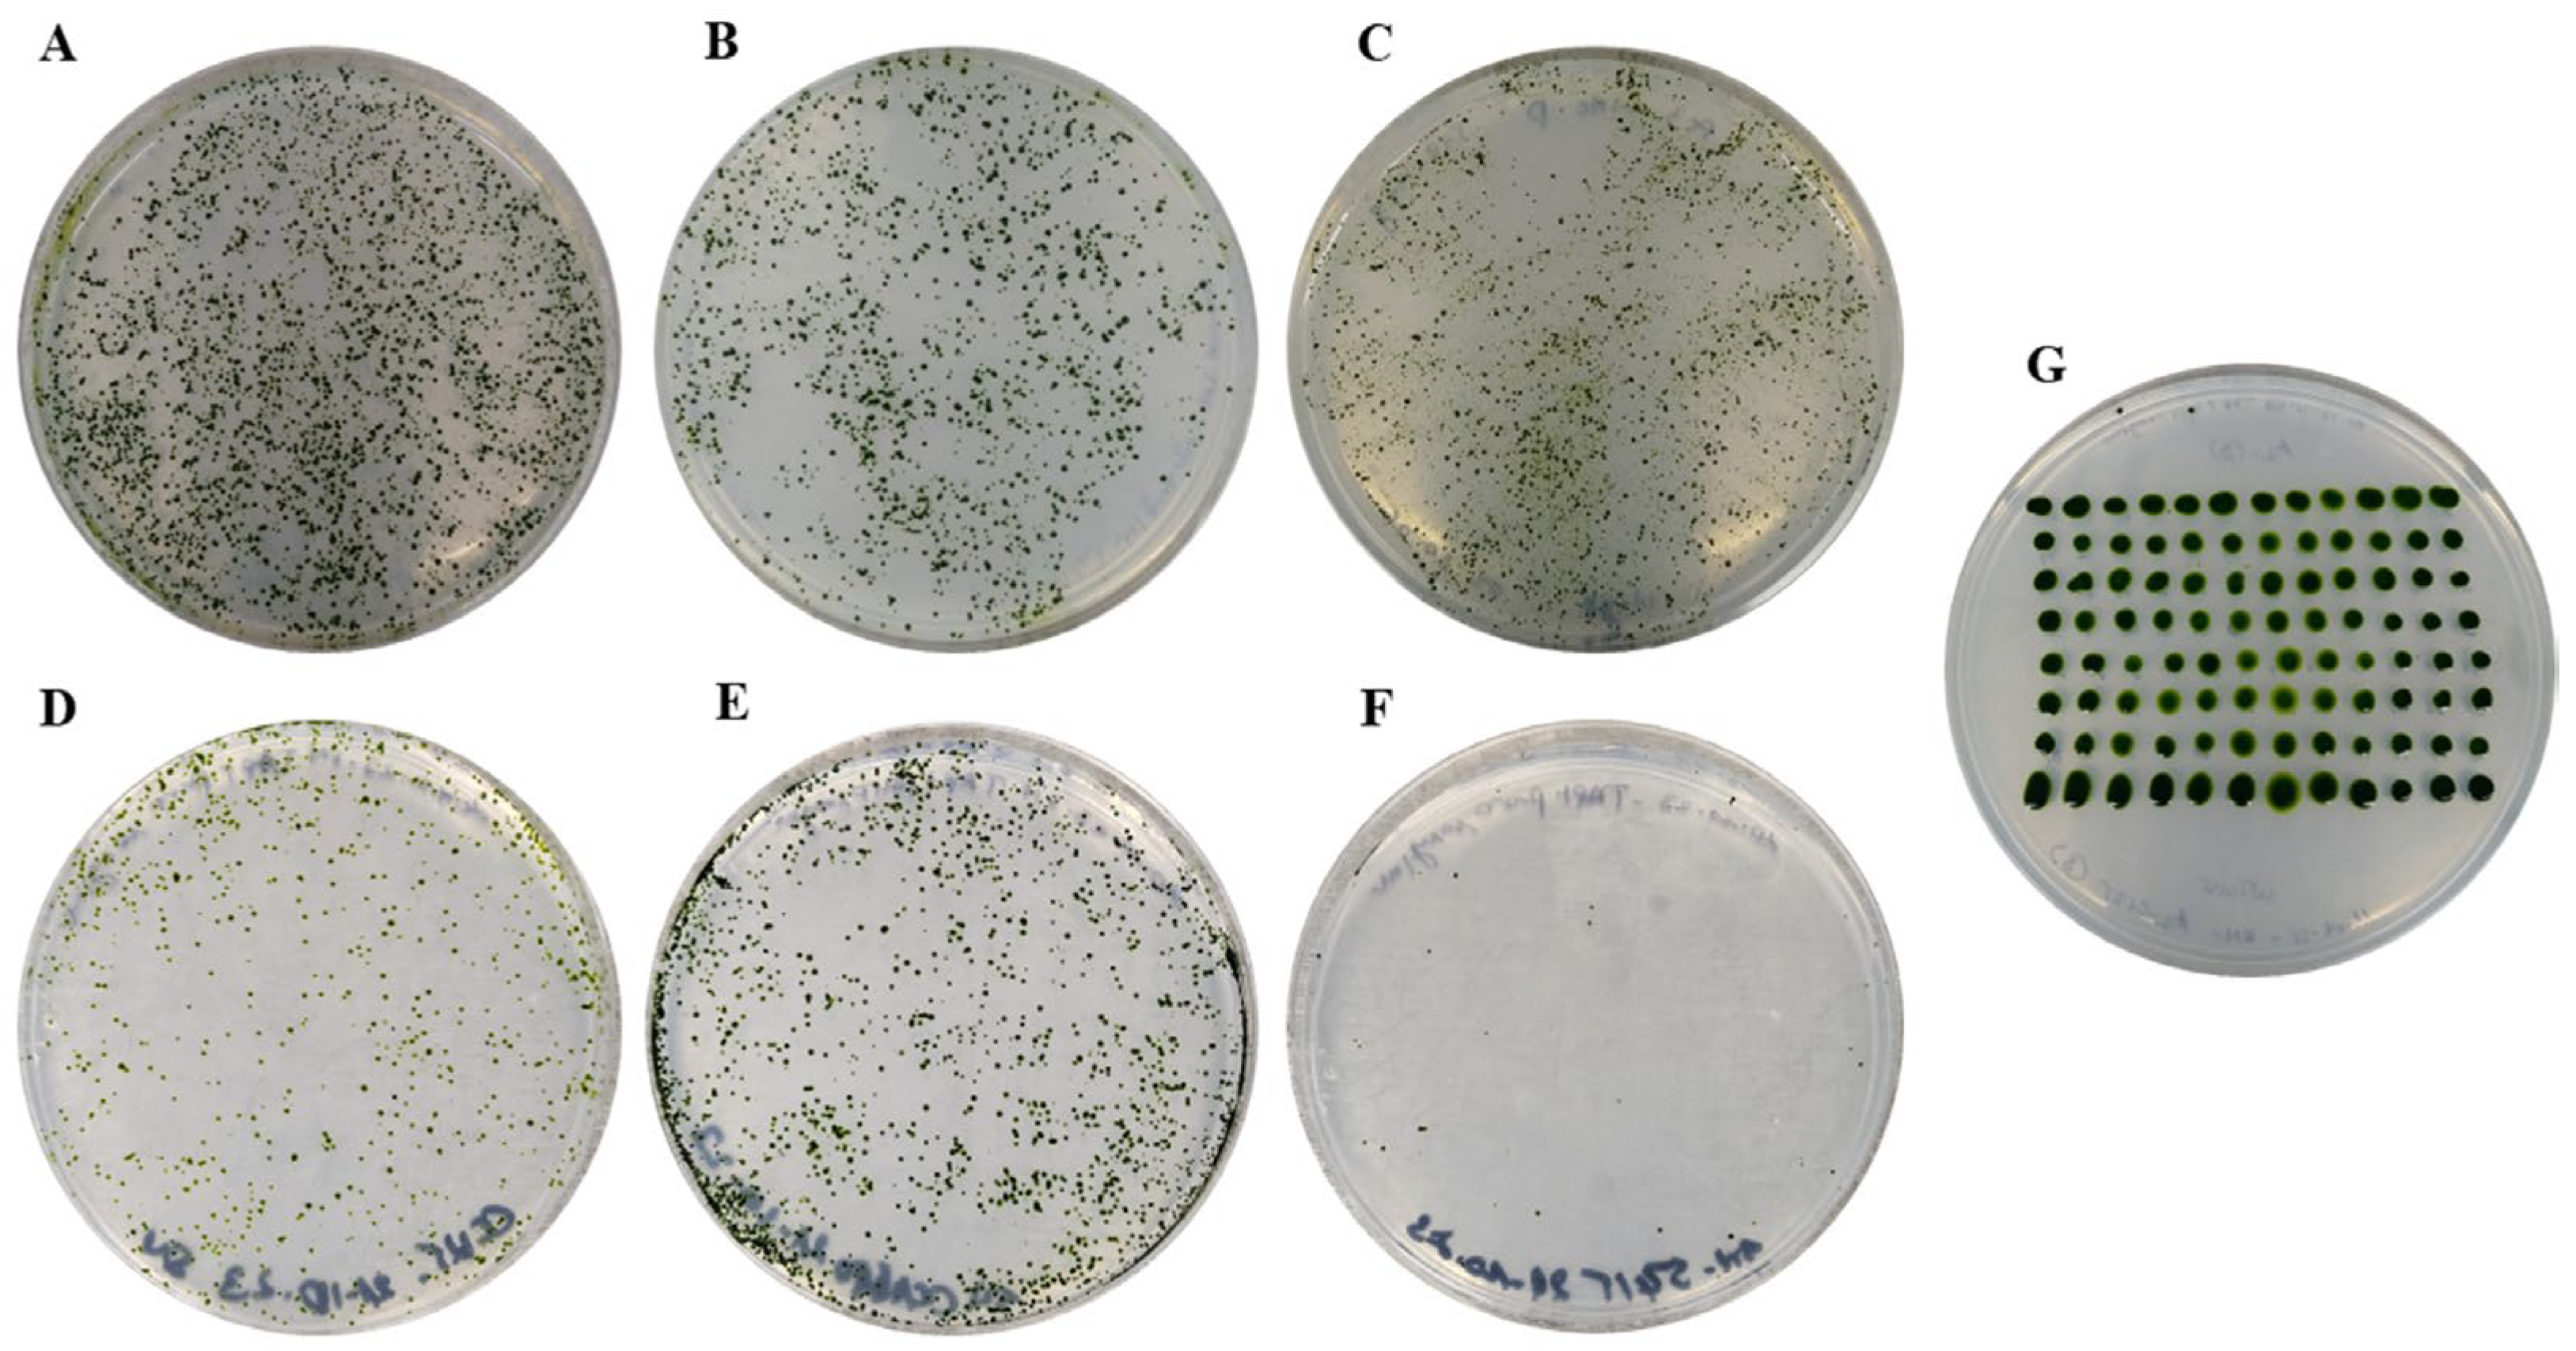
In CC-125, approximately 3000 transformants were obtained following antibiotic selection (Appendix AFigure A2). After five rounds of subculturing to ensure genomic stability, PCR screening of 384 randomly selected colonies identified 21 clones (5.5%) carrying the full-length C1 expression cassette (Appendix AFigure A3; Table 1). Sanger sequencing confirmed the integrity of the integrated transgene in these PCR-positive clones. RT-qPCR analysis revealed detectable transgene transcripts in 16 of the 21 clones, although transcript abundance varied substantially between individual transformants (Figure 4A; Table 1). For example, transcript abundance in clone 21 was approximately 733-fold higher than in clone 16. This significant variability highlights the complexity of transgene regulation in C. reinhardtii, possibly due to transcriptional silencing or positional effects [50,52,55].
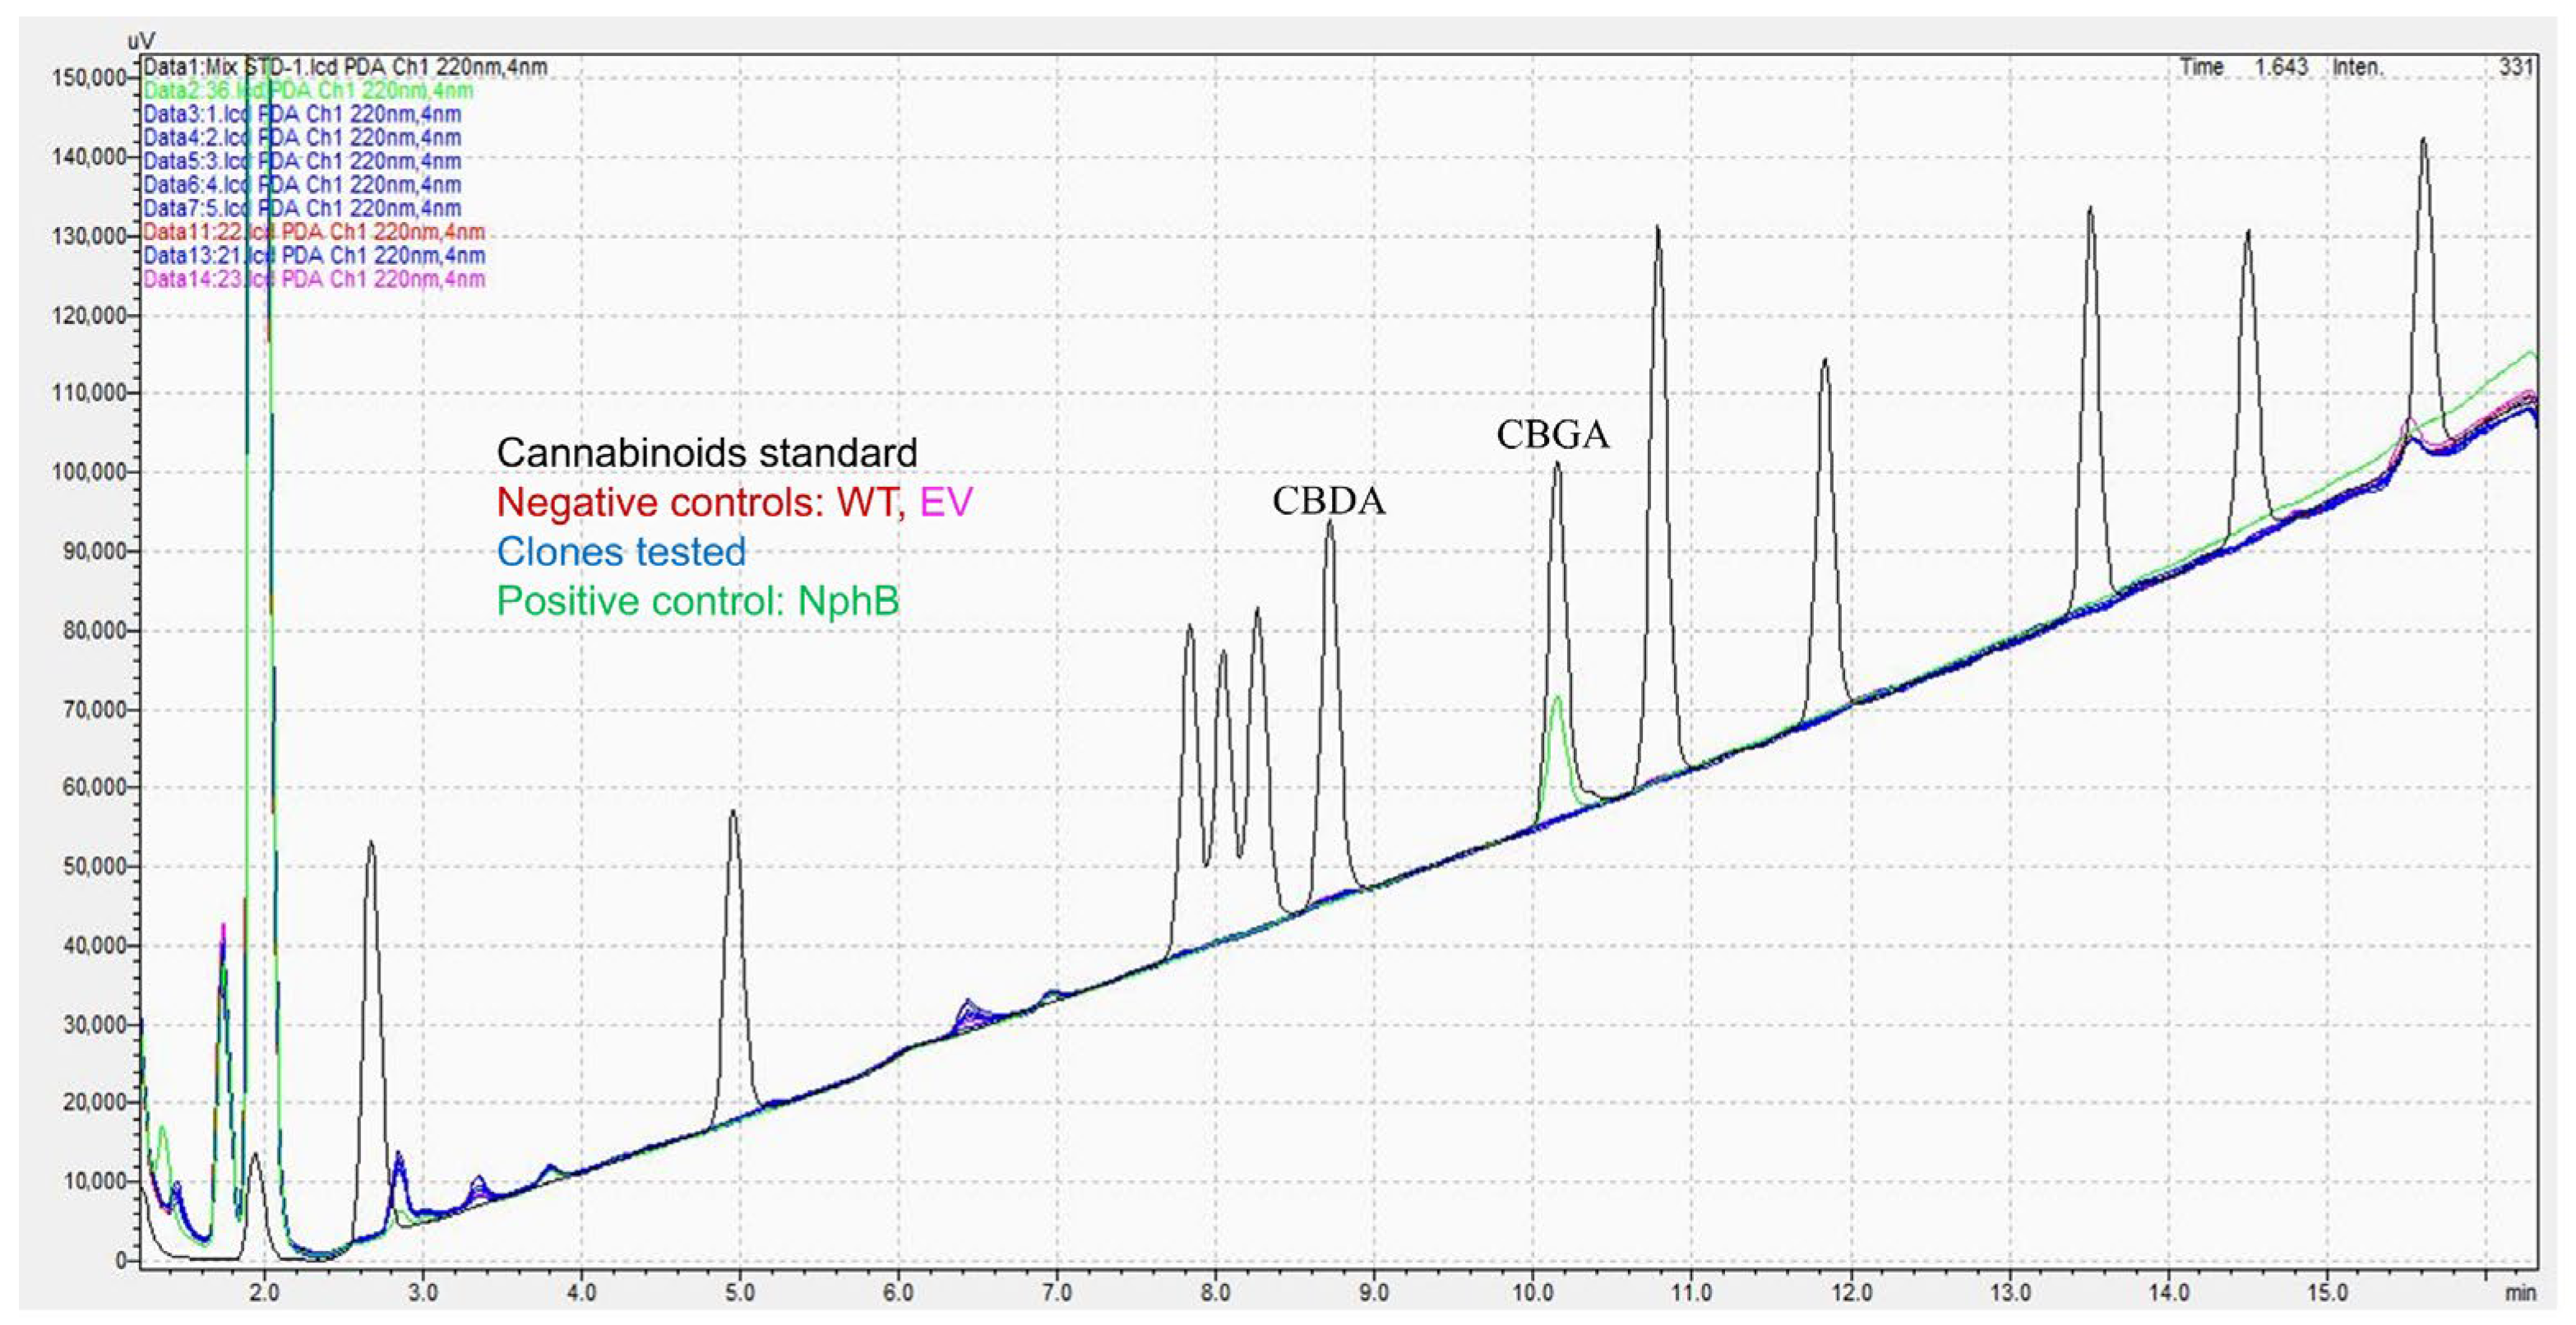
Despite confirmed transgene integration and transcription, no accumulation of NphB or CBDAS protein was detected by Western blot analysis in any of the tested CC-125 transformants (n = 5), using either anti-FLAG or anti-HA antibodies (Appendix AFigure A4). Consistent with the absence of detectable protein, in vitro enzymatic assays performed with total soluble protein extracts from these clones did not yield expected products CBGA or CBDA, as determined by HPLC analysis (Appendix AFigure A5).
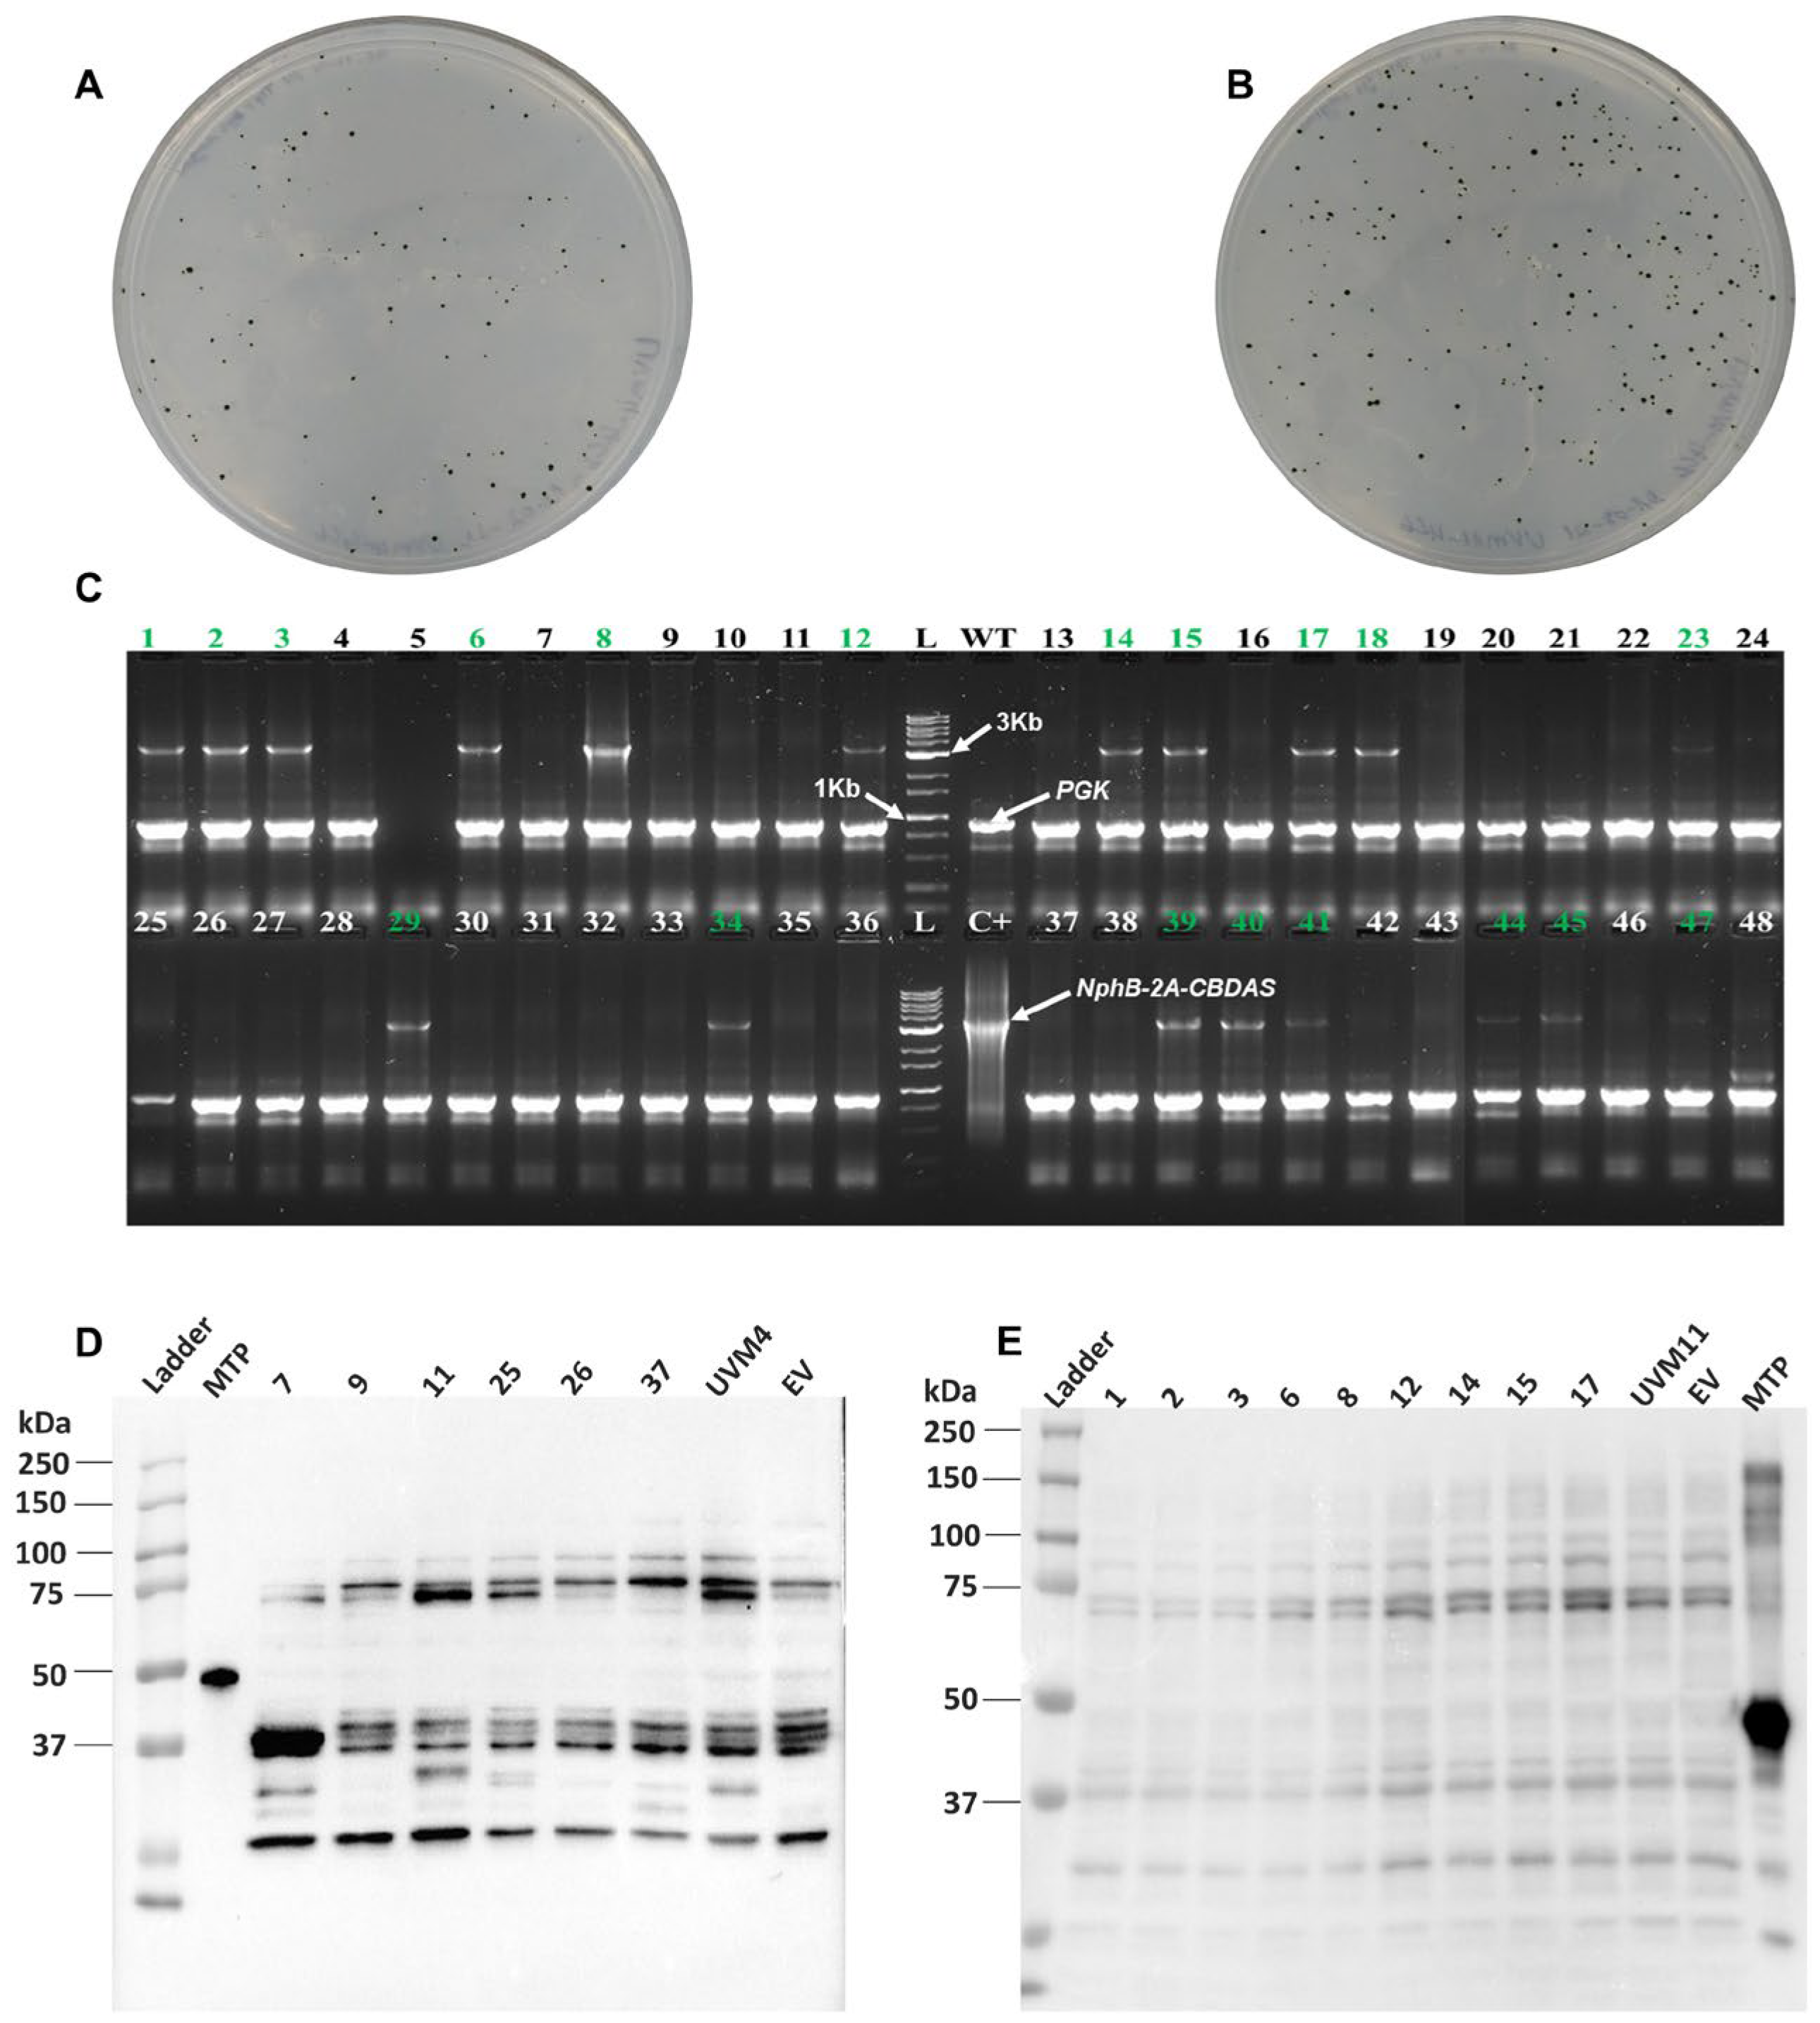
A similar outcome was observed in the high-expression strains UVM4 and UVM11 (Appendix ATable A1). Although PCR analysis confirmed stable integration of the full-length C1 construct in both backgrounds (Appendix AFigure A6), no accumulation of NphB or CBDAS protein was detected by Western blot, and no cannabinoid-related products were observed in enzymatic assays.
Together, these results indicate that while the bicistronic NphB–CBDAS transgene can be stably integrated and transcribed in the nuclear genome of C. reinhardtii, this configuration does not support detectable protein accumulation or enzymatic activity under the conditions tested. These findings prompted further evaluation of alternative construct designs aimed at improving heterologous enzyme expression.

2.3. Expression of NphB and CBDAS Using Independent ORFs

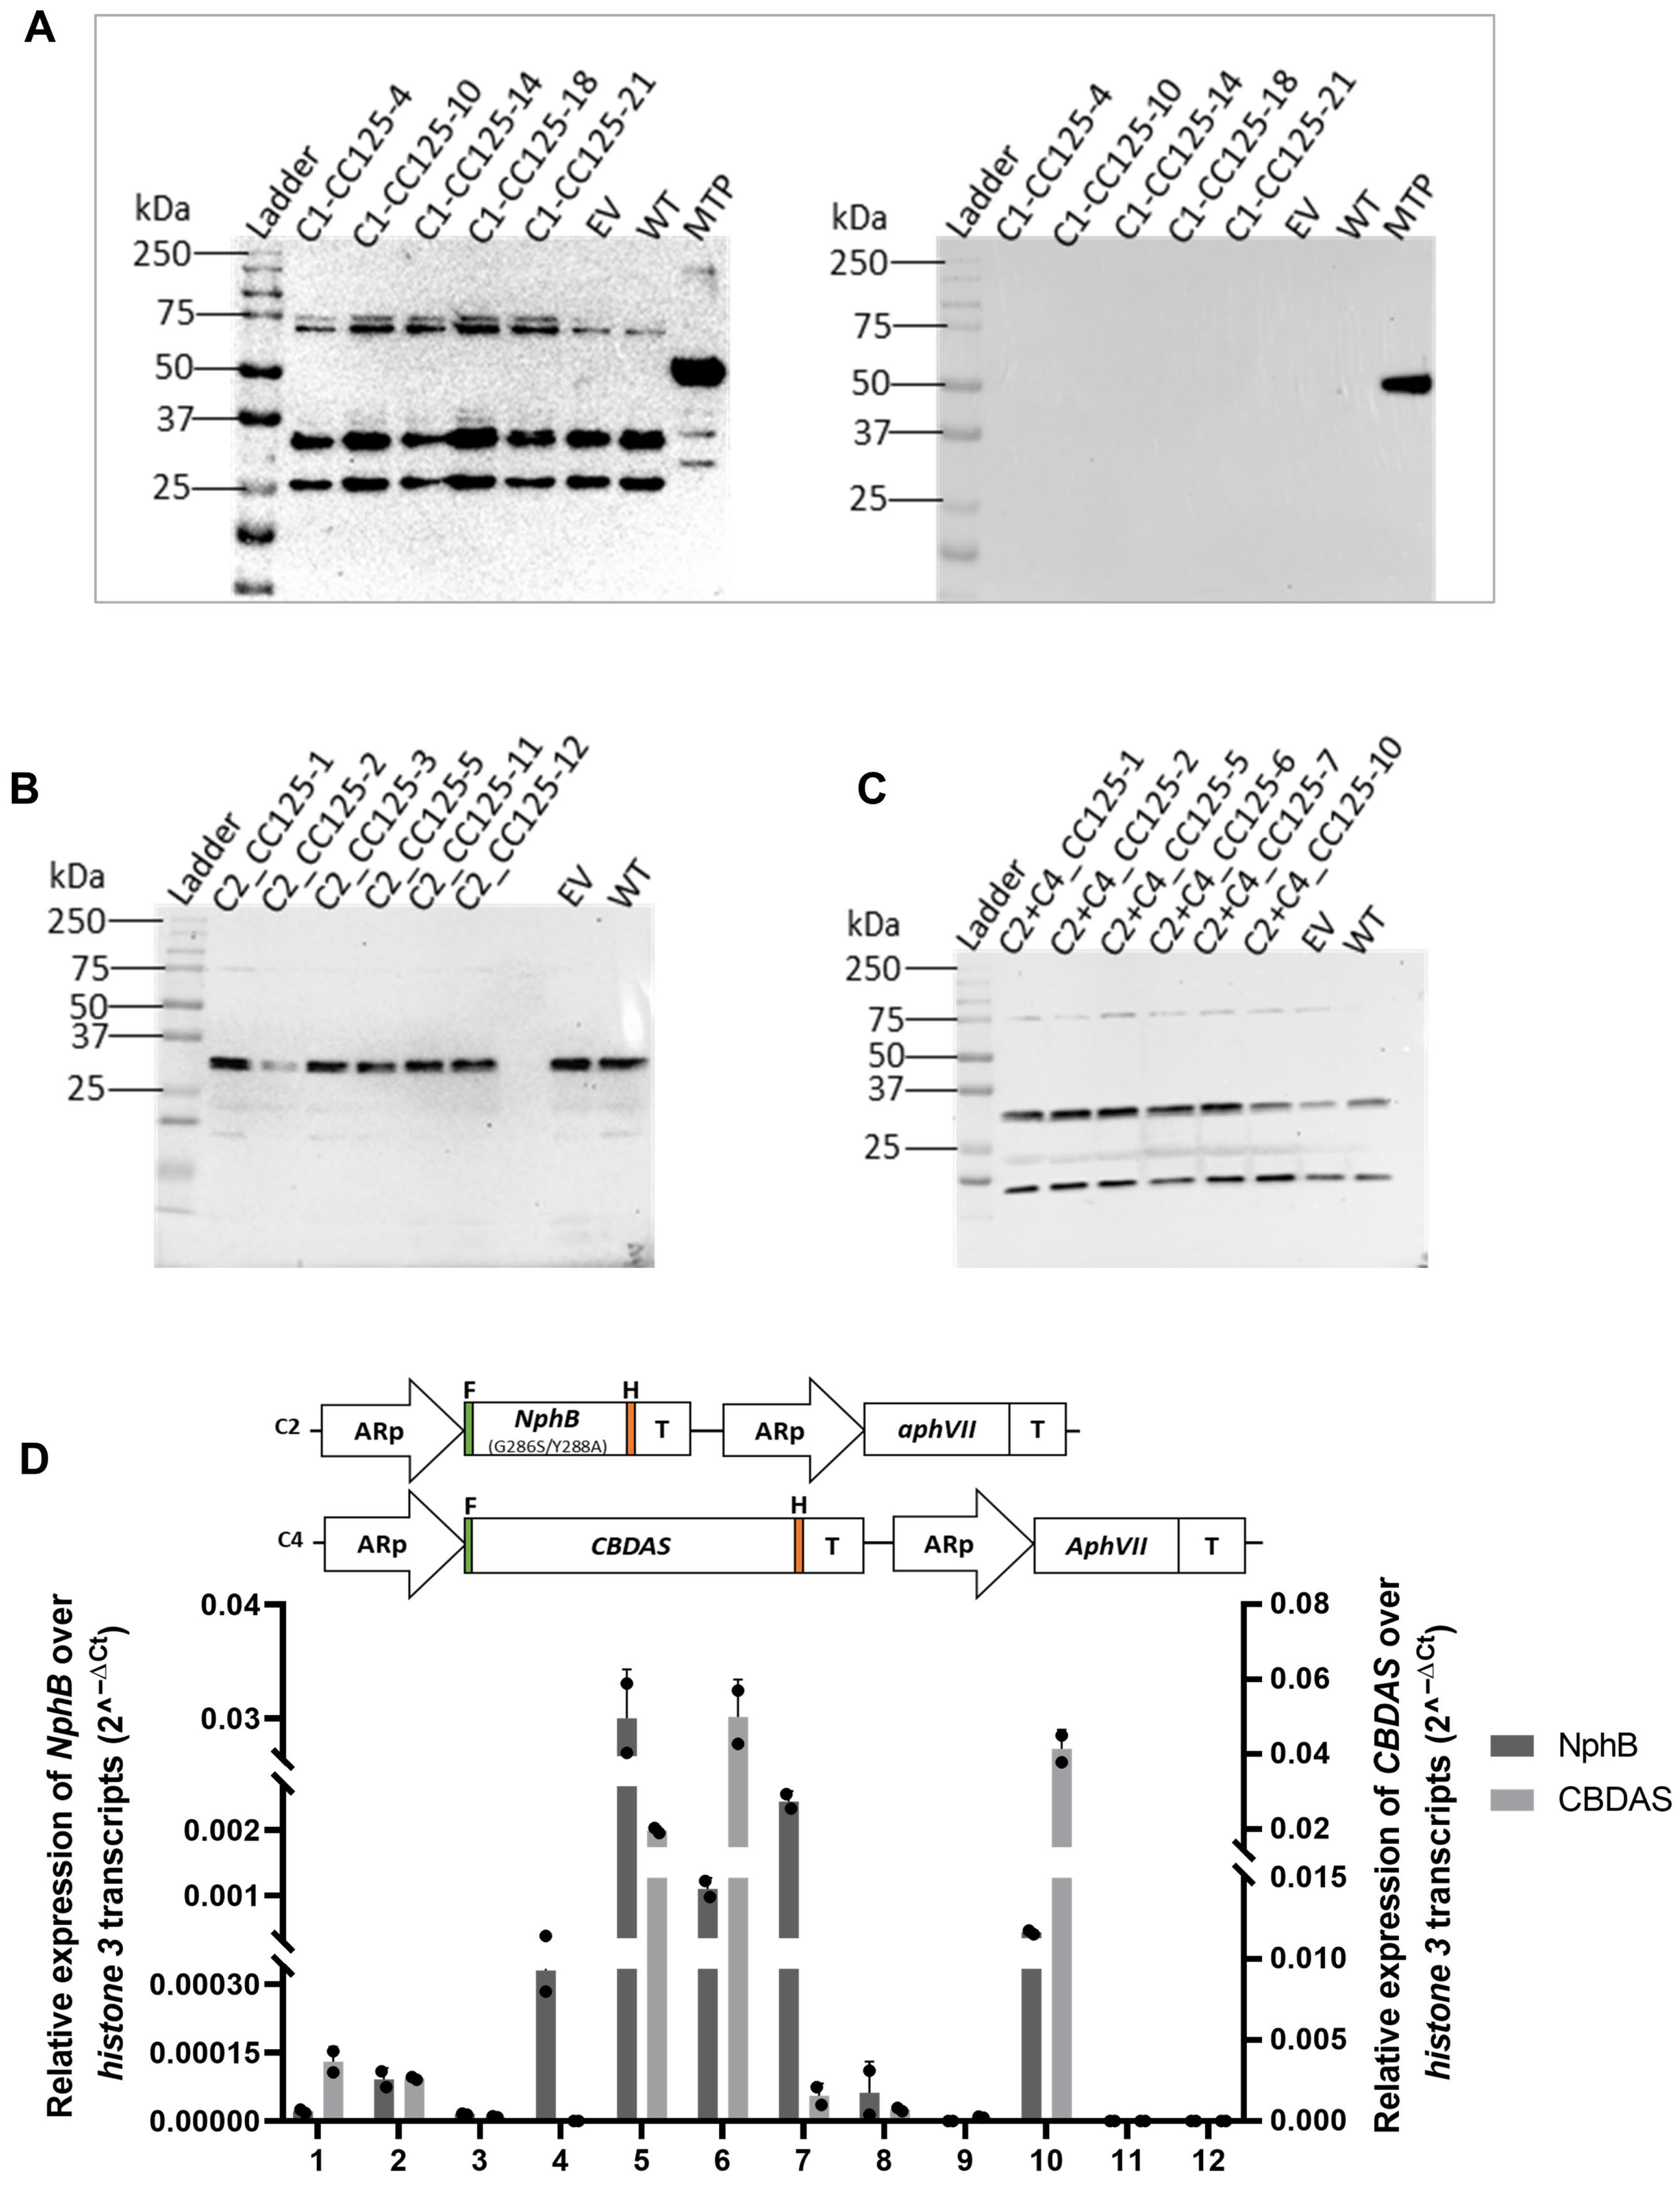
To determine whether separating the NphB and CBDAS coding sequences could improve protein accumulation in C. reinhardtii, the bicistronic C1 construct was divided into two independent expression cassettes. Construct C2 encoded NphB alone, while construct C4 encoded CBDAS, each driven by the same HSP70A–RBCS2 fusion promoter and terminator used in C1 (Figure 3; Appendix AFigure A4). Transformations were performed in the wild-type strain CC-125 using C2 alone or the co-transformation of C2 and C4.
Transformation with C2 yielded approximately 2000 antibiotic-resistant colonies. After five rounds of subculturing under selective conditions, PCR screening of 384 randomly selected colonies identified 140 transformants (36.5%) carrying the complete NphB expression cassette (Appendix AFigure A2; Table 1). RT-qPCR analysis of representative clones revealed detectable NphB transcripts in 10 of 12 tested transformants, although transcript abundance varied substantially among clones (Figure 4B). It should be noted that transcript analyses were performed using technical replicates only, and therefore these results primarily reflect relative expression trends rather than statistically robust biological variation. Similar transcription patterns were observed in co-transformants carrying both C2 and C4 constructs (Appendix AFigure A4).
Despite confirmed transcription of the transgenes, Western blot analysis did not reveal bands corresponding to the expected molecular weights of NphB or CBDAS proteins in any of the tested transformants. Instead, only non-specific bands were observed with the anti-FLAG antibody, likely reflecting antibody cross-reactivity or protein degradation (Appendix AFigure A4). The absence of a detectable band at the expected size indicates that the target proteins did not accumulate to detectable levels under these conditions. Consistent with the absence of detectable protein accumulation, in vitro enzymatic assays performed with soluble protein extracts from these clones did not produce cannabinoid metabolites.
These results indicate that although the NphB and CBDAS transgenes were successfully integrated and transcribed when expressed as independent open reading frames, this configuration did not lead to detectable protein accumulation or enzymatic activity under the tested conditions.

2.4. PSAD-Driven Nuclear Expression Enables Functional Accumulation of NphB in C. reinhardtii

Because the previous construct configurations did not result in detectable protein accumulation, we evaluated an alternative expression strategy focusing on the bacterial prenyltransferase NphB. A new expression cassette (C3) was designed in which the codon-optimized NphB gene was placed under the control of the strong nuclear PSAD promoter and terminator (Figure 3). The construct was introduced into the nuclear genome of the wild-type strain CC-125 by electroporation.
Following transformation, approximately 2000 antibiotic-resistant colonies were obtained. PCR screening of 384 randomly selected transformants identified 55 clones (14.3%) carrying the complete C3 expression cassette (Table 1; Appendix AFigure A2). Among these, 17 clones maintained stable integration after subculturing (Appendix AFigure A3) and were selected for protein analysis.
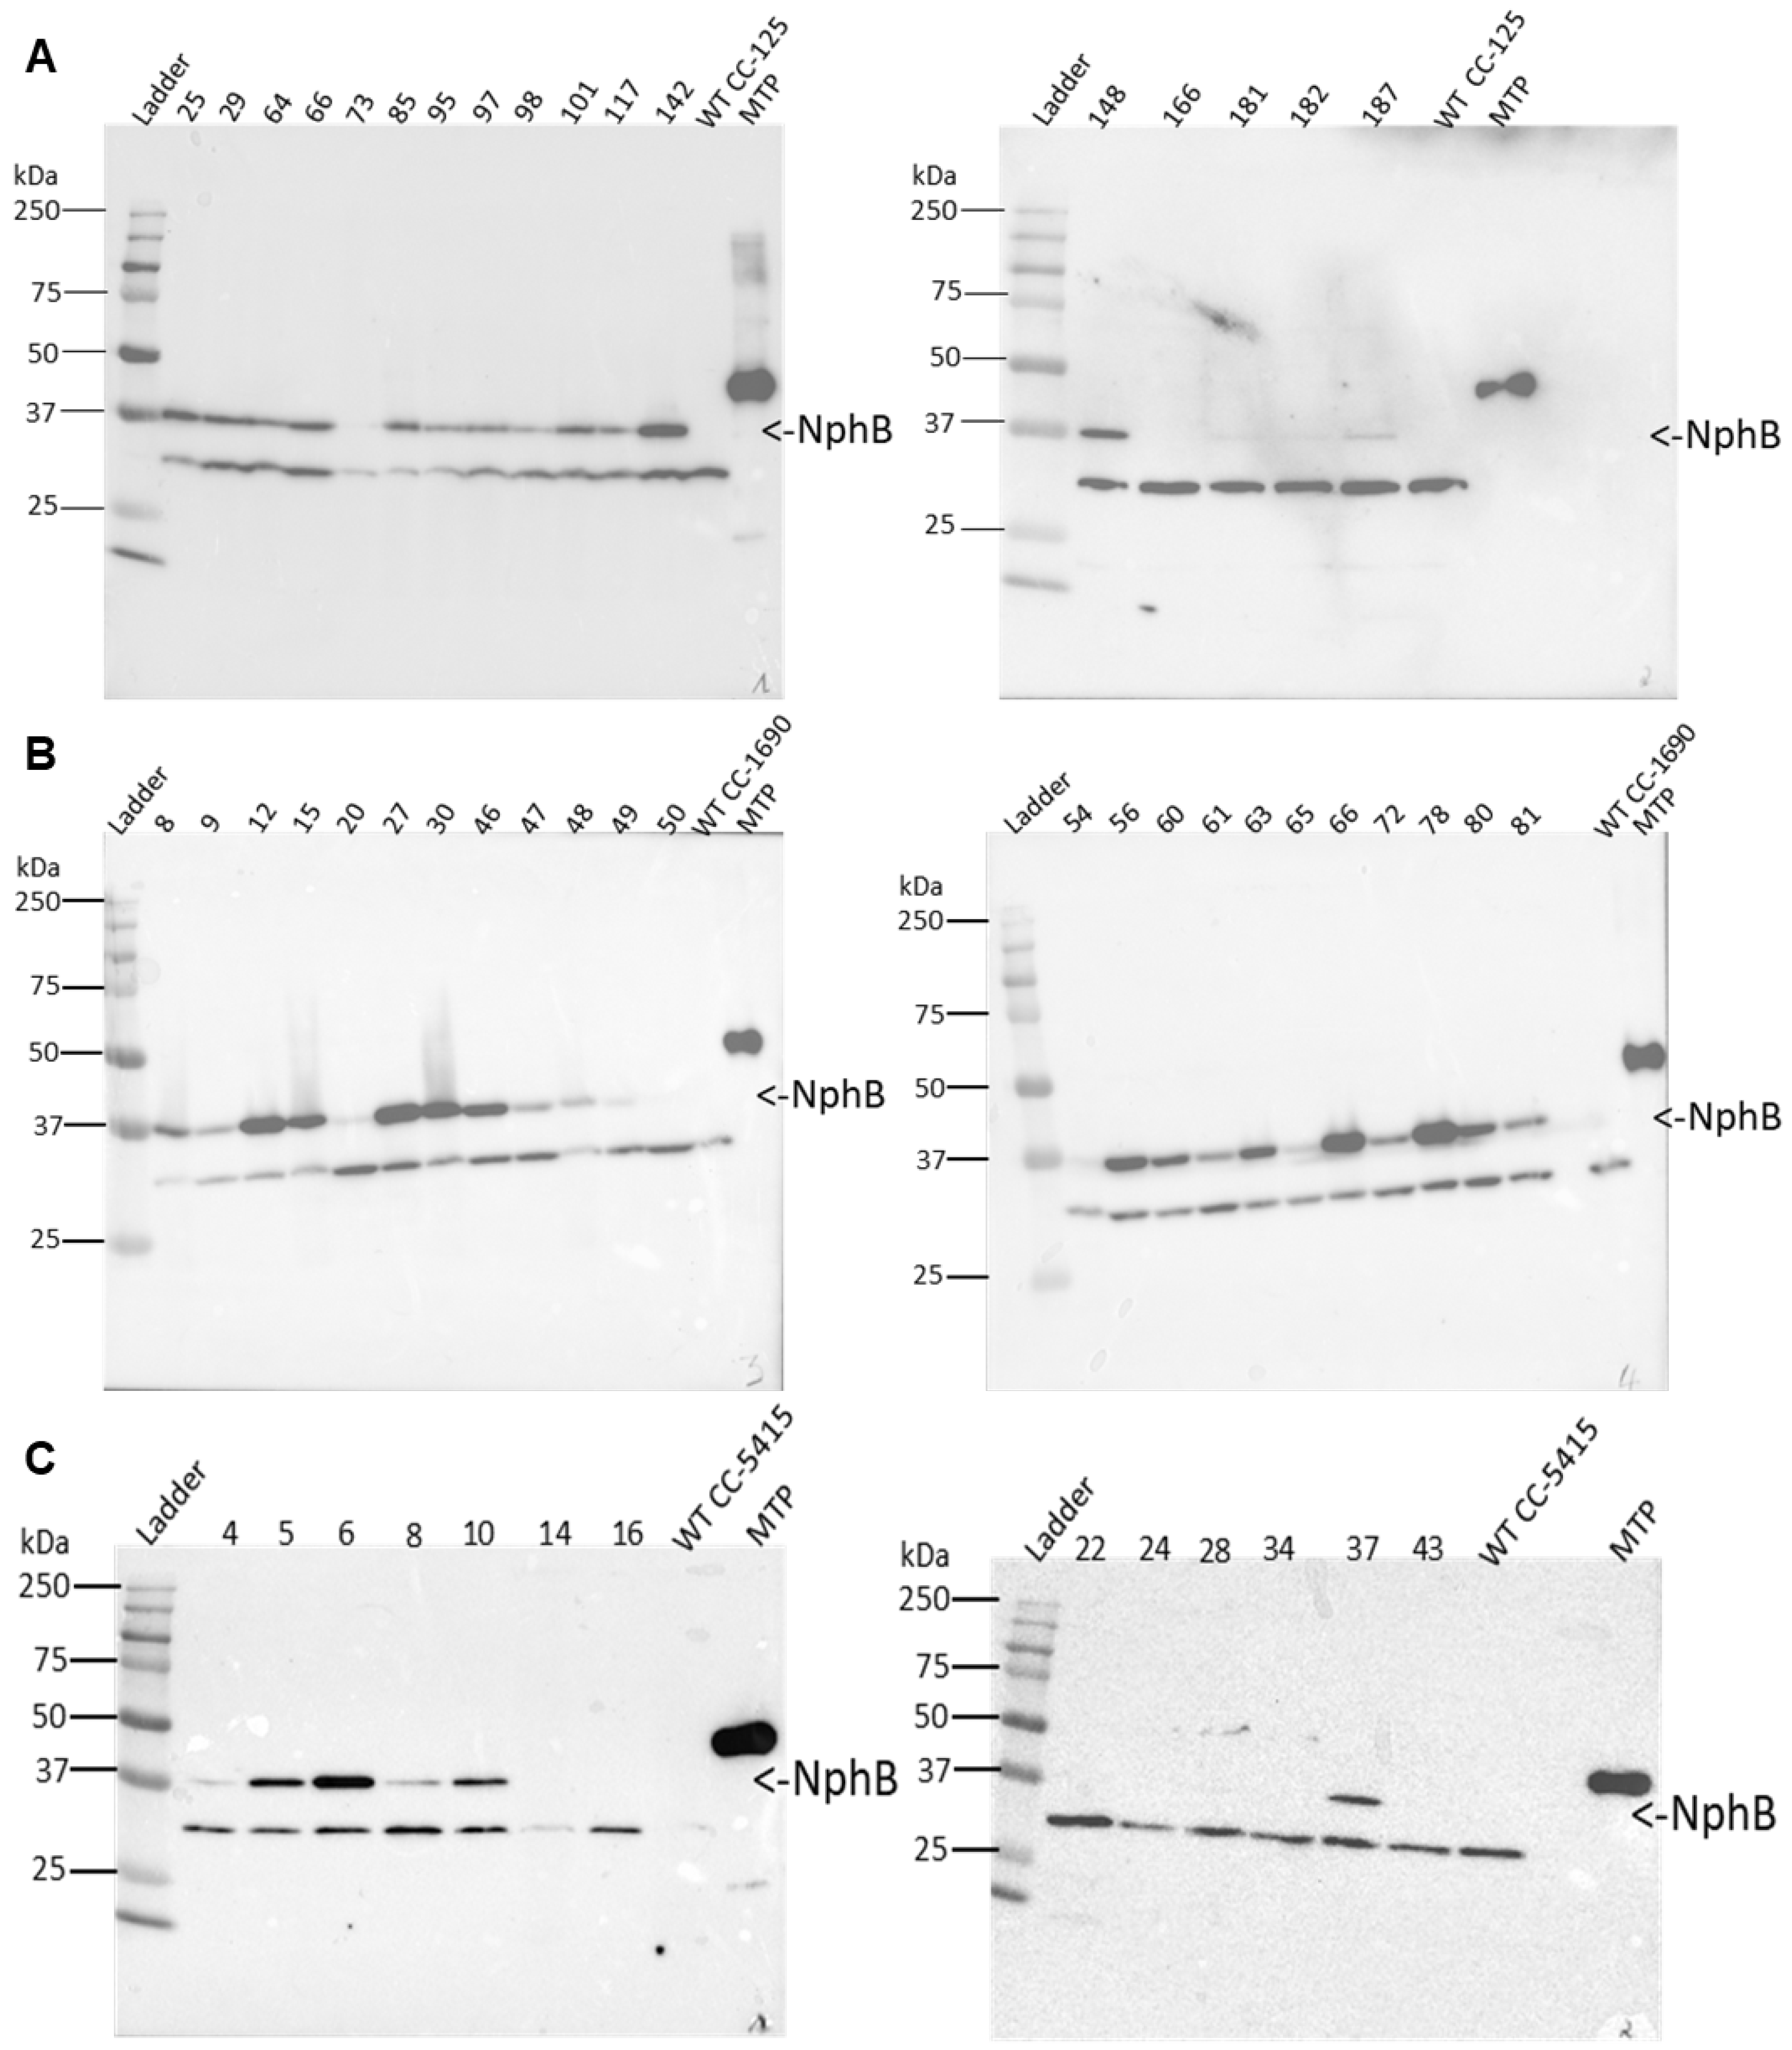
Western blot analysis using an anti-FLAG antibody revealed the accumulation of a protein band at approximately 37 kDa, consistent with the expected molecular weight of NphB, in 15 of the 17 analyzed clones (88.2%) (Figure 5A; Table 1). This band was absent in wild-type or empty vector controls supporting its specificity. A multi-tag protein (MTP) was used as a positive control to validate antibody detection. In addition to the expected band, several non-specific bands were observed across samples. Such signals are commonly reported in C. reinhardtii protein extracts and may arise from antibody cross-reactivity, partial protein degradation, or endogenous proteins with similar epitopes. Despite this background, the reproducible detection of a band at the expected molecular weight, specifically in transformed lines and absent in controls, supports the conclusion that NphB is successfully expressed under these conditions. These results demonstrate that the PSAD promoter and terminator effectively support heterologous expression of NphB (without a C-terminal tag) in the nuclear genome of C. reinhardtii under the tested conditions. Notably, this construct differs from previous designs by the absence of a C-terminal tag, which may have contributed to improved protein accumulation.
To evaluate whether this expression pattern was reproducible across different genetic backgrounds, the C3 construct was subsequently introduced into two additional wild-type strains, CC-1690 and CC-5415. Western blot analysis confirmed the accumulation of NphB in multiple transformants of both strains (Figure 5B,C; Table 1), indicating that PSAD-driven expression enables detectable NphB production across distinct C. reinhardtii backgrounds.

2.5. C. reinhardtii-Produced NphB Catalyzes CBGA Production In Vitro

To evaluate whether NphB produced in C. reinhardtii was enzymatically active, we first attempted to detect CBGA production in vivo. Cultures of NphB-expressing transformants were supplemented with 2 mM OA during the late exponential growth phase, and metabolites were extracted after 24 h and analyzed by HPLC-MS/MS (Appendix AFigure A7). Despite confirmed NphB protein accumulation, CBGA was not detected in cell extracts or culture media under these conditions.
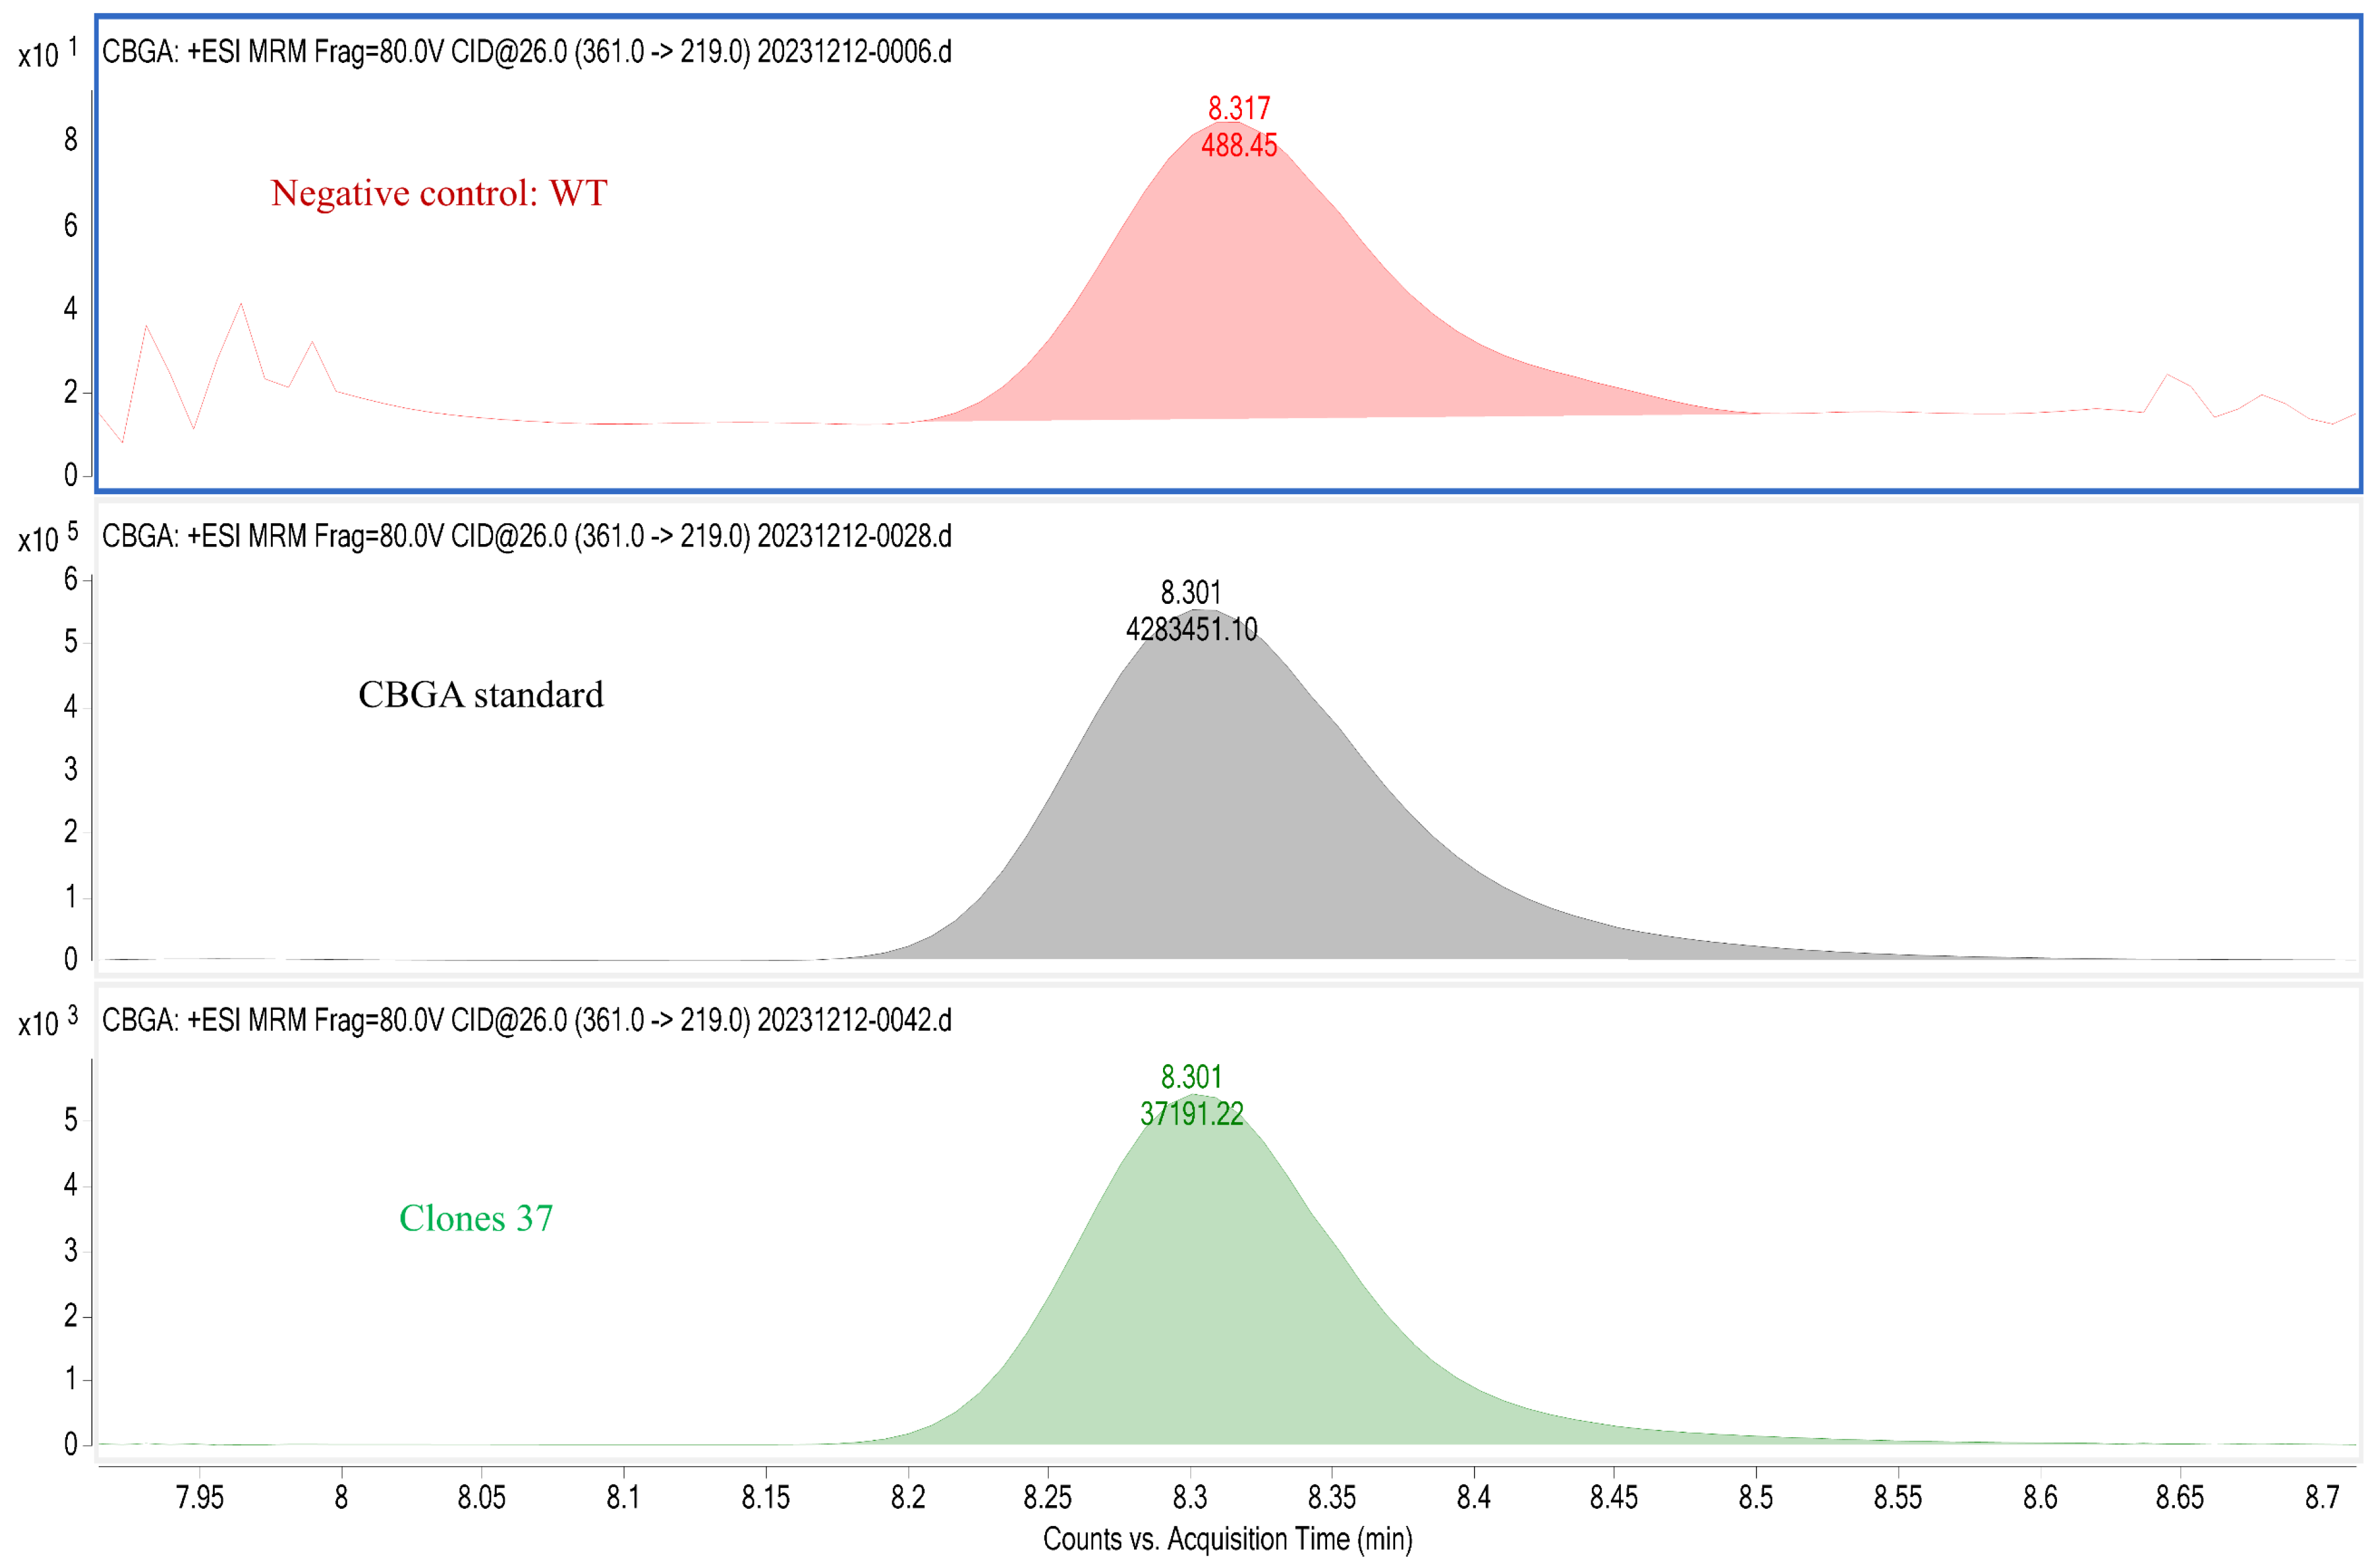
We therefore assessed enzymatic activity using in vitro assays with soluble protein extracts from NphB-expressing transformants. Reactions containing OA and GPP were incubated with algal protein extracts and analyzed by HPLC. An initial screening of 41 Western blot–positive transformants identified CBGA production in 38 clones, based on a chromatographic signal consistent with the CBGA standard and a recombinant NphB positive control expressed in E. coli (Appendix AFigure A5 and Figure A8). While the use of crude extracts may introduce background enzymatic activity or matrix effects, CBGA production was consistently detected only in extracts derived from NphB-expressing lines and not in wild-type or negative controls.
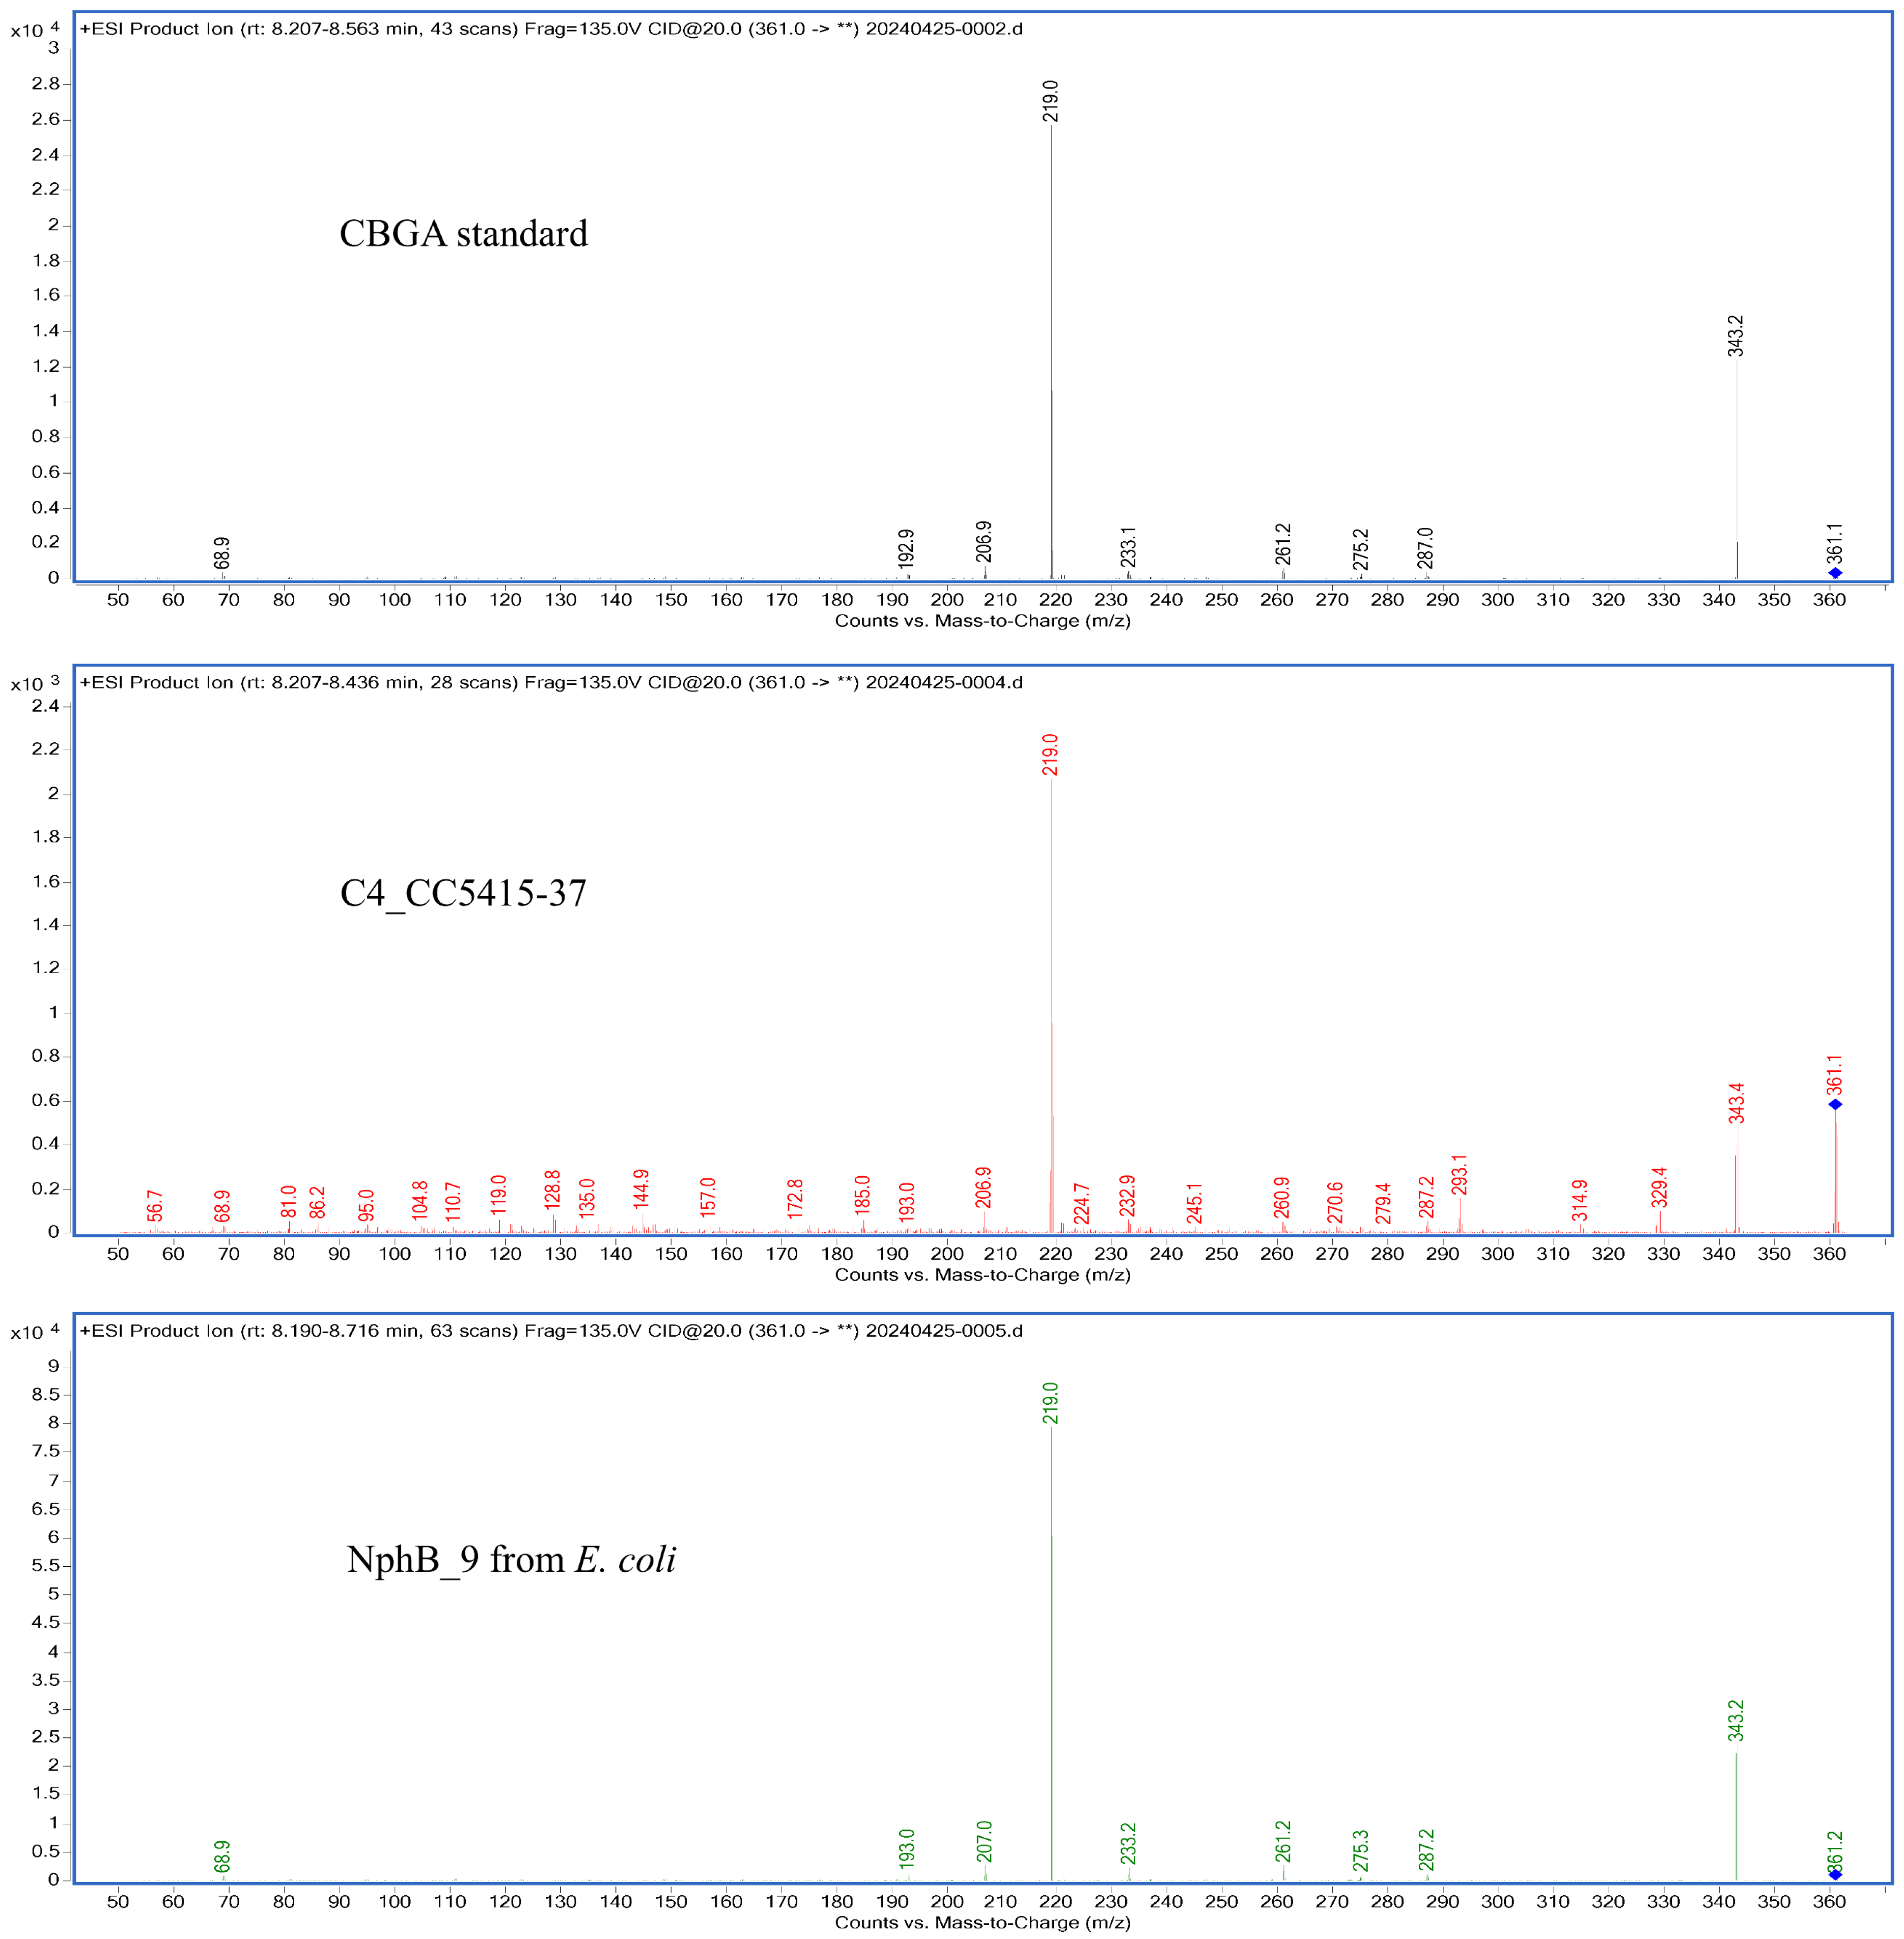
The identity of the product was confirmed by HPLC-MS/MS analysis, which detected the characteristic molecular ion (m/z 361) and fragmentation pattern of CBGA (Appendix AFigure A9). Among the tested strains, a high proportion of transformants exhibited enzymatic activity, including 13 of 15 clones (86.7%) in CC-125, 19 of 20 clones (95%) in CC-1690, and all 6 tested clones (100%) in CC-5415 (Table 1, Appendix ATable A2).
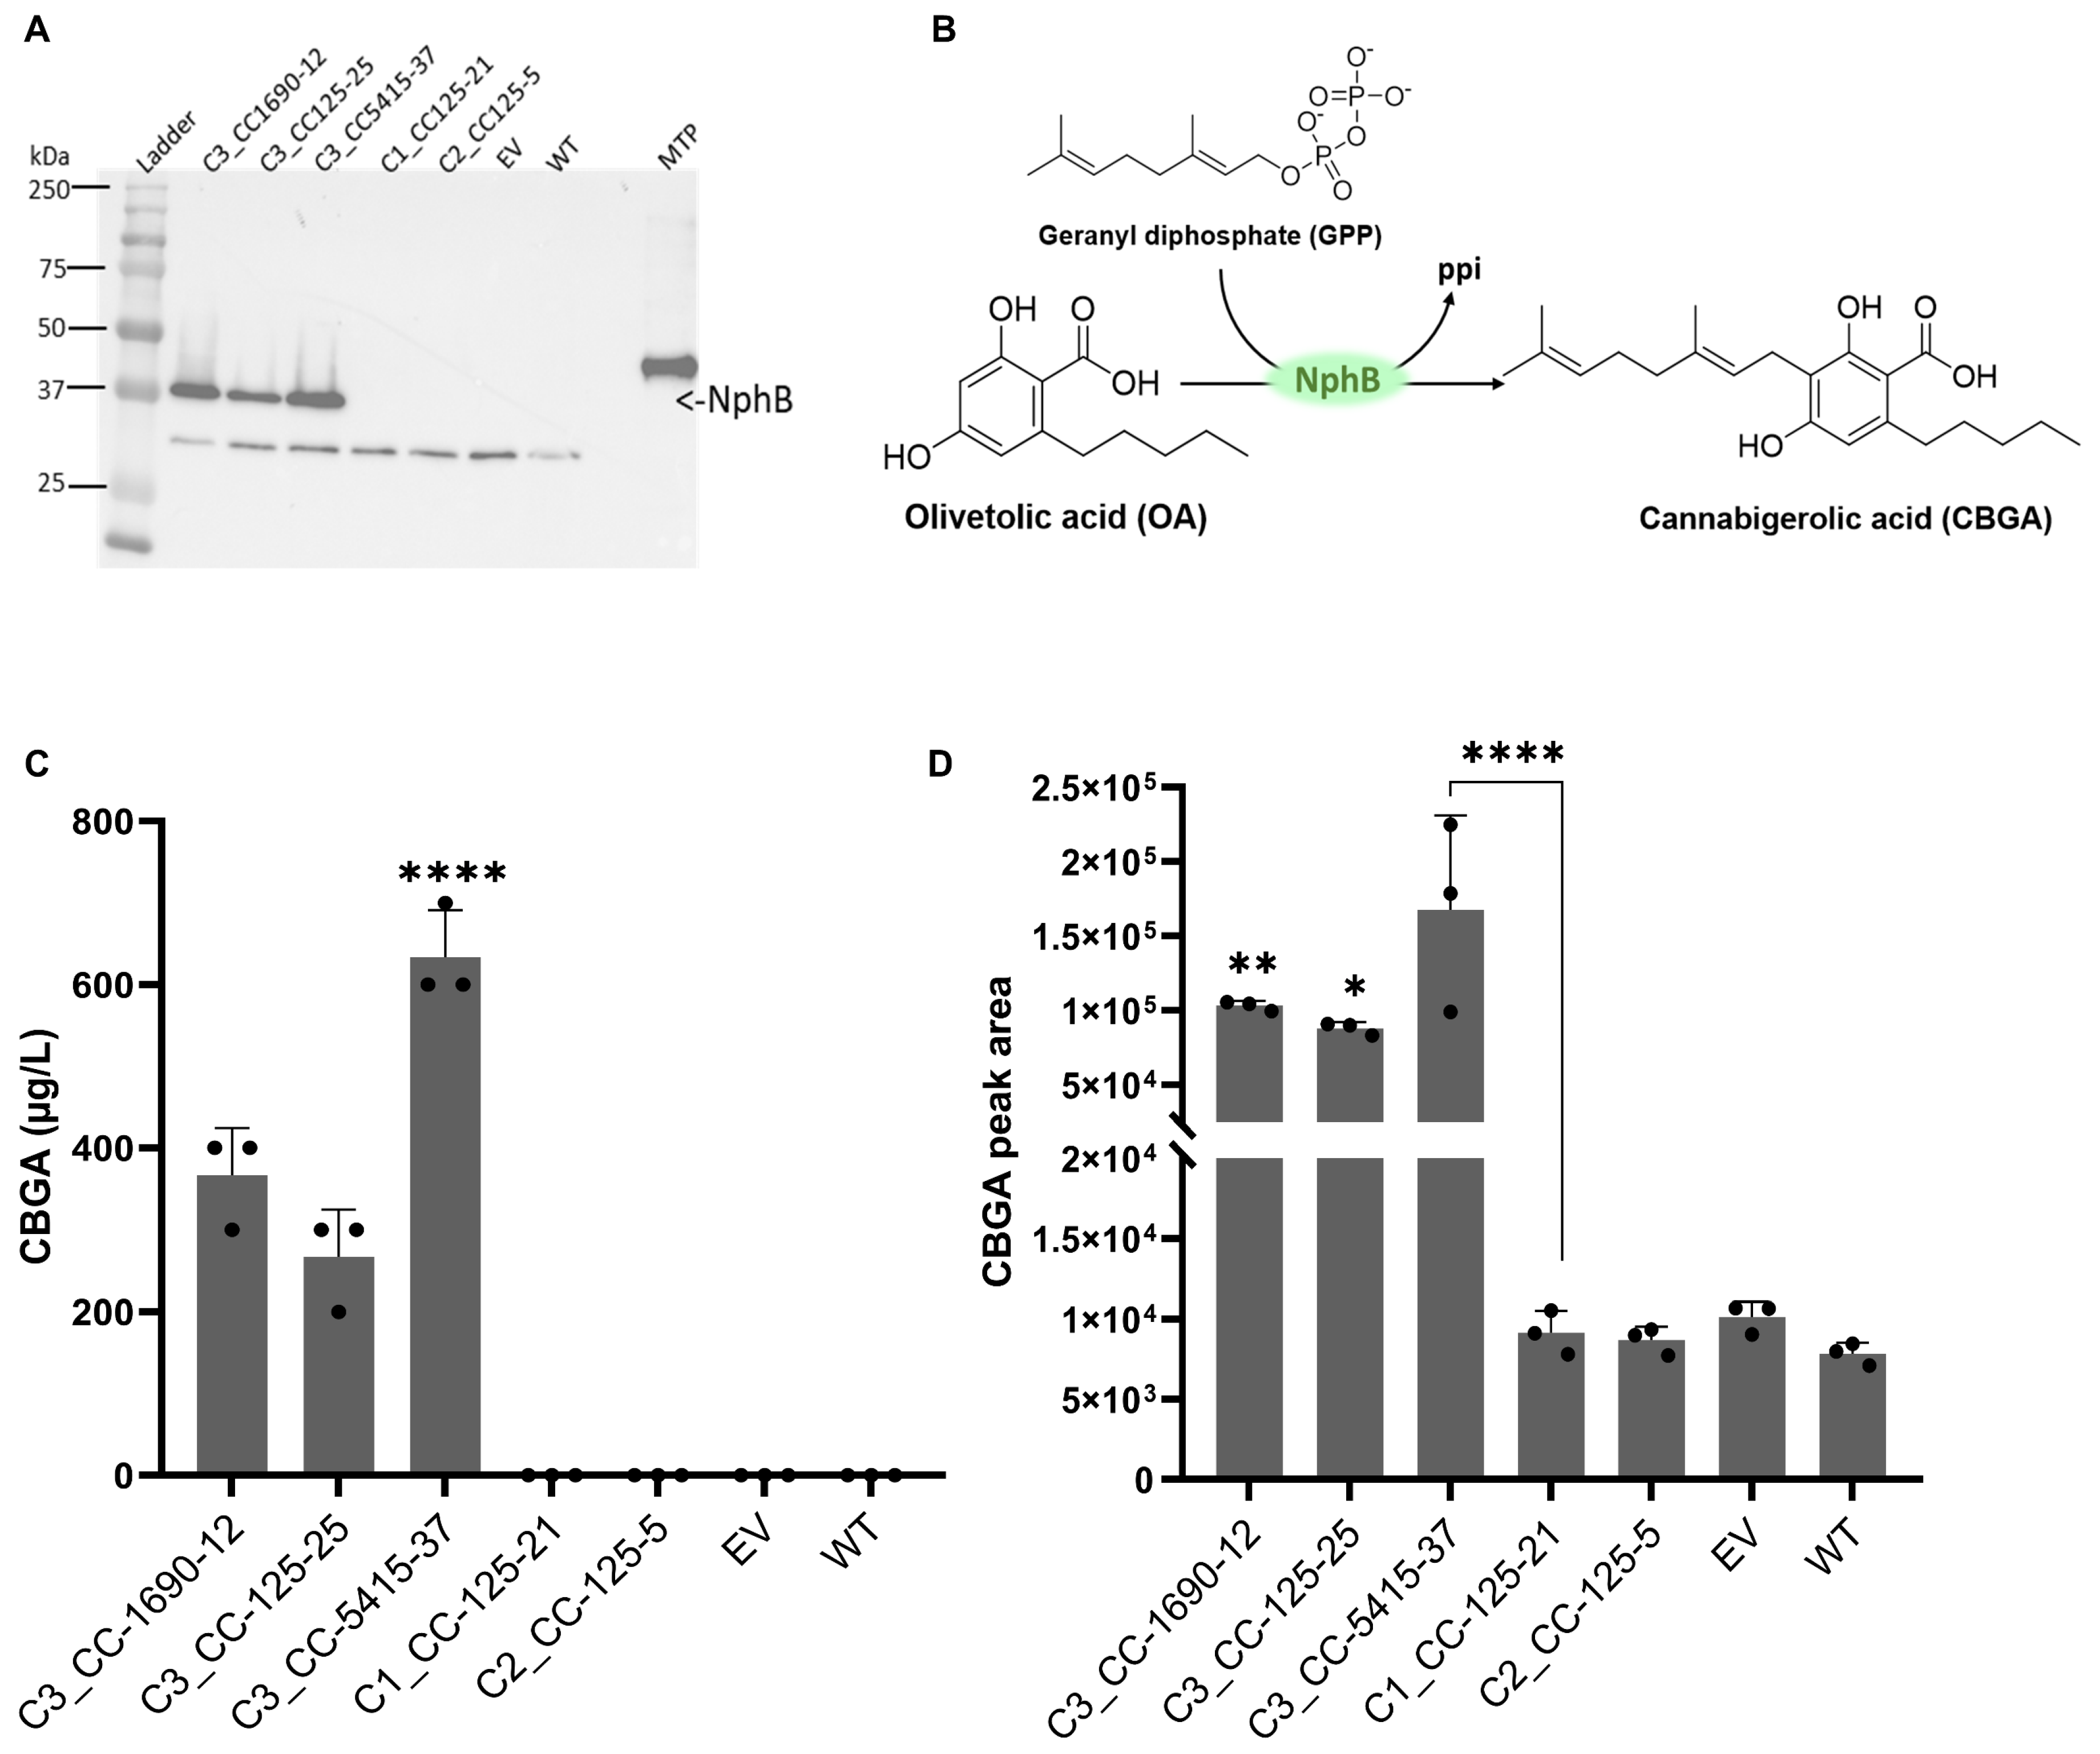
From the pool of active transformants, three clones (clone 12 from CC-1690, clone 25 from CC-125, and clone 37 from CC-5415) were selected for detailed quantitative analysis, as they represent the upper range of enzymatic activity observed among independent transformants. This selection was intended to illustrate the maximal functional potential of NphB expression, while the overall screening results reflect the broader variability across the population. Western blot analysis confirmed NphB accumulation in these transformants (Figure 6; Appendix AFigure A10). Increasing substrate concentrations enhanced CBGA formation, yielding 267 ± 58 µg L−1, 367 ± 58 µg L−1, and 633 ± 58 µg L−1 for clones 25, 12, and 37, respectively (Figure 6C; Appendix ATable A2). Statistical analysis using one-way ANOVA, followed by Tukey’s post hoc test, confirmed that CBGA peak areas for the WB+ clones (12, 25, and 37) were significantly higher (p < 0.0001) than those from WB clones and negative controls (Figure 6D). These values represent estimates based on external calibration and are intended for relative comparison of enzymatic activity across transformants.
Together, these results demonstrate that NphB expressed in the nuclear genome of C. reinhardtii produces a catalytically active prenyltransferase capable of converting OA and GPP into CBGA in vitro.

3. Discussion

This study provides a biocatalytic assessment of cannabinoid-related enzyme functionality in the photosynthetic microalga C. reinhardtii. Our results demonstrate that the bacterial aromatic prenyltransferase NphB can be heterologously expressed in the nuclear genome of C. reinhardtii, producing an active enzyme capable of catalyzing the formation of CBGA in vitro. In contrast, the plant-derived oxidocyclase CBDAS did not accumulate as a detectable protein or exhibit enzymatic activity under the tested conditions, highlighting challenges associated with expressing complex plant enzymes in this photosynthetic host.
Initial validation experiments in E. coli confirmed that the codon-optimized NphB sequence [39] encoded a functional enzyme capable of producing CBGA from OA and GPP. In contrast, although CBDAS from C. sativa [59] accumulated when expressed as a fusion protein, no CBDA formation was detected in vitro, suggesting that the enzyme was inactive in this prokaryotic system [16,64,65]. These results are consistent with previous reports indicating that cannabinoid oxidocyclases require appropriate folding environments, post-translational modifications, and potentially compartmentalized localization to achieve catalytic activity [21,31,66,67,68].
The inefficient cleavage of the NphB–2A–CBDAS fusion observed highlights an important design limitation associated with the use of 2A peptides for co-expression of heterologous enzymes. The FMDV 2A peptide mediates ribosomal skipping during translation; however, its efficiency can vary depending on the host system, protein context, and sequence composition. In this study, the predominance of the uncleaved fusion protein likely resulted in a covalently linked NphB–CBDAS polypeptide, which may impair proper folding, structural independence, and enzymatic activity of CBDAS. Given that cannabinoid oxidocyclases such as CBDAS require precise folding and cofactor interactions for activity, incomplete 2A cleavage may have significantly contributed to the lack of detectable CBDAS function. This limitation may extend to C. reinhardtii, where similar translational constraints could further reduce cleavage efficiency. Future strategies using independent expression cassettes, alternative 2A variants, or internal ribosome entry sites may improve co-expression and functional assembly of multi-enzyme pathways in microalgal systems.
In C. reinhardtii, the expression of heterologous genes is often constrained by transcriptional silencing, mRNA processing inefficiencies, and positional effects associated with nuclear integration [50,52,55]. Our experiments using bicistronic and monocistronic constructs driven by the HSP70A–RBCS2 promoter produced detectable transcripts but did not result in measurable protein accumulation. In contrast, removing the C-terminal tag and replacing this regulatory configuration with the PSAD promoter and terminator enabled consistent accumulation of the NphB protein across several transformants and genetic backgrounds. Western blot analyses revealed the presence of non-specific bands across samples, which is consistent with previous reports using total soluble protein extracts in Chlamydomonas. Such background signals may arise from antibody cross-reactivity or protein degradation during extraction. Nevertheless, the detection of a protein band at the expected molecular weight exclusively in transformed lines, and not in controls, supports the successful expression of NphB under PSAD promoter regulation. Future work could improve detection specificity by employing affinity purification strategies, alternative tagging systems, or optimized extraction protocols to reduce background interference. Promoter selection also emerged as a critical determinant of successful protein production [69,70,71]. While the HSP70A–RBCS2 promoter supported transcription of the target genes, it did not yield detectable protein accumulation under our experimental conditions. In contrast, the PSAD promoter and terminator combination enabled robust expression of NphB across multiple transformants and strain backgrounds. These observations are consistent with previous studies demonstrating that promoter architecture, terminator strength, and chromatin context can strongly influence transgene expression in C. reinhardtii [49,50,52,70,72,73,74]. These results highlight the importance of promoter selection, regulatory context and trying various genetic constructs when designing nuclear transgene expression systems in C. reinhardtii [63,75,76].
Despite successful protein accumulation, CBGA production was only detected in vitro using soluble protein extracts and was not observed in vivo following OA supplementation. This likely reflects limitations in precursor availability and intracellular compartmentalization. Similar constraints have been reported in other microalgal systems engineered for cannabinoid biosynthesis, including P. tricornutum [22,23]. In C. reinhardtii, GPP is primarily produced in plastids through the methylerythritol phosphate (MEP) pathway, while the heterologously expressed NphB enzyme was localized in the cytosol. Limited availability of cytosolic GPP or inefficient transport of exogenous OA may therefore restrict CBGA formation in vivo. Future metabolic engineering strategies such as overexpression of genes in the MEP pathway (e.g., DXS, DXR, HDR), suppression of native GPP-consuming pathways (e.g., competing terpene synthases), or employing synthetic scaffolds to enhance substrate channeling [17,57,77,78,79] could address these limitations by increasing precursor supply, enhancing substrate transport, or modifying enzyme localization to improve metabolic coupling. In addition, varying culture conditions during OA and GPP supplementation, including light intensity, nutrient levels, duration, and timing, may improve precursor assimilation and enzymatic conversion, offering a practical route to in vivo CBGA production [22,80].
The absence of detectable CBDAS protein in C. reinhardtii further underscores the complexity of expressing plant oxidocyclases in heterologous hosts. These flavin-dependent enzymes often require specific folding environment and subcellular targeting for activity [3,81]. Previous studies have shown that successful expression of cannabinoid synthases frequently relies on targeting to secretory pathways [21,31,66,67,68,82]. Similar strategies may therefore be required to achieve functional CBDAS expression and functionality in C. reinhardtii.
Another factor potentially limiting heterologous protein expression is mRNA maturation [55]. Nuclear transgenes in C. reinhardtii frequently require introns to ensure efficient transcript processing and export [50,53,83,84]. The constructs used in this study contained intronless coding sequences, which may have reduced transcript stability or translation efficiency [53,54,85]. In particular, CBDAS transcripts may have been transcribed but failed to be exported or translated due to processing errors. Cryptic splice sites introduced during codon optimization or weak 3′UTR sequences may have contributed to aberrant mRNA forms or destabilization [49,50,70,78]. These possibilities highlight the potential importance of intron incorporation [53,78,86], validated terminators [50,70], and transcript-stabilizing elements in future construct designs may represent an important optimization strategy for future pathway engineering efforts.
Strain background also influenced transformation efficiency and protein accumulation frequencies. NphB expression was detected in all three tested C. reinhardtii wild-type strains (CC-125, CC-1690, and CC-5415), although expression efficiencies varied between strains. It is important to note that transcript analyses in this study were performed using technical replicates only, which limits the ability to draw statistically robust conclusions regarding biological variability. However, given the large number of independent transformants analyzed, the observed variability in transcript accumulation likely reflects genuine positional and regulatory effects associated with nuclear transgene integration in C. reinhardtii. This variability likely reflects differences in genomic integration patterns, chromatin environment, and endogenous regulatory mechanisms affecting transgene expression [53,54,55,84,87,88]. Such strain-dependent effects highlight the importance of host selection when developing algal expression systems.
Although CBGA production was quantified using external calibration curves, the analytical method was not fully validated in terms of recovery, linearity across all concentration ranges, or sensitivity parameters such as LOD and LOQ. As a result, the reported values should be considered semi-quantitative. However, the consistency of CBGA detection across independent transformants and its confirmation by HPLC-MS/MS support the reliability of the observed trends in enzymatic activity.
Taken together, our findings demonstrate that C. reinhardtii can support the heterologous production of a catalytically active aromatic prenyltransferase involved in cannabinoid biosynthesis. However, the inability to achieve detectable in vivo CBGA accumulation and the absence of functional CBDAS expression reveal several challenges that must be addressed before complete pathway reconstruction can be achieved in this organism. Improving precursor availability, optimizing enzyme localization, enhancing mRNA processing through intron incorporation, and refining promoter and terminator combinations will likely be necessary steps toward establishing efficient cannabinoid biosynthesis in microalgal systems.
Based on our findings, a conceptual model can be proposed to explain the limitations of cannabinoid biosynthesis in C. reinhardtii. While the heterologous expression of the bacterial prenyltransferase NphB can yield an active enzyme, several key bottlenecks appear to restrict in vivo CBGA production. These include (i) limited availability of cytosolic precursors such as GPP and inefficient uptake or intracellular distribution of exogenous olivetolic acid, (ii) spatial mismatch between enzyme localization and precursor biosynthesis pathways, and (iii) competition with endogenous metabolic processes. In addition, the failure to detect CBDAS protein highlights challenges related to folding, cofactor dependency, and subcellular targeting of complex plant oxidocyclases. Together, these constraints illustrate the need for coordinated optimization of precursor supply, enzyme localization, and expression architecture to enable efficient cannabinoid biosynthesis in photosynthetic hosts.
Beyond cannabinoid biosynthesis, these results provide broader insights into the opportunities and limitations of using photosynthetic microalgae as biocatalytic platforms for complex plant metabolic pathways. Compared with heterotrophic hosts such as E. coli and yeast, microalgae offer unique advantages, including light-driven metabolism, CO2 fixation, and plant-like protein processing machinery [14,47,71,81]. Continued advances in synthetic biology tools, including modular pathway assembly, CRISPR-based genome editing, and improved nuclear expression systems, may further enhance the potential of C. reinhardtii as a sustainable platform for the production of valuable natural products.

4. Materials and Methods

4.1. Cultivation Conditions of Microalgal and Bacterial Strains

Wild-type C. reinhardtii strains CC-125 (mt+,137c), CC-1690 (mt+, Sager 21 gr), CC-5415 (nit1 agg1 mt+, Witman g1), and the expression strains UVM4 and UVM 11, were used in this study.
Strains CC-125 and CC-1690 were obtained from the Chlamydomonas Resource Center (The University of Minnesota, Minneapolis–Saint Paul, MN, USA). UVM4 and UVM11 were provided by Prof. Ralph Bock (Max Planck Institute of Molecular Plant Physiology, Potsdam-Golm, Germany), and strain CC-5415 was kindly provided by Prof. Martin Jonikas (Jonikas Lab, Princeton University, Princeton, NJ, USA). The microalgal strains were maintained under photo-mixotrophic conditions on Tris-acetate-phosphate (TAP) agar plates [89,90,91] or in a liquid TAP medium. Liquid cultures were grown in 125 mL flasks on a rotary shaker (120 rpm) under white fluorescent light (50–90 µE m−2 s−1) with a 16 h light/8 h dark cycle at 25 ± 0.5 °C.
The bacterial strains E. coli DH5α (Invitrogen, Carlsbad, CA, USA) and E. coli TOP10 (Thermo Fisher Scientific, Waltham, MA, USA) were used to propagate plasmids, while E. coli Rosetta BL21 (DE3) pLysS (Novagen®, Madison, WI, USA) was used for recombinant protein expression. Bacteria were cultured in Luria-Bertani (LB) medium supplemented with appropriate antibiotics (100 mg/L ampicillin, 35 mg/L chloramphenicol) at 37 °C under shaking at 200 rpm for liquid culture.

4.2. PCR Amplification, Cloning, and Expression Vector Construction

The plasmids pOpt_mRuby2_aphVII, containing the aminoglycoside 3′-phosphotransferase gene VII (aphVII) for hygromycin B resistance [62] and pSL18_aphVIII, carrying the aminoglycoside 3′-phosphotransferase gene VIII (aphVIII) for paromomycin resistance [63], were obtained from the Chlamydomonas Resource Center. These plasmids were used as backbones for transgene integration into the C. reinhardtii nuclear genome. The plasmid pMAL-c2x (New England Biolabs, Ipswich, MA, USA) was used for the recombinant protein expression in E. coli [60,62,63].
The coding sequences of NphB (NphBG286S/Y288A) [39], extended Foot-and-Mouth Disease Virus 2A peptide (2A) [60], and CBDAS [59] were codon-optimized for C. reinhardtii nuclear expression and synthesized (Bio Basic, Markham, ON, Canada).
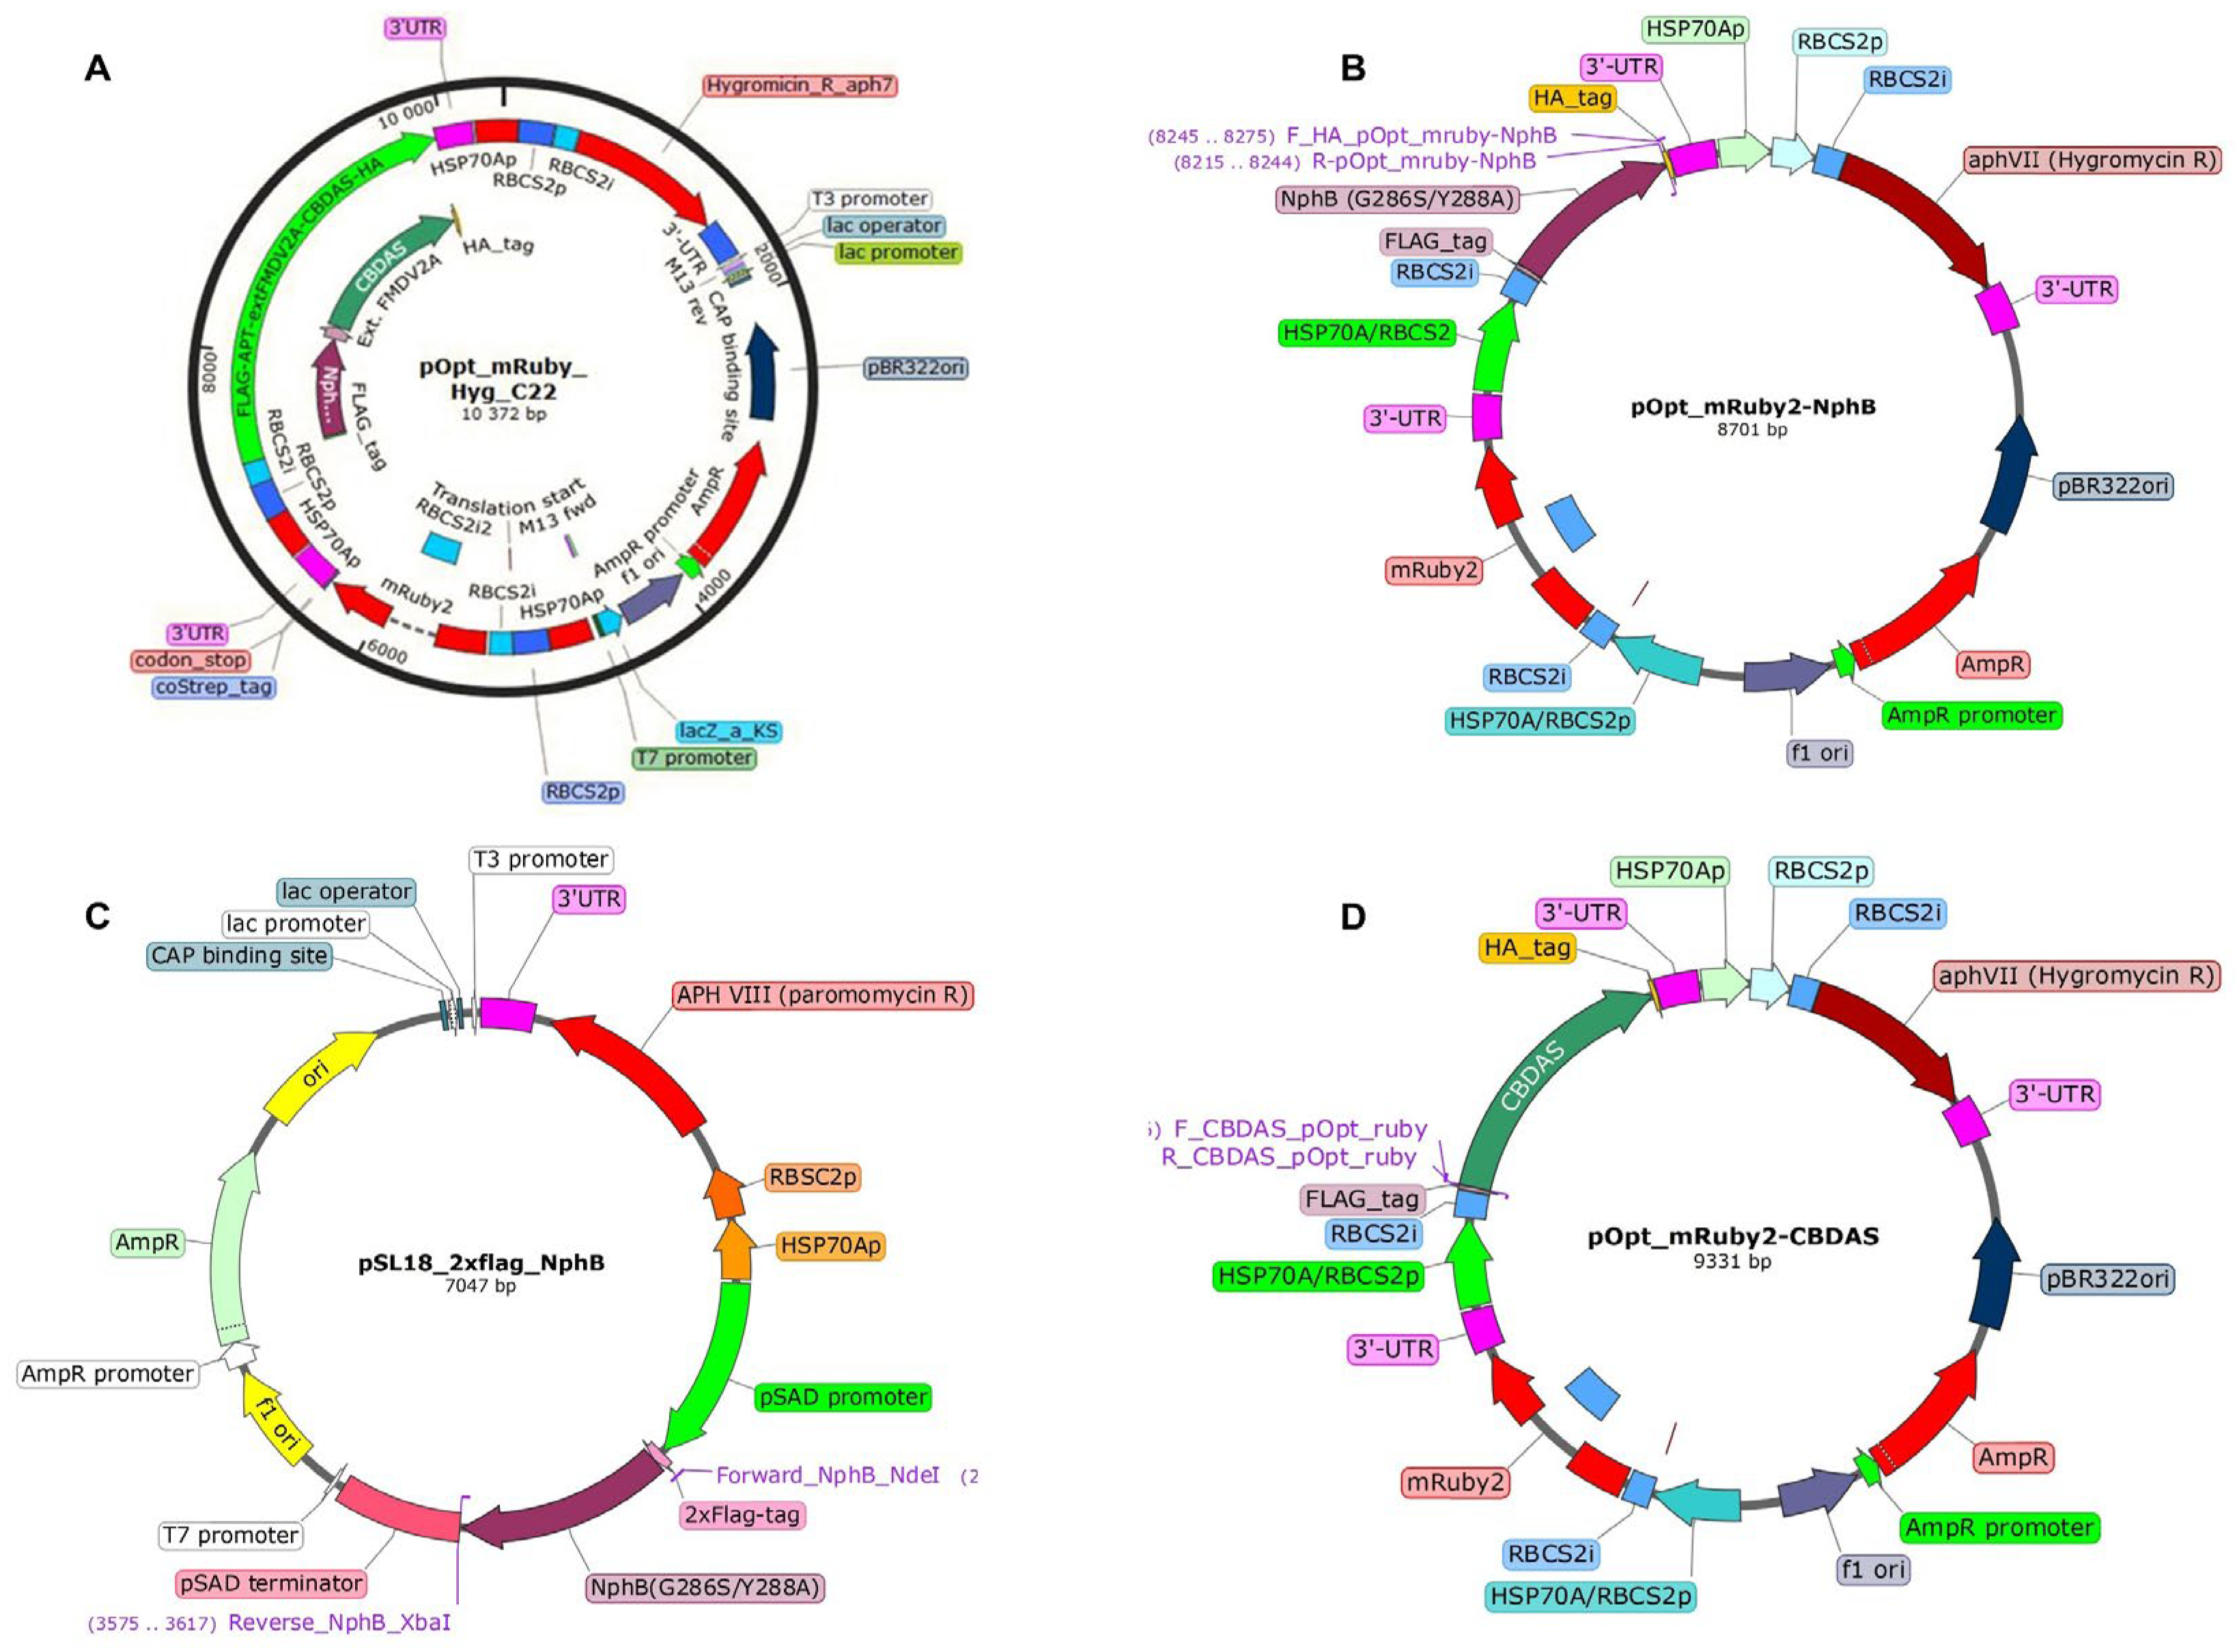
Transgene insertion into the pOpt_mRuby2_aphVII vector backbone was performed using Gibson assembly with the NEBuilder® HiFi DNA Assembly kit (New England Biolabs, Ipswich, MA, USA), following the manufacturer’s instructions. The required DNA fragments were amplified using Q5 High-Fidelity DNA Polymerase (NEB) and assembled under the control of the HSP70A-RBCS2 fusion promoter (ARp) and the RBCS2 terminator. This resulted in the recombinant expression vector pOpt_mRuby2_NphB-2A-CBDAS (Appendix AFigure A11), hereafter referred to as construction 1 (C1).
To generate the recombinant vectors pOpt_mRuby2-NphB (construction 2, C2; Appendix AFigure A11) and pOpt_mRuby2-CBDAS (Construction 4, C4; Appendix AFigure A11), the NphB and CBDAS coding sequences were amplified from C1 using primers specific to the vector backbone. The amplified fragments were gel-purified using the GenepHlow™ Gel/PCR Kit (Geneaid, New Taipei City, Taïwan) and ligated using the NEB Kinase, Ligase, and DpnI (KLD) enzyme mix, following the manufacturer’s protocol.
A restriction enzyme-based cloning strategy generated additional recombinant vectors: pSL18-NphB (construction 3, C3), pMAL-c2x-NphB, and pMAL-c2x-NphB-2A-CBDAS.
For expression in C. reinhardtii, the NphB coding sequence was cloned into the pSL18 backbone under the control of the PSAD promoter and terminator (Appendix AFigure A11). The NphB gene was PCR-amplified from C1 using primers designed to introduce NdeI/XbaI restriction sites at the 5′ and 3′ ends, respectively (Appendix ATable A3 and Table A4). The PCR product was gel-purified, digested with the corresponding restriction enzymes, and ligated into pre-digested pSL18 using T4 DNA ligase (NEB), following the manufacturer’s protocol.
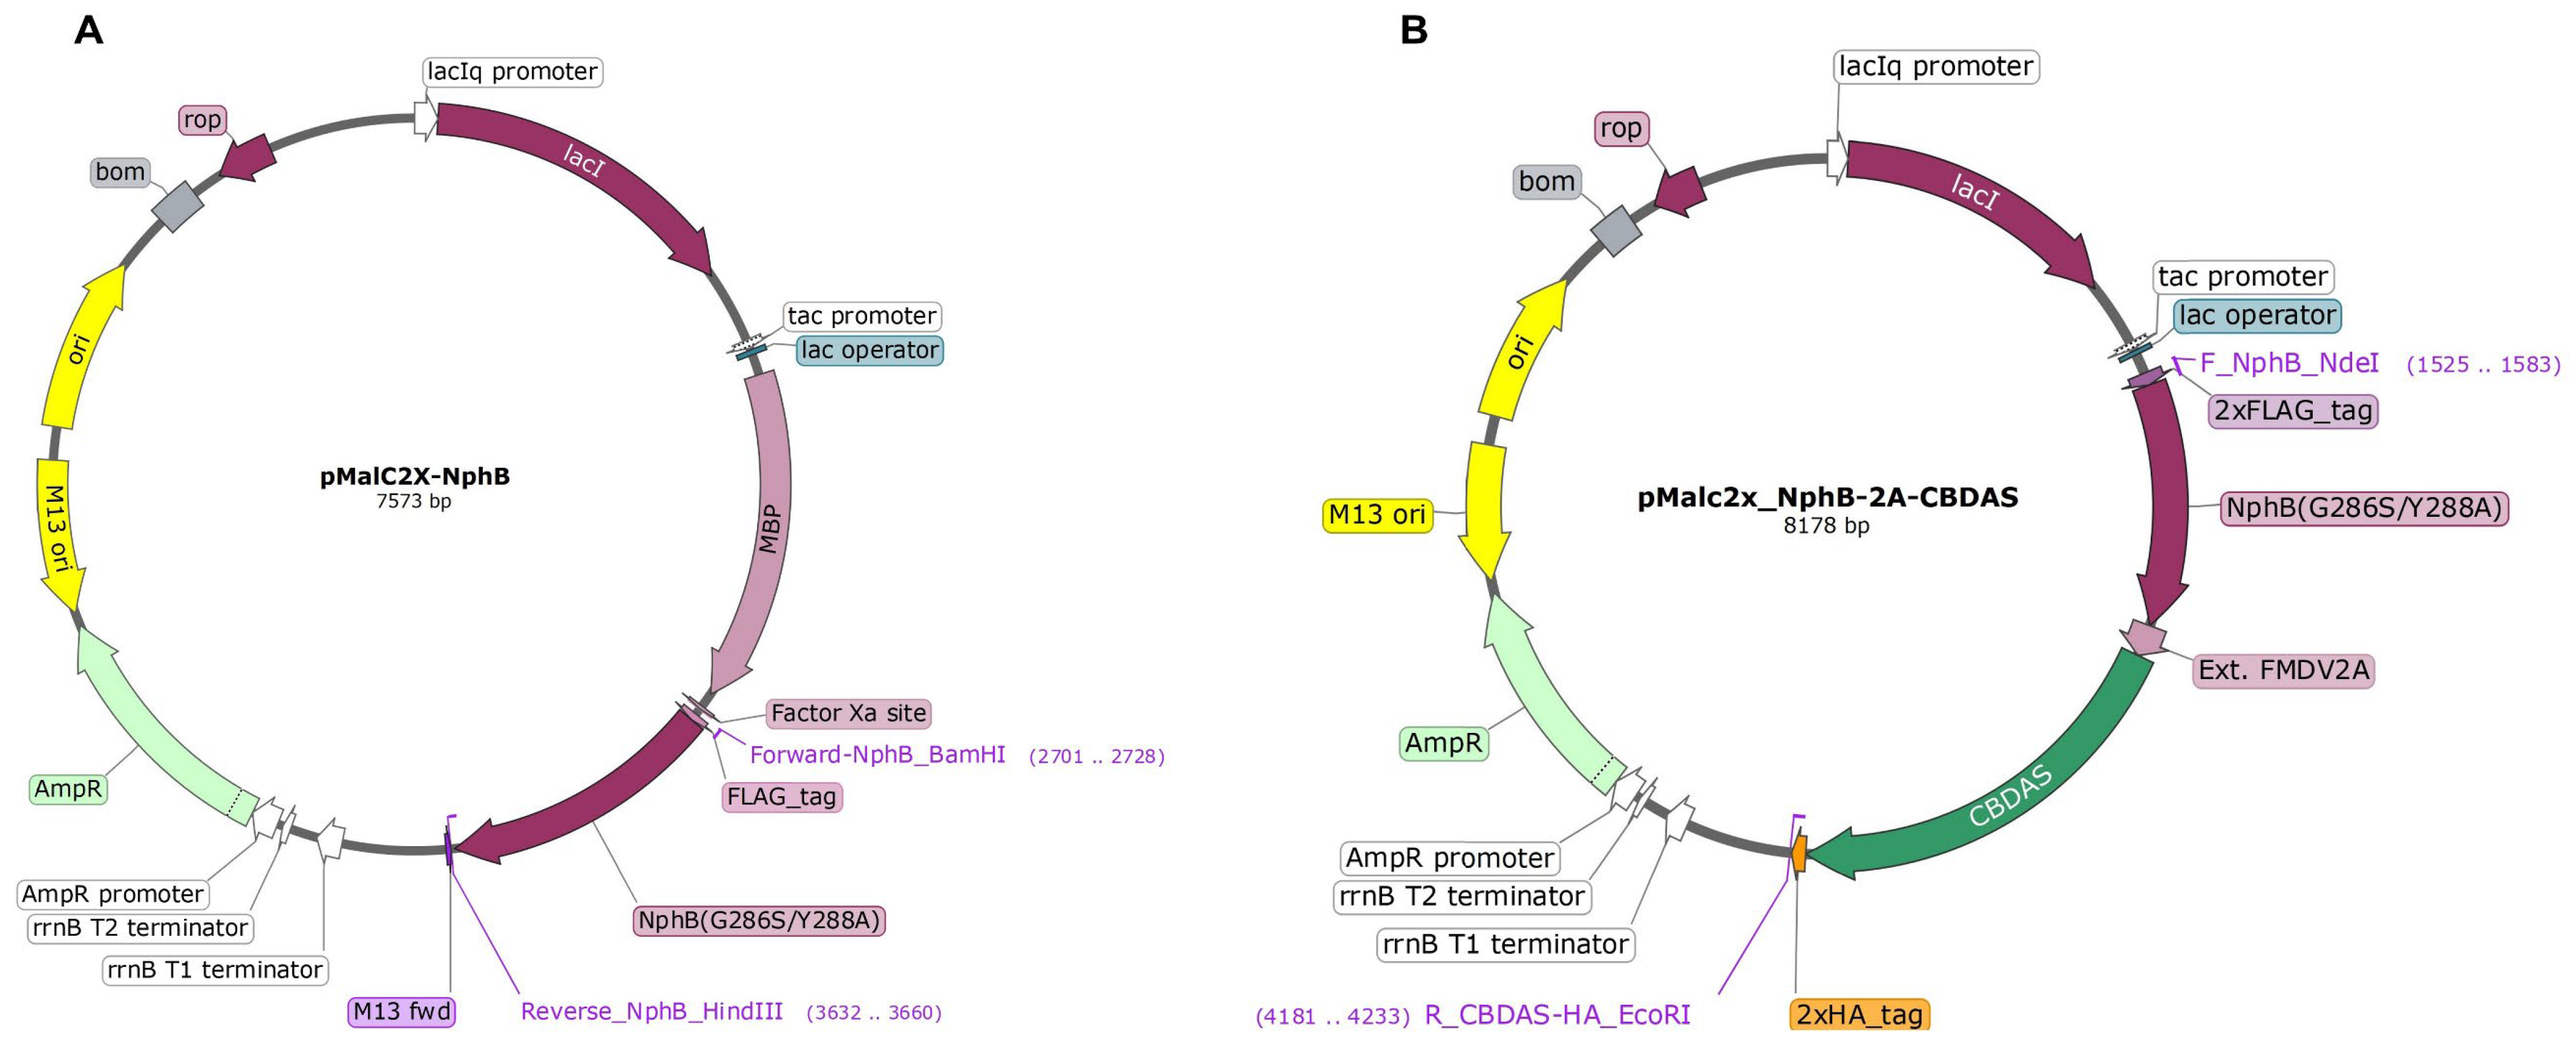
For expression in E. coli, the NphB and NphB-2A-CBDAS sequences were cloned into the pMAL-c2x vector under the control of the tac promoter (Appendix AFigure A12). NphB was fused to the C-terminus of the maltose-binding protein (MBP) tag, while NphB-2A-CBDAS was inserted downstream of the lac operator, without an MBP fusion. The MBP tag enhances recombinant protein’s expression, stability, and solubility and facilitates purification [92,93]. Coding sequences were amplified from C1 using primers incorporating BamHI/HindIII sites (for MBP-NphB fusion) or NdeI/EcoRI (for NphB-2A-CBDAS). PCR products were gel-extracted, digested, purified, and ligated into the appropriately pre-digested pMAL-c2x vector using T4 DNA ligase (NEB).
Table A3 provides a complete list of primers, with introduced restriction sites indicated in bold and underlined.

4.3. Transgene Expression in the Prokaryotic System, Screening, and Protein Production

Recombinant expression vectors were transformed into chemically competent E. coli cells for plasmid propagation. E. coli TOP10 was used for C1 after Gibson assembly, while E. coli DH5α was used for C2 and C3 following ligation-based cloning. Transformation was performed using the heat shock method according to the manufacturer’s protocol. Transformed cells were plated on LB agar supplemented with 100 mg/L ampicillin and incubated at 37 °C for 16 h. To confirm successful plasmid integration, colony PCR was performed as described by [94]. The reaction was carried out in a 25 µL total volume using Taq DNA polymerase and ThermoPol buffer (NEB) under the following conditions: an initial denaturation at 95 °C for 5 min, followed by 30 cycles of 95 °C for 30 s, 54 °C for 1 min, and 68 °C for 1–3 min, with a final extension at 68 °C for 5 min and an infinite hold at 4 °C. The plasmids were verified via next-generation sequencing (NGS) at the Massachusetts Institute of Technology (MIT) to confirm sequence integrity.
For recombinant protein production, the purified pMAL-c2x-NphB and pMAL-c2x-NphB-2A-CBDAS vectors were extracted from E. coli DH5α and transformed into chemically competent E. coli Rosetta BL21 (DE3) pLysS using the heat shock transformation. Transformants were selected on LB agar plates containing 100 mg/L ampicillin and 35 mg/L chloramphenicol and incubated overnight at 37 °C. A single PCR-positive colony was picked and grown overnight at 37 °C in 12.5 mL LB broth containing antibiotics under shaking at 200 rpm. The overnight culture was inoculated into 250 mL fresh LB broth supplemented with antibiotics and grown at 37 °C, 200 rpm, until the OD600 reached 0.4–0.7. The cultures were then brought to room temperature before induction with 0.5 mM isopropyl-β-D-thiogalactopyranoside (IPTG). Induction was performed at 18 °C for 20 h with shaking at 150 rpm. Following induction, cells were harvested by centrifugation at 17,000× g and resuspended in the protein solubilization buffer (25 mM Tris HCl, pH 7.5; 150 mM NaCl; 1 mM EDTA, pH 8). Protein extraction was performed by sonication using a Fisherbrand™ Model 505 Sonic Dismembrator (Thermo Fisher Scientific) under the following conditions: total sonication time 8 min; amplitude 41%, pulse on 14 s; pulse off 35 s. Cell lysates were centrifuged at 20,000× g for 30 min at 4°C, and the supernatant containing the soluble protein fraction was collected and stored at −80 °C for further analysis.

4.4. Nuclear Transformation and Screening of the Microalga C. reinhardtii

The nuclear transformation of C. reinhardtii wild-type strains was performed by electroporation, following the protocol described by [52,95], with slight modifications. A total of 2 µg of gel-purified vectors, linearized using ScaI, or a combination of ScaI and KpnI, was used to transform the microalgae. Electroporation was carried out using the Bio-Rad Gene Pulser XcellTM system (Bio-Rad laboratories, Hercules, CA, USA) in a 4 mm cuvette under the following conditions: 0.5 kV, 50 µF, 800 Ω. For the UVM4 and UVM11 strains, nuclear transformation was carried out using the glass bead method as described by Kindle [96]. In this case, 2 µg of gel-purified ScaI-linearized vector was mixed with 500 µL of C. reinhardtii cells resuspended in TAP medium supplemented with 5% polyethylene glycol (PEG). The suspension was vortexed for 15 s and spread onto selective TAP agar plates.
Transformants were selected on TAP-agar plates supplemented with appropriate antibiotic (hygromycin, 15 mg/L or paromomycin, 15 mg/L) and incubated for 5–7 days until single colonies appeared. Colony enumeration was performed using Open CFU software version 3.9.0 [97]. Randomly selected colonies were subcultured weekly on fresh TAP-agar plates containing antibiotics for five rounds to ensure stable genomic integration of the gene of interest. Subsequent screening was conducted using high-throughput colony PCR (HT-cPCR) as described by [95].
For the co-expression of C2 and C4 as independent open reading frames (ORFs), both constructs, carrying the same selection marker, were co-transformed in a single procedure. Specifically, 1 µg of gel-purified linearized vector from each construct was combined in a 4 mm cuvette containing wild-type C. reinhardtii cells, followed by electroporation and screening under the abovementioned conditions.
To verify the integrity of the gene sequences following genomic integration, PCR products from HT-cPCR-confirmed transformants were analyzed by Sanger sequencing at the Centre de Recherche CHU de Québec, Université Laval.
In this study, technical replicates refer to repeated measurements performed on the same biological sample, while biological replicates correspond to independent transformants or cultures. Unless otherwise specified, RT-qPCR analyses were performed using technical replicates only, whereas transformation, screening, and enzymatic activity assays involved multiple independent transformants representing biological variation.

4.5. DNA Extraction and Colony PCR in C. reinhardtii

Genomic DNA (gDNA) extraction for HT-cPCR was performed following the protocol described by [95]. Two microliters of gDNA were used for colony PCR, which was carried out using Taq DNA Polymerase with ThermoPol® Buffer (New England Biolabs, Ipswich, MA, USA) under the following conditions: an initial denaturation at 95 °C for 5 min, followed by 30 cycles of 95 °C for 30 s, 54 °C for 1 min, and 68 °C for 1–3 min, with a final extension at 68 °C for 5 min and an infinite hold at 4 °C. The primer sequences used are listed in Appendix ATable A3.
Before characterizing PCR-positive clones for transgene expression, an additional PCR targeting the gene of interest was performed on gDNA extracted from liquid cultures. This extraction followed the protocol described by [84], with slight modifications to assess transgene stability in clones grown for five days in a 25 mL TAP medium. Briefly, 2 mL of algal culture from day five was centrifuged at 17,000× g for 1 min. The resulting cell pellet was resuspended in 200 µL of extraction buffer (2% cetyltrimethylammonium bromide [CTAB], 100 mM Tris-HCl pH 8.0, 20 mM EDTA pH 8.0, 1.4 M NaCl, and 2% [v/v] freshly added β-mercaptoethanol) by vortexing. Next, 200 µL of chloroform/isoamyl alcohol (24:1) was added, and the mixture was incubated at 65 °C for 20 min with shaking at 1400 rpm. After centrifugation at 17,000× g for 10 min at 10 °C, the DNA-containing supernatant was carefully collected by tilting the tube at a 45° angle to avoid contamination from the organic phase and transferred to a new microcentrifuge tube. The gDNA was precipitated by adding 0.7 volumes of isopropanol to the supernatant, followed by a 10 min incubation at room temperature and centrifugation at 17,000× g for 10 min at 4 °C. The pellet was then washed with 1 mL of 70% (v/v) ethanol, air-dried, and resuspended in 50 µL of DNase-free water supplemented with 1 µL of RNase A (10 mg/mL), followed by incubation at 37 °C for 15 min. The concentration and purity of the extracted gDNA were assessed by measuring the OD260/280 ratio using a NanoPhotometer® N60/N50 (Implen, Munich, Germany).

4.6. Total RNA Extraction and Quantitative PCR

Total RNA was extracted from 5-day-old C. reinhardtii cultures using the TRIzol reagent (Invitrogen, Carlsbad, CA, USA). A 4 mL culture was collected and centrifuged at 12,000× g for 5 min, after which the cell pellet was resuspended in 500 µL of TRIzol. To enhance cell lysis, samples were flash-frozen in liquid nitrogen, incubated at room temperature for 10 min, and then extracted with 200 µL of chloroform. After centrifugation at 12,000× g for 10 min at 4 °C, the RNA-containing upper phase was carefully transferred to a fresh microcentrifuge tube. RNA was precipitated by adding 500 µL of isopropanol and 100 mM NaCl, incubating for 10 min at room temperature, and centrifuging at 12,000× g for 10 min at 4 °C. The RNA pellet was washed with 1 mL of 75% (v/v) ethanol, centrifuged at 7500× g for 5 min at 4 °C, air-dried, and resuspended in 50 µL of nuclease-free water. Residual genomic DNA was removed using Turbo DNase (Invitrogen TURBO DNA-free Kit, Thermo Fisher Scientific) following the manufacturer’s instructions. The RNA concentration and purity were assessed by measuring the OD260/280 ratio using a NanoPhotometer® N60/N50 (Implen, Munich, Germany).
For quantitative reverse transcription PCR (RT-qPCR), 250 ng of total RNA was subjected to reverse transcription and qPCR amplification in a single reaction using the Luna Universal One-step RT-qPCR Kit (NEB). Reverse transcription was performed at 55 °C for 10 min, followed by an initial denaturation at 95 °C for 1 min. qPCR cycling conditions included 45 cycles of 95 °C for 10 s (denaturation) and 60 °C for 30 s (extension). A melt curve analysis was conducted from 60 °C to 95 °C, with an increment of 0.5 °C every 5 s. Primers for NphB and CBDAS transcripts were designed using the PrimerQuestTM Tool (IDT), while reference gene primers (histone 3 and phosphoglycerate kinase [PGK]) were obtained from [52] (Table A4). Histone H3 was used as the reference gene for normalization based on its reported stable expression across various growth and experimental conditions in C. reinhardtii. While reference gene stability was not independently validated under all experimental conditions in this study, histone H3 has been widely used as a normalization control in previous Chlamydomonas transcript analyses integration [52]. Therefore, normalization was applied to enable relative comparison of transgene expression levels across transformants. SYBR Green fluorescence was recorded in the FAM channel of a CFX connect Real-Time System (Bio-Rad laboratories, Hercules, CA, USA), and amplification products were analyzed using Bio-Rad CFX Manager version 3.1. Relative transgene expression levels were determined using the 2−ΔΔCt method [98]. RT-qPCR analyses were performed using technical replicates (replicate number, n = 2) for each selected transformant. Given the large number of independent clones screened, transcript measurements were used as a qualitative assessment of relative expression levels across transformants rather than for statistical comparison between biological conditions. Representative clones were selected to capture the observed variability in transgene expression.

4.7. Total Protein Extraction and Western Blot Analysis

Total protein extraction was performed by sonication as described by [22], with minor modifications. Briefly, C. reinhardtii culture (19 mL) grown for five days were harvested by centrifugation at 3500× g for 15 min at 4 °C. the resulting cell pellets were resuspended in 500 µL of solubilization buffer (51.4 mM Tris-HCl pH 8; 0.75 mM sodium dodecyl sulfate [SDS]; 10% (v/v) glycerol; 0.02 mM EDTA; 10 mM phenylmethylsulfonyl fluoride [PMSF]; and 2 µL of protease inhibitor cocktail [Sigma-Aldrich, Saint-Louis, MO, USA]) by gentle pipetting. Cells were lysed by sonication using a Fisherbrand™ Model 505 Sonic Dismembrator (Thermo Fisher Scientific, Waltham, MA, USA) for six cycles of 3 min at 35% amplitude, with 30 s pulses on and off. Lysates were centrifuged at 17,000× g for 30 min at 4 °C, and the supernatants, containing the total soluble protein fraction, were flash-frozen in liquid nitrogen and stored at −80 °C for subsequent Western blot analysis and in vitro enzymatic assays. Protein concentrations were determined using the RC DC™ Protein Assay Kit I (Bio-Rad), with bovine serum albumin (BSA) as a standard.
For Western blot analysis, 100 µg of total protein was resolved on a 12% (v/v) SDS-PAGE gel at a constant voltage of 100 V for 3 h. Proteins were transferred onto a 0.2 µm polyvinylidene difluoride (PVDF) membrane using the Trans-Blot Turbo Transfer System (Bio-Rad). The membrane was equilibrated in Tris-buffered saline (TBS; 20 mM Tris, 150 mM NaCl, pH 7.6) for 10 min, followed by blocking in 5% (w/v) skim milk prepared in TBS containing 0.1% (v/v) Tween-20 (TBST) for 5 h at room temperature. The membrane was incubated overnight at 4 °C in TBST with 5% skim milk containing primary antibodies (1:1000 dilution), either mouse anti-FLAG monoclonal antibody (Millipore Sigma, Carlsbad, CA, USA) or mouse anti-HA-tag monoclonal antibody (GenScript, Piscataway, NJ, USA). After primary antibody incubation, the membrane was washed three times (10 min each) in TBST and subsequently incubated for 1 h at room temperature in TBST containing 5% skim milk and goat anti-mouse horseradish peroxidase (GAM-HRP) conjugate (1:20,000 dilution). The membrane was washed twice in TBST, and protein detection was performed using Clarity Max Western ECL Substrate (Bio-Rad). Following chemiluminescence detection, the membrane was washed twice in TBST and stained with 0.5% (w/v) Ponceau S solution (0.5% [w/v] Ponceau S in 1% [v/v] acetic acid) for 1 min to assess protein transfer efficiency. Chemiluminescence signals and Ponceau S-stained blots were visualized using the ChemiDoc Imaging System (Bio-Rad) and analyzed with Image Lab software version 3.0.1 (Bio-Rad). The molecular weight of detected proteins was confirmed using the Precision Plus Protein Dual Color Standards (Bio-Rad).

4.8. Enzymatic Assays and CBGA Detection

In vitro enzymatic assays were conducted using three biological replicates in a total reaction volume of 100 µL, following the protocol of [22]. Enzymatic assays were performed using total soluble protein extracts as an initial screening approach to evaluate NphB activity in C. reinhardtii. Substrate concentrations, incubation time, and protein input were selected based on previously reported conditions for NphB activity and adapted to account for the use of crude algal extracts. Although purified enzyme systems provide more controlled conditions, the use of crude extracts enables rapid functional assessment of multiple transformants and reflects enzyme activity within a complex cellular protein environment. Specifically, 1 mg of soluble total protein extract was added to the reaction buffer (100 mM HEPES, pH 7.5; 25 mM MgCl2; 2 mM OA; and 2 mM GPP) and incubated at 30 °C for 16 h. Proteins were precipitated with 2% (v/v) trichloroacetic acid to terminate the reaction, and metabolites were extracted using 300 µL of HPLC-grade methanol. The extracts were filtered through 0.22 µm nylon filters, dried using a Savant SPD1010 SpeedVac concentrator (Thermo Scientific), and reconstituted in 100 µL of HPLC-grade methanol. Samples were then diluted 10-fold in the mobile phase (0.1% (v/v) formic acid in Milli-Q water/0.1% (v/v) formic acid in methanol, 30:70) and analyzed by high-performance liquid chromatography coupled with tandem mass spectrometry (HPLC-MS/MS).

4.9. Olivetolic Acid Supplementation and Metabolite Extraction

C. reinhardtii cells grown for five days in 25 mL of TAP media were supplemented with 2 mM of olivetolic acid (OA). The culture was incubated for 24 h. Cells were harvested by centrifugation at 3500× g for 10 min at 4 °C. The supernatant was discarded, and the conical tubes were inverted to dry. Metabolites were extracted using methanol at a ratio of 1 mL per 100 mg of fresh biomass. Samples were vortexed for 30 s and incubated overnight at −20 °C. The extract (supernatant) was separated from the pellet by centrifugation at 3500× g for 10 min at 4 °C, followed by sample filtration through 0.22 µm nylon syringe filters. Filtered samples were stored at −20 °C for metabolite analysis.

4.10. HPLC-DAD and HPLC-MS/MS Analysis

To perform the detection of the metabolite by high-performance liquid chromatography (HPLC) with diode-array detection (DAD) and coupled with tandem mass spectrometry (MS/MS), the following cannabinoids and precursors were used as standards: olivetolic acid (OA, CAS 491–72-5) and olivetol (OL, CAS 500–66-3) were purchased from Santa Cruz biotechnologies (Dallas, TX, USA). Δ9-tetrahydrocannabinol (THC, CAS 1972-08-3), cannabidiol (CBD, CAS 13956–29-1), cannabinol (CBN, CAS 521–35-7), Δ9-tetrahydrocannabinolic acid (THCA, CAS 23978–85-0), cannabidiolic acid (CBDA, CAS 1244-58-2), cannabigerolic acid (CBGA, CAS 25555–57-1), cannabichromene (CBC, CAS 20675–51-8), cannabigerol (CBG, CAS 25654–31-3), tetrahydrocannabivarin (THCV, CAS 31262–37-0) and cannabidivarin (CBDV, CAS 24274–48-4) were purchased from Agilent Technologies (Mississauga, ON, Canada). Cannabinolic acid (CBNA, CAS 2808-39-1) was purchased from Sigma-Aldrich (Oakville, ON, Canada).
Initial analyses were performed using high-performance liquid chromatography with a diode array detector (HPLC-DAD). Chromatographic separation of analytes was achieved using an InfinityLab Poroshell 120 EC-C18 column (4.6 × 100 mm, 2.7 mm; Agilent Technologies, Mississauga, ON, Canada) maintained at 30 °C. A 10 µL sample was injected into the analytical system. The mobile phase consisted of: (A) 30% of 0.1% (v/v) formic acid in Milli-Q water and (B) 70% of 0.1% (v/v) formic acid in methanol was used. The flow rate was set to 1 mL/min, and the HPLC gradient program was as follows: 0 min, 70% B; 1.0 min, 70% B; 6.0 min, 77% B; 15.0 min, 90% B; 15.1 min, 70% B and 18.0 min, 70% B. Each run lasted 18.5 min, including column reconditioning before the next injection. The diode array detector was set to acquire the wavelength range of 190 to 400 nm using a deuterium (D2) lamp, with UV detection at 220 nm. Compounds were identified by comparing retention time and maximum absorption wavelengths to those of reference standards (Appendix ATable A5). Calibration curves were generated using CBGA standard solutions (10 mg/L and 100 mg/L in HPLC-grade methanol). These stock solutions were serially diluted to obtain calibration standards at 0.5, 1, 2, 4, 5, 10, 25, 50, and 100 mg/L, each analyzed in triplicate. The standards were injected into the HPLC-DAD system, and calibration curves were constructed by plotting the area under the curve (AUC) against analyte concentration. The resulting linear regression equations were used to quantify OA (y = 52,762x + 29,254; R2 = 0.9990), OL(y = 15,834x + 3,176.5; R2 = 0.9997), and CBGA (y = 38,493x + 758.22; R2 = 0.9999) in enzymatic and supplementation assays. Parameters such as recovery, limit of detection (LOD), and limit of quantification (LOQ) were not formally determined. Therefore, reported concentrations should be interpreted as semi-quantitative estimates suitable for comparative analysis between transformants.
Confirmatory analyses were conducted using HPLC-MS/MS (Agilent, Mississauga, ON Canada) equipped with an Agilent Jet Stream ionization source, a binary pump, an autosampler, and a column compartment. Compound separation was achieved using an InfinityLab Poroshell 120 EC-C18 column (4.6 × 100 mm, 2.7 mm). Five microliters of each sample were injected into the column set at 50 °C. A gradient method made of (A) 0.1% (v/v) formic acid in Milli-Q water and (B) 0.1% (v/v) formic acid in methanol with a flow rate of 0.5 mL/min was used to achieve chromatographic separation. The HPLC elution program was as follows: 0 min, 70% B; 7.0 min, 100% B; 10 min, 100% B; 12.0 min, 70% B. The total run time was 14 min per sample. The parameters used in the MS/MS source were set as follows: gas flow rate 8 L/min; gas temperature 220 °C; nebulizer 55 psi; sheath gas flow 12 L/min; sheat gas temperature 380 °C; capillary voltage 4500 V; and nozzle voltage 0 V. Agilent MassHunter Data Acquisition (version 1.2) and MassHunter Qualitative Analysis (version 10.0) software were used for data acquisition and processing, respectively. Sample analyses were conducted in triggered multiple reaction monitoring (tMRM) acquisition mode, allowing compound identification using authentic standards. MRM transitions and MS/MS parameters used for targeted compounds identification are provided in the Appendix ATable A6.
Retention times may vary between HPLC-DAD and HPLC-MS/MS systems due to differences in chromatographic conditions, and therefore compound identification was confirmed using both retention time relative to standards and mass spectrometric fragmentation patterns.

4.11. Statistical Analysis

Statistical analyses were performed using GraphPad Prism (Version 9.4.1, GraphPad Software, San Diego, CA, USA). Data are expressed as means ± standard deviation (SD) from two or three biological replicates, each conducted at least twice in independent experiments.

4.12. AI-Assisted Writing Disclosure

During the preparation of this manuscript, the authors used ChatGPT (OpenAI, GPT-5.3) for the purposes of refining the clarity and structure of the text, specifically for enhancing readability and improving sentence flow. The authors have reviewed and edited the output and take full responsibility for the content of this publication.


5. Conclusions

This study evaluated the heterologous expression of cannabinoid-related enzymes in the photosynthetic microalga Chlamydomonas reinhardtii. We demonstrate that the bacterial aromatic prenyltransferase NphB can be successfully expressed in the nuclear genome of C. reinhardtii, producing a catalytically active enzyme capable of synthesizing cannabigerolic acid (CBGA) in vitro. In contrast, the plant-derived oxidocyclase CBDAS did not accumulate as a detectable protein under the tested expression configurations, highlighting significant challenges associated with expressing complex plant enzymes in this host. Our results indicate that promoter selection, host strain background, and regulatory architecture strongly influence heterologous protein accumulation in C. reinhardtii. While CBGA formation was not detected in vivo, the functional activity of NphB in algal extracts demonstrates the potential of this photosynthetic organism as a biocatalytic platform. Future work aimed at improving precursor availability, optimizing enzyme localization, and enhancing nuclear transgene expression may enable more efficient reconstruction of cannabinoid biosynthetic pathways in microalgae.
Author Contributions

S.B.N.: Conceptualization, Data curation, Formal analysis, Investigation, Methodology, Validation, Writing—original draft, Writing—review and editing. A.B.: Conceptualization, Formal analysis, Investigation, Methodology, Writing—review and editing. R.B.: Conceptualization, Methodology, Writing—review and editing. A.C.: Formal analysis, Validation, Writing—review and editing. S.-È.G.: Formal analysis, validation, Writing—review and editing. N.M.: Conceptualization, Methodology, investigation, Data curation, Project administration, Writing—review and editing. F.M.-M.: Conceptualization, Methodology, Project administration, Resources, Writing—review and editing. H.G.: Project administration, Resources, Supervision, Writing—review and editing. I.D.-P.: Conceptualization, Visualization, Funding acquisition, Project administration, Resources, Supervision, Writing—review and editing. All authors have read and agreed to the published version of the manuscript.

Funding

This research was funded by the Natural Sciences and Engineering Research Council of Canada (NSERC) through the Alliance program Award No ALLRP 554429-20 and ALLRP 570476–2021 to IDP. Additional funding in the form of scholarships to R.B. and S.B.N. from Mitacs-Acceleration program grants Award No IT12310 was provided. Finally, financial support from the Canada Research Chairs on plant specialized metabolism Award CRC-2018-00137 to I.D-P was also provided.

Data Availability Statement

The data supporting the findings of this study are available within the article and its Appendix A.

Acknowledgments

The authors wish to thank Mather Carscallen and the lab members past and present, specifically Manel Ghribi and Bharat Bhusan Majhi, and Melodie B. Plourde for samples, technical support and helpful discussions.

Conflicts of Interest

The authors declare no conflicts of interest.

Abbreviations

The following abbreviations are used in this manuscript:
CBCannabinoid
CBDCannabidiol
CBDACannabidiolic acid
CBDASCannabidiol acid synthase
CBGACannabigerolic acid
CBGASCannabigerolic acid synthase
GPPGeranyl diphosphate
OAOlivetolic acid
THCTetrahydrocannabinol
THCATetrahydrocannabinolic acid
THCASTetrahydrocannabinolic acid synthase

Appendix A

Figure A1. Chromatograms showing after in vitro enzymatic assay analysis: (A) the detection of CBGA at the retention time of 10.146 min when the single protein NphB (peak in purple) or the fused protein NphB-2A-CBDAS (peak in green) was used, with no peak matching the CBDA standard (in black), compared to the empty vector (EV) used (in red). (B) Confirmation of CBGA mass-to-charge (m/z) produced in vitro using NphB-2A-CBDAS protein compared to the CBGA standard.
Catalysts 16 00346 g0a1
Figure A2. Colonies obtained after the nuclear transformation of different C. reinhardtii wild-type strains by electroporation with different genetic constructs and a layout of transformants randomly selected on a TAP-hygromycin or paromomycin selection plate. (A) Strain CC-125 transformed with C1. (B) Strain CC-125 transformed with C2. (C) Strain CC-125 co-transformed with C2+C4. (D) Strain CC-125 transformed with C3. (E) Strain CC-1690 transformed with C3. (F) Strain CC-5415 transformed with C3. (G) an example of transformants selected growing on TAP media selection plate in a layout of 96 wells plate for high throughput sub-culturing and colony PCR screening. All the strains were transformed with an equal amount of the digested linearized and purified recombinant DNA (2 µg).
Catalysts 16 00346 g0a2
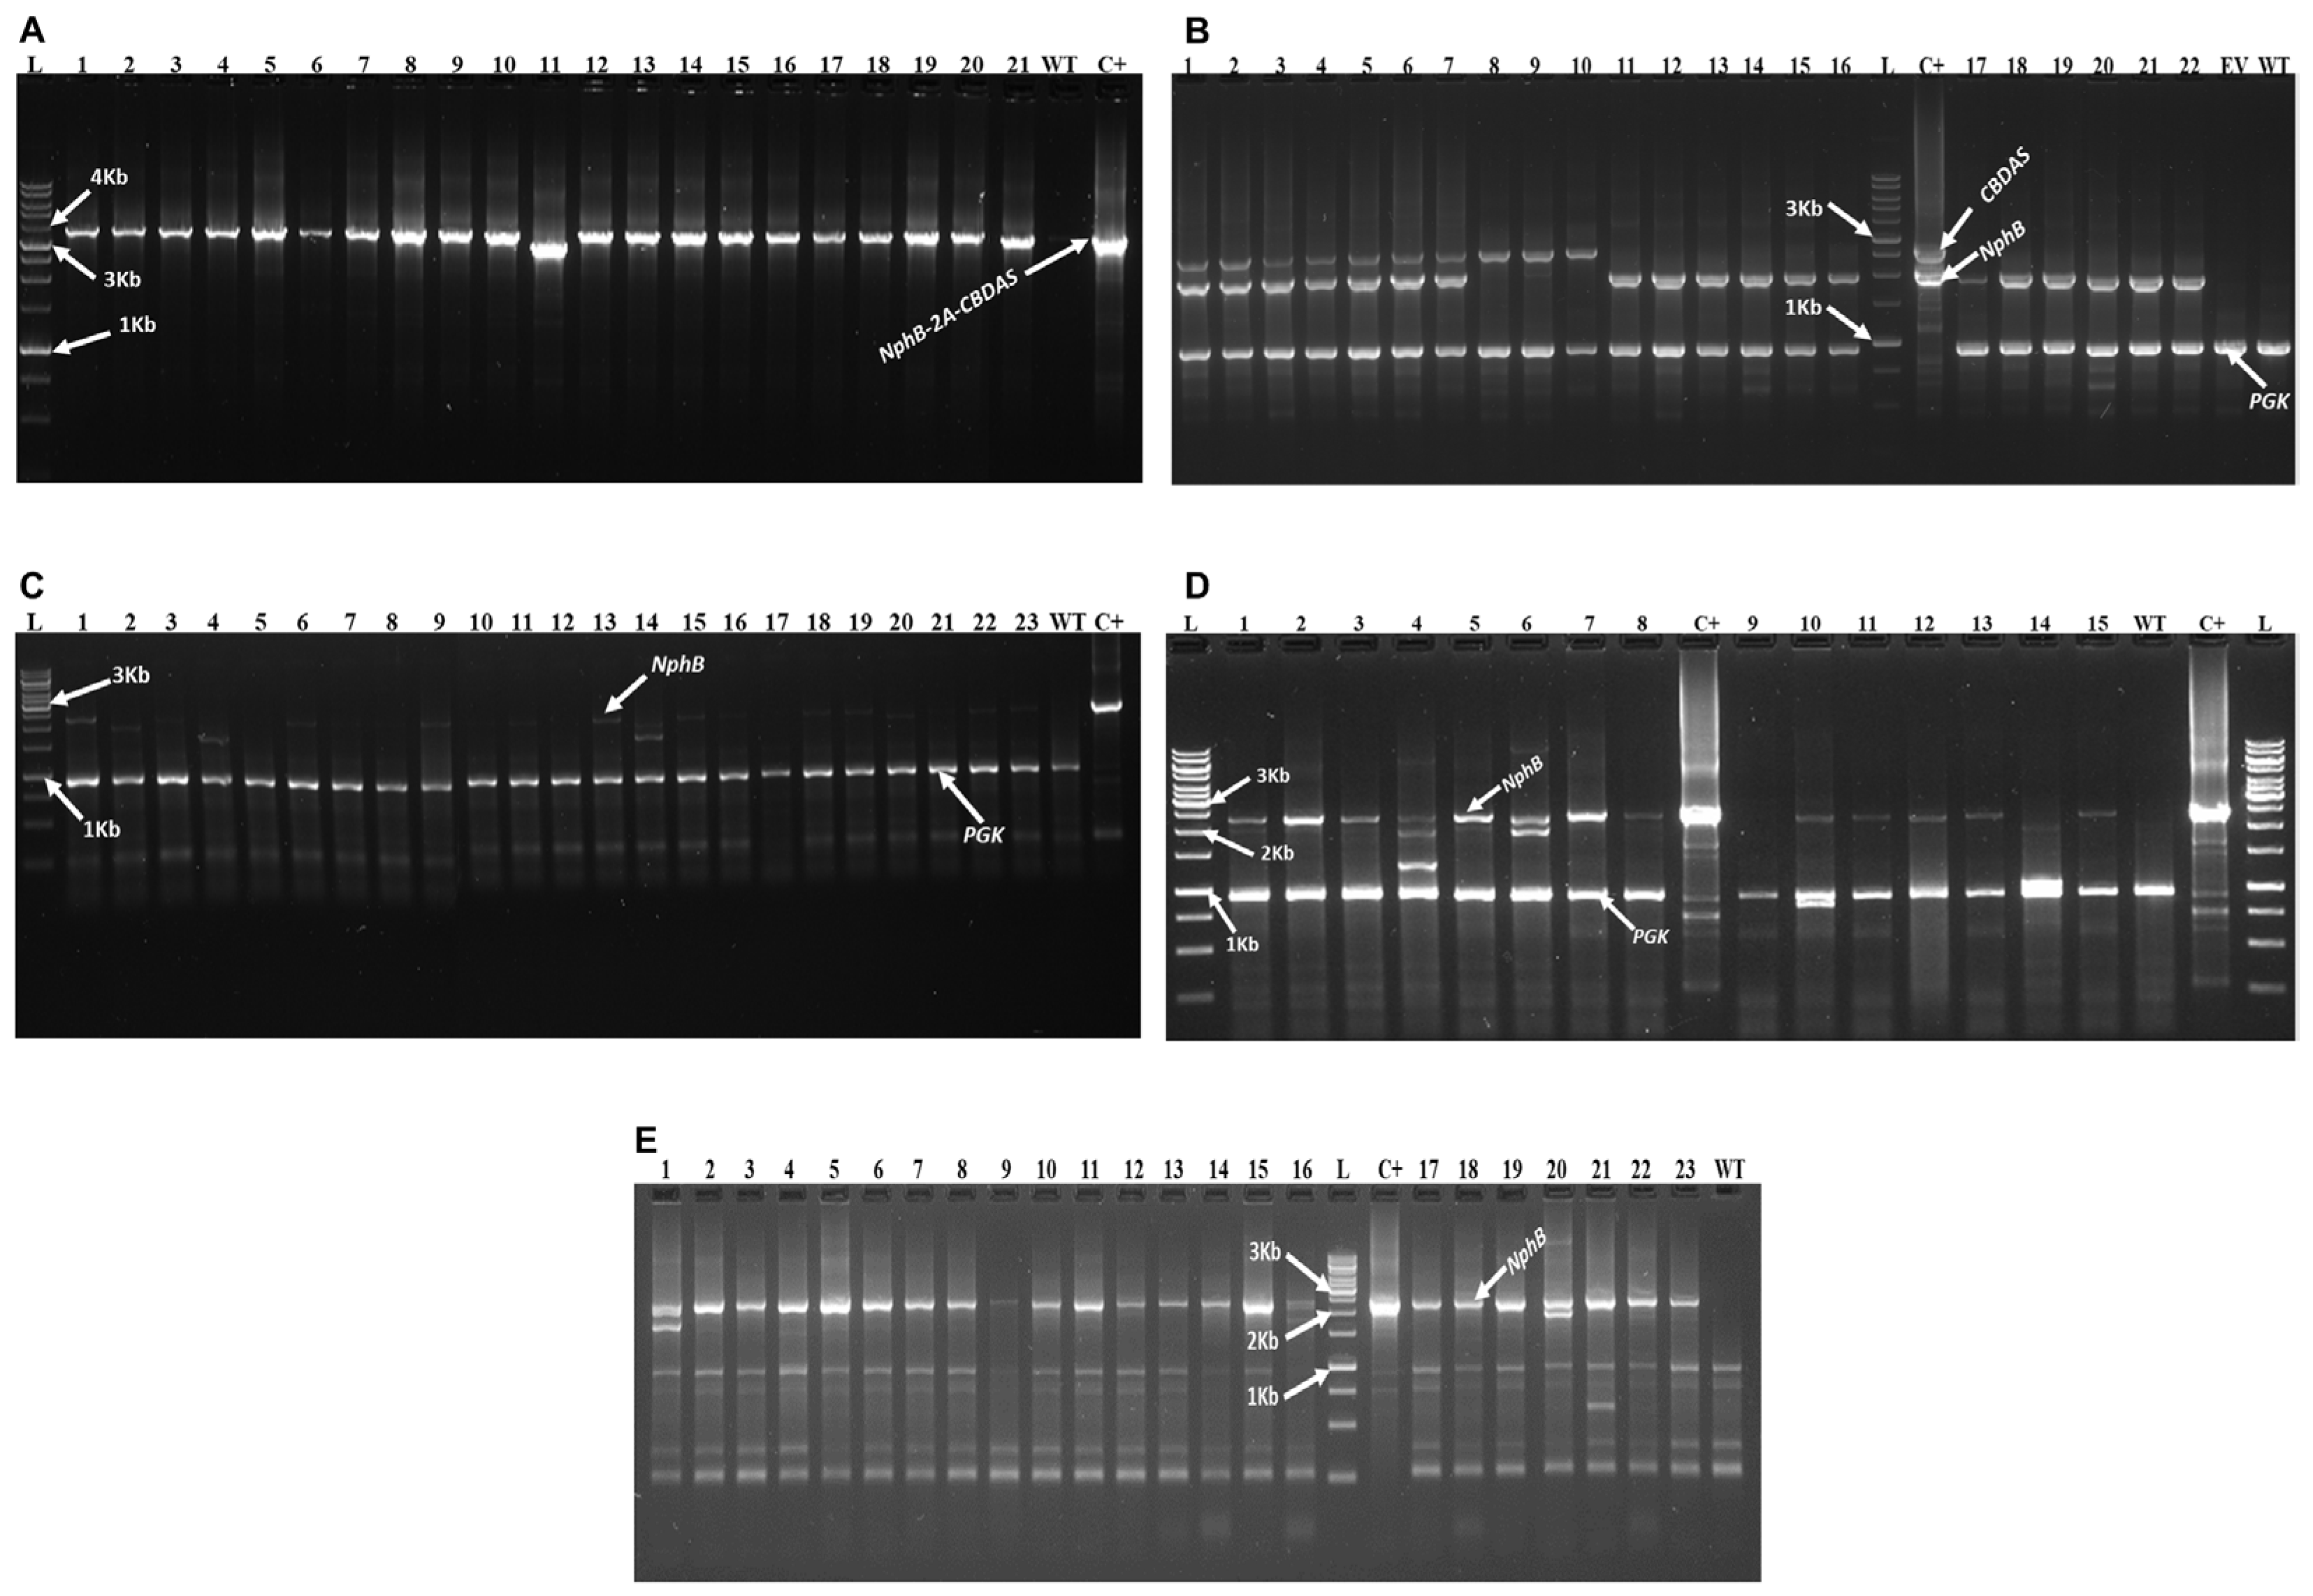
Figure A3. Illustration of 1% agarose gels showing transgene amplicons after colony PCR screening of transformants selected. (A) C1 amplicons of 3.5 kb from CC-125 transformants. (B) An example of C2 and C4 amplification of 2.577 kb and 1.950 kb amplicons, respectively, from CC-125 transformants. (C) C3 amplicons of 2.363 kb from CC-125 transformants. (D) C3 amplicons of 2.363 kb from CC-5415 transformants. (E) C3 amplicons of 2.363 kb from CC-1690 transformants. PCR products were run for 45 to 60 min at 100 V constant, and positive control (C+) used was the purified recombinant plasmid DNA of the corresponding construct in each case. The PGK (Phosphoglycerate Kinase: amplicon size 0.944 kb) was used as an internal control for gDNA extraction in the high-throughput colony PCR experiments. L: Frogga Bio 1 kb DNA ladder; EV: empty vector; WT: wild type strains.
Catalysts 16 00346 g0a3
Figure A4. C. reinhardtii strain CC-125 transformed or co-transformed with the genetic constructs C1, C2, and C4 successfully expressed or co-expressed the transgenes NphB and CBDAS but did not yield the expected proteins. (A) Western blot showing unspecific bands detection (left panel) onto the membrane containing separated protein from transformants expressing C1 when treated with Flag antibody; on the (right panel) is the membrane treated with HA antibody, which shows no band excepted the multi-tag purified protein (MTP) used as a positive control for the experiment. (B) Expressed NphB protein extracts after Western blot analysis showing unspecific bands after treatment with flag antibody. (C) Co-expressed NphB and CBDAS protein extracts after Western blot analysis showing unspecific bands after treatment with flag antibody. (D) NphB and CBDAS expression levels in transformants obtained from the co-transformation of genetic constructs C2 and C4. The expected sizes of proteins of interest are C1 ≈ 100 kDa or ≈37 kDa and ≈60 kDa (if the ribosome-skip mediated by 2A occurs), C2 ≈ 37 kDa, and C4 ≈ 60 kDa. EV: empty vector, WT: wild type. Technical replicate (black dots n = 2), results are shown as mean ± standard deviation.
Catalysts 16 00346 g0a4
Figure A5. HPLC-DAD chromatograms of in vitro enzymatic assays with C. reinhardtii transformants expressing NphB-2A-CBDAS. Chromatograms from tested clones (blue) showed no CBGA or CBDA peaks, similar to negative controls (WT, red; EV, pink). In contrast, the positive control (NphB expressed in E. coli, green) produced a CBGA peak at a retention time of 10.146 min, which matched the commercial CBGA standard (black).
Catalysts 16 00346 g0a5
Figure A6. Transformation of C. reinhardtii strains UVM4 and UVM11 with construct C1. (A) Colonies obtained after nuclear transformation of UVM4. (B) Colonies obtained after nuclear transformation of UVM11. (C) Agarose gel (1%) showing the 3.5 kb transgene amplicon from colony PCR screening of randomly selected UVM11 transformants. (D) Western blot of UVM4 transformants expressing C1 probed with anti-FLAG antibody, showing only nonspecific bands. (E) Western blot of UVM11 transformants expressing C1 probed with anti-FLAG antibody, also showing nonspecific bands. The expected protein sizes are ~100 kDa for the complete C1 fusion, and ~37 kDa (NphB) and ~60 kDa (CBDAS) if ribosome skipping at the 2A site occurs. Green color on the agarose gel highlights the positive clones harboring the 3.5 kb transgene amplicon.
Catalysts 16 00346 g0a6
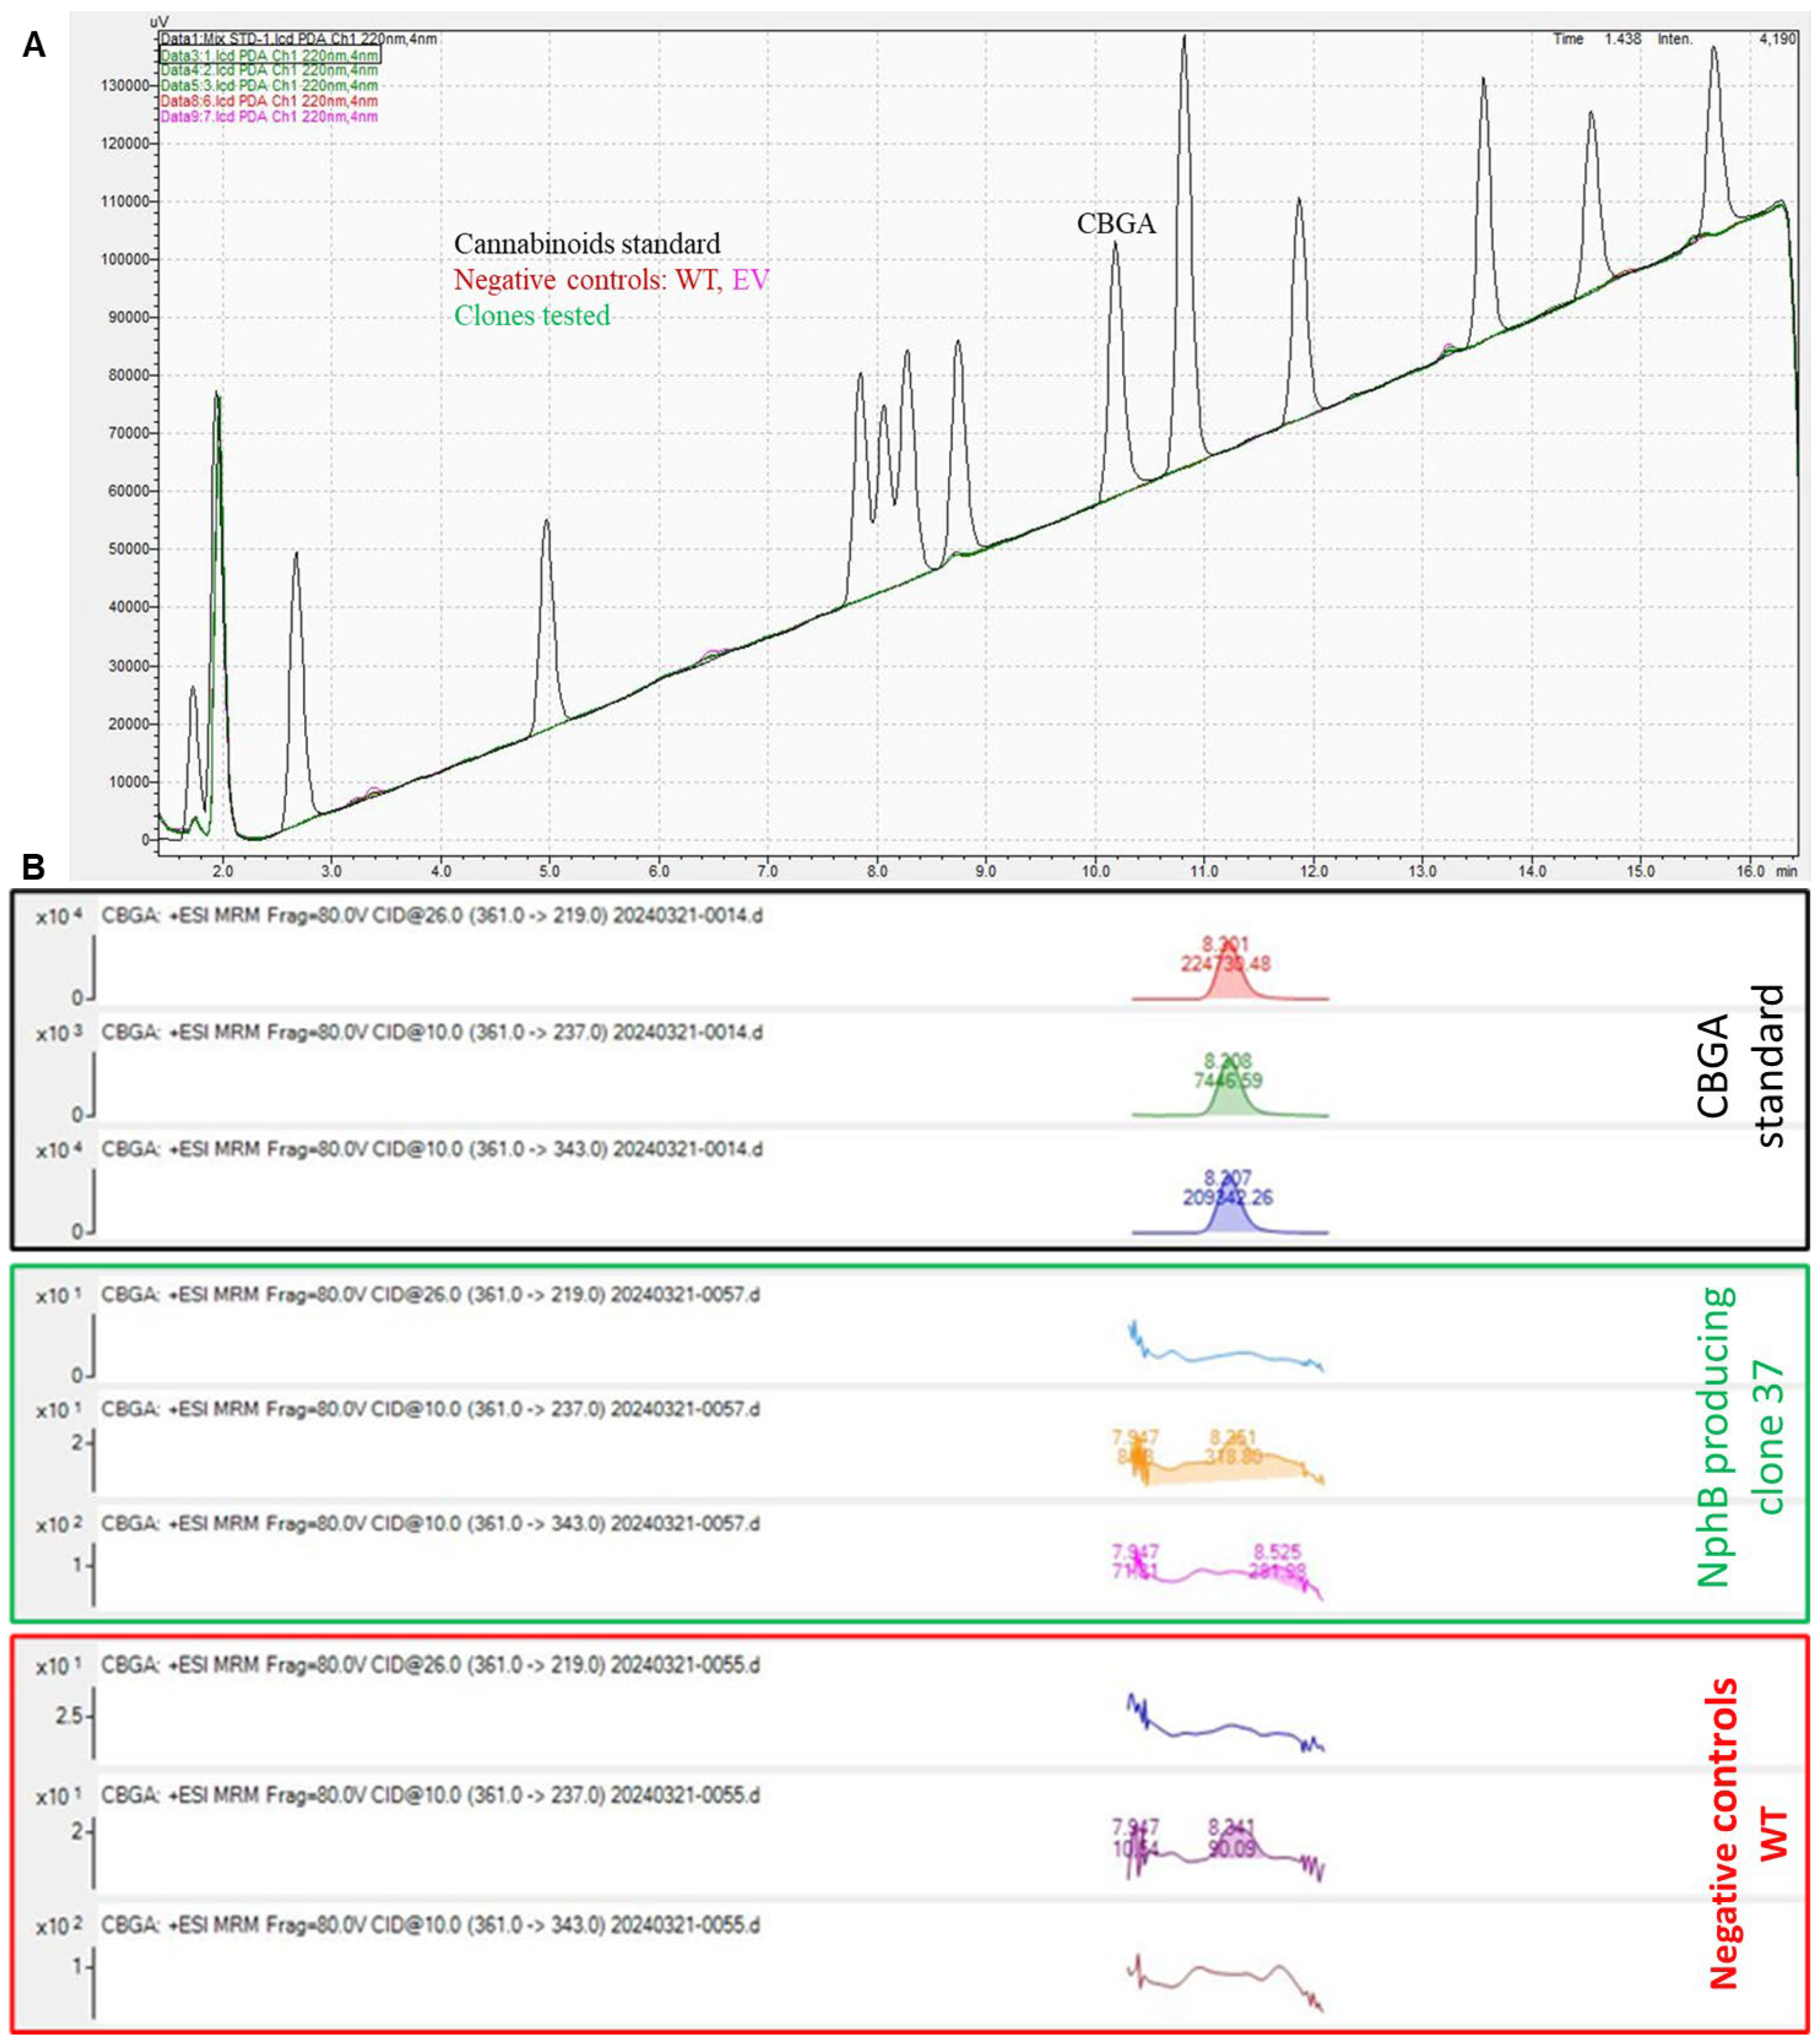
Figure A7. HPLC-DAD and HPLC-MS/MS chromatograms, (A) showing no detection of CBGA in clones tested (in green), compared to the commercial standard CBGA peak (in black) at the retention time of 10.146 min after analysis by HPLC-DAD of metabolites extracted from clones 12, 25, and 37, respectively, selected from the strains CC-1690, CC-125, and CC-5415; (B) the analysis by HPLC-MS/MS further confirmed no detection of CBGA in the clones tested (e.g., clone 37). Overlapping chromatograms generated by HPLC-MS/MS are technical replicates of each sample. Chromatograms of clones tested showed a similar profile as the negative controls, wild type (WT) in red and empty vector (EV) in pink.
Catalysts 16 00346 g0a7
Figure A8. CBGA signal detection by HPLC-MS/MS at the retention time of 8.301 min in the positive clone (green) compared to the CBGA standard (black) and the negative control WT (red).
Catalysts 16 00346 g0a8
Figure A9. Confirmation of CBGA mass-to-charge (m/z) produced in vitro by the WB+ transformants of C. reinhardtii and E. coli expressing a functionally active NphB.
Catalysts 16 00346 g0a9
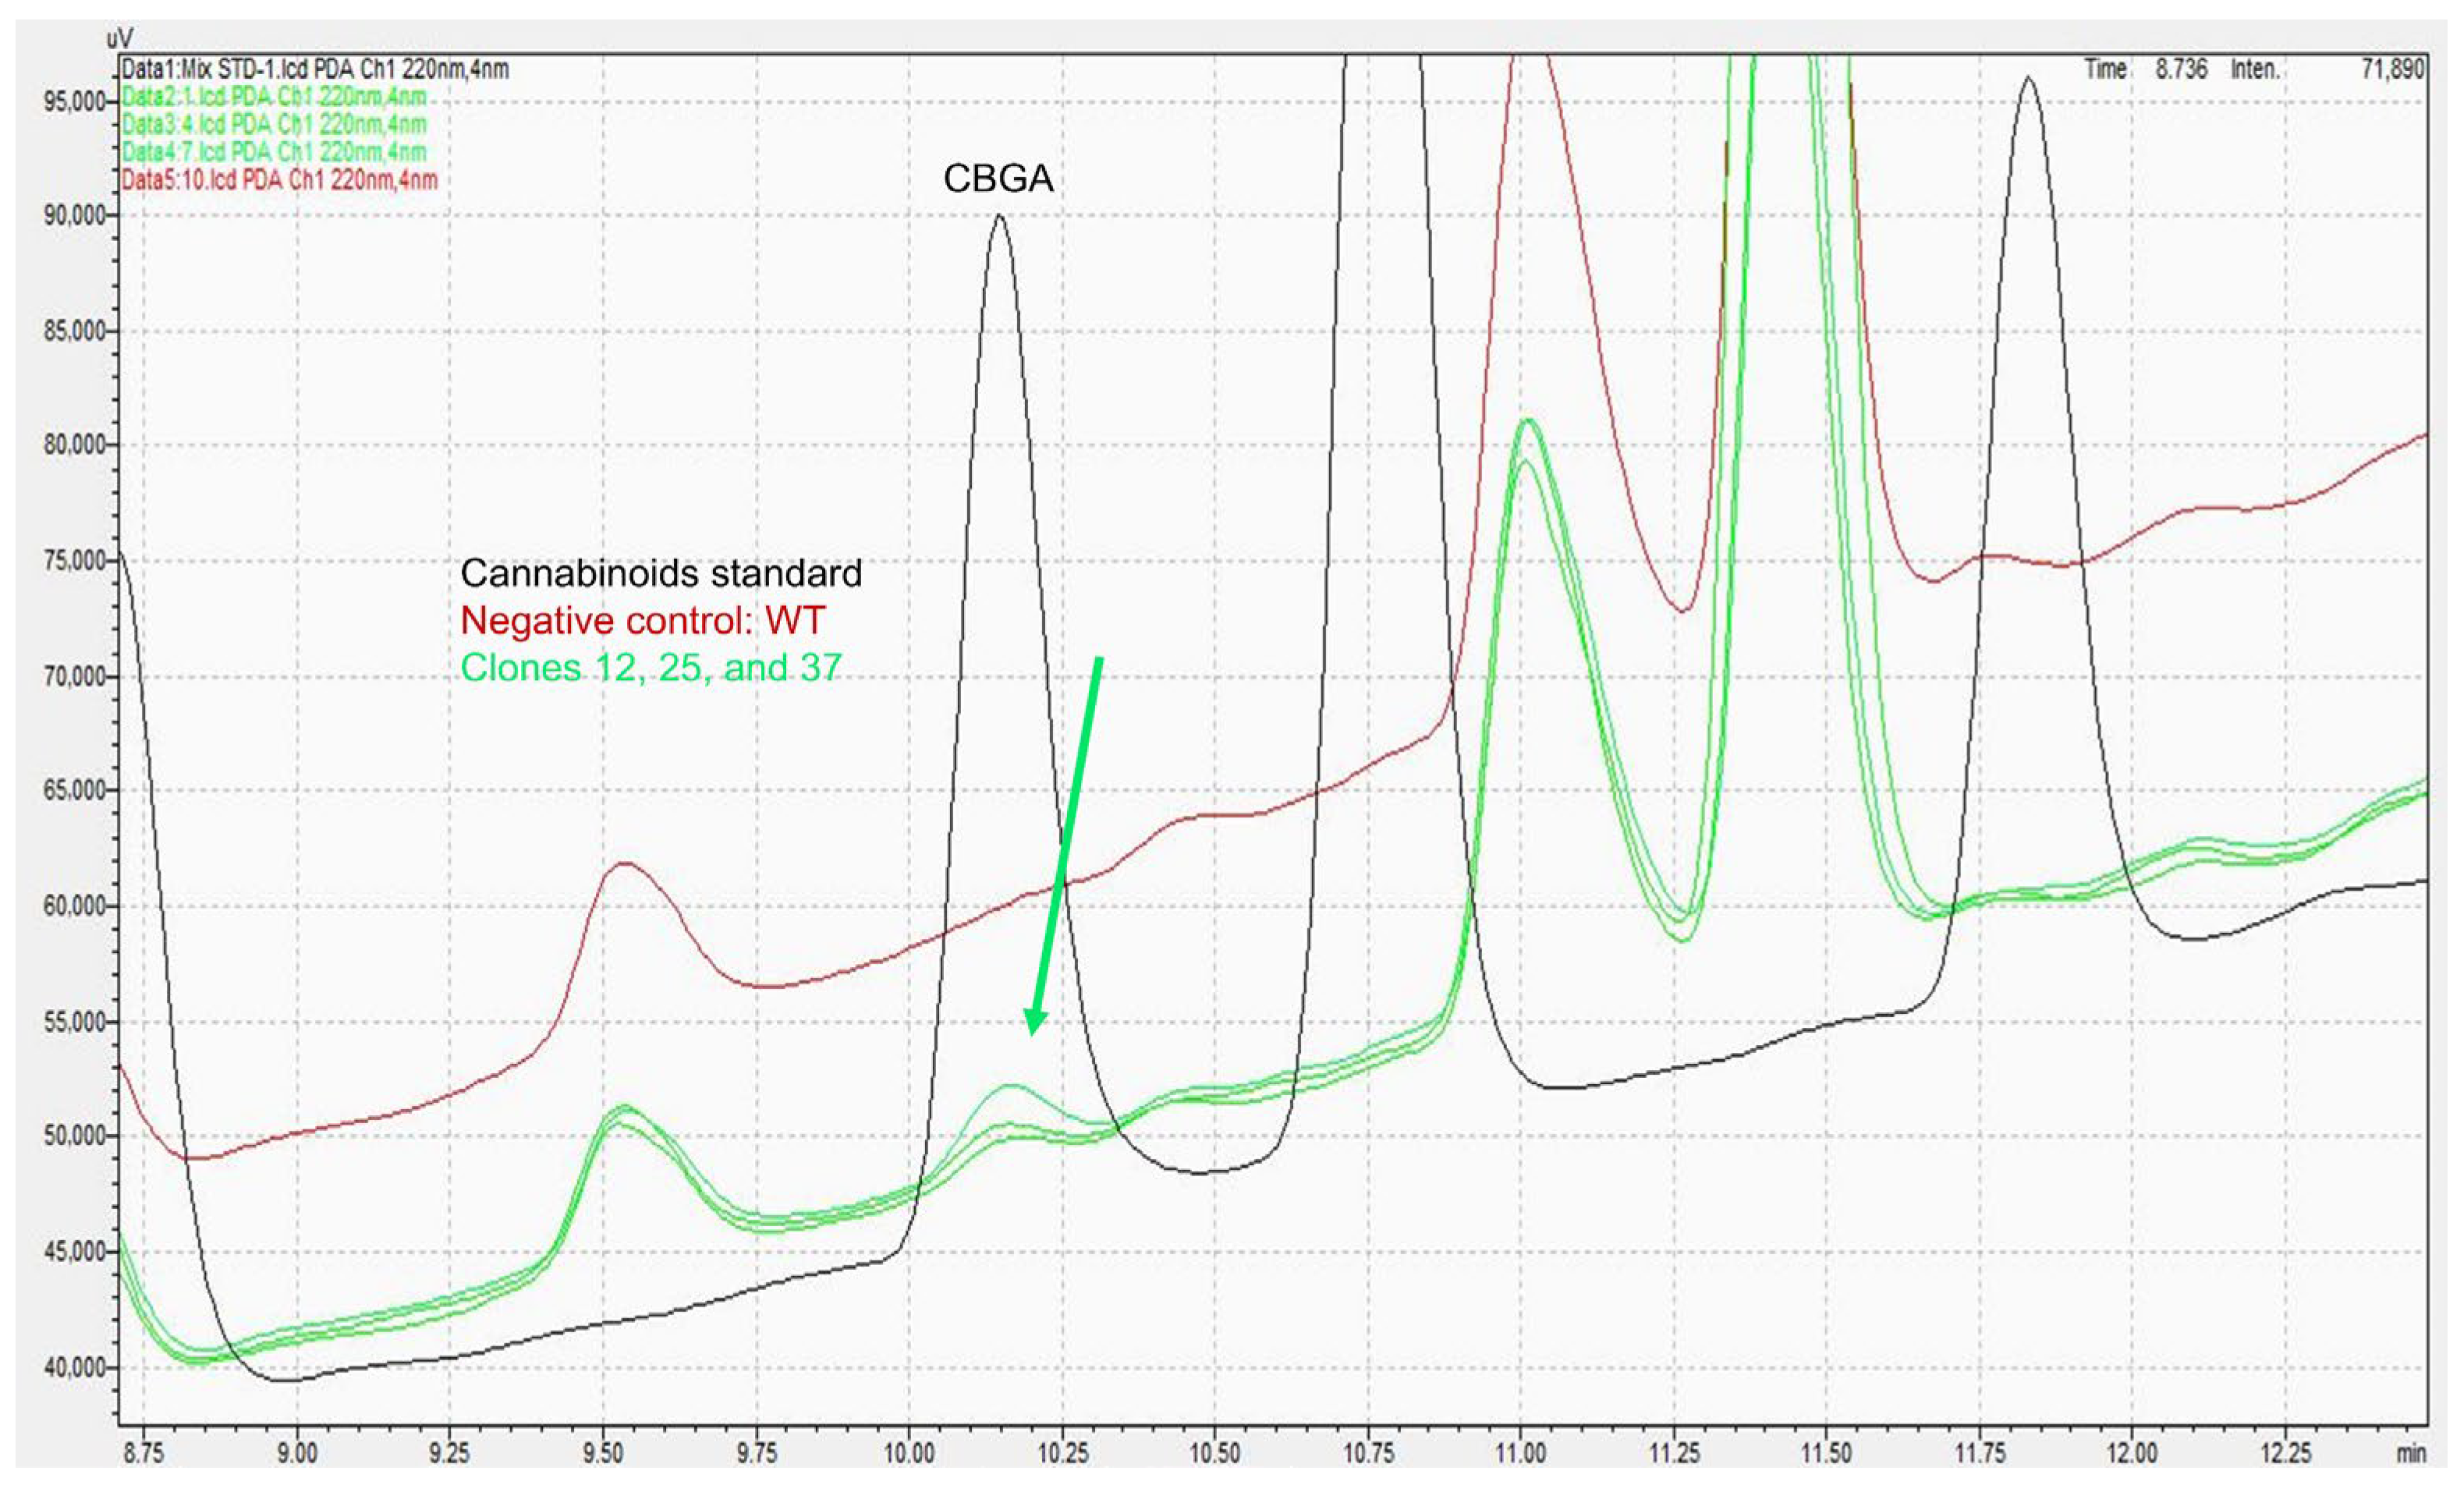
Figure A10. Chromatogram showing the CBGA peak at 10.146 min (in green highlighted with the arrow) matching the commercial standard CBGA peak (in black) after analysis by HPLC-DAD of in vitro enzymatic products obtained from the reaction performed with the C. reinhardtii WB+ transformants, compared to the wild-type (WT) in red.
Catalysts 16 00346 g0a10
Figure A11. Recombinant vectors pOpt_mRuby2-aphVII and pSL18-aphVIII harboring (A) the bicistronic constructs C1, of NphB-2A-CBDAS under ARp regulation; (B) the monocistronic construct C2, of NphB under ARp regulation; (C) the monocistronic construct C3, of NphB under pSAD regulation; (D) the monocistronic construct C4, of CBDAS under ARp regulation. The vector design was created using SnapGene version 8.0.3.
Catalysts 16 00346 g0a11
Figure A12. Recombinant vectors pMal-c2x harboring NphB and CBDAS genes for expression in E. coli. (A) pMalc2x holds the monocistronic genetic construct (NphB) fused to the C-terminal region of maltose binding protein (MBP). (B) pMalc2x holds the bicistronic genetic construct (NphB-2A-CBDAS) without MBP.
Catalysts 16 00346 g0a12
Table A1. Summary of selected UVM4 and UVM11 transformants tested for C1 construct integration and protein accumulation.
Genetic ConstructC. reinhardtii StrainsNumber of Colonies After TransformationRandomly Selected Clones Stable Clones After Five Rounds of SubculturingPCR+ Clones (%)Clones Tested for Protein DetectionWB+ Clones (%)
C1 UVM4100969118 (19.8%)180 (0%)
UVM11198969319 (20.4%)190 (0%)
Table A2. CBGA peak areas were obtained with the WB+ clones from the strains CC-5415, CC-125, and CC-1690 after in vitro enzymatic assay analysis by HPLC-MS/MS. ND = Not detected.
C. reinhardtii StrainsWB+ Clones TestedCBGA Peak Area
CC-541549,717.74851
532,943.8604
630,127.02
88,368.85007
1016,762.1016
3734,711.9617
WTND
C+ (NphB expressed in Bacteria)2,904,845.28
CC-1252536,709.52926
2919,858.80924
6413,792.38187
6611,045.42278
8518,800.53448
9512,722.9058
9710,217.03439
98ND
10110,856.97318
1176758.663872
14216,607.58164
14812,622.62841
181ND
1824,904.456476
1876,132.950473
WTND
C+ (NphB expressed in Bacteria)3,069,991.921
Table A3. List of primers used in this study for cloning, colony-PCR, and RT-qPCR.
Genes/
Constructs
Primer NameSequence 5′→3′
Cloning into pOPt_mRuby2 (C1, C2, and C4)
NphB-2A-CBDASRuby2_Hyg_HpaI_C5p1_FagcgggatccttcgaacgtacggttGCTGAGGCTTGACATGATTGGTG
C22_ScaI_C5p1_RtgtcgtcgtcgtccttgtagtccatcACTCTGCAAATGGAAACGGCGAC
C5p1_ScaI_C22_Fc gcgtcgccgtttccatttgcagagtgATGGACTACAAGGACGACGACG
C5p2_ScaI_C22_RcgcctccatttacacggagcggagtCTAGGCGTAGTCAGGCACGTCA
C22_ScaI_C5p2_FctatgacgtgcctgactacgcctagACTCCGCTCCGTGTAAATGGAG
Ruby2_Hyg_SnaBI_C5p2_RgcctcagcacgcgtatttaaattacCGCTTCAAATACGCCCAGCCC
CBDASF-pOpt_mRuby-CBDASAACCCACGCGAGAACTTCCTGAAGTGCTTCA
R-pOpt_mRuby-CBDASCTTGTCGTCGTCGTCCTTGTAGTCCAT
NphBNphB_pOpt_mRuby-FTACCCCTATGACGTGCCTGACTACGCCTAGACTCC
NphB-pOpt_mRuby-RGTCCTCCAGGCTGTCGAACGCCTTG
Cloning into pSL18 (C3 and C3b)
NphBF_NphB_NdeICGTACATATGATGGATTACAAGGATGACGACGATAAGGACTACAAGGACGACGACGACAAGTC
R_NphB_XbaIGTCATCTAGACTAGTCCTCCAGGCTGTCGAACGCCTTGAGCAGGC
CBDASF_CBDAS_NdeICATATGATGAACCCACGCGAGAACTTC
R_CBDAS-HA_EcoRIGCATGAATTCTCAAGCGTAATCTGGAACATCGTATGGGTAGGCGTAGTCAGGCACGT
Cloning into pMAL-c2x and colony-PCR of E. coli clones
NphB-2A-CBDASF_NphB_NdeICGTACATATGATGGATTACAAGGATGACGACGATAAGGACTACAAGGACGACGACGACAAGTC
R_CBDAS-HA_EcoRIGCATGAATTCTCAAGCGTAATCTGGAACATCGTATGGGTAGGCGTAGTCAGGCACGT
NphBF-NphB/BamHIGGATCCATGTCCGAGGCCGCGG
R-NphB/HindIIIAAGCTTTTAGTCCTCCAGGCTGTCGAACG
Colony PCR of C. reinhardtii transformants
C1, C2, and C4Block2_ FAAGTTCTAGAGTATTTGAAGCGGGATCCTTCGAACGTAC
Block2_RTACTAAGCTTTGTCAAGCCTCAGCACGCGTATTTAA
C3F_pSADp-NphBGCTAGGATCCcacacacctgcccgtctgcctgac
R_pSADT-NphBGTCATACGTAcacagtcacgctgtctccccctg
RT-qPCR primers were synthesized and validated
PGKCrPGKexon9-qP F1ATGGGTGTGTTCGAGTTTCC
CrPGKexon9-qP R1GTCACCGCCACCAATGAT
Histone 3Cr_hist3qPCR FWD Set 2GATTGCCCAGGACTTCAAGA
Cr_hist3qPCR REV Set 2CAGGTTGGTATCCTCGAACAG
NphBCr_NphB-RT-pcrFor1CTGAGCACCTTCCAGGACAC
Cr_NphB-RT-pcrRev1GAACAGGCCCTTCTCCACC
CBDASCr_CBDAS_RT-pcrForTGACGCCCTACGTGAGCAAG
Cr_CBDAS_RT-pcrRevCCACCAGAGTCTTCACCTTAAC
Bold and underlined nucleotides in the primer sequence are the enzyme’s restriction sites.
Table A4. Gene sequences used in this study. CDS = coding sequence, SM = selection marker.
NameTypeGene Sequence OptimizedRef.
NphBG286S/Y288ACDSATGTCCGAGGCCGCGGACGTGGAGCGCGTGTACGCGGCCATGGAGGAGGCCGCCGGCCTGCTGGGCGTGGCCTGCGCCCGCGACAAGATCTACCCGCTGCTGAGCACCTTCCAGGACACCCTGGTGGAAGGCGGCAGCGTGGTGGTGTTCAGCATGGCCAGCGGCCGCCACAGCACCGAGCTGGACTTCAGCATCAGCGTGCCCACCTCCCACGGCGACCCCTACGCCACGGTGGTGGAGAAGGGCCTGTTCCCCGCGACCGGCCACCCCGTGGACGACCTGCTGGCGGACACGCAGAAGCACCTGCCGGTGAGCATGTTCGCCATCGACGGCGAGGTGACGGGCGGCTTCAAGAAGACCTACGCGTTCTTCCCCACCGACAACATGCCCGGCGTGGCCGAGCTCTCGGCGATCCCCTCGATGCCCCCCGCCGTGGCCGAGAACGCGGAGCTGTTCGCGCGGTACGGCCTGGACAAGGTGCAGATGACGTCCATGGACTACAAGAAGCGCCAGGTGAACCTGTACTTCTCCGAGCTGTCGGCGCAGACCCTGGAGGCCGAGAGCGTGCTGGCCCTGGTGCGGGAGCTGGGCCTGCACGTGCCCAACGAGCTGGGCCTGAAGTTCTGCAAGCGCTCCTTCTCCGTGTACCCCACCCTGAACTGGGAGACCGGCAAGATTGACCGCCTGTGCTTCGCCGTGATTAGCAACGACCCCACCCTGGTGCCCTCCAGCGACGAGGGCGACATCGAGAAGTTCCACAACTACGCCACCAAGGCGCCGTACGCCTACGTGGGCGAGAAGCGCACCCTGGTGTACGGCCTTACCCTGAGCCCCAAGGAGGAGTATTACAAGCTGTCGGCCGCCTATCACATCACCGACGTCCAGCGCGGCCTGCTCAAGGCGTTCGACAGCCTGGAGGACTAG[39]
ExtFMDV2ACDSCTGCTGGCCATCCACCCCACCGAGGCCCGGCACAAGCAGAAGATCGTGGCCCCCGTCAAGCAGACGCTGAACTTCGACCTGCTGAAGCTGGCCGGCGACGTGGAGTCGAACCCCGGCCCC[60]
CBDASCDSATGAACCCACGCGAGAACTTCCTGAAGTGCTTCAGCCAGTACATCCCGAACAACGCCACCAACCTGAAGCTGGTCTATACCCAGAACAACCCCCTGTACATGTCCGTCCTGAACAGCACCATCCACAACCTGCGCTTCACCAGCGACACGACCCCGAAGCCCCTCGTGATCGTGACCCCCAGCCACGTGTCCCACATCCAGGGCACCATCCTGTGCTCGAAGAAGGTGGGCCTGCAGATCCGCACCCGCAGCGGCGGCCACGACTCTGAGGGCATGTCGTACATCAGCCAGGTGCCGTTCGTGATCGTCGACCTGCGCAACATGCGCTCCATCAAGATCGACGTGCACTCGCAGACCGCCTGGGTGGAGGCGGGGGCCACCCTCGGCGAGGTCTACTACTGGGTGAACGAGAAGAACGAGAACCTGAGCCTGGCCGCCGGCTACTGCCCGACGGTCTGCGCGGGCGGCCACTTCGGCGGCGGCGGCTACGGCCCCCTGATGCGCAACTACGGCCTGGCGGCCGACAACATCATCGACGCGCACCTCGTGAACGTGCACGGCAAGGTGCTGGACCGCAAGTCGATGGGGGAGGACCTGTTCTGGGCCCTGCGCGGCGGCGGCGCCGAGAGCTTCGGCATCATCGTCGCCTGGAAGATCCGCCTGGTGGCGGTGCCCAAGTCCACCATGTTCAGCGTGAAGAAGATCATGGAGATCCACGAGCTCGTGAAGCTGGTCAACAAGTGGCAGAACATCGCGTACAAGTACGACAAGGACCTGCTGCTGATGACCCACTTCATCACGCGCAACATCACGGACAACCAGGGCAAGAACAAGACCGCCATCCACACCTACTTCAGCAGCGTGTTCCTGGGCGGCGTGGACAGCCTGGTCGACCTGATGAACAAGAGCTTCCCCGAGCTGGGCATCAAGAAGACCGACTGCCGCCAGCTGTCGTGGATCGACACCATCATCTTCTACTCCGGCGTCGTGAACTACGACACCGACAACTTCAACAAGGAGATCCTGCTGGACCGCTCCGCGGGCCAGAACGGCGCGTTCAAGATCAAGCTGGACTACGTGAAGAAGCCCATCCCGGAGAGCGTGTTCGTGCAGATCCTGGAGAAGCTGTACGAGGAGGACATTGGCGCCGGCATGTACGCGCTGTACCCCTACGGCGGCATCATGGACGAGATCTCCGAGTCCGCCATCCCGTTCCCCCACCGGGCGGGCATCCTGTACGAGCTGTGGTACATCTGCAGCTGGGAGAAGCAGGAGGACAACGAGAAGCACCTGAACTGGATCCGCAACATCTACAACTTCATGACGCCCTACGTGAGCAAGAACCCCCGCCTGGCCTACCTGAACTACCGCGACCTGGACATCGGCATCAACGACCCCAAGAACCCGAACAACTACACGCAGGCCCGCATTTGGGGCGAGAAGTATTTCGGCAAGAACTTCGACCGATTGGTTAAGGTGAAGACTCTGGTGGATCCTAATAACTTCTTCCGTAATGAGCAGTCCATCCCCCCCCTGCCGCGGCACCGCCACTAG[17]
Hsp70A-RBCS2/5′UTRPromoterGCTGAGGCTTGACATGATTGGTGCGTATGTTTGTATGAAGCTACAGGACTGATTTGGCGGGCTATGAGGGCGGGGGAAGCTCTGGAAGGGCCGCGATGGGGCGCGCGGCGTCCAGAAGGCGCCATACGGCCCGCTGGCGGCACCCATCCGGTATAAAAGCCCGCGACCCCGAACGGTGACCTCCACTTTCAGCGACAAACGAGCACTTATACATACGCGACTATTCTGCCGCTATACATAACCACTCAGCTAGCTTAAGATCCCATCACCGGTGCATGCCGGGCGCGCCAGAAGGAGCGCAGCCAAACCAGGATGATGTTTGATGGGGTATTTGAGCACTTGCAACCCTTATCCGGAAGCCCCCTGGCCCACAAAGGCTAGGCGCCAATGCAAGCAGTTCGCATGCAGCCCCTGGAGCGGTGCCCTCCTGATAAACCGGCCAGGGGGCCTATGTTCTTTACTTTTTTACAAGAGAAGTCACTCAACATCTTAAAATG[62,99]
RBCS2/3′UTRTerm.ACTCCGCTCCGTGTAAATGGAGGCGCTCGTTGATCTGAGCCTTGCCCCCTGACGAACGGCGGTGGATGGAAGATACTGCTCTCAAGTGCTGAAGCGGTAGCTTAGCTCCCCGTTTCGTGCTGATCAGTCTTTTTCAACACGTAAAAAGCGGAGGAGTTTTGCAATTTTGTTGGTTGTAACGATCCTCCGTTGATTTTGGCCTCTTTCTCCATGGGCGGGCTGGGCGTATTTGAAGCG
PSADpPromoterCACACACCTGCCCGTCTGCCTGACAGGAAGTGAACGCATGTCGAGGGAGGCCTCACCAATCGTCACACGAGCCCTCGTCAGAAACACGTCTCCGCCACGCTCTCCCTCTCACGGCCGACCCCGCAGCCCTTTTGCCCTTTCCTAGGCCACCGACAGGACCCAGGCGCTCTCAGCATGCCTCAACAACCCGTACTCGTGCCAGCGGTGCCCTTGTGCTGGTGATCGCTTGGAAGCGCATGCGAAGACGAAGGGGCGGAGCAGGCGGCCTGGCTGTTCGAAGGGCTCGCCGCCAGTTCGGGTGCCTTTCTCCACGCGCGCCTCCACACCTACCGATGCGTGAAGGCAGGCAAATGCTCATGTTTGCCCGAACTCGGAGTCCTTAAAAAGCCGCTTCTTGTCGTCGTTCCGAGACATGTTAGCAGATCGCAGTGCCACCTTTCCTGACGCGCTCGGCCCCATATTCGGACGCAATTGTCATTTGTAGCACAATTGGAGCAAATCTGGCGAGGCAGTAGGCTTTTAAGTTGCAAGGCGAGAGAGCAAAGTGGGACGCGGCGTGATTATTGGTATTTACGCGACGGCCCGGCGCGTTAGCGGCCCTTCCCCCAGGCCAGGGACGATTATGTATCAATATTGTTGCGTTCGGGCACTCGTGCGAGGGCTCCTGCGGGCTGGGGAGGGGGATCTGGGAATTGGAGGTACGACCGAGATGGCTTGCTCGGGGGGAGGTTTCCTCGCCGAGCAAGCCAGGGTTAGGTGTTGCGCTCTTGACTCGTTGTGCATTCTAGGACCCCACTGCTACTCACAACAAGC[63]
PSADtTerm.TGGCAGCAGCTGGACCGCCTGTACCATGGAGAAGAGCTTTACTTGCCGGGATGGCCGATTTCGCTGATTGATACGGGATCGGAGCTCGGAGGCTTTCGCGCTAGGGGCTAGGCGAAGGGCAGTGGTGACCAGGGTCGGTGTGGGGTCGGCCCACGGTCAATTAGCCACAGGAGGATCAGGGGGAGGTAGGCACGTCGACTTGGTTTGCGACCCCGCAGTTTTGGCGGACGTGCTGTTGTAGATGTTAGCGTGTGCGTGAGCCAGTGGCCAACGTGCCACACCCATTGAGAAGACCAACCAACTTACTGGCAATATCTGCCAATGCCATACTGCATGTAATGGCCAGGCCATGTGAGAGTTTGCCGTGCCTGCGCGCGCCCCGGGGGCGCAGTTTAGCTGACCAGCCGTGGGATGATGCACGCATTTGCAAGGACAGGGTAATCACAGCAGCAACATGGTGGGCTTAGGACAGCTGTGGGTCAGTGGACGGACGGCAGGGGAGGGACGGCGCAGCTCGGGAGACAGGGGGAGACAGCGTGACTGTG[63]
aphVIIHygromycin SMATGACACAAGAATCCCTGTTACTTCTCGACCGTATTGATTCGGATGATTCCTACGCGAGCCTGCGGAACGACCAGGAGTTCTGGGAGCCGCTGGCCCGCCGAGCCCTGGAGGAGCTCGGGCTGCCGGTGCCGCCGGTGCTGCGGGTGCCCGGCGAGAGCACCAACCCCGTACTGGTCGGCGAGCCCGGCCCGGTGATCAAGCTGTTCGGCGAGCACTGGTGCGGTCCGGAGAGCCTCGCGTCGGAGTCGGAGGCCTACGCGGTCCTGGCGGACGCCCCGGTGCCGGTGCCCCGCCTCCTCGGCCGCGGCGAGCTGCGGCCCGGCACCGGAGCCTGGCCGTGGCCCTACCTGGTGATGAGCCGGATGACCGGCACCACCTGGCGGTCCGCGATGGACGGCACGACCGACCGGAACGCGCTGCTCGCCCTGGCCCGCGAACTCGGCCGGGTGCTCGGCCGGCTGCACAGGGTGCCGCTGACCGGGAACACCGTGCTCACCCCCCATTCCGAGGTCTTCCCGGAACTGCTGCGGGAACGCCGCGCGGCGACCGTCGAGGACCACCGCGGGTGGGGCTACCTCTCGCCCCGGCTGCTGGACCGCCTGGAGGACTGGCTGCCGGACGTGGACACGCTGCTGGCCGGCCGCGAACCCCGGTTCGTCCACGGCGACCTGCACGGGACCAACATCTTCGTGGACCTGGCCGCGACCGAGGTCACCGGGATCGTCGACTTCACCGACGTGTATGCGGGAGACTCCCGCTACAGCCTGGTGCAACTGCATCTCAACGCCTTCCGGGGCGACCGCGAGATCCTGGCCGCGCTGCTCGACGGGGCGCAGTGGAAGCGGACCGAGGACTTCGCCCGCGAACTGCTCGCCTTCACCTTCCTGCACGACTTCGAGGTGTTCGAGGAGACCCCGCTGGATCTCTCCGGCTTCACCGATCCGGAGGAACTGGCGCAGTTCCTCTGGGGGCCGCCGGACACCGCCCCCGGCGCCTGA[62]
aphVIIIParomomycin SMTCAGAAGAACTCGTCCAACAGCCGGTAAAACGCCAGCTTTTCCTCCGATACCGCCCCATCCCACCCGCGCCCGTACTCCCGCAGGAACGCCGCGGAACACTCCGGCCCGAACCACGGGTCCTCCTCGTGGGCCAGCTCGCGCAGCACCAGCGCGAGATCGGAGTGCCGGTCCGCACGGCCGACCCGCCCCACGTCGATCAGCCCGGTCACCTCGCAGGTACGAGGGTCGAGCAGCACGTTGTCCGGGCACAGGTGACCGTGGCAAACCGCCAGATCCTCGTCCGCAGGCCGAGTCCGCTCCAGCTCGGCGAGAAGCCGCTCCCCCGACCACCCCTTCCGCTCCTCGTCCAGATCCTCCAAGTCGACGCTCCCTTCAGCGACAGCACGGGCCGCCTGCGGCACCGTCACCGCGAGACTGCGATCGAACGGACACCGCTCCCAGTCCAGCGCGTGCAGCGAACGAGCGAGCCCCGCGAGCGCCACCGCCACGTCCAGCCGCTGCTCCCGCGGCCACCGCGCACTGGCCGGACGCCCCGGAACCGCTTCGGTGACCAACCAGGCGACCCTCTCGTCCCCACCACCCTCCACAACACGAGGTACGGGAATCCCCACCTCCGCCAACCACACCAGCCGCTCAGCCTCACCCAACAAGCCCACCCCGGCCCCCAGAGCTGCCACCTTGACAAACAACTCCCGCCCACCACCCCGAAGCCGATAAACACCAGCCCCCGAGGCCCCATCCTCCACAACAACCCACTCACAACCGGGATACCGACCCCGCAGTGCACGCAACGCATCGTCCAT[63]
Table A5. Analytical parameters used for compound identification using high-performance liquid chromatography with diode-array detection (HPLC-DAD). Abbreviations: olivetolic acid (OA), olivetol (OL), delta-9-tetrahydrocannabinol (THC), cannabidiol (CBD), cannabinol (CBN), delta-9-tetrahydrocannabinolic acid (THCA), cannabidiolic acid (CBDA), cannabinolic acid (CBNA), cannabigerolic acid (CBGA), cannabichromene (CBC), cannabigerol (CBG), tetrahydrocannabivarin (THCV), cannabidivarin (CBDV), retention time (RT), maximum absorption wavelengths (λmax).
CompoundRT (min)λmax (nm)
OA1.936214/261/300
OL1.716202/276
THC11.827199/279/328
CBD7.811199/276
CBN10.773198/221/283
THCA15.636199/223/270/306
CBDA8.709198/223/269/307
CBNA14.547199/222/261/328
CBGA10.146198/222/268/305
CBC13.517199/226/280
CBG8.025199/274
THCV8.239199/278
CBDV4.942200/275
Table A6. Optimized instrumental parameters used for HPLC-MS/MS analyses in ESI+. References: olivetolic acid (OA), olivetol (OL), delta-9-tetrahydrocannabinol (THC), cannabidiol (CBD), cannabinol (CBN), delta-9-tetrahydrocannabinolic acid (THCA), cannabidiolic acid (CBDA), cannabinolic acid (CBNA), cannabigerolic acid (CBGA), cannabichromene (CBC), cannabigerol (CBG), tetrahydrocannabivarin (THCV), cannabidivarin (CBDV), retention time (RT), collision energy (CE). Quantification MRM transitions are bold, while qualifier MRM transitions are not.
CompoundRT (min)Parent Ion (m/z)Product Ion (m/z)Fragmentor (V)CE (V)Polarity
OA4.2722252077510+
1237518+
1897518+
OL4.0831811117510+
717510+
937526+
THC9.2253151938022+
1238034+
1358018+
CBD7.7523151937522+
1237534+
1357518+
CBN8.8253112237522+
2937514+
2417518+
THCA10.3343593418014+
2198034+
2858026+
CBDA7.9353593418010+
2198030+
2618026+
CBNA9.9333553378514+
2538530+
2358530+
CBGA8.2893612198026+
3438010+
2378010+
CBC9.5563151937518+
2597510+
817510+
CBG7.6553171938014+
1238034+
2078010+
THCV8.1622871657522+
1237534+
2317518+
CBDV6.6422871657522+
1237534+
2317514+

References

  1. Andre, C.M.; Hausman, J.-F.; Guerriero, G. Cannabis sativa: The plant of the thousand and one molecules. Front. Plant Sci. 2016, 7, 174167. [Google Scholar] [CrossRef]
  2. Gülck, T.; Booth, J.; Carvalho, Â.; Khakimov, B.; Crocoll, C.; Motawia, M.; Møller, B.; Bohlmann, J.; Gallage, N. Synthetic Biology of Cannabinoids and Cannabinoid Glucosides in Nicotiana benthamiana and Saccharomyces cerevisiae. J. Nat. Prod. 2020, 83, 2877–2893. [Google Scholar] [CrossRef] [PubMed]
  3. Romero, P.; Peris, A.; Vergara, K.; Matus, J.T. Comprehending and improving cannabis specialized metabolism in the systems biology era. Plant Sci. 2020, 298, 110571. [Google Scholar] [CrossRef] [PubMed]
  4. Abd-Nikfarjam, B.; Dolati-Somarin, A.; Baradaran Rahimi, V.; Askari, V.R. Cannabinoids in neuroinflammatory disorders: Focusing on multiple sclerosis, Parkinsons, and Alzheimers diseases. Biofactors 2023, 49, 560–583. [Google Scholar] [CrossRef] [PubMed]
  5. Al-Ghezi, Z.Z.; Miranda, K.; Nagarkatti, M.; Nagarkatti, P.S. Combination of cannabinoids, Δ9-tetrahydrocannabinol and cannabidiol, ameliorates experimental multiple sclerosis by suppressing neuroinflammation through regulation of miRNA-mediated signaling pathways. Front. Immunol. 2019, 10, 466430. [Google Scholar] [CrossRef]
  6. van den Hoogen, N.J.; Harding, E.K.; Davidson, C.E.; Trang, T. Cannabinoids in chronic pain: Therapeutic potential through microglia modulation. Front. Neural Circuits 2022, 15, 816747. [Google Scholar] [CrossRef]
  7. Abrams, D.I. The therapeutic effects of Cannabis and cannabinoids: An update from the National Academies of Sciences, Engineering and Medicine report. Eur. J. Intern. Med. 2018, 49, 7–11. [Google Scholar] [CrossRef]
  8. Hazekamp, A.; Ware, M.A.; Muller-Vahl, K.R.; Abrams, D.; Grotenhermen, F. The medicinal use of cannabis and cannabinoids—An international cross-sectional survey on administration forms. J. Psychoact. Drugs 2013, 45, 199–210. [Google Scholar] [CrossRef]
  9. Dorbian. Global Legal Cannabis Market Expected to Reach $58 Billion in 2028. Available online: https://www.forbes.com/sites/irisdorbian/2024/03/07/global-legal-cannabis-market-expected-to-reach-58-billion-in-2028/?sh=465318e11d84 (accessed on 30 May 2024).
  10. Gülck, T.; Møller, B.L. Phytocannabinoids: Origins and biosynthesis. Trends Plant Sci. 2020, 25, 985–1004. [Google Scholar] [CrossRef]
  11. Atakan, Z. Cannabis, a complex plant: Different compounds and different effects on individuals. Ther. Adv. Psychopharmacol. 2012, 2, 241–254. [Google Scholar] [CrossRef]
  12. Shultz, Z.P.; Lawrence, G.A.; Jacobson, J.M.; Cruz, E.J.; Leahy, J.W. Enantioselective Total Synthesis of Cannabinoids A Route for Analogue Development. Org. Lett. 2018, 20, 381–384. [Google Scholar] [CrossRef]
  13. Dethe, D.H.; Erande, R.D.; Mahapatra, S.; Das, S.; Kumar, B.V. Protecting group free enantiospecific total syntheses of structurally diverse natural products of the tetrahydrocannabinoid family. Chem. Commun. 2015, 51, 2871–2873. [Google Scholar] [CrossRef]
  14. Bolaños-Martínez, O.C.; Malla, A.; Rosales-Mendoza, S.; Vimolmangkang, S. Harnessing the advances of genetic engineering in microalgae for the production of cannabinoids. Crit. Rev. Biotechnol. 2022, 43, 823–834. [Google Scholar] [CrossRef] [PubMed]
  15. Awwad, F.; Fantino, E.I.; Héneault, M.; Diaz-Garza, A.M.; Merindol, N.; Custeau, A.; Gélinas, S.-E.; Meddeb-Mouelhi, F.; Li, J.; Lemay, J.-F. Bioengineering of the Marine Diatom Phaeodactylum tricornutum with Cannabis Genes Enables the Production of the Cannabinoid Precursor, Olivetolic Acid. Int. J. Mol. Sci. 2023, 24, 16624. [Google Scholar] [CrossRef] [PubMed]
  16. Zirpel, B.; Degenhardt, F.; Martin, C.; Kayser, O.; Stehle, F. Engineering yeasts as platform organisms for cannabinoid biosynthesis. J. Biotechnol. 2017, 259, 204–212. [Google Scholar] [CrossRef] [PubMed]
  17. Luo, X.; Reiter, M.A.; d’Espaux, L.; Wong, J.; Denby, C.M.; Lechner, A.; Zhang, Y.; Grzybowski, A.T.; Harth, S.; Lin, W. Complete biosynthesis of cannabinoids and their unnatural analogues in yeast. Nature 2019, 567, 123–126. [Google Scholar] [CrossRef]
  18. Tan, Z.; Clomburg, J.M.; Gonzalez, R. Synthetic pathway for the production of olivetolic acid in Escherichia coli. ACS Synth. Biol. 2018, 7, 1886–1896. [Google Scholar] [CrossRef]
  19. Taura, F.; Dono, E.; Sirikantaramas, S.; Yoshimura, K.; Shoyama, Y.; Morimoto, S. Production of Δ1-tetrahydrocannabinolic acid by the biosynthetic enzyme secreted from transgenic Pichia pastoris. Biochem. Biophys. Res. Commun. 2007, 361, 675–680. [Google Scholar] [CrossRef]
  20. Zhang, Y.; Guo, J.; Gao, P.; Yan, W.; Shen, J.; Luo, X.; Keasling, J.D. Development of an efficient yeast platform for cannabigerolic acid biosynthesis. Metab. Eng. 2023, 80, 232–240. [Google Scholar] [CrossRef]
  21. Fantino, E.; Messaabi, A.; Mérindol, N.; Awwad, F.; Sene, N.; Gélinas, S.-E.; Custeau, A.; Rhéaume, K.-L.; Meddeb-Mouelhi, F.; Desgagné-Penix, I. Extrachromosomal expression of functional Cannabis sativa cannabidiolic acid synthase in Phaedodactylum tricornutum. Algal Res. 2025, 85, 103889. [Google Scholar] [CrossRef]
  22. Fantino, E.; Awwad, F.; Merindol, N.; Garza, A.M.D.; Gélinas, S.-E.; Robles, G.C.G.; Custeau, A.; Meddeb-Mouelhi, F.; Desgagné-Penix, I. Bioengineering Phaeodactylum tricornutum, a marine diatom, for cannabinoid biosynthesis. Algal Res. 2024, 77, 103379. [Google Scholar] [CrossRef]
  23. Sene, N.; Gonçalves dos Santos, K.C.; Merindol, N.; Gélinas, S.-E.; Custeau, A.; Awwad, F.; Fantino, E.; Meddeb-Mouelhi, F.; Germain, H.; Desgagné-Penix, I. Impact of heterologous expression of Cannabis sativa tetraketide synthase on Phaeodactylum tricornutum metabolic profile. Biotechnol. Biofuels Bioprod. 2025, 18, 42. [Google Scholar] [CrossRef] [PubMed]
  24. Gagne, S.J.; Stout, J.M.; Liu, E.; Boubakir, Z.; Clark, S.M.; Page, J.E. Identification of olivetolic acid cyclase from Cannabis sativa reveals a unique catalytic route to plant polyketides. Proc. Natl. Acad. Sci. USA 2012, 109, 12811–12816. [Google Scholar] [CrossRef] [PubMed]
  25. Sirikantaramas, S.; Morimoto, S.; Shoyama, Y.; Ishikawa, Y.; Wada, Y.; Shoyama, Y.; Taura, F. The gene controlling marijuana psychoactivity: Molecular cloning and heterologous expression of Δ1-tetrahydrocannabinolic acid synthase from Cannabis sativa L. J. Biol. Chem. 2004, 279, 39767–39774. [Google Scholar] [CrossRef] [PubMed]
  26. Sirikantaramas, S.; Taura, F.; Tanaka, Y.; Ishikawa, Y.; Morimoto, S.; Shoyama, Y. Tetrahydrocannabinolic Acid Synthase, the Enzyme Controlling Marijuana Psychoactivity, is Secreted into the Storage Cavity of the Glandular Trichomes. Plant Cell Physiol. 2005, 46, 1578–1582. [Google Scholar] [CrossRef]
  27. Taura, F.; Morimoto, S.; Shoyama, Y. Purification and characterization of cannabidiolic-acid synthase from Cannabis sativa L.: Biochemical analysis of a novel enzyme that catalyzes the oxidocyclization of cannabigerolic acid to cannabidiolic acid. J. Biol. Chem. 1996, 271, 17411–17416. [Google Scholar] [CrossRef]
  28. Taura, F.; Sirikantaramas, S.; Shoyama, Y.; Shoyama, Y.; Morimoto, S. Phytocannabinoids in Cannabis sativa: Recent studies on biosynthetic enzymes. Chem. Biodivers. 2007, 4, 1649–1663. [Google Scholar] [CrossRef]
  29. ElSohly, M.; Gul, W. Constituents of Cannabis sativa. Handb. Cannabis 2014, 3, 187–188. [Google Scholar]
  30. Hanuš, L.O.; Meyer, S.M.; Muñoz, E.; Taglialatela-Scafati, O.; Appendino, G. Phytocannabinoids: A unified critical inventory. Nat. Prod. Rep. 2016, 33, 1357–1392. [Google Scholar] [CrossRef]
  31. Schmidt, C.; Aras, M.; Kayser, O. Engineering cannabinoid production in Saccharomyces cerevisiae. Biotechnol. J. 2024, 19, 2300507. [Google Scholar] [CrossRef]
  32. Hussain, T.; Jeena, G.; Pitakbut, T.; Vasilev, N.; Kayser, O. Cannabis sativa research trends, challenges, and new-age perspectives. Iscience 2021, 24, 103391. [Google Scholar] [CrossRef] [PubMed]
  33. Kearsey, L.J.; Prandi, N.; Karuppiah, V.; Yan, C.; Leys, D.; Toogood, H.; Takano, E.; Scrutton, N.S. Structure of the Cannabis sativa olivetol-producing enzyme reveals cyclization plasticity in type III polyketide synthases. FEBS J. 2020, 287, 1511–1524. [Google Scholar] [CrossRef] [PubMed]
  34. Degenhardt, F.; Stehle, F.; Kayser, O. The biosynthesis of cannabinoids. In Handbook of Cannabis and Related Pathologies; Elsevier: Amsterdam, The Netherlands, 2017; pp. 13–23. [Google Scholar]
  35. Carvalho, Â.; Hansen, E.H.; Kayser, O.; Carlsen, S.; Stehle, F. Designing microorganisms for heterologous biosynthesis of cannabinoids. FEMS Yeast Res. 2017, 17, fox037. [Google Scholar] [CrossRef] [PubMed]
  36. Krogh, A.; Larsson, B.; Von Heijne, G.; Sonnhammer, E.L. Predicting transmembrane protein topology with a hidden Markov model: Application to complete genomes. J. Mol. Biol. 2001, 305, 567–580. [Google Scholar] [CrossRef]
  37. Ayakar, S.R.; Pawar, S.V.; Hallam, S.J.; Hossain, S.; Yadav, V.G.; Protiva, R.R.; Srivastava, S.K. Metabolic Engineering of E. coli for the Biosynthesis of Cannabinoid Products. US Patent 20200291434A1, 17 September 2020. [Google Scholar]
  38. Page, J.; Boubakir, Z. Aromatic Prenyltransferase from Cannabis. US Patent 20120144523, 7 June 2012. [Google Scholar]
  39. Valliere, M.A.; Korman, T.P.; Woodall, N.B.; Khitrov, G.A.; Taylor, R.E.; Baker, D.; Bowie, J.U. A cell-free platform for the prenylation of natural products and application to cannabinoid production. Nat. Commun. 2019, 10, 565. [Google Scholar] [CrossRef]
  40. Park, Y.S.; Kim, M.; Na, C.Y.; Ham, H.W.; Cho, J.-Y.; Park, B.; Jung, C.; Park, D.; Yoo, T.H. A highly active and regioselective cannabigerolic acid synthase engineered from a promiscuous prenyltransferase NphB. Catal. Sci. Technol. 2025, 15, 3363–3371. [Google Scholar] [CrossRef]
  41. Spitzer, S.; Wloka, J.; Pietruszka, J.; Kayser, O. Generation of Cannabigerolic Acid Derivatives and Their Precursors by Using the Promiscuity of the Aromatic Prenyltransferase NphB. ChemBioChem 2023, 24, e202300441. [Google Scholar] [CrossRef]
  42. Bonitz, T.; Alva, V.; Saleh, O.; Lupas, A.N.; Heide, L. Evolutionary relationships of microbial aromatic prenyltransferases. PLoS ONE 2011, 6, e27336. [Google Scholar] [CrossRef]
  43. Kuzuyama, T.; Noel, J.P.; Richard, S.B. Structural basis for the promiscuous biosynthetic prenylation of aromatic natural products. Nature 2005, 435, 983–987. [Google Scholar] [CrossRef]
  44. Lim, K.J.H.; Hartono, Y.D.; Xue, B.; Go, M.K.; Fan, H.; Yew, W.S. Structure-Guided Engineering of Prenyltransferase NphB for High-Yield and Regioselective Cannabinoid Production. ACS Catal. 2022, 12, 4628–4639. [Google Scholar] [CrossRef]
  45. Qian, S.; Clomburg, J.M.; Gonzalez, R. Engineering Escherichia coli as a platform for the in vivo synthesis of prenylated aromatics. Biotechnol. Bioeng. 2019, 116, 1116–1127. [Google Scholar] [CrossRef] [PubMed]
  46. Merchant, S.S.; Prochnik, S.E.; Vallon, O.; Harris, E.H.; Karpowicz, S.J.; Witman, G.B.; Terry, A.; Salamov, A.; Fritz-Laylin, L.K.; Maréchal-Drouard, L. The Chlamydomonas genome reveals the evolution of key animal and plant functions. Science 2007, 318, 245–250. [Google Scholar] [CrossRef] [PubMed]
  47. Einhaus, A.; Steube, J.; Freudenberg, R.; Barczyk, J.; Baier, T.; Kruse, O. Engineering a powerful green cell factory for robust photoautotrophic diterpenoid production. Metab. Eng. 2022, 73, 82–90. [Google Scholar] [CrossRef] [PubMed]
  48. Kong, F.; Yamaoka, Y.; Ohama, T.; Lee, Y.; Li-Beisson, Y. Molecular genetic tools and emerging synthetic biology strategies to increase cellular oil content in Chlamydomonas reinhardtii. Plant Cell Physiol. 2019, 60, 1184–1196. [Google Scholar] [CrossRef]
  49. Schroda, M.; Remacle, C. Molecular advancements establishing Chlamydomonas as a host for biotechnological exploitation. Front. Plant Sci. 2022, 13, 911483. [Google Scholar] [CrossRef]
  50. Schroda, M. Good news for nuclear transgene expression in Chlamydomonas. Cells 2019, 8, 1534. [Google Scholar] [CrossRef]
  51. Gallaher, S.D.; Fitz-Gibbon, S.T.; Glaesener, A.G.; Pellegrini, M.; Merchant, S.S. Chlamydomonas genome resource for laboratory strains reveals a mosaic of sequence variation, identifies true strain histories, and enables strain-specific studies. Plant Cell 2015, 27, 2335–2352. [Google Scholar] [CrossRef]
  52. Beauchemin, R.; Mérindol, N.; Fantino, E.; Lavoie, P.; Nouemssi, S.B.; Meddeb-Mouelhi, F.; Desgagné-Penix, I. Successful reversal of transgene silencing in Chlamydomonas reinhardtii. Biotechnol. J. 2024, 19, 2300232. [Google Scholar] [CrossRef]
  53. Baier, T.; Jacobebbinghaus, N.; Einhaus, A.; Lauersen, K.J.; Kruse, O. Introns mediate post-transcriptional enhancement of nuclear gene expression in the green microalga Chlamydomonas reinhardtii. PLoS Genet. 2020, 16, e1008944. [Google Scholar] [CrossRef]
  54. Baier, T.; Wichmann, J.; Kruse, O.; Lauersen, K.J. Intron-containing algal transgenes mediate efficient recombinant gene expression in the green microalga Chlamydomonas reinhardtii. Nucleic Acids Res. 2018, 46, 6909–6919. [Google Scholar] [CrossRef]
  55. Barolo, L.; Abbriano, R.M.; Commault, A.S.; Padula, M.P.; Pernice, M. Proteomic analysis reveals molecular changes following genetic engineering in Chlamydomonas reinhardtii. BMC Microbiol. 2024, 24, 392. [Google Scholar] [CrossRef] [PubMed]
  56. Zhao, M.-L.; Cai, W.-S.; Zheng, S.-Q.; Zhao, J.-L.; Zhang, J.-L.; Huang, Y.; Hu, Z.-L.; Jia, B. Metabolic engineering of the isopentenol utilization pathway enhanced the production of terpenoids in Chlamydomonas reinhardtii. Mar. Drugs 2022, 20, 577. [Google Scholar] [CrossRef] [PubMed]
  57. Lauersen, K.J.; Wichmann, J.; Baier, T.; Kampranis, S.C.; Pateraki, I.; Møller, B.L.; Kruse, O. Phototrophic production of heterologous diterpenoids and a hydroxy-functionalized derivative from Chlamydomonas reinhardtii. Metab. Eng. 2018, 49, 116–127. [Google Scholar] [CrossRef] [PubMed]
  58. Lauersen, K.J.; Baier, T.; Wichmann, J.; Wördenweber, R.; Mussgnug, J.H.; Hübner, W.; Huser, T.; Kruse, O. Efficient phototrophic production of a high-value sesquiterpenoid from the eukaryotic microalga Chlamydomonas reinhardtii. Metab. Eng. 2016, 38, 331–343. [Google Scholar] [CrossRef]
  59. Taura, F.; Sirikantaramas, S.; Shoyama, Y.; Yoshikai, K.; Shoyama, Y.; Morimoto, S. Cannabidiolic-acid synthase, the chemotype-determining enzyme in the fiber-type Cannabis sativa. FEBS Lett. 2007, 581, 2929–2934. [Google Scholar] [CrossRef]
  60. Plucinak, T.M.; Horken, K.M.; Jiang, W.; Fostvedt, J.; Nguyen, S.T.; Weeks, D.P. Improved and versatile viral 2 A platforms for dependable and inducible high-level expression of dicistronic nuclear genes in C hlamydomonas reinhardtii. Plant J. 2015, 82, 717–729. [Google Scholar] [CrossRef]
  61. Schroda, M.; Beck, C.F.; Vallon, O. Sequence elements within an HSP70 promoter counteract transcriptional transgene silencing in Chlamydomonas. Plant J. 2002, 31, 445–455. [Google Scholar] [CrossRef]
  62. Lauersen, K.J.; Kruse, O.; Mussgnug, J.H. Targeted expression of nuclear transgenes in Chlamydomonas reinhardtii with a versatile, modular vector toolkit. Appl. Microbiol. Biotechnol. 2015, 99, 3491–3503. [Google Scholar] [CrossRef]
  63. Fischer, N.; Rochaix, J.-D. The flanking regions of PsaD drive efficient gene expression in the nucleus of the green alga Chlamydomonas reinhardtii. Mol. Genet. Genom. 2001, 265, 888–894. [Google Scholar] [CrossRef]
  64. Donnelly, M.L.; Gani, D.; Flint, M.; Monaghan, S.; Ryan, M.D. The cleavage activities of aphthovirus and cardiovirus 2A proteins. J. Gen. Virol. 1997, 78, 13–21. [Google Scholar] [CrossRef]
  65. Luke, G.A.; Ryan, M.D. The 2A Story: The End of the Beginning. In Beyond the Blueprint—Decoding the Elegance of Gene Expression: Decoding the Elegance of Gene Expression; IntechOpen: London, UK, 2024; p. 115. [Google Scholar]
  66. Zirpel, B.; Degenhardt, F.; Zammarelli, C.; Wibberg, D.; Kalinowski, J.; Stehle, F.; Kayser, O. Optimization of Δ9-tetrahydrocannabinolic acid synthase production in Komagataella phaffii via post-translational bottleneck identification. J. Biotechnol. 2018, 272, 40–47. [Google Scholar] [CrossRef] [PubMed]
  67. Geissler, M.; Volk, J.; Stehle, F.; Kayser, O.; Warzecha, H. Subcellular localization defines modification and production of Δ 9-tetrahydrocannabinolic acid synthase in transiently transformed Nicotiana benthamiana. Biotechnol. Lett. 2018, 40, 981–987. [Google Scholar] [CrossRef]
  68. Zirpel, B.; Stehle, F.; Kayser, O. Production of Δ9-tetrahydrocannabinolic acid from cannabigerolic acid by whole cells of Pichia (Komagataella) pastoris expressing Δ9-tetrahydrocannabinolic acid synthase from Cannabis sativa L. Biotechnol. Lett. 2015, 37, 1869–1875. [Google Scholar] [CrossRef] [PubMed]
  69. Einhaus, A.; Baier, T.; Rosenstengel, M.; Freudenberg, R.A.; Kruse, O. Rational promoter engineering enables robust terpene production in microalgae. ACS Synth. Biol. 2021, 10, 847–856. [Google Scholar] [CrossRef] [PubMed]
  70. Milito, A.; Alzuria, D.; Aschern, M.; McQuillan, J.L.; Yang, J.S. Rational Design and Screening of Synthetic Promoters in Chlamydomonas reinhardtii. In Synthetic Promoters: Methods and Protocols; Springer: Berlin/Heidelberg, Germany, 2024; pp. 69–83. [Google Scholar]
  71. Milito, A.; Aschern, M.; McQuillan, J.L.; Yang, J.-S. Challenges and advances towards the rational design of microalgal synthetic promoters in Chlamydomonas reinhardtii. J. Exp. Bot. 2023, 74, 3833–3850. [Google Scholar] [CrossRef]
  72. Neupert, J.; Gallaher, S.D.; Lu, Y.; Strenkert, D.; Segal, N.; Barahimipour, R.; Fitz-Gibbon, S.T.; Schroda, M.; Merchant, S.S.; Bock, R. An epigenetic gene silencing pathway selectively acting on transgenic DNA in the green alga Chlamydomonas. Nat. Commun. 2020, 11, 6269. [Google Scholar] [CrossRef]
  73. Ghribi, M.; Nouemssi, S.B.; Meddeb-Mouelhi, F.; Desgagné-Penix, I. Genome editing by CRISPR-Cas: A game change in the genetic manipulation of Chlamydomonas. Life 2020, 10, 295. [Google Scholar] [CrossRef]
  74. Crozet, P.; Navarro, F.J.; Willmund, F.; Mehrshahi, P.; Bakowski, K.; Lauersen, K.J.; Pérez-Pérez, M.-E.; Auroy, P.; Rovira, A.G.; Sauret-Gueto, S.; et al. Birth of a photosynthetic chassis: A MoClo toolkit enabling synthetic biology in the microalga Chlamydomonas reinhardtii. ACS Synth. Biol. 2018, 7, 2074–2086. [Google Scholar] [CrossRef]
  75. Kumar, A.; Falcao, V.R.; Sayre, R.T. Evaluating nuclear transgene expression systems in Chlamydomonas reinhardtii. Algal Res. 2013, 2, 321–332. [Google Scholar] [CrossRef]
  76. Geisler, K.; Scaife, M.A.; Mordaka, P.M.; Holzer, A.; Tomsett, E.V.; Mehrshahi, P.; Ochoa, G.I.M.; Smith, A.G. Exploring the impact of terminators on transgene expression in Chlamydomonas reinhardtii with a synthetic biology approach. Life 2021, 11, 964. [Google Scholar] [CrossRef]
  77. Goold, H.D.; Moseley, J.L.; Lauersen, K.J. The synthetic future of algal genomes. Cell Genom. 2024, 4, 100505. [Google Scholar] [CrossRef]
  78. Wichmann, J.; Baier, T.; Wentnagel, E.; Lauersen, K.J.; Kruse, O. Tailored carbon partitioning for phototrophic production of (E)-α-bisabolene from the green microalga Chlamydomonas reinhardtii. Metab. Eng. 2018, 45, 211–222. [Google Scholar] [CrossRef]
  79. Mayfield, S.P.; Manuell, A.L.; Chen, S.; Wu, J.; Tran, M.; Siefker, D.; Muto, M.; Marin-Navarro, J. Chlamydomonas reinhardtii chloroplasts as protein factories. Curr. Opin. Biotechnol. 2007, 18, 126–133. [Google Scholar] [CrossRef] [PubMed]
  80. Zhang, Z.; Tan, Y.; Wang, W.; Bai, W.; Fan, J.; Huang, J.; Wan, M.; Li, Y. Efficient heterotrophic cultivation of Chlamydomonas reinhardtii. J. Appl. Phycol. 2019, 31, 1545–1554. [Google Scholar] [CrossRef]
  81. Shoyama, Y.; Tamada, T.; Kurihara, K.; Takeuchi, A.; Taura, F.; Arai, S.; Blaber, M.; Shoyama, Y.; Morimoto, S.; Kuroki, R. Structure and function of ∆1-tetrahydrocannabinolic acid (THCA) synthase, the enzyme controlling the psychoactivity of Cannabis sativa. J. Mol. Biol. 2012, 423, 96–105. [Google Scholar] [CrossRef] [PubMed]
  82. Bolaños-Martínez, O.C.; Urbanetz, A.; Maresch, D.; Strasser, R.; Vimolmangkang, S. Engineering Nicotiana benthamiana for production of active cannabinoid synthases via secretory pathway optimization. Biotechnol. Rep. 2025, 45, e00865. [Google Scholar] [CrossRef]
  83. Aschern, M.; Braad, J.; Milito, A.; Alzuria, D.; Yang, J.-S. A novel MoClo-mediated intron insertion system facilitates enhanced transgene expression in Chlamydomonas reinhardtii. Front. Plant Sci. 2025, 16, 1544873. [Google Scholar] [CrossRef]
  84. Jaeger, D.; Baier, T.; Lauersen, K.J. Intronserter, an advanced online tool for design of intron containing transgenes. Algal Res. 2019, 42, 101588. [Google Scholar] [CrossRef]
  85. Lumbreras, V.; Stevens, D.R.; Purton, S. Efficient foreign gene expression in Chlamydomonas reinhardtii mediated by an endogenous intron. Plant J. 1998, 14, 441–447. [Google Scholar] [CrossRef]
  86. Rose, A.B. Introns as Gene Regulators: A Brick on the Accelerator. Front. Genet. 2019, 9, 672. [Google Scholar] [CrossRef]
  87. Dementyeva, P.; Freudenberg, R.A.; Baier, T.; Rojek, K.; Wobbe, L.; Weisshaar, B.; Kruse, O. A novel, robust and mating-competent Chlamydomonas reinhardtii strain with an enhanced transgene expression capacity for algal biotechnology. Biotechnol. Rep. 2021, 31, e00644. [Google Scholar] [CrossRef] [PubMed]
  88. López-Paz, C.; Liu, D.; Geng, S.; Umen, J.G. Identification of Chlamydomonas reinhardtii endogenous genic flanking sequences for improved transgene expression. Plant J. 2017, 92, 1232–1244. [Google Scholar] [CrossRef] [PubMed]
  89. Gorman, D.S.; Levine, R. Cytochrome f and plastocyanin: Their sequence in the photosynthetic electron transport chain of Chlamydomonas reinhardi. Proc. Natl. Acad. Sci. USA 1965, 54, 1665–1669. [Google Scholar] [CrossRef] [PubMed]
  90. Kropat, J.; Hong-Hermesdorf, A.; Casero, D.; Ent, P.; Castruita, M.; Pellegrini, M.; Merchant, S.S.; Malasarn, D. A revised mineral nutrient supplement increases biomass and growth rate in Chlamydomonas reinhardtii. Plant J. 2011, 66, 770–780. [Google Scholar] [CrossRef]
  91. Harris, E.H.; Harrisduke, E.H. The Chlamydomonas Sourcebook: Introduction to Chlamydomonas and Its Laboratory Use; Elsevier Science: Amsterdam, The Netherlands, 2009; Volume 1. [Google Scholar]
  92. Dälken, B.; Jabulowsky, R.A.; Oberoi, P.; Benhar, I.; Wels, W.S. Maltose-Binding Protein Enhances Secretion of Recombinant Human Granzyme B Accompanied by In Vivo Processing of a Precursor MBP Fusion Protein. PLoS ONE 2010, 5, e14404. [Google Scholar] [CrossRef]
  93. Duong-Ly, K.C.; Gabelli, S.B. Affinity Purification of a Recombinant Protein Expressed as a Fusion with the Maltose-Binding Protein (MBP) Tag. Methods Enzym. 2015, 559, 17–26. [Google Scholar]
  94. Azevedo, F.; Pereira, H.; Johansson, B. Colony PCR. In PCR; Springer: Berlin/Heidelberg, Germany, 2017; pp. 129–139. [Google Scholar]
  95. Nouemssi, S.B.; Ghribi, M.; Beauchemin, R.; Meddeb-Mouelhi, F.; Germain, H.; Desgagné-Penix, I. Rapid and efficient colony-PCR for high throughput screening of genetically transformed Chlamydomonas reinhardtii. Life 2020, 10, 186. [Google Scholar] [CrossRef]
  96. Kindle, K.L. High-frequency nuclear transformation of Chlamydomonas reinhardtii. Proc. Natl. Acad. Sci. USA 1990, 87, 1228–1232. [Google Scholar] [CrossRef]
  97. Geissmann, Q. OpenCFU, a new free and open-source software to count cell colonies and other circular objects. PLoS ONE 2013, 8, e54072. [Google Scholar] [CrossRef]
  98. Livak, K.J.; Schmittgen, T.D. Analysis of relative gene expression data using real-time quantitative PCR and the 2−ΔΔCT method. Methods 2001, 25, 402–408. [Google Scholar] [CrossRef]
  99. Schroda, M.; Blöcker, D.; Beck, C.F. The HSP70A promoter as a tool for the improved expression of transgenes in Chlamydomonas. Plant J. 2000, 21, 121–131. [Google Scholar] [CrossRef]
Figure 1. Overview representation of cannabinoids biosynthetic pathway. Represented in red is the double-mutated soluble aromatic prenyltransferase NphBG286S/Y288A from Streptomyces sp. strain CL190 to substitute the native Cannabis sativa cannabigerolic acid synthase (CsCBGAS). Each single-headed arrow represents a unidirectional enzymatic reaction, whereas double-headed arrows indicate the potential exchange of metabolites between compartments (e.g., IPP and DMAPP shuttling between the plastid and cytosol). Highlighted in orange are enzymes involved in the Hexanoate pathway, the methylerythritol 4-phosphate (MEP) pathway in light green, and the mevalonate (MVA) pathway in brown. The non-enzymatic decarboxylation of final cannabinoids CBDA and THCA is in black. Abbreviations: AAE1, acyl activating enzyme 1; TKS, type III tetraketide synthase; OAC, olivetolic acid synthase; CBGAS, cannabigerolic acid synthase; CBDAS, cannabidiolic acid synthase; THCAS, tetrahydrocannabinolic acid synthase; DXS, deoxyxylulose-5-phosphate synthase; DXR, 1-deoxy-D-xylulose 5-phosphate reductoisomerase; MCT, 4-diphosphocytidyl-2-C-methyl-D-erythritol synthase; CMK, 4-diphosphocytidyl-2-C-methyl-D-erythritol kinase; MDS, 2-C-methyl-D-erythritol 2,4-cyclodiphosphate synthase; HDS, 4-hydroxy-3-methylbut-2-en-1-yl diphosphate synthase; HDR, 4-hydroxy-3-methylbut-2-enyl diphosphate reductase, IPPiso, isopentenyl diphosphate isomerase, GPPS, geranyl diphosphate synthase; AACT, acetoacetyl-CoA thiolase; HMGS, HMG-CoA synthase; HMGR, HMG-CoA reductase; MVK, mevalonate-5-kinase; PMK, phosphomevalonate kinase; MVD, mevalonate diphosphate decarboxylase; IPP, isopentenyl diphosphate; DMAPP, dimethylallyl-diphosphate. We have adapted this representation from [3,10,16,34].
Catalysts 16 00346 g001
Figure 2. NphB expression and co-expression with CBDAS (NphB-2A-CBDAS) in E. coli resulted in protein accumulation of both genes, but only NphB was functionally active. (A) Expression cassettes. (B) Coomassie-stained SDS gel showing the NphB protein (fused to MBP-tag ≈ 75 kDa) accumulation compared to the EV. (C) Western blot detection of NphB-2A-CBDAS (≈ 100 kDa) using HA antibody. (D) NphB in vitro enzymatic reaction leading to the synthesis of CBGA from the C–C prenylation of olivetolic acid (OA) with geranyl diphosphate (GPP). (E) CBGA concentration after in vitro enzymatic assays using NphB and NphB-2A-CBDAS protein extracts. CBGA quantification in different samples was determined using a standard curve plotted with the commercial CBGA standard used in the HPLC-DAD runs where black dots correspond to result from one replicate. EV: empty vector, MTP: Multi-Tag protein, 2A: FMDV2A. n = 3, results are shown as mean ± standard deviation; **** p < 0.0001.
Catalysts 16 00346 g002
Figure 3. Genetic constructs used in the present study. C1, the bicistronic genetic construct containing the double-mutated soluble aromatic prenyl transferase gene (NphBG286S/Y288A) from Streptomyces sp. strain CL190 [39] linked to the C. sativa’s cannabidiolic acid synthase gene (CBDAS) by the extended Foot and Mouth Disease Virus 2A (extFMDV2A) peptide sequence [59,60]. C2 is the monocistronic genetic construct harboring the NphB gene. Genes sequences of the C1 and C2 constructs were tagged in their N and C-terminal regions with Flag (F) and HA (H)-tags, respectively, and their expression was driven by the C. reinhardtii fusion promoter HSP70A-RBCS2/5′UTR (ARp) and its 3′UTR/RBCS2 terminator (T). The two constructs (C1 and C2) were cloned into the pOPt_mRuby2 vector backbone, which harbors the Hygromycin B resistance gene (aphVII) as an antibiotic selection marker [62]. C3 is the monocistronic genetic construct with the NphB gene under the regulation of C. reinhardtii strong promoter PSAD (PSADp) and PSAD terminator (T1). In construct C3, the NphB sequence was 2xFlag (2F)-tagged in the N-terminal region, and the construct was cloned into the pSL18 vector backbone harboring the paromomycin resistance gene (aphVIII) under the regulation of ARp and T as an antibiotic selection marker [63].
Catalysts 16 00346 g003
Figure 4. Relative expression of NphB and CBDAS across representative transformants normalized to histone H3 transcripts. The multiple clones tested from the PCR+ transformants generated with the genetic constructs C1, C2, and C3 show significant variation in transgene expression among clones from the same transformed cell lines. (A) C1 expression in the strain CC-125, (B) C2 expression in the strain CC-125, and (C) C3 expression in the strain CC-5415. EV: empty vector; WT: wild type. RT-qPCR data represent technical replicates (black dots n = 2) from a single biological sample and are shown as mean ± standard deviation. These data are intended to illustrate relative transcript variability among transformants rather than to provide quantitative statistical comparisons.
Catalysts 16 00346 g004
Figure 5. Expressing NphB under the PSAD regulation led to the accumulation of the protein of interest, in different strains of C. reinhardtii. Western blot (WB) detection of NphB using anti-FLAG antibody. A band at ~37 kDa corresponding to the expected size of NphB was observed in transformed lines but not in wild-type (WT) controls. The multi-tag protein (MTP) was used as a positive control for antibody detection. Additional non-specific bands are visible and likely reflect background signal from total protein extracts. (A) NphB detection in 13 clones among the 15 PCR+ clones tested from the strain CC-125. (B) NphB detection in 20 clones among the 23 PCR+ clones tested from the strain CC-1690. (C) NphB detection in 6 clones among the 13 PCR+ clones tested from the strain CC-5415.
Catalysts 16 00346 g005
Figure 6. C. reinhardtii successfully expressed the NphB transgene under the PSAD regulation, accumulating active proteins. (A) Western blot showing NphB detection in clones 12, 25, and 37, respectively, selected from strains CC-1690, 125, and 5415, compared to the negative control EV and WT, but also to clones 21 and 5, respectively selected from C1 and C2 transformants expressing NphB-2A-CBDAS and NphB under AR promoter and terminator regulation. (B) NphB in vitro enzymatic reaction leading to the synthesis of CBGA from the C–C prenylation of olivetolic acid (OA) with geranyl diphosphate (GPP). (C) CBGA concentration obtained after in vitro enzymatic assays using proteins crude extracts from the C. reinhardtii transformants expressing NphB, analyzed and quantified by HPLC-DAD using commercial CBGA standard curve. (D) HPLC-MS/MS confirmation of CBGA production generating peak areas proportional to CBGA concentration in each sample. EV: empty vector, MTP: Multi-Tag protein, WT: wild type. Enzymatic activity data represent measurements from independent biological samples (black dot n = 3), shown as mean ± standard deviation; * p < 0.05; ** p < 0.01; **** p < 0.0001.
Catalysts 16 00346 g006
Table 1. Summary of stable recombinant C. reinhardtii clones after five rounds of subculturing, collated with the PCR-positive clones and the transformants exhibiting NphB activity in vitro, leading to the synthesis of CBGA.
C. reinhardtii StrainsVectors and Resistance MarkerPromoter/TerminatorGenetic ConstructsNumber of Colonies After TransformationRandomly Selected ClonesPCR+ Clones (%)RT-qPCR+ Clones (%)Clones Tested for Protein DetectionWB+ Clones (%)NphB Active Clones (%)
CC-125pOpt_ mRuby2- APHVIIHSP70A- RBCS2/3′UTRC1≈300038421 (5.5%)12/21 (57.1%)210 (0%)0 (0%)
C2≈2000384140 (36.5%)10/12 (83.3%)920 (0%)0 (0%)
pSL18-APHVIIIPSAD/PSADC3≈200038455 (14.3%)ND1715 (88.2%)13 (86.7%)
CC-1690pSL18-APHVIIIPSAD/PSADC3≈300038473 (19%)ND2320 (82.6%)19 (95%)
CC-5415pSL18-APHVIIIPSAD/PSADC3444413 (29.5%)11/13 (84.6%)136 (46.2%)6 (100%)
Disclaimer/Publisher’s Note: The statements, opinions and data contained in all publications are solely those of the individual author(s) and contributor(s) and not of MDPI and/or the editor(s). MDPI and/or the editor(s) disclaim responsibility for any injury to people or property resulting from any ideas, methods, instructions or products referred to in the content.