Abstract
The most viable way to decarbonize aviation in the near term is through Sustainable Aviation Fuel (SAF), most of which is currently produced via the deoxygenation of fats, oils, and greases (FOG) followed by a separate isomerization step. Multifunctional zeolite-supported catalysts offer several advantages over existing formulations, such as enabling the use of waste FOG streams, performing their deoxygenation via decarboxylation/decarbonylation (deCOx), and effecting the synthesis of SAF in one-pot. Previous work has shown that while supported Ni-Cu catalysts can afford excellent results in the conversion of waste FOG to fuel-like hydrocarbons via deCOx, zeolitic materials represent promising supports in formulations employed for the synthesis of SAF. In this contribution, catalysts involving different zeolitic supports and the same Ni-Cu active phase were prepared, characterized, and tested in the conversion of brown grease to SAF to identify the carrier affording the best results. A Ni-Cu/ZSM-5 catalyst displayed the highest conversion and yield of SAF-like hydrocarbons relative to formulations supported on ZSM-22, SAPO-11, or SAPO-34 (these catalysts being referred to herein as NCZSM-5, NCZSM-22, NCSAPO-11, and NCSAPO-34).
1. Introduction
The demand for aviation fuel is expected to more than double by 2050 and triple by 2070 [1], which is of concern since aviation already accounts for 2.5% of global energy-related CO2 emissions [2]. Given that the electrification of aircraft is in its infancy, the most promising way to decarbonize aviation in the near to medium term is through the use of Sustainable Aviation Fuel (SAF), which can be produced from several feedstocks via different technologies [3]. However, the International Air Transport Association (IATA) has reported that >80% of SAF is produced via the hydroprocessing of esters and fatty acids (HEFA) [4]. Processes utilizing fats, oils, and greases (FOG) as feedstocks—such as HEFA—are expected to remain the primary way to produce SAF for the foreseeable future given the maturity and widespread use of this technology [5].
Current HEFA processes are mostly based on the hydrodeoxygenation (HDO) reaction, which displays several shortcomings. Indeed, HDO-based HEFA requires large amounts and high pressures of hydrogen, which are typically only available at centralized facilities where this gas is produced from natural gas via steam reforming. In addition, HDO-based HEFA typically employs sulfided catalysts, which risk contaminating the product with sulfur [6,7], deactivate in the presence of water (a product of HDO) [7,8], are not regenerated online [9], and require FOG feedstocks low in impurities like phosphorus, metals, and free fatty acids (FFAs) [10]. Finally, SAF production via HDO-based HEFA involves separate deoxygenation and isomerization steps that result mainly in normal and branched alkanes but not in other SAF components, namely, cycloalkanes and aromatics. (Jet fuel—a mixture of C8–C16 hydrocarbons—comprises ~20 vol.% n-alkanes, ~33 vol.% iso-alkanes, ~27 vol.% cycloalkanes, and ~20 vol.% aromatics. These hydrocarbon families, respectively, confer jet fuel a high energy density, good cold flow properties, low freezing point, and seal-swelling properties [11]). This leads to SAF production facilities having separate units to (1) pre-treat the feedstock to remove impurities; (2) hydroprocess the pre-treated feedstock to yield n-alkanes; (3) isomerize the n-alkanes to iso-alkanes; and (4) separate the SAF from other fuel fractions via distillation, all of which adds complexity and cost.
Converting FOG to fuel-like hydrocarbons via decarbonylation/decarboxylation (deCOx) can avoid the drawbacks of HDO-based HEFA since deCOx reactions require smaller amounts and lower pressures of hydrogen and deCOx catalysts are typically supported metals that can be simple (non-sulfided), inexpensive (non-precious), and robust (resistant to deactivation). Moreover, these formulations can be regenerated online and upgrade waste FOG streams rich in impurities and/or composed mainly of FFAs such as brown grease (BG) [12]—i.e., FOG collected from wastewater streams—all of which is currently incinerated or landfilled [13,14]. Another advantage of deCOx formulations is that they can involve zeolitic materials as the support of multifunctional catalysts capable of performing deoxygenation and isomerization (but also cyclization and aromatization) reactions in “one-pot” [15]. Therefore, deCOx-based technology has the potential to convert currently unutilized waste FOG streams to a product mixture containing all families of hydrocarbons comprising aviation fuel and to do so in less steps or units, which can reduce both complexity and cost.
Previous work has shown that supported metal catalysts comprising Ni and Cu in a 4:1 proportion (by weight), can afford excellent results in the conversion of BG to fuel-like hydrocarbons via deCOx [12,16]. In addition, several zeolitic materials have been studied as supports for Ni-based catalysts used in the synthesis of SAF from oleaginous biomass, promising results being obtained using SAPO-11 [17], SAPO-34 [18], ZSM-5 [19,20], and ZSM-22 [21]. However, the literature lacks systematic studies in which the nature of the active phase and the reaction conditions employed are fixed and the zeolitic support is varied to identify the carrier(s) leading to the best results in the conversion of FOG to SAF. A notable exception is the work of Wang et al., who upgraded vegetable oil over Ni-based catalysts supported on SAPO-11, ZSM-5, ZSM-22, ZSM-23, or β-zeolites and observed quantitative conversion, high isomerization activity, and decreased cracking over 8 wt.% Ni/SAPO-11, which was found to be the most promising among all catalysts studied [17]. The present contribution aimed to further address the aforementioned gap in the literature by supporting Ni and Cu in a 4:1 proportion (by weight) on several zeolitic materials and testing the resulting catalysts in the conversion of BG to SAF-like hydrocarbons via deCOx. The characterization of both fresh and spent catalysts was also undertaken to rationalize trends and elucidate structure–activity relationships.
2. Results and Discussion
2.1. Catalyst Synthesis and Fresh Catalyst Characterization
A series of catalysts involving 12 wt.% Ni-3 wt.% Cu as the supported metals and different zeolitic materials—namely, SAPO-11, SAPO-34, ZSM-5, and ZSM-22—as the carrier were prepared via incipient wetness impregnation employing the materials and methods described in Section 3.1. The synthesized catalysts were analyzed by means of inductively coupled plasma mass spectrometry (ICP-MS) to experimentally determine their metal loadings. The results of these tests, which are summarized in Table A1 within Appendix A, show that the experimental loadings obtained are close to the nominal loadings targeted.
The textural properties of the bare supports employed and of the catalysts synthesized were determined by means of N2-physisorption, the results of these measurements being included in Table 1. The data in Table 1 clearly show that the textural properties of the bare zeolitic supports vary widely. For instance, surface area, which follows the trend ZSM-22 < SAPO-11 < ZSM-5 < SAPO-34, ranges from 59.6 to 525.7 m2/g. Unsurprisingly, the surface area of the supported metal catalysts is lower than that of the bare supports, since metal deposition causes some degree of pore filling.

Table 1.
Textural properties and average NiO particle size of the catalysts used in this study.
The X-ray diffractograms of the catalysts synthesized are included in Figure A1 within Appendix A. The diffraction peaks so denoted are attributed to NiO, peaks at 37.3°, 43.3°, and 62.9°, respectively, representing its (111), (200), and (220) planes [22]. The fact that no peaks associated with Cu species were observed can be attributed to the lower Cu loading and/or to Cu species being highly dispersed, which is in agreement with previous reports on NCSAPO-11 [15]. The Scherrer equation was applied to the diffraction peak at 43.3° to determine the average NiO particle size, which afforded the values included in Table 1. The average NiO particle size ranges from 21.9 to 28.4 nm and it follows the trend NCZSM-22 < NCSAPO-11 ≈ NCSZM-5 < NCSAPO-34. Notably, the latter trend is the same as that observed for the surface area of the bare supports, which is at odds with the fact that carriers with a higher surface area would be expected to stabilize supported metals in the form of smaller particles and suggests the presence of amorphous and/or sub-nanometric Ni species not detected by means of XRD. Additional information regarding metal dispersion was acquired through H2 pulse chemisorption measurements, which resulted in the data included in Table 2. The trend observed for H2 uptake and metal-specific surface area—namely, NCSAPO-34 < NCSAPO-11 < NCSZM-5 < NCZSM-22—is also indicative of the metal dispersion trend followed by these catalysts.

Table 2.
H2 uptake, Ni-specific surface area, and total acidity of the catalysts used in this study.
More detailed information regarding the elemental composition and chemical environment of the surface of the catalysts surveyed was acquired via X-ray photoelectron spectroscopy (XPS) measurements, which were performed after reducing the catalysts using the conditions and approach described in Section 3.2. Table 3 summarizes the results of these analyses in terms of the surface concentration and oxidation state of the supported metals, while Table A2 and Table A3 in Appendix A provide more detailed information vis-à-vis the elemental surface composition and the supported metal species of the catalysts as determined via XPS. Full scans as well as Ni and Cu 2p regions of X-ray photoelectron spectra are included in Figure A2, Figure A3 and Figure A4 within Appendix A. The XPS analysis of NCSAPO-11 and NCZSM-5 clearly showed that the entirety of Ni is present in the metallic state in these two catalysts. Similarly, the low intensity of the Ni 2p3/2 satellite peak in the spectra of NCSAPO-34 and NCZSM-22 suggests that Ni is mostly reduced in these two formulations. However, the inhomogeneous character of these two samples precludes the neutralization of charging effects, which cause peak broadening and the appearance of a supplemental peak in the spectra of NCZSM-22 and NCSAPO-34, respectively, and make it impossible to accurately determine Ni0 concentration.

Table 3.
Surface concentration and oxidation state (in at.%) of supported metals as determined via XPS.
The most salient feature of the data in Table 3 is the surface concentration of the metals, which follows the trend NCSAPO-34 > NCZSM-22 >> NCSAPO-11 > NCZSM-5. However, the surface concentration of Cu0 shows a slightly different trend—namely, NCZSM-22 > NCSAPO-34 > NCZSM-5 > NCSAPO-11—which confirms that the reducibility of the surface metals varies across these catalysts. Indeed, the trend observed vis-à-vis the fraction that Cu0 represents of the total surface metal is NCSZM-5 > NCSZM-22 > NCSAPO-34 > NCSAPO-11. Admittedly, it is difficult to relate particle size information estimated from XRD, metal-specific surface area results from H2 pulse chemisorption, and surface concentration data on the supported metals derived from XPS. This can be attributed to the heterogeneity of Ni and Cu species expected to result from the deposition of these metals via impregnation on the zeolitic materials employed, since Ni and Cu can be expected to be present not only as nanoparticles but also as amorphous clusters and/or sub-nanometric species at different locations of the carriers. For instance, the fact that the Cu2O signal is observed at much higher binding energy than usual—see Table A3 and Figure A4 in Appendix A—may suggest an ionic Cu species exchanged on zeolitic Brønsted acid sites. Nevertheless, the results above provide valuable insights regarding the size of metal nanoparticles, metal-specific surface area, as well as the surface concentration and oxidation state of the supported metals.
The acidity of the catalysts used in this study was assessed by means of ammonia temperature-programmed desorption (NH3-TPD) given the importance of surface acidity to several reactions and phenomena of interest, including isomerization and cracking as well as coke-induced deactivation. In terms of total acidity, the catalysts followed the trend NCSAPO-34 > NCSAPO-11 > NCZSM-5 > NCZSM-22 (see Table 2), which is in overall agreement with previously reported acidity trends for the bare supports [23,24]. In contrast with previous reports focused on the bare supports, most acidity was found to be associated with weakly acidic sites (from which ammonia desorbs below 250 °C) albeit a smaller number of sites of medium acidity (from which ammonia desorbs between 250 and 400 °C) were also found to be present (see Figure 1). The fact that strongly acidic sites (displaying higher NH3 desorption temperatures) were not observed can be attributed to the fact that these sites would represent the main adsorption and anchor sites for metal precursors and particles, respectively. Thus, any strongly acidic sites—along with most sites of medium acidity—would be occupied during catalyst synthesis, leaving only weakly acidic sites and the relatively small number of sites of medium acidity observed.
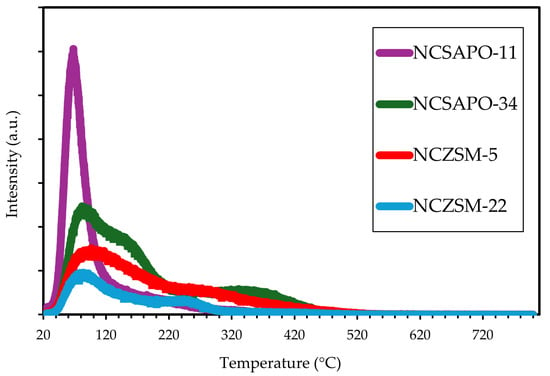
Figure 1.
NH3-TPD of the catalysts used in this study.
2.2. BG Conversion to SAF
The BG sample used in this study was analyzed via gas chromatography (GC) and found to be composed entirely of C18 and C16 FFAs as shown in Table A4 in Appendix B. This feed was upgraded over the catalysts synthesized using the equipment and methods described in Section 3.3, the experimental approach employed used for the GC analysis of both the feed and the reaction products being described in Section 3.4. The results of these upgrading experiments and analyses are summarized in Table 4. Saliently, both BG conversion and the fraction of aviation fuel-range alkanes (C8–C16 hydrocarbons) in the reaction products follow the trend NCSAPO-11 < NCSAPO-34 < NCZSM-5 ≈ NCZSM-22, which suggests that 12 wt.% Ni-3 wt.% Cu catalysts supported on the socony mobil zeolites tested afford better results that the corresponding formulations involving the silicoaluminophospate zeotypes essayed. Parenthetically, the inferior conversion of NCSAPO-11 is likely not due to its relatively low concentration of surface Ni0 and Cu0 (see Table 3), which represent the active sites for the deCOx reactions. Indeed, NCZSM-5 affords quantitative conversion despite displaying a slightly lower concentration of Ni0 than NCSAPO-11 and the second lowest concentration of Cu0 of all catalysts tested. Similarly, differences in conversion cannot be assigned to the surface Ni0/Cu0 concentrations of these catalysts, since the ratios for NCSAPO-11 and NCZSM-5 are 10.5 and 3.0, respectively. Instead, differences in conversion can be attributed—at least in part—to the propensity of these formulations towards fouling and coking (see Section 2.3). ZSM-supported catalysts also afford better results than SAPO-supported formulations in terms of the selectivity to the hydrocarbon families comprising aviation fuel, since the catalyst supported on SAPO-11 and SAPO-34 displayed almost identical selectivity of ~88.5% n-alkanes, ~7.5% iso-alkanes, ~2.5% cycloalkanes, and ~1.5% aromatics. In contrast, the catalysts supported on ZSM-5 and ZSM-22 showed lower selectivity to n-alkanes and higher selectivity to the other hydrocarbon families comprising aviation fuel. Among these, NCZSM-5 afforded the highest selectivity to iso-alkanes and cycloalkanes, as well as a yield of aromatics within the 8–25% specified for aviation fuel [25].

Table 4.
Results of BG conversion to SAF over the catalysts used in this study.
To elucidate the fate of the oxygen atoms in the BG feed, the gas stream produced during the upgrading of BG over NCZSM-5 was analyzed with a refinery gas analyzer (RGA) and found to contain 0.45% CO and 0.26% CO2 as the only oxygen-bearing compounds, which is unsurprising since deoxygenation proceeds via deCOx. The other compounds detected by the RGA were hydrogen (the reaction atmosphere) and C1–C6 hydrocarbons resulting from COx methanation and/or the cracking of alkyl chains, which is consistent with previous reports [26].
Figure 2 shows the carbon number distribution of the product mixtures resulting from upgrading experiments. Irrespective of the catalyst support employed, most hydrocarbon products were found to be within the C8–C16 range characteristic of aviation fuel (with the remainder being ≥C17 hydrocarbons). However, SAPO-supported catalysts show noticeable differences in terms of the carbon number of the reaction products relative to those obtained over ZSM-supported formulations. Indeed, NCSAPO-11 and NCSAPO-34 yield a considerable and comparable amount of C15 and C11 hydrocarbons, these two carbon numbers representing the most abundant among the products obtained over these catalysts. In contrast, NCZSM-5 and NCZSM-22 afford much lower amounts of C15, since lighter (≤C13) hydrocarbons are favored among which C10 hydrocarbons are the most abundant.
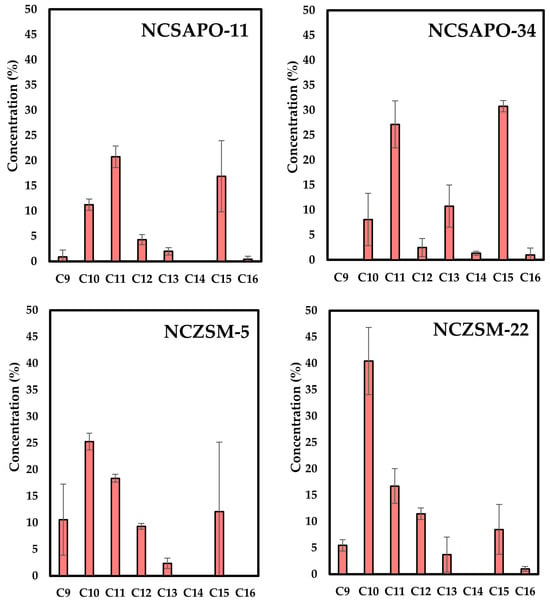
Figure 2.
Carbon number of the reaction products resulting from upgrading BG over the catalysts used in this study.
These results cannot be readily explained by the relative acidity of the supports favoring cracking reactions—since ZSM-supported catalysts have a total acidity that is either slightly (NCZSM-5) or much lower (NCZSM-22) than SAPO-supported formulations—albeit this can be attributed to the fact that most of the acid sites in these supports are either weakly or moderately acidic (see Figure 1) with a relatively low activity towards C-C cleavage [27,28]. Instead, these results can be rationalized by invoking the metal-specific surface area of ZSM-supported catalysts, which is much higher than that of their SAPO-supported counterparts (see Table 2). Indeed, it can be argued that a higher concentration of surface metal sites would increase the metal-catalyzed hydrogenolysis of C–C bonds, which in turn would favor the formation of lighter—at the expense of heavier—hydrocarbons. The relatively low concentration of surface Ni0 within NCSAPO-11 can only partially explain the lower cracking activity of this catalyst, since NCZSM-5 displays a slightly lower concentration of surface Ni0 (see Table 4). In addition to the aforementioned heterogeneity of Ni and Cu species, the lack of a consistent trend in this regard can also be attributed to the relative distribution of these metals on the catalyst surface, since C–C hydrogenolysis reactions require contiguous Ni atoms to be catalyzed [29] and Cu can disrupt Ni adjacency [30], curbing cracking reactions through both geometric and electronic effects [12,30,31,32]. However, the ability of Cu to disrupt Ni adjacency and cracking reactions appears to be limited in these catalysts, since NCSAPO-11 displays a lower cracking activity than NCZSM-5 despite having a much higher surface Ni0/Cu0 concentration ratio (10.5 vs. 3.0).
Given that the results in Table 4 preclude the identification of NCSZM-5 or NCZSM-22 as the most active catalyst (since both formulations afforded quantitative conversion), upgrading experiments were performed in which the amount of BG employed was doubled relative to that specified in Section 3.3. The results of these experiments are summarized in Table A5 in Appendix B. Surprisingly, both catalysts displayed quantitative BG conversion and practically identical selectivity to C8–C16 hydrocarbons under these conditions. An additional effort was made to identify the most active formulation between NCSZM-5 or NCZSM-22 by halving the amount of catalyst relative to the amount used in the experiments that afforded the data in Table A5. However, conversion remained quantitative, which suggests that testing these catalysts in a fixed-bed reactor, which would allow for additional variables (such as space velocity and time on stream) to be investigated—represents a better approach to enable this comparison. Previous reports on the upgrading of BG over supported Ni-Cu catalysts indicate that fixed-bed reactor experiments are also the best was to study catalyst stability and recyclability [12]; however, those experiments fall outside of the scope of this work and will be the focus of a future contribution.
2.3. Spent Catalyst Characterization
In an effort to rationalize the results of BG upgrading to SAF, the spent catalysts were analyzed by means of thermogravimetric analysis (TGA). Indeed, TGA offers a way to determine the amount of type of the carbonaceous deposits that accumulate on the catalyst surface in the course of the reaction, which can in turn serve as a gauge for the catalyst deactivation caused by fouling and coking. Parenthetically, coking and fouling represent the main deactivation mechanism for supported Ni-Cu catalysts used for the conversion of oleaginous biomass to fuel-like hydrocarbons, since metal loss due to leaching or even the formation of volatile carbonyls has been found to be negligible [12,15]. The results of these TGA measurements are summarized in Figure 3. Saliently, the spent NCSAPO-11 catalyst displayed the most significant weight loss (~18%), which suggests that fouling and coking could explain (at least in part) the fact that it shows the lowest BG conversion among all catalysts tested. NCSAPO-11 is unique in the sense that it represents the only spent formulation displaying considerable weight losses below 400 °C—which can be assigned to the removal of residual solvent, reactants, products as well as soft coke—as well as weight losses above the same temperature that can be attributed to the combustion of hard coke or graphitic carbon [33]. Indeed, spent NCSAPO-34 displays the vast majority of its weight loss below 400 °C, whereas spent NCZSM-5 and NCZSM-22 undergo most of their weight loss above this temperature.
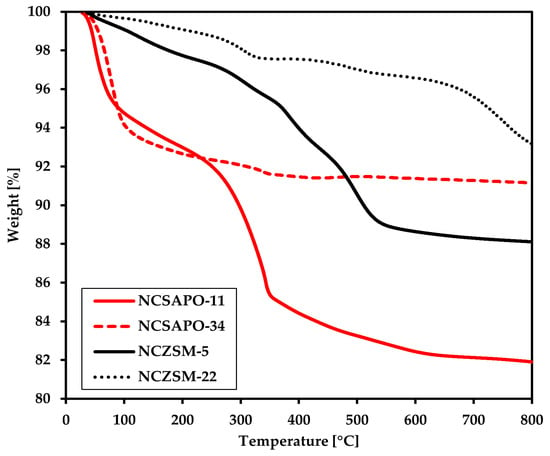
Figure 3.
TGA of the spent catalysts recovered from the experiments affording the data in Table 2.
In short, it can be argued that coking and fouling can only be invoked to explain catalytic activity when the catalyst displays both a relatively low surface area and a high propensity for coking as is the case for NCSAPO-11. All other formulations display a moderate degree of coking (like NCZSM-22), a relatively high surface area (like NCSAPO-34), or both (as is the case for NCZSM-5). The analysis by means of TGA of the catalysts spent in the experiments resulting in the data within Table A5 seems to corroborate this conclusion, since the weight loss spent NCZSM-22 and NCZSM-5 displayed, respectively, remained unchanged and increased only slightly (see Figure A5 in Appendix B) with no impact on conversion. Lastly, it should be noted that the TGA results can only be partially explained invoking acidity. Indeed, the least acidic catalysts—namely, NCZSM-22—displays the lowest degree of fouling and coking as would be expected. However, the extent of coking and fouling observed for the other catalysts does not show a linear relationship with acidity, which suggests that other variables (like the concentration and relative distribution of Ni and Cu on the catalyst surface) are at play.
2.4. Catalyst Recycling Studies
The recyclability of the catalyst that afforded the most promising results—i.e., NCZSM-5 (see Section 2.2)—was assessed by testing this catalyst in five sequential BG upgrading reactions. Between reactions, the spent catalyst was regenerated through a procedure comprising a calcination step under static air (to remove carbonaceous deposits from the spent catalyst surface) and a reduction step identical to the one used before the first upgrading reaction (to re-reduce the supported metals oxidized during the calcination step). The results of these experiments are summarized in Figure 4.
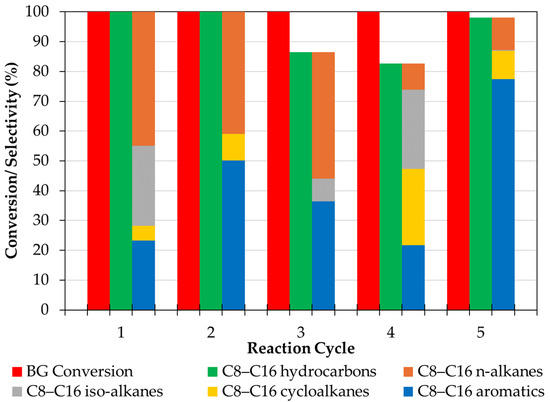
Figure 4.
Results of recycling studies performed using NCZSM-5.
Notably, BG conversion remained quantitative across all reaction cycles. Interestingly, the selectivity to C8–C16 hydrocarbons was 100% in cycles 1 and 2, dropped to 86.5 and 82.7% in cycles 3–4 (due to the formation of oxygenates and C19 hydrocarbons) and increased to 98% in cycle 5 (since much less oxygenates and no C19 hydrocarbons were produced in this last cycle). Parenthetically, the oxygenates detected in some products mixtures were aldehydes, alcohols, ethers, and ketones, which are produced in small amounts via the incomplete deoxygenation of FFAs in BG and through condensation reactions involving oxygenated intermediates. Finally, Figure 4 also shows how the selectivity to the different hydrocarbon families comprising jet fuel (n-alkanes, iso-alkanes, cyclo-alkanes, and aromatics) varied significantly across cycles.
To rationalize these results, the post-mortem of the NCZSM-5 catalyst recovered at the end of the recycling experiments was performed focusing on Ni-specific metal active sites and on surface acid sites associated with the zeolitic support. H2 pulse chemisorption results showed that the metal-specific surface area of the catalyst dropped from 1.414 m2/g in the fresh catalyst to 0.004 m2/g in the catalyst recovered at the end of the recycling experiments, which clearly indicates a loss of metal sites likely due to metal sintering and coking. Similarly, NH3-TPD measurements indicate that the total acidity of the catalyst dropped from 1.44 mmol NH3/g on the fresh catalyst to 0.59 mmol NH3/g on the catalyst recovered at the end of the recycling experiments, which is indicative of a loss of acid sites attributable to the accumulation of recalcitrant coke deposits.
The results of recycling studies and of the post-mortem catalyst characterization suggests that metal sites within NCZSM-5 have a very high intrinsic activity, since conversion remained quantitative despite the loss of most metal sites. Moreover, changes in the amount of metal active sites and surface acid sites are in line with the changes in selectivity observed during the recycling studies, since structural changes are bound to affect the performance of the catalyst in cracking, isomerization, cyclization, and aromatization reactions. In short, although these studies show the recycling stability of the catalyst in terms of conversion, the results also show variance in terms of selectivity, clearly indicating the direction of future work. However, the latter falls outside of the scope of the present contribution and will be the focus of future studies.
3. Materials and Methods
3.1. Catalyst Synthesis
Catalysts were prepared via incipient wetness impregnation—using Ni(NO3)2·6H2O (Alfa Aesar, Ward Hill, MA, USA) and Cu(NO3)2·3H2O (Sigma Aldrich, St. Louis, MO, USA) as metal precursors and SAPO-11 (6% SiO2, 48% Al2O3; ACS MATERIAL, Pasadena, CA, USA), SAPO-34 (~0.5 SiO2/Al2O3 molar ratio; ACS MATERIAL), ZSM-5 (30 SiO2/Al2O3 molar ratio; Zeolyst, Kansas City, KS, USA), or ZSM-22 (65–80 SiO2/Al2O3 molar ratio; ACS MATERIAL) as the support—targeting a Ni loading of 12 wt.% and a Cu loading of 3.0 wt.%. After drying under vacuum overnight at 60 °C, the catalysts were calcined at 500 °C for 3 h in static air.
3.2. Fresh Catalyst Characterization
The fresh catalysts prepared were characterized using previously described equipment and methods for ICP [34], N2 physisorption [35], XRD [32], NH3 TPD [36], H2 pulse chemisorption [36], and XPS [15,32,37]. Briefly, ICP was performed using a Varian 720-ES analyzer (Agilent Technologies, Santa Clara, CA, USA), while XRD was carried out on a Phillips X’Pert diffractometer (Philips Analytical, Almelo, The Netherlands) with Cu Kα radiation at 0.02° step size. NH3 TPD and H2 pulse chemisorption experiments were performed on an Autochem II analyzer (Micromeritics, Norcross, GA, USA) outfitted with a thermal conductivity detector (TCD) and a Thermostar mass spectrometer (Pfeiffer, Aßlar, Germany). For each experiment, 250 mg of catalyst was loaded into a U-tube quartz reactor connected to the instrument and heated by a clamshell oven. Prior to analysis, the catalyst was reduced at 350 °C for 1 h under 10% H2/Ar. For NH3 TPD, after cooling the reduced catalyst to 30 °C, the sample was exposed to a flow (100 sccm) of 1% NH3/N2 for an hour before purging with a flow (100 sccm) of Ar for another hour to remove physisorbed NH3. The sample was then heated to 500 °C at a rate of 10 °C/min while NH3 desorption was monitored using the mass spectrometer signal at m/z = 16. For H2 pulse chemisorption, after reduction the reactor was purged with Ar at 450 °C for 30 min and cooled to 45 °C. Pulses of 0.025mL (STP) H2 were then introduced to the reactor in 3 min intervals using Ar (50 sccm) as carrier gas, the TCD being employed to monitor H2 breakthrough. Pulses were continued until the amount of breakthrough H2 detected via TCD became constant. For XPS analyses, catalysts were reduced under a flow of H2 at 350 °C for 3 h in a pre-treatment chamber connected to the instrument and allowing the transfer of pre-treated samples into the XPS analysis chamber without exposure to air. XPS was performed using a PHI 5000 Versaprobe—Physical Electronics (Chanhassen, MN, USA)–apparatus using a monochromatic Al Kα1 X-Ray source with energy of 1486.6 eV, accelerating voltage of 15 kV, power of 50 W, and spot size diameter of 200 μm. Spectra were processed using the CasaXPS software package (version 2.3.25PR1.0).
3.3. Catalyst Testing for BG Conversion to SAF
Catalyst testing was conducted in a 100 mL stainless steel reactor—Autoclave Engineers (Erie, PA, USA)—operated in semi-batch mode. After placing 0.5 g of the formulation to be tested in the reactor, closing the latter, and purging the system with Argon, the catalyst was reduced at 350 °C for 3 h under 100 psi and a flow (60 sscm) of 10% H2 in N2. Subsequently, the reactor was allowed to cool down to room temperature and the system was purged with Argon. Then, a solution comprising 1.8 g of BG—which was produced by “Greasezilla™” a product of Downey Ridge Environmental Company (Lansing, WV, USA) and has the composition in Table A4 within Appendix B—dissolved in 22.75 g of dodecane (99+% Sigma Aldrich) was introduced to the reactor through a port in the reactor head using a needle connected to a syringe containing the feed. After sealing the reactor, Argon was replaced with H2, which was used to pressurize the system to 580 psi and establish a flow of 60 sccm using a backpressure regulator and a mass flow controller, respectively. The reaction mixture was then heated to 375 °C and kept at said temperature for 3 h under constant mechanical stirring (1000 rpm). All experiments were performed in duplicate to ascertain both reproducibility and the statistical significance of the results.
3.4. Analysis of BG and Its Catalytic Upgrading Products
The identity and quantity of all compounds comprising the BG feed employed and the liquid products stemming from its catalytic upgrading were determined via dual detection GC using instrumentation and methods described in detail in a previous contribution [38]. Briefly, analyses were performed using an Agilent 7890A GC (Santa Clara, CA, USA) equipped with both MS and flame ionization detectors. The inlet was operated in split mode (split ratio 25:1; split flow 50 mL/min) using an initial temperature of 100 °C. The inlet temperature was increased immediately upon injection (at a rate of 8 °C/min) to a final temperature of 320 °C, which was maintained for the duration of the analysis. The initial oven temperature (45 °C) was increased upon injection first to 325 °C (at a rate of 4 °C/min) and then to 400 °C (at a rate of 10 °C/min). This temperature was then maintained for 12.5 min, making the total run time 90 min. An Agilent J&W DB-5HT column (30 m × 250 μm × 0.1 μm) rated to 450 °C was employed along with a constant He flow of 2 mL/min. Quantification was performed using cyclohexanone as internal standard. Agilent Chemstation and Separation Systems Inc. (Gulf Breeze, FL, USA). SimDis Expert 9 software were used to perform chromatographic programming and to process the chromatographic data acquired. Solvents (i.e., chloroform and dodecane) were quenched and subtracted prior to data processing. A representative chromatogram—corresponding to the liquid products stemming from the upgrading of BG over NCZSM-5—is provided in Appendix C as Figure A6. In addition, a table including the retention time (RT) of each peak in this chromatogram along with its corresponding compound name, compound carbon number (CN), and percent area under the curve (% AUC) is provided in the same appendix as Table A6.
3.5. Spent Catalyst Characterization
Spent catalysts were subjected to TGA using a Discovery Q500 thermogravimetric analyzer—TA Instruments (New Castle, DE, USA)—after being dried in a vacuum at 60 °C overnight to remove water. Dried spent catalysts held in a platinum TGA pan were heated from room temperature to 800 °C at a rate of 10 °C/min under a flow (50 sccm) of air.
3.6. Catalyst Recycling Studies
Recycling studies were performed using NCZSM-5, the most promising formulation identified in catalyst testing runs. After each upgrading reaction, the spent catalyst was recovered via filtration, rinsed with chloroform, dried at 60 °C overnight in a vacuum oven, and calcined under static air at 450 °C for 5 h using a muffle furnace to remove carbonaceous deposits (see Figure 3). The calcined catalyst was then subjected to the same catalyst testing procedure described in Section 3.3, adjusting the amount of feed employed to keep the catalyst–feed ratio constant for five reaction cycles.
4. Conclusions
In this study, catalysts comprising Ni and Cu supported on various zeolitic carriers were synthesized, characterized, and evaluated for the conversion of BG to SAF. Among the tested formulations, a 12.8% Ni-3.2% Cu/ZSM-5 (NCZSM-5) catalyst exhibited the highest BG conversion and selectivity to SAF-like hydrocarbons. Specifically, the NCZSM-5 catalyst achieved a BG conversion of 99.9% and a jet fuel yield of 87.3%. Moreover, NCZSM-5 afforded SAF-range products containing n-alkanes, iso-alkanes, cycloalkanes, and aromatics, all integral components of aviation fuel. The results obtained compare favorably to those recently reported by Ritmun. Indeed, this author also found that a 12.5% Ni-2.5% Cu/ZSM-5 catalyst displayed the best results among a series of Ni-Cu formulations supported on various zeolites—including SAPO-11 and ZSM-5—in the conversion of palm oil to SAF [39]. A notable difference is that while palm oil is an edible feedstock composed almost entirely of triglycerides, BG is a waste stream that is typically incinerated or landfilled and is 100% FFAs. The latter is significant, as current HEFA technology typically avoids feedstocks with FFA levels exceeding 25% [40]. This highlights the potential of BG as a viable and underutilized resource for SAF production.
Additionally, this study addressed a gap in the literature by systematically varying the zeolitic support while using the same active phase and reaction conditions in the conversion of BG to SAF. The findings demonstrate that ZSM-5 offers superior performance relative to other supports tested, including SAPO-11, SAPO-34, and ZSM-22. This contrasts with the results of Wang et al., who found that SAPO-11 led to the best results when they upgraded vegetable oil over Ni-based catalysts supported on SAPO-11, ZSM-5, ZSM-22, ZSM-23, or β-zeolites [17].
Overall, the results presented herein provide valuable insights into catalyst design for SAF production from FOG. Particularly, they underscore the role of zeolitic supports in optimizing performance and suggest that the latter may be dependent on the nature of the active phase and/or the feedstock employed.
Author Contributions
Conceptualization, E.S.-J. and R.P.; methodology, E.S.-J. and R.P.; validation, C.M., G.U. and T.S.C.; formal analysis, C.M., G.U., T.S.C. and O.H.; investigation, C.M., G.U., T.S.C. and O.H.; resources, G.C.; data curation, C.M., G.U., T.S.C. and O.H.; writing—original draft preparation, E.S.-J. and T.S.C.; writing—review and editing, R.P., G.U., G.C. and O.H.; visualization, E.S.-J. and T.S.C.; supervision, E.S.-J. and R.P.; project administration, E.S.-J.; funding acquisition, E.S.-J. All authors have read and agreed to the published version of the manuscript.
Funding
This material is based upon work supported by the National Science Foundation under Grant No. 1922694. This project was also supported in part by the UKinSPIRE (Seeding Partnerships for International Research Engagement) initiative, an internal seed funding program jointly administered by the University of Kentucky International Center and Office of the Vice President for Research. This publication was also supported by the University of Kentucky Energy Research Priority Area. The part of this research performed at the Laboratoire Interdisciplinaire Carnot de Bourgogne of the Université de Bourgogne Europe was funded by the Graduate School EIPHI (Contract ANR-17-EURE-0002).
Data Availability Statement
The original contributions presented in this study are included in the article. Further inquiries can be directed to the corresponding author.
Acknowledgments
The authors would like to thank Brian Levine, Macy Shelton, and Nicholas Clark for the sample of BG employed in this study, which was produced by “Greasezilla™” a product of Downey Ridge Environmental Company.
Conflicts of Interest
The authors declare no conflicts of interest. The funders had no role in the design of the study; in the collection, analyses, or interpretation of data; in the writing of the manuscript; or in the decision to publish the results.
Abbreviations
The following abbreviations are used in this manuscript:
| AUC | Area under the curve |
| BG | Brown Grease |
| CN | Carbon number |
| DeCOx | Decarbonylation/decarboxylation |
| FFAs | Free Fatty Acids |
| FOG | Fats, Oils, and Greases |
| GC | Gas chromatography |
| HDO | Hydrodeoxygenation |
| HEFA | Hydroprocessing of esters and fatty acids |
| IATA | International Air Transport Association |
| ICP | Inductively Coupled Plasma |
| MS | Mass Spectrometry |
| NA | Not applicable |
| NAD | Not accurately determinable |
| NCSAPO-11 | 12 wt.% Ni-3 wt.% Cu/SAPO-11 (nominal loadings) |
| NCSAPO-34 | 12 wt.% Ni-3 wt.% Cu/SAPO-34 (nominal loadings) |
| NCZSM-5 | 12 wt.% Ni-3 wt.% Cu/ZSM-5 (nominal loadings) |
| NCZSM-22 | 12 wt.% Ni-3 wt.% Cu/ZSM-22 (nominal loadings) |
| RGA | Refinery gas analyzer |
| RT | Retention time |
| SAF | Sustainable Aviation Fuel |
| SAPO | Silicoaluminophosphate |
| TCD | Thermal conductivity analysis |
| TGA | Thermogravimetric analysis |
| TPD | Temperature programmed desorption |
| XPS | X-ray photoelectron spectroscopy |
| XRD | X-ray diffraction |
| ZSM | Zeolite Socony Mobil |
Appendix A

Table A1.
Experimental loading determined via ICP-MS of the catalysts used in this study.
Table A1.
Experimental loading determined via ICP-MS of the catalysts used in this study.
| Catalyst | Ni (%) | Cu (%) |
|---|---|---|
| NCSAPO-11 | 12.8 ± 0.4 | 3.3 ± 0.1 |
| NCSAPO-34 | 12.0 ± 0.1 | 3.0 ± 0.0 |
| NCZSM-5 | 12.8 ± 0.1 | 3.2 ± 0.0 |
| NCZSM-22 | 13.2 ± 0.1 | 2.9 ± 0.1 |

Table A2.
Elemental surface composition of the catalysts employed in this study determined via XPS (at%).
Table A2.
Elemental surface composition of the catalysts employed in this study determined via XPS (at%).
| Catalyst | C | O | P | Si | Al | Ni | Cu |
|---|---|---|---|---|---|---|---|
| NCSAPO-11 | 7.61 | 40.38 | 3.41 | 14.14 | 32.83 | 1.05 | 0.59 |
| NCSAPO-34 | 2.87 | 18.69 | 2.87 | 0 | 68.99 | 5.2 | 1.39 |
| NCZSM-5 | 3.21 | 46.85 | 0 | 31.9 | 16.55 | 1.02 | 0.46 |
| NCZSM-22 | 7.07 | 15.86 | 3.44 | 10.11 | 57.17 | 5.17 | 1.17 |

Table A3.
Area of XPS peaks representing supported metal species (at.%) and their respective binding energies.
Table A3.
Area of XPS peaks representing supported metal species (at.%) and their respective binding energies.
| Catalyst | Metal Species (%) [Binding Energy (eV)] | |||||
|---|---|---|---|---|---|---|
| Ni0 | NiO | Cu0 | CuO | Cu2O | Cu (Cu0) | |
| NCSAPO-11 | 100 [852.64] | 0 [NA] | 18.1 [934.23] | 80.6 [936.96] | 0 [N/A] | 1.29 [946.77] |
| NCSAPO-34 | NAD [852.81] | NAD [NA] | 41.28 [932.51] | 0 [N/A] | 58.72 [937.22] | 0 [N/A] |
| NCZSM-5 | 100 [852.67] | 0 [NA] | 73.83 [933.76] | 0 [N/A] | 26.17 [934.24] | 0 [N/A] |
| NCZSM-22 | NAD [852.72] | NAD [NA] | 68.29 [931.79] | 0 [N/A] | 31.71 [934.22] | 0 [N/A] |
NAD: Not accurately determinable. NA: Not applicable.
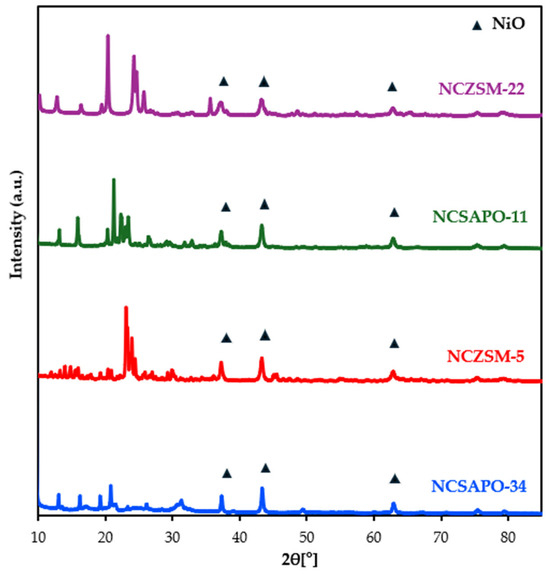
Figure A1.
X-ray diffractograms of surveyed catalysts.
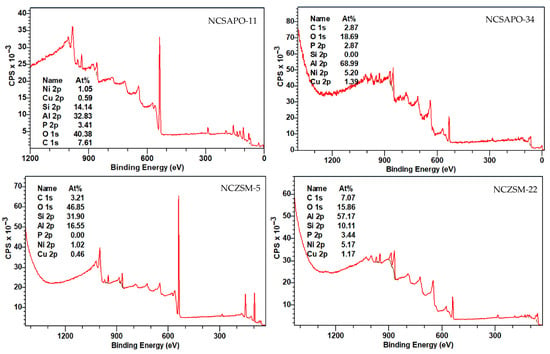
Figure A2.
Full scan X-ray photoelectron spectra of surveyed catalysts.
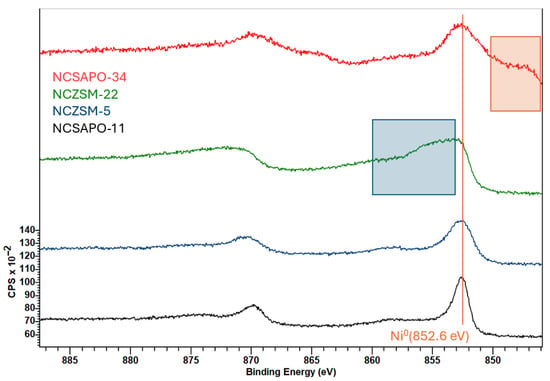
Figure A3.
Ni 2p X-ray photoelectron spectra of surveyed catalysts. The orange and blue boxes, respectively, highlight a supplementary peak and peak broadening stemming from the inhomogeneous character of the samples precluding the neutralization of charging effects.
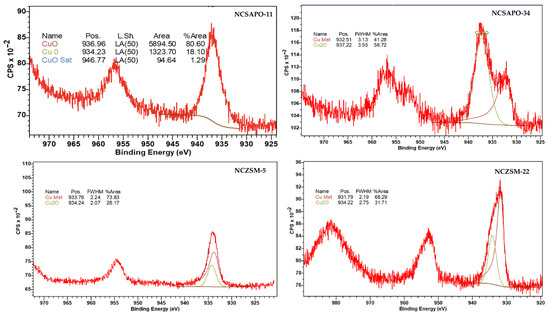
Figure A4.
Cu 2p X-ray photoelectron spectra of surveyed catalysts.
Appendix B

Table A4.
Composition of the BG used in this study.
Table A4.
Composition of the BG used in this study.
| Fatty Acid | Concentration (%) |
|---|---|
| Oleic acid (C18:1) | 61.1 |
| Stearic acid (C18:0) | 22.5 |
| Palmitic acid (C16:0) | 15.1 |
| Linoleic acid (C18:2) | 1.2 |

Table A5.
Results of BG conversion to SAF over the catalysts used in this study when twice the amount of BG relative to that specified in Section 3.3 was employed.
Table A5.
Results of BG conversion to SAF over the catalysts used in this study when twice the amount of BG relative to that specified in Section 3.3 was employed.
| Catalyst | Conversion (%) | C8–C16 Hydrocarbons (%) | Selectivity (%) |
|---|---|---|---|
| NCZSM-5 | 99.9 ± 0.0 | 79.1 ± 3.7 | C8–C16 n-alkane: 58.4 ± 17.1 |
| C8–C16 iso-alkane: 10.7 ± 2.2 | |||
| C8–C16 cycloalkane: 0.4 ± 0.5 | |||
| C8–C16 aromatic: 28.5 ± 14.1 | |||
| NCZSM-22 | 99.8 ± 0.3 | 79.2 ± 4.1 | C8–C16 n-alkane: 71.3 ± 10.4 |
| C8–C16 iso-alkane: 8.3 ± 2.0 | |||
| C8–C16 cycloalkane: 2.1 ± 1.6 | |||
| C8–C16 aromatic: 17.2 ± 9.3 |
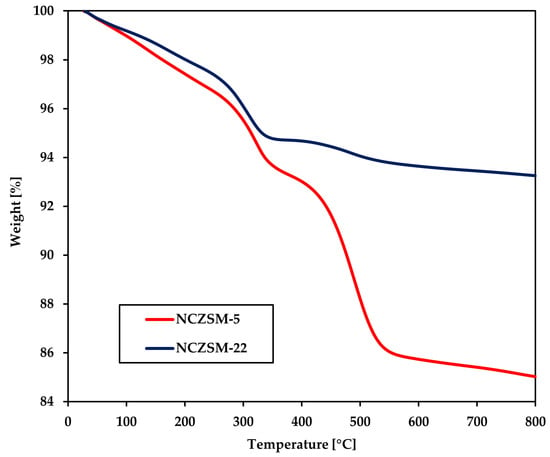
Figure A5.
TGA of the spent catalysts recovered from the experiments affording the data in Table A5.
Appendix C

Figure A6.
Chromatogram of the liquid products stemming from the upgrading of BG over NCZSM-5.

Table A6.
Retention time (RT), compound name, compound carbon number (CN), and percent area under the curve (% AUC) of the chromatogram in Figure A6.
Table A6.
Retention time (RT), compound name, compound carbon number (CN), and percent area under the curve (% AUC) of the chromatogram in Figure A6.
| RT | Compound Name | CN | % AUC |
|---|---|---|---|
| 2.134 | 3,5 dimethyl cyclohexene | C8 | 1.022 |
| 2.164 | 1 methyl 4 methylene cyclohexane | C8 | 0.414 |
| 2.206 | methyl ethyl cyclopentene | C8 | 2.231 |
| 2.545 | 4 methyl octane | C9 | 4.259 |
| 2.615 | p-xylene | C8 | 8.029 |
| 3.371 | 3,3,5 trimethyl cyclohexane | C9 | 1.214 |
| 3.878 | propyl benzene | C9 | 1.499 |
| 4.071 | 1 ethyl 3 methyl benzene | C9 | 6.17 |
| 4.142 | 3,5 dimethyl octane | C10 | 1.158 |
| 4.267 | 3 methyl nonane | C10 | 1.684 |
| 4.687 | 1,2,3 trimethyl benzene | C9 | 2.235 |
| 4.903 | decane | C10 | 35.813 |
| 5.989 | 1,2 diethyl benzene | C10 | 0.437 |
| 6.071 | 1 methyl 3 propyl benzene | C10 | 1.219 |
| 6.18 | 1 methyl 4 propyl benzene | C10 | 1.954 |
| 6.335 | 5 methyl decane | C11 | 0.441 |
| 6.433 | 4 methyl decane | C11 | 0.558 |
| 6.559 | 2 methyl decane | C11 | 0.599 |
| 6.71 | 3 methyl decane | C11 | 1.116 |
| 6.943 | 2 ethyl 1,4 dimethyl benzene | C10 | 1.296 |
| 7.556 | undecane | C11 | 7.825 |
| 9.208 | 5 ethyl decane | C12 | 4.543 |
| 9.336 | 4 methyl undecane | C12 | 3.241 |
| 9.499 | 2 methyl undecane | C12 | 3.657 |
| 9.679 | 3,8 dimethyl decane | C12 | 3.803 |
| 11.092 | 2,6 dimethyl undecane | C13 | 1.63 |
| 13.135 | 2 methyl naphtalene | C11 | 0.476 |
| 13.766 | tridecane | C13 | 0.473 |
| 18.569 | 4 methyl tetradecane | C15 | 0.268 |
| 19.799 | pentadecane | C15 | 0.515 |
| 25.319 | hexadecane | C16 | 0.221 |
References
- Grim, R.G.; Tao, L.; Abdullah, Z.; Cortright, R.; Oakleaf, B. The Challenge Ahead: A Critical Perspective on Meeting U.S. Growth Targets for Sustainable Aviation Fuel. Available online: https://www.nrel.gov/docs/fy24osti/89327.pdf (accessed on 3 March 2025).
- Aviation. Available online: https://www.iea.org/energy-system/transport/aviation (accessed on 4 March 2025).
- Conversion Processes. Available online: https://www.icao.int/environmental-protection/GFAAF/Pages/Conversion-processes.aspx (accessed on 3 March 2025).
- Energy Transition. Available online: https://www.iata.org/contentassets/f9f1f10a29524cf68326605e9982bb8d/energy-transition-hemant-mistry-gmd2022.pdf (accessed on 3 March 2025).
- SAF Grand Challenge Roadmap. Available online: https://www.energy.gov/sites/default/files/2022-09/beto-saf-gc-roadmap-report-sept-2022.pdf (accessed on 4 March 2025).
- Zuo, H.; Liu, Q.; Wang, T.; Ma, L.; Zhang, Q.; Zhang, Q. Hydrodeoxygenation of Methyl Palmitate over Supported Ni Catalysts for Diesel-like Fuel Production. Energy Fuels 2012, 26, 3747–3755. [Google Scholar] [CrossRef]
- Peng, B.; Yuan, X.; Zhao, C.; Lercher, J.A. Stabilizing Catalytic Pathways via Redundancy: Selective Reduction of Microalgae Oil to Alkanes. J. Am. Chem. Soc. 2012, 134, 9400–9405. [Google Scholar] [CrossRef]
- Laurent, E.; Delmon, B. Influence of water in the deactivation of a sulfided NiMoγ-Al2O3 catalyst during hydrodeoxygenation. J. Catal. 1994, 146, 281–291. [Google Scholar] [CrossRef]
- Dufresne, P. Hydroprocessing catalysts regeneration and recycling. Appl. Catal. A Gen. 2007, 322, 67–75. [Google Scholar] [CrossRef]
- Pérez-Rangel, N.; Coronado, C.; Ancheyta, J. Approaches to conditioning of vegetable oil feedstock for hydrotreating to produce renewable diesel. Fuel 2025, 383, 133897. [Google Scholar] [CrossRef]
- Díaz-Pérez, M.A.; Serrano-Ruiz, J.C. Catalytic Production of Jet Fuels from Biomass. Molecules 2020, 25, 802. [Google Scholar] [CrossRef] [PubMed]
- Loe, R.; Lavoignat, Y.; Maier, M.; Abdallah, M.; Morgan, T.; Qian, D.; Pace, R.; Santillan-Jimenez, E.; Crocker, M. Continuous Catalytic Deoxygenation of Waste Free Fatty Acid-Based Feeds to Fuel-Like Hydrocarbons over a Supported Ni-Cu Catalyst. Catalysts 2019, 9, 123. [Google Scholar] [CrossRef]
- 2017 Project Peer Review. Available online: https://www.energy.gov/eere/bioenergy/peer-review-2017 (accessed on 2 March 2025).
- Biofuels and Bioproducts from Wet and Gaseous Waste Streams: Challenges and Opportunities. Available online: https://www.energy.gov/sites/default/files/2017/09/f36/biofuels_and_bioproducts_from_wet_and_gaseous_waste_streams_full_report.pdf (accessed on 3 March 2025).
- Umenweke, G.C.; Pace, R.B.; Metais, M.; Heintz, O.; Caboche, G.; Santillan-Jimenez, E. Continuous conversion of tall oil over Ni-Cu/SAPO-11 to a sustainable aviation fuel blendstock with excellent seal swelling properties. Fuel 2025, 392, 134695. [Google Scholar] [CrossRef]
- Umenweke, G.C.; Hogston, B.; Heintz, O.; Caboche, G.; Pace, R.B.; Santillan-Jimenez, E. Robust engineered catalyst for the conversion of brown grease to renewable diesel via decarboxylation/decarbonylation. Chem. Commun. 2025, 61, 10784–10787. [Google Scholar] [CrossRef]
- Wang, C.; Liu, Q.; Song, J.; Li, W.; Li, P.; Xu, R.; Ma, H.; Tian, Z. High quality diesel-range alkanes production via a single-step hydrotreatment of vegetable oil over Ni/zeolite catalyst. Catal. Today 2014, 234, 153–160. [Google Scholar] [CrossRef]
- Li, T.; Cheng, J.; Huang, R.; Yang, W.; Zhou, J.; Cen, K. Hydrocracking of palm oil to jet biofuel over different zeolites. Int. J. Hydrogen Energy 2016, 41, 21883–21887. [Google Scholar] [CrossRef]
- Feng, F.; Niu, X.; Wang, L.; Zhang, X.; Wang, Q. TEOS-modified Ni/ZSM-5 nanosheet catalysts for hydroconversion of oleic acid to high-performance aviation fuel: Effect of acid spatial distribution. Microporous Mesoporous Mater. 2020, 291, 109705. [Google Scholar] [CrossRef]
- Shi, Y.; Xing, E.; Cao, Y.; Liu, M.; Wu, K.; Yang, M.; Wu, Y. Tailoring product distribution during upgrading of palmitic acid over bi-functional metal/zeolite catalysts. Chem. Eng. Sci. 2017, 166, 262–273. [Google Scholar] [CrossRef]
- Cao, Y.; Shi, Y.; Bi, Y.; Wu, K.; Hu, S.; Wu, Y.; Huang, S. Hydrodeoxygenation and hydroisomerization of palmitic acid over bi-functional Co/H-ZSM-22 catalysts. Fuel Process. Technol. 2018, 172, 29–35. [Google Scholar] [CrossRef]
- Kline, M.J.; Karunarathne, S.A.; Schwartz, T.J.; Wheeler, M.C. Hydrogenation of 2-methylnaphthalene over bi-functional Ni catalysts. Appl. Catal. A Gen. 2022, 630, 118462. [Google Scholar] [CrossRef]
- Portillo, A.; Ateka, A.; Ereña, J.; Bilbao, J.; Aguayo, A.T. Alternative acid catalysts for the stable and selective direct conversion of CO2/CO mixtures into light olefins. Fuel Process. Technol. 2022, 238, 107513. [Google Scholar] [CrossRef]
- Liu, J.; Hu, S.; Chen, J.; Meng, J.; Ye, G.; Zhou, X. Effects of SiO2 Deposition on Surface Barriers and Catalytic Activity of Different Zeolites. Catal. Lett. 2023, 153, 544–558. [Google Scholar] [CrossRef]
- Mäki-Arvela, P.; Martínez-Klimov, M.; Murzin, D.Y. Hydroconversion of fatty acids and vegetable oils for production of jet fuels. Fuel 2021, 306, 121673. [Google Scholar] [CrossRef]
- Santillan-Jimenez, E.; Loe, R.; Garrett, M.; Morgan, T.; Crocker, M. Effect of Cu promotion on cracking and methanation during the Ni-catalyzed deoxygenation of waste lipids and hemp seed oil to fuel-like hydrocarbons. Catal. Today 2018, 302, 261–271. [Google Scholar] [CrossRef]
- Chen, D.; Liu, D.; Wei, J.; Bai, Y.; Zhao, L.; Gao, J.; Xu, C. The effect of acid strength on the mechanism of catalytic pyrolysis reaction of n-hexane in ZSM5: A DFT study. Appl. Catal. A Gen. 2023, 665, 119389. [Google Scholar] [CrossRef]
- Komvokis, V.G.; Karakoulia, S.; Iliopoulou, E.F.; Papapetrou, M.C.; Vasalos, I.A.; Lappas, A.A.; Triantafyllidis, K.S. Upgrading of Fischer–Tropsch synthesis bio-waxes via catalytic cracking: Effect of acidity, porosity and metal modification of zeolitic and mesoporous aluminosilicate catalysts. Catal. Today 2012, 196, 42–55. [Google Scholar] [CrossRef]
- Yang, Z.; Liu, Y.; Liu, D.; Meng, X.; Liu, C. Hydroisomerization of n-octane over bimetallic Ni-Cu/SAPO-11 catalysts. Appl. Catal. A Gen. 2017, 543, 274–282. [Google Scholar] [CrossRef]
- Tang, F.; Wang, L.; Dessie Walle, M.; Mustapha, A.; Liu, Y.-N. An alloy chemistry strategy to tailoring the d-band center of Ni by Cu for efficient and selective catalytic hydrogenation of furfural. J. Catal. 2020, 383, 172–180. [Google Scholar] [CrossRef]
- Khromova, S.A.; Smirnov, A.A.; Bulavchenko, O.A.; Saraev, A.A.; Kaichev, V.V.; Reshetnikov, S.I.; Yakovlev, V.A. Anisole hydrodeoxygenation over Ni–Cu bimetallic catalysts: The effect of Ni/Cu ratio on selectivity. Appl. Catal. A Gen. 2014, 470, 261–270. [Google Scholar] [CrossRef]
- Silva, G.C.R.; Qian, D.; Pace, R.; Heintz, O.; Caboche, G.; Santillan-Jimenez, E.; Crocker, M. Promotional Effect of Cu, Fe and Pt on the Performance of Ni/Al2O3 in the Deoxygenation of Used Cooking Oil to Fuel-Like Hydrocarbons. Catalysts 2020, 10, 91. [Google Scholar] [CrossRef]
- Zhang, H.; Shao, S.; Xiao, R.; Shen, D.; Zeng, J. Characterization of Coke Deposition in the Catalytic Fast Pyrolysis of Biomass Derivates. Energy Fuels 2014, 28, 52–57. [Google Scholar] [CrossRef]
- Loe, R.; Huff, K.; Walli, M.; Morgan, T.; Qian, D.; Pace, R.; Song, Y.; Isaacs, M.; Santillan-Jimenez, E.; Crocker, M. Effect of Pt Promotion on the Ni-Catalyzed Deoxygenation of Tristearin to Fuel-Like Hydrocarbons. Catalysts 2019, 9, 200. [Google Scholar] [CrossRef]
- Morgan, T.; Grubb, D.; Santillan-Jimenez, E.; Crocker, M. Conversion of Triglycerides to Hydrocarbons over Supported Metal Catalysts. Top. Catal. 2010, 53, 820–829. [Google Scholar] [CrossRef]
- Morgan, T.; Santillan-Jimenez, E.; Harman-Ware, A.E.; Ji, Y.; Grubb, D.; Crocker, M. Catalytic deoxygenation of triglycerides to hydrocarbons over supported nickel catalysts. Chem. Eng. J. 2012, 189–190, 346–355. [Google Scholar] [CrossRef]
- Wang, F.; Pace, R.; Ji, Y.; Jiang, J.; Jiang, X.; Krystianiak, A.; Heintz, O.; Caboche, G.; Santillan-Jimenez, E.; Crocker, M. Effect of Pd promotion and catalyst support on the Ni-catalyzed deoxygenation of tristearin to fuel-like hydrocarbons. Renew. Energy 2022, 195, 1468–1479. [Google Scholar] [CrossRef]
- Morgan, T.; Santillan-Jimenez, E.; Huff, K.; Javed, K.R.; Crocker, M. Use of Dual Detection in the Gas Chromatographic Analysis of Oleaginous Biomass Feeds and Biofuel Products To Enable Accurate Simulated Distillation and Lipid Profiling. Energy Fuels 2017, 31, 9498–9506. [Google Scholar] [CrossRef]
- Ritmun, N. Effect of Zeolite Support of Nickel-Copper Catalyst on Conversion of Palm Oil to Sustainable Aviation Fuel. Master’s Thesis, Chulalongkorn University, Bangkok, Thailand, 2024. [Google Scholar] [CrossRef]
- Rosales Calderon, O.; Tao, L.; Abdullah, Z.; Talmadge, M.; Milbrandt, A.; Smolinski, S.; Moriarty, K.; Bhatt, A.; Zhang, Y.; Ravi, V.; et al. Sustainable Aviation Fuel State-of-Industry Report: Hydroprocessed Esters and Fatty Acids Pathway; NREL: Golden, CO, USA, 2024. Available online: https://docs.nrel.gov/docs/fy24osti/87803.pdf (accessed on 8 September 2025).
Disclaimer/Publisher’s Note: The statements, opinions and data contained in all publications are solely those of the individual author(s) and contributor(s) and not of MDPI and/or the editor(s). MDPI and/or the editor(s) disclaim responsibility for any injury to people or property resulting from any ideas, methods, instructions or products referred to in the content. |
© 2025 by the authors. Licensee MDPI, Basel, Switzerland. This article is an open access article distributed under the terms and conditions of the Creative Commons Attribution (CC BY) license (https://creativecommons.org/licenses/by/4.0/).