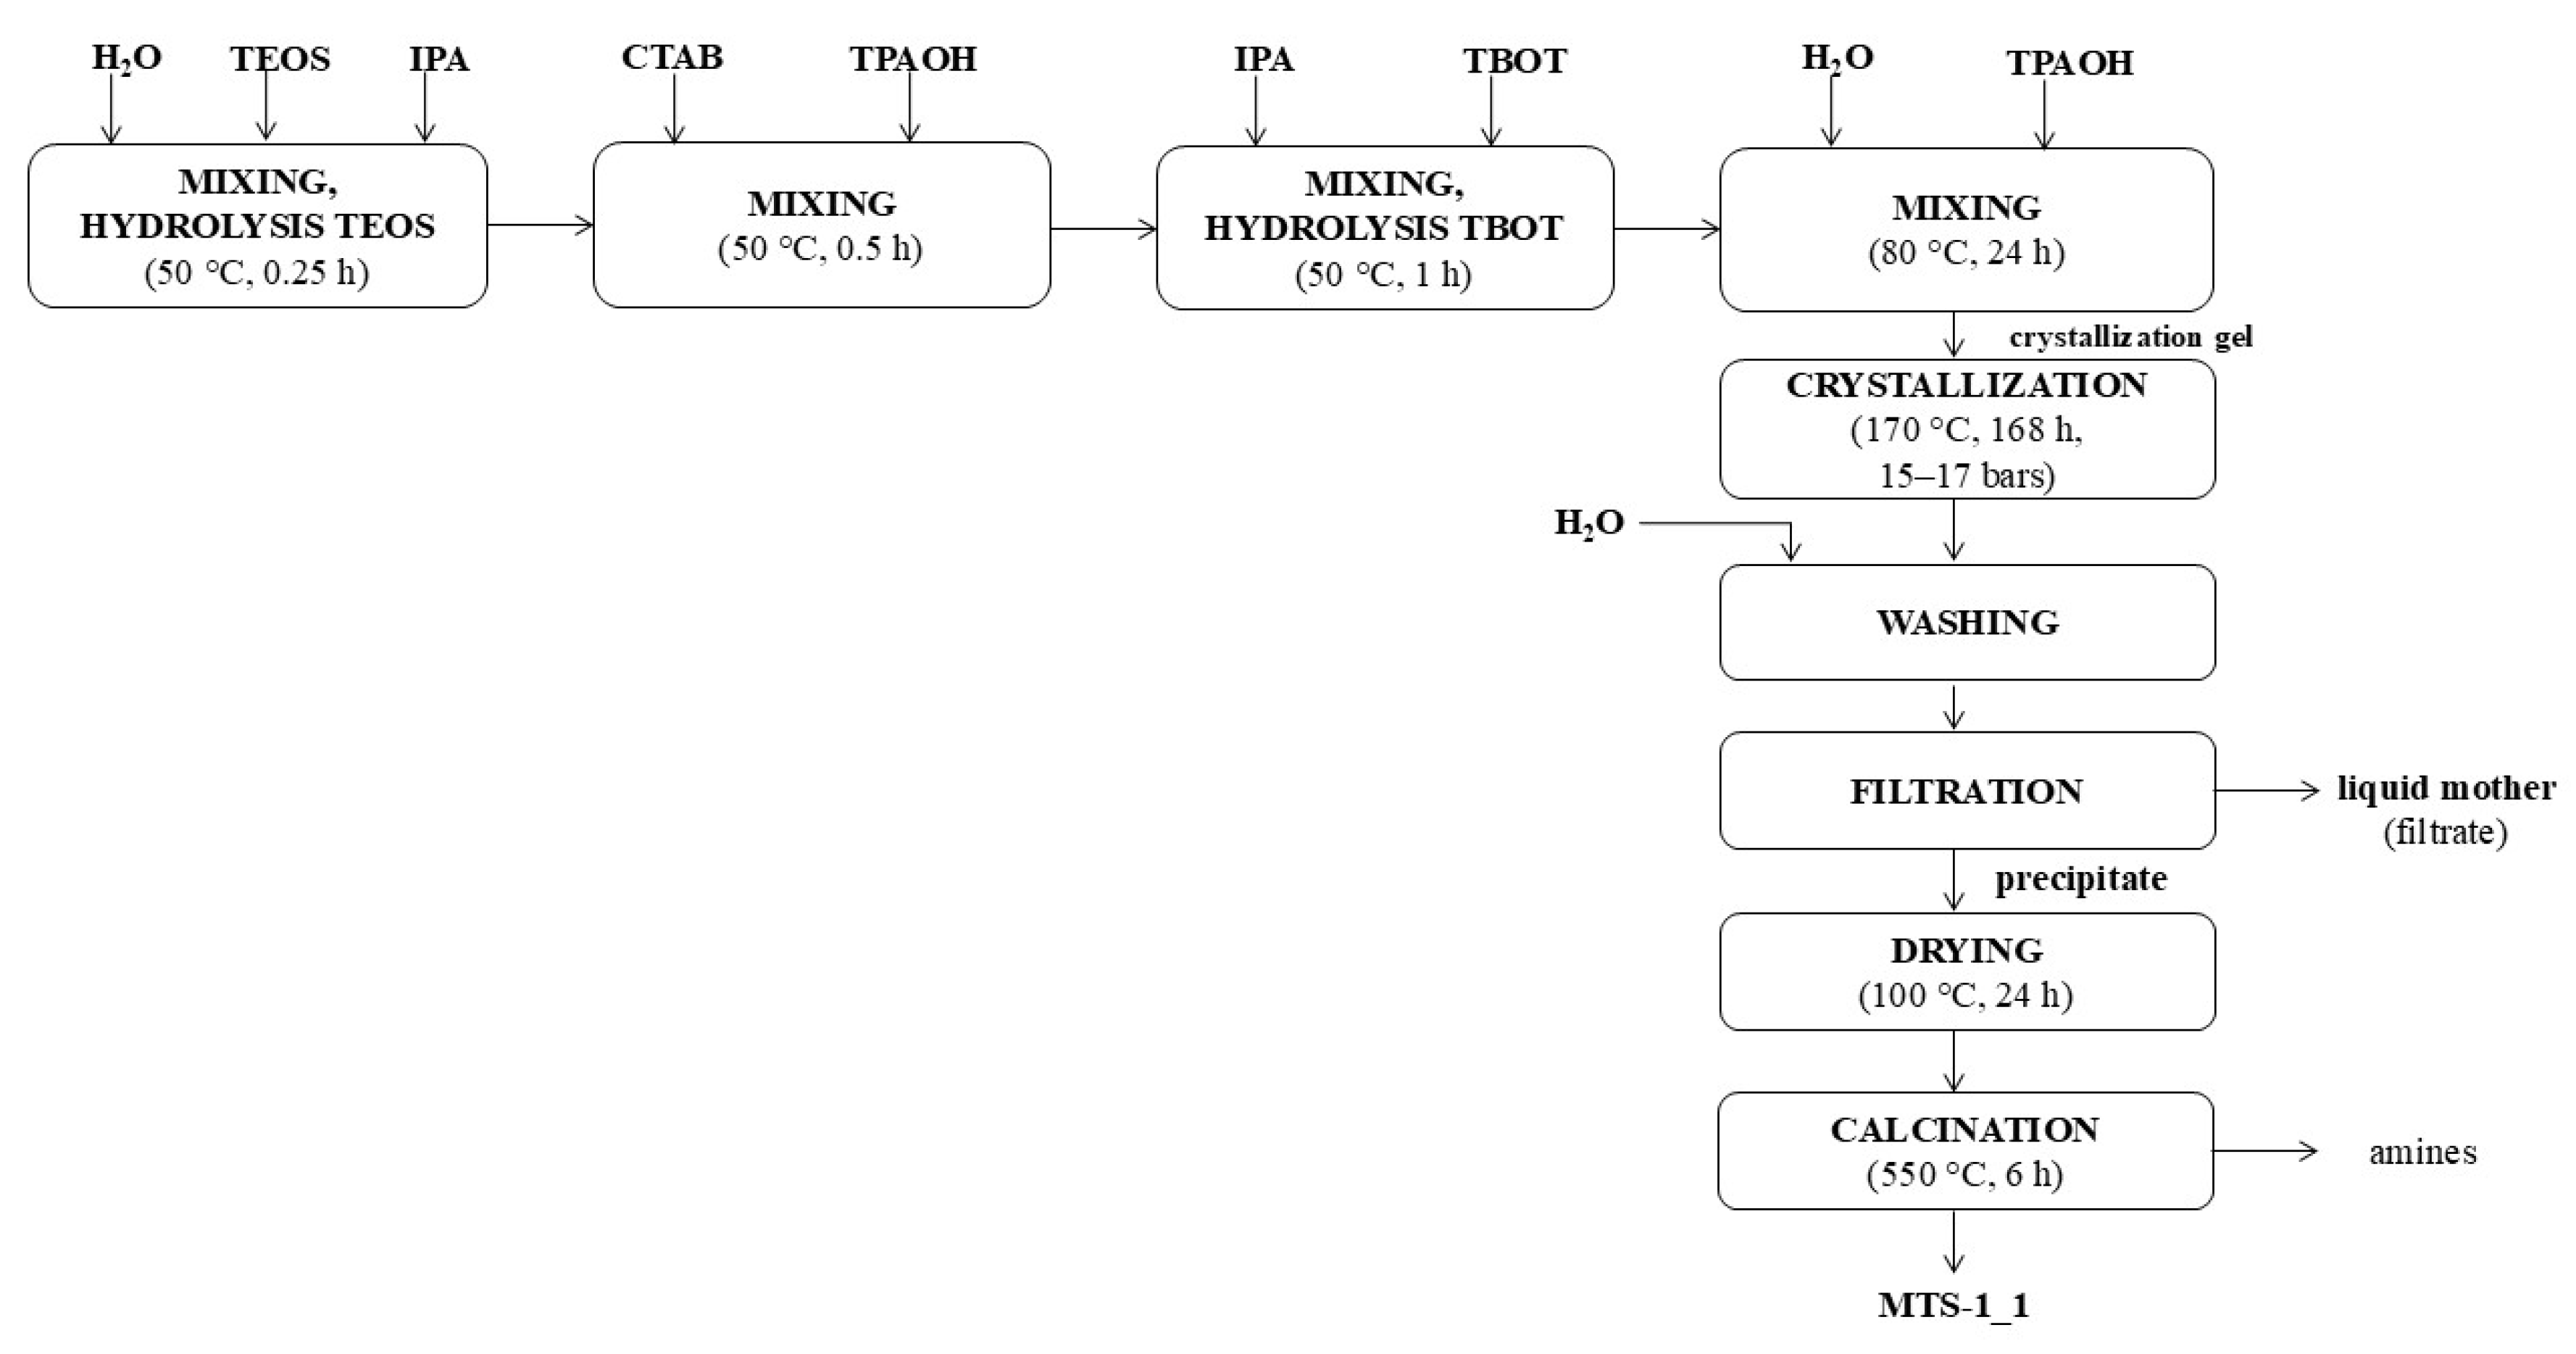
2.1. Characteristics of the Obtained Catalysts
To evaluate the structural and physicochemical properties of the synthesized titanium silicate catalysts, a comprehensive instrumental analysis was conducted. The materials were characterized by UV–Vis and FTIR spectroscopy, X-ray diffraction (XRD), scanning electron microscopy (SEM), nitrogen sorption measurements, and energy-dispersive X-ray fluorescence (EDXRF), in order to assess titanium coordination, crystallinity, morphology, porosity, and chemical composition.
The UV–Vis spectra of the MTS-1 and HTS-1 materials, along with spectrum of the reference TS-1 material [
27], are presented in
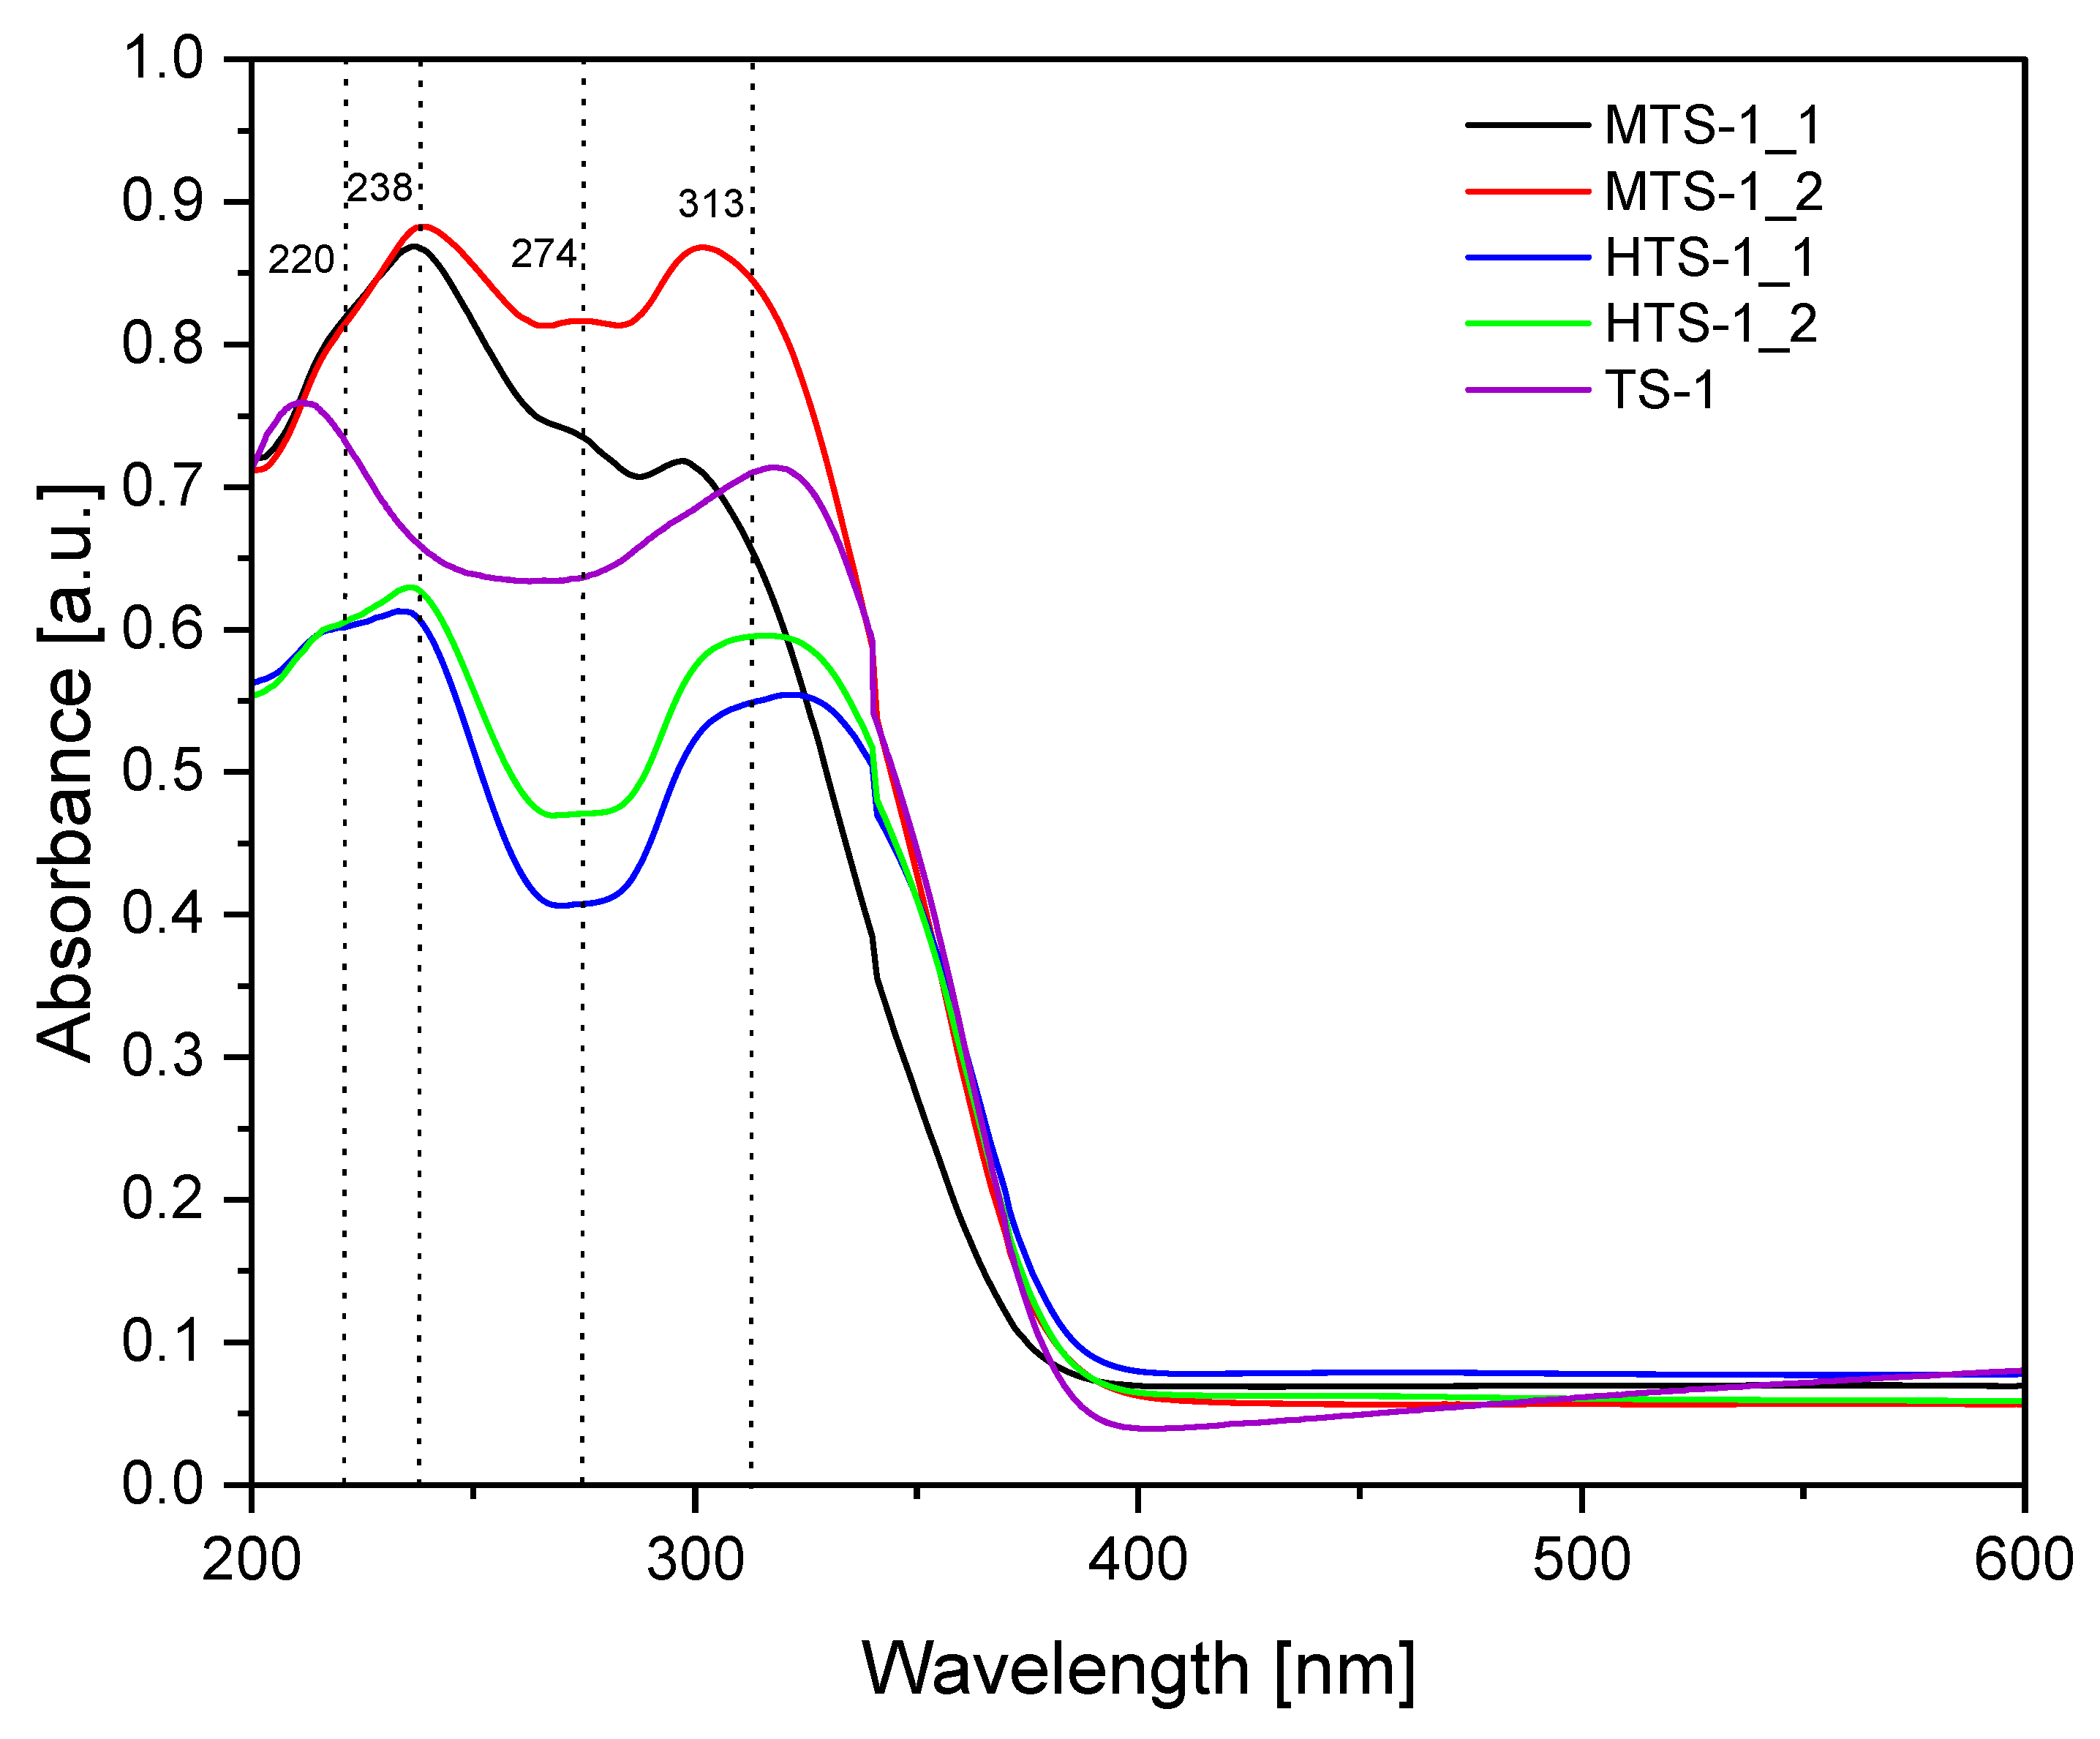
Figure 1. These spectra show three characteristic types of bands associated with various forms of titanium present in the structure of the tested titanium silica catalysts. The bands at 220–240 nm are connected with the presence of Ti
4+ in the structure of titanium silica materials (tetrahedrally coordinated Ti). The UV–Vis spectra of titanium silica materials also show bands at 270–274 nm, which are attributed to the presence of titanium with coordination numbers 5 and 6, having one or two water molecules coordinated to titanium in the structure of silica. However, the bands at 300–320 nm are related to the presence of TiO
2 in the form of anatase [
29,
30].
The comparison of the spectra obtained for the MTS-1 and HTS-1 samples shows that for both MTS-1 catalysts, the three characteristic bands mentioned above, associated with different forms of titanium in the structure, are much more intense than in the case of the reference TS-1 catalyst sample or the HTS-1 catalyst samples. Moreover, in the case of the reference TS-1 catalyst sample, a slight shift toward lower wavelengths is visible in the band associated with titanium tetrahedrally bound in the silica structure (this band occurs at approximately 210 nm).
At the same time, the UV–Vis spectra of the two tested materials, designated MTS-1, are notable for the significantly lower peak intensity at 300–320 nm for sample MTS-1_1, which is associated with the presence of TiO2 in the anatase form. This indicates a lower TiO2 content in this sample and may contribute to the higher catalytic activity of this catalyst during the oxidation of α-pinene, as in this case, there is a lower risk of anatase blocking the pores. A significantly smaller band at 270–274 nm is also visible for the same sample, indicating that this sample contained significantly less Ti with coordination numbers of 5 and 6. However, the bands associated with titanium in tetrahedral coordination are comparable. Considering the steric hindrances associated with the structure of α-pinene, the presence of titanium in tetrahedral coordination is more favorable. Such large differences in the appearance of UV–Vis spectra do not occur in the case of samples marked as HTS-1_1 and HTS-1_2, but also in this case, the HTS-1_1 sample is characterized by lower intensity of the 270–274 nm and 300–320 nm bands, which may have a positive impact on its catalytic activity (easier access to the active sites of the catalyst).
The FTIR spectra of the MTS-1 and HTS-1 samples, along with the spectrum of the reference sample TS-1 [
27], are presented in
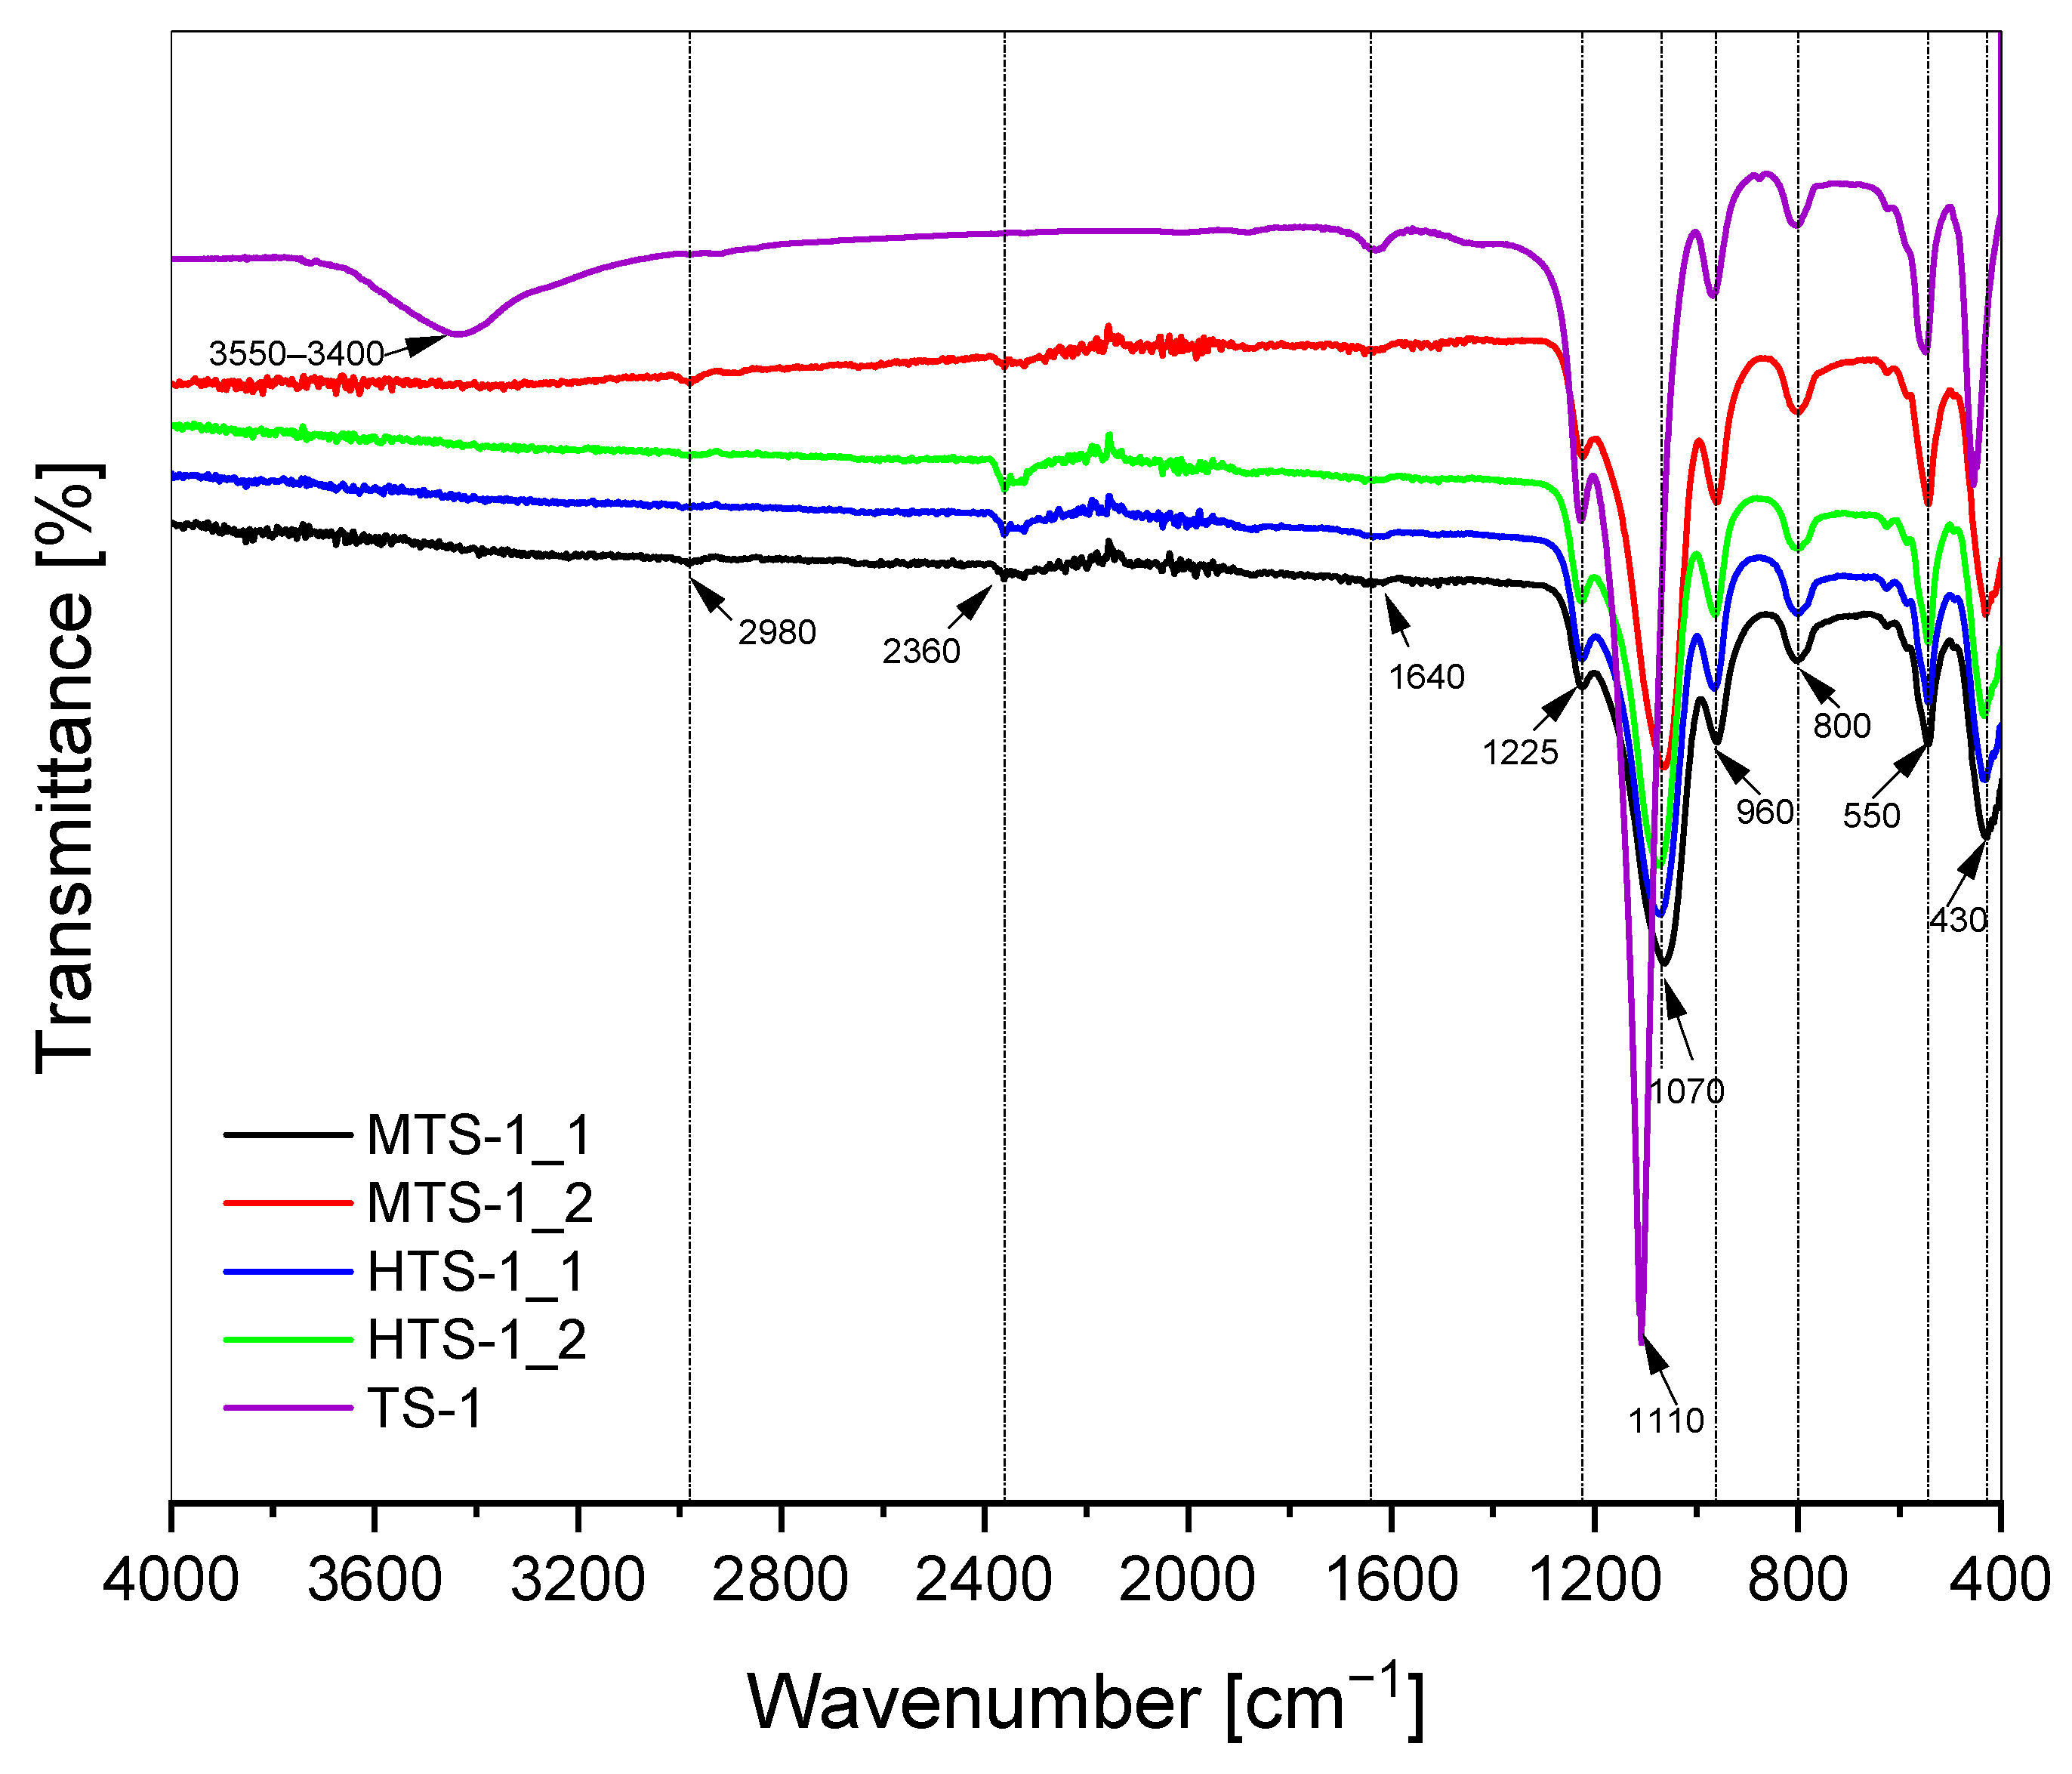
Figure 2. These spectra show bands characteristic for materials with MFI structure which are connected with the vibrations of Si–O–Si bonds (bands at 430 cm
−1, 550 cm
−1, 800 cm
−1, 1070–1110 cm
−1, and 1225 cm
−1) [
1,
29,
31,
32]. Among these bands, the band in the range of 1070–1100 cm
−1 is very important; it is described as characteristic of zeolites and zeolite-like materials and is connected with asymmetric Si–O–Si stretching vibrations.
Figure 2 shows that this band is the most intense for the reference sample of TS-1 material. The MTS-1 and HTS-1 materials are characterized by lower intensity of this band. However, among the bands preset in the spectra presented in
Figure 2, the most important is the band visible about 960 cm
−1, which confirms the incorporation of titanium into the structure of the titanium silicate catalysts obtained in this work and which is also present in the spectrum of the reference sample of TS-1 material. This band does not occur in pure silicalite-1 (the material that does not contain titanium in its structure) [
1,
27]. For the TS-1 reference material, a broad band in the range of 3550–3400 cm
−1 is also visible. This band is connected with the -OH groups present on the surface of titanium silicate materials. These -OH groups are groups originating from H
2O molecules adsorbed on the surface of the obtained materials, or they are -OH groups occurring in silanol groups [
1,
27]. In the case of the reference sample of the TS-1 material, another band characteristic of -OH groups appears in the spectrum, namely, the band at about 1640 cm
−1 [
33]. For the MTS-1 and HTS-1 materials, this band is poorly visible. Moreover, for the MTS-1 and HTS-1 samples weak bands are visible at 2360 cm
−1 and 2980 cm
−1. The band at 2360 cm
−1 is attributed to CO
2 (adsorbed from air) [
34] and the band at 2980 cm
−1 is characteristic of C–H bond vibrations (residues of organic templates such as TPAOH and CTAB) [
35]. The presence of this band may indicate incomplete decomposition of the templates during calcination.
XRD patterns of the MTS-1 and HTS-1 samples are presented in
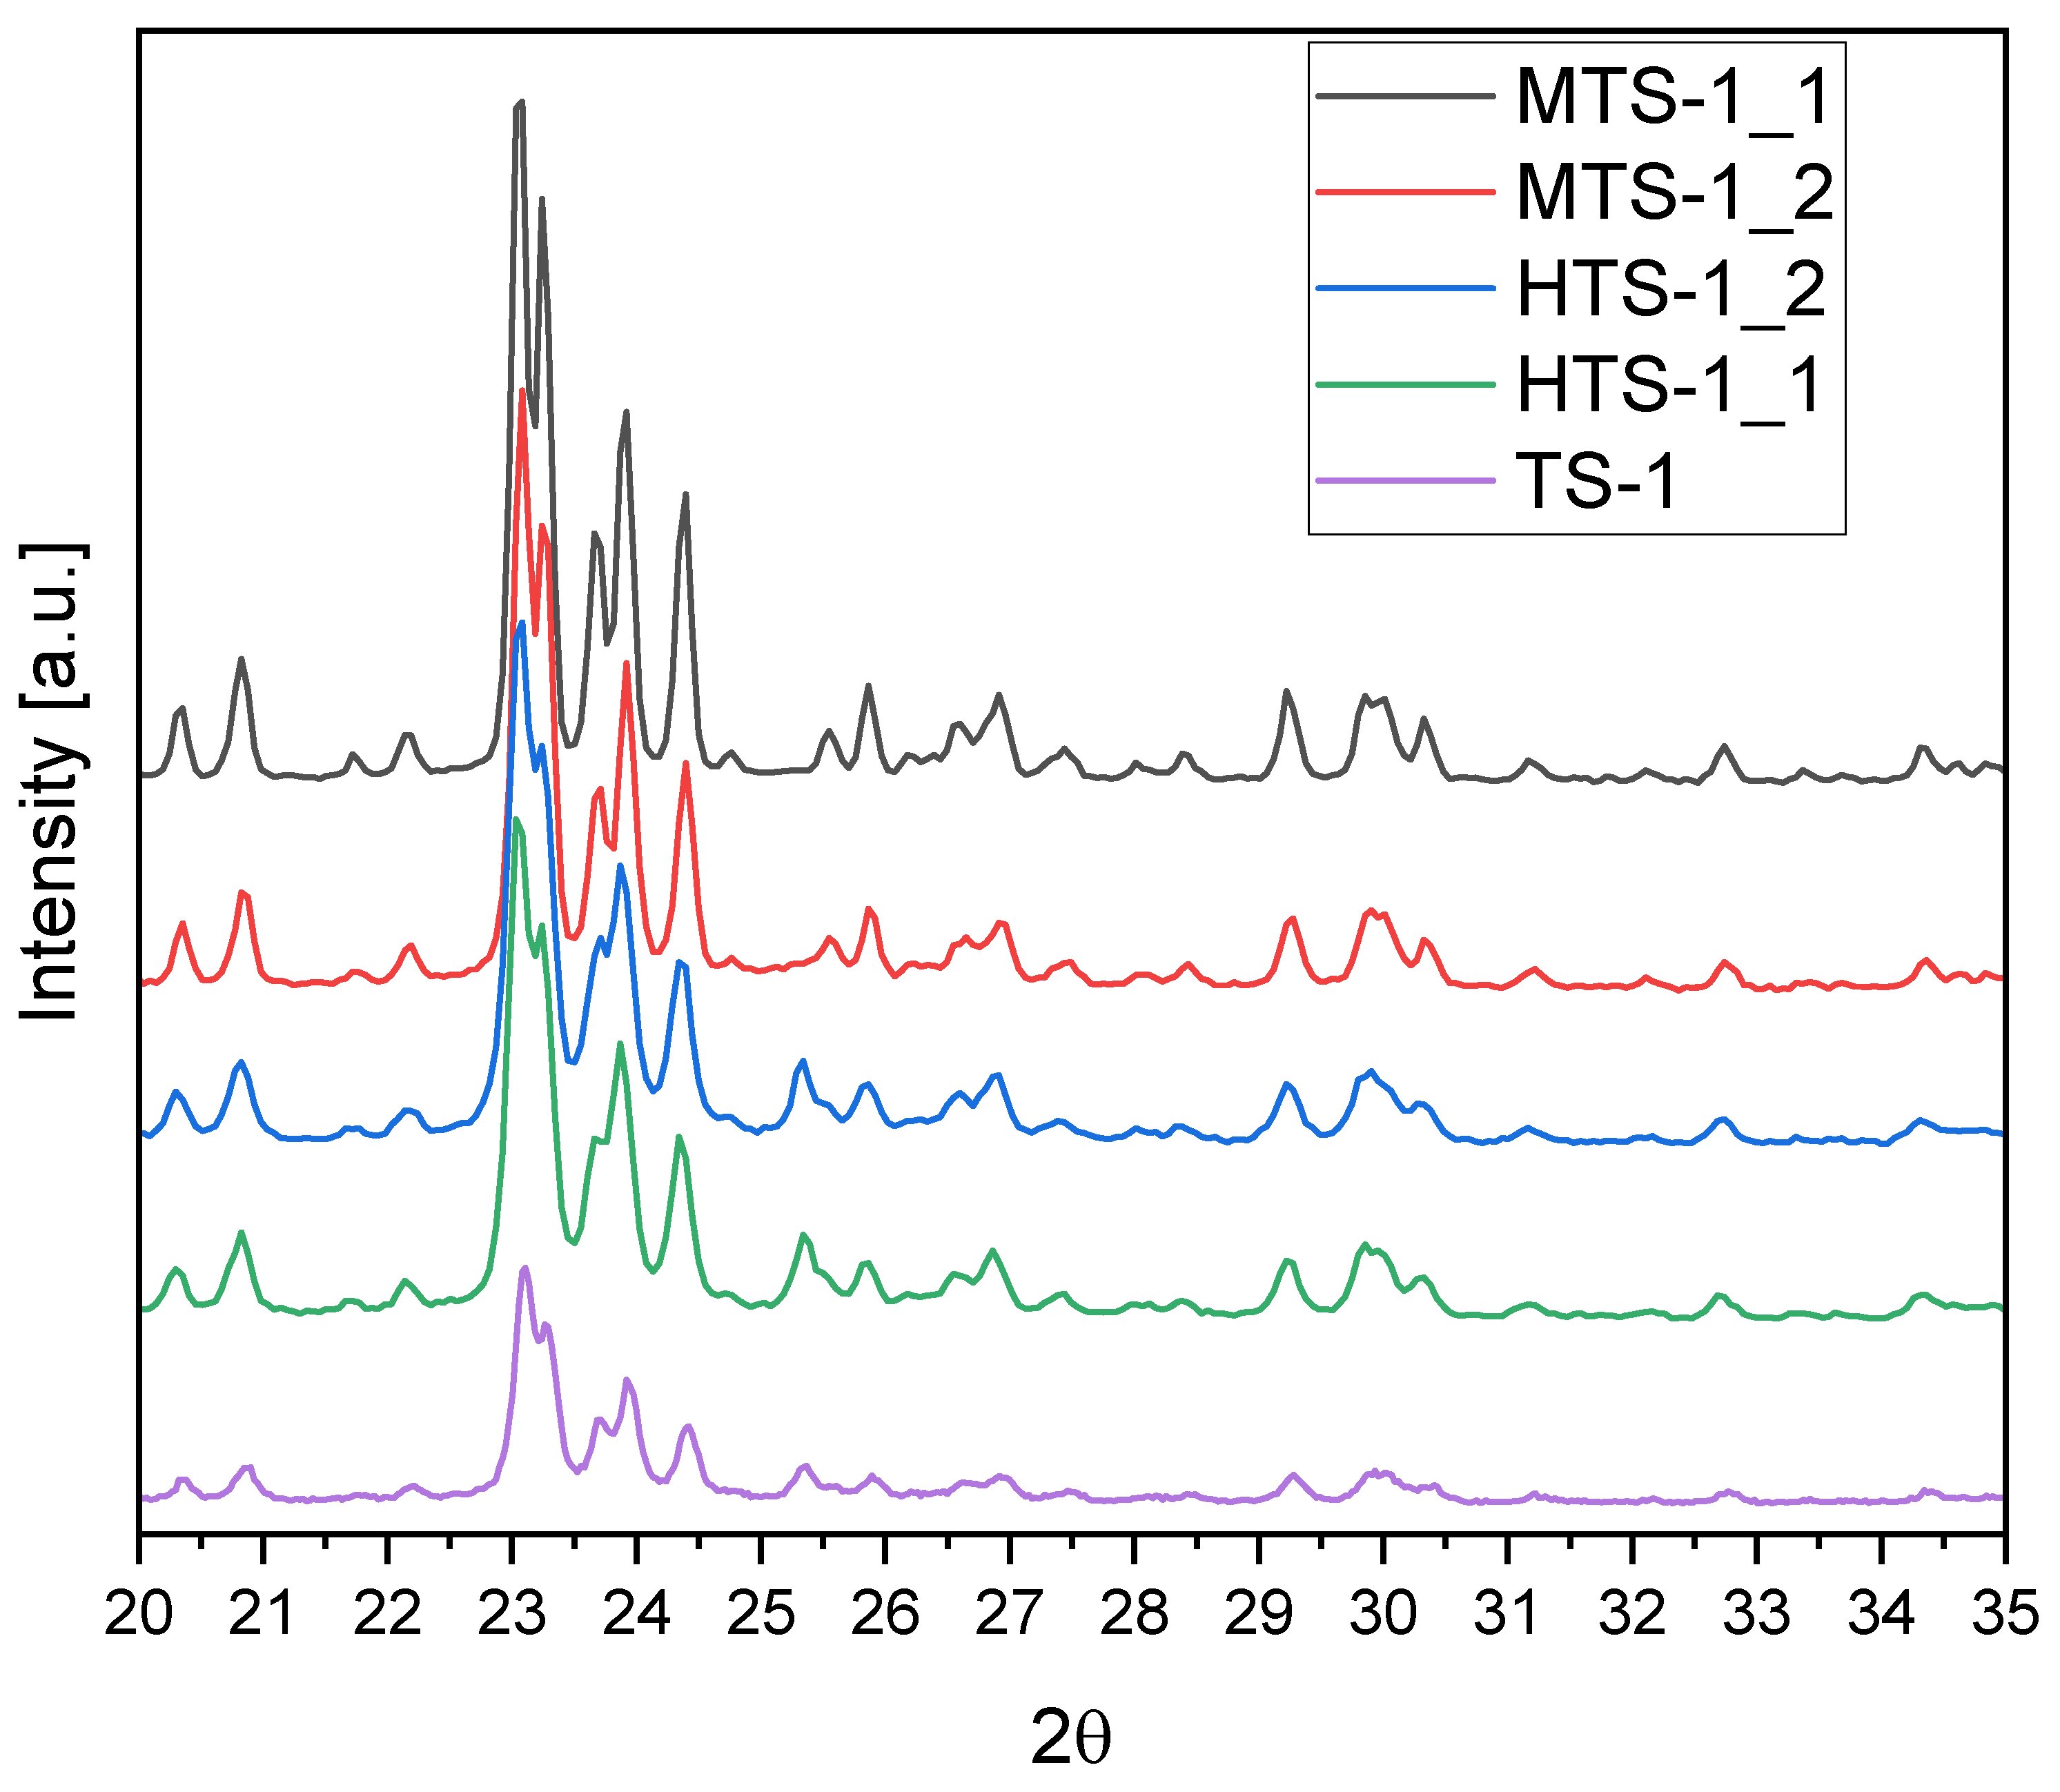
Figure 3.
The XRD patterns shown in
Figure 3 correspond to the reference TS-1 sample and the MTS-1 and HTS-1 materials synthesized under modified conditions. All samples exhibit characteristic reflections in the 2θ range of 23–25°, which are attributed to the crystallographic planes of the MFI-type zeolite structure. This confirms that the MFI framework is retained regardless of the synthesis route applied.
Closer examination of peak shape and intensity reveals notable differences in crystallite size across the samples. The MTS-1_1 sample displays the sharpest and most intense reflections, suggesting it contains the largest crystallites among all tested materials. MTS-1_2 also shows relatively sharp peaks, though slightly less intense than MTS-1_1, indicating that the crystallites are slightly smaller but still well developed. In the case of the HTS-1 series, both HTS-1_1 and HTS-1_2 exhibit moderately sharp reflections—more defined than those of TS-1, yet broader and less intense than in the MTS materials—pointing to crystallites of intermediate size. Between the two, HTS-1_1 may contain slightly smaller crystallites than HTS-1_2. The reference TS-1 sample shows the broadest and least intense peaks, which clearly indicates that it has the smallest crystallite size in this group.
A small reflection near 2θ ≈ 25.3° can be seen in the TS-1 and HTS samples, which is consistent with the (101) plane of anatase TiO2. This suggests that not all the titanium in these materials is incorporated into the zeolite framework—some may exist as a separate TiO2 phase. In contrast, the MTS-1 samples do not show any clear peak at this position, indicating that titanium is fully incorporated into the MFI structure. A slight hump in the baseline around 25.3° in the MTS-1_2 sample may point to the presence of trace amounts of anatase, possibly coexisting with the MFI phase. The XRD findings are consistent with the UV–Vis results, as both techniques indicate a significant presence of anatase in the TS-1 sample and only a negligible amount in MTS-1_1.
The crystallite size (CS), absolute degree of crystallinity (ADC), and relative crystallinity (RC) calculated using the data from the XRD are presented in
Table 1.
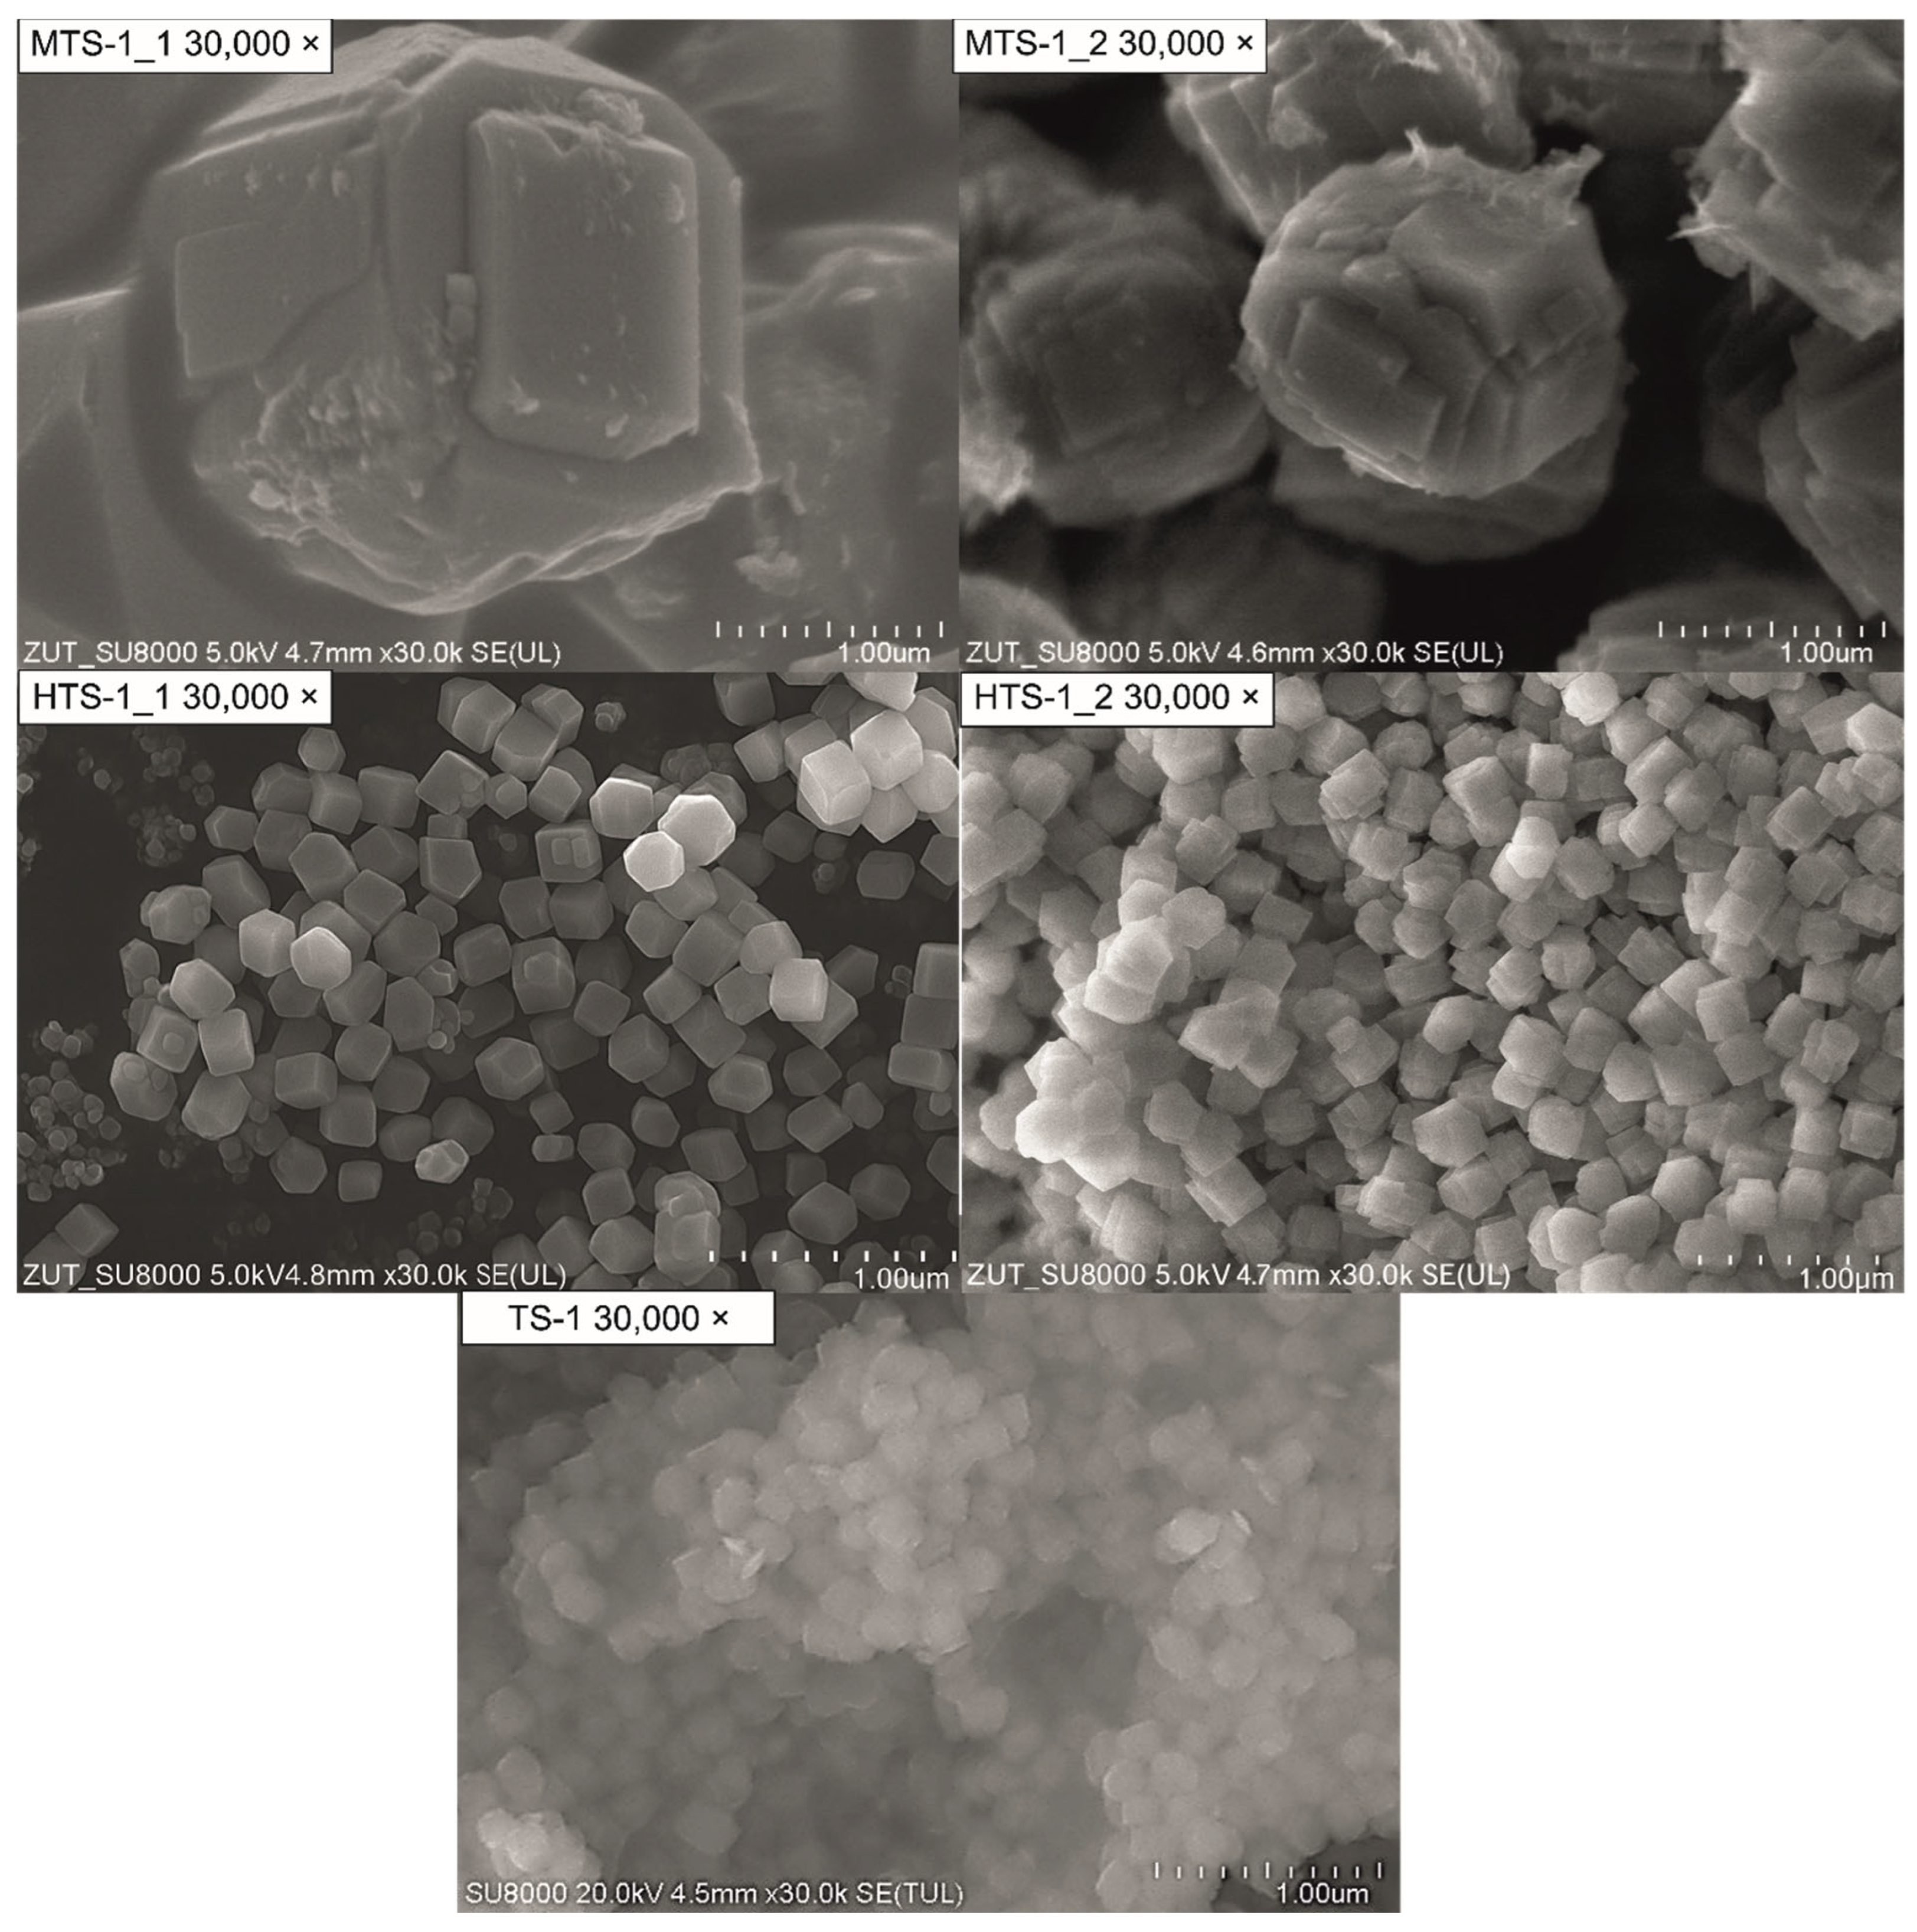
Figure 4 shows SEM micrographs of the reference TS-1 material alongside samples from the MTS and HTS series, all recorded at a magnification of 30,000×.
The TS-1 sample appears as an agglomerate of poorly defined and irregularly shaped particles with no distinct external morphology. The surface features are blurred, and no clear crystallographic edges are visible, which suggests low crystallinity and a high degree of aggregation. Such morphology may hinder accessibility to internal pores and limit the effective surface area.
In contrast, the MTS-1_1 and MTS-1_2 samples consist of clearly developed crystallites with faceted surfaces and regular geometric shapes. In particular, MTS-1_1 shows larger, well-defined crystallites with sharp edges and smooth faces, reflecting the typical morphology of MFI-type zeolitic structures [
29]. MTS-1_2 displays slightly smaller and more compact crystallites, often with more rounded edges, indicating subtle differences in growth conditions. These variations are likely related to differences in synthesis protocols, such as crystallization time or gel composition.
The samples from the HTS series (HTS-1_1 and HTS-1_2) display a markedly different morphology. They are composed of uniform, nanometer-sized crystallites with a nearly isometric shape. The particles are closely packed, forming a homogeneous and highly textured surface. HTS-1_2 exhibits very regular and evenly distributed crystallites, which may contribute to a higher external surface area and improved accessibility to the pore system. This observation is consistent with the enhanced nitrogen uptake observed in the physisorption analysis. The finely dispersed nature of these crystallites indicates that the modified HTS synthesis protocol was effective in controlling the nucleation and growth processes. This is consistent with the XRD findings.
The average grain size (AGS) calculated from the SEM images is presented in
Table 1. The AGS values are considerably larger than the crystallite size (CS). The crystallite size was determined from X-ray diffraction (XRD) data using the Scherrer method and refers to the size of a single crystalline domain, i.e., the smallest region in which the crystal lattice is coherent. This value can be much smaller than the actual particle size when the particle is composed of multiple crystallites. In contrast, the AGS was obtained from SEM images and describes the average size of entire particles or grains visible in the micrographs, which are often aggregates consisting of numerous smaller crystallites. Therefore, AGS is typically much larger than CS, as shown in
Table 1; for example, in the case of MTS-1_1, the CS is ~28 nm, whereas the AGS reaches 1500 nm. This clearly indicates that the particles observed in SEM are conglomerates of many fine crystallites.
Overall, the SEM and XRD analyses confirm that both MTS and HTS synthesis modifications significantly influence the morphological characteristics of TS-1. The MTS route results in larger and well-faceted crystallites, while the HTS approach promotes the formation of uniformly distributed nanocrystallites, potentially offering improved performance in catalytic applications.
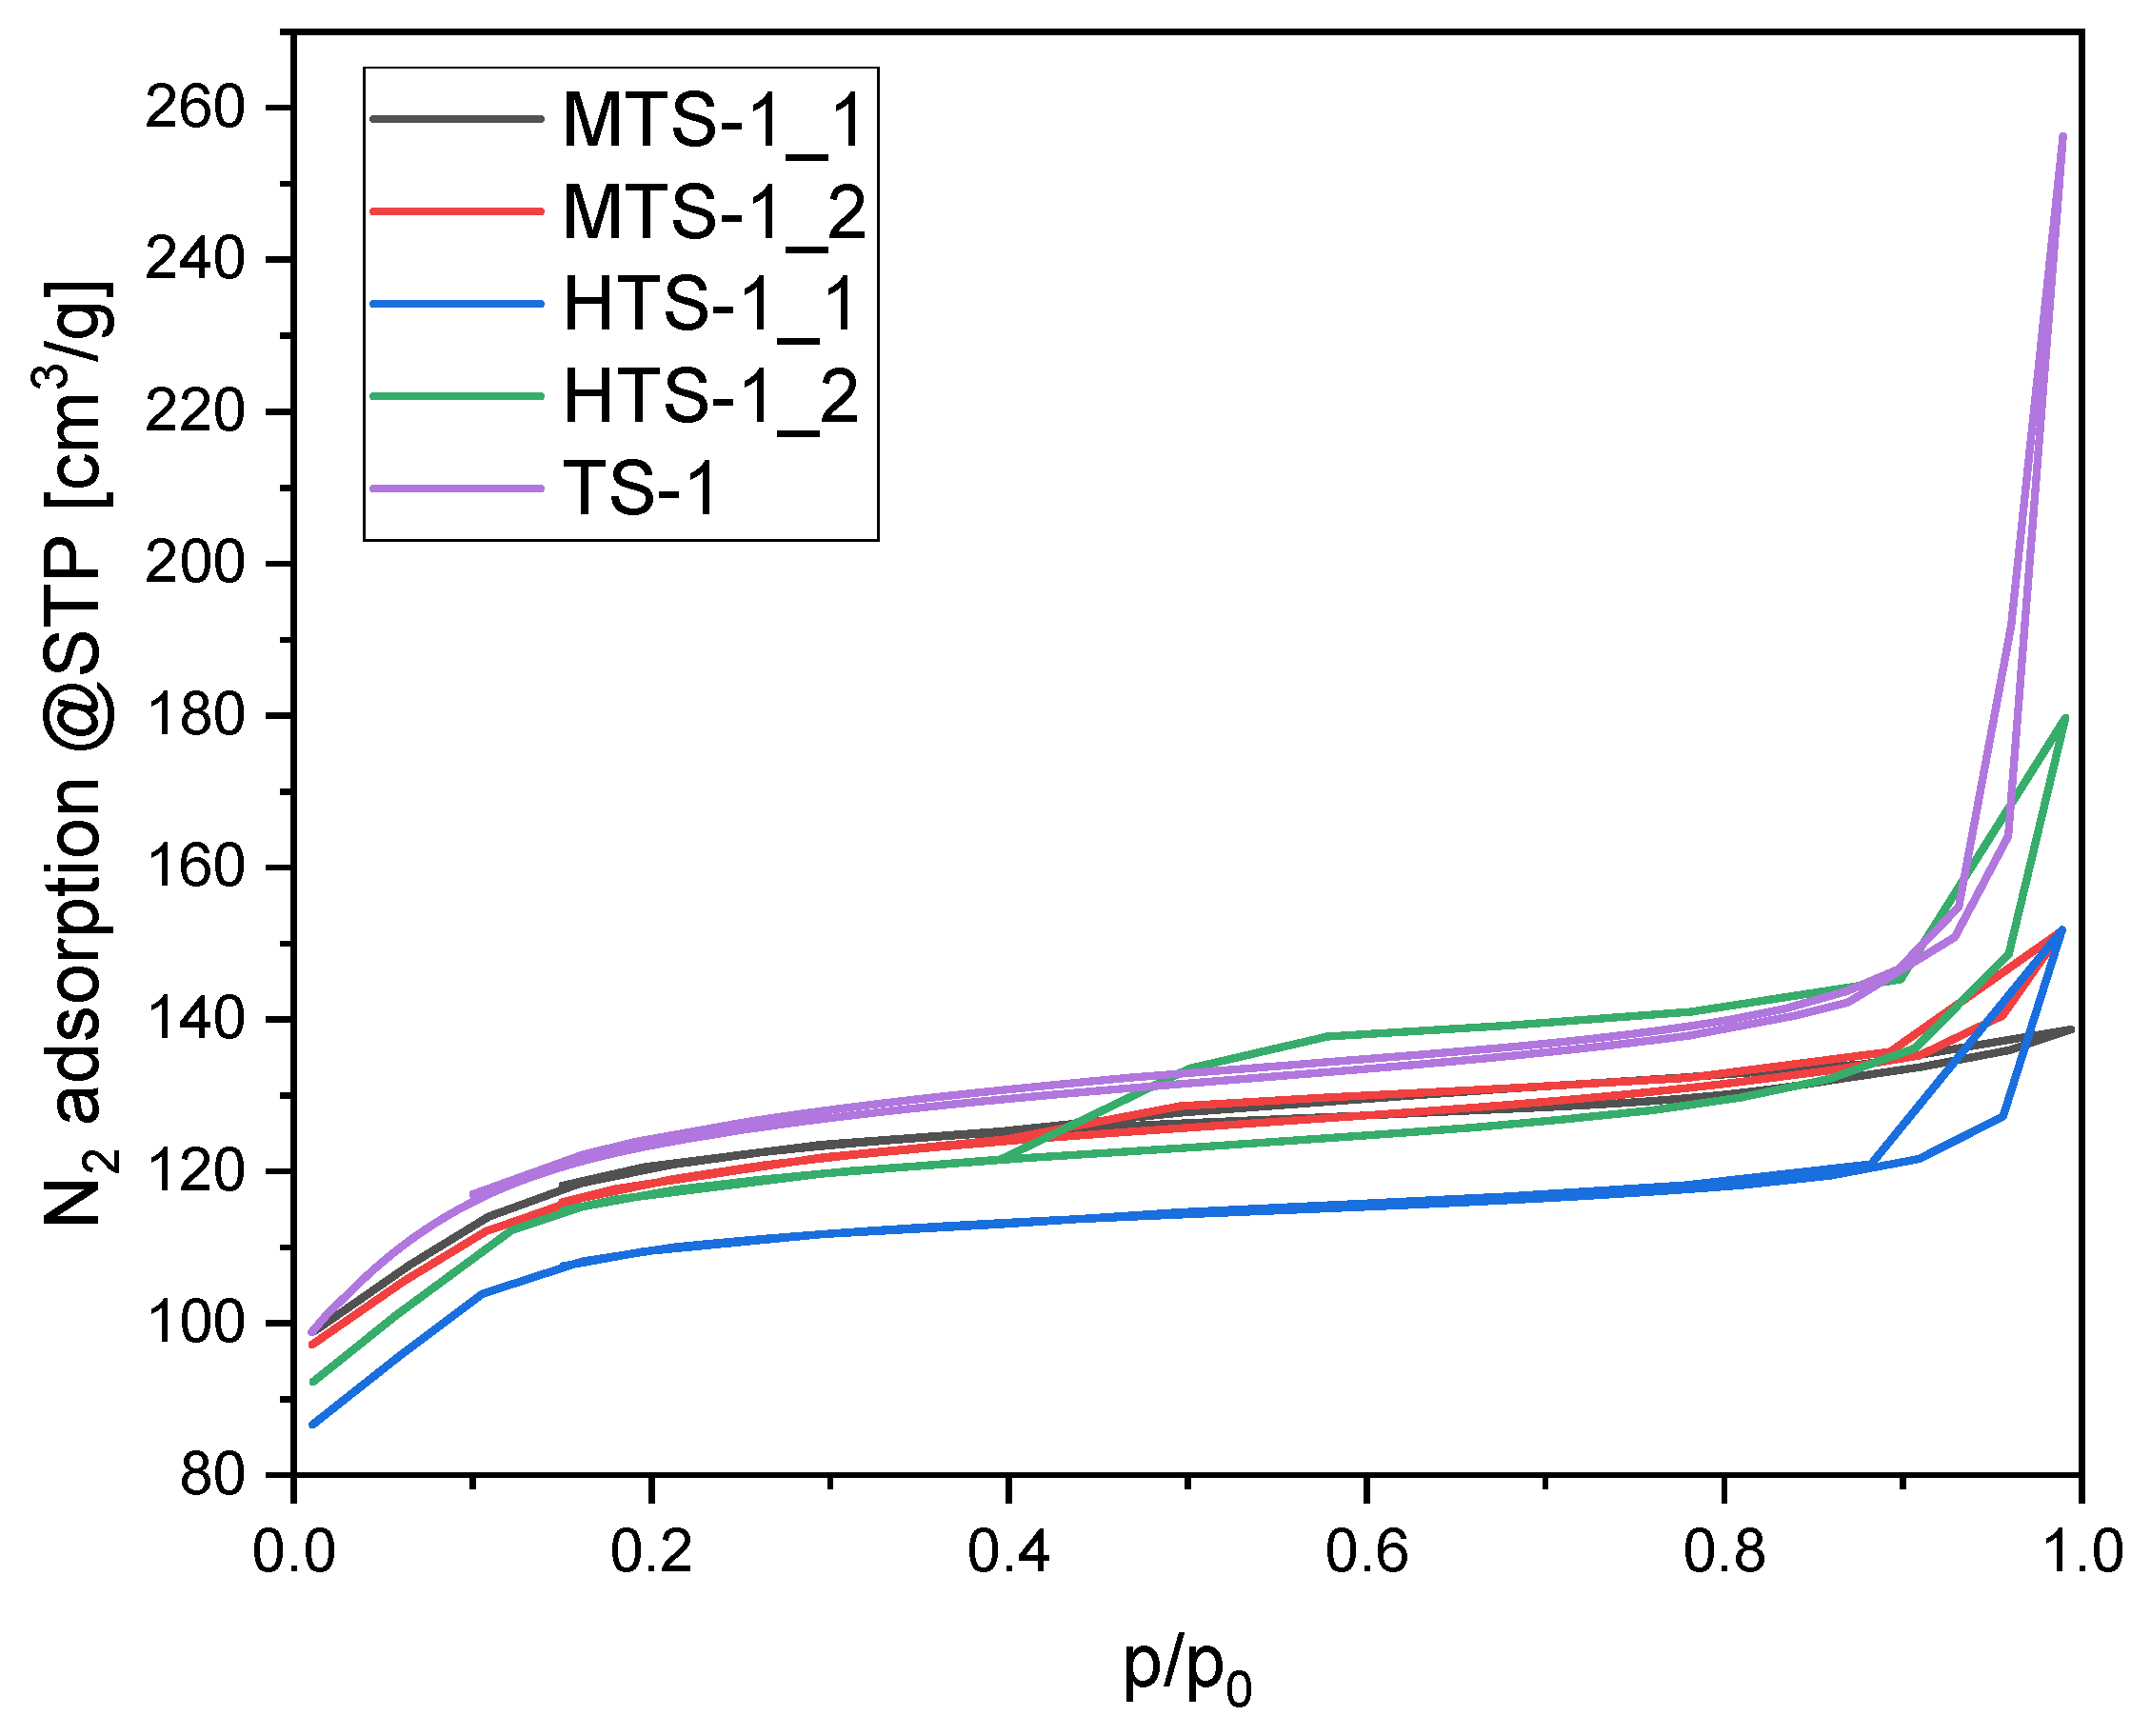
The nitrogen adsorption isotherms recorded at 77 K for the reference material TS-1 and for the materials synthesized using modified procedures (MTS and HTS series) are presented in
Figure 5.
The isotherm obtained for the TS-1 sample exhibits the characteristics of a type II isotherm, according to the IUPAC classification. This shape is typical of nonporous or macroporous materials, where adsorption initially occurs through monolayer formation on a relatively smooth surface, followed by multilayer adsorption at higher relative pressures. The absence of a distinct plateau in the low-pressure region supports this interpretation, while the steep increase at high p/p0 values clearly suggests capillary condensation in macropores. However, a narrow hysteresis loop observed in the p/p0 range of 0.4–0.9 indicates the presence of a small fraction of mesopores, whereas the sharp increase in adsorption above p/p0 = 0.9 points directly to the contribution of macropores.
The isotherms of the remaining materials can be ascribed to a mixed type II/IV character. The adsorption behavior of both MTS-1 materials up to p/p0 ≈ 0.8 closely resembles that of TS-1. In both cases, however, the hysteresis loops are slightly broader, indicating the presence of mesopores within a similar pore size range for all three materials, accompanied by an increase in mesopore volume for the MTS-1 series. The somewhat wider hysteresis loop observed for MTS-1_2 compared to MTS-1_1 suggests that MTS-1_2 possesses a larger mesopore volume.
In contrast, the nitrogen adsorption isotherms of the HTS-1 materials differ significantly from one another. The isotherm of HTS-1_1 exhibits an almost negligible hysteresis loop, which may indicate a lower mesopore volume than in TS-1. In turn, HTS-1_2 shows a very pronounced and wide hysteresis loop over the range p/p0 = 0.4–1. The hysteresis in the region of 0.4–0.9 is characteristic of mesopores with a substantial volume.
All materials display hysteresis loops parallel to the X-axis within this range, which can be classified as type H4, typically associated with narrow slit-shaped pores. In addition, TS-1 and HTS-1_1 exhibit a second distinct hysteresis loop in the high-pressure region (p/p0 = 0.9–1.0), indicative of the presence of macropores. These loops do not show limiting adsorption at high relative pressures and are therefore assigned to type H3, associated with slit-like pores. In the case of HTS-1_2, the two hysteresis types, H4 and H3, appear to be interconnected.
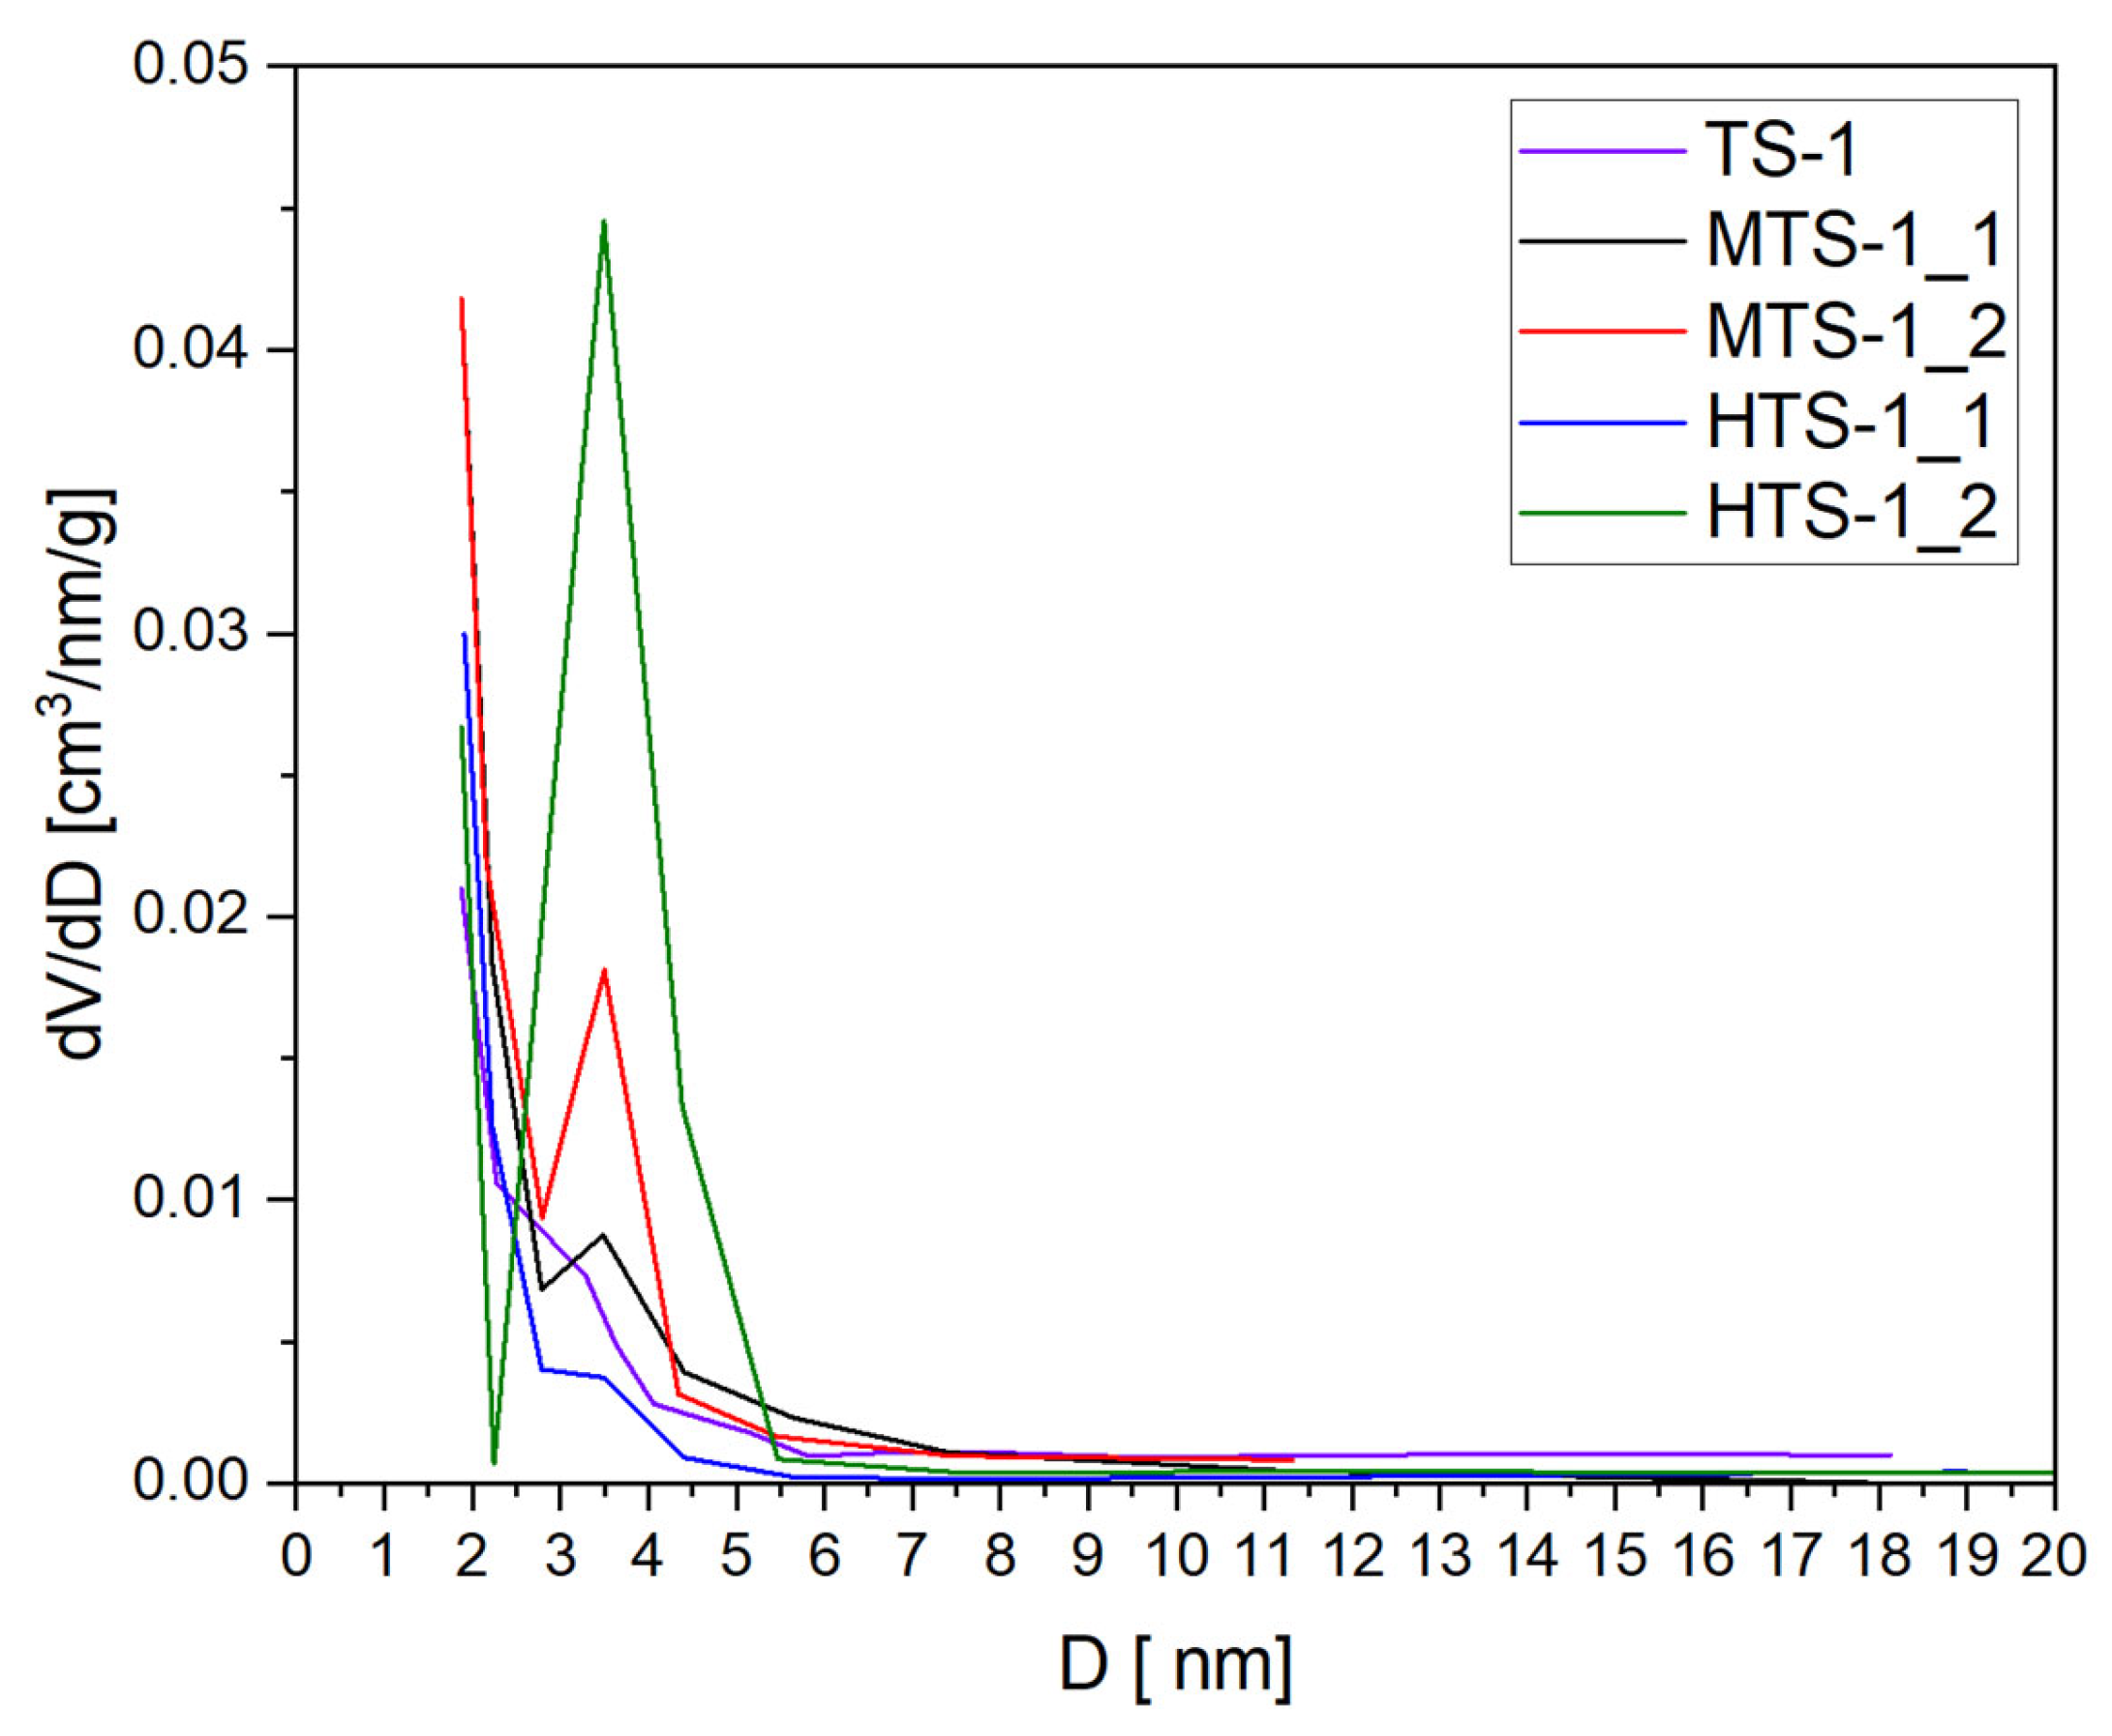
Figure 6 presents pore size distribution of the MTS-1 and HTS-1 samples, with reference TS-1 [
28] included for comparison.
The conclusions drawn from the adsorption isotherms are further supported by the pore size distribution determined using the BJH method, as shown in the figure. All materials exhibited the presence of mesopores in the range of 3–5 nm. For TS-1, MTS-1_1, and HTS-1_1, the mesopore volume was relatively low, whereas the highest degree of mesoporosity was identified in the case of HTS-1_2.
These results suggest that the specific modifications introduced during the synthesis of HTS-1_2 effectively enhanced the formation of mesopores, which can be advantageous in applications that require improved mass transport, such as heterogeneous catalysis or the adsorption of larger molecules.
These findings are consistent with the XRD analysis, where sample HTS-1_2 exhibited the lowest crystallinity, which can be attributed to an intense reconstruction process that generated mesoporosity at the expense of long-range structural order. In contrast, HTS-1_1 displayed slightly higher crystallinity, as evidenced by sharper diffraction peaks, and less developed porosity, suggesting a trade-off between crystallinity and mesoporous development. Within the context of the XRD data, the lower crystallinity observed for HTS-1_2 supports the hypothesis that aggressive chemical modification partially disrupted the ordered MFI framework while simultaneously promoting the formation of a hierarchical mesoporous architecture. Thus, the earlier appearance of hysteresis in HTS-1_2 serves as a meaningful complement to the diffraction results, highlighting a structural compromise between crystallinity and mesoscale porosity development.
XRD analysis showed that HTS-1_2 exhibited the lowest crystallinity, indicating that the long-range MFI order of the parent material was partially destroyed during the acid/TPAOH treatment. At the same time, nitrogen adsorption isotherms revealed clear differences at high relative pressures (p/p0 = 0.9–1.0). TS-1 showed a steep nitrogen uptake, which is characteristic of macroporosity, whereas this effect was absent in HTS-1_2. Instead, the modification eliminated macropores and generated mesoporosity, as evidenced by the earlier onset of hysteresis.
In morphological terms, this means that the compact TS-1 crystals underwent partial reconstruction, and their structure was transformed into a rougher and more open hierarchical architecture, where the development of mesopores improved molecular transport and accessibility of the titanium active sites.
Table 2 presents the values of specific surface area and total pore volume. These data support the conclusions drawn from the nitrogen adsorption isotherms. The TS-1 material exhibited the highest specific surface area and pore volume.
The content of aluminum, silicon, and titanium in the MTS-1 and HTS-1 materials was determined using the EDXRF method, and the results are shown in the following table (
Table 3).
The observed differences in titanium content among the synthesized materials result primarily from the applied synthesis methods, which vary in terms of templating strategy, crystallization conditions, and post-synthetic treatment. In particular, the lowest Ti content was obtained for MTS-1_1 (3.22 wt%), which may have been due to less efficient titanium incorporation under co-templating conditions. Nevertheless, UV–Vis spectroscopy indicated that the titanium in this sample was predominantly in tetrahedral coordination, suggesting that most of the Ti species were successfully incorporated into the zeolite framework. This form is catalytically active and provides accessible isolated Ti4+ sites within the MFI structure.
Titanium with coordination numbers 5 or 6 may also participate in catalytic reactions; however, coordination with water molecules leads to steric hindrance, limiting the access of bulky organic substrates, such as α-pinene, to the active sites. The presence of anatase-type titanium species is considered unfavorable, as anatase may become occluded within the pores and obstruct the diffusion pathways. This physical blockage can significantly reduce the availability of internal active sites located within the zeolite channels. Therefore, not only the total amount of titanium but also its coordination environment and distribution are critical factors determining the catalytic performance of the synthesized materials.
Generally, we can say that in comparison to the reference TS-1 catalyst with a Si/Ti molar ratio of 20:1, the newly synthesized MTS and HTS materials exhibit substantial differences in physicochemical properties. All modified samples show increased crystallinity, consistent with the partial structural rearrangement during post-synthetic or co-templating modification.
The BET surface areas of the obtained samples were in the range of 398–463 m2/g, with an average value of 435 m2/g and a standard deviation of ~24 m2/g (ca. 5.5%). Considering that the typical uncertainty of BET measurements is 3–5%, the observed variations are close to the error margin. On the other hand, the maximum difference between the lowest and highest values was 65 m2/g, i.e., about 16% relative to the smallest value. Such a difference may also be interpreted as an indication that the synthesis conditions contributed to modifications of the surface area.
The total pore volume of the studied samples ranged from 0.215 to 0.397 cm3/g, with an average value of 0.272 cm3/g and a standard deviation of ~0.074 cm3/g. The coefficient of variation was about 27%, and the maximum difference between the extreme values was 0.182 cm3/g, which corresponds to approximately 85% relative to the smallest value. Such large variations clearly exceed the typical measurement error of the BET method (~3–5%), which unambiguously indicates that the differences in pore volume result not from measurement uncertainty, but from the synthesis procedure.
Notably, the titanium content varied depending on the synthesis approach, with MTS-1_1 containing the lowest Ti amount (3.22 wt%) and MTS-1_2 the highest (6.16 wt%). These differences reflect variations in titanium incorporation and dispersion resulting from the applied synthetic methods.
2.2. Oxidation of α-Pinene Catalyzed by MTS-1 and HTS-1 Materials
The two MTS-1 and two HTS-1 materials that were obtained were used to perform catalytic tests with regard to the oxidation of α-pinene with oxygen. The process consisted of several stages of testing, and these stages consisted of studying the effects of temperature (stage I), amount of catalyst (stage II), and reaction time (stage III) on α-pinene conversion and appropriate product selectivity. Temperatures in the range of 110–150 °C were studied, the amount of catalyst varied within the range 0.025–1.5 wt%, and the reaction times in the range 0.25–24 h were tested. After each stage of these studies, the most favorable conditions for carrying out α-pinene oxidation were selected, considering the values of the conversion of α-pinene and the selectivities of the main oxygenated derivatives of α-pinene, such as α-pinene oxide, verbenol, and verbenone. In the oxidation of α-pinene on the obtained MTS-1 and HTS-1 materials, monoterpenes such as campholenic aldehyde, pinocarveol, myrtenal, myrtenol, carveol, carvone, and pinanediol were also formed but in smaller amounts.
Figure 7 shows the oxygenated derivatives of α-pinene and the pathways of formation of these compounds.
For the studies on the effect of temperature and the amount of catalyst, the amount of α-pinene was about 10 g, and for the studies on the effect of reaction time, the amount of α-pinene was 25 g. When conducting studies on the effect of reaction time, the reaction mixture samples of 1 cm3 were taken after the following reaction times: 0.25 h, 0.5 h, 1 h, 2 h, 3 h, 4 h, 5 h, 6 h, and 24 h.
The first material which was tested in our studies was the MTS-1_1 catalyst.
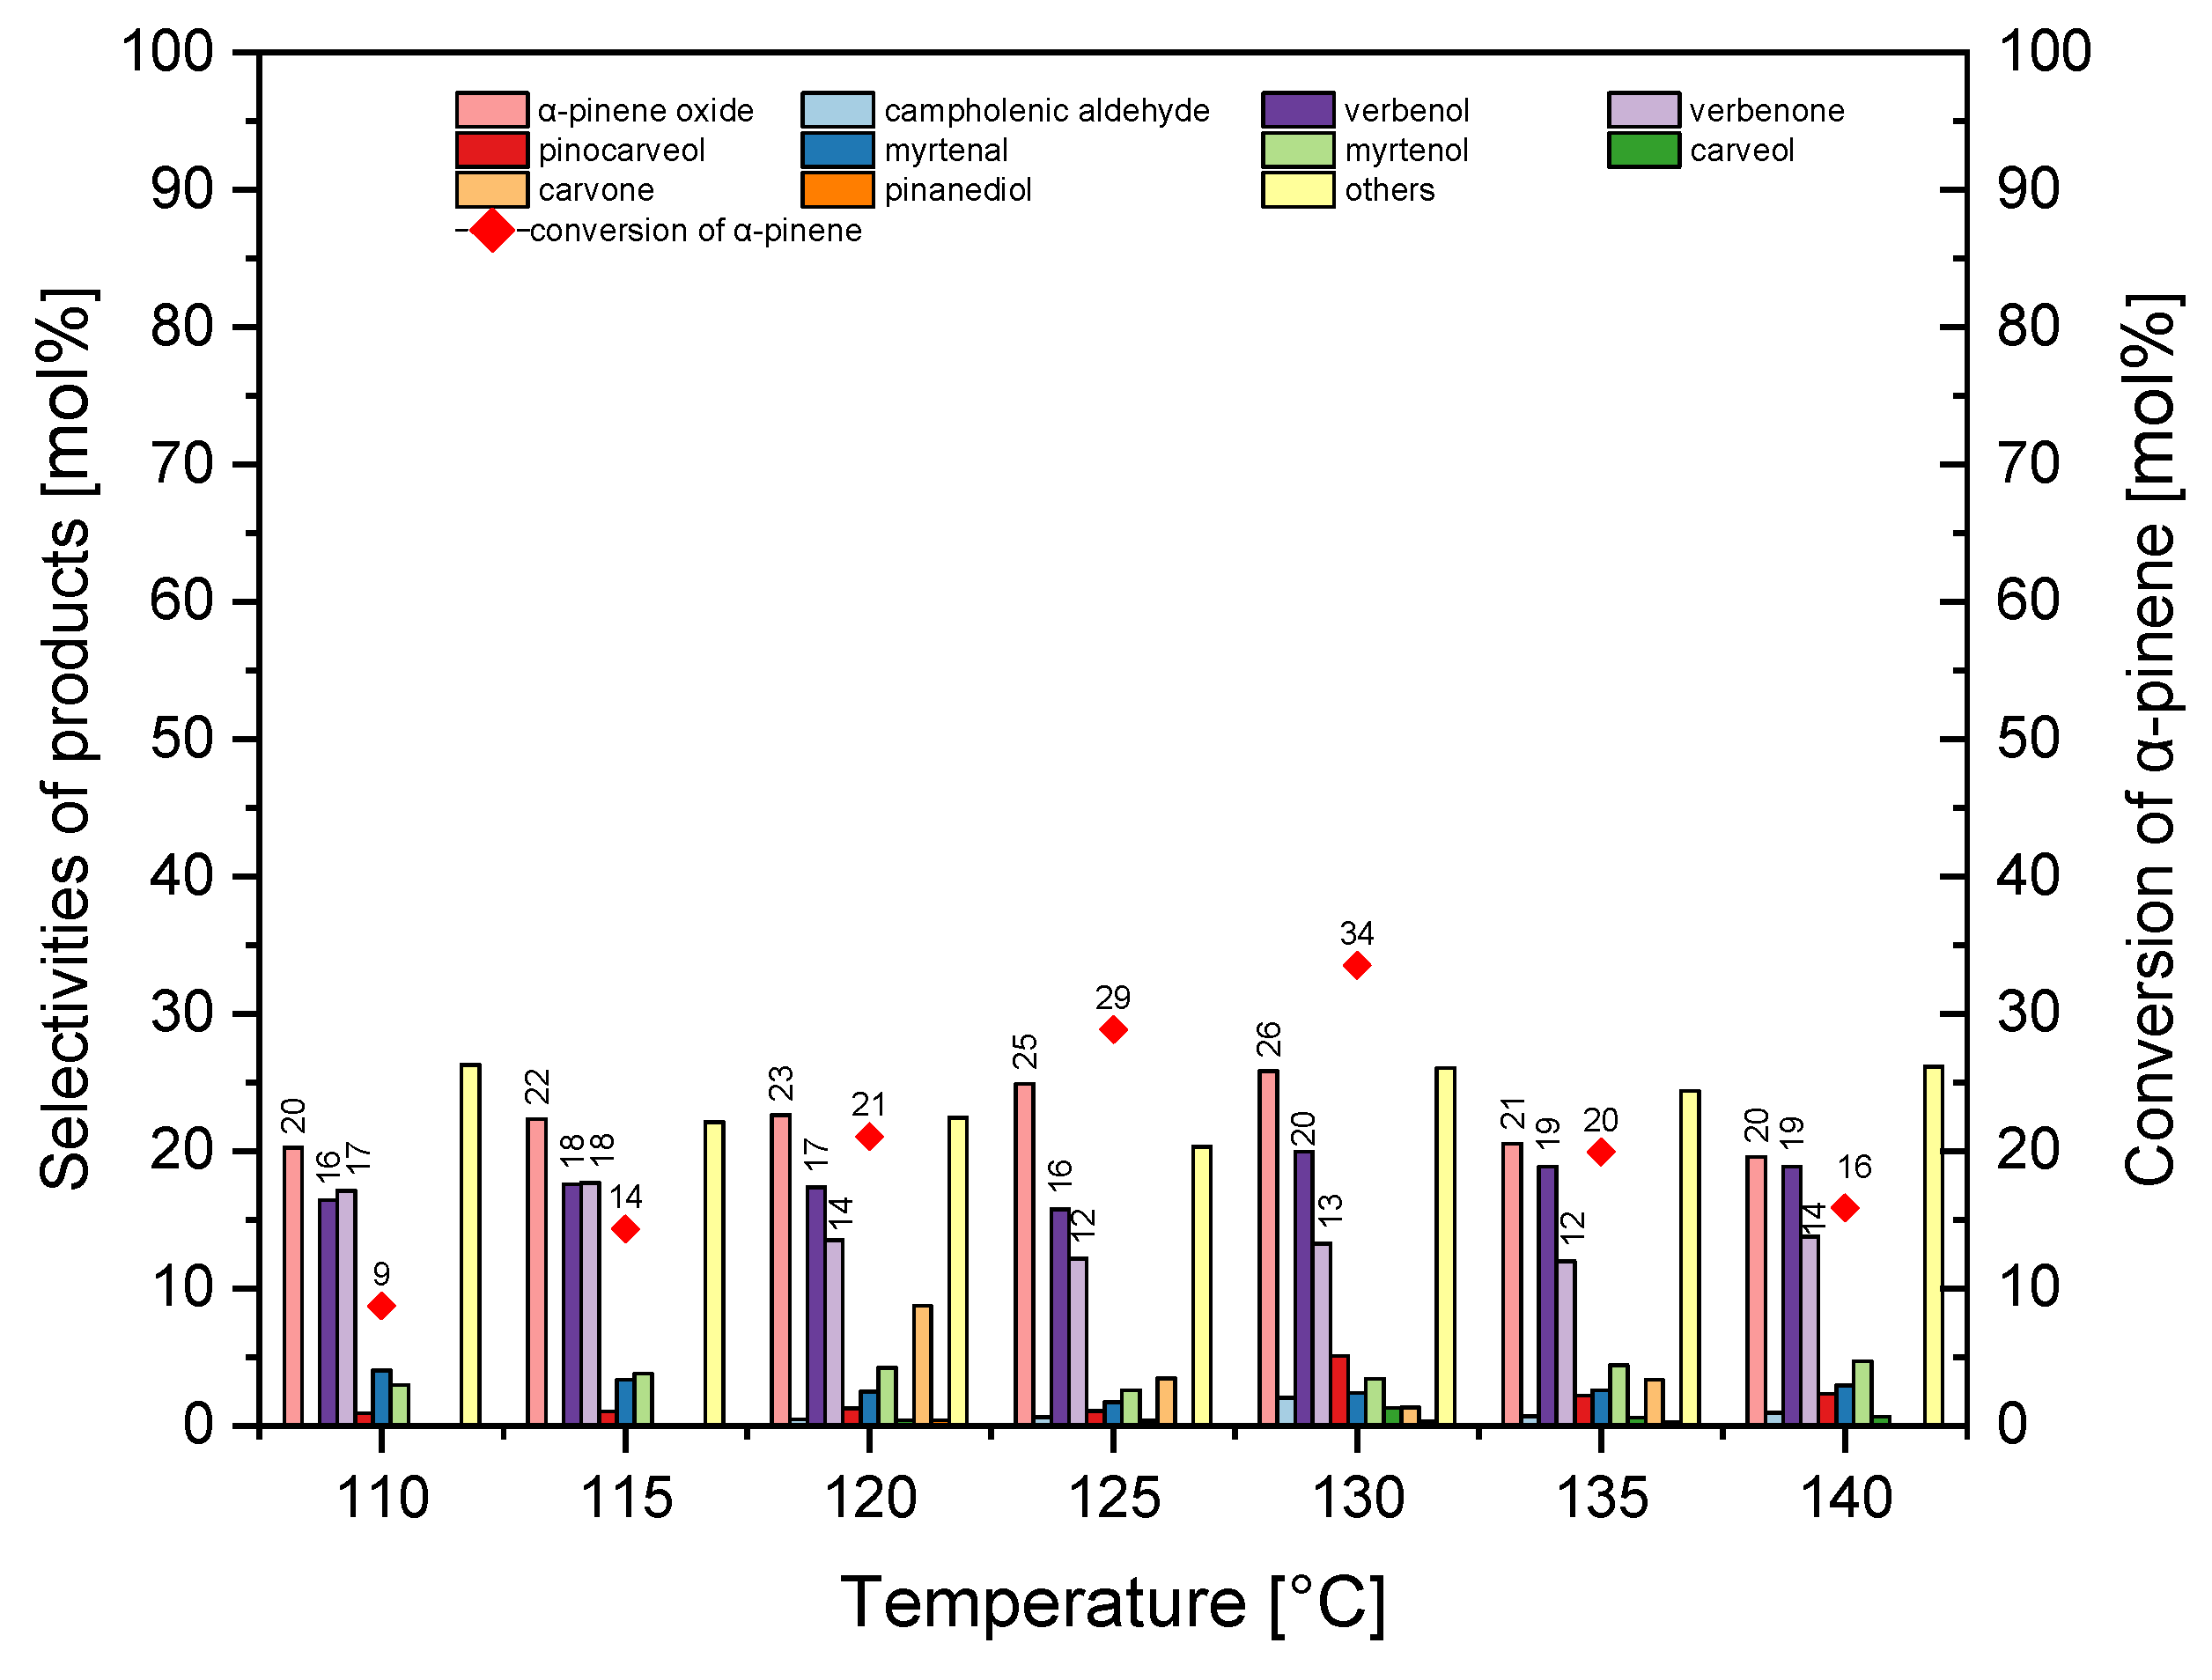
Figure 8 shows that increasing in the temperature from 110 °C to 130 °C increased the selectivity of α-pinene oxidation (the epoxy compound) from 20 mol% to 26 mol%, while increasing in the temperature from 130 °C to 140 °C decreased the selectivity of this epoxy compound from 26 mol% to 20 mol%.
In the temperature range of 110–140 °C, the selectivity of transformation to verbenol was in the range of 16–20 mol%. In the temperature range of 110–115 °C, selectivity of verbenone was about 17 mol%, and in the temperature range of 120–140 °C, its selectivity decreased slightly to 12–14 mol%. The increase in the temperature from 110 °C to 130 °C caused an increase in the conversion of α-pinene from 9 mol% to 34 mol%, but further increase in temperature from 130 °C to 140 °C caused a decrease in conversion of α-pinene from 34 mol% to 16 mol%. At this stage of the research, 130 °C was taken as the best temperature (taking into account conversion of α-pinene and the selectivity of α-pinene oxide).
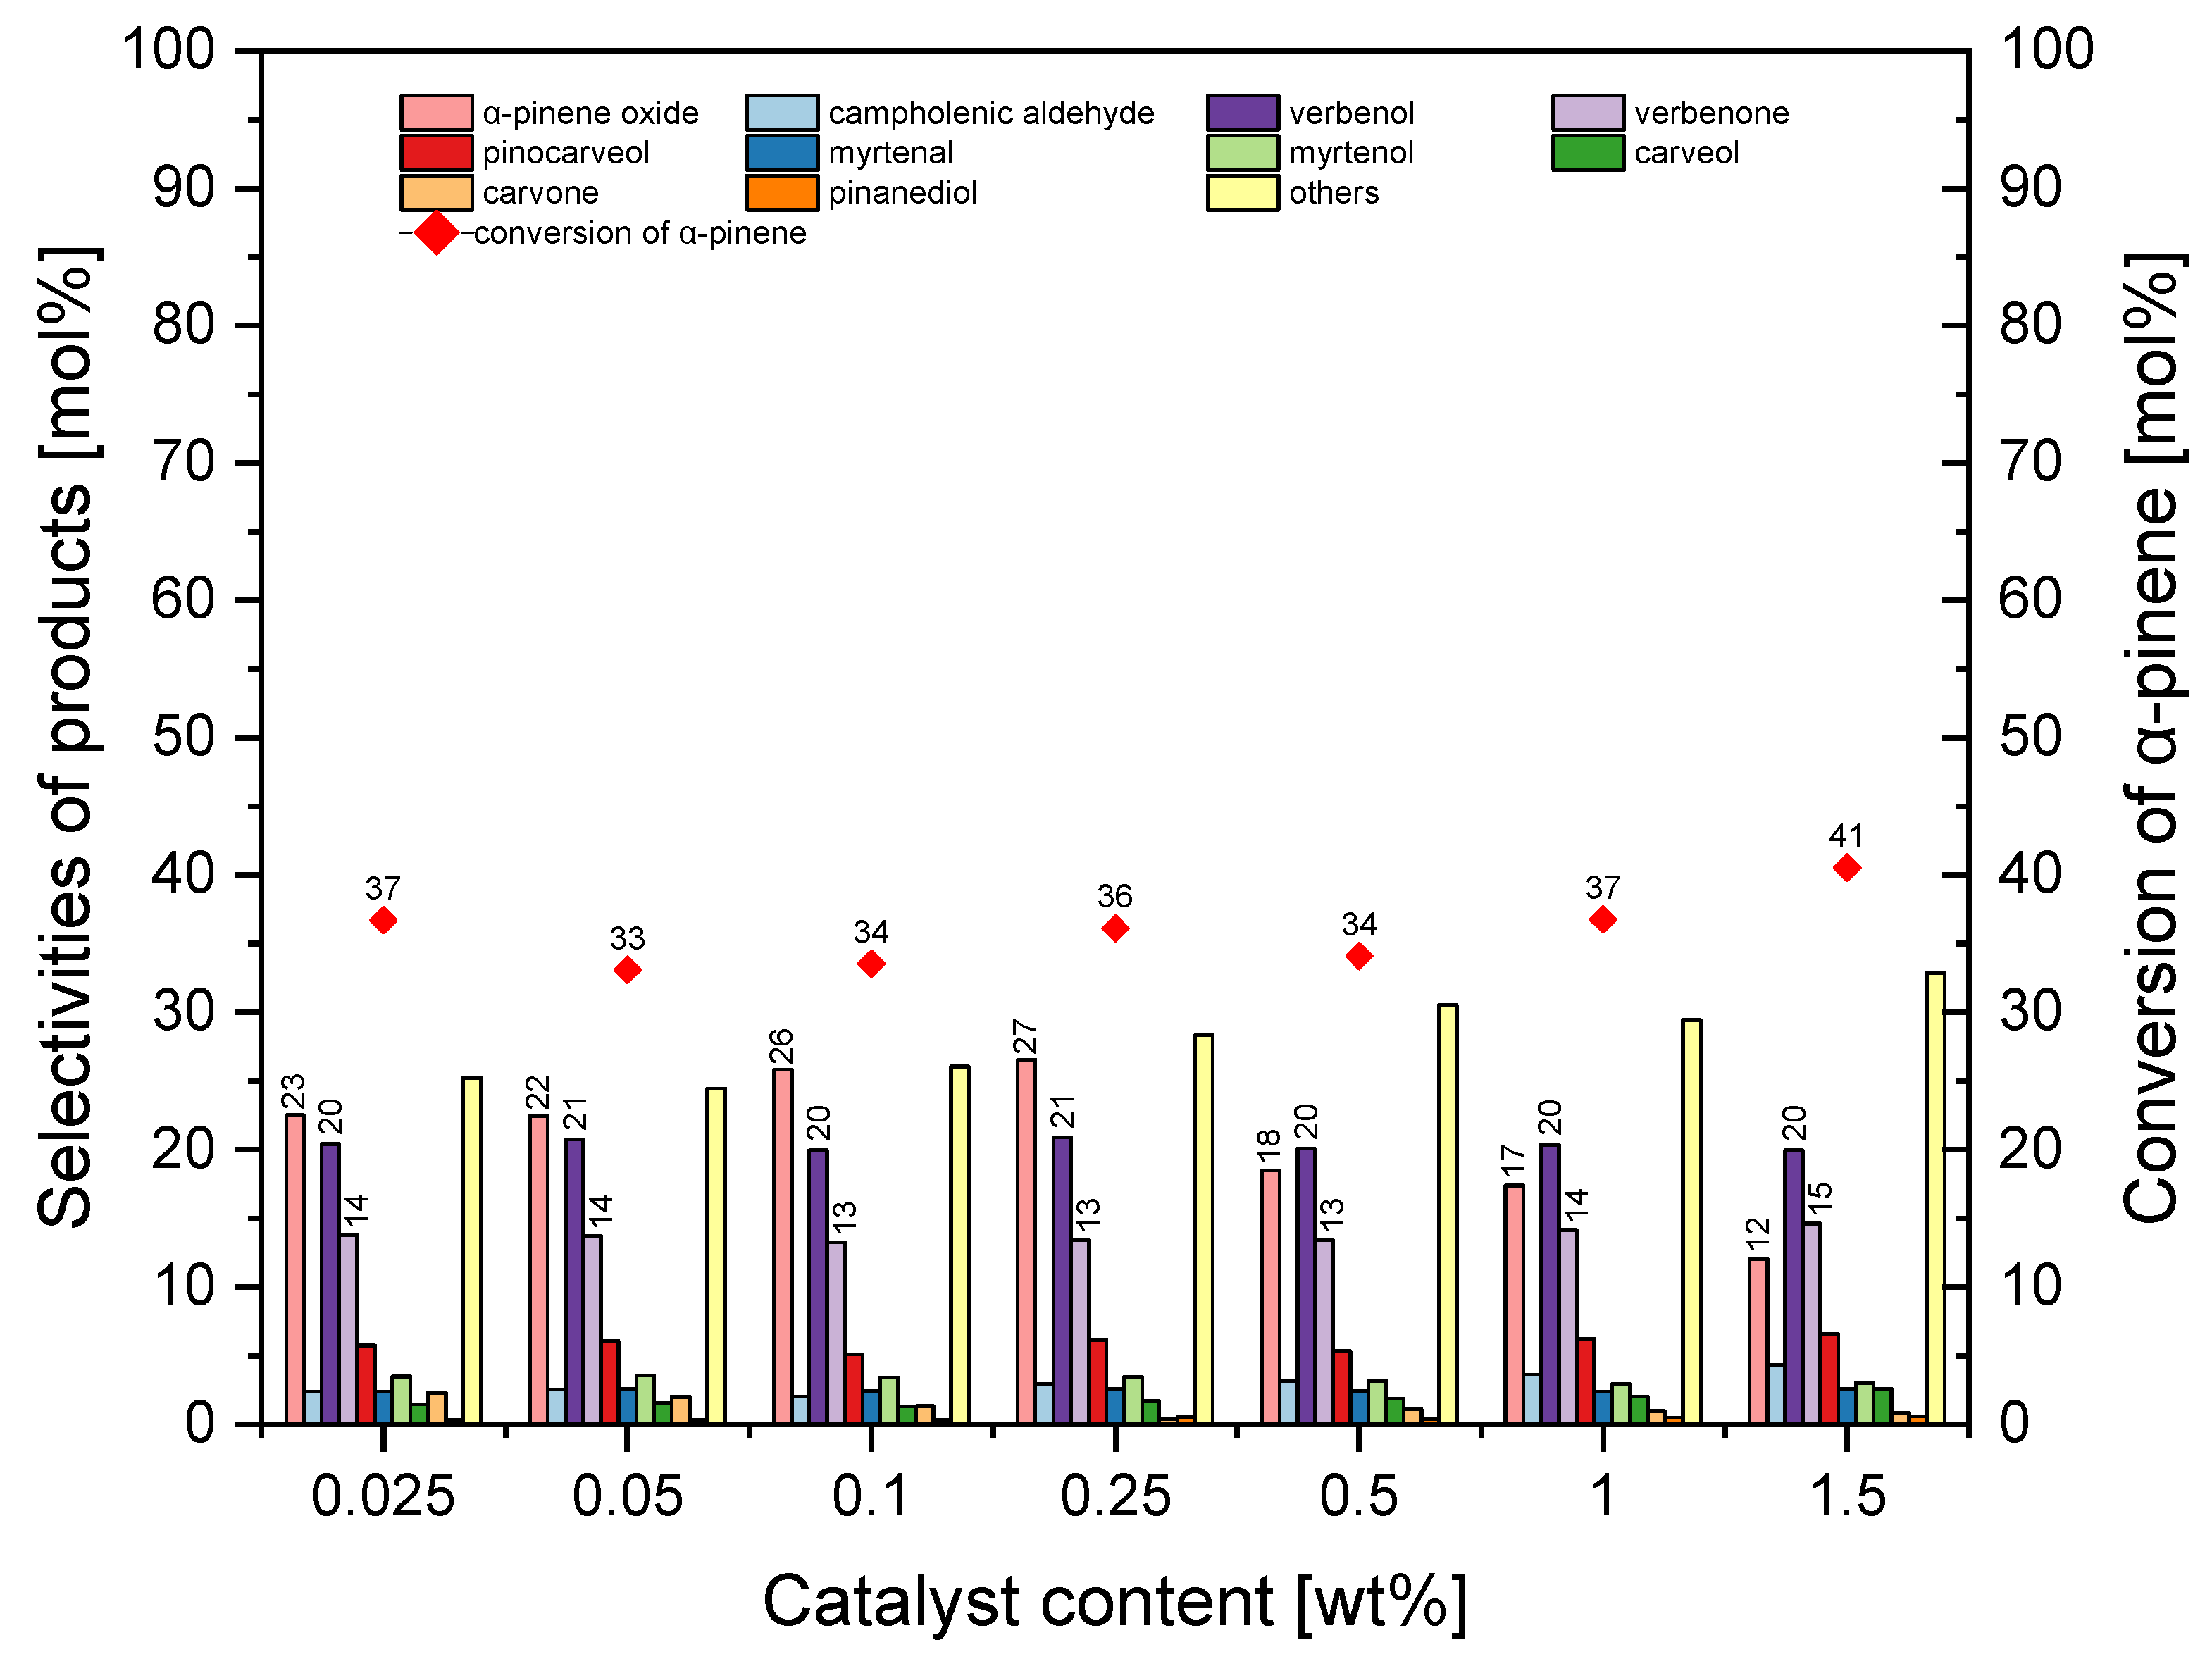
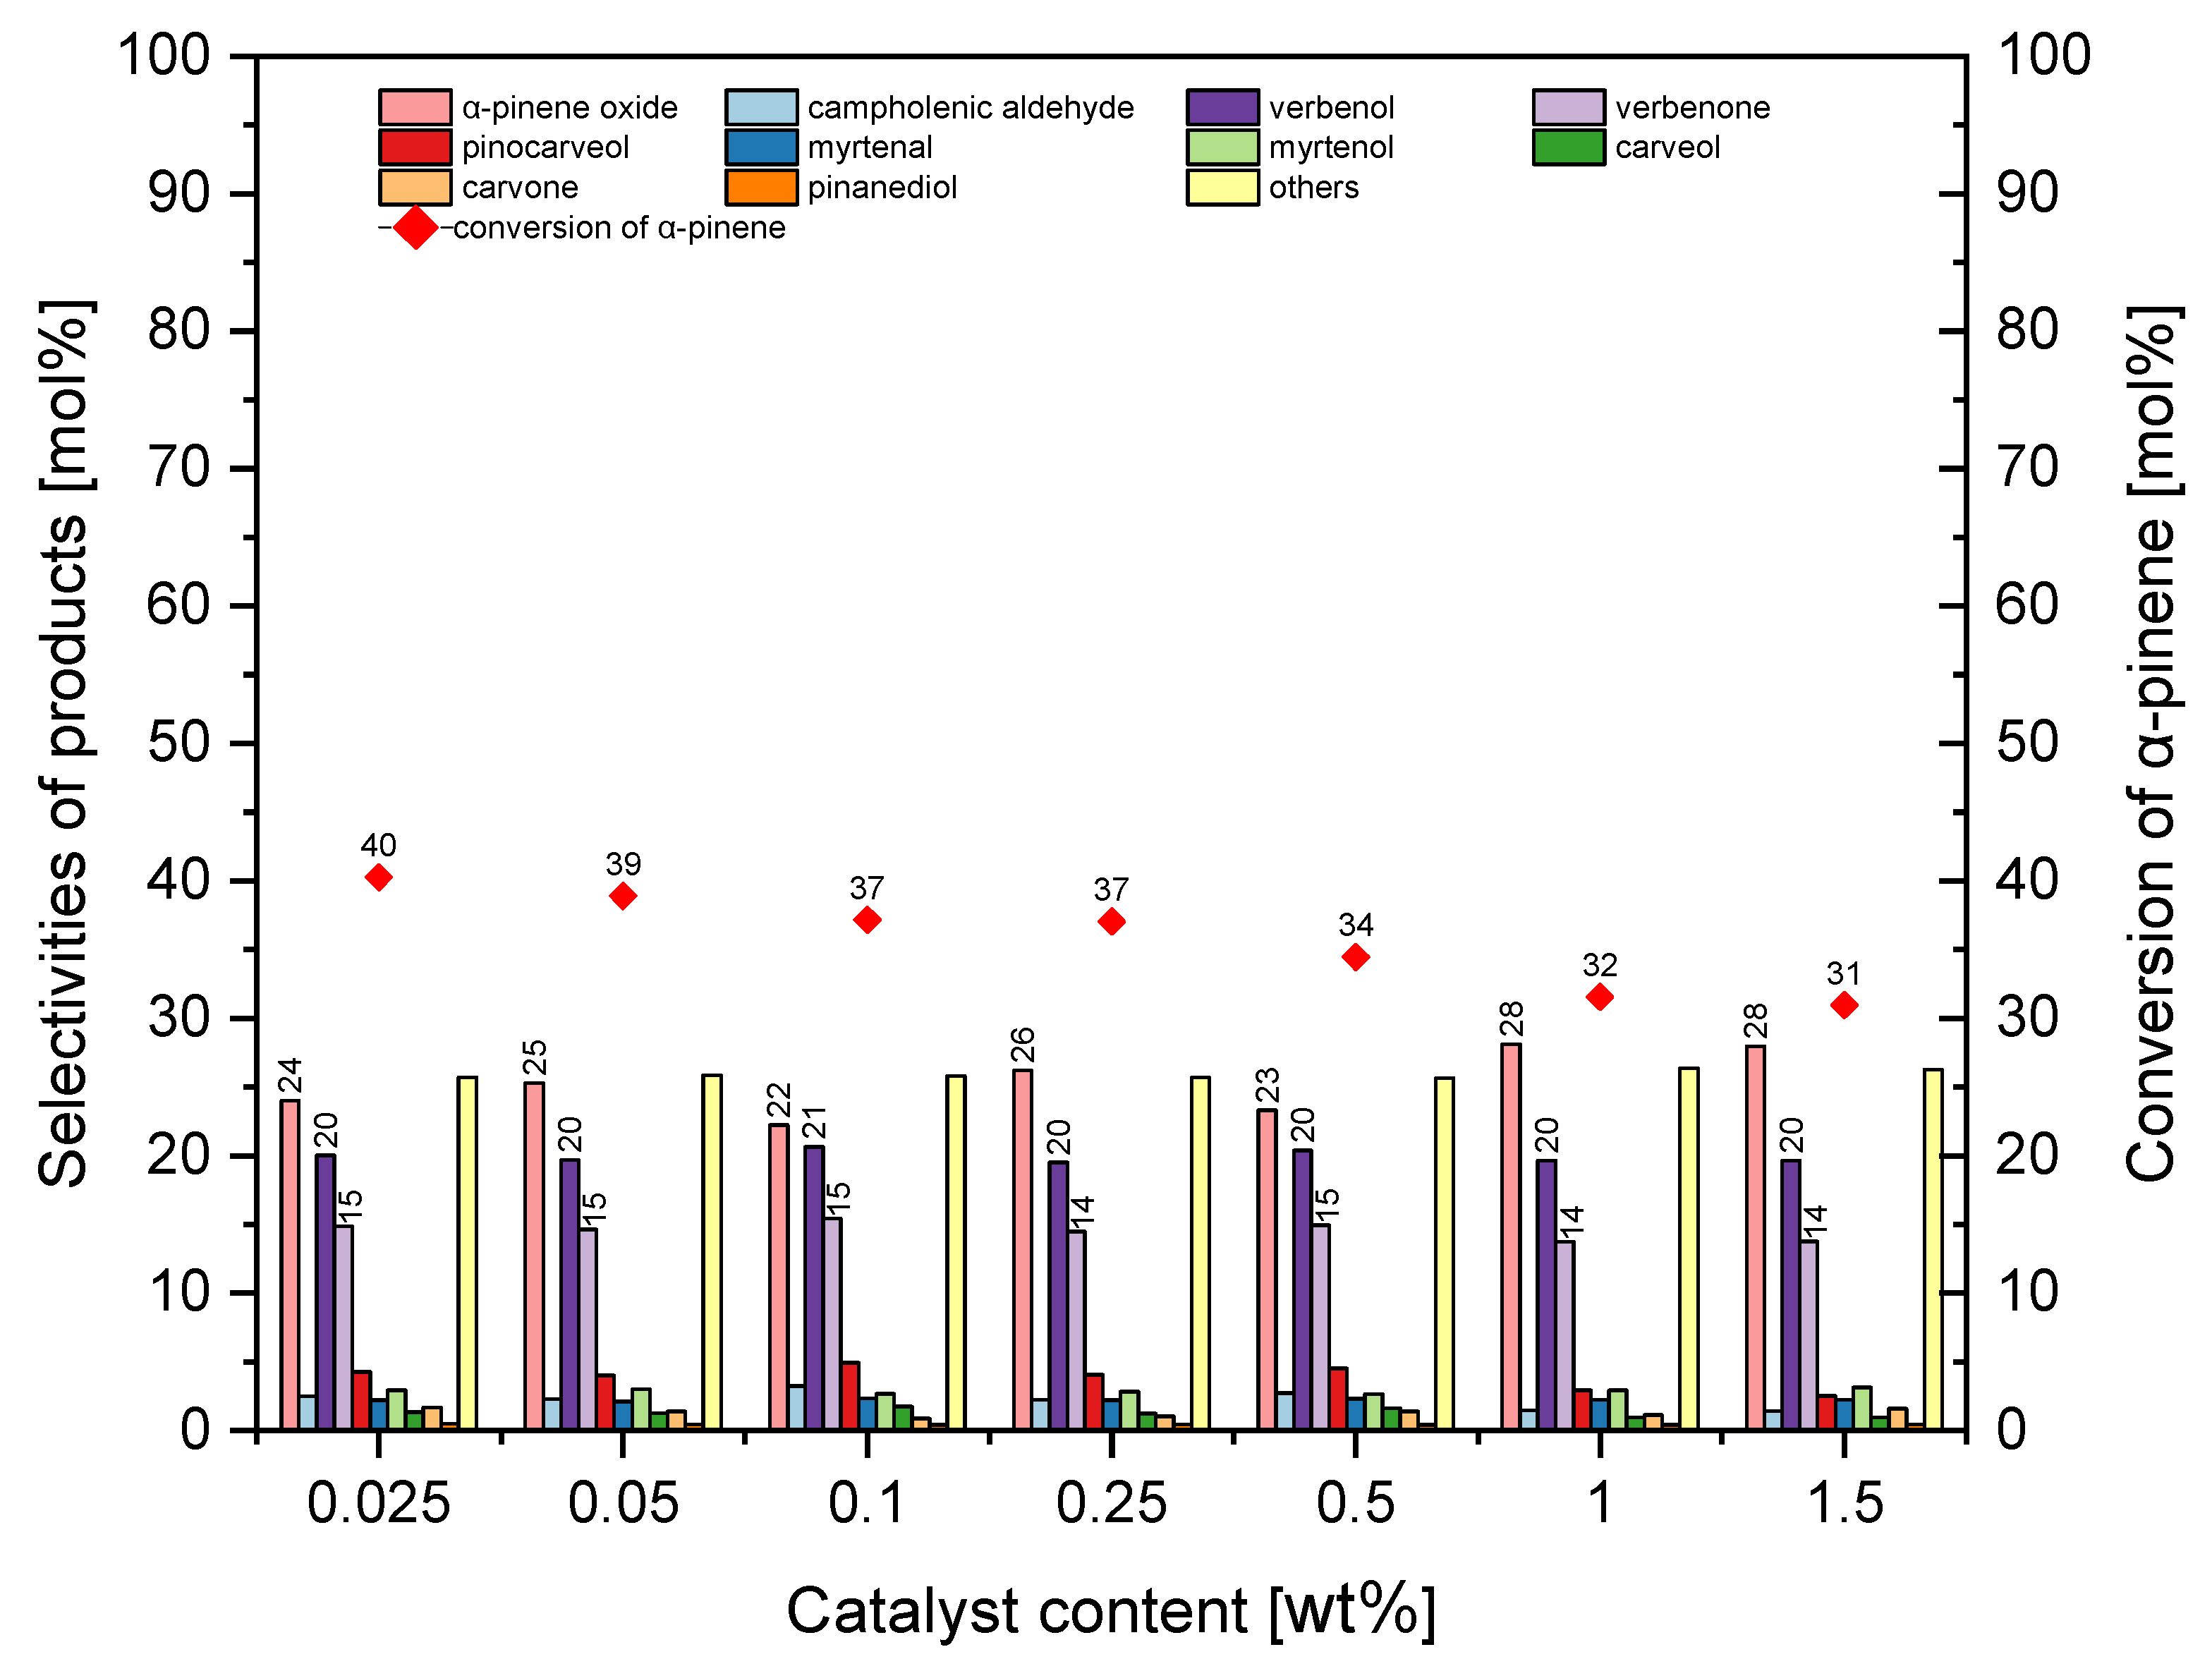
The second stage of catalytic testing of the MTS-1_1 material consisted of examining the influence of the amount of MTS-1_1 catalyst on the conversion of α-pinene and selectivity for the appropriate products. The results of these tests are shown in
Figure 9.
The
Figure 9 shows that the amount of MTS-1_1 material in the reaction mixture had a significant effect on the product selectivity. When the amount of catalyst was in the range of 0.025–0.25 wt%, α-pinene epoxide was the main oxidation product (its selectivity changed from 23 mol% to 27 mol%), while when the amount of catalyst was in the range of 0.5–1.5 wt%, verbenol was the main oxidation product (it selectivity was about 20 mol%). The selectivity of transformation to verbenone was almost constant across whole studied range of catalyst amounts, and it amounted to about 20 mol%. Across the whole studied range of catalyst content, the conversion of α-pinene was in the range of 33–41 mol%. The lack of a proportional increase in conversion of α-pinene with the increase in the catalyst content in the reaction mixture indicated that the reaction was affected by mass transfer limitations; once the number of active sites was excessive, diffusion of α-pinene to these sites became the limiting factor (not all active sites were utilized). In contrast, extending the reaction time allowed a gradual utilization of active centers, which explains the observed increase in conversion with longer reaction times.
At this stage of the research, the most favorable amount of MTS-1_1 material was taken to be 0.25 wt% (taking into account the selectivity of α-pinene oxide and conversion of α-pinene).
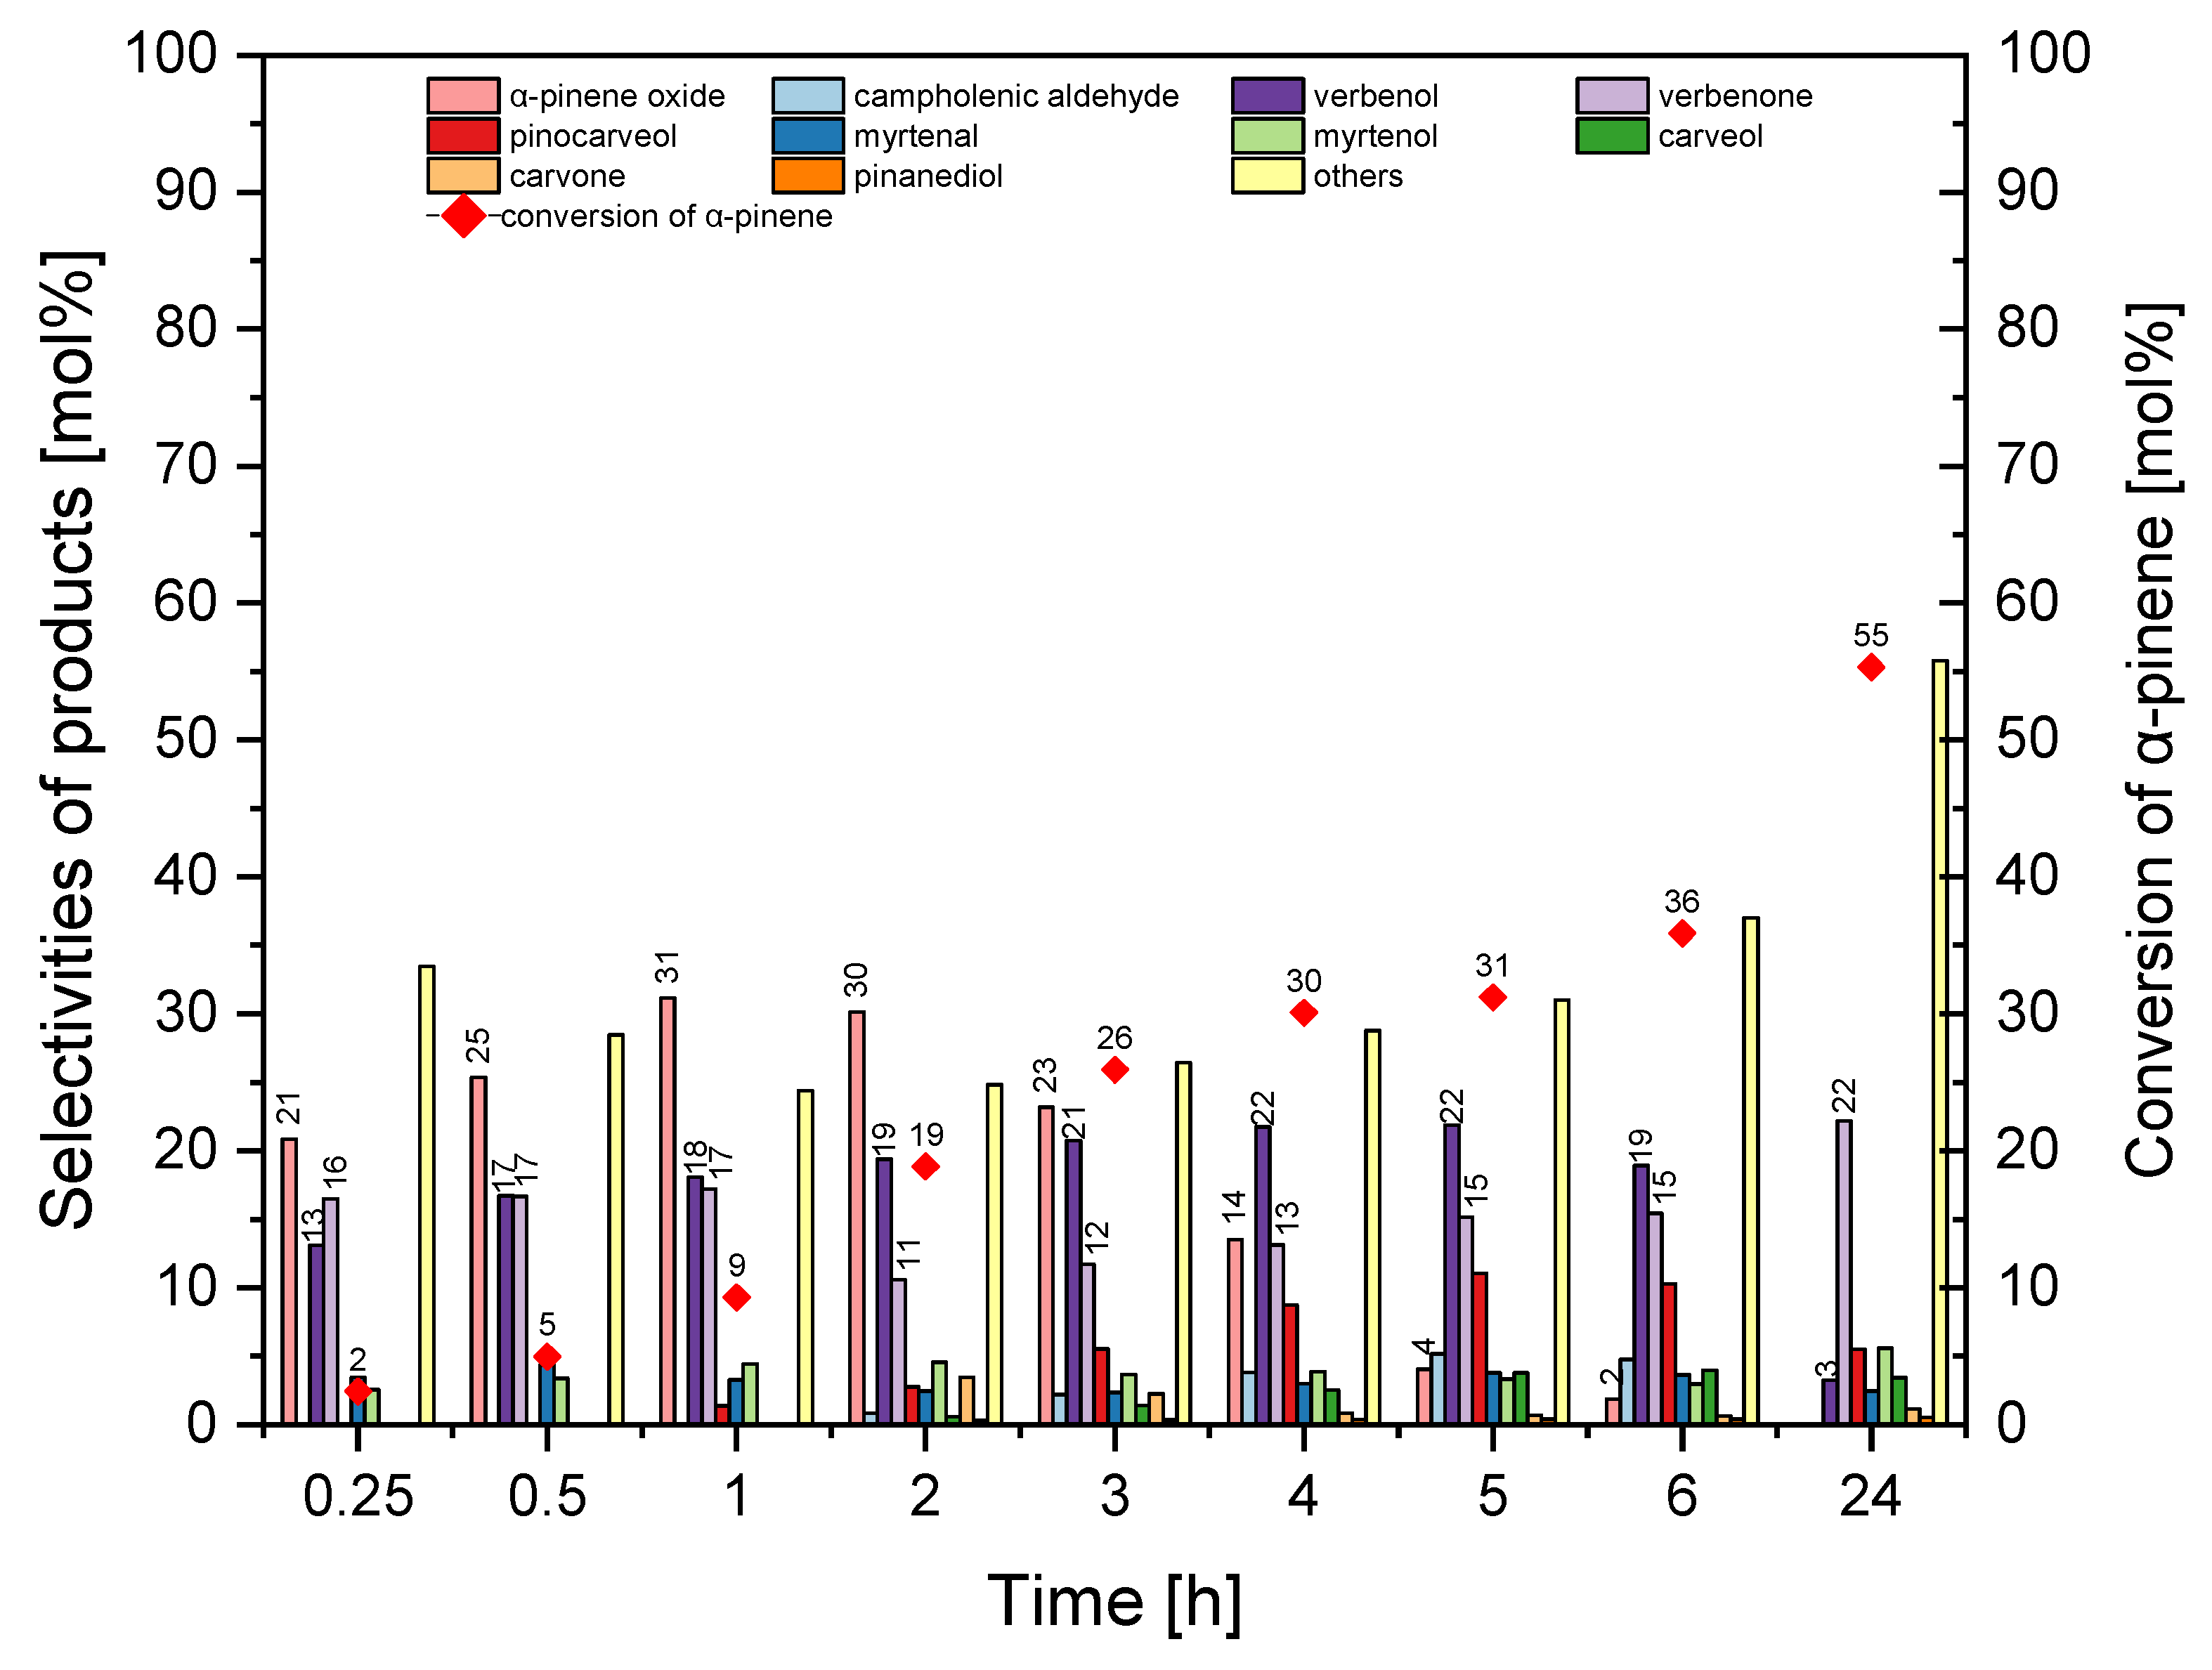
The third stage of our studies were the tests on the effect of reaction time on the conversion of α-pinene and selectivity for the appropriate products (
Figure 10).
Figure 10 shows that prolongation of the reaction time from 0.25 h to 1 h caused an increase in the selectivity of transformation to α-pinene oxide from 21 mol% to 31 mol%, but further extension of reaction time from 1 h to 24 h caused a decrease in the selectivity of α-pinene oxide from 31 mol% to 0 mol%. Moreover, the extension of the reaction time from 0.25 h to 5 h increased the selectivity of verbenol from 13 mol% to 22 mol%, while further prolongation of the reaction time from 5 h to 24 h caused a decrease in the selectivity of transformation to verbenol from 22 mol% to 3 mol%. In the range of reaction time of 0.25–6 h, verbenone selectivity ranged from 11–17 mol%, and with a 24 h reaction time, verbenone selectivity was the highest and amounted to 22 mol%.
Figure 10 illustrates that prolongation of the reaction time from 0.25 h to 24 h increased conversion of α-pinene from 2 mol% to 55 mol%. At this stage, the most favorable reaction time was taken to be 2 h (taking into account the selectivity of α-pinene oxide and conversion of α-pinene).
The second catalyst used in the α-pinene oxidation was the material named MTS-1_2. At the first stage of the catalytic tests, the effect of temperature on the conversion of α-pinene and selectivity for the appropriate products was studied. The obtained results are shown in
Figure 11.
Figure 11 illustrates that an increase in the temperature from 110 °C to 120 °C increased the selectivity of the transformation to epoxide compound from 15 mol% to 22 mol%, while increase in the temperature from 120 °C to 140 °C decreased the selectivity for the epoxide compound from 22 mol% to 15 mol%. The increase in the temperature from 110 °C to 120 °C increased the selectivity for verbenol from 14 mol% to 21 mol%, while increasing the temperature from 120 °C to 140 °C caused a decrease in the selectivity for verbenol from 21 mol% to 13 mol%. Between the temperatures of 110 and 140 °C, verbenone selectivity was in the range of 11–15 mol%. Moreover, it is apparent that the increase in temperature from 110 °C to 120 °C increased the conversion of α-pinene from 29 mol% to 37 mol%, but further increase in the temperature from 120 °C to 140 °C decreased the conversion of α-pinene from 37 mol% to 20 mol%. At this stage of the research, the best temperature was taken to be 120 °C (taking into account the conversion of α-pinene and the selectivity of α-pinene oxide).
In the second stage of the catalytic tests of the MTS-1_2 material, we investigated the influence of the amount of MTS-1_2 material in the reaction mixture on the conversion of α-pinene and the selectivity for the appropriate products. The results of these tests are shown in
Figure 12.
In the studied range of amounts of MTS-1_2 catalyst in the reaction mixture, the selectivity of α-pinene oxide was in the range of 22–28 mol%. On the other hand, the selectivity for the transformation to verbenol was almost constant and amounted to about 20 mol%, and for verbenone, it was about 15 mol%. It is apparent from
Figure 12 that the increase in the amount of MST-1_2 catalyst in the reaction mixtures from 0.025 wt% to 1.5 wt% caused a reduction in conversion of α-pinene from 40 mol% to 31 mol%. At this stage of the research, the most favorable amount of MTS-1_2 was taken as 0.25 wt% (taking into account the conversion of α-pinene and the selectivity of α-pinene oxide).
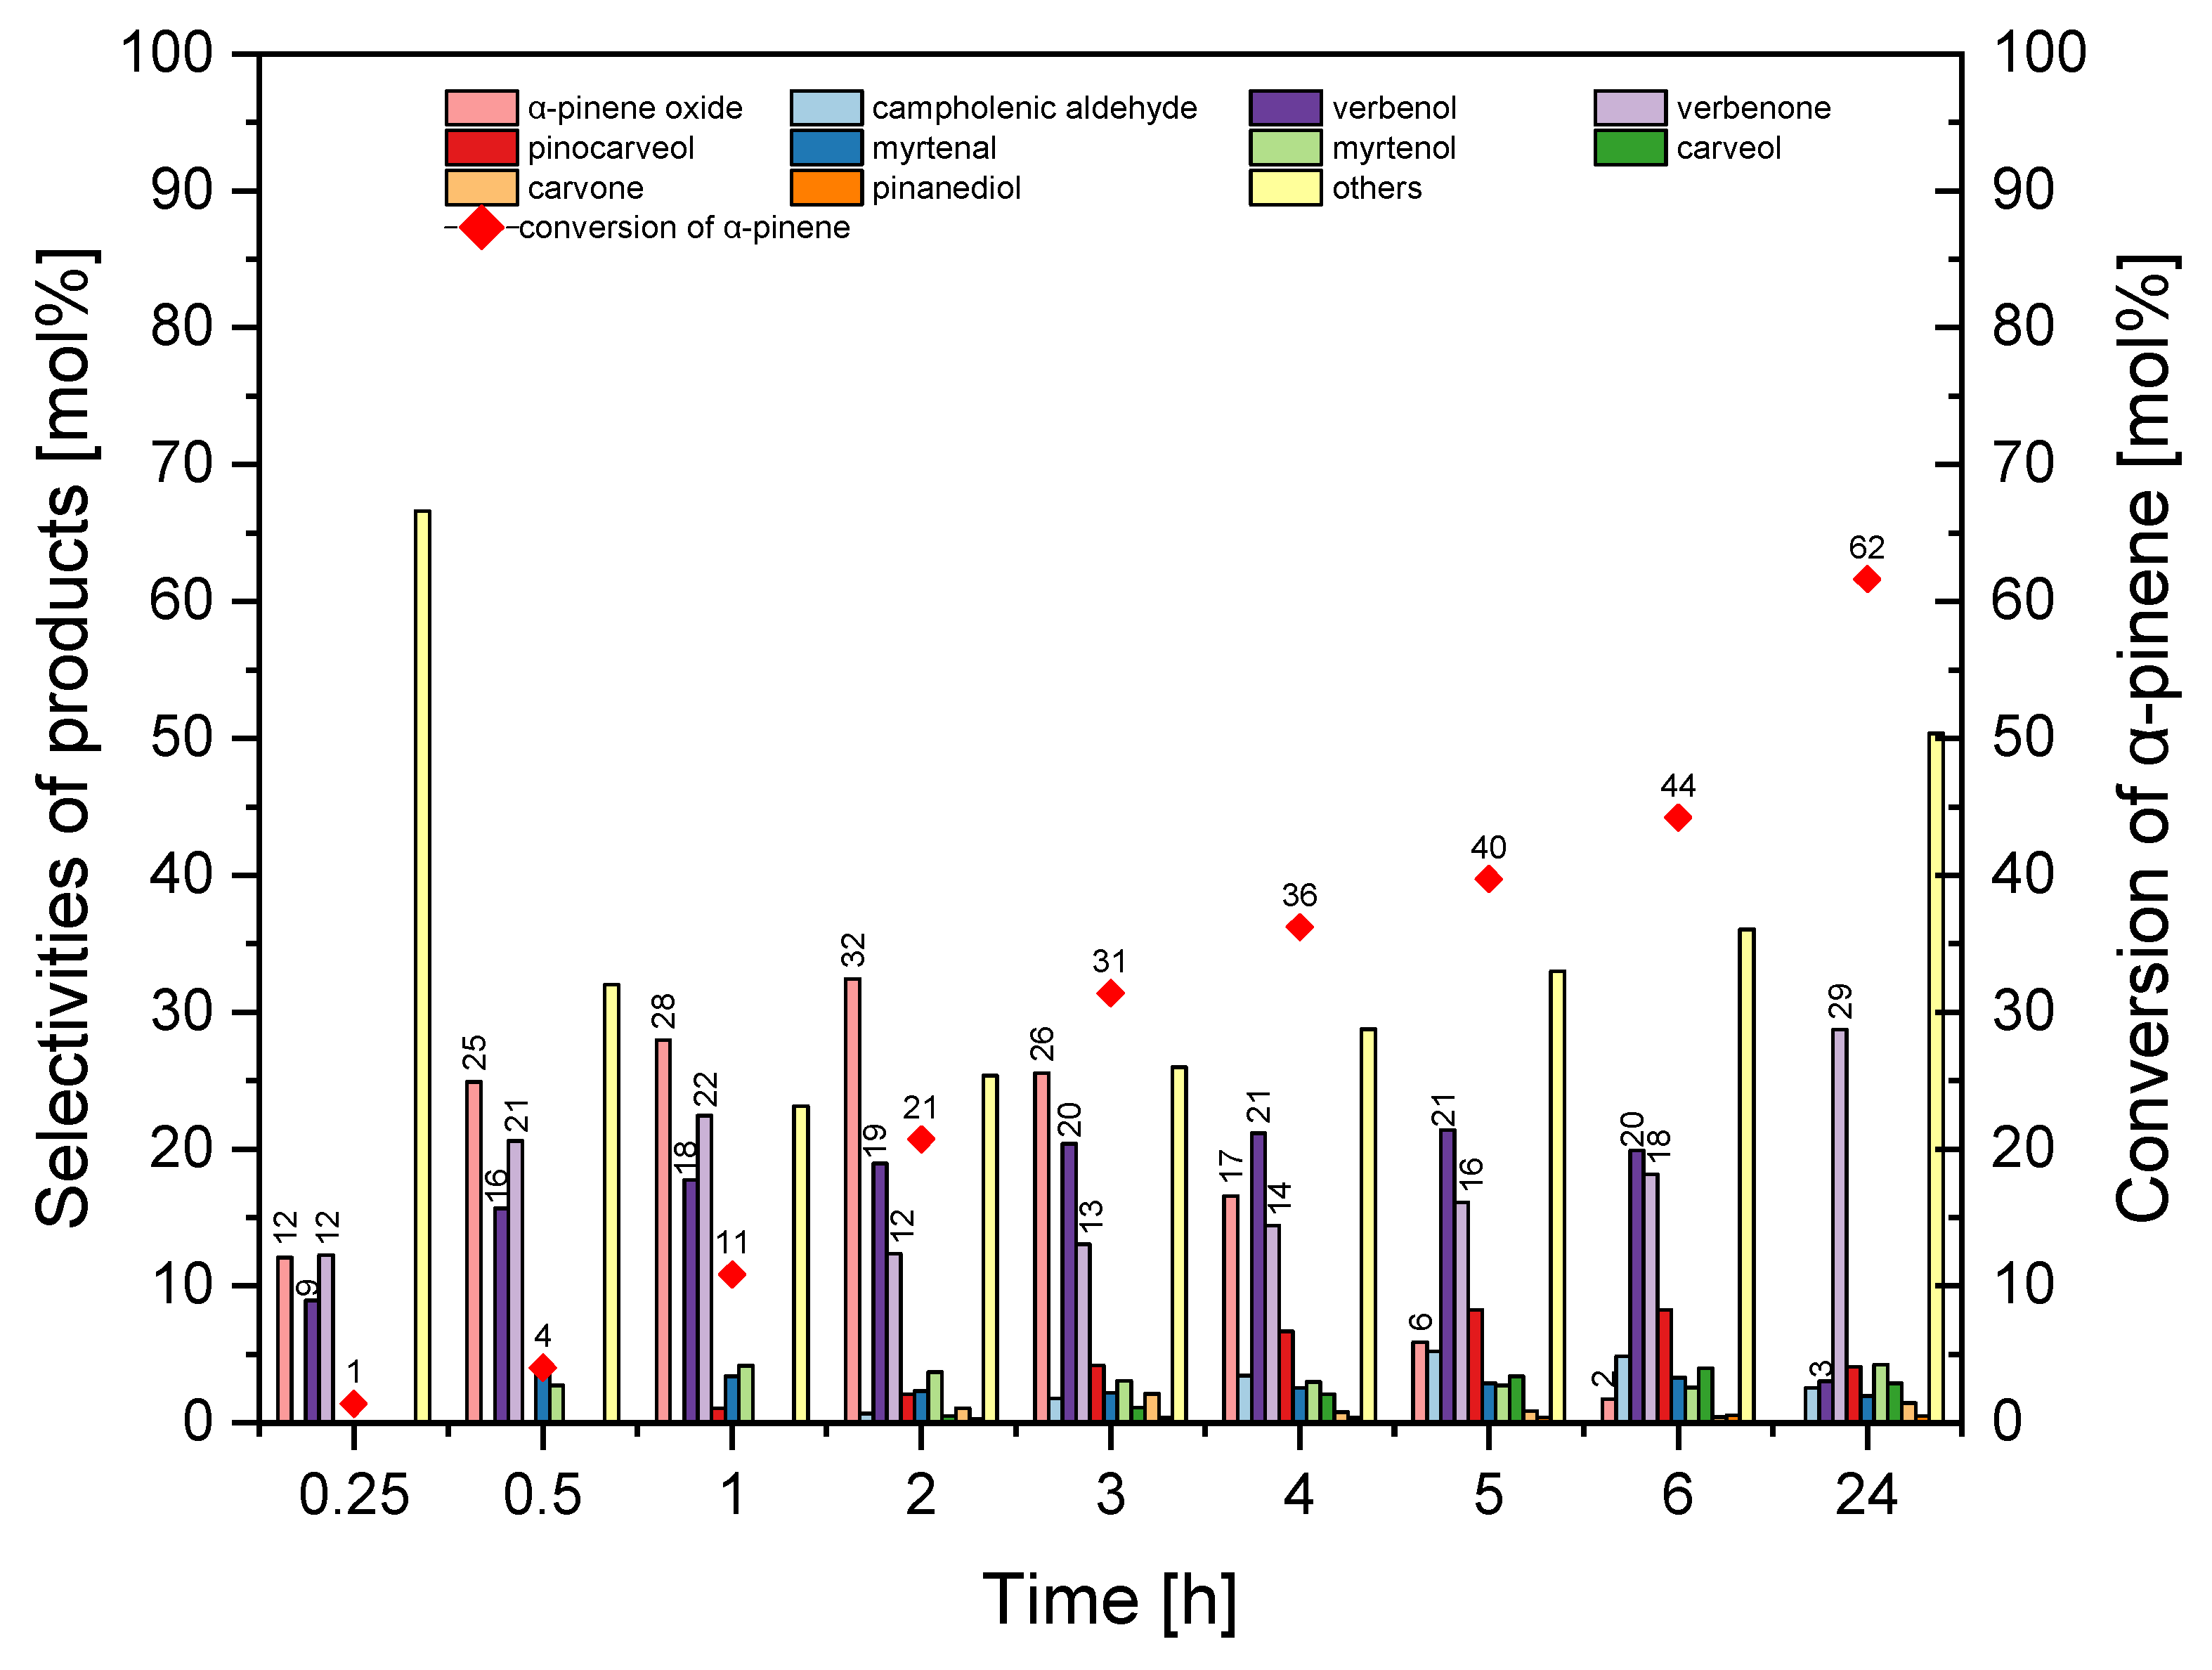
The third stage of our studies with the MTS-1_2 catalyst were the tests on the effect of reaction time on the conversion of α-pinene and selectivity for the appropriate products (
Figure 13).
Figure 13 shows that with the prolongation of the reaction time from 0.25 h to 2 h there was a visible increase in selectivity for α-pinene oxide, which increased from 12 mol% to 32 mol%. However, in the range of reaction time from 2 h to 24 h, selectivity for α-pinene oxide decreased from 32 mol% to 0 mol%. Moreover, changing the reaction time from 0.25 h to 24 h caused an increase in selectivity for verbenone from 12 mol% to 30 mol%. Selectivity of transformation to verbenol increased from 9 mol% to 20 mol% (reaction time 5 h) but with a longer reaction time (24 h), it decreased to 3 mol%.
Figure 13 shows that prolongation of the reaction time from 0.25 h to 24 h increased the conversion of α-pinene from 1 mol% to 62 mol%. At this stage, the most favorable reaction time was taken tp be 2 h (taking into account the selectivity of α-pinene oxide and the conversion of α-pinene).
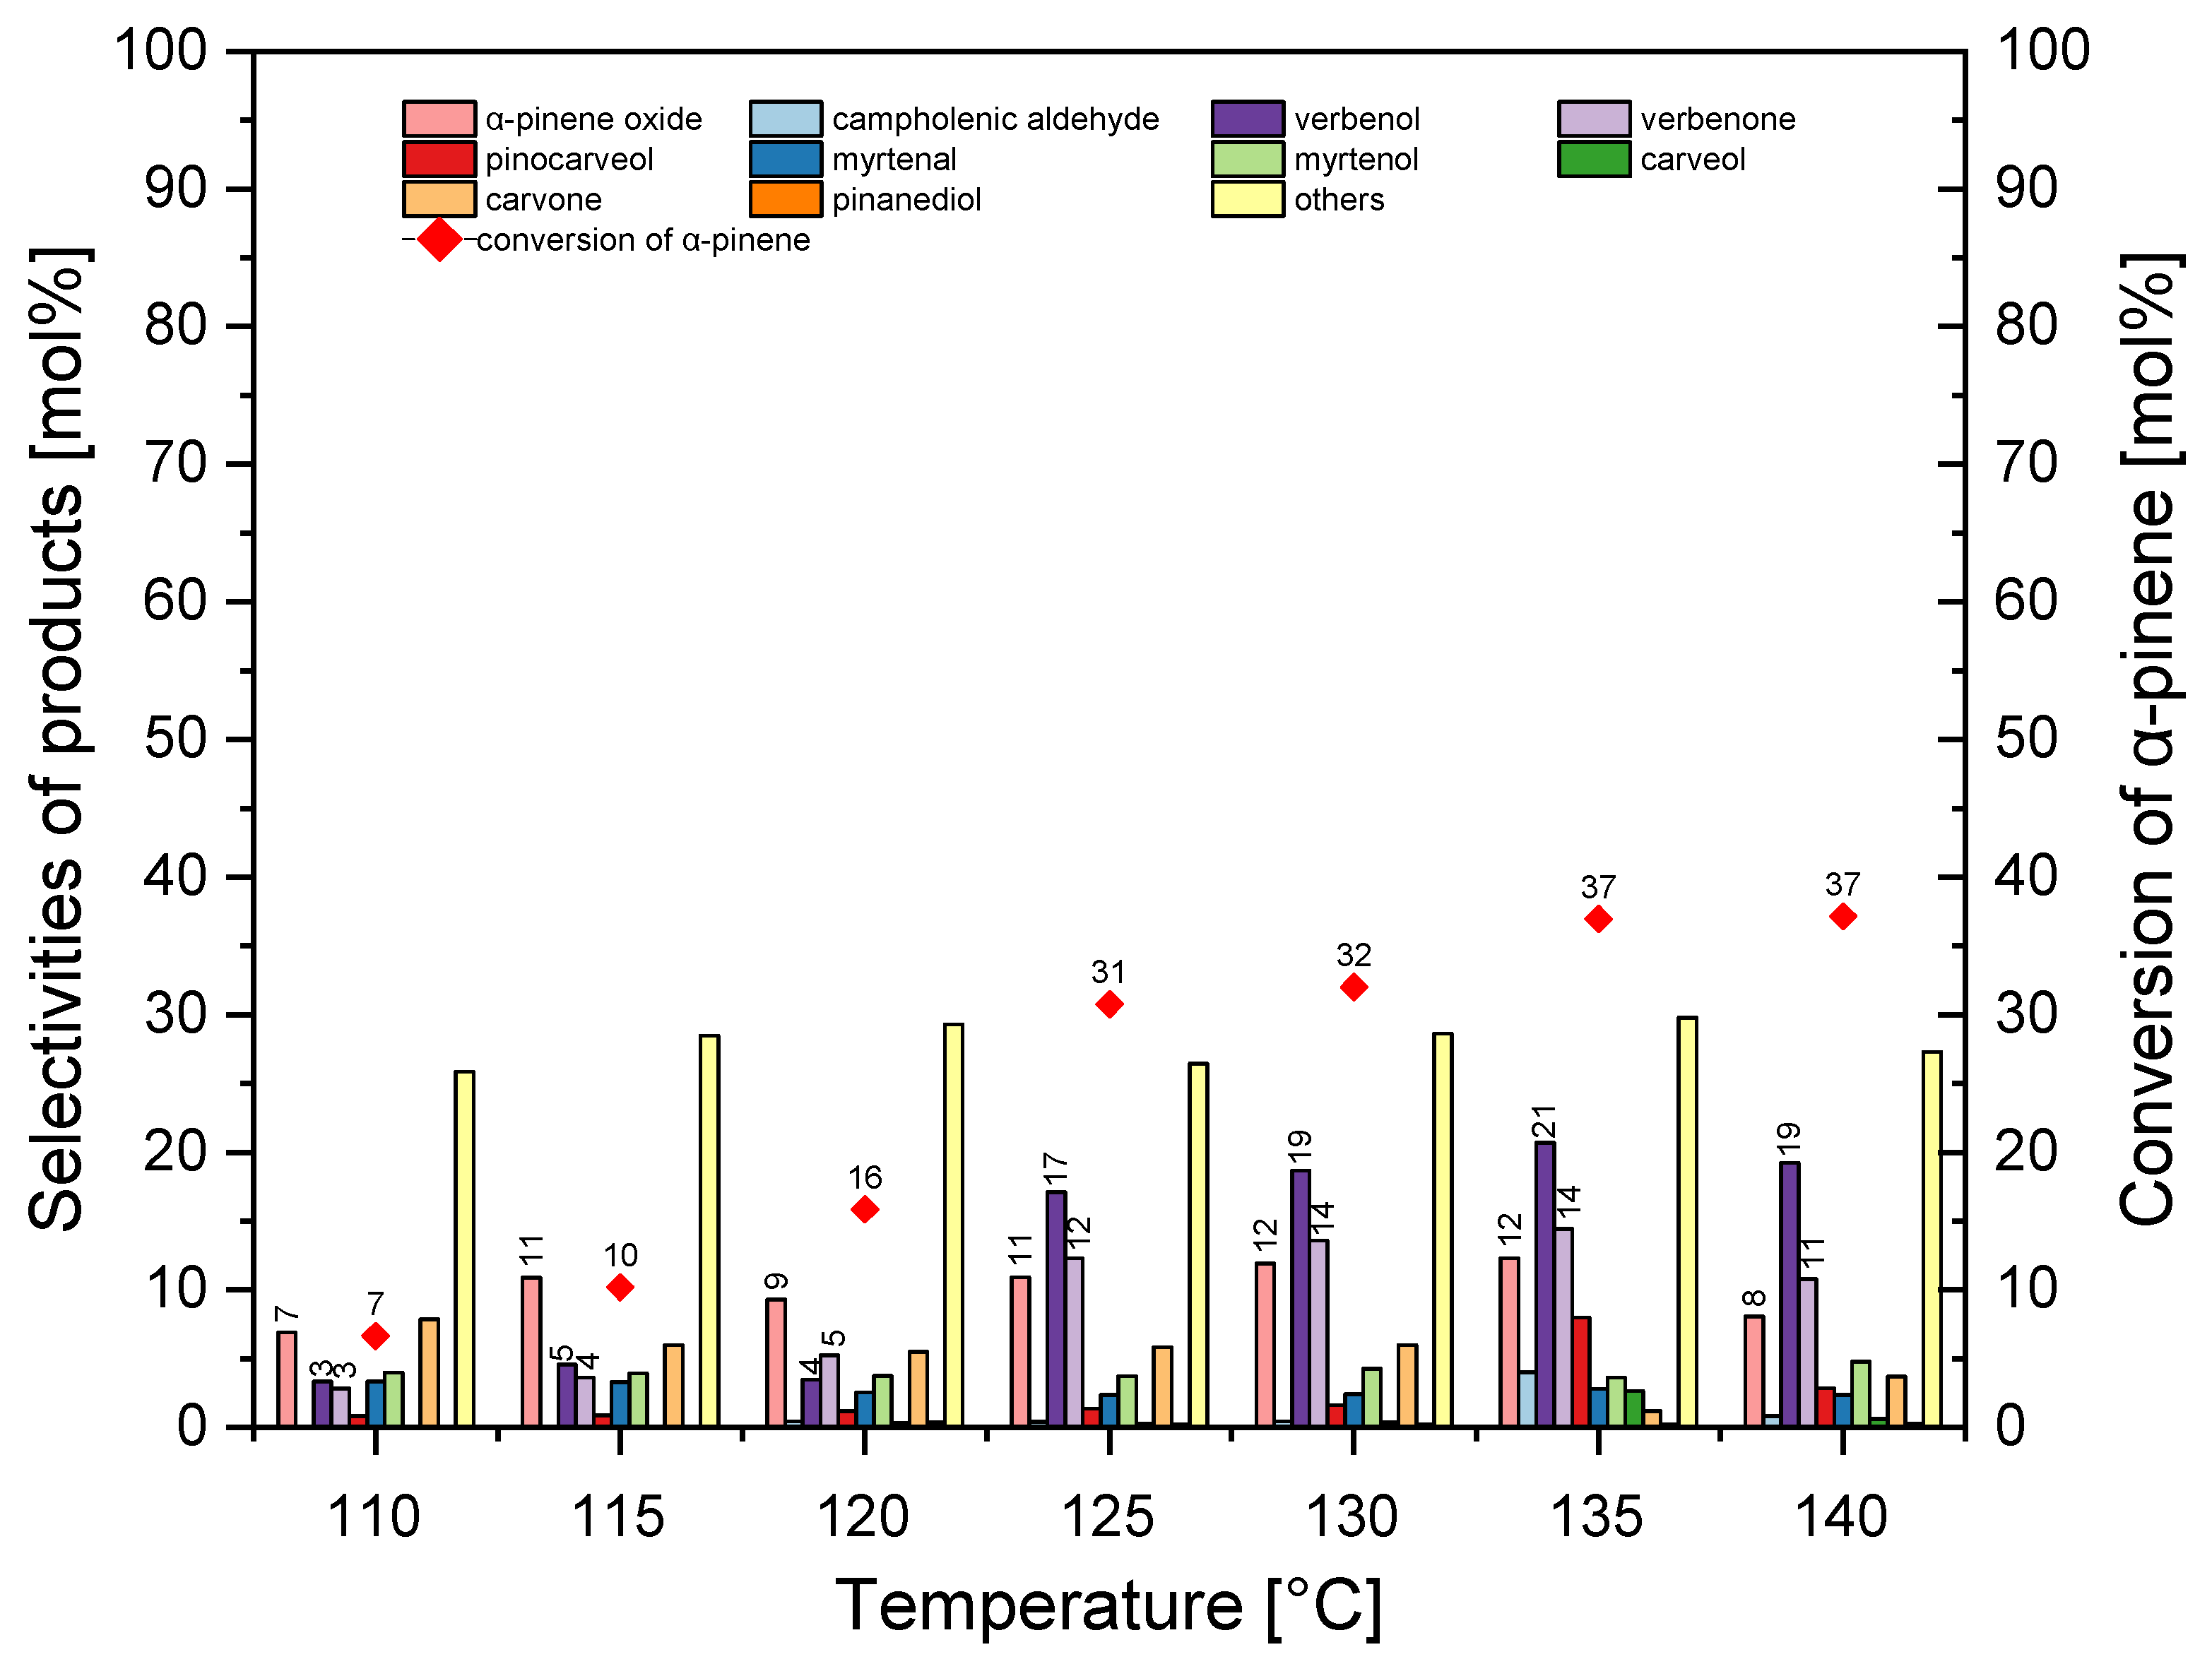
HTS-1_1 was the third catalyst which was used for the oxidation of α-pinene. The studies of the effect of temperature on the conversion of α-pinene and selectivity for the appropriate products were performed at the first stage of the catalytic tests of the HTS-1_1 material, and the results of these tests are shown in
Figure 14.
In the temperature range studied, the selectivity for α-pinene epoxide was in the range of 7–12 mol%. In the temperature range of 110–120 °C, the selectivity for verbenol was about 4 mol%, and during the studies in the temperature range of 125–140 °C it was about 19–20 mol%. The increase in the temperature from 110 °C to 135 °C increased the selectivity for verbenone from 3 mol% to 15 mol%, and this selectivity then slightly decreased to 11 mol%. During our test, the increase in the temperature from 110 °C to 140 °C caused an increase in the conversion of α-pinene from 7 mol% to 37 mol%. At this stage of the study, the best temperature was taken to be 135 °C (taking into account the selectivity of α-pinene oxide and the conversion of α-pinene).
At the second stage of catalytic tests with the HTS-1_1 material, the effect of the amount of HTS-1_1 material in the reaction mixture on α-pinene conversion and appropriate product selectivity was examined, and the results of these tests are shown in
Figure 15.
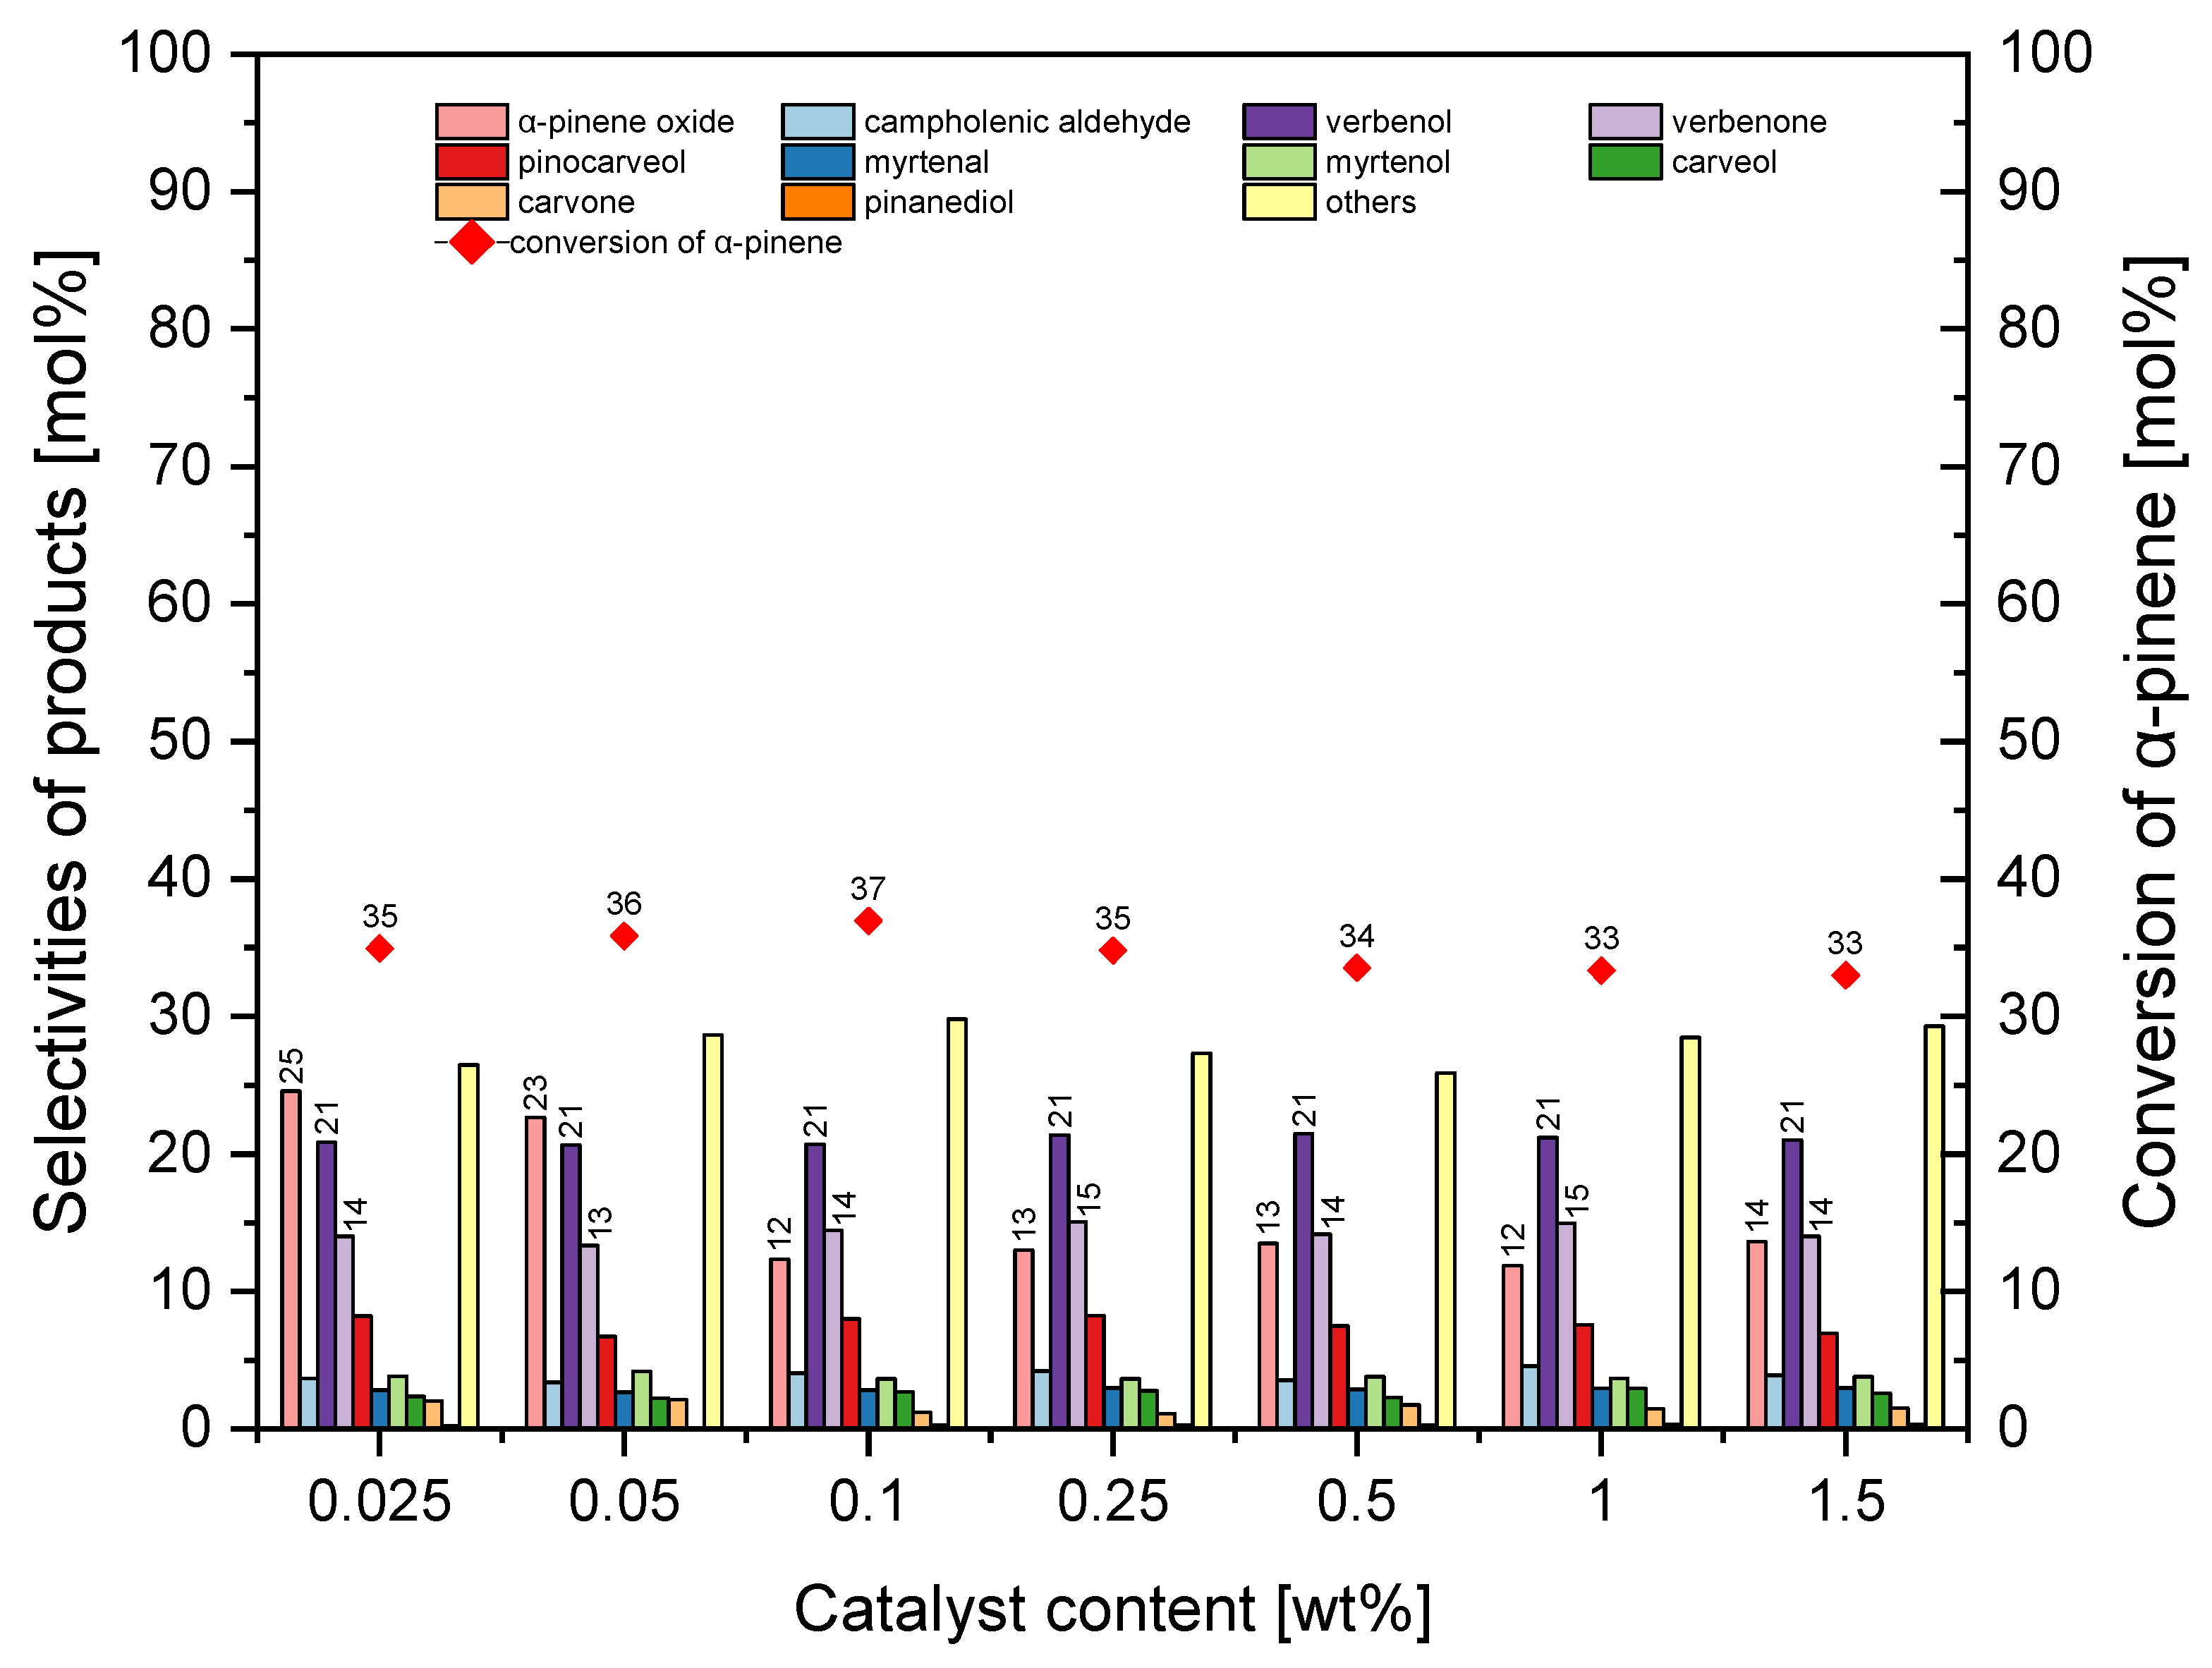
The amount of HTS-1_1 catalyst had a significant effect on the selectivity of α-pinene oxide and verbenol. The use of trace amounts of HTS-1_1 material (0.025–0.05 wt%) caused formation of α-pinene oxide as the main product with selectivity about 23–25 mol%, while the use of larger amounts of HTS-1_1 material (0.1–1.5 wt%) caused formation of verbenol as the main product with selectivity 21–22 mol%. The selectivity of transformation to verbenone was almost constant in the studied range of catalyst content and amounted to 14–15 mol%. Similar observations were made for the conversion of α-pinene, which was also almost constant and amounted to about 33–35 mol%. At this stage, the most favorable amount of HTS-1_1 catalyst was taken to be 0.025 wt% (taking into account the selectivity of α-pinene oxide and the conversion of α-pinene).
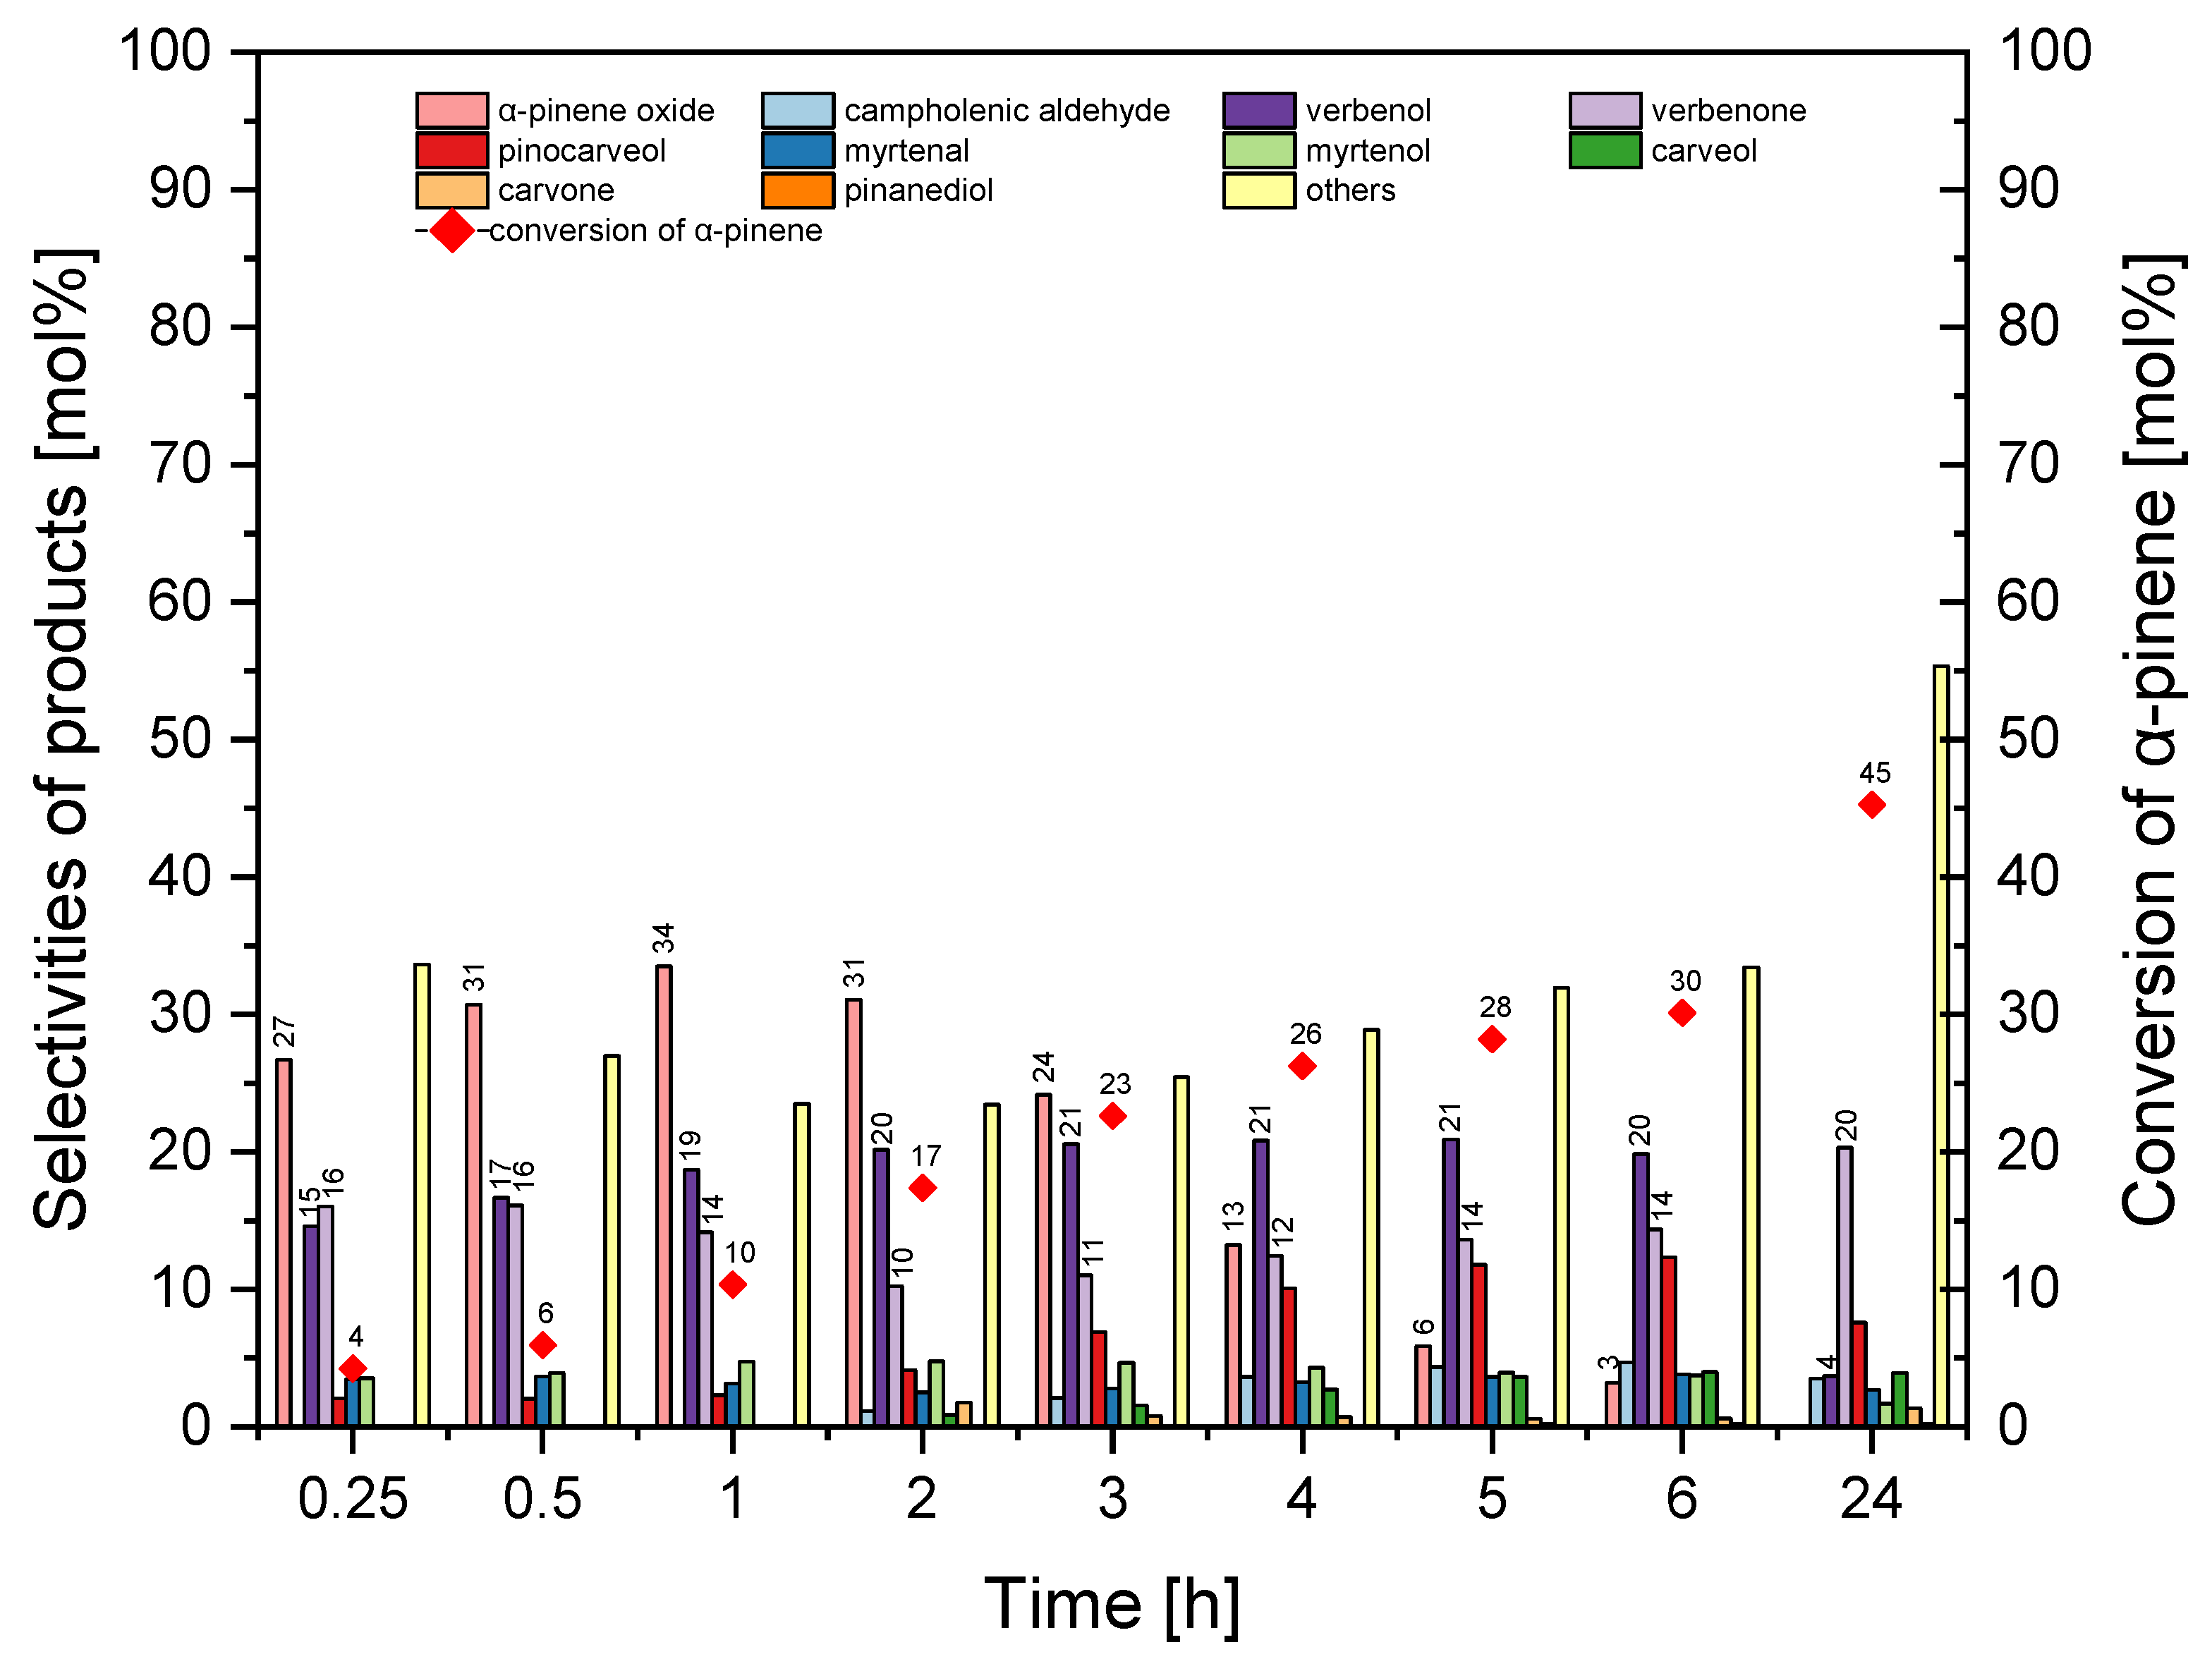
Figure 16 shows the results of the third stage of catalytic tests of the HTS-1_1 material.
Figure 16 shows that the highest values of the selectivity of α-pinene oxide (27–34 mol%) were obtained for reaction times in the range of 0.25–2 h. The selectivity for this compound decreased to the value of 0 mol% with a reaction time of 24 h. The prolongation of the reaction time from 0.25 h to 5 h caused an increase in the selectivity for verbenol from 15 mol% to 21 mol%. Next this function decreased to 4 mol% (24 h). In the range of the reaction time 0.25–6 h, the selectivity for verbenone was in the range of 10–16 mol%, and for 24 h this selectivity raised slightly to 20 mol%. During prolongation the reaction time the conversion of α-pinene increased from 4 mol% to 45 mol%. At this stage, the best reaction time was taken to be 2 h (taking into account the selectivity of α-pinene oxide and verbenone, and also the conversion of α-pinene).
The last catalyst used in the oxidation of α-pinene was the HTS-1_2 material.
Figure 17 shows the results of the first stage of catalytic tests of the HTS-1_2 material.
The studies showed that the temperature of 110 °C was too low to carry out the oxidation of α-pinene, since the conversion of this monoterpene at this temperature was only 1 mol%.
Figure 17 shows that the increase in the temperature from 115 °C to 125 °C increased the selectivity for α-pinene oxide from 27 mol% to 31 mol%, but a further increase in the temperature from 125 °C to 150 °C decreased the selectivity for α-pinene oxide from 31 mol% to 1 mol%. In the temperature range of 115–145 °C, the selectivity for verbenol was in the range of 18–22 mol%, but for the temperature of 150 °C the selectivity forverbenol was only 8 mol%. The selectivity for verbenone was in the range of 13–19 mol% across the whole range of studied temperatures.
Figure 17 also shows that increasing the temperature from 115 °C to 150 °C increased the conversion of α-pinene from 15 mol% to 43 mol%. At this stage, the best temperature was taken to be 125 °C (taking into account the selectivity of α-pinene oxide and the conversion of α-pinene).
The second stage of the HTS-1_2 material catalytic tests included examiningthe influence of the amount of catalyst on the course of α-pinene oxidation. The results of these tests are shown in
Figure 18.
With the amount of catalyst in the range of 0.025–0.25 wt% in the reaction mixture, the selectivity for α-pinene oxide was about 31–32 mol%, but next, in the range of 0.5–1.5 wt%, it was slightly lower and amounted to about 25 mol%. During the studies performed at this stage, the selectivity of transformation to verbenol was about 19–20 mol%, and for verbenone about 14–16 mol%.
Figure 18 shows that the increase in the amount of HTS-1_2 material from 0.025 wt% to 0.5 wt% increased the conversion of α-pinene from 23 mol% to 42 mol%, and subsequently, as the catalyst content increased further, this function remained nearly constant. At this stage, the best amount of HTS-1_2 material was taken to be 0.05 wt% (taking into account the selectivity of α-pinene oxide and the conversion of α-pinene).
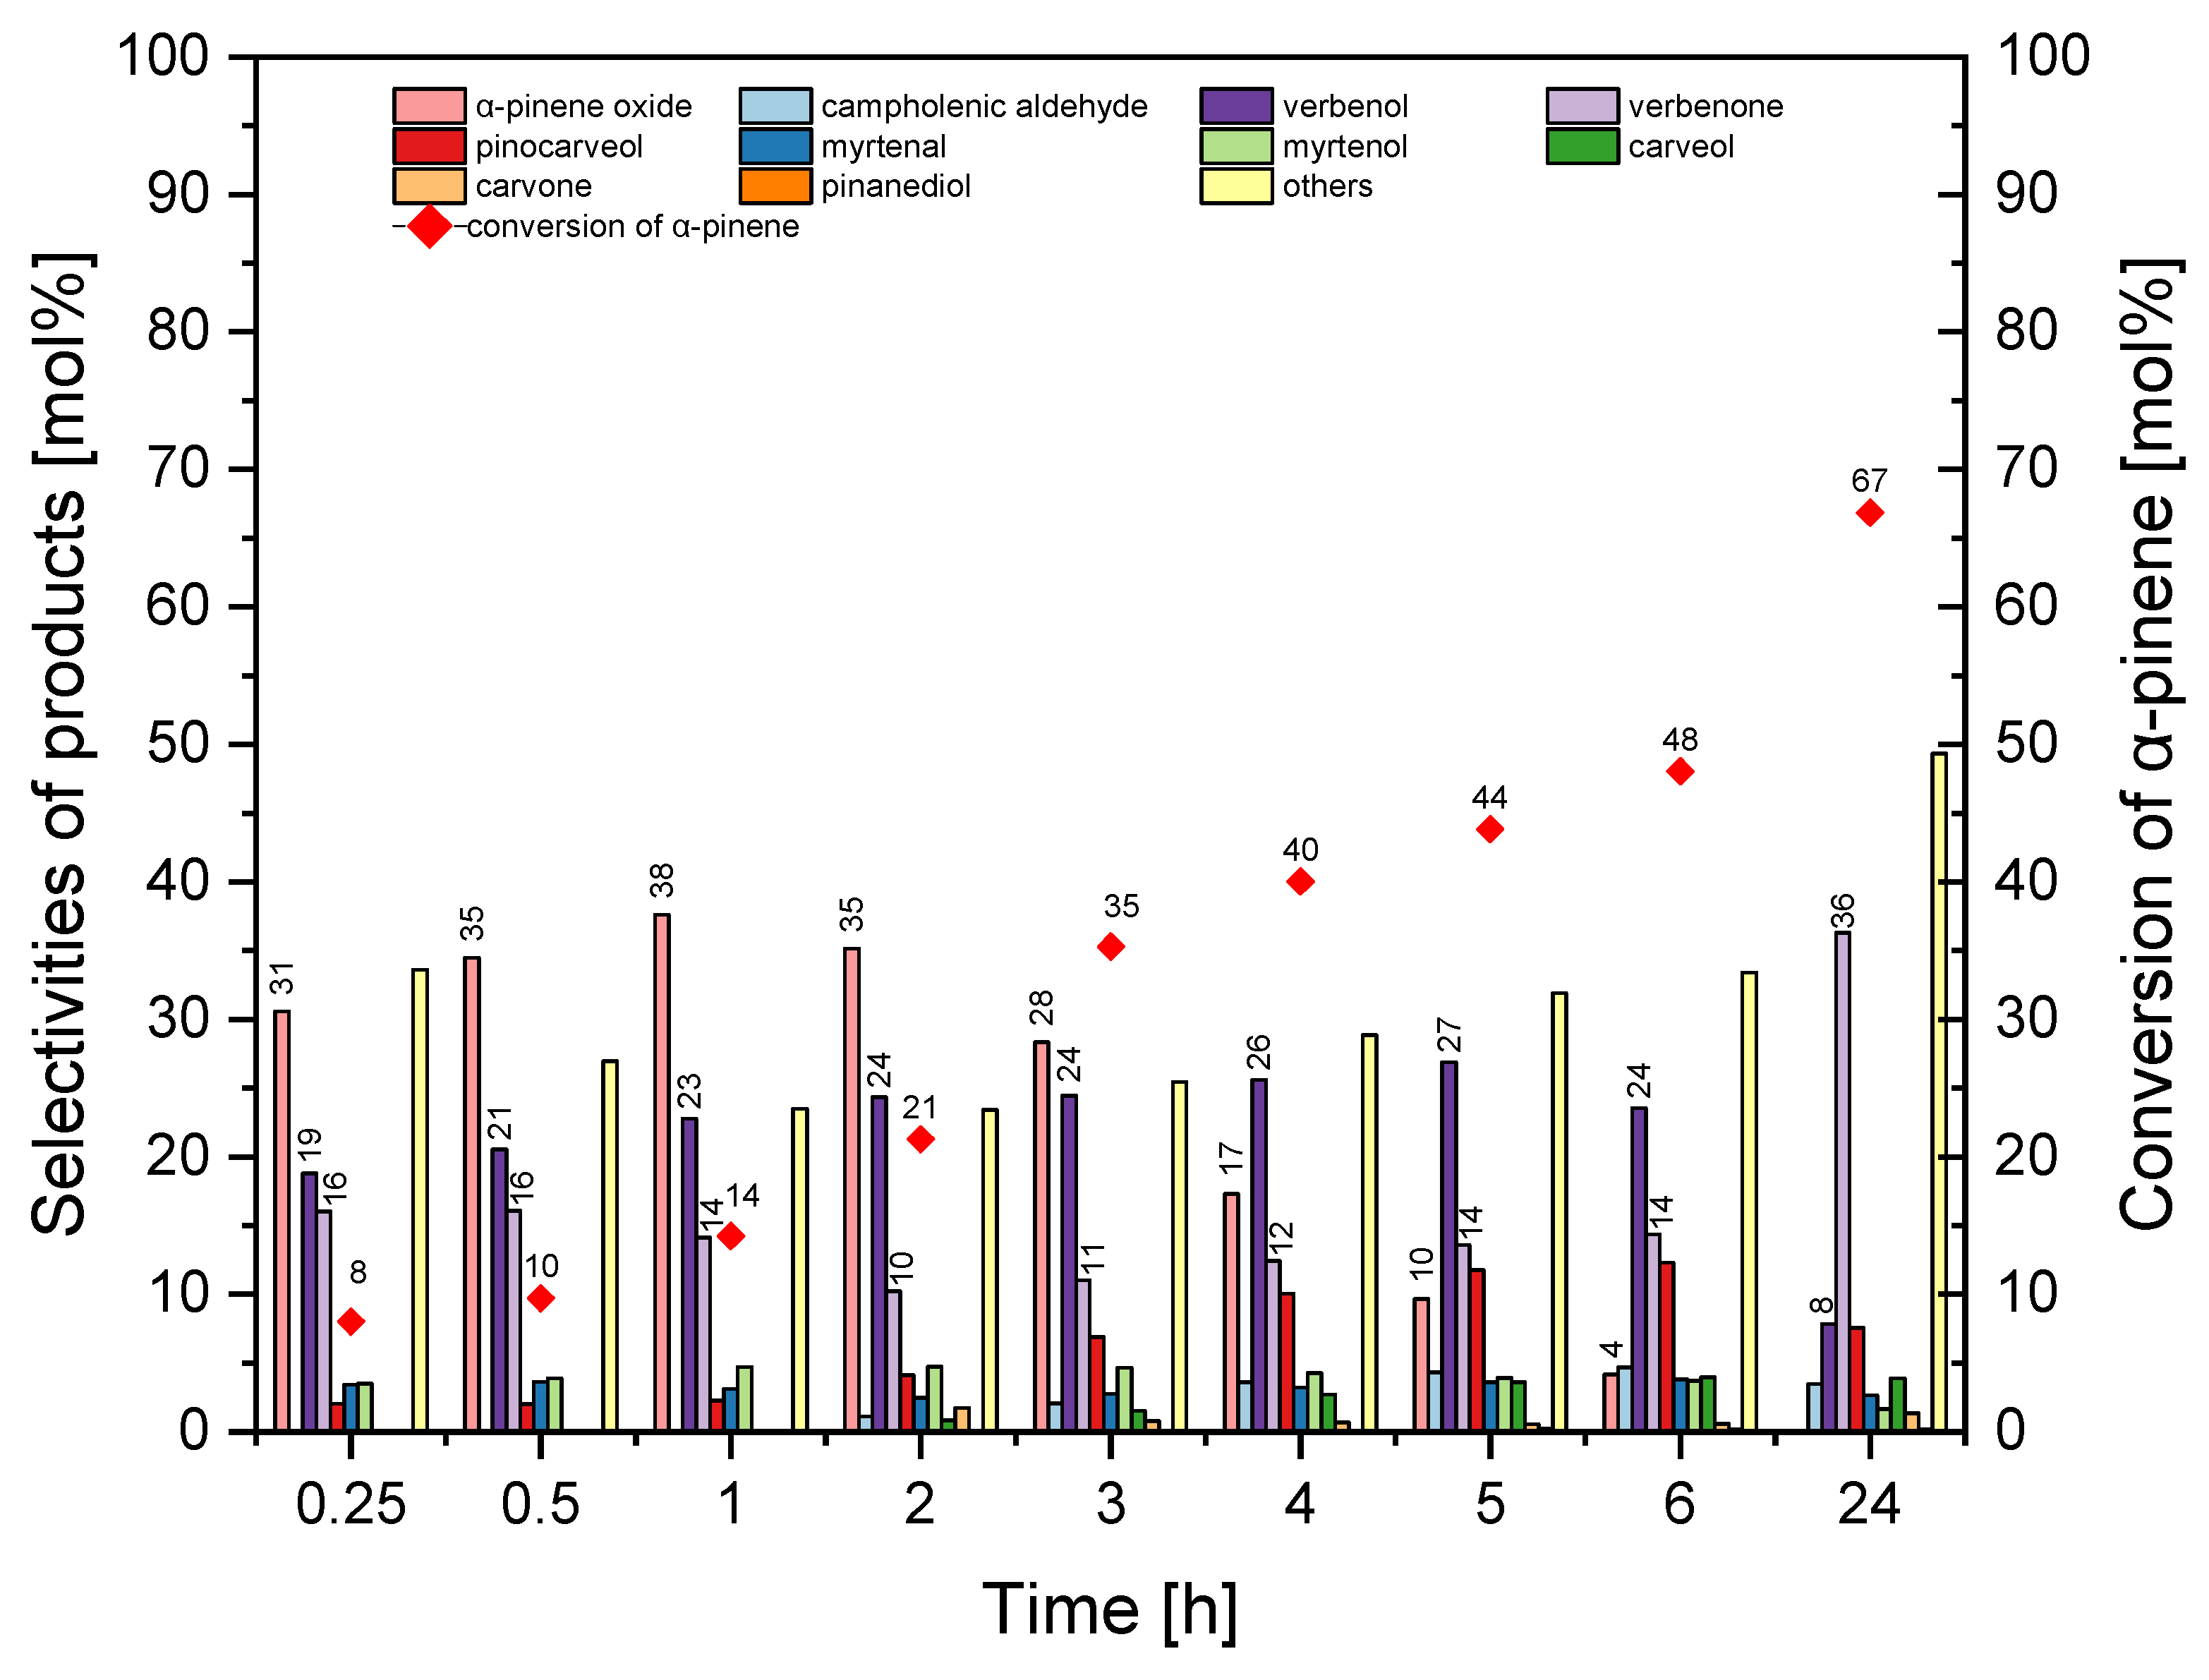
Figure 19 shows the results of the third stage of catalytic tests of the HTS-1_2 material.
Selectivity of transformation to α-pinene oxide was the highest for the reaction time in the range from 0.25–2 h (31–25 mol%), but this function decreased to 0 mol% (24 h). The selectivity for verbenol took values between 19–24 mol%, and with a reaction time of 24 h it decreased to 8 mol%. With reaction times ranging from 0.25–6 h, selectivity for verbenone was in the range of 10–16 mol%, and with a reaction time of 24 h, this function increased to 36 mol%. The conversion of α-pinene increased from 8 mol% to 67 mol%. At this stage, the best reaction time was taken 2 h (taking into account the selectivity of α-pinene oxide, the selectivity of verbenol and the conversion of α-pinene).
Table 4 summarizes the values of selectivity for α-pinene oxide, verbenol, verbenone, and conversion of α-pinene under the most favorable conditions obtained for the four modified TS-1 catalysts tested in the α-pinene oxidation process.
As shown in
Table 4, all modified catalysts demonstrated higher catalytic activity under the most favorable conditions than the reference TS-1 material (taking into account the selectivity of transformation to α-pinene oxide), despite being applied at significantly lower catalyst content and shorter reaction time. However, the use of these modified catalysts required higher temperatures by 40–50 °C, depending on the catalyst sample used. The comparison of the catalytic test results presented in
Table 4 shows that in the case of MTS-1 catalyst samples, it was possible to use the four-fold lower catalyst content and the three-fold shorter reaction time compared to the reference TS-1 sample, at the correspondingly higher reaction temperatures of 45 °C (MTS-1_1) and 35 °C (MTS-1_2), in order to obtain values for selectivity of transformation to α-pinene oxide similar to the reference TS-1 sample, with lower α-pinene conversion (by about 13–15 mol%). In the case of the HTS-1 catalyst samples, it can be seen that to obtain comparable selectivity values for the selectivity of the transformation to α-pinene oxide to the reference TS-1 sample (or even slightly higher—by 9 mol% in the case of the HTS-1_2 sample), even lower catalyst contents than those used in the MTS-1 samples—0.025 wt%—had to be used. These catalyst contents were 40 times (HTS-1_1) and 20 times (HTS-1_2) lower than those used in case of the reference TS-1 sample, and 10 times (HTS-1_1) and 5 times (HTS-1_2) lower than those used with the MTS-1 catalysts. The presented comparison shows that the obtained modified catalysts exhibit increased catalytic activity compared to the reference TS-1 sample (taking into account the selectivity of the transformation to α-pinene oxide). This is particularly visible in the case of HTS-1 catalysts, of which the HTS-1_2 sample showed the highest catalytic activity (what is particularly noteworthy here is the 2 times shorter reaction time compared to other modified samples tested and at the same time 6 times shorter compared to the reference TS-1 sample). Although our instrumental characterization did not provide evidence of the formation of a hollow morphology, the applied synthesis route allowed to obtain structural features in the obtained two HTS-1 materials than could probably facilitate faster diffusion of α-pinene oxide molecules away from active sites (in case of TS-1_2 sample this diffusion can proceed faster), thereby reducing their residence time in active centers and suppressing secondary transformations. As a result, HTS-1_2 exhibited improved selectivity to α-pinene oxide without a significant change in overall conversion of α-pinene.
Among the tested materials, the highest conversion of α-pinene (21 mol%) was achieved with HTS-1_2 (catalyst content 0.05 wt%, 2 h, 125 °C), followed by MTS-1_2 (21 mol%, catalyst content 0.25 wt%, 2 h, 120 °C), MTS-1_1 (19 mol%, catalyst content 0.25 wt%, 2 h, 130 °C), and HTS-1_1 (17 mol%, catalyst content 0.025 wt%, 2 h, 135 °C). For comparison, the reference TS-1 catalyst achieved the conversion of α-pinene of 34 mol%, but only after 6 h at catalyst content of 1.0 wt% and a significantly lower temperature of 85 °C. Considering the costs of conducting the process on a larger scale, it is advantageous to shorten the reaction time while simultaneously increasing the temperature of process carrying out. It should also be noted that a longer reaction time may intensify reactions involving the formation of by-products, which will increase the raw material conversion, but unfrtunately, the selectivity of the transformation to the main product will decrease. Therefore, the conversion of the organic raw material cannot always be taken into account when assessing the catalytic activity of the tested catalyst samples.
The observed data indicate that catalytic activity is not solely governed by reaction temperature. While higher temperatures generally accelerate oxidation, the efficiency of conversion of α-pinene is also strongly influenced by the porosity and accessibility of the active sites. For instance, HTS-1_2 outperformed all other samples at 125 °C despite a lower temperature than that used for HTS-1_1 (135 °C), highlighting the beneficial effect of its structure and appropriate titanium environment. Similarly, MTS-1_2 achieved high conversion at 120 °C, probably due to favorable diffusion through its mesoporous framework and high titanium content.
In terms of product distribution, HTS-1_2 also exhibited the highest selectivity to α-pinene oxide (35 mol%), indicating that the combination of morphology and post-synthetic treatment effectively enhanced substrate accessibility to titanium active sites. MTS-1_2 showed similarly high selectivity for α-pinene oxide (32 mol%), which may be associated with its high Ti content (6.16 wt%) and open mesoporous structure. All catalysts produced verbenol and verbenone as co-products, with comparable selectivity values, suggesting that the reaction pathways for these catalysts were very similar.
The improved catalytic activity of the modified materials can be attributed to their tailored porosity and favorable titanium coordination, which together reduce steric hindrance and facilitate the diffusion of bulky α-pinene molecules. These results confirm that applicated modifications of the TS-1 structure represent the effective strategy to improve efficiency in the oxidation of sterically hindered substrates under solvent-free conditions. The catalytic activity of TS-1 was lower compared to the modified samples, which can be explained by the limited accessibility of bulky α-pinene molecules to the microporous framework. The observed differences in catalytic behavior of the studied materials can be correlated with structural features of the catalysts: TS-1, with a purely microporous framework, limits the diffusion of bulky α-pinene molecules, resulting in moderate conversion of α-pinene and also moderate selectivity dominated by α-pinene oxide. In contrast, the introduction of mesoporosity in MTS-1 improves accessibility to active sites and leads to higher conversion of α-pinene, albeit with a greater proportion of secondary products. For HTS-1 materials, the modified morphology enhances the accessibility of active sites, which improves α-pinene oxide selectivity while maintaining similar overall conversion of α-pinene.
