Article

Carbonation Deactivation of Limestone in a Micro-Fluidized Bed Reactor

1
Chemical Engineering Department, College of Engineering, Kwame Nkrumah University of Science & Technology, PMB, University Post Office, Kumasi 00233, Ghana
2
Department of Chemical Engineering, Polytechnique Montreal, C.P. 6079, Succ. CV, Montreal, QC H3C 3A7, Canada
3
School of Engineering, Merz Court, Newcastle University, Newcastle upon Tyne NE1 7RU, UK
*
Authors to whom correspondence should be addressed.
Catalysts 2025, 15(8), 697; https://doi.org/10.3390/catal15080697
Submission received: 18 March 2025 / Revised: 4 July 2025 / Accepted: 18 July 2025 / Published: 22 July 2025
(This article belongs to the Special Issue Fluidizable Catalysts for Novel Chemical Processes)

Abstract

Carbonation–calcination looping using CaO-based natural sorbents such as limestone is a promising technology for the capture of CO2 from fossil fuel-based power plants. In this study, the CO2 capture capacities of Buipe, Oterpkolu, and Nauli limestones from quarries in Ghana were measured in a laboratory-scale micro-fluidized bed reactor through multiple carbonation–calcination cycles. The changes in CO2 capture capacity and conversion with the number of cycles mostly correlated with the changes in the physico-chemical properties: Capture capacity dropped from >60% to <15% after 15 cycles and the surface area dropped to below 5 m2 g−1 from as much as 20 m2 g−1 (for the Oterkpolu). The pore volume of the Nauli limestone was essentially invariant with the number of cycles while it increased for the Buipe limestone, and initially increased and then dropped for the Oterpkolu limestone. This decrease was likely due to sintering and a reduction in the number of micropores. The unusual increase in pore volume after multiple cycles was due to the formation of mesopores with smaller pore diameters.

1. Introduction

In 2015, the Paris Agreement was adopted by 196 countries with the aim of limiting the increase in global average temperature rise to 1.5–2 °C above pre-industrial levels [1]. However, six consolidated international datasets suggest that 2024 surpassed this target, largely as a consequence of the continued domination of fossil fuels in the energy mix [2]. The IEA developed a strategy to reach net zero by 2050 where the global anthropogenic CO2 emissions were to drop by 5 Gt from 2020 to 2025. However, rather than dropping, the emissions increased from 34 Gt y−1 to 41 Gt y−1. Carbon capture therefore remains a critical and relevant technology to curtail further average temperature increases [3,4].
The chemisorption of CO2 from flue gases with amine-containing compounds, such as monoethanolamide (MEA), is the only commercial technology where an aqueous solution of MEA reacts with a CO2-rich flue gas flowing counter-currently to form carbamate salts. Amine scrubbing dilutes and lowers CO2 concentrations, and can be retrofitted to existing power plants. However, it requires significant energy to regenerate the solvents, and introduces several other shortcomings which drive up the capture cost [5,6,7,8,9].
An alternative CO2 capture technology is calcium looping (CaL), which has had several decades of research. It involves a reversible exothermic reaction between CaO particles and CO2 in a carbonator (Equation (1)), followed by endothermic calcination to regenerate the sorbent and release tCO2 (Equation (2)). Carbonation involves two steps: an initial rapid and kinetically controlled stage, followed by a slower diffusion-controlled stage [10,11].
Fluidized beds improve the overall CaL efficiency, because of their excellent heat and mass transfer rates between the particles and flue gas versus gas switching between fixed bed reactors. There are numerous advantages of this approach, including the use of low-cost limestones; initial high carbonation–decarbonation cycling CO2 capture; selective separation of CO2 from CaCO3 via calcination; and coupling of the technology with a cement plant to offset the carbon footprint (which accounts for 5% of the global anthropogenic CO2 emissions) [12,13,14,15,16].
C a O s + C O 2 ( g ) C a C O 3 ( s ) , H = 179   k J / m o l
[calcination reaction]
L o g 10 P C O 2 a t m = 7.079 8308 T K
To maximize reaction rates and contact times between CaO and CO2, the equilibrium (Equation (3)) dictates that carbonation temperatures must exceed 600 °C at atmospheric pressure [11,17,18]. The reverse endothermic calcination (decarbonation) process operates at 800–1200 °C and is irreversible (in that this process often goes to completion). The regenerated CaO is recycled to the carbonation vessel, which is a well-established capability of fluidized bed technology [19]. The MEA process requires heat to release the CO2 after it has been absorbed, while the CaL process requires heat to operate at above 600 °C. Recovering the energy in the CaL process requires capital investment for heat exchangers.
However, the CO2 capacity of limestone decreases with increased cycling [10,11], possibly due to sorbent sintering, which has previously been characterized by textural changes [20,21]. This work investigates the mechanism through which the CO2 carrying capacity of three natural and affordable limestones decays with increasing carbonation–decarbonation cycles. We examine textural changes in the sorbents with scanning electron microscopy and N2 sorption to elucidate reduction in carbonation conversion.

2. Experimental Methodology

2.1. Limestone Characterization

This study comprises Buipe, Oterkpolu, and Nauli commercial limestones (Table 1) from Ghana. Ghana Cement (GHACEM) Ltd. (Tema, Ghana) provided Oterkpolu from eastern Ghana, while Nauli and Buipe limestones were sampled from commercial mining sites in western and northern Ghana, respectively. An LA 950 Horiba laser analyzer (HORIBA Instruments, Inc., Irvine, CA, USA) determined the particle size distribution of the samples. Prior to this analysis, we sieved the pellets with a 60-mesh sieve (>250 µm) for 15 min on a Ro-tap Model E Sieve Shaker (W.S. Tyler, Mentor, OH, USA).
Textural properties of the fresh and used limestones (i.e., after the carbonation–calcination tests) were assessed with scanning electron microscopy to examine the morphology and a Quantachrome Autosorb-0, Florida, USA, (N2 adsorption at −196 °C after degassing under vacuum at 200 °C for 3 h). The absorbed volume of N2 for a relative pressure (P/Po) of 0.97 was used to calculate the pore volume of the various sorbents. We report the BET specific surface area (SBET) and the pore size distribution (PSD) estimated based on BJH desorption.
An X-ray diffractometer, Bruker, Karlsruhe, Germany (XRD3 Bruker D2 PHASER with Lynx Eye detector) was used to obtain powder X-ray diffraction (PXRD) patterns to determine crystalline phases of fresh and used limestones using CuKα radiation (λ = 0.15406 nm) operating at 40 kV and 40 mA. The measurements were made for 2θ values within the range of 10–100°, with a step size = 0.05°, and a time step of 1 s. XRD patterns were analyzed for phase identification using High Score Plus. After determining the background, the matching sequence was carried out by using the PDF-2 database from the International Centre for Diffraction Data (ICDD) and Crystallography Open Database (COD). Elemental filters of Si, O, Ca, C, Mg, Fe, and Al were employed for searching and matching. Limestone crystallite size was estimated with Scherrer’s equation (Equation (3)), where D is the crystallite size (nm), b is the full width at half maximum (FWHM) of the XRD peak, λ is the wavelength (0.15406 nm), θ is the Bragg angle (°), and K is the Scherrer constant (0.9 for spherical particles).
D = K λ / b c o s   θ

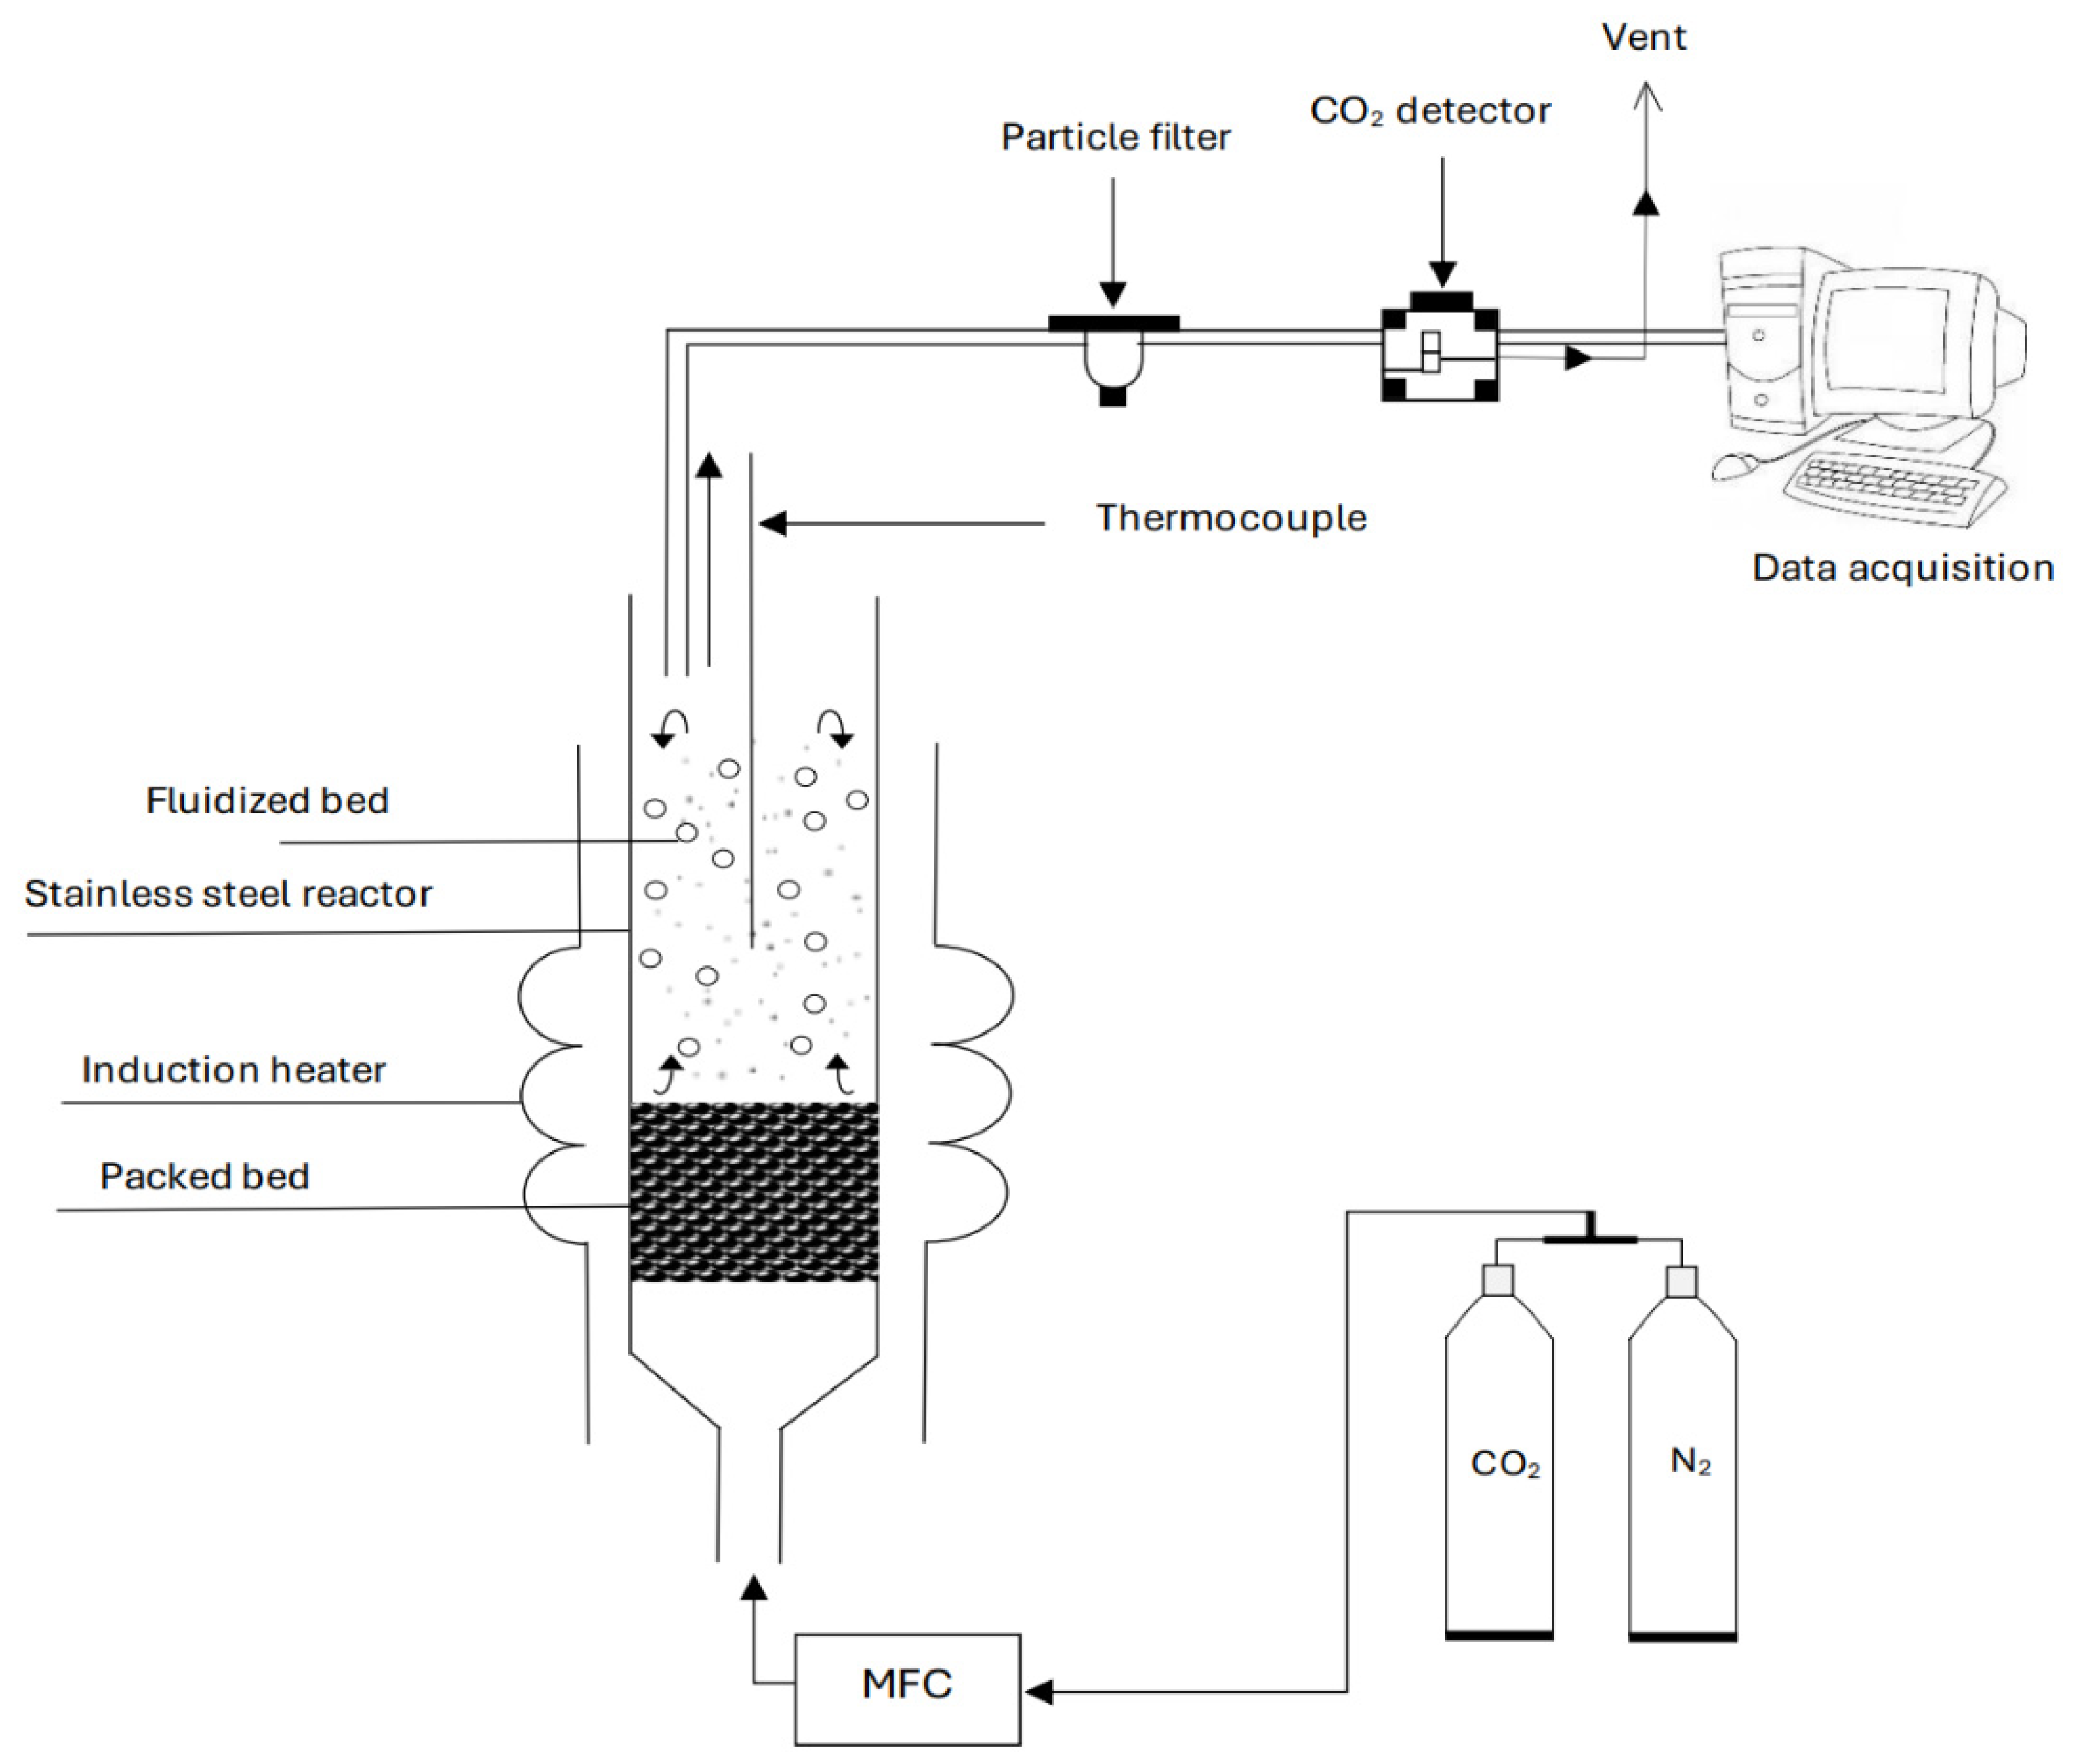
2.2. Fluidization Rig and Procedures

Limestone carbonation and decarbonation cycling experiments were conducted in a SS316 micro-fluidized bed reactor with an inner diameter and height of 22.5 mm and 450 mm, respectively (Figure 1). A perforated plate distributor topped with a 26 µm aperture 316L stainless steel mesh supported the static particle bed, which was 110 mm above the gas inlet. The distributor was also made of SS316 and had an outer diameter and thickness of 22 mm and 5 mm, respectively. The perforations were 1 mm circular holes spaced with a 1.5 mm pitch. The plenum chamber beneath the distributor was plugged with glass wool to ensure an even distribution of the fluidizing air, and gradually expanded from a diameter of 2 mm at the inlet (connected to the gas supply) to 22.5 mm at the distributor. An O-ring prevented gas leakage around the distributor.
A portable induction heating device (15 kW, 50/60 Hz) equipped with 300 mm diameter copper coils heated the reactor and bed to the set temperature. A K-type thermocouple (sheath material: 310SS, 1 mm diameter, and probe length 500 mm) inserted into the reactor and connected to a thermostat/controller regulated the operating temperature. A CO2 analyzer (GSS, SprintIR, Cumbernauld, UK) was placed after a filter at the outlet of the bed to record CO2 concentration within the 0–30% by volume range at a sampling rate of 20 Hz. Prior to each experiment, the CO2 detector was calibrated using 15 vol% CO2 in N2.
In a typical carbonation–calcination experiment, ~28 g of limestone (HS/Dt = 2) was loaded into the reactor and activated by heating it to 850 °C in N2 (1.5 cm s−1, or Ug/Umf = 3) until the CO2 signal dropped below its threshold. The reactor was then cooled to 650 °C and a stream of 15% CO2 in N2 entered the bed to simulate typical CO2 concentrations in flue gases. When the CO2 concentration stabilized, indicating that the limestone had reached maximum saturation, the CO2 flow was halted, and the solids calcined at 800 °C in N2) until the CO2 reading dropped to zero. We then repeated this procedure for 15 carbonation–calcination cycles.

3. Results and Discussion

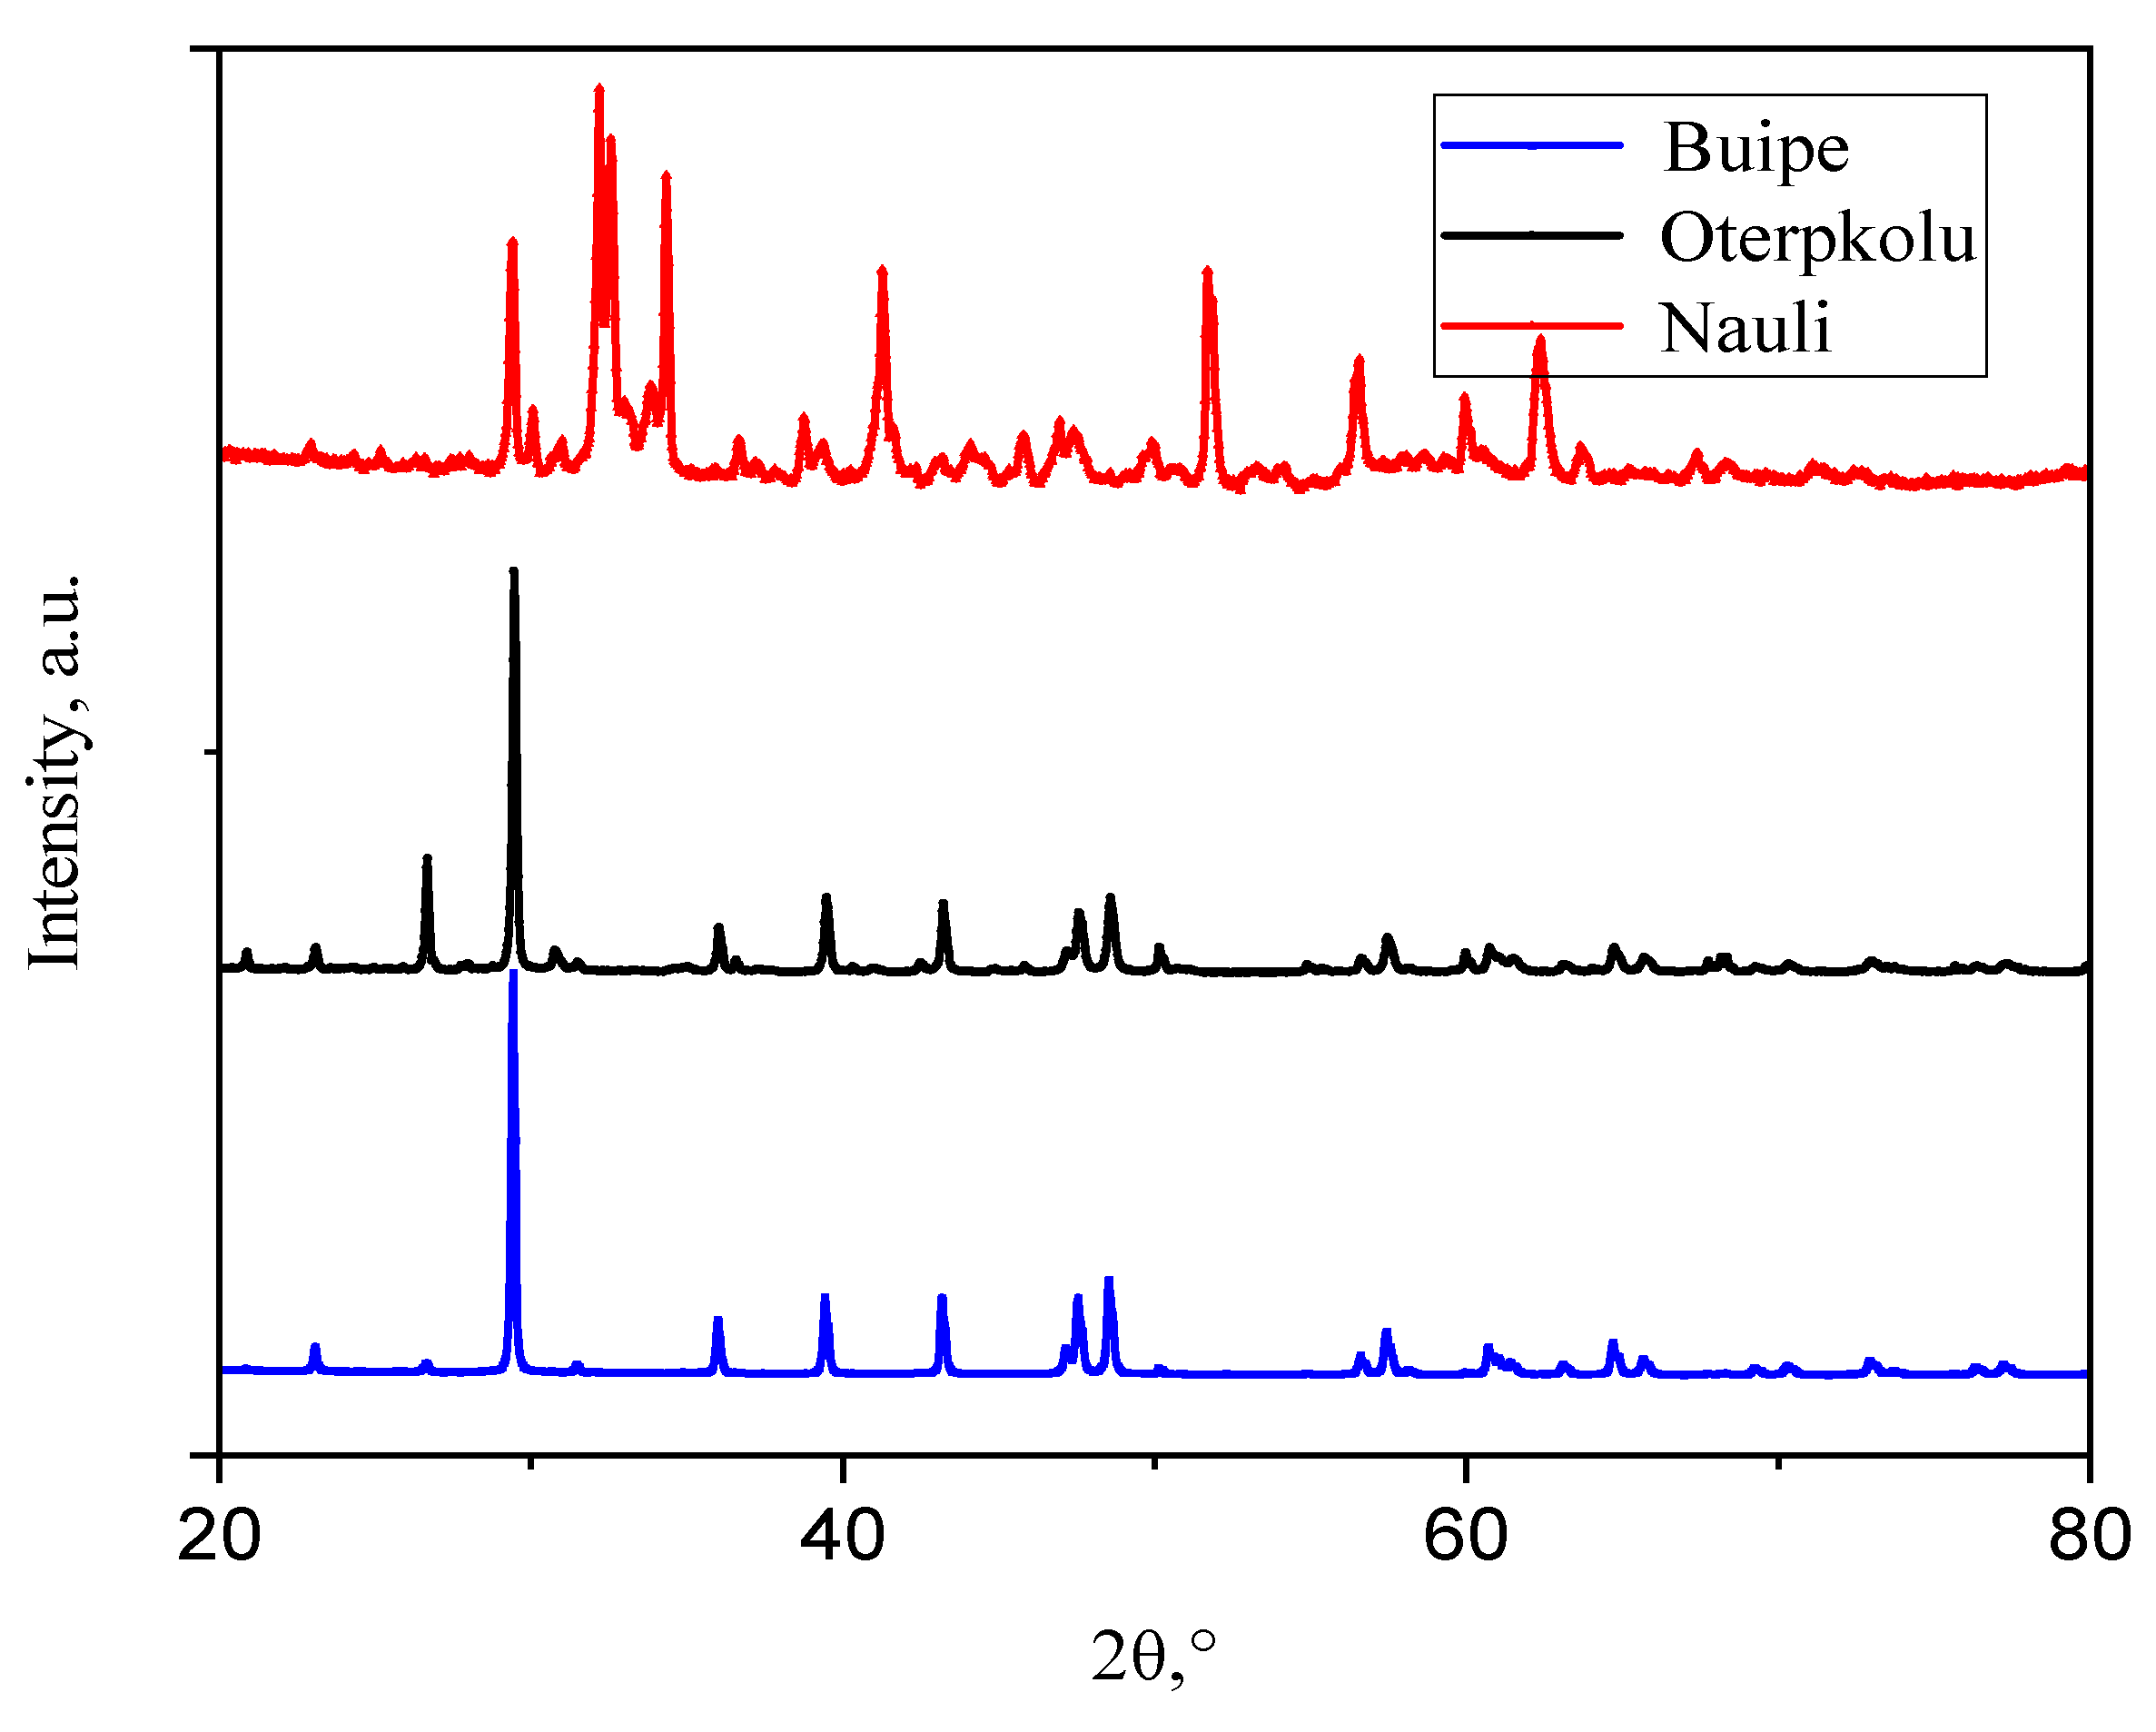
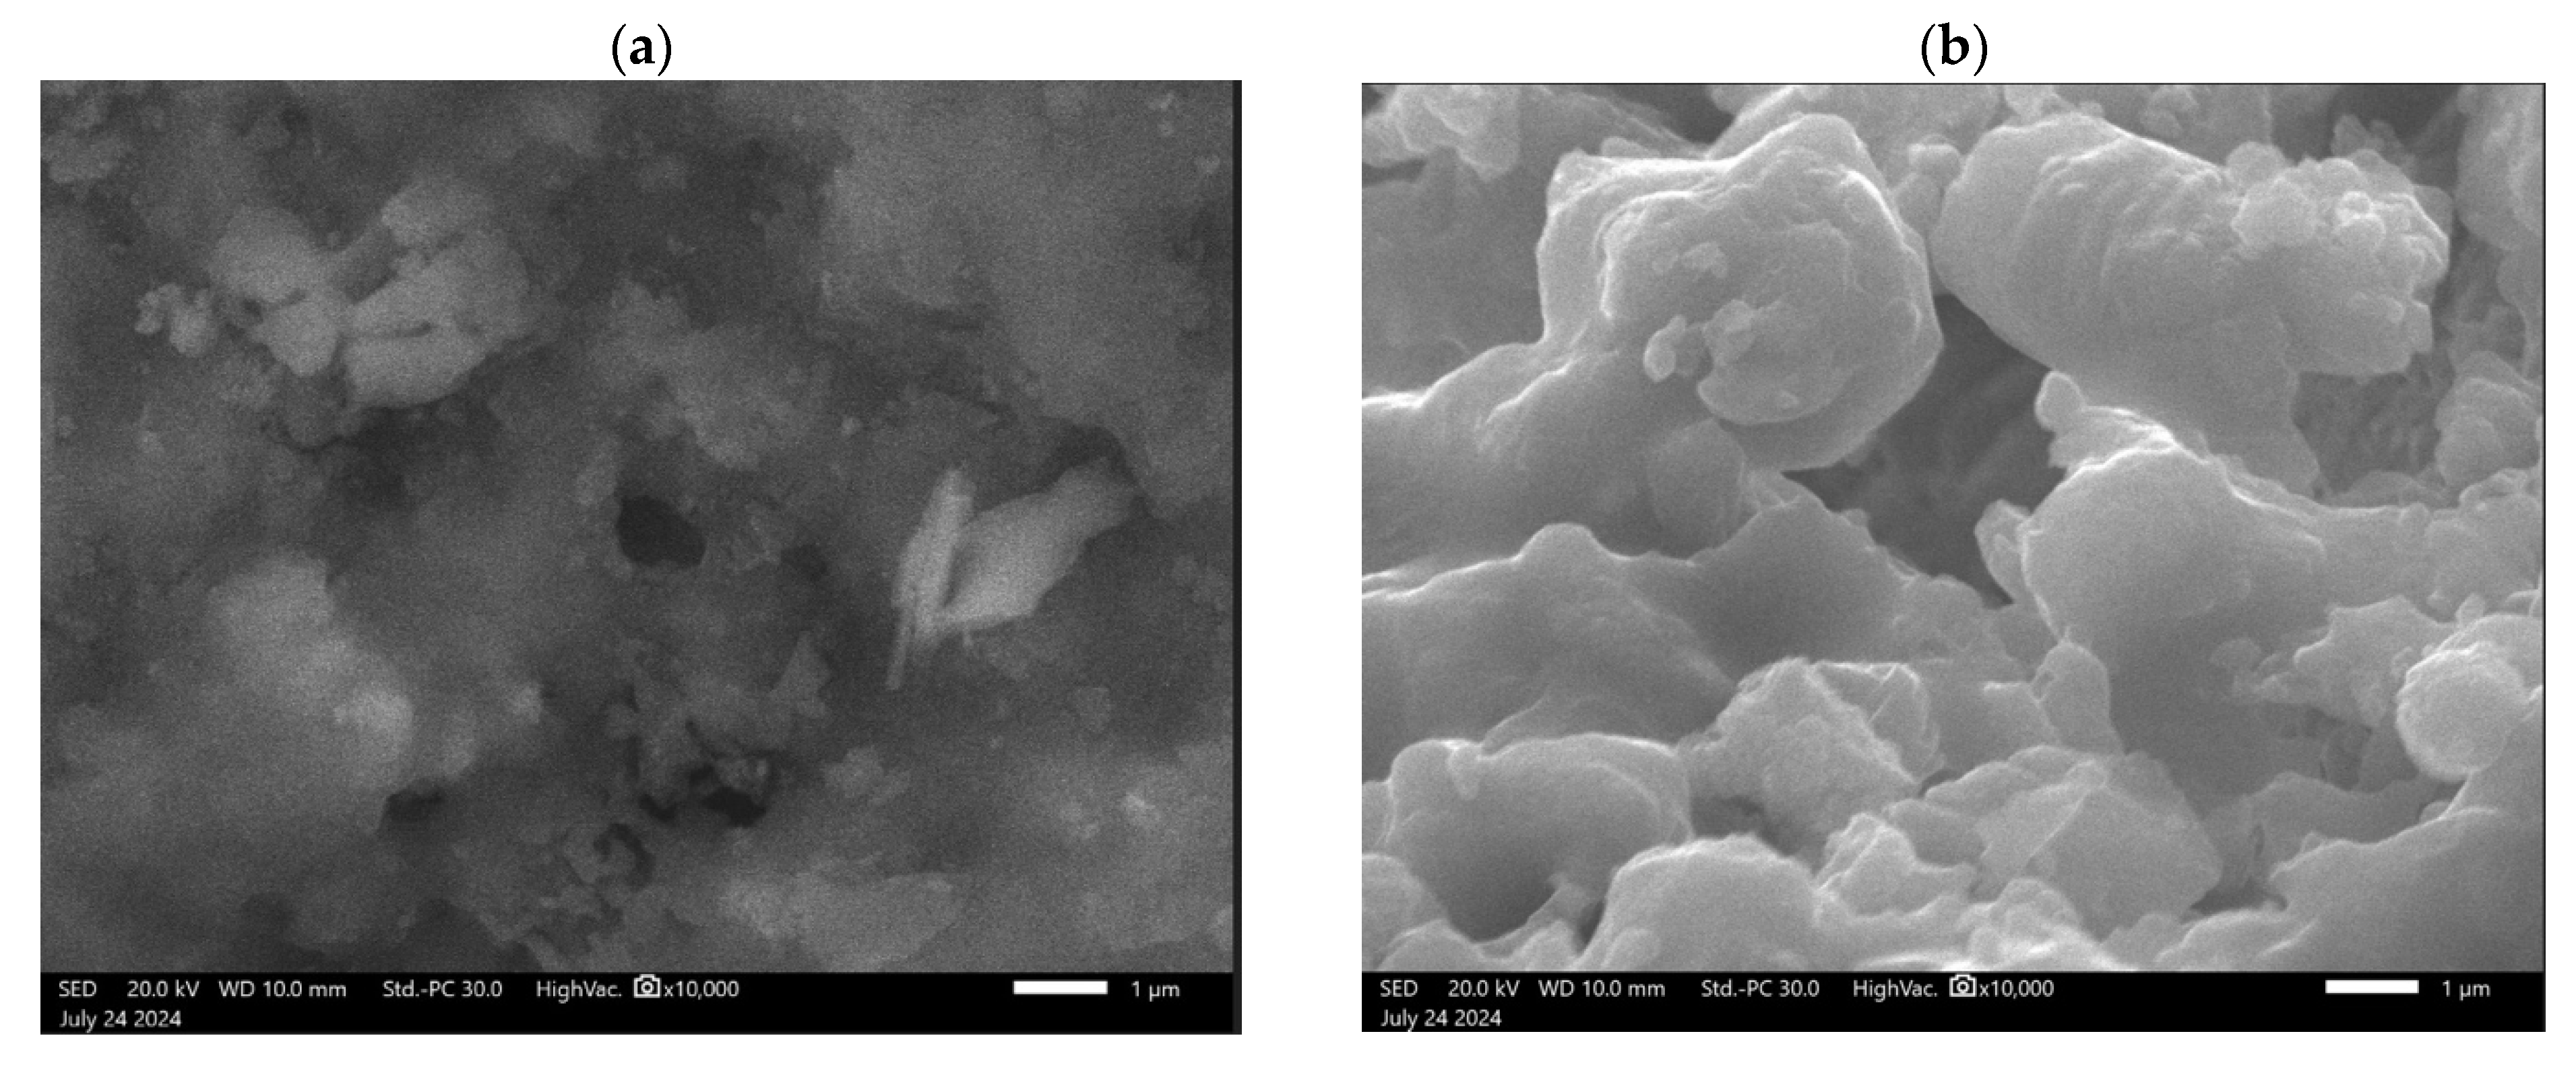
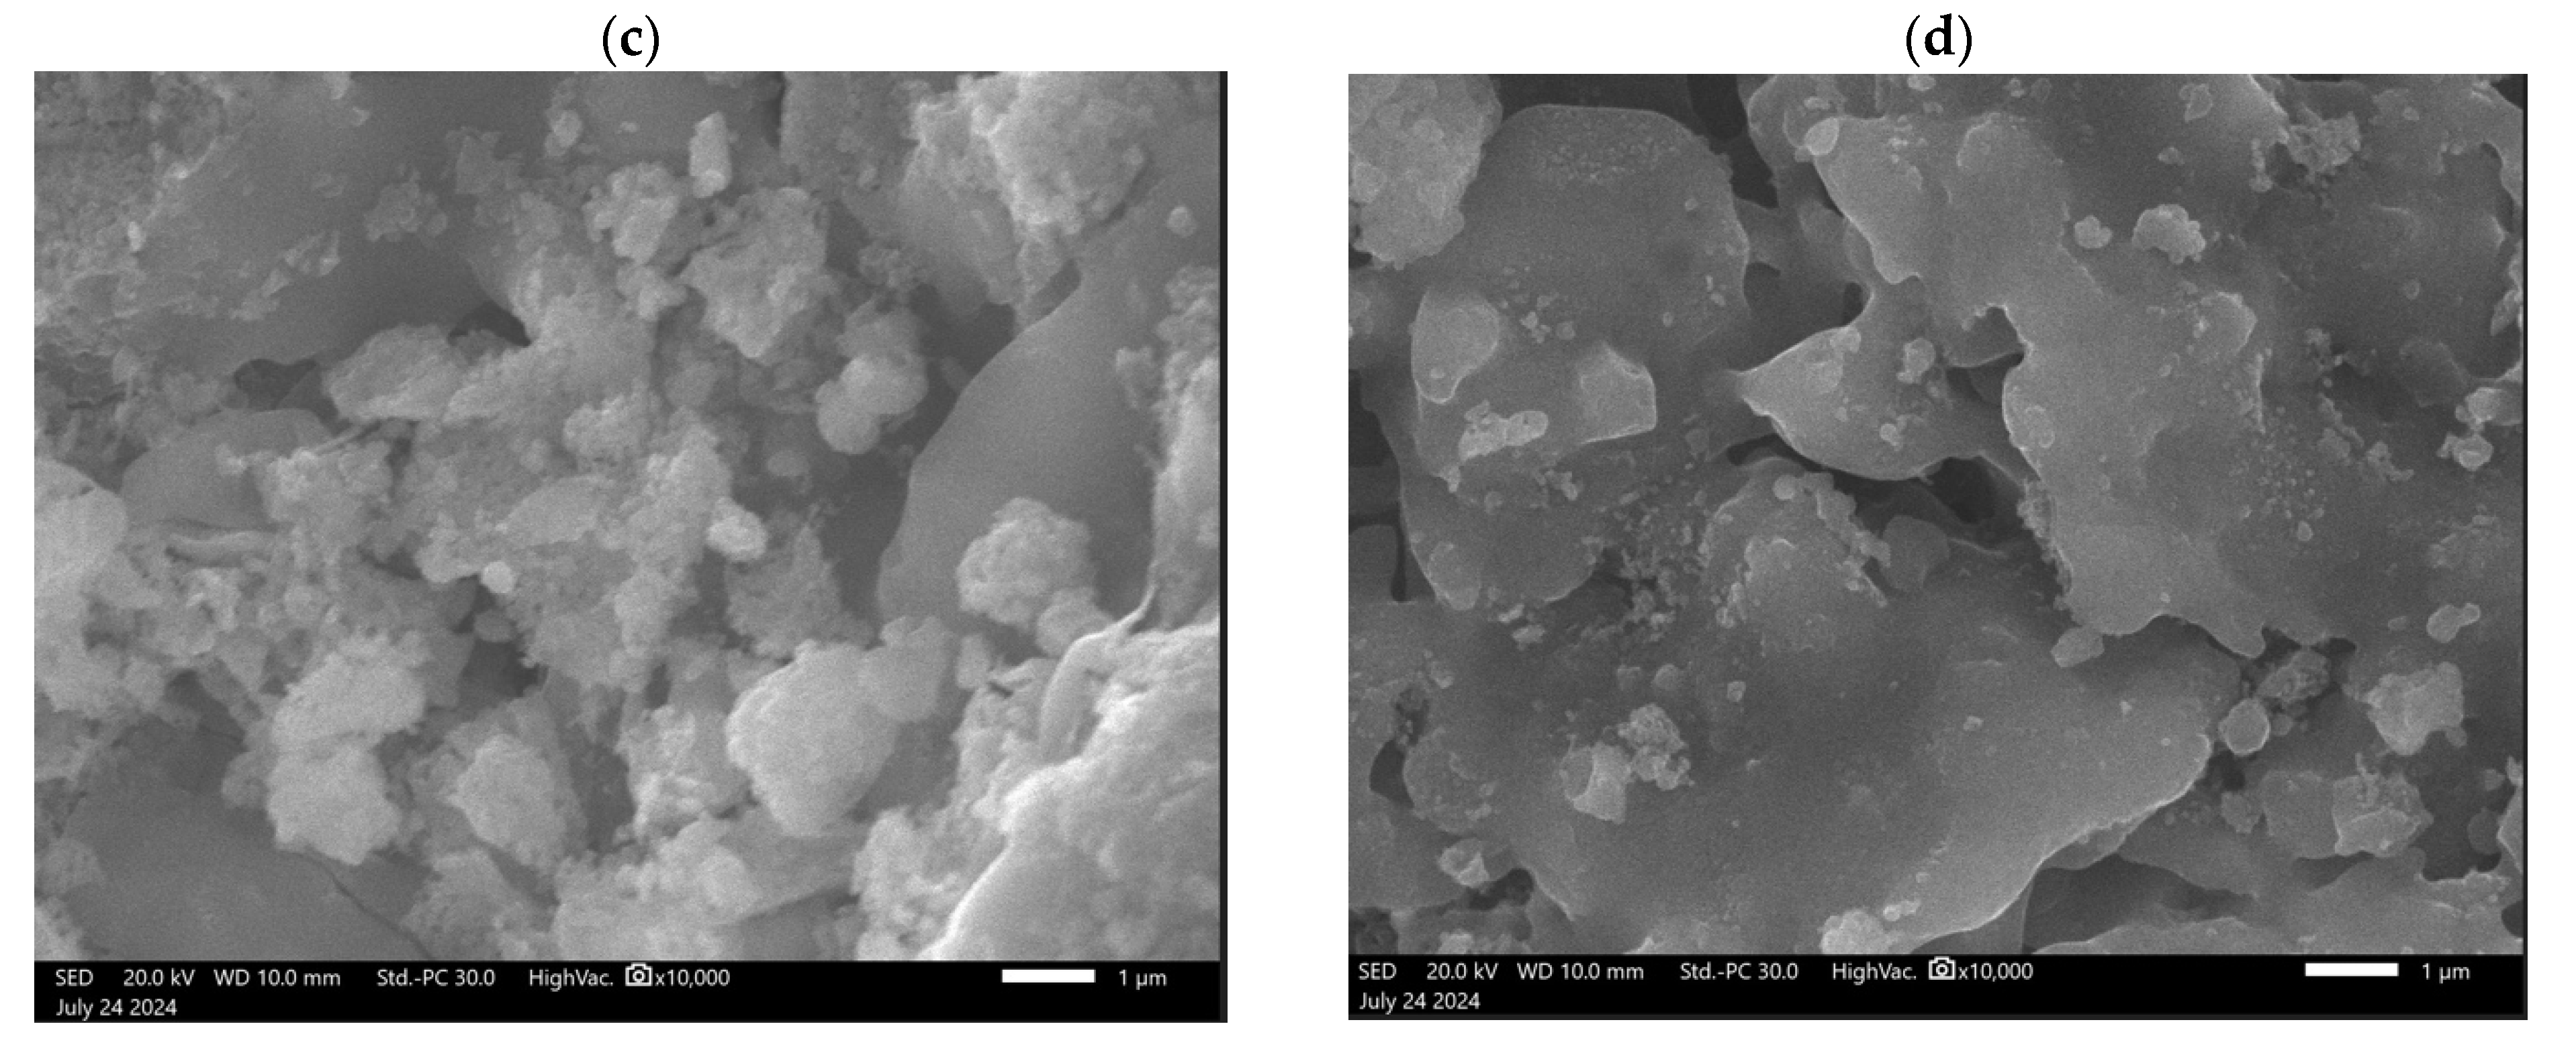
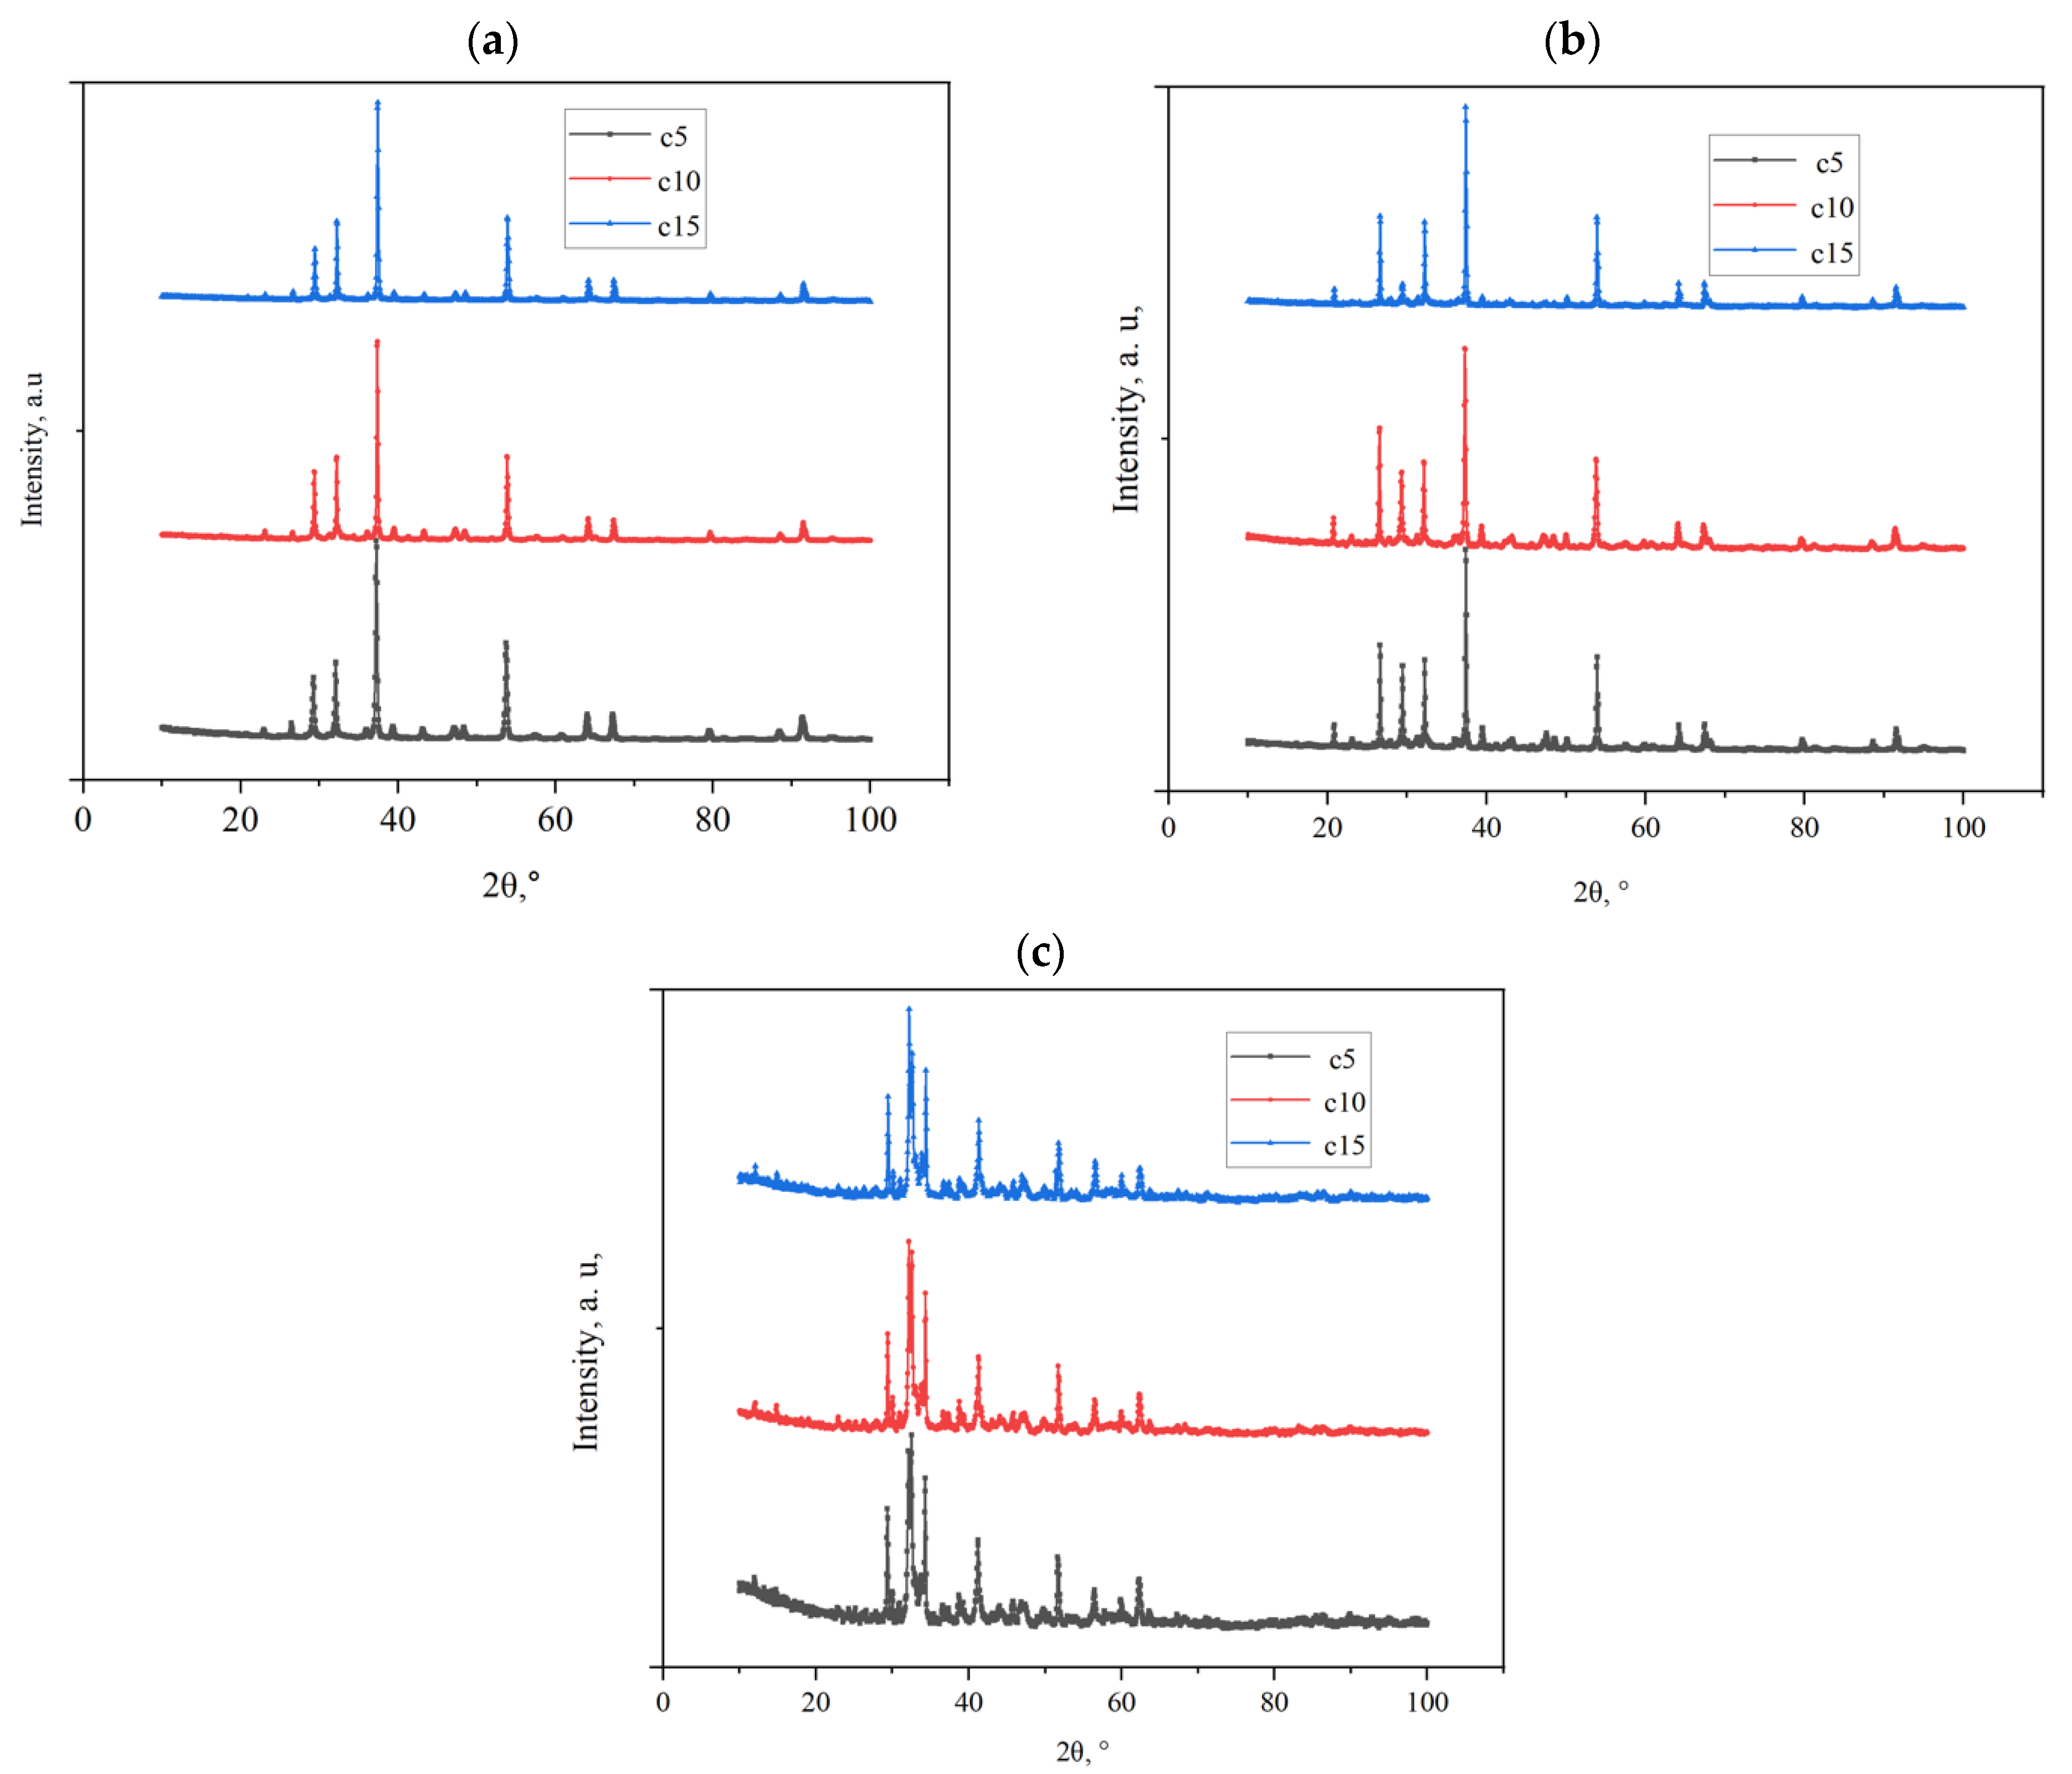
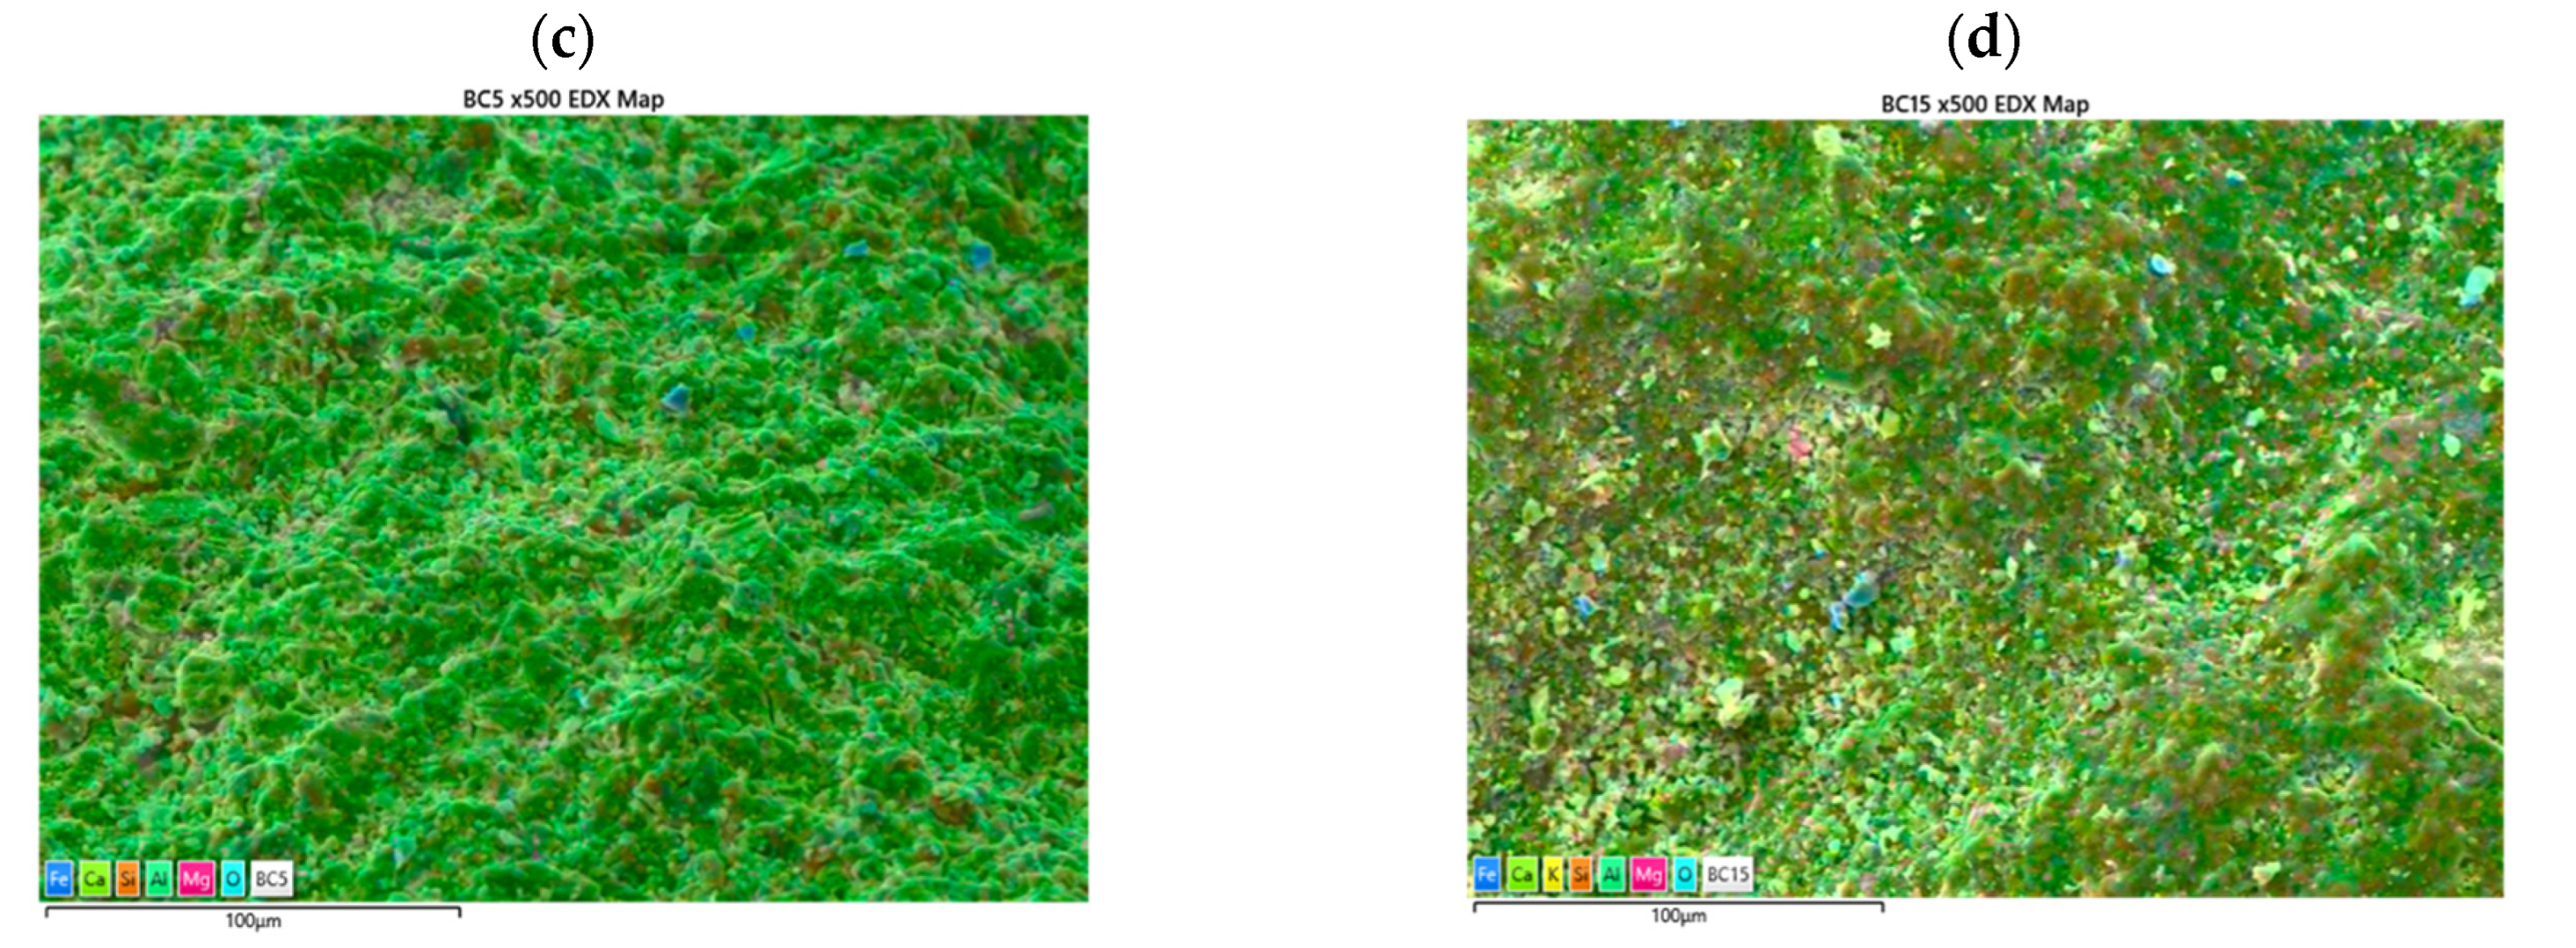
3.1. Limestone Characterization

For all three limestones, CaO is the major component (Table 1): Oterpkolu limestone also contains 27% SiO2 vs. 8% and 14% in Buipe and Nauli limestones, respectively. The MgO fractions are less than 4% while the K2O fractions are about ½ the MgO fraction. The surface area of the Nauli limestone is an order of magnitude lower than either the Oterpkolu or Buipe limestones at 0.2 m2 g−1, while its pore volume is only lower by a factor of two. All three exhibit Geldart B (sand-like) characteristics (Table 2) with a surface area close to SiO2. The Oterpkolu limestone particle size was the highest at 520 mm, followed by Buipe limestone at 475 μm, and Nauli limestone at 330 μm. All size fractions were monodispersed (Figure 2).
Sharp peaks in the XRD diffractograms for Oterpkolu and Buipe limestones indicate that they are highly crystalline (Figure 3), whereas diffractogram peaks of the Nauli limestone were slightly broader. The X-ray diffractograms confirm that the main diffraction peaks correspond to the calcite (CaCO3), with a dominant (104) pattern at 2θ = 29.7°, and other calcite peaks at 2θ = 23°, 35.8°, 39°, 43.1°, 47.0°, 48.4°, 58°, and 64.5° which, respectively, correspond to (012), (110), (113), (202), (018), (116), (122), and (300) patterns, in agreement with Marques et al. [12]. The pattern observed at 2θ = 26.4° corresponds to SiO2, confirming that Oterpkolu limestone contains the most SiO2.

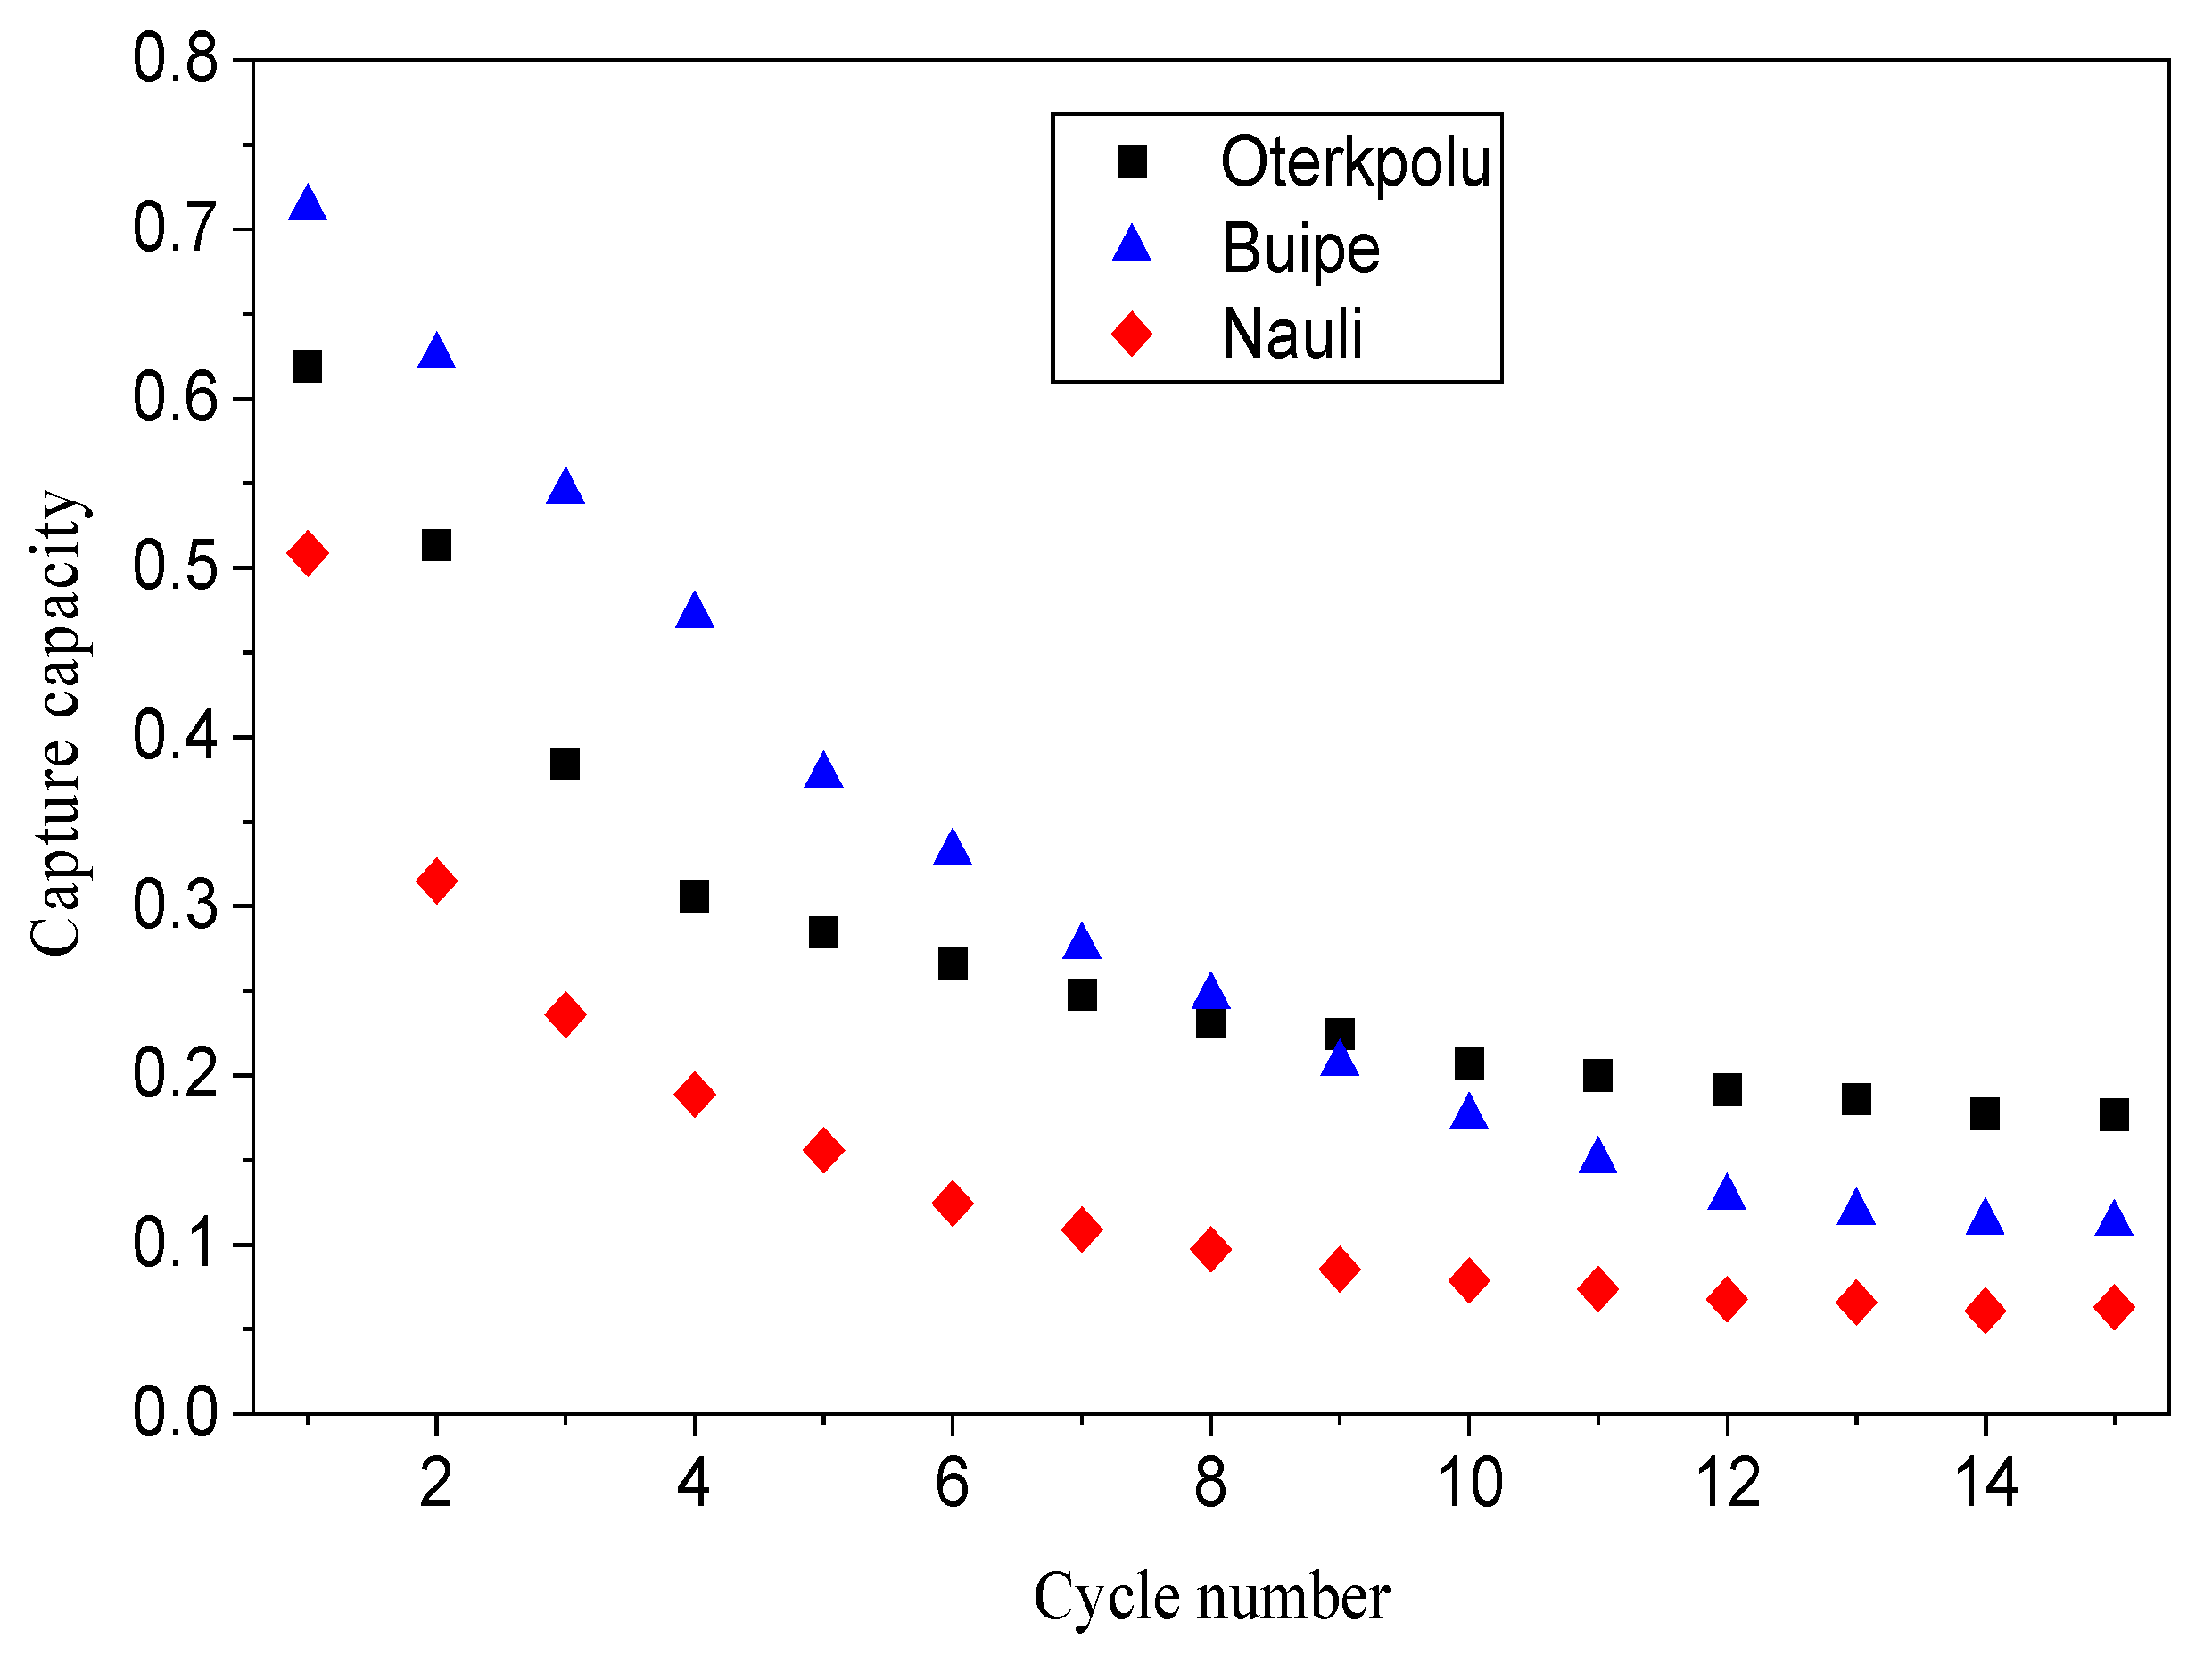
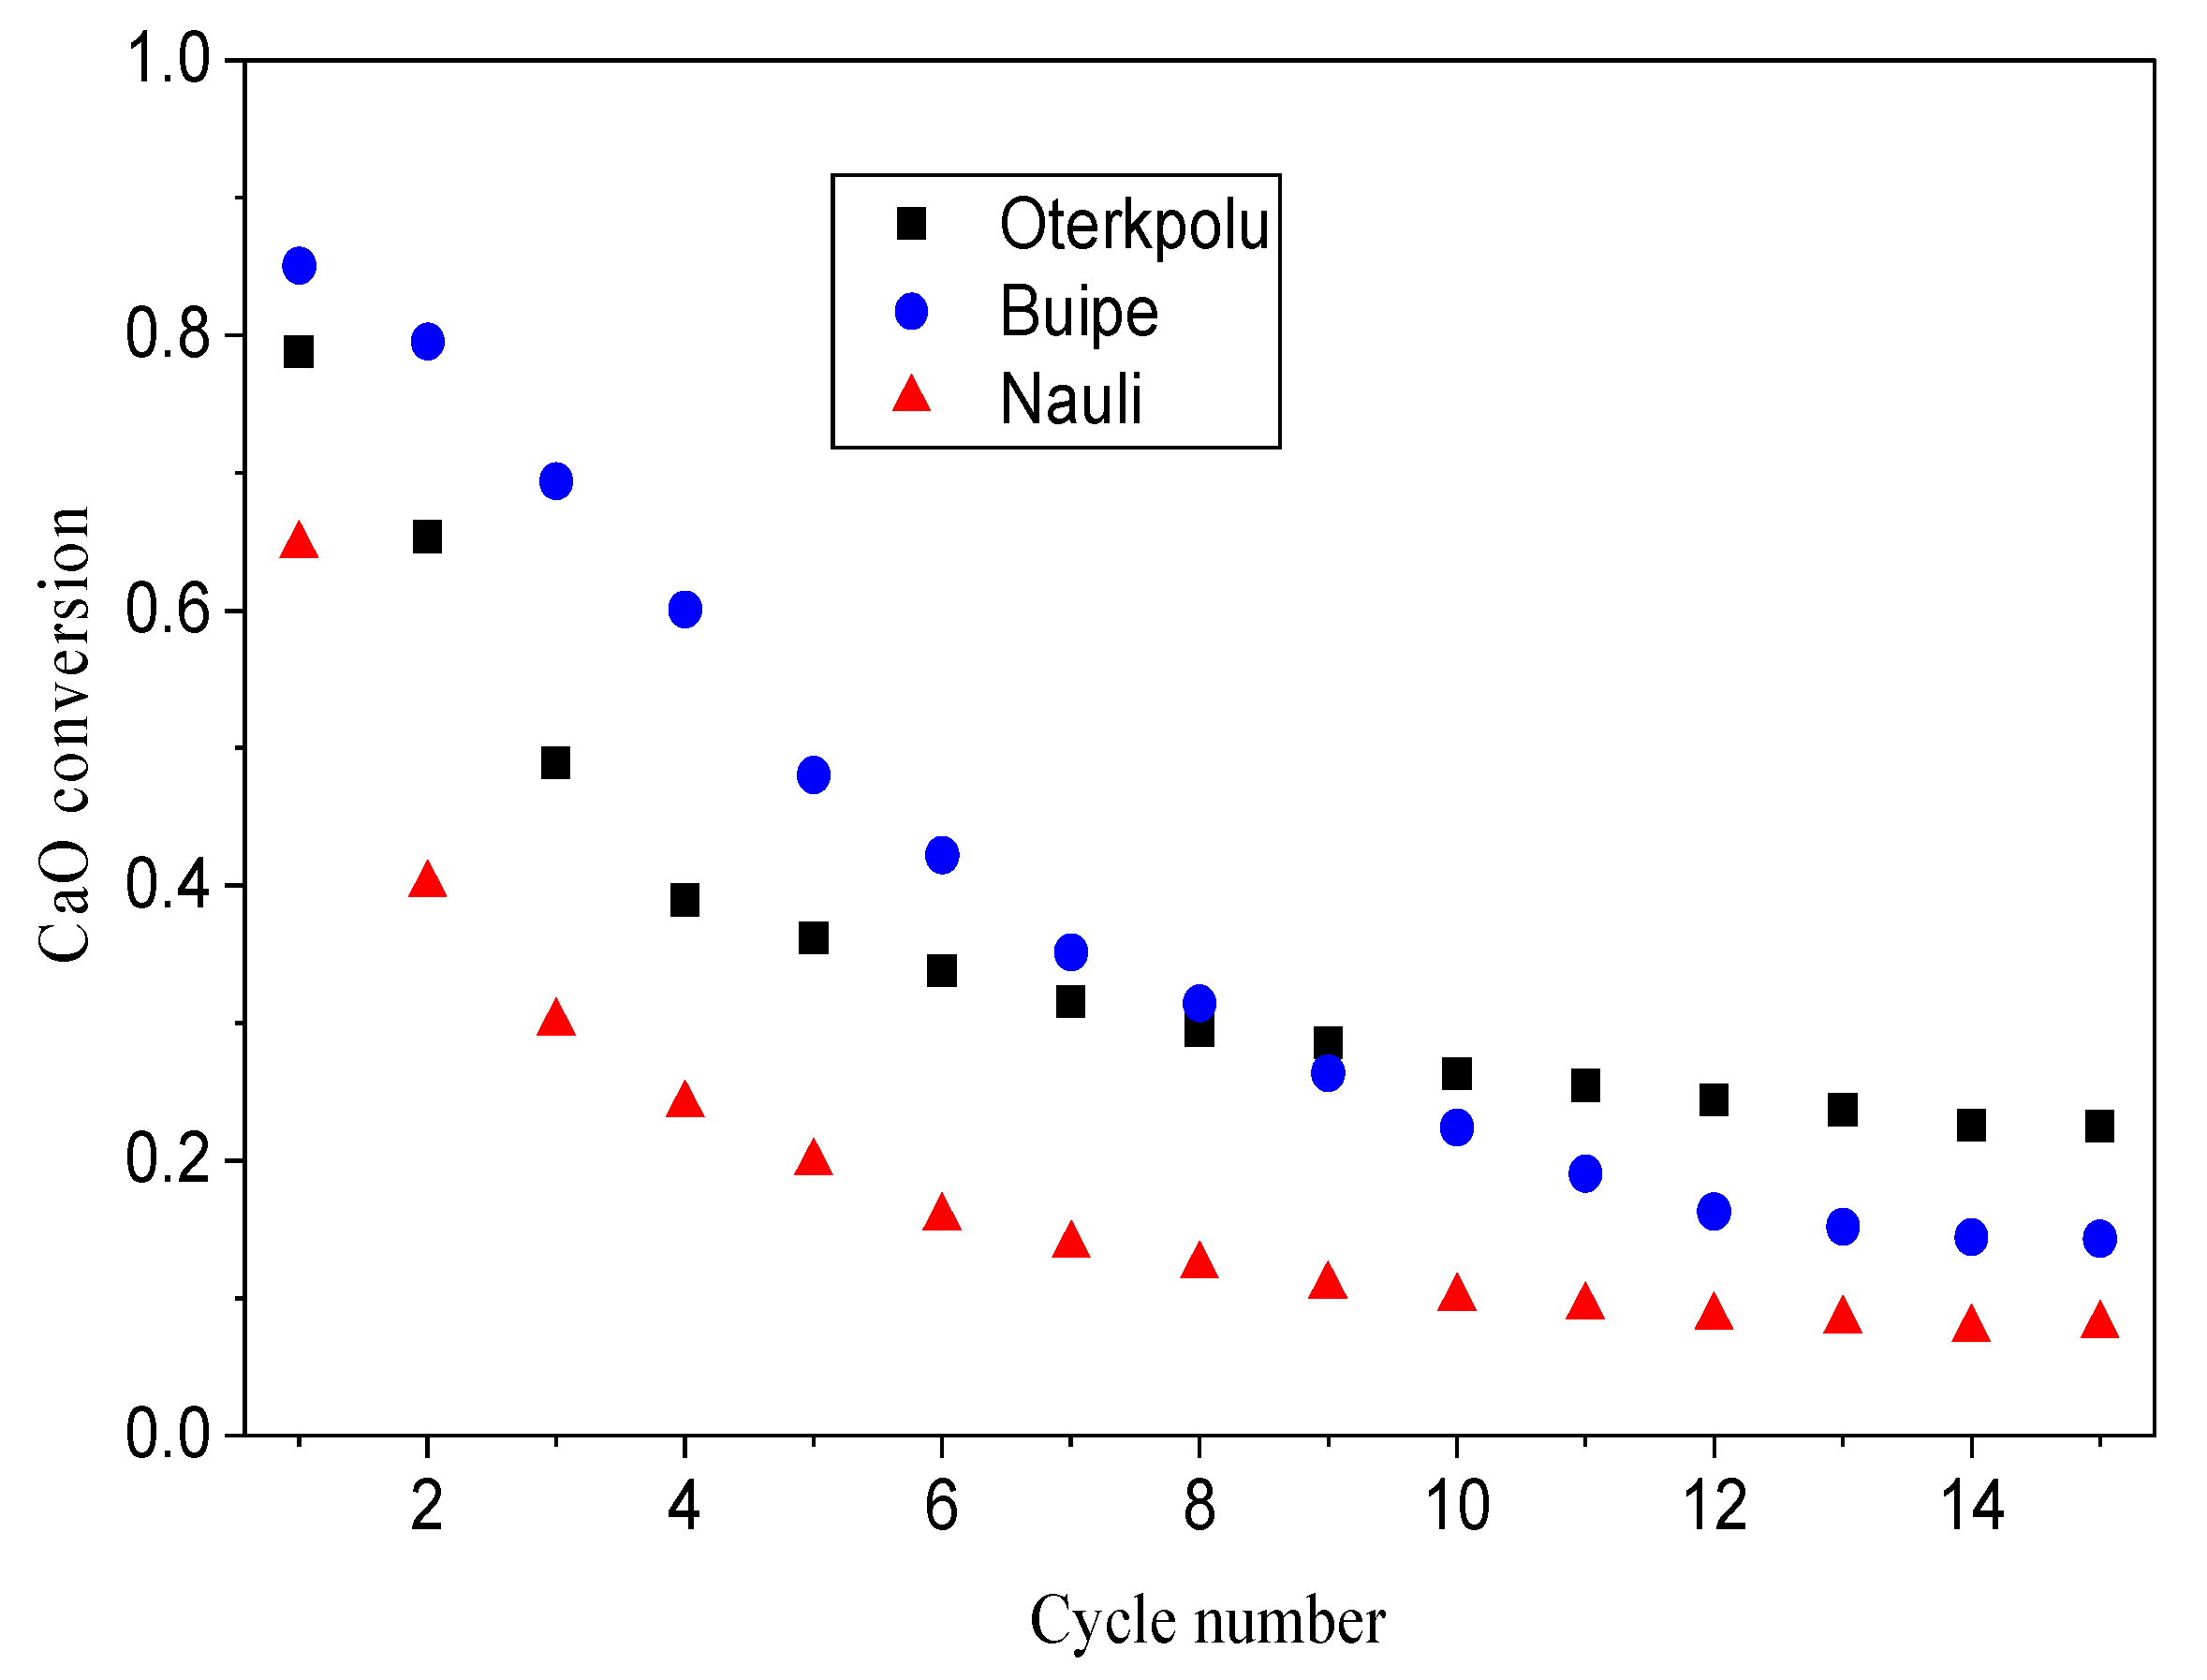
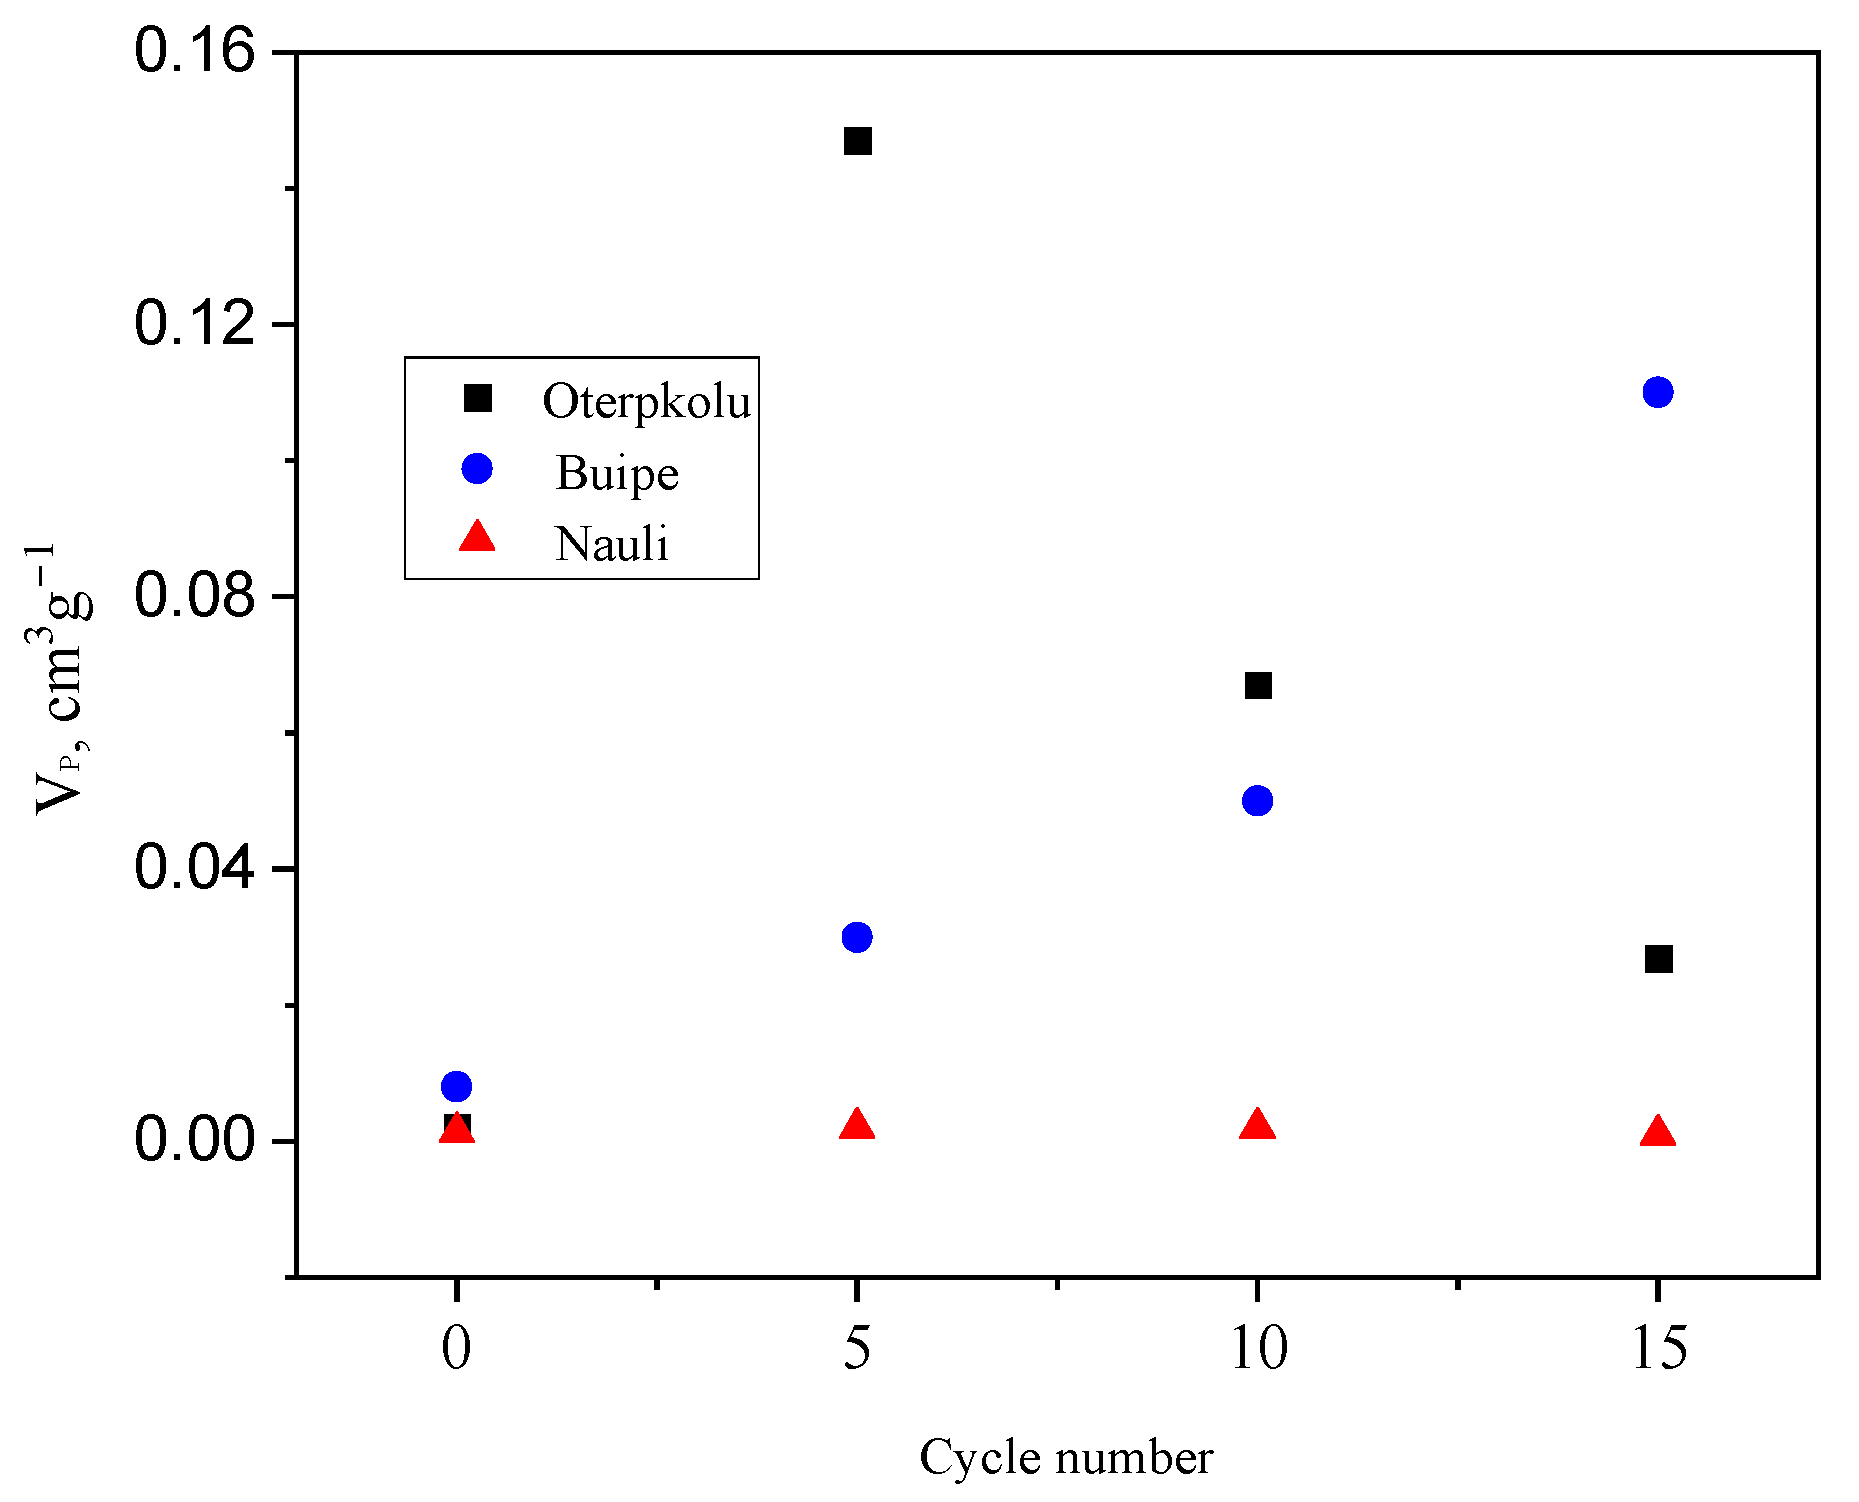
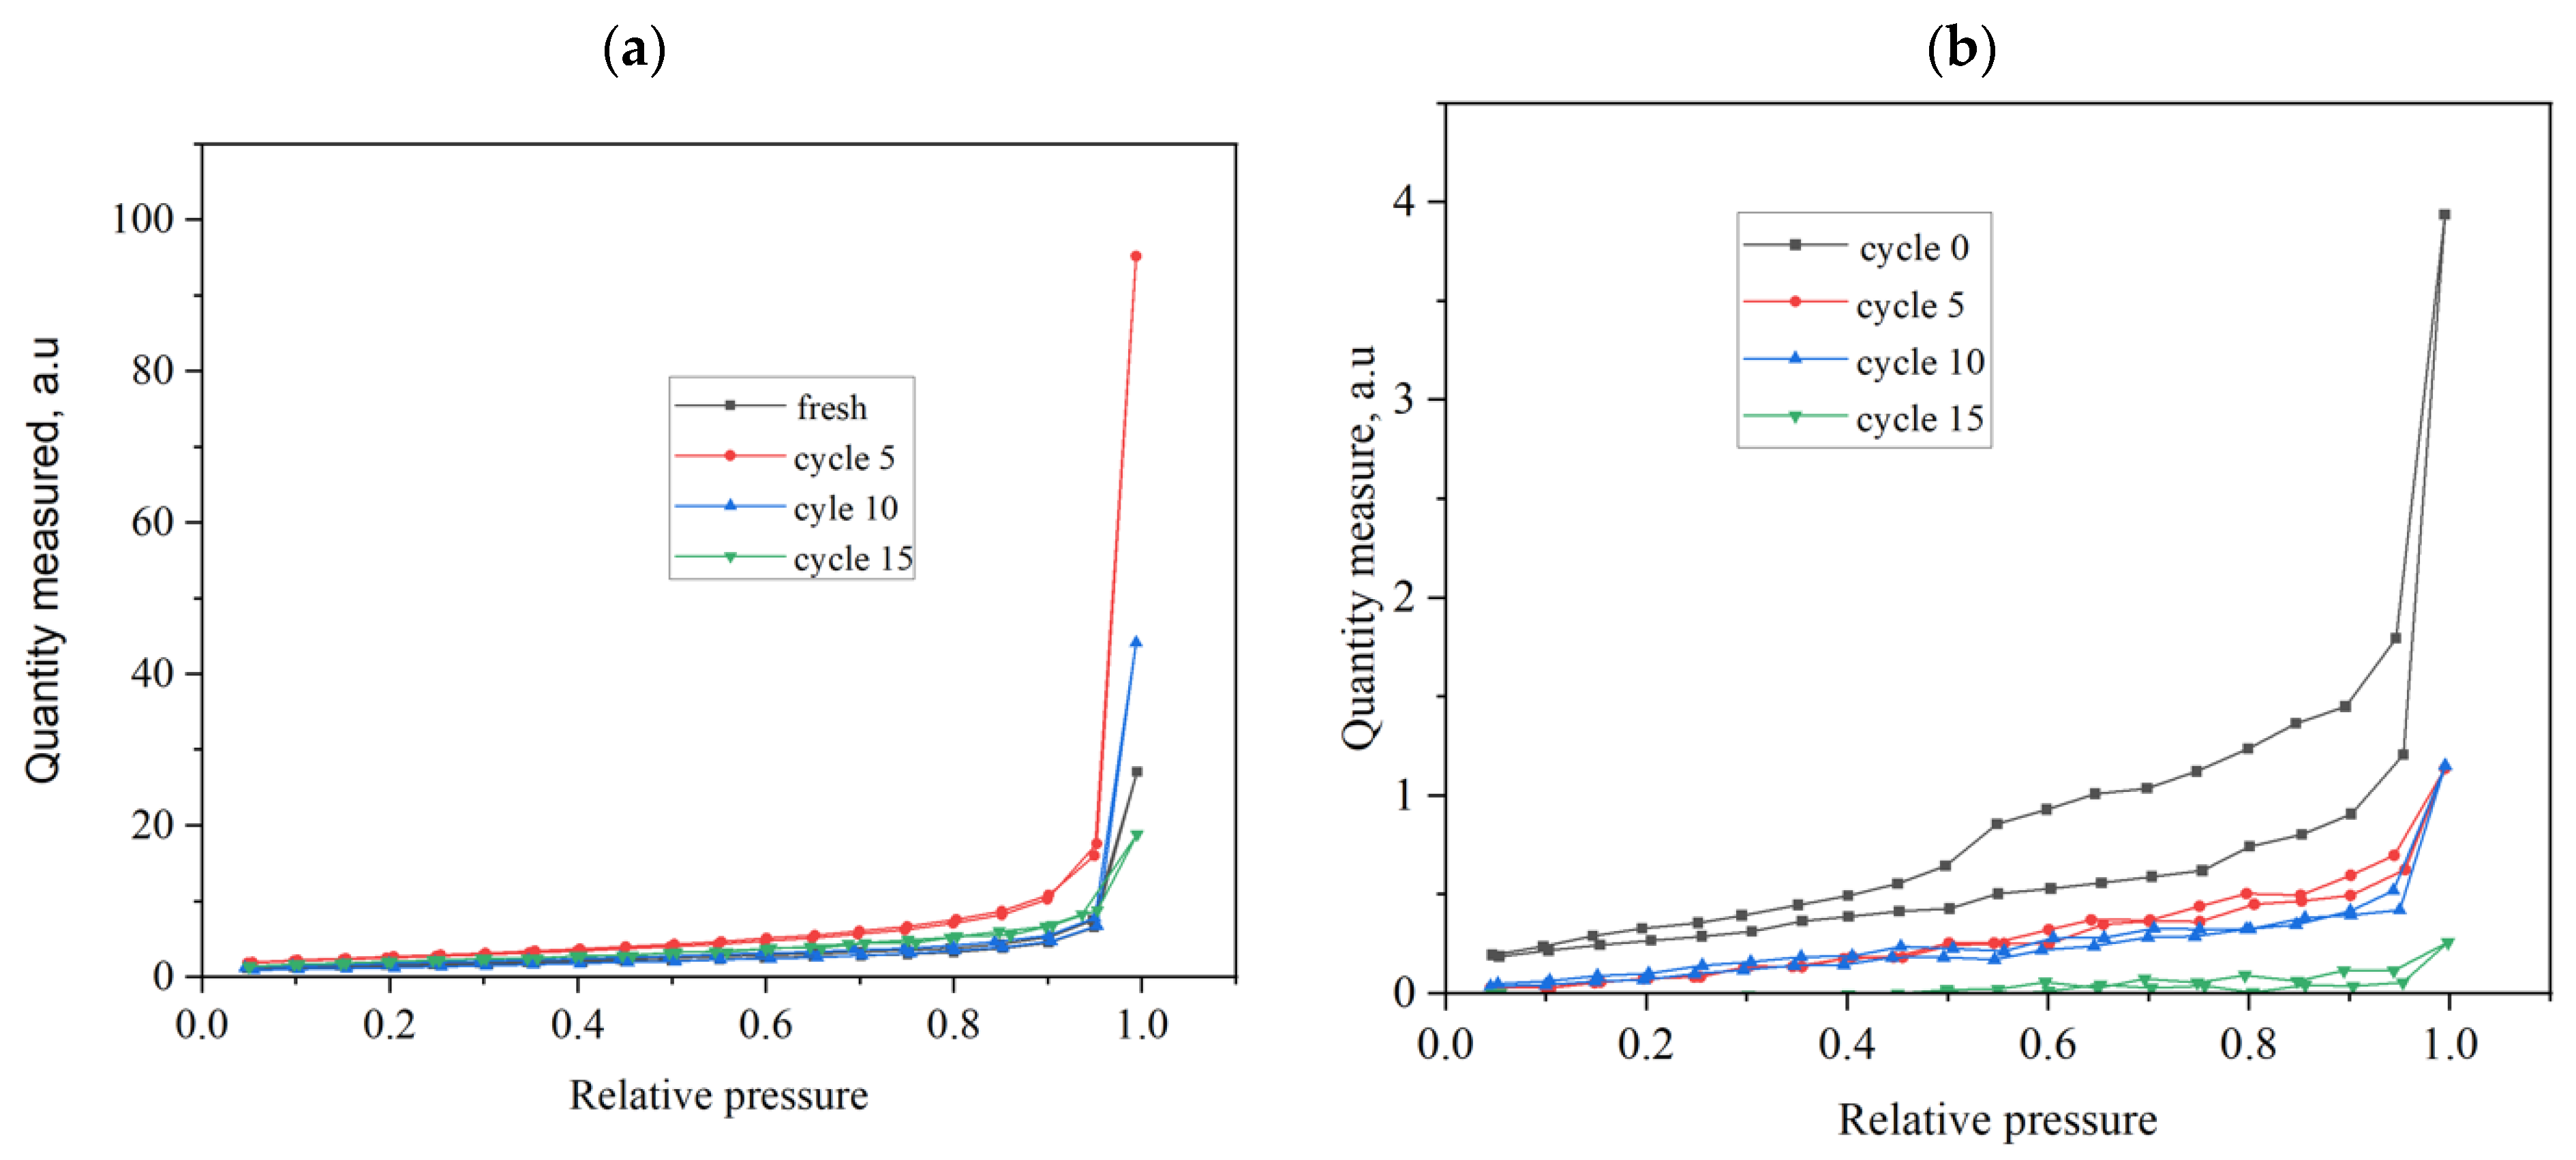
3.2. Reactivity of Limestones

The CO2 capture capacity of the three different limestones was evaluated based on multiple carbonation–calcination cycles. The CO2 capture capacity of limestone is defined as the ratio of the mass of CO2 captured to the mass of sorbent, which includes the minor concentrations of MgO (<4%) and K2O (~1%). Here, m s o r b e n t is the initial mass of limestone, M C a O is the molar mass of CaO, w C a O is the percentage of CaO in the initial mass of limestone obtained from the chemical analysis of the limestone, and n C O 2 ,   c a r b is the number of moles of CO2 captured in the carbonization step. The latter was determined using Equation (5), where n C O 2 ,   i refers to the number of moles of CO2 fed to the reactor, and n C O 2 ,   n o t   c a p t is the number of moles detected at the outlet between times t 1 and t 2 [22].
Capture   capacity = n C O 2 , c a r b M C a O m s o r b e n t w C a O × 100 %
n C O 2 , c a r b = t 1 t 2 n C O 2 , i n C O 2 , n o t c a p t d t
The capture capacity of the limestone drops after each successive cycle (Figure 4). The Buipe limestone capture capacity was higher than that of Oterkpolu and Nauli limestones and it had the highest percentage of CaO and the least percentage of MgO and K2O. However, after, it dropped below the capture capacity of Oterkpolu limestone. It is surprising that the Nauli limestone had such a large capture capacity despite its lower surface area. One limitation of the study relates to reacting until the maximum stable capacity is reached rather than time: Presumably, the limestones with a higher surface area would react faster than the Nauli limestone with only 1 m2 g−1.
The most practical parameter to evaluate the performance of limestone is the capture capacity but it is worth looking at the CaO conversion, i.e., the ratio of the mass of CaO converted in each carbonation stage to the mass of CaO initially present in the sorbent after calcination (Figure 5). The conversion of CaO in limestone is a product of the capture capacity and the ratio of the molar mass of CaO to that of CO2 (MCaO/MCO2) [14]. The three limestone samples follow similar deactivation profiles as other natural limestones, consisting of an initial steeper drop corresponding to an initial fast and kinetically controlled stage dominated by surface reaction, followed by a plateauing, which is indicative of the rate being dominated by the diffusion of CO2 across a CaCO3 “film” that might form. The initial conversions of Buipe, Oterpkolu, and Nauli limestones were 82%, 78%, and 65%, respectively, which are similar to other natural limestones like Strassburg limestone (80%) [21], Cadomin limestone (76%) [23], La Bianca limestone [20], and Maoming limestone (47%) [24]. Considering the deactivation trends, CaO content and the textural properties only partially contribute to the drop in conversion, which was also reported in the work of Teixeira et al. [22].
The conversion of the three limestones decreased with the number of cycles. After 15 carbonation–calcination cycles, conversion dropped by 72%, 75%, and 83% of the initial conversions for Oterpkolu, Buipe, and Nauli limestones, respectively. The initially higher CO2 capture capacity of Buipe limestone may partly be attributed to its higher CaO content as compared to the other two limestones. However, the Oterpkolu limestone exhibited better stability, with less CO2 capture decay, possibly due to its higher SiO2 content. For instance, Valverde et al. observed that the addition of nano-SiO2 particles to limestone improved CO2 capture stability due to the higher active surface area and stable pore structure [25]. Li et al. [24] also concluded that the addition of rice husk with high SiO2 content improved the stability and CO2 capture capacity of sorbents. They attributed the higher stability to the higher melting point of calcium silicate formed from the reaction between SiO2 and Ca(OH)2, making the sorbent more resistant to sintering.
The decrease in the reactivity of the limestone can be generally attributed to the sintering of CaO during the high-temperature calcination. Sintering starts at the Tammann temperature, which is half of its melting point [26]. CaCO3 has a Tammann temperature of 553 °C and so we expect substantial sintering when calcining at 800 °C [27]. The composition of the sorbent also has a major effect on its thermal stability and durability over repeated carbonation–calcinations cycles. Thus, it is expected that CaO sorbents with high SiO2 and MgO content would resist sintering better. Sintering leads to grain growth and pore shrinkage, a reduction in microporosity, and an increase in macroporosity [28]. Sintering may also lead to pore blockage and reduction in useable surface area. Following the reaction of CO2 with CaO during the kinetically controlled stage of carbonation, the product CaCO3 blocks the pores, rendering CaO sites in the pores unavailable in the subsequent carbonation time and cycles. This condition severely reduces the ability of the sorbent to capture CO2.
The microporosity gradually increases with successive carbonation cycles (Figure 6 and Figure 7). Similar shifts from micro- to macroporosity were observed for Oterpkolu and Buipe (Figure 6).
The initial stage of sintering is governed by surface diffusion, where small pores close and larger pores of equal volume are created but with a lower surface area. At the intermediate and final stages, both surface area and porosity decrease [29].
The surface area of the natural limestones drops with successive carbonation–calcination cycles (Figure 8), which is consistent with the carrying capacity trend. This can be ascribed to sintering accompanied by a loss of micropores and increase in macropores. Solid-state sintering involves the temperature-dependent generation of vacancies and ion-sensitive lattice defects, with void volume migrating from smaller to larger pores, and mass flowing from larger to smaller pores [30].
Most naturally occurring limestones exhibit a decrease in pore volume during cycling as a consequence of sintering and the associated reduction in the number of smaller pores [8,18,20,24]. The pore volume increases with cycle number for the Buipe limestone, while it changes little for the Nauli limestone (Figure 9). The pore volume of the Oterpkolu limestone increases through the first 10 cycles and then drops. Portuguese marble waste powder is one of the only other naturally occurring sources of CaO in the literature found to exhibit similar behavior [13,22,30]. This behavior can be explained by looking at the N2 adsorption isotherms.
The nitrogen sorption isotherms for Oterpkolu and Nauli limestones after different numbers of cycles are shown in Figure 10. Oterpkolu and Nauli limestones all exhibit type IV sorption isotherms with a type III hysteresis loop [31], implying mesoporous materials with small pore widths. The increase in pore volume (Figure 8) after multiple cycles may be attributed to the formation of mesopores with smaller pore diameters. Pores of smaller diameters might have arisen due to the release of CO2 during the calcination of CaCO3. Alvarez and Abanades [32] reported a bimodal pore size distribution due to smaller pores and another peak resulting from increasing mesopores due to the sintering of unreacted CaO.
Figure 11 shows XRD diffractograms of the limestones after 5, 10, and 15 cycles. Both Oterpkolu and Buipe demonstrated crystalline well-defined diffraction peaks in the 20° to 95° range. It is also clear that the dominant phase in the calcined limestones after different cycling numbers is CaO. Peaks appearing at 2θ values of 32.2°, 37.4°, 53.9°, and 67.4° can be assigned to (111), (200), (202), (311), and (222) patterns of CaO. Both limestones also show peaks at 26.5° which can be attributed to the (101) pattern of SiO2. Furthermore, peaks observed at 2θ values of 29.7°, 23.1°, and 64.4° are attributed to (101), (012), and (300) patterns, which confirm the presence of calcite (CaCO3), implying that calcination times might not have been sufficient. The diffractograms do not show significant differences for the various number of cycles. Like the pre-cycling diffractogram (Figure 3), the diffractograms of Nauli limestone after 5, 10, and 15 cycles are broader, implying a less crystalline structure.
The Oterpkolu limestone contained the highest percentage of SiO2 and was expected to demonstrate the lowest CO2 capture capacity, because silica was expected to react with calcium to form calcium silicate, thereby reducing the amount of CaO available to capture CO2. Indeed, the initial capture capacity of Oterpkolu was lower than Buipe. However, the presence of SiO2 contributes to more stable CO2 capture capacity over many cycles, as discussed above.
Figure 12 shows the EDX maps of Nauli limestone from its initial uncalcined state to its state after 15 carbonation–calcination cycles. The reactivity of Nauli limestone may have decreased significantly due to the formation of calcium silicate on the sorbent surface (which increased with cycling), thereby reducing the available CaO surface area for reaction with CO2. Additionally, the relatively high SiO2 content did not contribute to maintaining stable reactivity in this case. It is also clear that agglomeration contributed to the poor reactivity performance of the limestones as observed in our previous work [33,34,35].
Figure 13 shows the EDX maps of Oterpkolu and Buipe limestone after 5 and 15 carbonation–calcination cycles. Oterpkolu limestone retained the clearest surface and showed little or no surface covering with calcium silicate nor agglomeration. This confirms the high stability of the reactivity of Oterpkolu limestone. It is also clear that after 15 cycles, Buipe limestone had degraded more than Oterpkolu limestone.

4. Conclusions

This work studied the CO2 capture performance of three natural limestones undergoing carbonation–calcination cycles in a micro-fluidized bed reactor, specifically focusing on the decrease in reactivity as the number of cycles increased. Here, a combination of XRF, SEM-EDX, XRD, and N2 sorption was used to study the CaO content, surface morphology, crystallinity, and surface area.
Buipe limestone, which had the highest CaO content, exhibited the highest initial reactivity with CO2, but its capture capacity declined more rapidly compared to Oterpkolu limestone containing less CaO. It is believed that the higher SiO2 content of the Oterpkolu limestone enhanced its stability during the cycles.
The reduction in CO2 capture capacity correlates with the loss in surface area as it sinters. The pore volume increases as a function of cycle number for both the Buipe and Oterkpolu which may be attributed to the formation of mesopores with smaller pore diameters due to the release of CO2 during the calcination of CaCO3. The pore volume of the Oterkpolu limestone decreased after 10 cycles while that of the Nauli limestone remained very low in all cycles. Sintering and agglomeration at a high temperature may have contributed to the deterioration in reactivity of the Nauli limestone.

Author Contributions

Conceptualization, P.A.-B.; Methodology, P.A.-B.; Formal analysis, P.A.-B.; Investigation, P.A.-B.; Writing—original draft, P.A.-B.; Writing—review & editing, N.Y.A., G.S.P., J.R.M. and V.Z.; Supervision, J.R.M. and V.Z.; Funding acquisition, P.A.-B., N.Y.A. and V.Z. All authors have read and agreed to the published version of the manuscript.

Funding

The authors thank commonwealth scholarship secretariat and the KNUST Engineering education program for the financial support.

Data Availability Statement

The original contributions presented in this study are included in the article. Further inquiries can be directed to the corresponding author(s).

Conflicts of Interest

The authors declare no conflict of interest.

References

  1. Plakitkina, L.S.; Plakitkin, Y.A.; Dyachenko, K.I. Hydrogen versus coal: Implications of the hydrogen energy engineering advance for the coal industry. Gorn. Zhurnal 2021, 2021, 14–21. [Google Scholar] [CrossRef]
  2. World Metrological Organization. WMO Confirms 2024 as Warmest Year on Record at About 1.55 °C Above Pre-Industrial Level. 2024. Available online: https://wmo.int/news/media-centre/wmo-confirms-2024-warmest-year-record-about-155degc-above-pre-industrial-level (accessed on 27 February 2025).
  3. Roche. Collaborating for a Lasting Future-Global Status of CCC 2024; Roche: Basel, Switzerland, 2024. [Google Scholar]
  4. Blamey, J.; Anthony, E.; Wang, J.; Fennell, P. The calcium looping cycle for large-scale CO2 capture. Prog. Energy Combust Sci. 2010, 36, 260–279. [Google Scholar] [CrossRef]
  5. Alie, C.; Backham, L.; Croiset, E.; Douglas, P. Simulation of CO2 capture using MEA scrubbing: A flowsheet decomposition method. Energy Convers. Manag. 2005, 46, 475–487. [Google Scholar] [CrossRef]
  6. Rao, A.B.; Rubin, E.S. A Technical, Economic, and Environmental Assessment of Amine-Based CO2 Capture Technology for Power Plant Greenhouse Gas Control. Environ. Sci. Technol. 2002, 36, 4467–4475. [Google Scholar] [CrossRef] [PubMed]
  7. Abu-Zahra, M.R.; Schneiders, L.H.; Niederer, J.P.; Feron, P.H.; Versteeg, G.F. CO2 capture from power plants Part I. A parametric study of the technical performance based on monoethanolamine. Int. J. Greenh. Gas Control 2007, 1, 37–46. [Google Scholar] [CrossRef]
  8. Nabavi, S.A.; Erans, M.; Manović, V. Demonstration of a kW-scale solid oxide fuel cell-calciner for power generation and production of calcined materials. Appl. Energy 2019, 255, 113731. [Google Scholar] [CrossRef]
  9. Amirkhosrow, M.; Lay, E.N. Simulation model evaluation of desorber column in CO2 capture process by MEA scrubbing: A rigorous rate-based model for kinetic model and mass transfer correlations analysis. Fuel Process. Technol. 2020, 203, 106390. [Google Scholar] [CrossRef]
  10. Alvarez, D.; Abanades, J.C. Determination of the critical product layer thickness in the reaction of CaO with CO2. Ind. Eng. Chem. Res. 2005, 44, 5608–5615. [Google Scholar] [CrossRef]
  11. Sun, P.; Lim, C.J.; Grace, J.R. Cyclic CO2 capture by limestone-derived sorbent during prolonged calcination/carbonation cycling. AIChE J. 2008, 54, 1668–1677. [Google Scholar] [CrossRef]
  12. Marques, L.; Mota, S.; Teixeira, P.; Pinheiro, C.; Matos, H. Ca-looping process using wastes of marble powders and limestones for CO2 capture from real flue gas in the cement industry. J. CO2 Util. 2023, 71, 102450. [Google Scholar] [CrossRef]
  13. Abreu, M.; Teixeira, P.; Filipe, R.M.; Domingues, L.; Pinheiro, C.I.; Matos, H.A. Modeling the deactivation of CaO-based sorbents during multiple Ca-looping cycles for CO2 post-combustion capture. Comput. Chem. Eng. 2020, 134, 106679. [Google Scholar] [CrossRef]
  14. Valverde, J.; Sanchez-Jimenez, P.; Perez-Maqueda, L. Ca-looping for postcombustion CO2 capture: A comparative analysis on the performances of dolomite and limestone. Appl. Energy 2015, 138, 202–215. [Google Scholar] [CrossRef]
  15. Bosoaga, A.; Masek, O.; Oakey, J.E. CO2 Capture Technologies for Cement Industry. Energy Procedia 2009, 1, 133–140. [Google Scholar] [CrossRef]
  16. Anthony, E.J.; Wang, J.; Oakey, J.E. Integrating CO2 Capture with CaO. Environ. Sci. Technol. 2005, 39, 2861–2866. [Google Scholar]
  17. Grasa, G.S.; Abanades, J.C. CO2 capture capacity of CaO in long series of carbonation/calcination cycles. Ind. Eng. Chem. Res. 2006, 45, 8846–8851. [Google Scholar] [CrossRef]
  18. Zhou, L.; Duan, L.; Anthony, E.J. A calcium looping process for simultaneous CO2 capture and peak shaving in a coal-fired power plant. Appl. Energy 2019, 235, 480–486. [Google Scholar] [CrossRef]
  19. Manovic, V.; Charland, J.-P.; Blamey, J.; Fennell, P.S.; Lu, D.Y.; Anthony, E.J. Influence of calcination conditions on carrying capacity of CaO-based sorbent in CO2 looping cycles. Fuel 2009, 88, 1893–1900. [Google Scholar] [CrossRef]
  20. Abanades, J.C.; Alvarez, D. Conversion limits in the reaction of CO2 with lime. Energy Fuels 2003, 17, 308–315. [Google Scholar] [CrossRef]
  21. Sun, P.; Grace, J.R.; Lim, C.J.; Anthony, E.J. The effect of CaO sintering on cyclic CO2 capture in energy systems. AIChE J. 2007, 53, 2432–2442. [Google Scholar] [CrossRef]
  22. Teixeira, P.; Fernandes, A.; Ribeiro, F.; Pinheiro, C.I.C. Blending wastes of marble powder and dolomite sorbents for calcium-looping CO2 capture under realistic industrial calcination conditions. Materials 2021, 14, 4379. [Google Scholar] [CrossRef] [PubMed]
  23. Hughes, R.W.; Lu, D.; Anthony, E.J.; Wu, Y. Improved long-term conversion of limestone derived sorbents for in situ capture of CO2 in a fluidised bed combustor. Ind. Eng. Chem. Res. 2004, 43, 5529–5539. [Google Scholar] [CrossRef]
  24. Li, Y.; Zhao, C.; Chen, H.; Duan, L.; Chen, X. CO2 Capture Behavior of Shell during Calcination/Carbonation Cycles. Chem. Eng. Technol. 2009, 32, 1176–1182. [Google Scholar] [CrossRef]
  25. Valverde, J.M.; Perejon, A.; Perez-Maqueda, L.A. Enhancement of Fast CO2 Capture by a Nano-SiO2/CaO Composite at Ca-Looping Conditions. Environ. Sci. Technol. 2012, 46, 6401–6408. [Google Scholar] [CrossRef] [PubMed]
  26. Glasson, D.R.; O’Neill, P. Reactivity of lime and related oxides. XVII. Sulphating of lime with magnesium and aluminium sulphates. J. Appl. Chem. 1967, 17, 96–101. [Google Scholar] [CrossRef]
  27. Lu, H.; Khan, A.; Pratsinis, S.E.; Smirniotis, P.G. Flame-Made Durable Doped-CaO Nanosorbents for CO2 Capture. Energy Fuels 2009, 23, 1093–1100. [Google Scholar] [CrossRef]
  28. Kim, J.Y.; Ellis, N.; Lim, C.J.; Grace, J.R. Effect of calcination/carbonation and oxidation/reduction on attrition of binary solid species in sorption-enhanced chemical looping reforming. Fuel 2020, 271, 117665. [Google Scholar] [CrossRef]
  29. Maya, J.C.; Chejne, F.; Gómez, C.A.; Bhatia, S.K. Effect of the CaO sintering on the calcination rate of CaCO3 under atmospheres containing CO2. AIChE J. 2018, 64, 3638–3648. [Google Scholar] [CrossRef]
  30. Pinheiro, C.I.C.; Fernandes, A.; Freitas, C.; Santos, E.T.; Ribeiro, M.F. Waste Marble Powders as Promising Inexpensive Natural CaO-Based Sorbents for Post-Combustion CO2 Capture. Ind. Eng. Chem. Res. 2016, 55, 7860–7872. [Google Scholar] [CrossRef]
  31. Thommes, M.; Kaneko, K.; Neimark, A.V.; Olivier, J.P.; Rodriguez-Reinoso, F.; Rouquerol, J.; Sing, K.S.W. Physisorption of gases, with special reference to the evaluation of surface area and pore size distribution (IUPAC Technical Report). Pure Appl. Chem. 2015, 87, 1051–1069. [Google Scholar] [CrossRef]
  32. Alvarez, D.; Abanades, J.C. Pore-Size and Shape Effects on the Recarbonation Performance of Calcium Oxide Submitted to Repeated Calcination/Recarbonation Cycles. Energy Fuels 2005, 19, 270–278. [Google Scholar] [CrossRef]
  33. Asiedu-Boateng, P.; Asiedu, N.; Zivkovic, V.; Patience, G. Attrition characteristics of limestone in gas-solid fluidized beds. Powder Technol. 2023, 419, 118342. [Google Scholar] [CrossRef]
  34. Asiedu-Boateng, P.; Legros, R.; Patience, G. Attrition resistance of calcium oxide-copper oxide-cement sorbents for post-combustion carbon dioxide capture. Adv. Powder Technol. 2016, 27, 786–795. [Google Scholar] [CrossRef]
  35. Perreault, P.; Patience, G.-S. Carbonation and deactivation kinetics of a mixed calcium oxide–copper oxide sorbent/oxygen carrier for post-combustion carbon dioxide capture. Chem. Eng. J. 2016, 306, 726–733. [Google Scholar] [CrossRef]
Figure 1. Simplified schematic of the experimental setup.
Catalysts 15 00697 g001
Figure 2. Particle size distribution of limestone.
Catalysts 15 00697 g002
Figure 3. XRD patterns of the fresh limestones.
Catalysts 15 00697 g003
Figure 4. CO2 capture capacity of limestone.
Catalysts 15 00697 g004
Figure 5. Variation in limestone reactivity with number of carbonation–calcination cycles. Carbonation @ 650 °C and calcination @ 800 °C.
Catalysts 15 00697 g005
Figure 6. SEM images of Nauli limestone showing a gradual shift from microporosity to macroporosity from (a) fresh limestone (b) after 5th carbonation cycle (c) after 10th carbonation cycle to (d) after the 15th carbonation cycle.
Catalysts 15 00697 g006
Figure 7. SEM images of limestones after various carbonation–calcination cycles showing a gradual shift from microporosity to microporosity: (a) Oterpkolu after 5 cycles, (b) Oterpkolu after 15 cycles, (c) Buipe after 5 cycles, (d) Buipe after 15 cycles.
Catalysts 15 00697 g007aCatalysts 15 00697 g007b
Figure 8. Variation in BET surface with carbonation–calcination cycle number.
Catalysts 15 00697 g008
Figure 9. Effect of carbonation–calcination cycling on pore volume.
Catalysts 15 00697 g009
Figure 10. N2 sorption isotherms after different numbers of cycles for (a) Oterpkolu limestone and (b) Nauli limestone.
Catalysts 15 00697 g010
Figure 11. XRD patterns of used limestones: (a) Oterpkolu, (b) Buipe, and (c) Nauli.
Catalysts 15 00697 g011
Figure 12. EDX maps of Nauli limestone after (a) 0 cycles, (b) 5 cycles, (c) 10 cycles, and (d) 15 cycles.
Catalysts 15 00697 g012
Figure 13. EDX map; (a) Oterpkolu after 5 cycles, (b) Oterpkolu limestone after 15 cycles, (c) Buipe limestone after 5 cycles, and (d) Buipe limestone after 15 cycles.
Catalysts 15 00697 g013aCatalysts 15 00697 g013b
Table 1. Physical properties of limestones.
Property/MaterialOterpkoluBuipeNauli
Particle density, kg m−3256024502430
BET surface area, m2 g−13.22.00.2
Pore volume, mL g−10.120.0150.08
D50, µm520475330
Mean size, µm500420370
Table 2. Chemical composition of the limestone (%).
CompositionOterpkoluBuipeNauli
MgO3.40.82
Al2O35.02.44.1
SiO2277.714
P2O50.10.4-
SO30.50.41
K2O1.00.41.2
CaO608774
TiO21.030.160.12
MnO0.110.540.40
Fe2O32.391.333.11
BaO --0.5
Disclaimer/Publisher’s Note: The statements, opinions and data contained in all publications are solely those of the individual author(s) and contributor(s) and not of MDPI and/or the editor(s). MDPI and/or the editor(s) disclaim responsibility for any injury to people or property resulting from any ideas, methods, instructions or products referred to in the content.

