Article

Electrocatalytic Investigation of the SOFC Internal CH4 Dry Reforming with Modified Ni/GDC: Effect of Au Content on the Performance Enhancement by Fe-Au Doping

by
Evangelia Ioannidou
1,*,
Stylianos G. Neophytides
1 and
Dimitrios K. Niakolas
1,2,*
1
Institute of Chemical Engineering Sciences, Foundation for Research and Technology-Hellas (FORTH/ICE-HT), GR-26504 Patras, Greece
2
Department of Chemistry, University of Ioannina, GR-45110 Ioannina, Greece
*
Authors to whom correspondence should be addressed.
Catalysts 2025, 15(7), 618; https://doi.org/10.3390/catal15070618
Submission received: 22 May 2025 / Revised: 16 June 2025 / Accepted: 18 June 2025 / Published: 23 June 2025

Abstract

Internal Dry Reforming of Methane (IDRM) in biogas fed Solid Oxide Fuel Cells (SOFCs) was investigated on Fe-Au modified Ni/GDC electrolyte-supported cells at 900 and 850 °C. The aim was to clarify the synergistic interaction between Fe and Au, focusing on the effect of X wt.% of Au loading (where X = 1 or 3 wt.%) in binary Au-Ni/GDC and ternary 0.5 wt.% Fe-Au-Ni/GDC fuel electrodes. The investigation combined i-V, Impedance Spectroscopy and Gas Chromatography electrocatalytic measurements. It was found that modification with 0.5Fe-Au enhanced significantly the electrocatalytic activity of Ni/GDC for the IDRM reaction, whereas the low wt.% Au content had the most promoting effect. The positive interaction of 0.5 wt.% Fe with 1 wt.% Au increased the conductivity of Ni/GDC and enhanced the corresponding IDRM charge transfer electrochemical processes, especially those in the intermediate frequency region. Comparative long-term measurements, between cells comprising Ni/GDC and 0.5Fe-1Au-Ni/GDC, highlighted the significantly higher IDRM electrocatalytic activity of the modified electrode. The latter operated for almost twice the time (280 h instead of 160 h for Ni/GDC) with a lower degradation rate (0.44 mV/h instead of 0.51 mV/h). Ni/GDC degradation was ascribed to inhibited charge transfer processes in the intermediate frequencies region and to deteriorated ohmic resistance. Stoichiometric analysis on the (post-mortem) surface state of each fuel electrode showed that the wt.% content of reduced nickel on Ni/GDC was lower, compared to 0.5Fe-1Au-Ni/GDC, verifying the lower re-oxidation degree of the latter. This was further correlated to the hindered H2O production during IDRM operation, due to the lower selectivity of the modified electrode for the non-desired RWGS reaction.

Graphical Abstract

1. Introduction

The effects of human-caused global warming are irreversible for people alive today and will worsen as long as humans release greenhouse gases into the atmosphere [1]. Because of this considerable risk, the European Union’s and U.S. green energy regulations and policies focus on reducing greenhouse emissions and promoting the sustainable use of renewable resources [2,3].
In this context, Solid Oxide Fuel Cells (SOFCs) could have a key role as energy producing devices by using renewable sources such as biogas, biofuel or biomass as fuel in addition to hydrogen [4]. In particular, biogas is one of the most attractive fuels because it is cheap when obtained from landfills or anaerobic digesters and its use could simultaneously reduce fermentation waste, avoiding environmental issues [5,6]. Depending on the organic substrate, the composition of biogas ranges between 55–65% CH4 and 35–45% CO2 [7,8]. Biogas could be used either directly or indirectly (by using an external reformer) in SOFCs [9]. The direct operation of SOFCs without the need for an external reformer is known as Direct Internal Reforming (DIR), and it is one of the competitive advantages that favors the commercialization of these systems [6,9,10,11]. In the DIR process, the heat generated by the electrochemical reactions of fuel is used in the endothermic reforming reactions, which decreases the cooling demand of SOFCs and improves their overall efficiency [10,11,12]. Despite the significant progress in developing commercial SOFC systems, the main issue that hinders the widespread use of this technology is the performance degradation of the cells due to high thermal stresses and the risk of carbon deposition [9,10,13].
In DIR operation with a CH4 and CO2 mixture, the main reaction that occurs within the SOFC fuel electrode is the dry reforming of methane (DRM) to form syngas (Equation (1)) [8,9,14,15]. DRM is a strongly endothermic process, thermodynamically favored at high temperatures (>650 °C) and low pressure [8,14,16]. Apart from the DRM reaction, side reactions also take place. One of these side reactions is the reverse water gas shift (RWGS) (>825 °C) (Equation (2)), which lowers the H2/CO ratio and consumes the valuable H2, and methane decomposition (>600 °C) (Equation (3)) that leads to carbon formation [14,17,18,19].
  CH 4 + CO 2   2 CO + 2 H 2 Δ H 298 o = 247 kJ mol 1
CO 2 + H 2   CO + H 2 O       Δ H 298 o = 41 kJ mol 1
CH 4 C + 2 H 2 Δ H 298 o = 75 kJ mol 1
Electrical energy is then produced through the subsequent exothermic electrochemical oxidation of H2 and CO as well as of the supplied CH4 on the fuel electrode according to the following reactions (Equations (4)–(6)) [12,15,20]. In these reactions, the O2− ions come from the oxygen electrode, where O2 reduction takes place, and diffuse to the triple-phase boundary zone, where they react with the fuel.
  H 2 + O 2 H 2 O + 2 e Δ H 298 o = 242 kJ mol 1
  CO + O 2 CO 2 + 2 e Δ H 298 o = 283 kJ mol 1
CH 4 + O 2 CO + 2 H 2 + 2 e   Δ H 298 o = 37 kJ mol 1
The combination of endothermic and exothermic (electro-)catalytic reactions results in thermal stresses that eventually lead to the destruction of the fuel electrode structure [21,22]. In this respect, Takahashi et al. [21] reported severe thermal stresses in an SOFC using simulated biogas at 800 °C. The operation stopped after 15 min due to the thermo-mechanical fracture of the electrolyte thin film. Shiratori et al. [22] tackled this issue by adding air to the biogas, after which stabilization of the cell’s performance and the gradient of temperature was observed as a result of the exothermicity of the partial oxidation of CH4. On the other hand, excess air may result in the oxidation of the fuel electrode, which degrades the performance and efficiency of the SOFC [23].
Τhe presence of carbon deposits on the fuel electrode surface has been reported to increase its electrical conductivity, but it also decreases ionic conductivity, blocks the catalytically active sites, hinders the mass transfer and overall leads to the progressive deterioration of the cell’s performance [6,9,14,15,17,18,19]. Carbon deposition can be suppressed by adding oxygen-containing species such as air, O2, H2O and/or by increasing the CO2 content (i.e., the CO2/CH4 ratio) [23,24,25,26]. Steam may also be present in the products of the internal DRM (IDRM) process (Equation (4)) and can promote the carbon removal through the reaction of Equation (7) [9,10,26]. However, high steam or CO2 concentrations have been reported to be one reason for increased polarization resistance values and/or the oxidation of the Ni-based electrocatalysts, resulting in decreased cell performance [24,26,27]. On the positive side, under the closed circuit operating conditions in SOFCs, the O2− flux (i.e., current density) can oxidize the absorbed carbidic species according to Equation (8) [6,9,15,28]. Nevertheless, in this case, the removal of the absorbed carbon is restricted to the triple-phase boundary zone.
C ( s ) + H 2 O CO + H 2 Δ H 298 o = 131 kJ mol 1
  C ( s ) + O 2 CO + 2 e Δ H 298 o = 111 kJ mol 1
Considerable efforts have also been made in developing suitable electrocatalysts with improved carbon tolerance. The state-of-the-art (SoA) fuel electrode is Ni/YSZ (nickel-yttria stabilized zirconia), due to its high electronic conductivity under a reductive atmosphere, its excellent mechanical stability and its matched thermal expansion with the typical electrolyte YSZ [29,30]. However, several stability issues arise under hydrocarbon fuel feed because of carbon deposition, re-oxidation and the coarsening of Ni/YSZ particles [25,31]. Over the last years, new Ni-based materials have been introduced, more resistant to degradation and of the same or even higher performance than Ni/YSZ. Very promising results have been obtained using Ni/GDC (nickel-gadolinium doped ceria) as an improved solid oxide electrocatalyst [29,32,33]. Even under pure H2 feed or under CH4 reforming reaction conditions, the performance of Ni/GDC was found superior to that of Ni/YSZ, exhibiting the additional advantage of minimal coke build up [10,29,32,33]. The enhanced performance of GDC can be attributed to its mixed ionic-electronic conductivity and particularly to the redox tendency of ceria to change between the Ce4+ and Ce3+ oxidation states [34,35]. This significant characteristic of GDC increases the entire electro-active zone and allows CeO2 to release or to store oxygen under reducing and oxidizing conditions, respectively. Consequently, high oxygen mobility in ceria under CH4 decomposition favors the oxidation of carbon species on the surface toward CO and CO2 [8,35].
Another effective way to decrease the carbon deposition, to improve the activity and thermal stability of the electrocatalyst, and to suppress the non-desired RWGS reaction is doping [36,37]. Modifying Ni with small amounts (0.5–3 wt.%) of noble (i.e., Au) or non-noble (i.e., Cu, Co, Fe, Sn, Mo and W) metals is the subject of a large number of experimental and theoretical studies of DRM processing, and it can be also be applied to SOFCs using internal DRM processes [8,11,14,15,36,37,38,39]. In this respect, a Ni-Au-GDC SOFC anode with a GDC electrolyte demonstrated high resistivity to carbon deposition during the operation of equimolar simulated biogas at 640 °C for 120 h at 445 mV and 135 mA cm2 [40]. In another study, a Ni-Fe-GDC SOFC anode produced a maximum power density of 0.34 W cm2, and it was stable for 50 h at 650 °C under a dry methane flow [38]. Enhanced durability of 116 h operation at 750 °C and 140 mA cm2 was also reported by researchers who used Mo-Ni-CeO2 as the anode in an SOFC fed by biogas [15]. According to the literature about the catalytic DRM process, the beneficial effect of doping Ni with another metal changes the electronic structure and geometric structure of the active metal (Ni), enhances the dispersion and provides additional active sites, thus changing the activity and stability of the catalyst [14,36,37].
Significant investigation has also been made from our research group in developing alternative electrocatalysts, for solid oxide cell applications, based on Ni/GDC and modified with Au, Mo-Au, Fe and Fe-Au. In this respect, Mo-Au-Ni/GDC powders have been examined as fuel electrodes for the SOFC operation in the presence of H2 and CH4-based fuels, under carbon forming and sulfur poisoning conditions [12,20,41,42,43], and for solid oxide H2O electrolysis [44,45,46] or H2O+CO2 [47] co-electrolysis (SOEC) operations. These studies highlighted the enhanced electrochemical performance, carbon and sulfur tolerance and improved stability of 0.4Mo-3Au-Ni/GDC. The cell with the latter electrode operated for double the period of time (140 h) of a Ni/GDC cell, having a degradation rate of 2.6 mV/h, compared to the Ni/GDC cell which operated for a shorter period and degraded at a rate of 5.5 mV/h under internal steam reforming of CH4 at 800 °C and 57 mA cm2 [12]. In the case of the non-noble modification with iron, the cell with 0.5Fe-Ni/GDC displayed the highest performance in the H2O electrolysis reaction, which was 3-fold higher than that of Ni/GDC and similar to that of 0.4Mo-3Au-Ni/GDC [48]. The promoting effect of 0.5 wt.% Fe in Ni/GDC was stabilized via co-deposition with 3 and 1 wt.% Au. The electrode 0.5Fe-1Au-Ni/GDC exhibited superior performance and stability under reversible SOFC/SOEC operation [49,50].
Recently, Fe-Au modified Ni/GDC electrocatalysts were catalytically and kinetically examined concerning their performance in the DRM, RWGS and CH4 decomposition reactions [51]. It was found that the 3Au-Ni/GDC and 0.5Fe-3Au-Ni/GDC electrocatalysts were less active catalytically compared to Ni/GDC, but at the same time they proved effective to suppress the (undesired for the electrocatalytic process) RWGS reaction and they exhibited high tolerances to carbon formation due to their lower activity in CH4 decomposition. In another recent study [52], it was shown that the cell with 0.5Fe-3Au-Ni/GDC exhibited much better electrochemical performance than the cells with 0.4Mo-3Au-Ni/GDC and Ni/GDC as fuel electrodes.
The study presented herein elucidates further the synergistic interaction between Fe and Au as dopants in Ni/GDC. More specifically, the investigation focused on the effect of wt.% Au concentration in: (i) binary Au-Ni/GDC and (ii) ternary Fe-Au-Ni/GDC fuel electrodes, considering the fact that Fe and Au act synergistically with Ni/GDC for the internal reforming of CH4 with CO2. The objective was to decrease, if possible, the gold content in the ternary electrode and to investigate whether the enhanced electrocatalytic performance of Fe-Au-Ni/GDC for the IDRM reaction is maintained. The Fe content was kept stable at 0.5 wt.%, based on the already observed high activity of 0.5Fe-3Au-Ni/GDC in combination with previous findings in which higher 2 wt.% Fe loading promoted carbon deposition in DRM catalytic measurements [51]. Finally, a long-term investigation took place in which we compared the selected best performing 0.5Fe-1Au-Ni/GDC electrode and Ni/GDC for the SOFC electrocatalytic internal dry reforming of CH4. The latter investigation combined electrocatalytic measurements with electrochemical impedance spectra recording.

2. Results

2.1. Effect of Au Content on the Performance Enhancement by Fe-Au Doping

Recent studies from our group [51,52] reported the improved performance of a cell comprising 0.5Fe-3Au-Ni/GDC, compared to 0.4Mo-3Au-Ni/GDC and Ni/GDC as fuel electrodes, for the SOFC IDRM reaction. The following measurements clarify the synergistic interaction between Fe and Au, focusing on the effect of Au wt.% concentration. Figure 1 and Figure S1 (Supplementary Material) show the characteristic i-V and i-P curves of SOFCs comprising Ni/GDC, 1Au-Ni/GDC, 3Au-Ni/GDC, 0.5Fe-1Au-Ni/GDC and 0.5Fe-3Au-Ni/GDC as fuel electrodes, under the internal DRM reaction with a fuel mixture of 50 vol.% CH4−50 vol.% CO2 (CH4/CO2 = 1) at 900 and 850 °C, respectively.
Specifically, the cells with the binary 1Au-Ni/GDC and 3Au-Ni/GDC performed better than the SoA Ni/GDC. However, when the Au content was increased, the electrochemical performance decreased. In the case of the cells with the ternary Fe-Au-Ni/GDC electrodes, the performance improved, which was a further validation of the reported [52] enhancement of the IDRM reaction. Similar to the performance of the binary Au-Ni/GDC electrodes, the increase of the Au wt.% content from 1 to 3 wt.% inhibited the electrochemical performance.
Figure 1. (A) Polarization (i-V) and (B) power density curves, at 900 °C, for SOFCs comprising (-■-) Ni/GDC, (-⯁-) 1Au-Ni/GDC, (-★-) 3Au-Ni/GDC, (--) 0.5Fe-1Au-Ni/GDC and (-●-) 0.5Fe-3Au-Ni/GDC as fuel electrodes. Mixt.: 50 vol.% CH4−50 vol.% CO2. Ftotal, in = 50 cm3/min.
Catalysts 15 00618 g001
Overall, the ternary electrode with the lowest examined Au content (i.e., 0.5Fe-1Au-Ni/GDC) exhibited the highest electrochemical activity. It achieved higher current density values and the highest power output compared to the other cells\ at 900 and 850 °C. Another interesting result was that the cell with the SoA Ni/GDC exhibited the worst electrochemical performance of the internal DRM process, despite its higher DRM catalytic activity [51]. This will be further discussed in the section with the comparative long-term electrocatalytic measurements.
The above trend in performance was also investigated by means of EIS analysis during the electrochemical measurements. The effect of Au, as well as of the interaction between Fe-Au and Ni/GDC, is presented in the Nyquist (−Zim vs. Zre) and semi-logarithmic (−Zim vs. frequency) plots under low (28 mA cm−2) and high (284 mA cm−2) applied polarization at 900 °C (Figure 2A–D) and 850 °C (Figure 3A–D), respectively. The impedance measurements for each cell were recorded at the same current density in order to have the same contribution from the oxygen electrode [45].
In the Nyquist plots, the ohmic resistance Rohm is determined from the high frequency intersect on the real (Z’) axis, whereas the low frequency intersect corresponds to the total resistance of the cell (Rt). Rt is the sum of Rohm and Rpol, and through this relation the Rpol value is obtained. Figure 2A,B show that the SoA Ni/GDC exhibited the highest Rohm and Rpol values (see also Table 1). In the case of the binary Au-Ni/GDC fuel electrodes, the addition of Au improved the electronic conductivity by sdecreasing the Rohm value, compared to Ni/GDC, as previously reported [43,44,45]. The effect on the polarization resistance varied. The low Au wt.% content had a positive effect and decreased the Rpol, compared to Ni/GDC, but the increase of gold to 3 wt.% had a negative effect and increased the polarization resistance. This is a first indication that higher amounts of Au may inhibit the occurring electrocatalytic processes of the IDRM reaction.
In regards to the ternary Fe-Au-Ni/GDC electrodes, the Nyquist plots highlight the positive interaction between Fe and Au with Ni/GDC toward the preparation of fuel electrodes with significantly lower Rohm and Rpol values compared to the other cells. Once again, the lowest examined Au content resulted in the best (lowest) resistance values, particularly of Rpol, which indicates that the high amount of Au is not beneficial either for the electronic conductivity (mainly for the binary fuel electrodes) or most importantly for the occurring electrochemical processes.
Figure 2. EIS Nyquist (A,B) and Semi-logarithmic plots of the EIS imaginary part (−Zim) versus frequency (C,D) for cells comprising: (-■-) Ni/GDC, (-⯁-) 1Au-Ni/GDC, (-★-) 3Au-Ni/GDC, (--) 0.5Fe-1Au-Ni/GDC and (-●-) 0.5Fe-3Au-Ni/GDC under (A,C) 28 mA cm−2 and (B,D) 284 mA cm−2, at 900 °C. Mixt.: 50 vol.% CH4−50 vol.% CO2. Ftotal, in = 50 cm3/min.
Catalysts 15 00618 g002
In particular, the ohmic resistance is strongly related to the electronic conductivity of the electrodes. Thus, the observed variations in the Rohm values can be attributed to the reported [20,42,44,45,50] structural changes, which are induced by the Au and Fe-Au modification. Further interpretation is related to the improved connectivity of the Ni particles after the H2-reduction step, which forms the main pathway for the transfer of electrons from the bulk phase toward the surface of the electrode that is in contact with the current collector (Ni mesh). In the case of the ternary samples, modification with Fe-Au seems to improve significantly the connectivity of the Ni particles and to enhance the electronic conductivity [44,45,49,50]. On the other hand, the higher Au wt.% content in the binary samples inhibited their conductivity, and this can be ascribed to a worsened connectivity of the nickel particles [49].
The polarization resistance is more related to the processes that take place in the electrochemical interface between the electrode and the electrolyte, including the triple phase boundaries (TPB). In the case of the presented electrolyte-supported cells, the semi-logarithmic (−Zim vs. frequency) plots (Figure 2C,D and Figure 3C,D) can be interpreted in two regions, namely (i) and (ii), which allow the distinction of the electrodes’ capacitance features [15,45,50,53]. In particular, the intermediate frequency region (i), which falls between 104–101 Hz, has been ascribed to the sum of charge transfer effects from the interfacial reactions on both electrodes [4,15,53,54,55,56]. The low frequency region (ii), which falls between 101 and 10−1 Hz, has been correlated to the applied reaction/fuel feed and the capacitance features due to the relaxation of the adsorbed/desorbed species surface coverage [45,57,58] as well as to the fuel diffusion/conversion processes [4,45,59,60,61]. It should be stressed that the compared EIS were recorded at the same applied current density and that the oxygen electrode was the same (GDC/LSCoF) in all cells. In this way, any contribution of the latter electrode does not vary per cell, and the observed variations can be assigned to the different fuel electrodes [45,62].
Concerning the effect of Fe/Au modification, variations were observed on both frequency regions [(i) 104–101 Hz and (ii) 101 and 10−1 Hz]. Specifically, at 900 °C the cells with Ni/GDC and 3Au-Ni/GDC, regardless of the applied polarization, exhibited the highest capacitance features, in accordance with the higher polarization resistance values in the corresponding Nyquist plots (Figure 3A,B). This observation denotes an increased difficulty for the occurring charge transfer processes on Ni/GDC and 3Au-Ni/GDC. On the other hand, the Fe-Au-modified cells and particularly the best performing (0.5Fe-1Au-Ni/GDC) cell exhibited the lowest capacitance features under both applied polarizations and temperatures. More specifically, the charge transfer processes in the intermediate frequencies region (i) were those that were more enhanced, whereas the differences for the low-frequency processes were marginal. Thus, it can be suggested that the positive interaction of Fe with low wt.% Au content enabled the fuel electrode to perform more easily/faster the corresponding charge transfer, interfacial and electrochemical processes for the IDRM reaction, which can be further correlated to the improved electronic conductivity and structural properties that are induced by the Fe-Au modification. This suggestion is corroborated by the variations in performance at operating temperatures below 900 °C, as discussed in the following section.

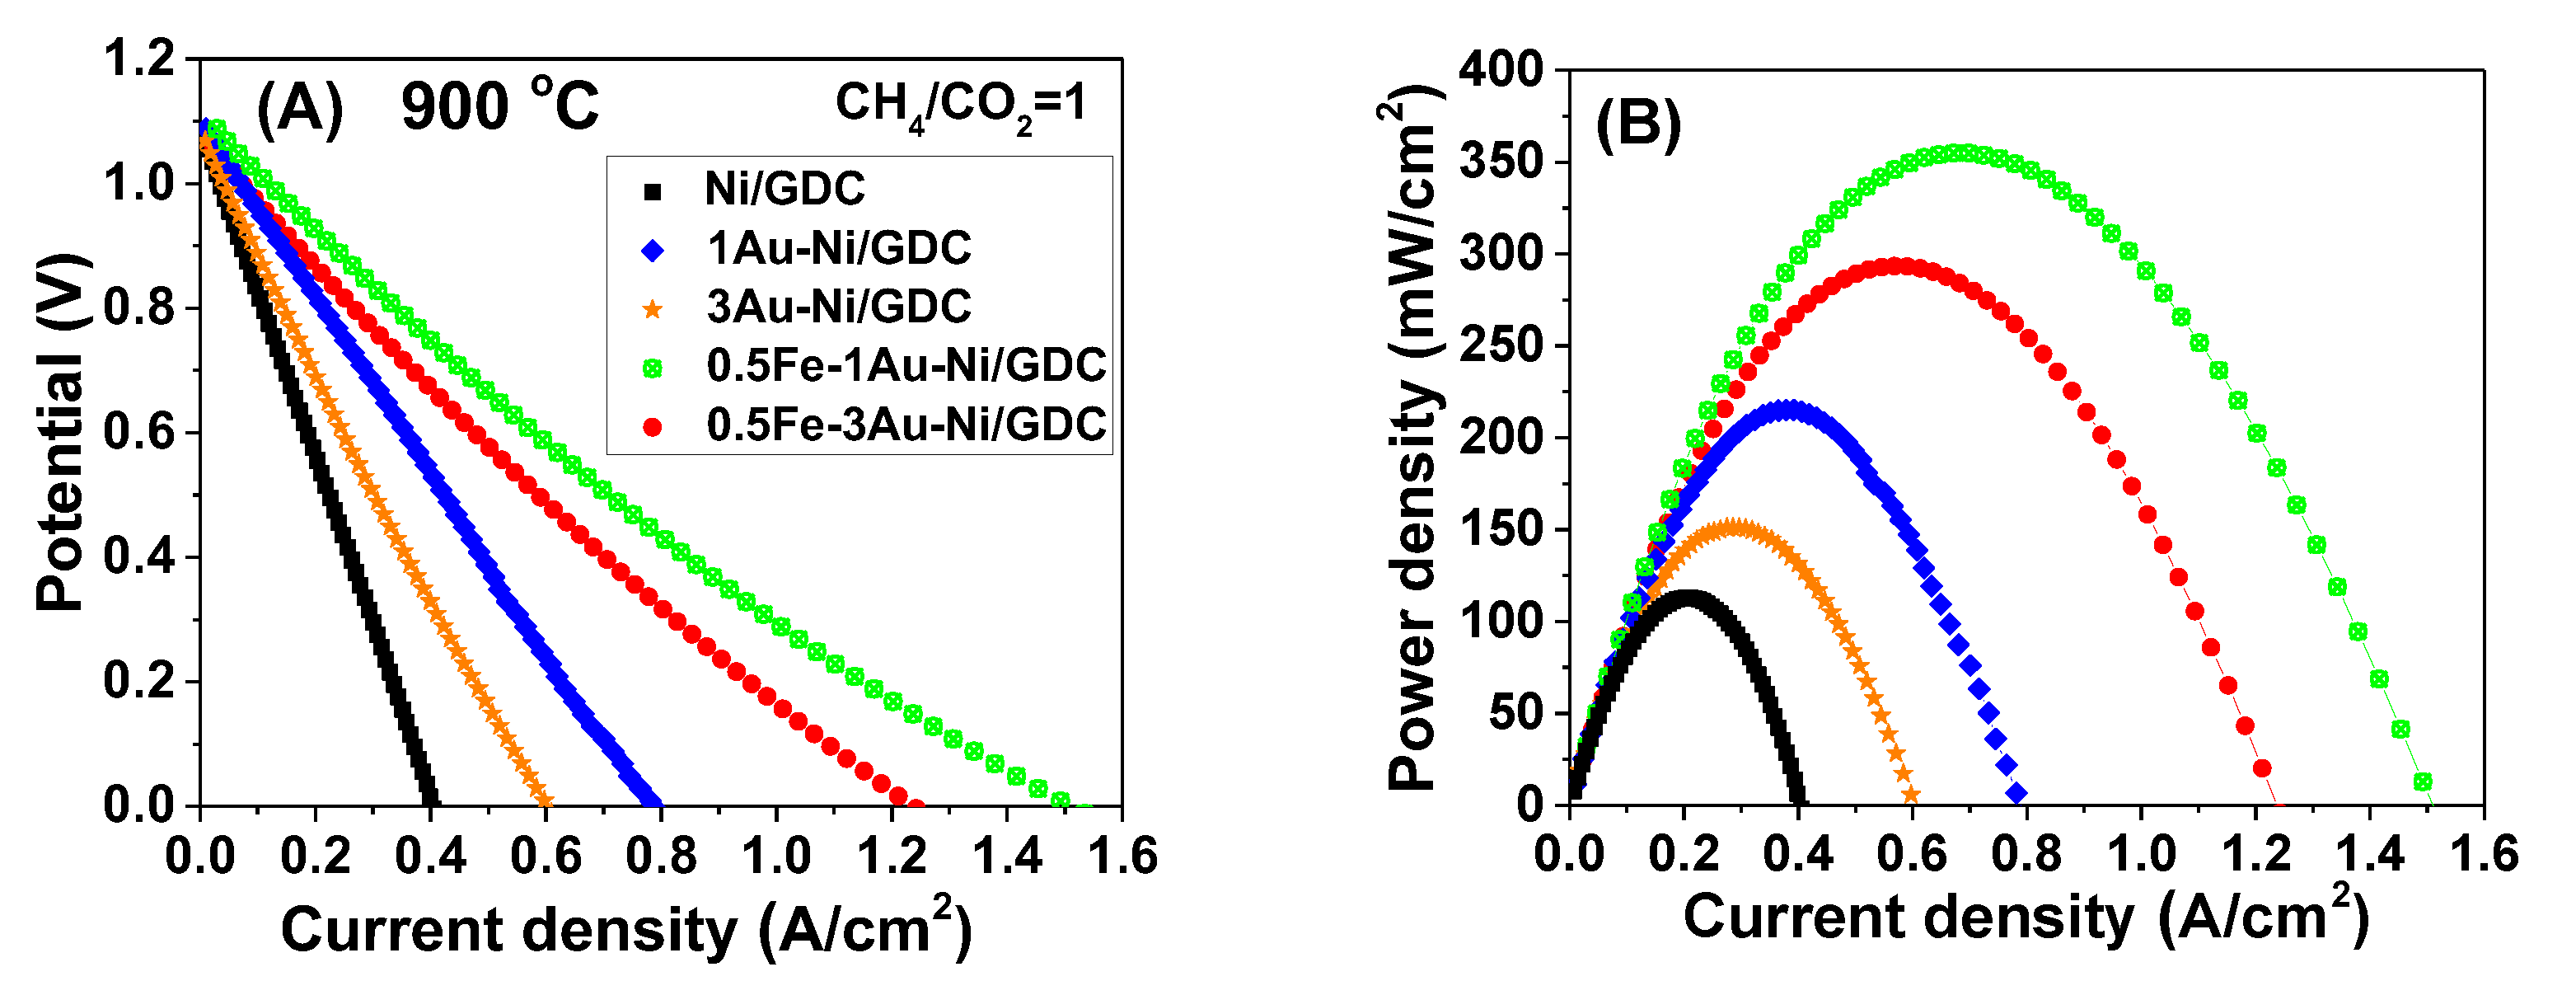
2.1.1. Effect of Fe/Au Modification at Lower Operating Temperature

By decreasing the temperature from 900 to 850 °C (Figure 2A–D and Figure 3A–D, respectively) there is an inhibition of the performance of all cells, which is mainly attributed to the higher ohmic resistance values due to the decreased ionic conductivity of the 8YSZ electrolyte. As observed in the Nyquist plots (see also Table S1> in Supplementary Material), both the Rohm and Rpol values increased, but there are variations per cell and these can be correlated to the different fuel electrodes.
Specifically, the effect of the decreased operating temperature on the Rpol values seems to be less on the ternary Fe-Au electrodes than it is on the binary Au-Ni/GDC and the SoA Ni/GDC. The latter remark is also observed in the semi-logarithmic (−Zim vs. frequency) plots (Figure 3C,D), where for both binary Au-Ni/GDC electrodes there is inhibition of the charge transfer processes in the low frequency region (ii), under both of the applied current densities. Specifically, under the applied low current density condition, which is close to the open circuit potential (O.C.P.), the inhibition is significant, particularly for the binary fuel electrode with the higher 3 wt.% Au content. The above remarks indicate that (i) the Fe-Au modification can enhance the intrinsic electrocatalytic activity of Ni/GDC for the IDRM reaction, since the improved performance is retained at lower operating temperature than 900 °C and (ii) the high wt.% Au concentration has an inhibiting effect, which is pronounced at lower temperatures. Most probably, the increased gold content deactivates the active sites of Ni/GDC, resulting in inhibition of the adsorbed/desorbed species at lower temperatures and thus in lower surface coverage with an overall negative impact on the electrocatalytic activity of the fuel electrode.
Figure 3. (A,B) Nyquist and (C,D) Semi-logarithmic plots of the EIS imaginary part (−Zim) versus frequency for SOFCs with (-■-) Ni/GDC, (-⯁-) 1Au-Ni/GDC, (-★-) 3Au-Ni/GDC, (--) 0.5Fe-1Au-Ni/GDC and (-●-) 0.5Fe-3Au-Ni/GDC under (A,C) 28 mA cm−2 and (B,D) 284 mA cm−2, at 850 °C. Mixt.: 50 vol.% CH4−50 vol.% CO2. Ftotal, in = 50 cm3/min.
Catalysts 15 00618 g003

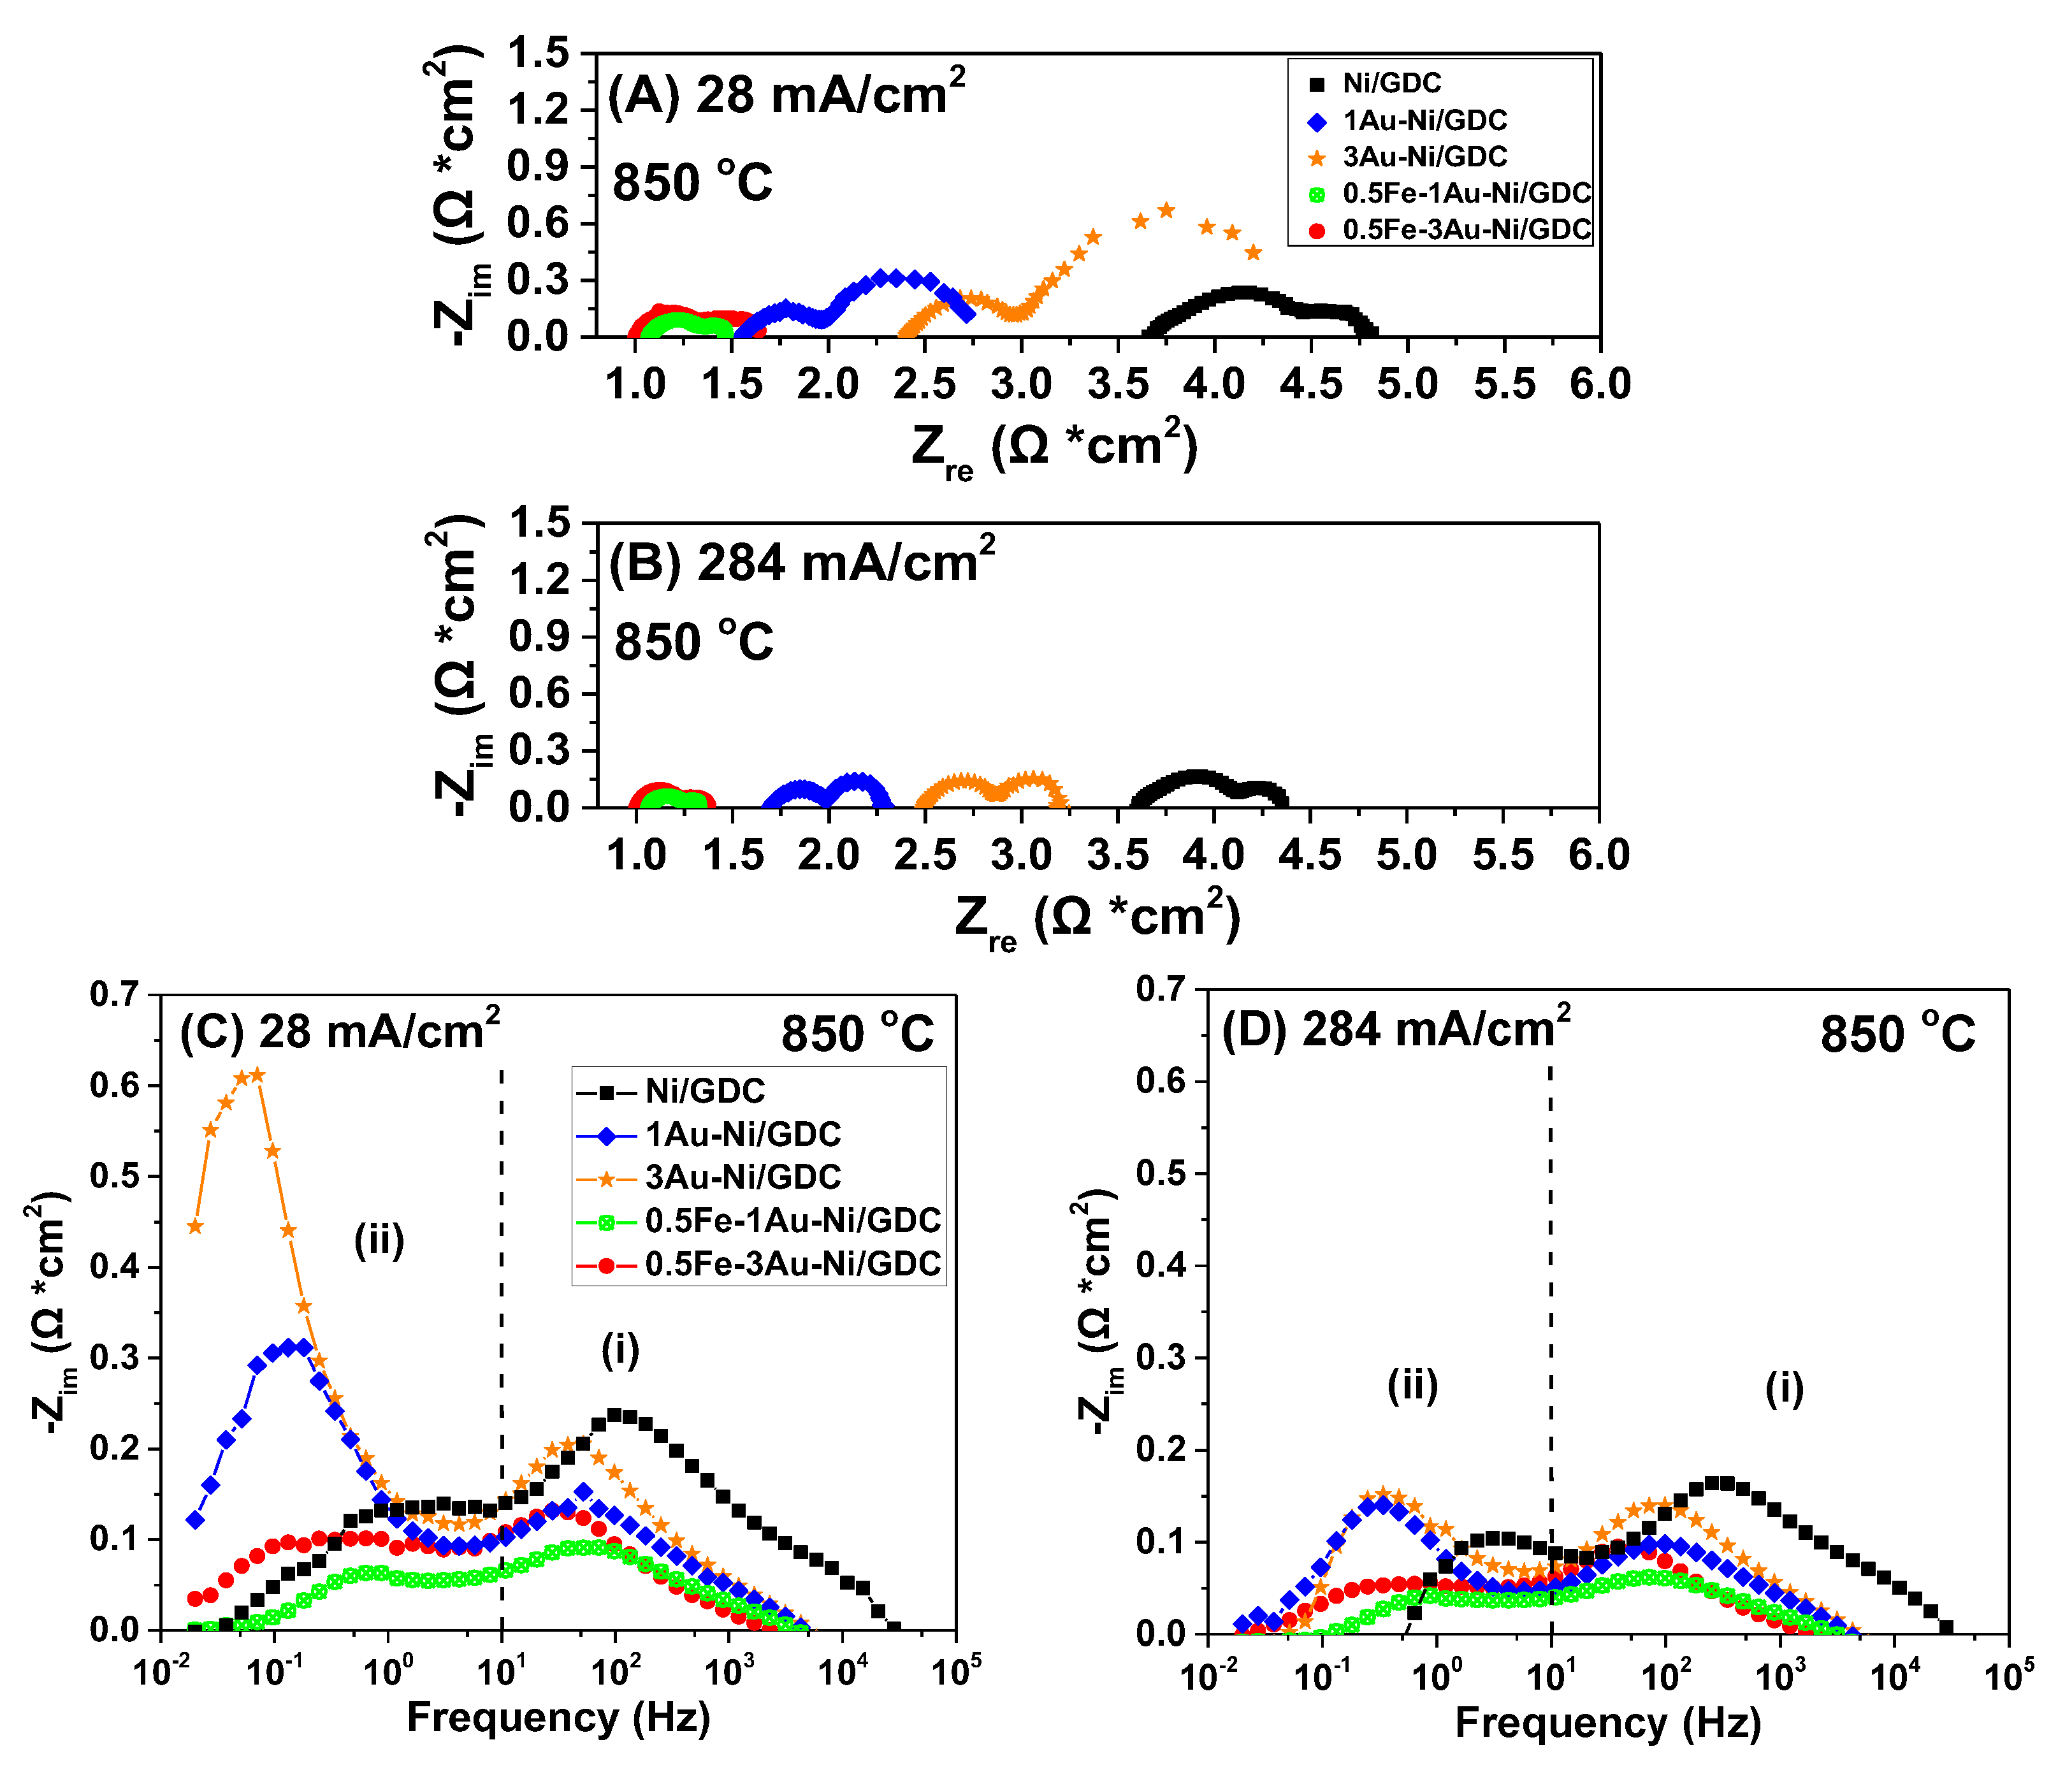
2.1.2. Effect of Fe/Au Modification at Different Applied Polarization

Figures S2 and S3 (Supplementary Material) depict the Nyquist (−Zim vs. Zre) and semi-logarithmic (−Zim vs. frequency) plots, respectively, at 900 °C, which were recorded in a wider range of applied current density values. The applied polarization on the modified cells was higher, compared to Ni/GDC, because the former cells exhibited better electrochemical performance for the SOFC IDRM reaction and their operating profile was wider. As expected, in the Nyquist plots and for all cells, the Rpol values decreased by increasing the applied polarization. In regards to the semi-logarithmic (−Zim vs. frequency) plots (Figure S3) the trend among the examined cells was similar to that discussed in Figure 2.
The most noteworthy differences were observed in the Nyquist plots and focus on the ohmic characteristics (Rohm). Specifically, the increased polarization resulted in the drastic deterioration (increase) of the ohmic resistance for the cell with Ni/GDC. This can be ascribed to the possible gradual re-oxidation and/or agglomeration of Ni, due to the high partial pressures of steam and CO2 in the IDRM reaction mixture [12]. Steam and CO2 are produced electrochemically during the SOFC operation (Equations (4) and (5)), whereas some of the reactant CO2 is not converted and remains in the feed. It should be also mentioned that Ni/GDC was the most active for H2O and CO2 production, as this will be further discussed in the electrocatalytic measurements section (Figure 4).
On the other hand, in the case of the modified electrodes the ohmic resistance values were less affected by the applied polarization. For the binary Au-Ni/GDC cells, there was a slight increase of Rohm, but this was quite a bit lower than the Ni/GDC. The key difference concerns the ternary Fe-Au-Ni/GDC electrodes, where in both of the examined cells the increased polarization had an enhancing effect and the Rohm values decreased, suggesting an improvement of the electronic conductivity and most importantly a higher tolerance to re-oxidation and/or agglomeration of Ni in the presence of H2O and CO2.
The suggested enhancement of the electrocatalytic activity of Ni/GDC for the SOFC IDRM reaction through Fe-Au modification is in accordance with recent results that showed the enhancement of the intrinsic electrochemical activity for the solid oxide H2O electrolysis reaction [50], where the apparent reaction order for the examined Fe-Au modified fuel electrode was higher than that of the SoA Ni/GDC. Moreover, SEM analysis on the surface morphology of the Fe-Au modified electrode showed that doping Ni/GDC with 0.5 wt.% Fe and 1 wt.% Au resulted in higher macro-porosity and tortuosity than that of the Ni/GDC electrode [50]. This was verified by examining SEM images for the present study, as discussed in Section 2.3 of the long-term measurements. Therefore, the improved performance of 0.5Fe-1Au-Ni/GDC for the SOFC IDRM reaction may also be correlated to the reported structural changes. These may facilitate the gas flow mixture (CH4 and CO2) distribution and diffusion within the electrode pores toward a more efficient electrochemical utilization of the fuel reactants (i.e., H2, CH4, CO) at the electrochemical interface and the TPB area. Certainly, the SOFC IDRM reaction is different to the solid oxide steam electrolysis. Nevertheless, there might be common electrochemical steps in the interface of the fuel electrode, the charge transfer processes of which are enhanced by the Fe-Au modification. The above remarks could be the topic for a specific investigation of the IDRM reaction and some aspects are discussed in the following sections of this study, which deal with electrocatalytic and long-term measurements.

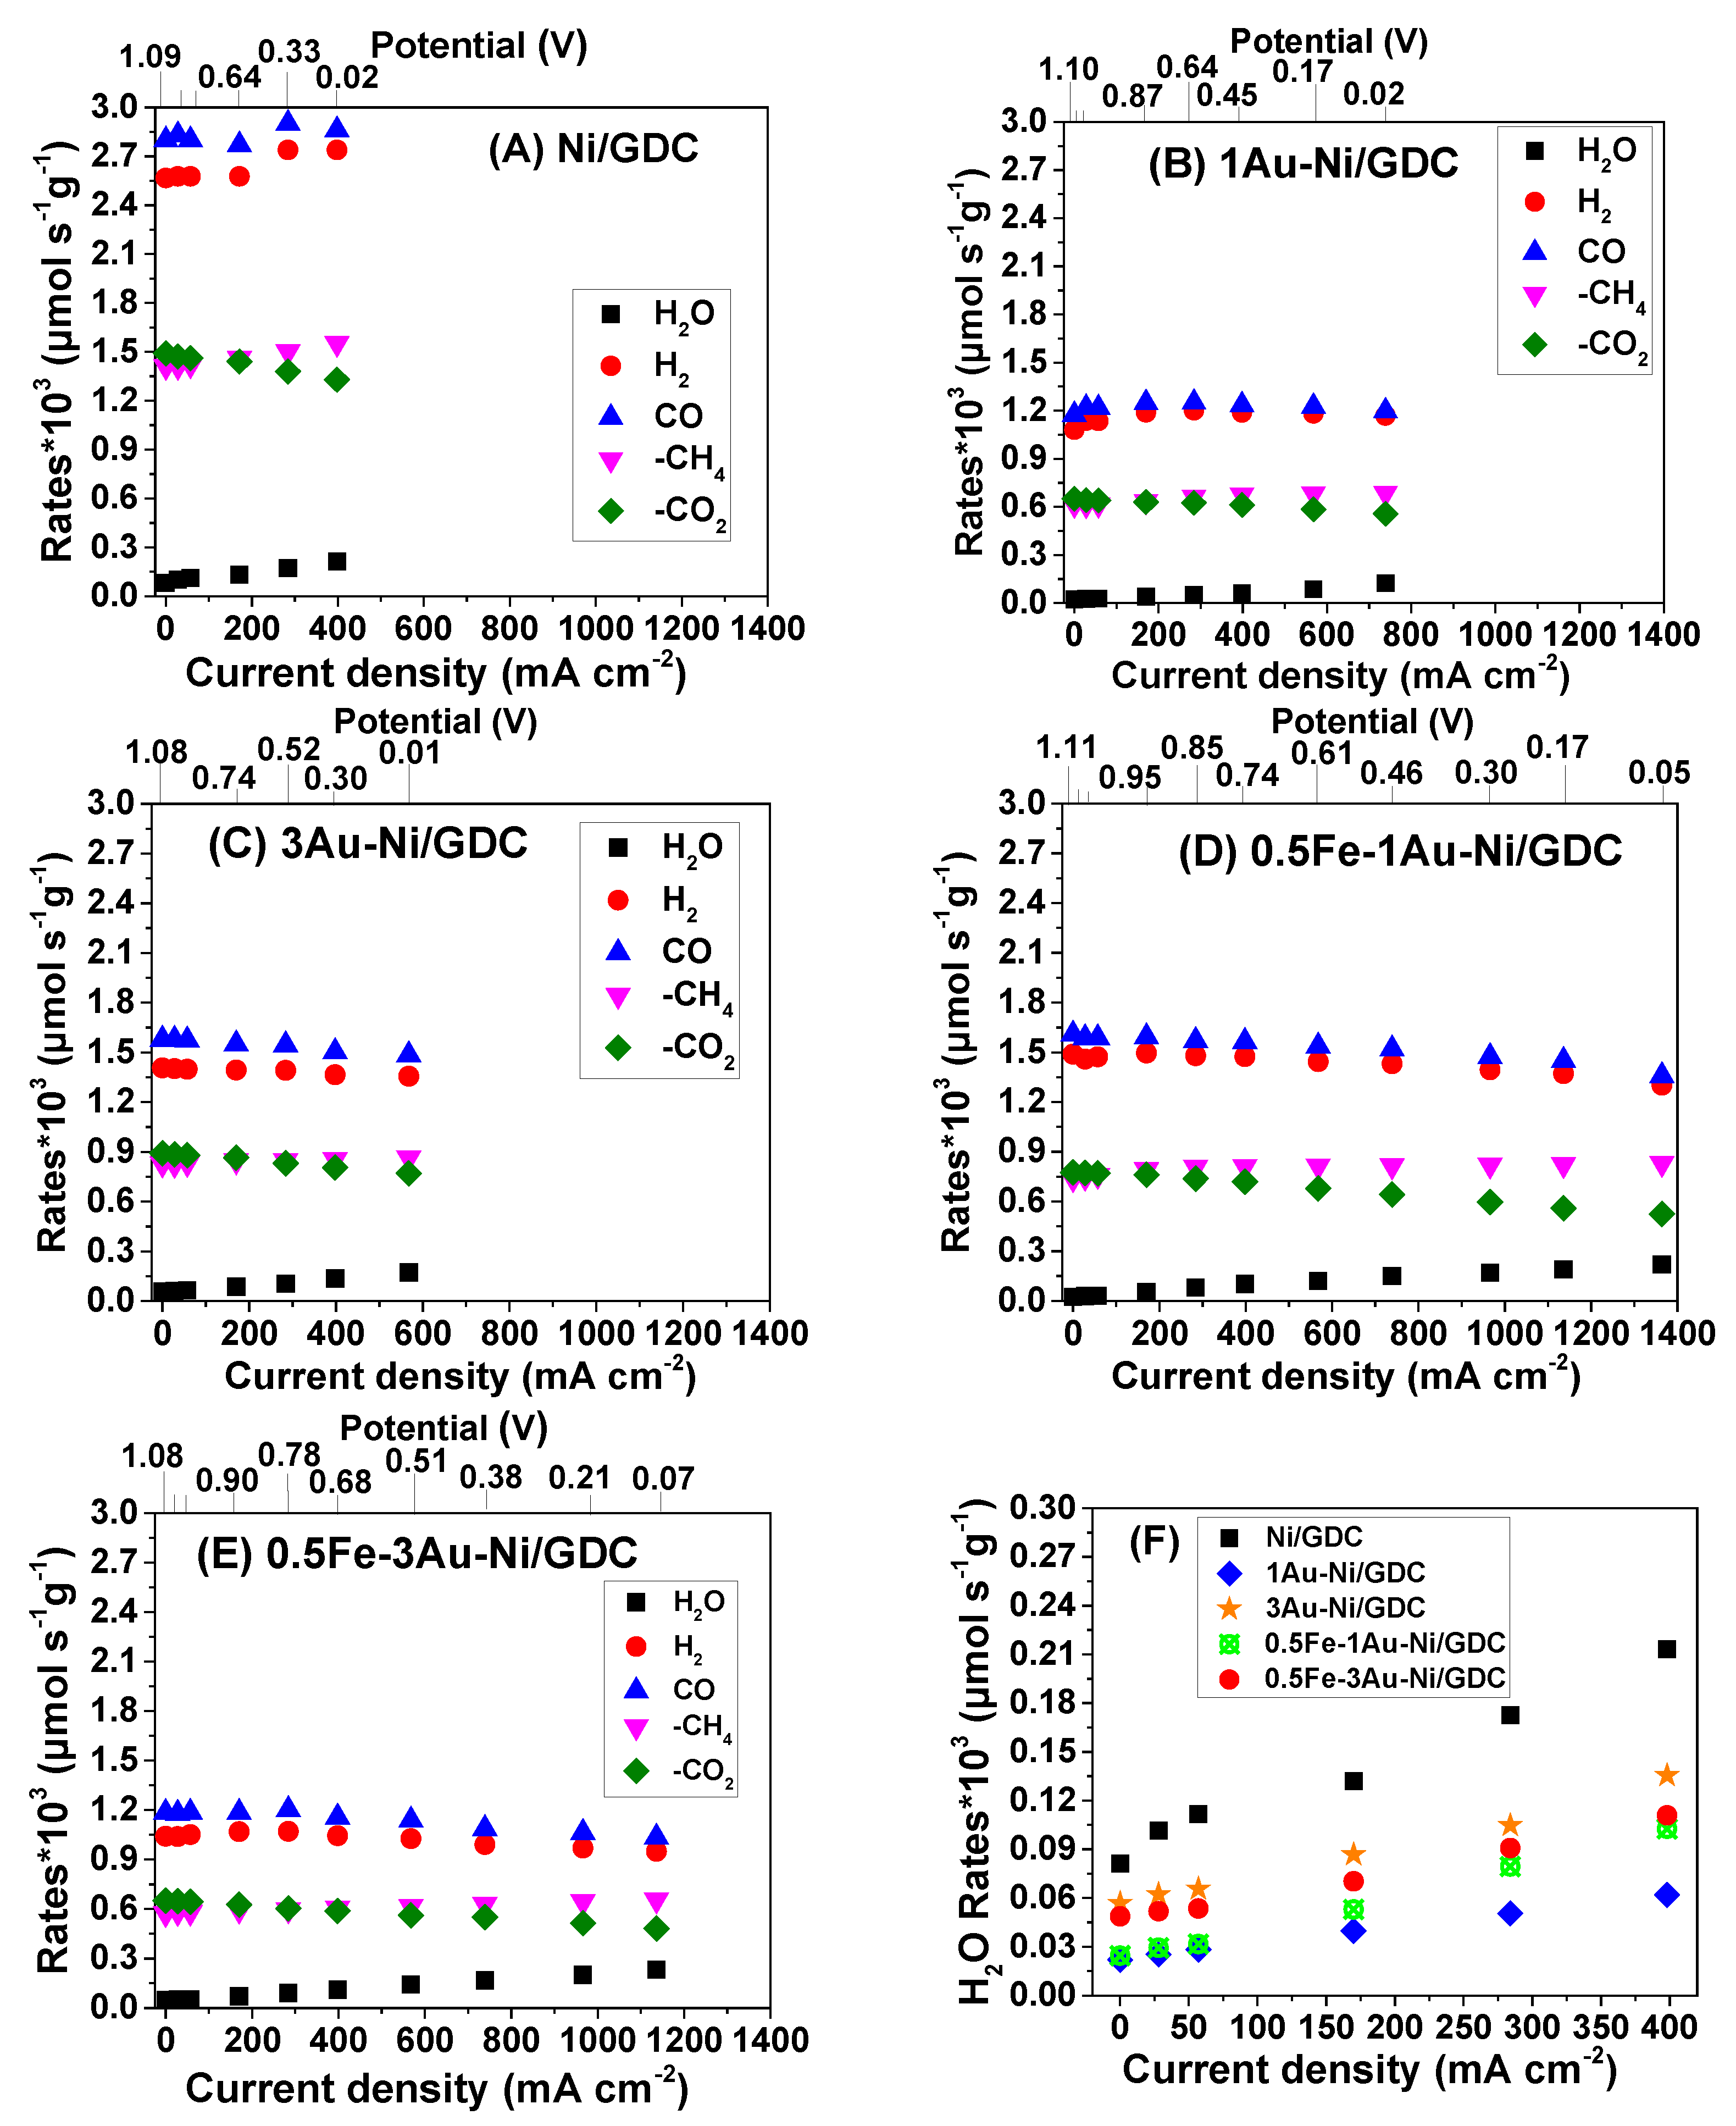
2.2. Effect of Fe/Au Modification on the SOFC IDRM Electrocatalytic Activity—Quantitative Analysis

During the electrochemical measurements, gas chromatography (GC) analysis took place in order to evaluate the IDRM electrocatalytic activity of the cells through the evolution of the reactants/products and to detect any variations, compared to the O.C.P. conditions. Figure 4A–E presents the electrocatalytic activity of the fuel electrodes under polarization at 900 °C for the SOFC IDRM (CH4/CO2 = 50/50, Ftot,in = 50 cm3/min), showing the consumption rates of CH4 and CO2 as well as the production rates of H2, CO and H2O. For better interpretation of the results, Figure 4F focuses on the production rates of H2O. Figure S4 (Supplementary Material) depicts the H2 and CO production rates as a function of the polarization at 900 °C. All rates were calculated through Equation (9).
r i m o l s = F t o t . c m 3 m i n C i , i n C i , o u t V m 60 s m i n  
where r i , o c p is the consumption/production rate for H2O, H2, CO, CH4 and CO2, F t o t . is the total volumetric flow, V m is the molecular volume of ideal gases at 25 °C and 1 atm (24,451 c m 3 m o l ), and C i , i n   and C i , o u t   c m 3 m i n   are the inlet/outlet concentrations of each compound, respectively.
Figure 4. Production (■H2O, H2, CO) and consumption (−CH4, −CO2) rates (μmol s−1 g−1) for SOFCs with (A) Ni/GDC (“Reproduced by Ioannidou E. (et al), ECS Trans, 111, (2023), https://doi.org/10.1149/11106.2473ecst, © The Electrochemical Society. Reproduced by permission of IOP Publishing Ltd. All rights reserved” [52]), (B) 1Au-Ni/GDC, (C) 3Au-Ni/GDC, (D) 0.5Fe-1Au-Ni/GDC and (E) 0.5Fe-3Au-Ni/GDC (“Reproduced by Ioannidou E. (et al), ECS Trans, 111, (2023), https://doi.org/10.1149/11106.2473ecst, © The Electrochemical Society. Reproduced by permission of IOP Publishing Ltd. All rights reserved” [52]), as fuel electrodes versus applied current density (mA cm−2), at 900 °C. The corresponding potential values, at each current, are also presented. (F) H2O production rates as a function of the applied current density, at 900 °C, per fuel electrode: (■) Ni/GDC, () 1Au-Ni/GDC, () 3Au-Ni/GDC, () 0.5Fe-1Au-Ni/GDC and () 0.5Fe-3Au-Ni/GDC. Mixt.: 50 vol.% CH4−50 vol.% CO2. Ftotal, in = 50 cm3/min.
Catalysts 15 00618 g004
Regarding the effect of Fe-Au modification on the electrocatalytic activity of Ni/GDC, the first remark concerns the general trend of H2 and CO production rates upon polarization. It should be noted that each cell exhibited different values of current densities (upon similar potential values) due to their different electrochemical performance in the IDRM reaction (Figure 4A–E). In this respect, the enhanced activity of the cells with the ternary electrodes (and more specifically of the 0.5Fe-1Au-Ni/GDC) enabled significantly higher current densities and thus a broader region for quantitative analysis.
Specifically, in the case of the cell with Ni/GDC and by increasing the applied polarization, there was increase on the rH2 and rCO values, up to the relatively low current density of 400 mA cm−2, whereas it exhibited the highest CH4 and CO2 consumption rates. For the ternary 0.5Fe-1Au-Ni/GDC and 0.5Fe-3Au-Ni/GDC fuel electrodes, the production/consumption rates were rather stable up to 400 mA cm−2, while at higher current densities there was a progressive decrease of the rH2 and rCO values and an increased rH2O. In the case of the binary 1Au-Ni/GDC and 3Au-Ni/GDC fuel electrodes, the corresponding rates were stable up to 600 mA cm−2.
The binary and ternary fuel electrodes were less active in terms of consumption/production rates compared to Ni/GDC, but among them the 0.5Fe-1Au-Ni/GDC exhibited the highest H2 and CO production rates (Figure S4). Interestingly, that specific cell achieved significantly higher current densities than Ni/GDC under the same potential values, but the latter exhibited the highest consumption/production rates. This is related to the higher O.C.P. activity of Ni/GDC for the catalytic DRM reaction, as also recently reported in a kinetic investigation [51] by our group. This study focused on the elucidation of the kinetic pre-conditions which a proper IDRM fuel electrocatalyst should follow. It was suggested that such an electrode should preferably exhibit (a) low Ea,app for H2 and CO production, (b) low carbon formation and (c) high Ea,app for H2O production, which results mainly from the RWGS and is considered undesirable side reaction of the SOFC IDRM process, since it consumes catalytically the necessary H2 fuel of the SOFC. It was concluded [51] that these kinetic pre-conditions were met by 3Au-Ni/GDC and the ternary 0.5Fe-3Au-Ni/GDC electrocatalysts. Furthermore, in agreement with the results of the kinetic study, wherein Ni/GDC was the most selective for the non-desired catalytic RWGS reaction [51], the quantitative analysis of the electrocatalytic measurements herein showed that the production of H2O (Figure 4F) was significantly less favored in 0.5Fe-1Au-Ni/GDC than in Ni/GDC at similar current densities (i.e., up to 400 mA cm−2). The increased production of steam at higher current densities (>400 mA cm−2) for the ternary fuel electrode (Figure 4D), is mainly ascribed to the electrochemical oxidation reaction of H2 (Equation (4)).
Finally, carbon formation was not detected during the above electrocatalytic measurements. This is probably due to carbon oxidation and removal either from the O2− (Equation (8)), which is transferred through the electrolyte to the fuel side [6,9,15,28], and/or from the produced H2O (Equation (7)) [9,10,26]. However, in the first case the removal of carbon deposits is mainly located at the triple-phase boundary zone [6,9,15,28] and thus degradation due to cumulative carbon deposition may occur, especially during prolonged operation.
Despite the lower rH2 and rCO of both of the Fe-Au modified cells, these products` rates seem to provide the required amount of fuel (mainly H2 and CO) for the SOFC operation toward the production of high current densities, as similarly reported for the internal CH4 steam reforming reaction [12]. This condition in combination with the improved ohmic and most importantly polarization resistance characteristics of the Fe-Au-Ni/GDC fuel electrodes results in the enhanced electrochemical operation seen during the SOFC IDRM reaction. Overall, the results from the electrochemical characterization in combination with the electrocatalytic measurements lead to the conclusion that the 0.5Fe-1Au-Ni/GDC fuel electrode exhibited the best properties for the internal DRM process. The latter electrode was selected to be further examined through SOFC stability measurements in comparison to a cell with the SoA Ni/GDC. The results are discussed in the following section.

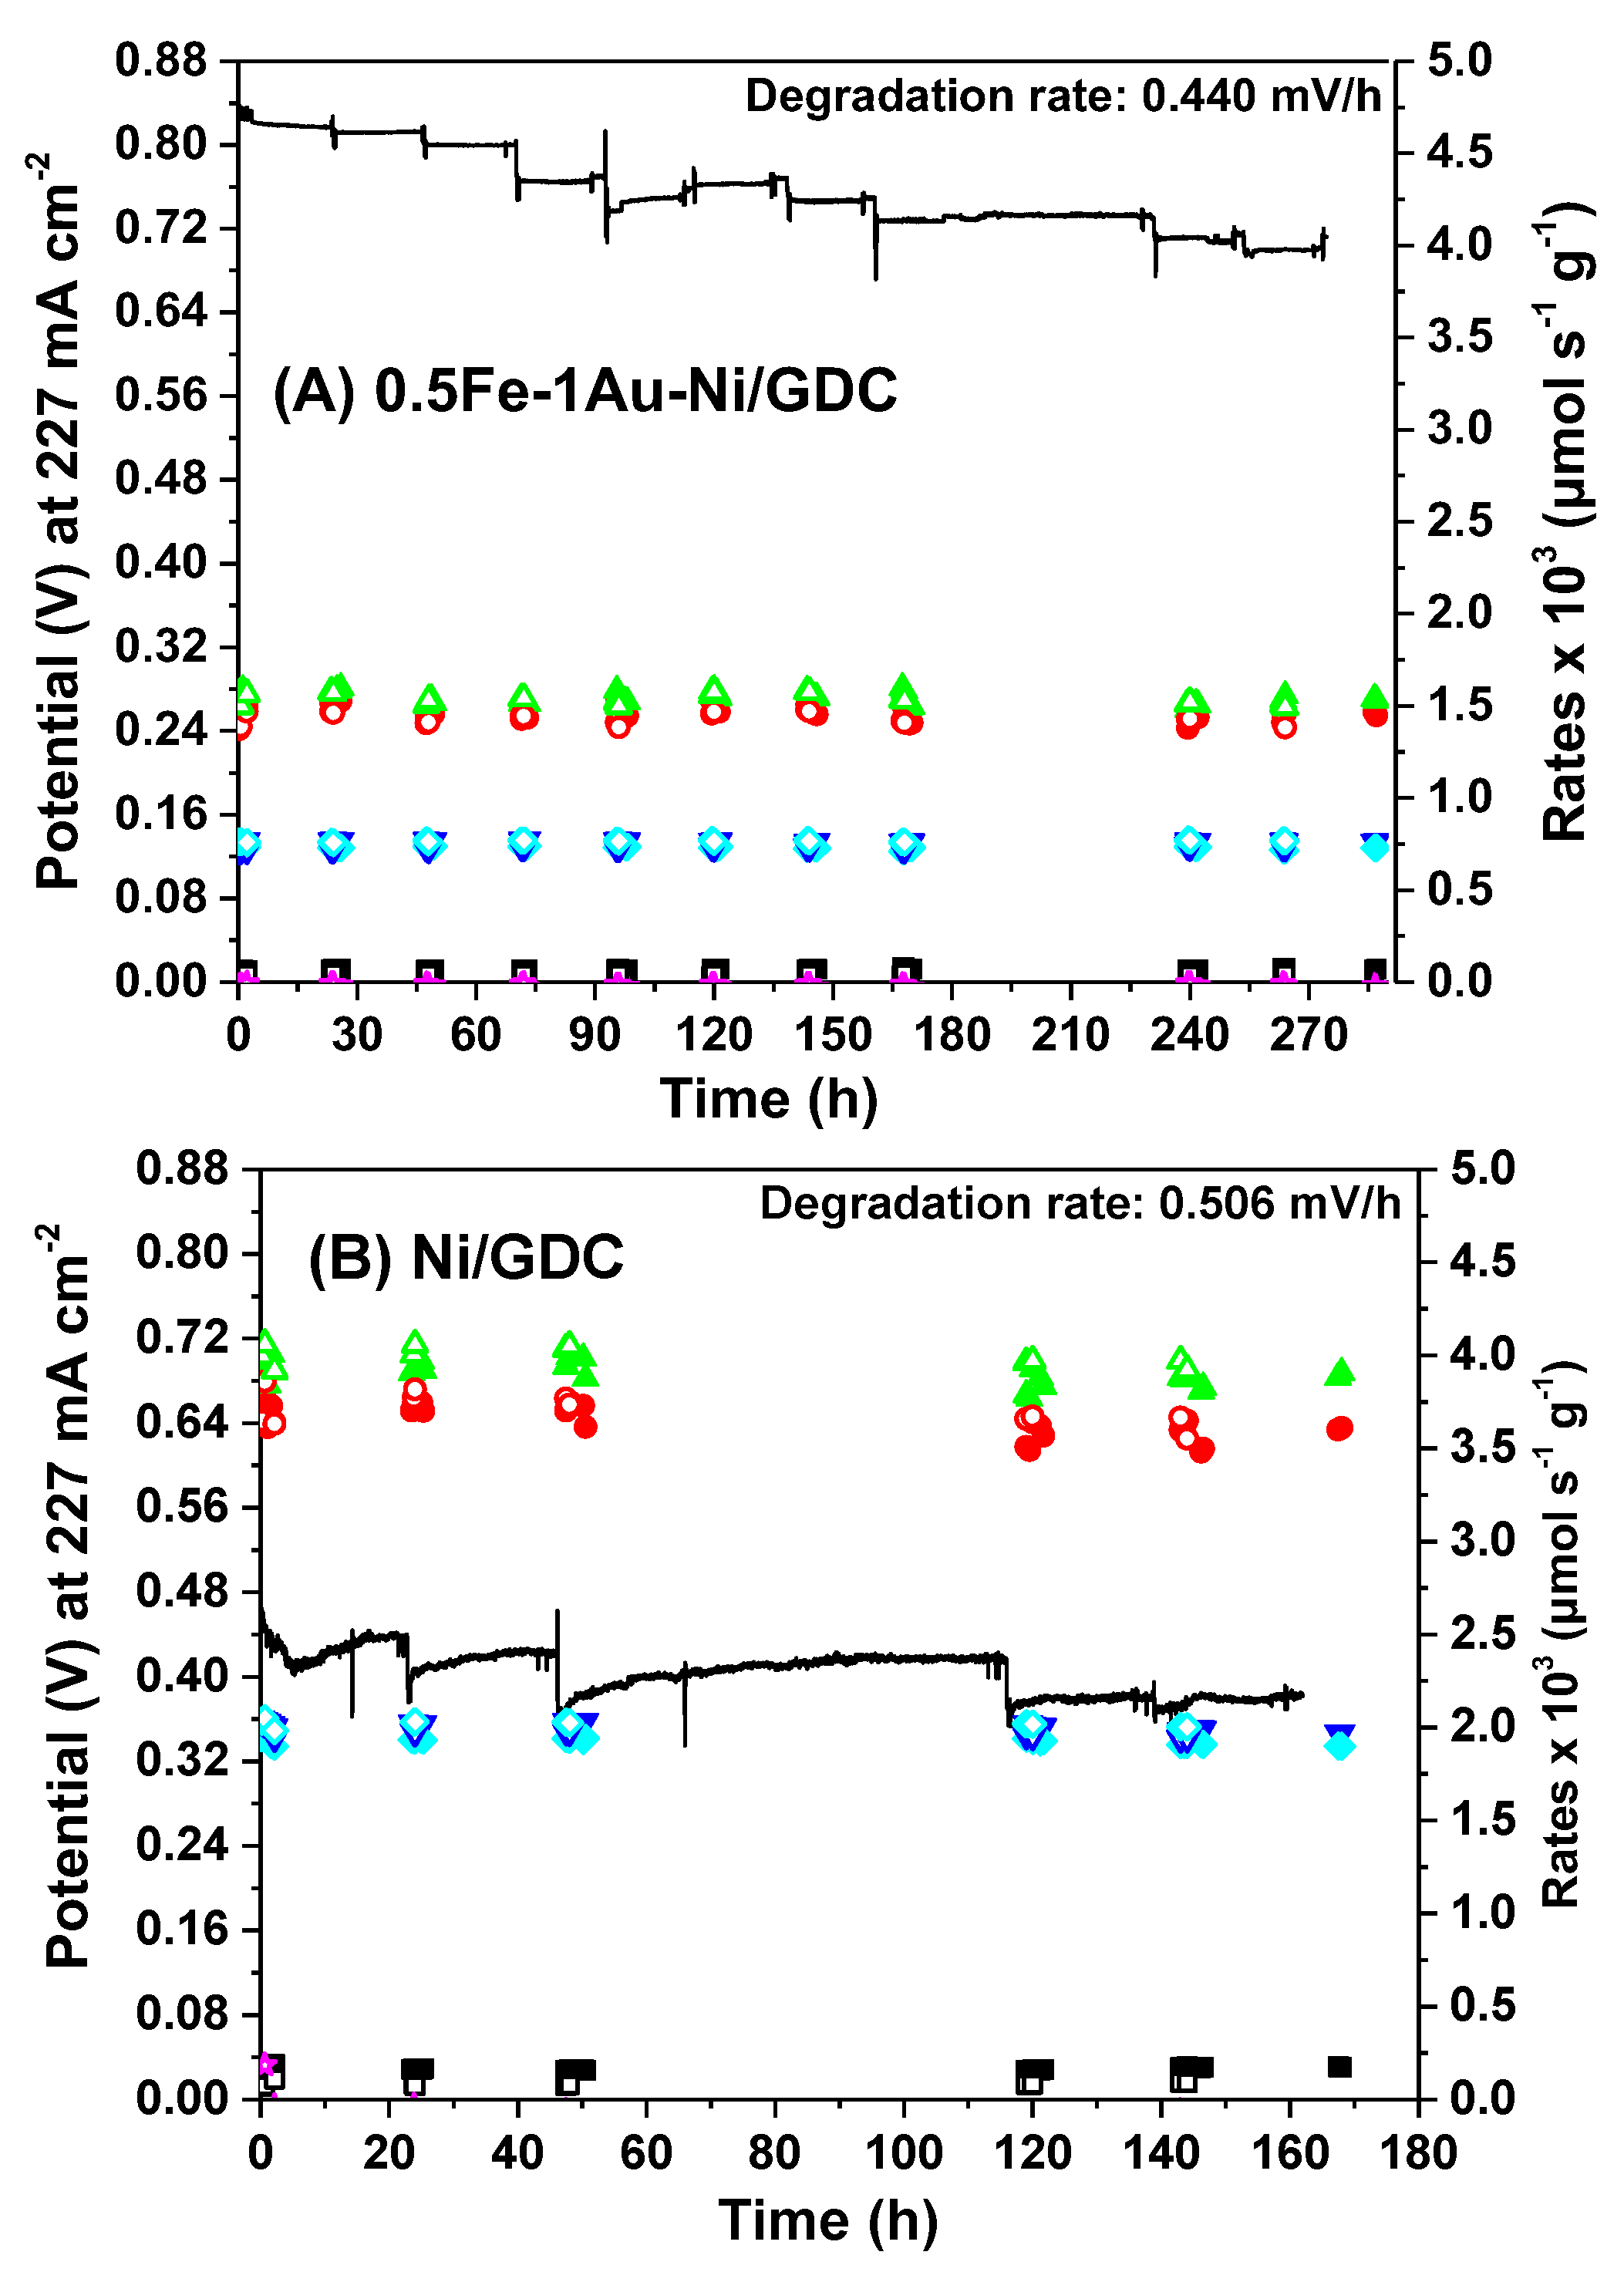
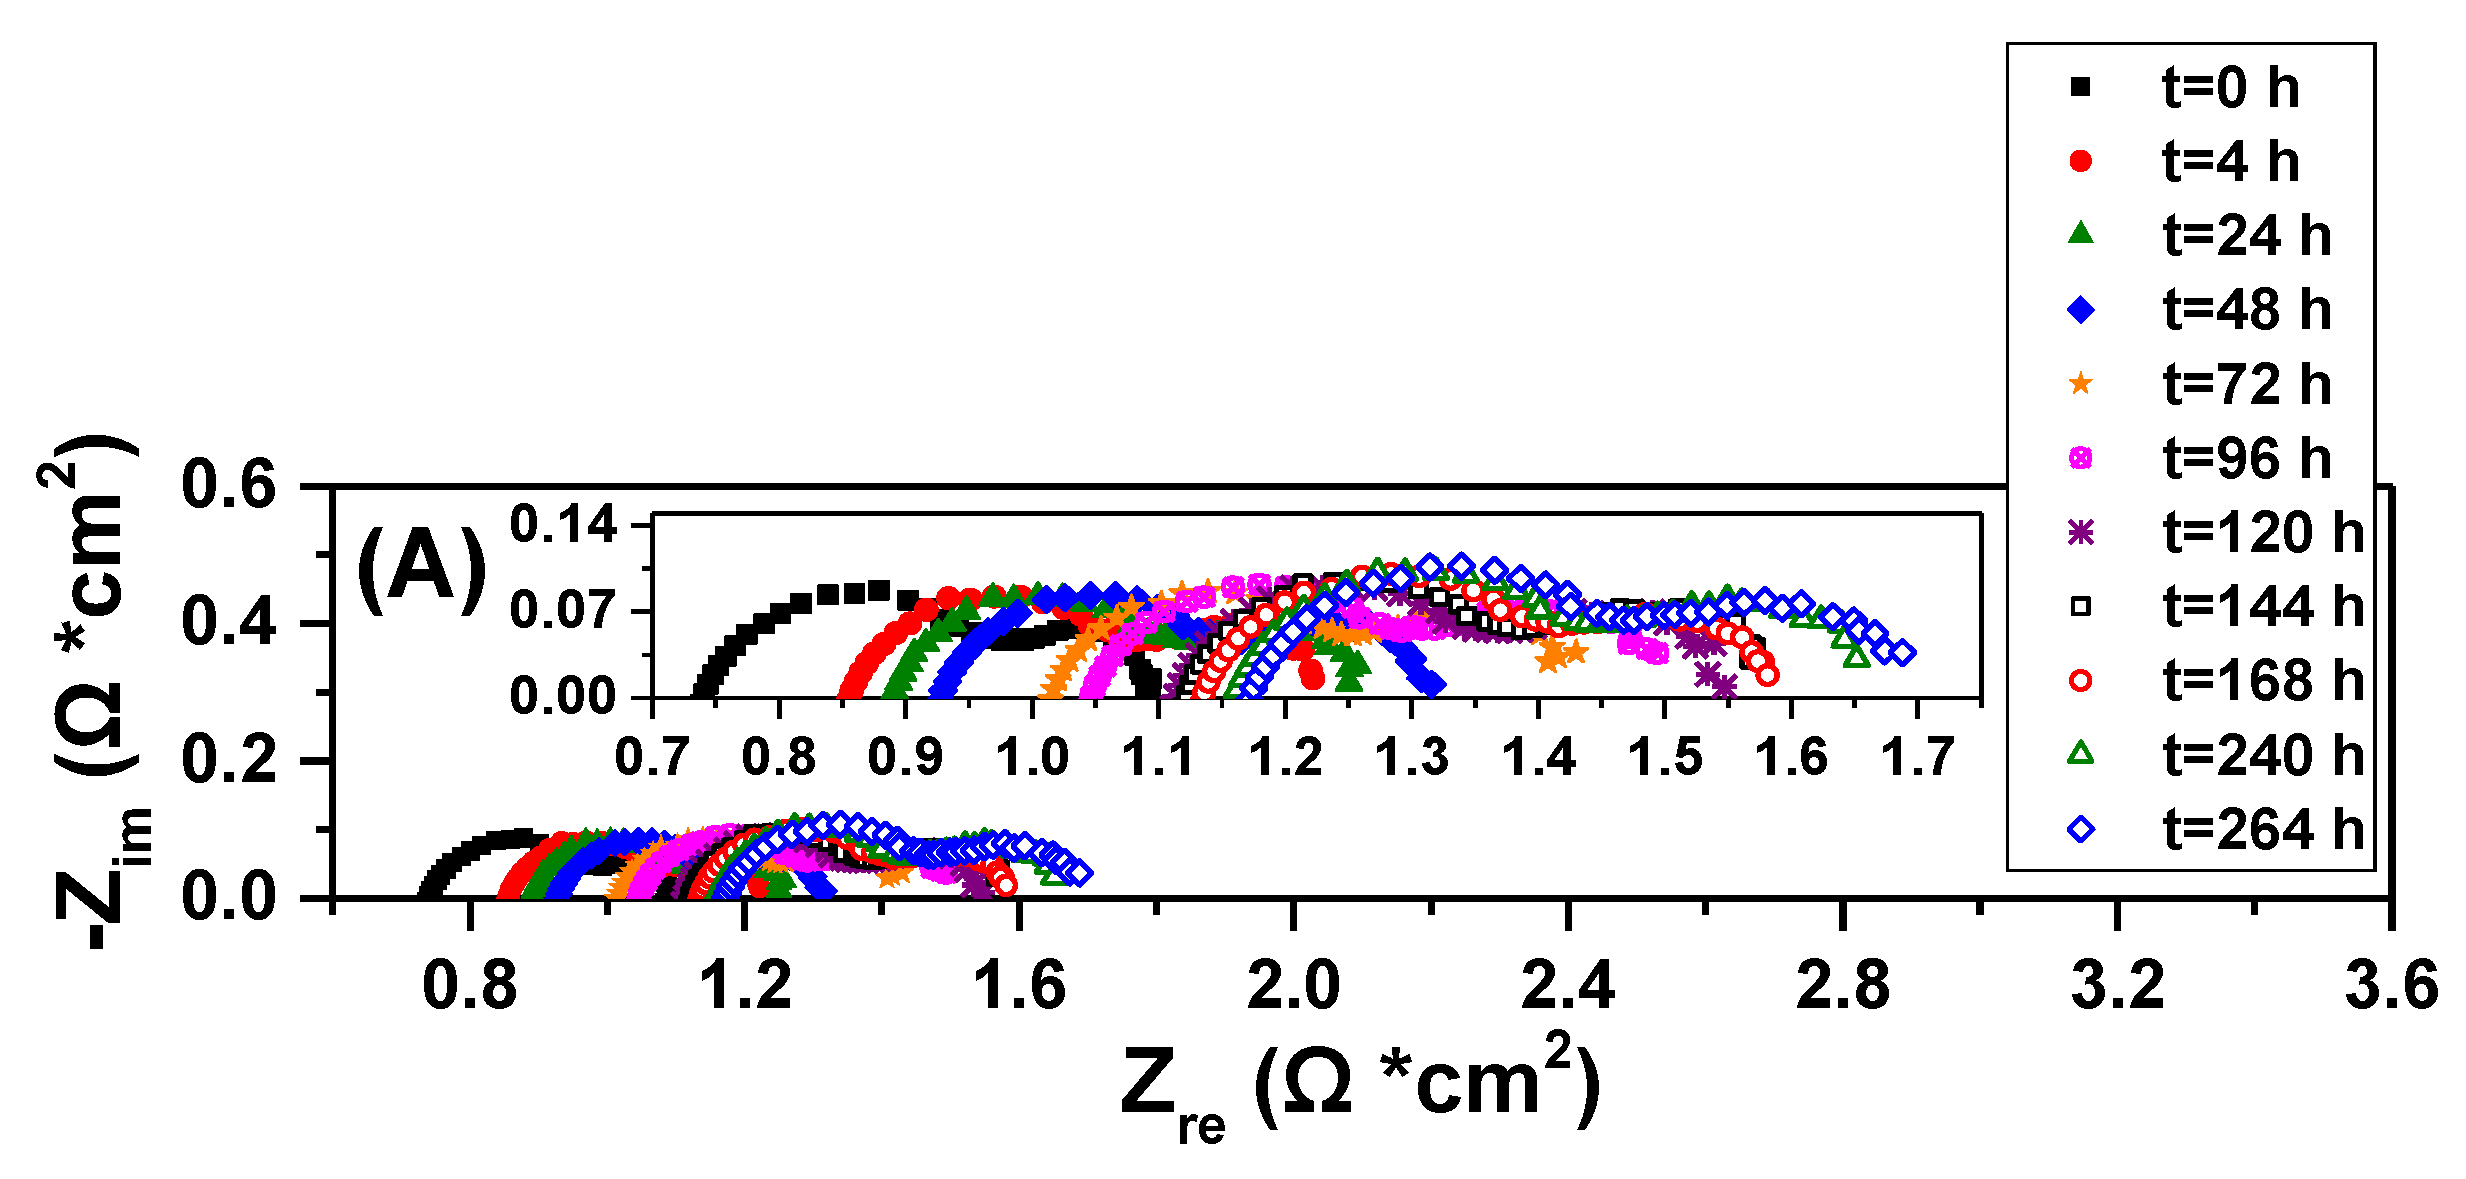
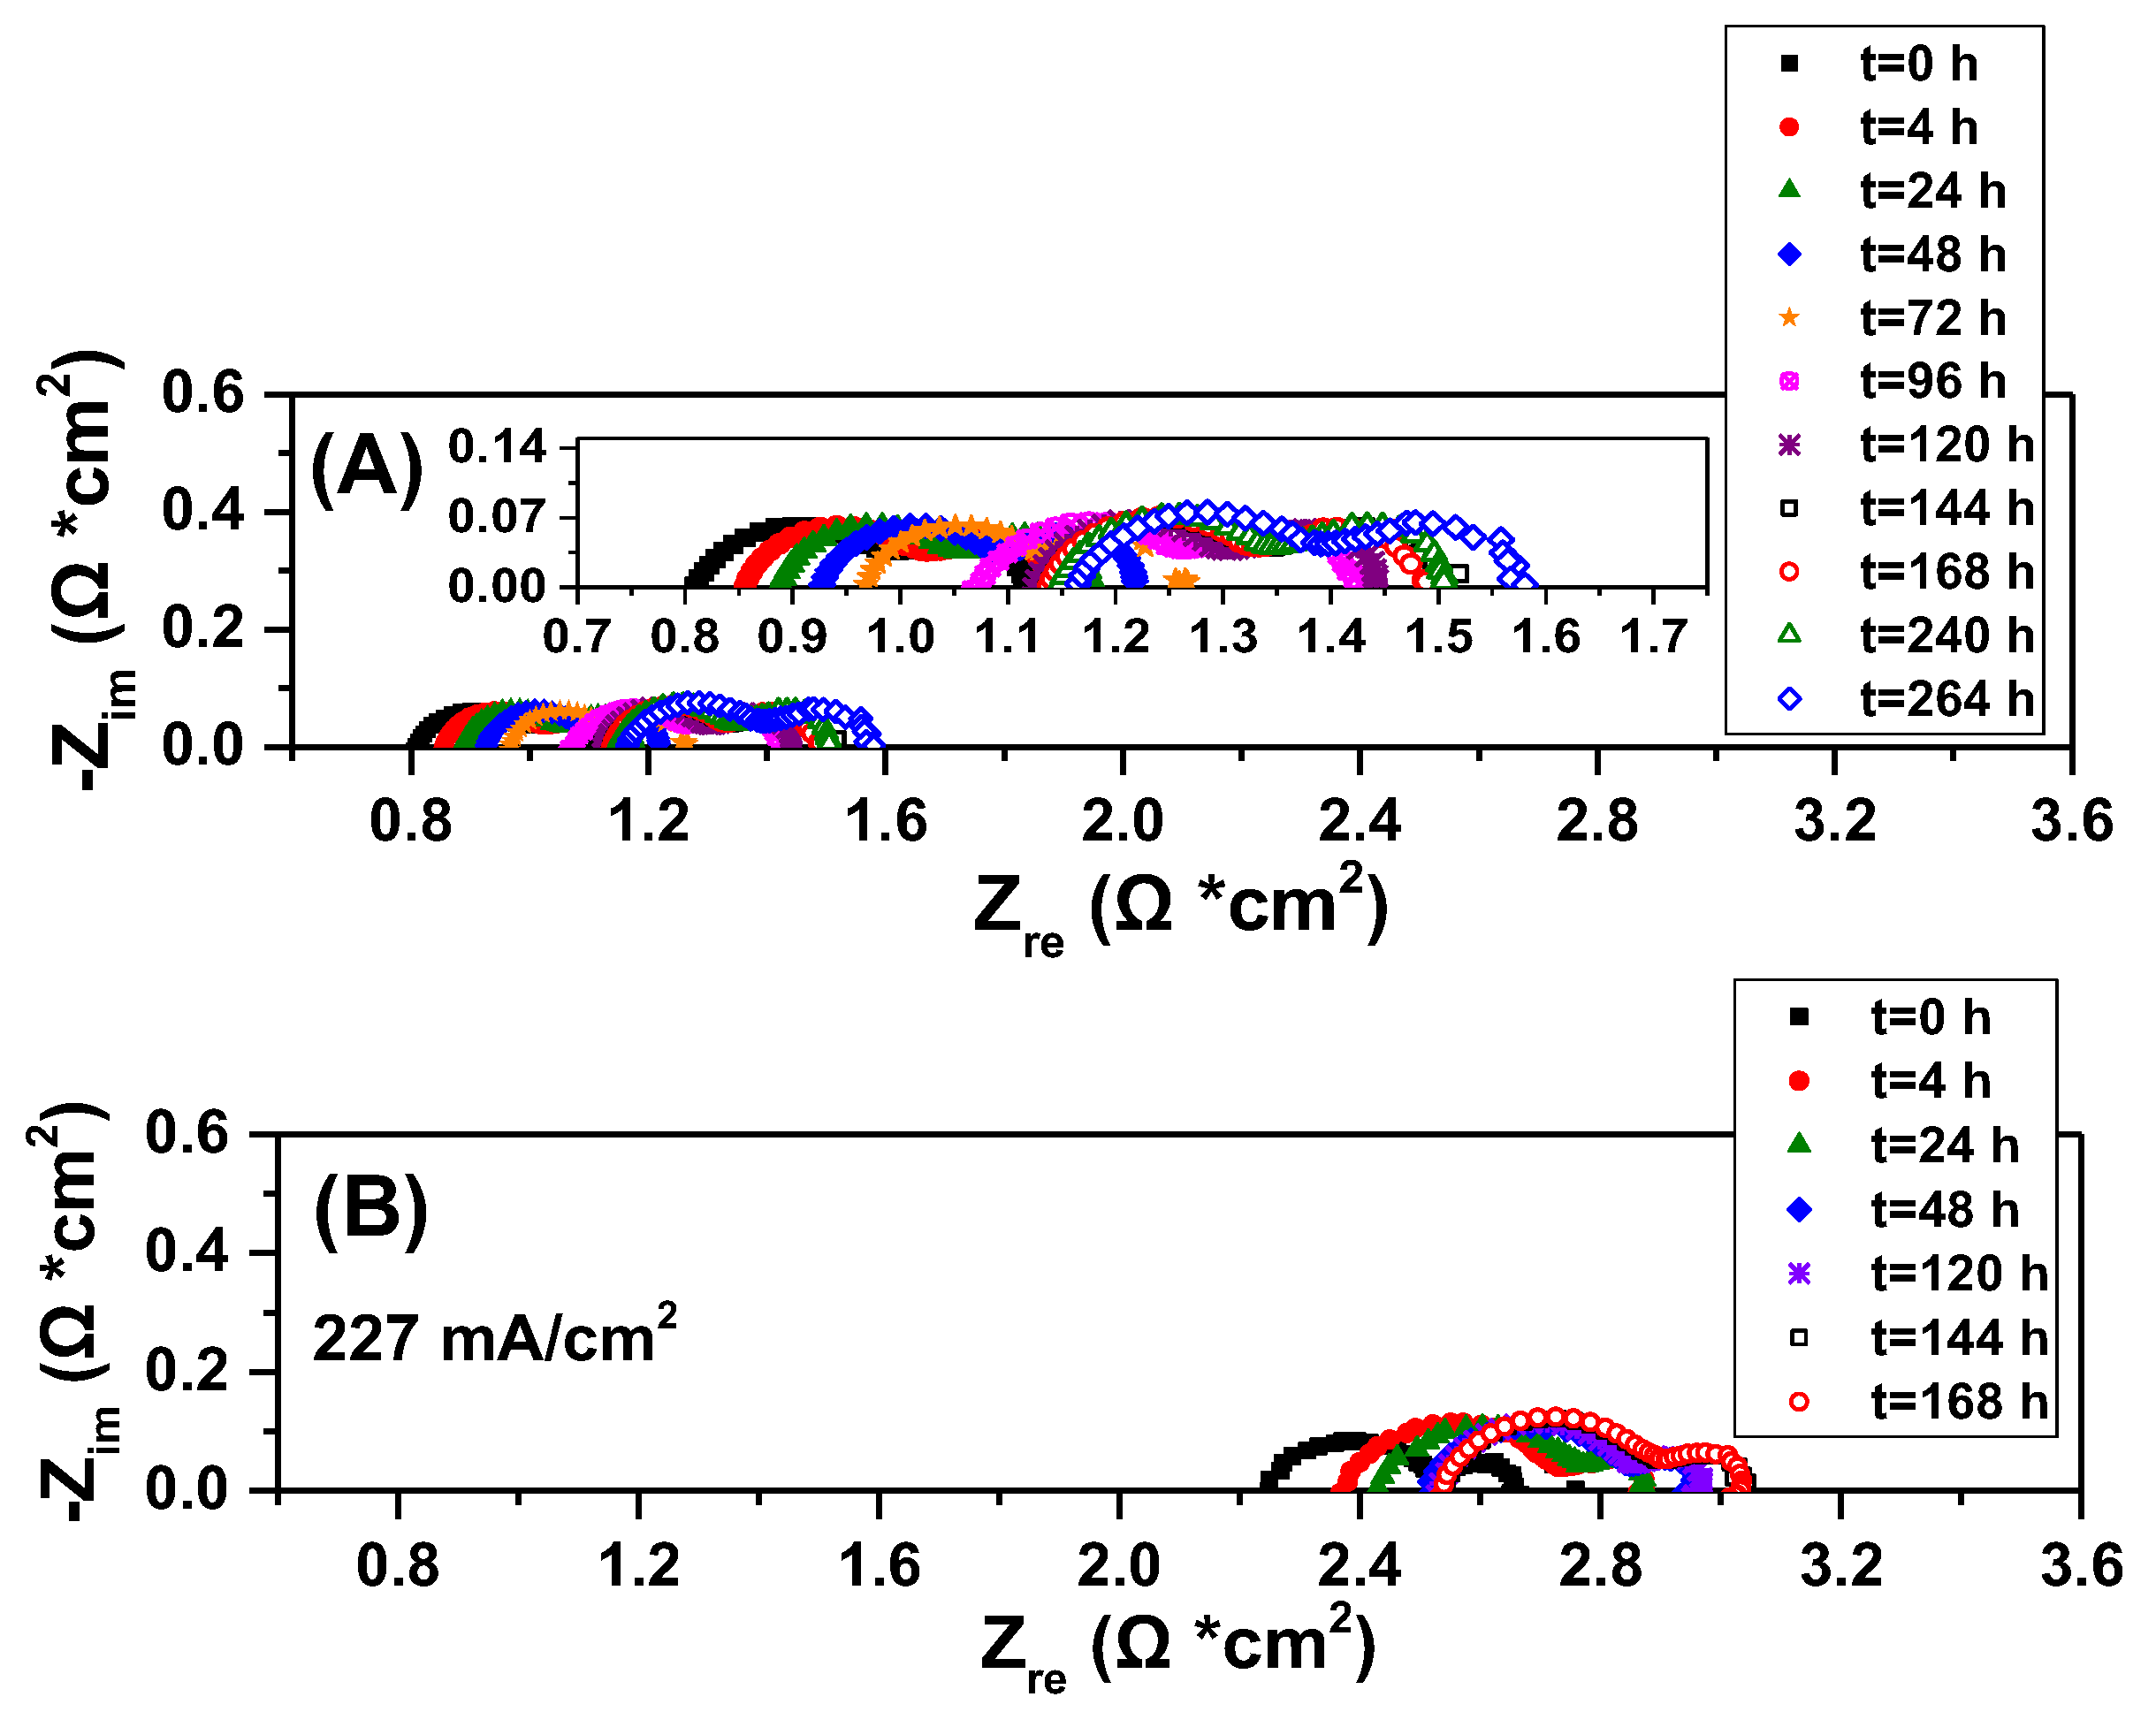
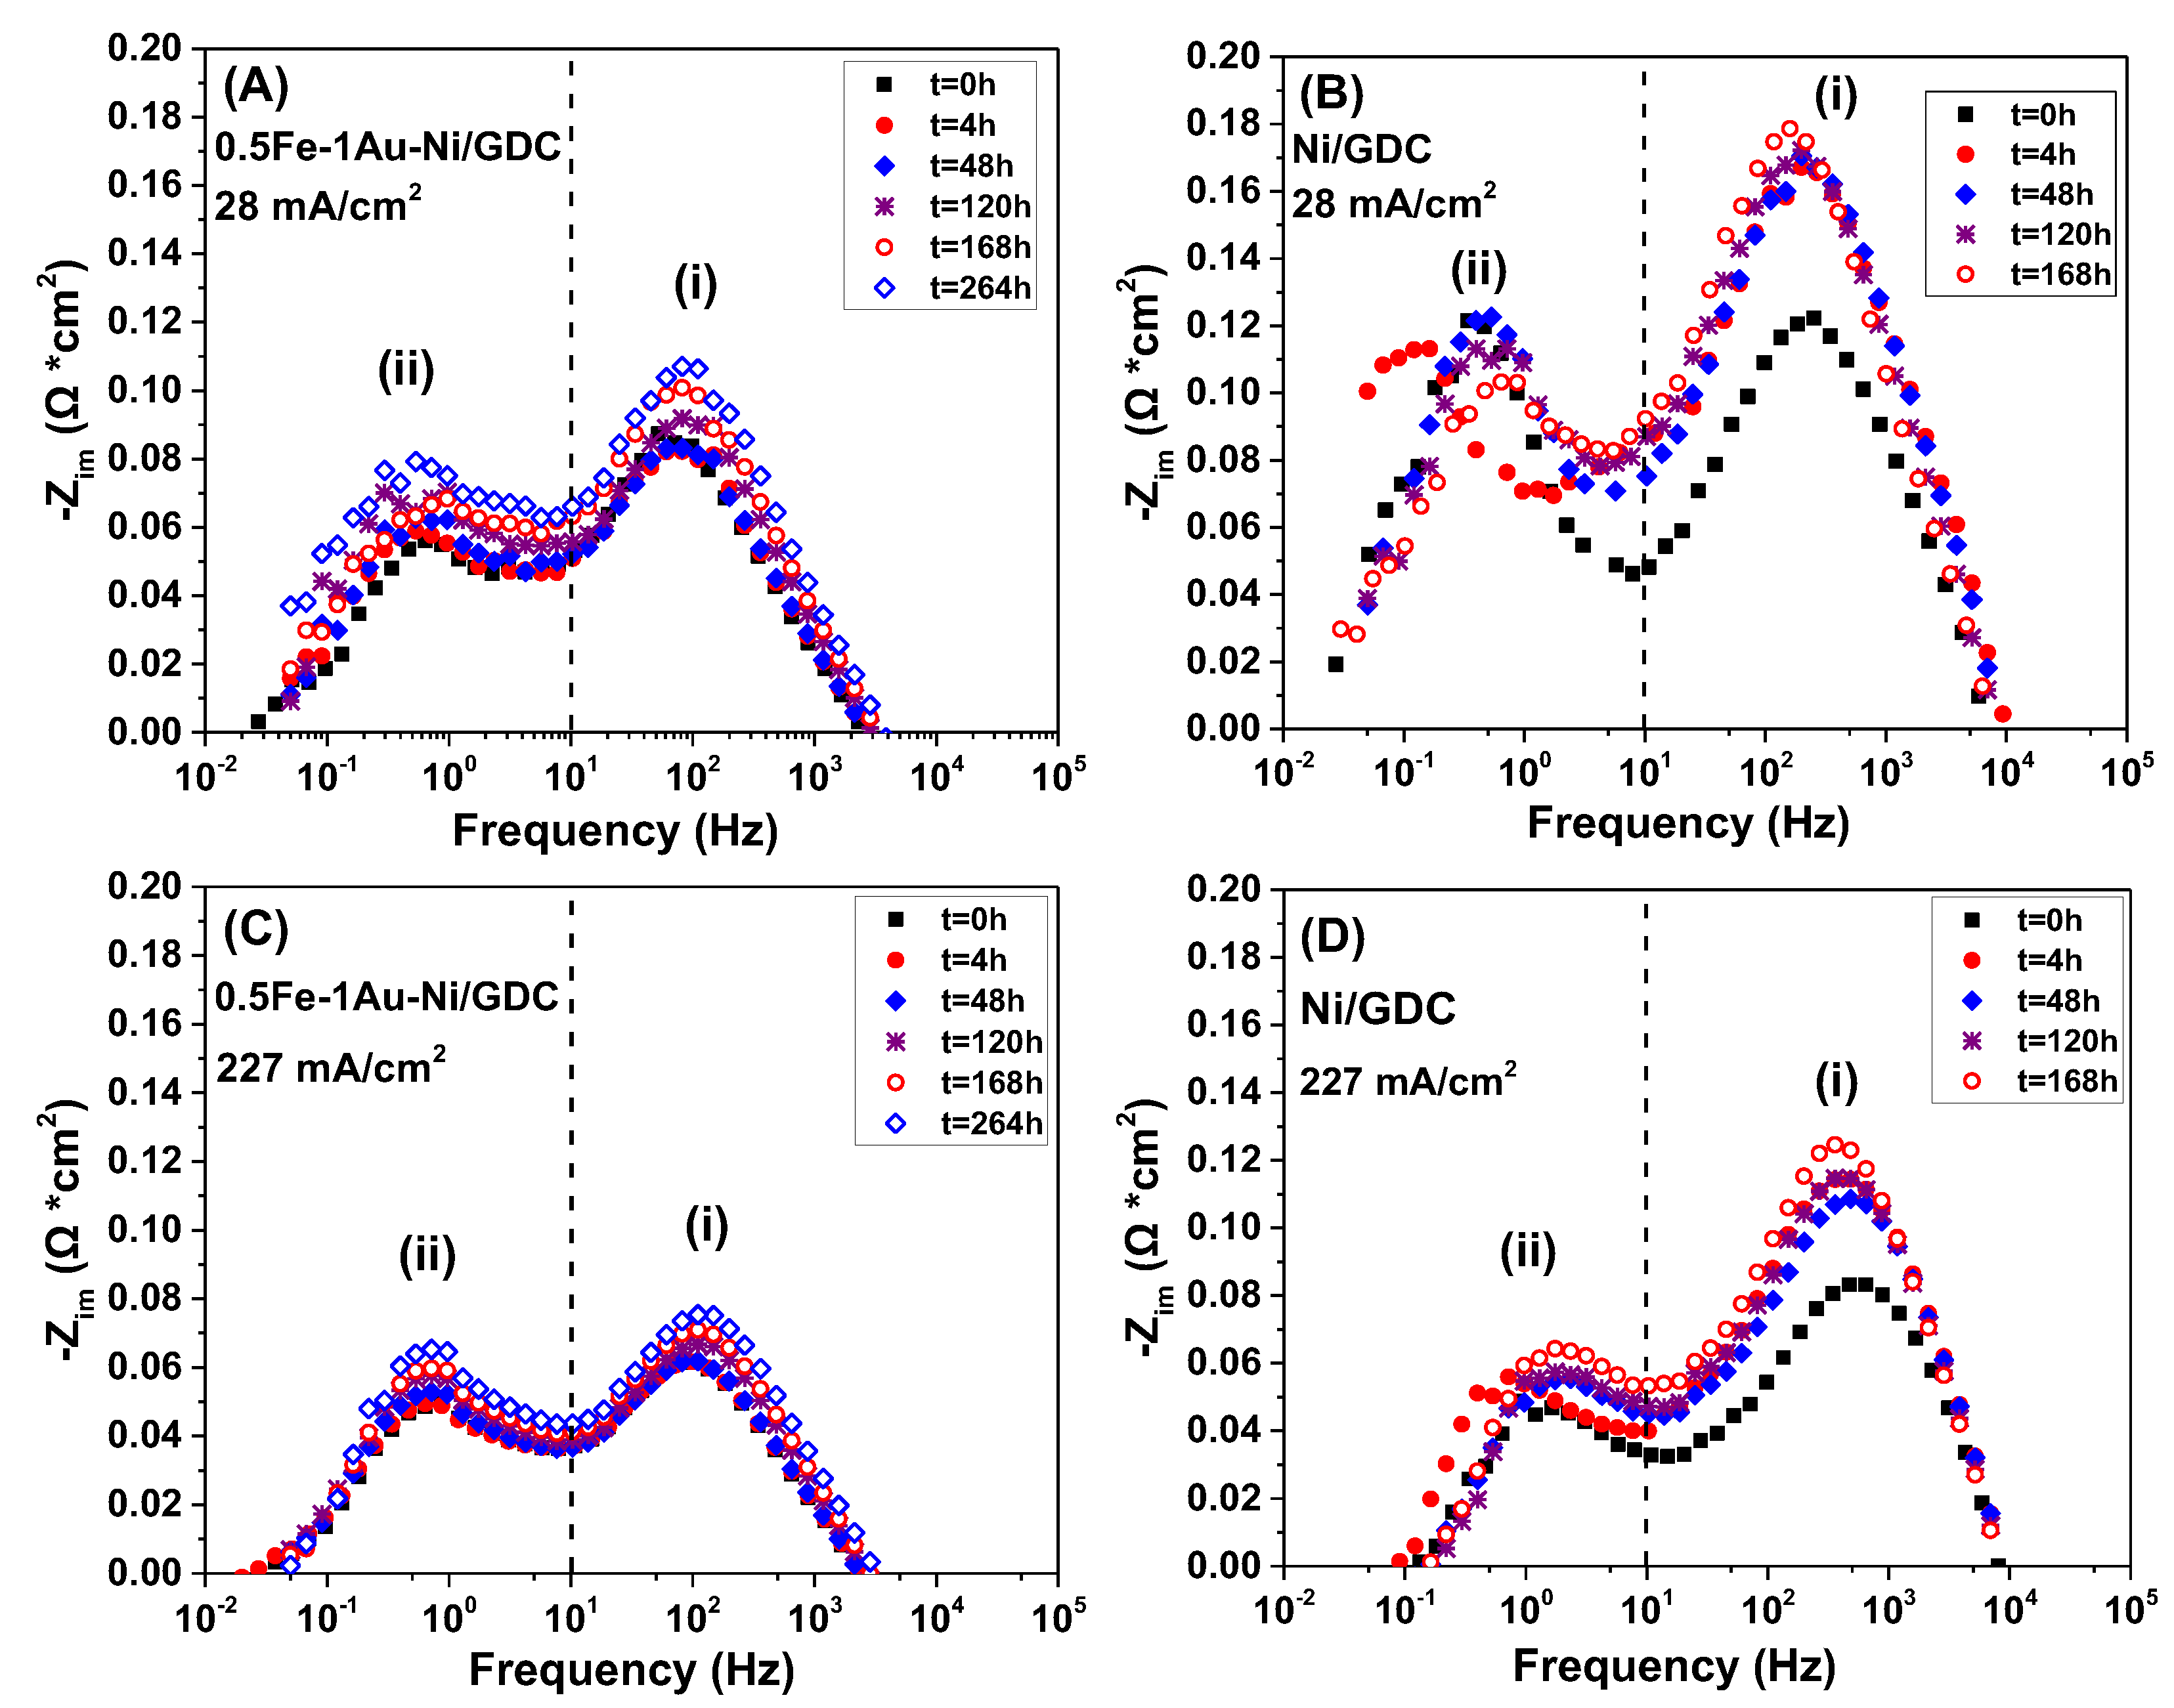
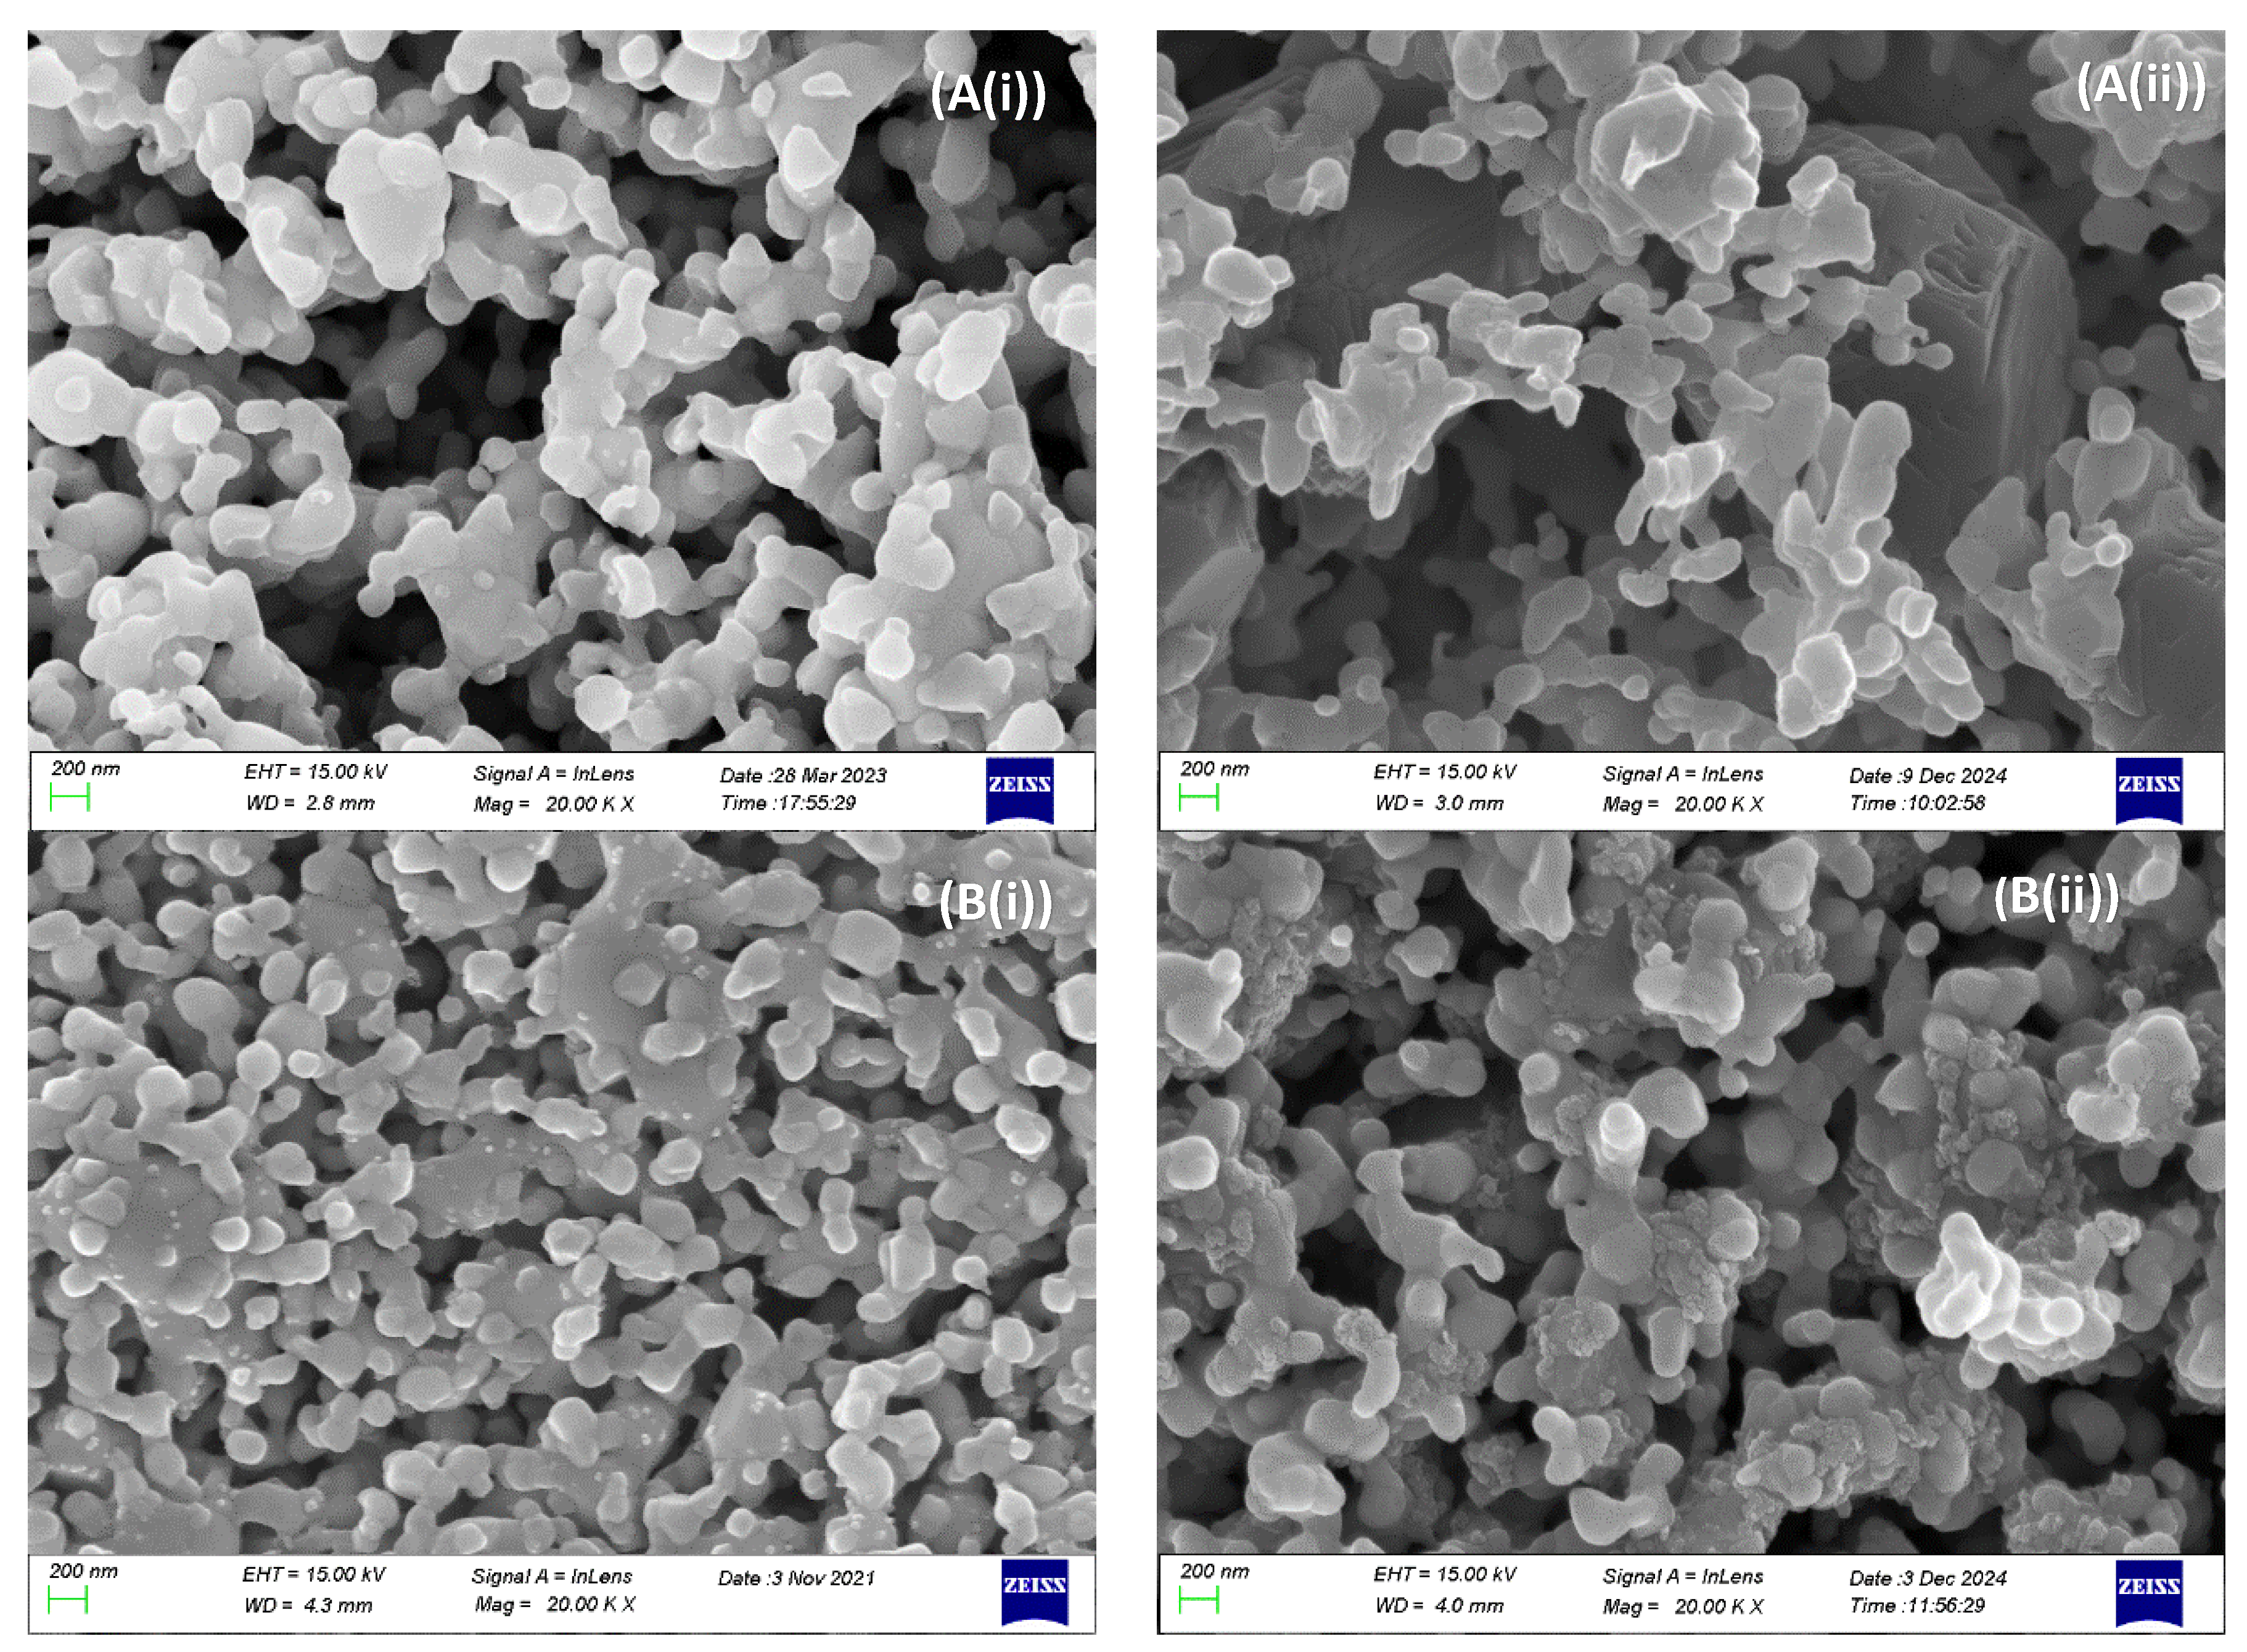
2.3. Electrocatalytic IDRM Stability Test of 0.5Fe-1Au-Ni/GDC vs Ni/GDC

The stability measurements (Figure 5) took place galvanostatically at 227 mA cm−2, and the fuel reaction mixture comprised 50 vol.% CH4 and 50 vol.% CO2, with a 50 cm3 min−1 total flow rate. The comparison includes the evolution of the operating potential over time, in combination with the electrocatalytic production/consumption rates. The open circuit potential of the SoA Ni/GDC cell was 1.135 V and 1.102 V for the cell with the 0.5Fe-1Au-Ni/GDC fuel electrode, which are considered as similar values. The operating potential of the cell with Ni/GDC, upon polarization at 227 mA cm−2, started at 450 mV. In the case of the cell with 0.5Fe-1Au-Ni/GDC, the operating potential started at a significantly higher value, 830 mV. The latter quite lower overpotential of operation highlights the higher electrocatalytic activity of the cell with the ternary fuel electrode and is attributed to the enhanced electrochemical activity in combination with the structural properties of 0.5Fe-1Au-Ni/GDC induced by the Fe-Au modification [51].
Figure 5. Stability diagrams of SOFCs with (A) 0.5Fe-1Au-Ni/GDC and (B) Ni/GDC as fuel electrodes, at 900 °C, under a constant current density of 227 mA cm−2. The solid curves correspond to the evolution of the operating potential (V), at 227 mA cm−2, and the symbols (■,□) rH2O, (,) rH2, (,) rCO, (,) rCH4, (,) rCO2, (,) rC to the production/consumption rates (μmol s−1 g−1) versus time (h). In particular, the closed symbols were recorded during polarization of 227 mA cm−2, while the open symbols at O.C.P. conditions. Fuel mixture: 50 vol.% CH4−50 vol.% CO2. Ftotal, in = 50 cm3/min.
Catalysts 15 00618 g005
The production/consumption rates (μmol s−1 g−1) at O.C.P. conditions (open symbols) are quite similar to the electrocatalytic rates under polarization (closed symbols). Like in the electrochemical measurements of Section 2.2, the 0.5Fe-1Au-Ni/GDC was less active catalytically and exhibited ~2.5 times lower production/consumption rates than Ni/GDC. Carbon formation rates were measurable only for the cell with Ni/GDC at O.C.P. conditions. On the other hand, for both cells, carbon formation was not measured during the stability test. This is consistent with other studies on internal CO2 reforming of CH4 over Ni-based electrodes, which have shown that carbon formation is inhibited under operation with sufficient O2− flux (i.e., current density) [6,28,63]. On the other hand, considerable amounts of carbon deposition were reported on the surface of Ni electrodes under O.C.P. conditions (i.e., zero O2− flux) [63]. This is in agreement with our kinetic study [51], where Ni/GDC exhibited carbon formation rates at O.C.P. conditions and for T ≥ 850 °C. The above remarks indicate that the removal of carbon deposits either through electro-oxidation by O2− (Equation (8)) and/or through the catalytic reaction with H2O (Equation (7)) should take place under polarization, preventing thus the acute and significant carbon accumulation.
The stability duration of the cell with Ni/GDC was lower (160 h) than that of the cell with 0.5Fe-1Au-Ni/GDC (280 h). This was due to a sudden increase in the pressure of the reactor that led to the termination of the test. The pressure increase could be attributed to the gradual formation of solid carbon deposits, which should have had quite low and thus not measurable rates, but capable of gradually accumulating and blocking the flow of the gas reactants/products inside the reactor. By the termination of the Ni/GDC stability, the degradation rate was 0.51 mV h−1. The cell with the ternary Fe-Au-modified fuel electrode degraded at a slightly lower rate of 0.44 mV h−1, and even though it operated for almost twice the time than that of the Ni/GDC, the latter stability was also terminated for the same reason of a pressure increase inside the reactor.
Further clarifications regarding the degradation of the cells can be derived from the recorded impedance spectra during the stability tests. The latter analysis started from the beginning of the measurements (t = 0) and continued at specific time periods up to the end of the experiments. The spectra were recorded galvanostatically at the low current density of 28 mA cm−2 (close to O.C.P.) (Figure 6), and at the applied current density 227 mA cm−2 of the stability (Figure 7). The resistance values (Rohm and Rpol), derived from the Nyquist plots, as well as their evolution during time, are also depicted in Figure 8 and Figure 9, respectively.
Figure 6. Nyquist plots of SOFCs comprising (A) 0.5Fe-1Au-Ni/GDC and (B) Ni/GDC during the stability tests of Figure 5, at 900 °C, under 28 mA cm−2. The spectra were recorded at consecutive time intervals: from t = 0 h to t = 264 h for 0.5Fe-1Au-Ni/GDC or from t = 0 h to t = 168 h for Ni/GDC. Magnified figure is also shown inside (A). Mixt.: 50 vol.% CH4−50 vol.% CO2. Ftotal, in = 50 cm3/min.
Catalysts 15 00618 g006aCatalysts 15 00618 g006b
Figure 7. Nyquist plots of SOFCs comprising (A) 0.5Fe-1Au-Ni/GDC and (B) Ni/GDC during the stability tests of Figure 5, at 900 °C, under 227 mA cm−2. The spectra were recorded at consecutive time intervals: from t = 0 h to t = 264 h for 0.5Fe-1Au-Ni/GDC or from t = 0 h to t = 168 h for Ni/GDC. Magnified figure is also shown inside (A). Mixt.: 50 vol.% CH4−50 vol.% CO2. Ftotal, in = 50 cm3/min.
Catalysts 15 00618 g007
It was observed that, regardless of the polarization, the cell with 0.5Fe-1Au-Ni/GDC exhibited lower Rohm and Rpol values compared to Ni/GDC (Figure 6 and Figure 7), in agreement with the results in the previous sections of this study. The main reason for the degradation of the cell with Ni/GDC seems to be the sharp increase of the ohmic resistance value after 4 h of the stability operation (Figure 6B and Figure 8B). This is well detected in the Nyquist plots under low polarization (28 mA cm−2), whereas a minor increase was observed in the Rpol values. A similar but much milder degradation effect on the Rohm and Rpol values of the Ni/GDC cell was observed under the higher applied polarization of 227 mA cm−2 (Figure 7B and Figure 9B) at t = 4 h. After 4 h of operation, the Rohm value stabilized and remained practically constant up to the end of the stability measurement (t = 170 h). The Rpol values were also practically stable with respect to time. In the case of 0.5Fe-1Au-Ni/GDC, the stability operation had a minor effect on the Rohm degradation. Its value did not increase significantly at t = 4 h, and after this time period a progressive slight increase was observed (Figure 6A, Figure 7A, Figure 8A and Figure 9A) until the end of the stability. In addition, as in the case of the cell with Ni/GDC, the Rpol values remained constant from the beginning of the experiment (t = 0 h) up to its completion (t = 270 h).
Figure 8. Evolution of (−■−) Rohm, (−●−) Rpol1 and (−▲−) Rpol2 (Ω cm2) values versus time (h) for the examined SOFCs with (A) 0.5Fe-1Au-Ni/GDC and (B) Ni/GDC. The resistance values were extracted from the impedance spectra, at low polarization 28 mA cm−2, depicted in Figure 6A and Figure 6B, respectively.
Catalysts 15 00618 g008
Figure 9. Evolution of (−■−) Rohm, (−●−) Rpol1 and (−▲−) Rpol2 (Ω cm2) values versus time (h) for the examined SOFCs with (A) 0.5Fe-1Au-Ni/GDC and (B) Ni/GDC. The resistance values were extracted from the impedance spectra, at 227 mA cm−2, depicted in Figure 7A and Figure 7B, respectively.
Catalysts 15 00618 g009
The semi-logarithmic (−Zim vs. frequency) plots (Figure 10) corroborate that the main degradation effect was observed on the cell with Ni/GDC. Specifically, after the first 4 h of operation, there seemed to be an inhibition of the charge transfer processes in the intermediate frequencies region (i), which was the case under both of the applied (low and high) current densities. This observation, in combination with the sharp increase of the Ni/GDC ohmic resistance highlight degradation, most probably on the conductivity and/or on the structural properties of the fuel electrode. This can be attributed to the high concentration of CO2 in the reactants/products mixture and most importantly to the increased concentration of the produced H2O, based on the higher selectivity of Ni/GDC for the RWGS catalytic reaction. These factors might have enhanced the gradual re-oxidation and/or agglomeration of nickel [64,65] on Ni/GDC, where specifically the re-oxidation by steam has been reported [12,66] to take place on the nickel surface through the formation of nickel hydroxide layers.
Figure 10. Semi-logarithmic plots of SOFCs comprising (A,C) 0.5Fe-1Au-Ni/GDC and (B,D) Ni/GDC during the stability tests of Figure 5, at 900 °C, under (A,B) 28 mA cm−2 and (C,D) 227 mA cm−2. The spectra were recorded at consecutive time intervals: from t = 0 h to t = 264 h for 0.5Fe-1Au-Ni/GDC or from t = 0 h to t = 168 h for Ni/GDC. Mixt.: 50 vol.% CH4−50 vol.% CO2. Ftotal, in = 50 cm3/min.
Catalysts 15 00618 g010
The conclusions of the electrochemical characterization during the stability tests were corroborated using scanning electron microscopy (SEM-EDS) analysis with an HR-SEM (Zeiss SUPRA 35VP, Oberkochen, Germany). Figure 11 presents the SEM images (top-side electrode) of the H2-reduced surface of 0.5Fe-1Au-Ni/GDC (A) and Ni/GDC (B) before and after the long-term stability measurements. In addition, Table 2 presents the results from the stoichiometric analysis on the (post-mortem) surface state of each fuel electrode. The main conclusion is that the wt.% content of reduced nickel on Ni/GDC was lower (i.e., 34 wt.% Ni), compared to the post-mortem surface nickel state of 0.5Fe-1Au-Ni/GDC (43 wt.% Ni). This is due to the higher re-oxidation degree of the former cell, despite the fact that it operated for almost half of the time under IDRM stability conditions. Moreover, it seems that the longer operating time of the modified cell did not negatively affect its macro-porosity/tortuosity, which remained higher than that of Ni/GDC, in agreement with previous findings [50].
Overall, the cell with the ternary 0.5Fe-1Au-Ni/GDC exhibited better electrochemical performance and operated for almost twice the operation time of the cell with the SoA Ni/GDC. A noteworthy remark is that the observed degradation rates in both cells under the SOFC IDRM stability conditions are (5–10 times) lower than the reported degradation rates under internal methane steam reforming (ISRM) stability conditions [12]. This can be ascribed to the fact that in the IDRM reactants/products mixture the H2O concentration, which is an important re-oxidation factor of nickel, is much lower, whereas carbon formation rates seem also to be lower. On the other hand, the results presented herein highlight that the high concentration of CO2 and most importantly of H2O should be the main degradation factor for the Ni/GDC cell, due to its higher selectivity for the RWGS reaction. Carbon deposition was not measured/detected during the stability in both of the examined cells, but the pressure increase inside the reactor upon prolonged operation is a hint of accumulated carbon deposits. These should have very low formation rates which, despite the removal processes by O2− and/or H2O, may also contribute to the long-term operation and degradation.

3. Experimental Procedure

3.1. Preparation of Electrocatalysts

X wt.% Au-NiO/GDC and 0.5 wt.% Fe-X wt.% Au-NiO/GDC (where X = 1 or 3 wt.%) were prepared via a deposition (Co-)precipitation method using the commercial NiO/GDC (65 wt.% NiO-35 wt.% GDC, Marion Technologies) powder as the support and the metal precursors HAuCl4 and Fe(NO3)3x9H2O (Sigma-Aldrich, St. Louis, MO, USA). In Section 2, the electrocatalysts are reported as 1Au-Ni/GDC, 3Au-Ni/GDC, 0.5Fe-1Au-Ni/GDC and 0.5Fe-3Au-Ni/GDC. During the preparation, the NiO/GDC powder was immersed into triple de-ionized H2O and the resulting suspension was continuously stirred, keeping the temperature constant at 70 °C. The aqueous solutions of metal precursors were dropwise added in the suspension, simultaneously, at a constant pH value equal to 7.0 for Au-NiO/GDC and 6.0 for Fe-Au-NiO/GDC samples, by adding NH3 (1M). Afterwards, the precipitate was periodically washed in order to eliminate any residual Cl, filtered and dried at 90 °C for 24 h. All dried powders were calcined at 600 °C/90 min in stagnant air and then used for the slurry preparation of fuel electrodes. The experimental wt.% concentration of each dopant (Au and Fe) in the total mass of NiO/GDC powder was previously reported [51], whereas for 0.5Fe-1Au-Ni/GDC the wt.% of Fe and Au were 0.5 and 0.9, respectively.

3.2. Preparation of Solid Oxide Fuel Cells (SOFCs)

The electrolyte-supported single fuel cells consisted of a circular shaped disk ZrO2 (8% mol Y2O3) or 8YSZ electrolyte (Kerafol GmbH, Eschenbach, Germany) of 25 mm diameter and 300 μm thickness. The fuel and oxygen electrodes were deposited on 8YSZ disks via screen printing. The slurry used for the fuel electrode deposition was composed of a proper amount of NiO/GDC-based powder (calcined at 600 °C), terpineol (Sigma-Aldrich) as the solvent and polyvinyl butyral (PVB, Sigma-Aldrich) as the binder. The slurry was first homogenized and then screen-printed on the 8YSZ disk, covering a central circular surface area of 1.76 cm2. The fuel electrode was calcined at 1150 °C for 2 h with a heating/cooling ramp rate of 2 °C/min, and the final loading was 10 mg cm2. The oxygen electrode was La0.6Sr0.4Co0.8Fe0.2O3-δ (LSCoF, SolydEra, Via Trento, Mezzolombardo TN, Italy), which was also applied as slurry paste via screen printing and calcined at 1150 °C/2 h (2 °C/min). In the oxygen side, an adhesion layer of GDC10 was applied and pre-calcined at 1300 °C/2 h (2 °C/min) in order to overcome the thermal and chemical mismatch between LSCoF-YSZ. The final loading of LSCoF and GDC was 10 mg cm2. The thickness of each fuel and oxygen electrode of the prepared cells was measured at 20 μm, as reported in previous studies [45,47]. The images of NiO/GDC and 0.5Fe-1Au-NiO/GDC electrolyte-supported cells prepared by screen printing are presented in Figure 12.

3.3. Electrocatalytic Measurements

The electrocatalytic experiments were carried out in full SOFCs at 900 and 850 °C, where each electrocatalyst was the sole functional layer of the fuel electrode. Ni and Pt mesh (Alfa-Aesar, Haverhill, MA, USA) were used as current collectors on the fuel and oxygen side, respectively, and pressed onto the electrodes via spring force to achieve the optimum current collection. Each cell was attached to the reactor, which was a YSZ tube, and sealed airtight by using a glass sealing material (KeraGlas, Kerafol, Eschenbach, Germany). A schematic of the custom-made SOC electrocatalytic test-rig reactor is depicted in Figure S5 (Supplementary Material). The fuel compartment was fed with a mixture of 50 vol.% CH4−50 vol.% CO2 (CH4/CO2 = 1) without dilution in a carrier gas. Τhe oxygen compartment was exposed to 100 vol.% O2; thus, any observed change in the electrochemical response of the cell was attributed to the fuel electrode contribution only. Prior to electrocatalytic measurements, the fuel side was pre-conditioned at each temperature, with CH4/CO2 = 1 mixtures diluted in 80–20 vol.% He in order to avoid thermo-mechanical fracture of the electrolyte thin film. During the measurements, a six-port valve enabled the direction of the fuel mixture through/by-pass the reactor. The lines and valves of the setup were kept above 100 °C to prevent condensation of the produced steam. The flow rates were adjusted at 50 cm3 min−1 in the fuel compartment in order (to avoid cell fracture) and 100 cm3 min−1 in the oxygen compartment. In all cases, before the internal DRM measurements, the cells were heated up to 900 °C and the fuel side kept for 24 h in 100 vol.% H2 (150 cm3 min−1). This step activated the electrodes for the catalytic DRM reaction and rendered them electrically conducting. Then, the cells were comparatively examined under reference SOFC conditions (fuel side feed: 100 vol.% H2, 150 cm3 min−1, oxygen side feed: 100 vol.% O2, 170 cm3 min−1). Overall, the applied gases were CH4 (99.995 vol.%, Air Liquide), CO2 (99.992 vol.%, Messer), He (99.999 vol.%, Linde), H2 (99.999 vol.%, Linde) and O2 (99.9999 vol.%, Linde).
Polarization i-V curves were recorded using a potentiostat/galvanonstat, (Autolab PGSTAT30, Utrecht, The Netherlands), between the open circuit potential (O.C.P.) and 0 V, at a scan rate of 5 mV s−1 and a step potential of 20 mV. Subsequent electrochemical impedance spectra (EIS) were measured in galvanostatic mode at various current densities at an amplitude that was each time ~10% of the applied current in the frequency range from 100 kHz to 20 mHz. The electrocatalytic stability measurements were carried out in galvanostatic mode with an applied constant current density of 227 mA/cm2. The comparison included the evolution of the operating potential over time. Reactants and products were determined, under both open circuit potential (O.C.P.) and polarization (under various current densities) conditions, by using an on-line gas chromatograph (GC, Varian CP-3800, Walnut Creek, CA, USA) with a thermal conductivity detector. A Porapak Q column (80–100 mesh, 1.8 m × 1/8 in. × 2 mm) was used for the analysis of H2O at 150 °C, while a Carbosieve S-11 column (80–100 mesh, 2 m × 1/8 in. × 2 mm) was used for the analysis of H2, CO, CH4 and CO2 (in parallel with the Porapak Q).

4. Conclusions

This study is an electrocatalytic investigation of the performance enhancement that is induced by Fe-Au modification of the SoA Ni/GDC for the SOFC internal dry reforming of CH4. The focus was on the effect of Au wt.% concentration in: (i) binary Au-Ni/GDC and (ii) ternary Fe-Au-Ni/GDC fuel electrodes.
It was found that the Fe-Au modification enhanced the intrinsic electrocatalytic activity of Ni/GDC for the IDRM reaction. Specifically, the cells with Fe-Au-Ni/GDC fuel electrodes exhibited significantly lower Rohm and Rpol values, compared to the binary Au-Ni/GDC and the non-modified Ni/GDC, whereas the Fe-Au positive interaction was improved by decreasing the gold content. On the other hand, the high wt.% Au concentration had an inhibiting effect, which was pronounced at temperatures below 900 °C. The positive interaction of Fe with low wt.% Au content enabled the fuel electrode to perform more easily/faster the corresponding charge transfer, interfacial, and electrochemical processes for the IDRM, especially those in the intermediate frequencies region. This can be further correlated with the improved electronic conductivity and structural properties, which are induced by the Fe-Au modification.
Comparative long-term stability measurements between cells comprising the SoA Ni/GDC and the best performing 0.5Fe-1Au-Ni/GDC highlighted that the latter fuel electrode exhibited 2.5 times lower catalytic DRM performance but significantly higher IDRM electrochemical/electrocatalytic activity, whereas it operated for 280 h with a degradation rate of 0.44 mV/h. The cell with Ni/GDC exhibited higher DRM catalytic activity, with carbon deposition at O.C.P. conditions, but much worse IDRM electrochemical/electrocatalytic performance. It operated for almost half of the time (160 h) of the other cell, with a slightly higher degradation rate 0.51 mV/h. More specifically, after the first 4 h of operation there was inhibition of the charge transfer processes in the intermediate frequencies, accompanied by a sharp increase of the Rohm value, suggesting mainly degradation of the conductivity. Carbon deposition was not measured during the galvanostatic stability in either of the examined cells. However, a pressure increase inside the reactor is a hint of accumulated carbon deposits, with very low formation rates and removal processes, which may also play a role for the long-term operation. Post-mortem SEM analysis confirmed that the re-oxidation degree of Ni/GDC was higher than that of 0.5Fe-1Au-Ni/GDC, though the latter operated for a longer period of time. This can be further ascribed to the re-oxidation of nickel, caused by the high concentration of CO2 in the reactants/products mixture and most importantly by the higher content of produced H2O, according to the higher selectivity of Ni/GDC for the undesirable RWGS catalytic reaction.

Supplementary Materials

The following supporting information can be downloaded at: https://www.mdpi.com/article/10.3390/catal15070618/s1, Figure S1: (A) Polarization (i–V) and (B) power density curves, at 850 °C, for SOFCs comprising: (-■-) Ni/GDC, (-⯁-) 1Au-Ni/GDC, (-★-) 3Au-Ni/GDC, (-⦻-) 0.5Fe-1Au-Ni/GDC and (-●-) 0.5Fe-3Au-Ni/GDC as fuel electrodes. Mixt.: 50 vol.% CH4−50 vol.% CO2. Ftotal, in = 50 cm3/min.; Table S1: Rohm and Rpol values, extracted from the EIS Nyquist plots of Figure 3, under 28 and 284 mA cm−2, at 850 °C, for the cells with Ni/GDC, 1Au-Ni/GDC, 3Au-Ni/GDC, 0.5Fe-1Au-Ni/GDC and 0.5Fe-3Au-Ni/GDC.; Figure S2: Nyquist plots of SOFCs comprising (A) Ni/GDC (“Reproduced by Ioannidou E. (et al), ECS Trans, 111, (2023), https://doi.org/10.1149/11106.2473ecst, © The Electrochemical Society. Reproduced by permission of IOP Publishing Ltd. All rights reserved”), (B) 1Au-Ni/GDC, (C) 3Au-Ni/GDC, (D) 0.5Fe-1Au-Ni/GDC and (E) 0.5Fe-3Au-Ni/GDC (“Reproduced by Ioannidou E. (et al), ECS Trans, 111, (2023), https://doi.org/10.1149/11106.2473ecst, © The Electrochemical Society. Reproduced by permission of IOP Publishing Ltd. All rights reserved”), as fuel electrodes, at 900 °C, under various polarizations (applied current density, mA cm−2). Mixt.: 50 vol.% CH4−50 vol.% CO2. Ftotal, in = 50 cm3/min. Magnification figures are also shown inside the corresponding plots. The highest applied current density value for each cell corresponded to a potential value close to ~0 V and it was applied for a short duration of ~10 min, in order to avoid the detrimental re-oxidation of the electrodes.; Figure S3: Semi-logarithmic plots of the EIS imaginary part (−Zim) versus frequency for SOFCs comprising (A) Ni/GDC, (B) 1Au-Ni/GDC, (C) 3Au-Ni/GDC, (D) 0.5Fe-1Au-Ni/GDC and (E) 0.5Fe-3Au-Ni/GDC as fuel electrodes, at 900 °C, under various polarizations (applied current density, mA cm−2). Mixt.: 50 vol.% CH4−50 vol.% CO2. Ftotal, in = 50 cm3/min. The highest applied current density value for each cell corresponded to a potential value close to ~0 V and it was applied for a short duration of ~10 min.; Figure S4: Effect of the fuel electrode: (■) Ni/GDC, () 1Au-Ni/GDC, () 3Au-Ni/GDC, () 0.5Fe-1Au-Ni/GDC and () 0.5Fe-3Au-Ni/GDC in (A) H2 and (B) CO production rates (μmol s−1 g−1) as a function of the applied current density (mA cm−2), at 900 °C. Mixt.: 50 vol.% CH4−50 vol.% CO2. Ftotal, in = 50 cm3/min.; Figure S5: Cross section of the custom-made SOFC reactor.

Author Contributions

Conceptualization, S.G.N. and D.K.N.; Methodology, E.I., S.G.N. and D.K.N.; Validation, E.I., S.G.N. and D.K.N.; Formal analysis, E.I.; Investigation, E.I.; Resources, S.G.N. and D.K.N.; Data curation, E.I. and D.K.N.; Writing—original draft, E.I.; Writing—review and editing, E.I. and D.K.N.; Visualization, E.I. and D.K.N.; Supervision, S.G.N. and D.K.N.; Project administration, S.G.N. and D.K.N.; Funding acquisition, S.G.N. and D.K.N. All authors have read and agreed to the published version of the manuscript.

Funding

The research leading to these results has received funding from the European Union and Greek national funds through the operational program ‘Regional Excellence’ and the operational program ‘Competitiveness, Entrepreneurship, and Innovation’, under the call “RESEARCH-CREATE-INNOVATE” (Project code: Eco-Bio-H2-FCs, T2EΔK-00955).

Data Availability Statement

Data are contained within the article and Supplementary Materials.

Acknowledgments

The authors would like to thank Vassilios Dracopoulos, researcher at FORTH/ICEHT, for the SEM-EDS analysis.

Conflicts of Interest

The authors declare no conflict of interest.

References

  1. Lenton, T.M.; Xu, C.; Abrams, J.F.; Ghadiali, A.; Loriani, S.; Sakschewski, B.; Zimm, C.; Ebi, K.L.; Dunn, R.R.; Svenning, J.C.; et al. Quantifying the human cost of global warming. Nat. Sustain. 2023, 6, 1237–1247. [Google Scholar] [CrossRef]
  2. Spring, C.R.; Cirella, G.T. Fostering Sustainable Development: Green Energy Policy in the European Union and the United States. In Advances in 21st Century Human Settlements; Springer: Berlin/Heidelberg, Germany, 2022; pp. 101–137. [Google Scholar]
  3. Scarlat, N.; Prussi, M.; Padella, M. Quantification of the carbon intensity of electricity produced and used in Europe. Appl. Energy 2022, 305, 117901. [Google Scholar] [CrossRef]
  4. Escudero, M.J.; Maffiotte, C.A.; Serrano, J.L. Impedance analysis of electrolyte-supported solid oxide fuel cell with nickel-tungsten-cerium anode fed with CH4-CO2 mixtures and siloxanes. Electrochim. Acta 2022, 427, 140852. [Google Scholar] [CrossRef]
  5. Trendewicz, A.A.; Braun, R.J. Techno-economic analysis of solid oxide fuel cell-based combined heat and power systems for biogas utilization at wastewater treatment facilities. J. Power Sources 2013, 233, 380–393. [Google Scholar] [CrossRef]
  6. Zhang, H.; Liu, W.; Wang, J.; Yang, J.; Chen, Y.; Guan, W.; Singhal, S.C. Power generation from a symmetric flat-tube solid oxide fuel cell using direct internal dry-reforming of methane. J. Power Sources 2021, 516, 230662. [Google Scholar] [CrossRef]
  7. Calbry-Muzyka, A.; Madi, H.; Rüsch-Pfund, F.; Gandiglio, M.; Biollaz, S. Biogas composition from agricultural sources and organic fraction of municipal solid waste. Renew. Energy 2022, 181, 1000–1007. [Google Scholar] [CrossRef]
  8. Santoro, M.; Di Bartolomeo, E.; Luisetto, I.; Aricò, A.S.; Squadrito, G.; Zignani, S.C.; Lo Faro, M. Insights on the electrochemical performance of indirect internal reforming of biogas into a solid oxide fuel cell. Electrochim. Acta 2022, 409, 139940. [Google Scholar] [CrossRef]
  9. Abdelkareem, M.A.; Tanveer, W.H.; Sayed, E.T.; Assad, M.E.H.; Allagui, A.; Cha, S.W. On the technical challenges affecting the performance of direct internal reforming biogas solid oxide fuel cells. Renew. Sustain. Energy Rev. 2019, 101, 361–375. [Google Scholar] [CrossRef]
  10. Saadabadi, S.A.; Illathukandy, B.; Aravind, P.V. Direct internal methane reforming in biogas fuelled solid oxide fuel cell; the influence of operating parameters. Energy Sci. Eng. 2021, 9, 1232–1248. [Google Scholar] [CrossRef]
  11. Lyu, Z.; Wang, Y.; Zhang, Y.; Han, M. Solid oxide fuel cells fueled by simulated biogas: Comparison of anode modification by infiltration and reforming catalytic layer. Chem. Eng. J. 2020, 393, 124755. [Google Scholar] [CrossRef]
  12. Neofytidis, C.; Dracopoulos, V.; Neophytides, S.G.; Niakolas, D.K. Electrocatalytic performance and carbon tolerance of ternary Au-Mo-Ni/GDC SOFC anodes under CH4-rich Internal Steam Reforming conditions. Catal. Today 2018, 310, 157–165. [Google Scholar] [CrossRef]
  13. Zarabi Golkhatmi, S.; Asghar, M.I.; Lund, P.D. A review on solid oxide fuel cell durability: Latest progress, mechanisms, and study tools. Renew. Sustain. Energy Rev. 2022, 161, 112339. [Google Scholar] [CrossRef]
  14. Yentekakis, I.V.; Panagiotopoulou, P.; Artemakis, G. A review of recent efforts to promote dry reforming of methane (DRM) to syngas production via bimetallic catalyst formulations. Appl. Catal. B Environ. 2021, 296, 120210. [Google Scholar] [CrossRef]
  15. Escudero, M.J.; Maffiotte, C.A.; Serrano, J.L. Long-term operation of a solid oxide fuel cell with MoNi–CeO2 as anode directly fed by biogas containing simultaneously sulphur and siloxane. J. Power Sources 2021, 481, 229048. [Google Scholar] [CrossRef]
  16. Aramouni, N.A.K.; Touma, J.G.; Tarboush, B.A.; Zeaiter, J.; Ahmad, M.N. Catalyst design for dry reforming of methane: Analysis review. Renew. Sustain. Energy Rev. 2018, 82, 2570–2585. [Google Scholar] [CrossRef]
  17. Pakhare, D.; Spivey, J. A review of dry (CO2) reforming of methane over noble metal catalysts. Chem. Soc. Rev. 2014, 43, 7813–7837. [Google Scholar] [CrossRef]
  18. Nikoo, M.K.; Amin, N.A.S. Thermodynamic analysis of carbon dioxide reforming of methane in view of solid carbon formation. Fuel Process. Technol. 2011, 92, 678–691. [Google Scholar] [CrossRef]
  19. Jang, W.J.; Shim, J.O.; Kim, H.M.; Yoo, S.Y.; Roh, H.S. A review on dry reforming of methane in aspect of catalytic properties. Catal. Today 2019, 324, 15–26. [Google Scholar] [CrossRef]
  20. Souentie, S.; Athanasiou, M.; Niakolas, D.K.; Katsaounis, A.; Neophytides, S.G.; Vayenas, C.G. Mathematical modeling of Ni/GDC and Au–Ni/GDC SOFC anodes performance under internal methane steam reforming conditions. J. Catal. 2013, 306, 116–128. [Google Scholar] [CrossRef]
  21. Takahashi, Y.; Shiratori, Y.; Furuta, S.; Sasaki, K. Thermo-mechanical reliability and catalytic activity of Ni-Zirconia anode supports in internal reforming SOFC running on biogas. Solid State Ionics 2012, 225, 113–117. [Google Scholar] [CrossRef]
  22. Shiratori, Y.; Tuyen, T.; Takahashi, Y.; Taniguchi, S.; Sasaki, K. Highly Efficient Biomass Utilization with Solid Oxide Fuel Cell Technology. In Renewable Energy-Trends and Applications; InTech: Houston, TX, USA, 2011. [Google Scholar]
  23. Pillai, M.; Lin, Y.; Zhu, H.; Kee, R.J.; Barnett, S.A. Stability and coking of direct-methane solid oxide fuel cells: Effect of CO2 and air additions. J. Power Sources 2010, 195, 271–279. [Google Scholar] [CrossRef]
  24. Jones, C.M.; Persky, J.; Datta, R. Exploring Conditions That Enhance Durability and Performance of a Tubular Solid Oxide Fuel Cell Fed with Simulated Biogas. Energy Fuels 2017, 31, 12875–12892. [Google Scholar] [CrossRef]
  25. Qiu, P.; Sun, S.; Yang, X.; Chen, F.; Xiong, C.; Jia, L.; Li, J. A review on anode on-cell catalyst reforming layer for direct methane solid oxide fuel cells. Int. J. Hydrogen Energy 2021, 46, 25208–25224. [Google Scholar] [CrossRef]
  26. Lyu, Z.; Liu, Y.; Sciazko, A.; Komatsu, Y.; Tao, J.; Nakamura, A.; Hara, T.; Sun, K.; Shikazono, N.; Han, M. Co-Generation of Electricity and Chemicals From Methane Using Direct Internal Reforming Solid Oxide Fuel Cells. Adv. Energy Mater. 2024, 15, 2403869. [Google Scholar] [CrossRef]
  27. Lanzini, A.; Leone, P.; Guerra, C.; Smeacetto, F.; Brandon, N.P.; Santarelli, M. Durability of anode supported Solid Oxides Fuel Cells (SOFC) under direct dry-reforming of methane. Chem. Eng. J. 2013, 220, 254–263. [Google Scholar] [CrossRef]
  28. Papadam, T.; Goula, G.; Yentekakis, I.V. Long-term operation stability tests of intermediate and high temperature Ni-based anodes’ SOFCs directly fueled with simulated biogas mixtures. Int. J. Hydrogen Energy 2012, 37, 16680–16685. [Google Scholar] [CrossRef]
  29. Jiang, S.P.; Zhang, S.; Da Zhen, Y.; Wang, W. Fabrication and Performance of Impregnated Ni Anodes of Solid Oxide Fuel Cells. In Progress in Nanotechnology; John Wiley & Sons, Inc.: Hoboken, NJ, USA, 2009; pp. 257–263. [Google Scholar] [CrossRef]
  30. Wang, W.; Qu, J.; Julião, P.S.B.; Shao, Z. Recent Advances in the Development of Anode Materials for Solid Oxide Fuel Cells Utilizing Liquid Oxygenated Hydrocarbon Fuels: A Mini Review. Energy Technol. 2019, 7, 33–44. [Google Scholar] [CrossRef]
  31. Mogensen, M.B.; Chen, M.; Frandsen, H.L.; Graves, C.; Hauch, A.; Hendriksen, P.V.; Jacobsen, T.; Jensen, S.H.; Skafte, T.L.; Sun, X. Ni migration in solid oxide cell electrodes: Review and revised hypothesis. Fuel Cells 2021, 21, 415–429. [Google Scholar] [CrossRef]
  32. Wang, W.; Jiang, S.P.; Tok, A.I.Y.; Luo, L. GDC-impregnated Ni anodes for direct utilization of methane in solid oxide fuel cells. J. Power Sources 2006, 159, 68–72. [Google Scholar] [CrossRef]
  33. Livermore, S.J.A.; Cotton, J.W.; Ormerod, R.M. Fuel reforming and electrical performance studies in intermediate temperature ceria-gadolinia-based SOFCs. J. Power Sources 2000, 86, 411–416. [Google Scholar] [CrossRef]
  34. Jiang, S.P.; Zhang, S.; Zhen, Y.D.; Koh, A.P. Performance of GDC-impregnated Ni anodes of SOFCs. Electrochem. Solid-State Lett. 2004, 7, A282. [Google Scholar] [CrossRef]
  35. Sun, C.; Stimming, U. Recent anode advances in solid oxide fuel cells. J. Power Sources 2007, 171, 247–260. [Google Scholar] [CrossRef]
  36. Shi, C.; Wang, S.; Ge, X.; Deng, S.; Chen, B.; Shen, J. A review of different catalytic systems for dry reforming of methane: Conventional catalysis-alone and plasma-catalytic system. J. CO2 Util. 2021, 46, 101462. [Google Scholar] [CrossRef]
  37. Niu, J.; Guo, F.; Ran, J.; Qi, W.; Yang, Z. Methane dry (CO2) reforming to syngas (H2/CO) in catalytic process: From experimental study and DFT calculations. Int. J. Hydrogen Energy 2020, 45, 30267–30287. [Google Scholar] [CrossRef]
  38. Kan, H.; Lee, H. Enhanced stability of Ni-Fe/GDC solid oxide fuel cell anodes for dry methane fuel. Catal. Commun. 2010, 12, 36–39. [Google Scholar] [CrossRef]
  39. Cesario, M.R.; Souza, G.S.; Loureiro, F.J.A.; Araújo, A.J.M.; Grilo, J.P.F.; Aouad, S.; Tidahy, H.L.; Macedo, D.A.; Fagg, D.P.; Gennequin, C.; et al. Synthesis of Co–Ni and Cu–Ni based-catalysts for dry reforming of methane as potential components for SOFC anodes. Ceram. Int. 2021, 47, 33191–33201. [Google Scholar] [CrossRef]
  40. Yentekakis, I.V. Open- and closed-circuit study of an intermediate temperature SOFC directly fueled with simulated biogas mixtures. J. Power Sources 2006, 160, 422–425. [Google Scholar] [CrossRef]
  41. Papaefthimiou, V.; Shishkin, M.; Niakolas, D.K.; Athanasiou, M.; Law, Y.T.; Arrigo, R.; Teschner, D.; Hävecker, M.; Knop-Gericke, A.; Schlögl, R.; et al. On the Active Surface State of Nickel-Ceria Solid Oxide Fuel Cell Anodes During Methane Electrooxidation. Adv. Energy Mater. 2013, 3, 762–769. [Google Scholar] [CrossRef]
  42. Niakolas, D.K.; Neofytidis, C.S.; Neophytides, S.G. Effect of Au and/or Mo doping on the development of carbon and sulfur tolerant anodes for SOFCs-A short review. Front. Environ. Sci. 2017, 5, 78. [Google Scholar] [CrossRef]
  43. Sapountzi, F.M.; Zhao, C.; Boréave, A.; Retailleau-Mevel, L.; Niakolas, D.; Neofytidis, C.; Vernoux, P. Sulphur tolerance of Au-modified Ni/GDC during catalytic methane steam reforming. Catal. Sci. Technol. 2018, 8, 1578–1588. [Google Scholar] [CrossRef]
  44. Ioannidou, E.; Neofytidis, C.; Sygellou, L.; Niakolas, D.K. Au-doped Ni/GDC as an Improved Cathode Electrocatalyst for H2O Electrolysis in SOECs. Appl. Catal. B Environ. 2018, 236, 253–264. [Google Scholar] [CrossRef]
  45. Neofytidis, C.; Ioannidou, E.; Sygellou, L.; Kollia, M.; Niakolas, D.K. Affecting the H2O electrolysis process in SOECs through modification of NiO/GDC; experimental case of Au-Mo-Ni synergy. J. Catal. 2019, 373, 260–275. [Google Scholar] [CrossRef]
  46. Vibhu, V.; Vinke, I.C.; Zaravelis, F.; Neophytides, S.G.; Niakolas, D.K.; Eichel, R.-A.; de Haart, L.G.J. Performance and Degradation of Electrolyte-Supported Single Cell Composed of Mo-Au-Ni/GDC Fuel Electrode and LSCF Oxygen Electrode during High Temperature Steam Electrolysis. Energies 2022, 15, 2726. [Google Scholar] [CrossRef]
  47. Ioannidou, E.; Neophytides, S.; Niakolas, D.K. Experimental clarification of the RWGS reaction effect in H2O/CO2 SOEC co-electrolysis conditions. Catalysts 2019, 9, 151. [Google Scholar] [CrossRef]
  48. Neofytidis, C.; Ioannidou, E.; Kollia, M.; Neophytides, S.; Niakolas, D. The promoting effect of Fe on Ni/GDC for the Solid Oxide H2O electrolysis. Int. J. Energy Res. 2020, 44, 10982–10995. [Google Scholar] [CrossRef]
  49. Zaravelis, F.; Sygellou, L.; Souvalioti, A.; Niakolas, D.K. Transition metals in Ni/GDC for the reversible solid oxide cell operation: Optimization of the Mo-Au-Ni synergy and further enhancement via substitution of Mo with Fe. Electrochim. Acta 2023, 453, 142343. [Google Scholar] [CrossRef]
  50. Zaravelis, F.; Niakolas, D.K. Enhancement of the intrinsic Ni/GDC activity under rSOC operation by means of Fe–Au doping: An electro-kinetic study. Int. J. Hydrogen Energy 2023, 48, 36663–36677. [Google Scholar] [CrossRef]
  51. Ioannidou, E.T.; Neophytides, S.G.; Niakolas, D.K. Ternary Fe- or Mo-Au-Ni/GDC as Candidate Fuel Electrodes for the Internal Dry Reforming of CH4: Physicochemical and Kinetic Investigation. Energies 2024, 17, 184. [Google Scholar] [CrossRef]
  52. Ioannidou, E.; Neophytides, S.G.; Niakolas, D.K. Au-Mo-Fe-Ni/CeO2 (Gd2O3) As Potential Fuel Electrodes for Internal CO2 Reforming of CH4 in Single SOFCs. ECS Trans. 2023, 111, 2473–2485. [Google Scholar] [CrossRef]
  53. Escudero, M.J.; Serrano, J.L. Individual impact of several impurities on the performance of direct internal reforming biogas solid oxide fuel cell using W-Ni-CeO2 as anode. Int. J. Hydrogen Energy 2019, 44, 20616–20631. [Google Scholar] [CrossRef]
  54. Schefold, J.; Brisse, A.; Poepke, H. Long-term Steam Electrolysis with Electrolyte-Supported Solid Oxide Cells. Electrochim. Acta 2015, 179, 161–168. [Google Scholar] [CrossRef]
  55. Schefold, J.; Brisse, A.; Poepke, H. 23,000 h steam electrolysis with an electrolyte supported solid oxide cell. Int. J. Hydrogen Energy 2017, 42, 13415–13426. [Google Scholar] [CrossRef]
  56. Jensen, S.H.; Hauch, A.; Hendriksen, P.V.; Mogensen, M.; Bonanos, N.; Jacobsen, T. A Method to Separate Process Contributions in Impedance Spectra by Variation of Test Conditions. J. Electrochem. Soc. 2007, 154, B1325–B1330. [Google Scholar] [CrossRef]
  57. Giotakos, P.I.; Neophytides, S.G. Physical modeling of the electrochemical impedance spectra for the O2 reduction reaction in HTPEM fuel cells’ cathodic electrochemical interface. Electrochim. Acta 2018, 292, 285–291. [Google Scholar] [CrossRef]
  58. Zhou, Y.; Zhang, W.; Kane, N.; Luo, Z.; Pei, K.; Sasaki, K.; Choi, Y.; Chen, Y.; Ding, D.; Liu, M. An Efficient Bifunctional Air Electrode for Reversible Protonic Ceramic Electrochemical Cells. Adv. Funct. Mater. 2021, 31, 2105386. [Google Scholar] [CrossRef]
  59. Nuggehalli Sampathkumar, S.; Aubin, P.; Couturier, K.; Sun, X.; Sudireddy, B.R.; Diethelm, S.; Pérez-Fortes, M.; Van Herle, J. Degradation study of a reversible solid oxide cell (rSOC) short stack using distribution of relaxation times (DRT) analysis. Int. J. Hydrogen Energy 2022, 47, 10175–10193. [Google Scholar] [CrossRef]
  60. Nechache, A.; Mansuy, A.; Petitjean, M.; Mougin, J.; Mauvy, F.; Boukamp, B.A.; Cassir, M.; Ringuedé, A. Diagnosis of a cathode-supported solid oxide electrolysis cell by electrochemical impedance spectroscopy. Electrochim. Acta 2016, 210, 596–605. [Google Scholar] [CrossRef]
  61. Knibbe, R.; Traulsen, M.L.; Hauch, A.; Ebbesen, S.D.; Mogensen, M. Solid Oxide Electrolysis Cells: Degradation at High Current Densities. J. Electrochem. Soc. 2010, 157, B1209–B1217. [Google Scholar] [CrossRef]
  62. Hauch, A.; Jensen, S.H.; Bilde-So̸rensen, J.B.; Mogensen, M. Silica Segregation in the Ni∕YSZ Electrode. J. Electrochem. Soc. 2007, 154, A619–A626. [Google Scholar] [CrossRef]
  63. Moon, D.J.; Ryu, J.W. Electrocatalytic reforming of carbon dioxide by methane in SOFC system. Catal. Today 2003, 87, 255–264. [Google Scholar] [CrossRef]
  64. Mogensen, D.; Grunwaldt, J.D.; Hendriksen, P.V.; Dam-Johansen, K.; Nielsen, J.U. Internal steam reforming in solid oxide fuel cells: Status and opportunities of kinetic studies and their impact on modelling. J. Power Sources 2011, 196, 25–38. [Google Scholar] [CrossRef]
  65. Koh, J.H.; Yoo, Y.S.; Park, J.W.; Lim, H.C. Carbon deposition and cell performance of Ni-YSZ anode support SOFC with methane fuel. Solid State Ionics 2002, 149, 157–166. [Google Scholar] [CrossRef]
  66. Matsui, T.; Kishida, R.; Kim, J.-Y.; Muroyama, H.; Eguchi, K. Performance Deterioration of Ni–YSZ Anode Induced by Electrochemically Generated Steam in Solid Oxide Fuel Cells. J. Electrochem. Soc. 2010, 157, B776–B781. [Google Scholar] [CrossRef]
Figure 11. SEM of the top (surface) side of the reduced 0.5Fe-1Au-Ni/GDC (A(i),A(ii)) and Ni/GDC (B(i),B(ii)) fuel electrode layers before [A(i),B(i), respectively] and after the IDRM stability operation [A(ii),B(ii), respectively].
Catalysts 15 00618 g011
Figure 12. Images of electrolyte-supported cells with NiO/GDC and 0.5Fe-1Au-NiO/GDC fuel electrodes.
Catalysts 15 00618 g012
Table 1. Rohm and Rpol values, extracted from the EIS Nyquist plots of Figure 2, under 28 and 284 mA cm−2, at 900 °C, for the cells with Ni/GDC, 1Au-Ni/GDC, 3Au-Ni/GDC, 0.5Fe-1Au-Ni/GDC and 0.5Fe-3Au-Ni/GDC.
Temperature: 900 °C
Applied Polarization28 mA cm−2284 mA cm−2
ResistanceRohm (Ω cm2)Rpol (Ω cm2)Rohm (Ω cm2)Rpol (Ω cm2)
Ni/GDC2.070.572.330.46
1Au-Ni/GDC1.070.441.140.31
3Au-Ni/GDC1.440.581.480.44
0.5Fe-1Au-Ni/GDC0.690.270.690.21
0.5Fe-3Au-Ni/GDC0.710.350.710.28
Table 2. Quantitative, elementary, mapping EDS analysis on the surface side of the used 0.5Fe-1Au-Ni/GDC (A(ii)) and Ni/GDC (B(ii)) fuel electrodes, after the IDRM stability tests.
Elementwt.% Concentration
0.5Fe-1Au-Ni/GDCNi/GDC
C0.91.6
Pt9.414.3
Ce34.736.1
Gd5.25.3
Ni43.133.7
O6.79.0
Disclaimer/Publisher’s Note: The statements, opinions and data contained in all publications are solely those of the individual author(s) and contributor(s) and not of MDPI and/or the editor(s). MDPI and/or the editor(s) disclaim responsibility for any injury to people or property resulting from any ideas, methods, instructions or products referred to in the content.

