Article

Polyurethane@CeO2 Nanozyme Core–Shell Fibrous Membranes for Enhanced Wound Healing via Balanced Redox Modulation

Research Center for Nano-Biomaterials, Analytical and Testing Center, Sichuan University, Chengdu 610064, China
*
Authors to whom correspondence should be addressed.
Catalysts 2025, 15(7), 617; https://doi.org/10.3390/catal15070617
Submission received: 28 April 2025 / Revised: 8 June 2025 / Accepted: 19 June 2025 / Published: 22 June 2025
(This article belongs to the Special Issue Advances in Enzymes for Industrial Biocatalysis)

Abstract

:
This study designed a polyurethane core–shell fiber (PU CSF) wound dressing, which achieved unique redox catalytic function by loading nanoceria (n-CeO2) nanozyme and effectively reduced potential side effects. The stability of ceria nanoparticles with superoxide dismutase (SOD) mimetic activity was optimized. Engineered PU CSFs with different doses of citrate-modified nanospheres (CeO2@PU CSFs) were successfully fabricated via electrospinning and showed excellent SOD-mimetic activity in reducing oxidative stress both in vitro and in vivo. Notably, low-dose nanoceria PU CSFs demonstrated advantages in promoting wound healing and reducing scar formation compared to high-dose and SOD-loaded groups (p < 0.05), despite lower reactive oxygen species (ROS) scavenging capacity (p < 0.001). Transcriptome analysis revealed distinct mechanisms in rat skin studies: the CeO2-loaded dressing systemically downregulated cell activation- and innate immunity-related genes (Fos, Trpm2, Cybb, and Nlrc4), while the SOD-loaded group specifically regulated inflammation mediated by oxidative stress (IL17a and Ccl20). The optimized core–shell structure and low-dose nanoceria provided balanced redox modulation, effectively protecting cells from oxidative damage while providing a multifunctional therapeutic platform for damaged wound healing.

1. Introduction

Skin is the largest human organ, but is frequently damaged [1]. According to the type of wound, various treatment methods and approaches are provided, including transplantation of skin or stem cells/cells [2], platelet therapy [3], wound dressing [4], instrumental-based therapy [5], and so on. In general, wound healing is a multifactorial physiological process involving coagulation, inflammation, proliferation, and remodeling [6,7], where the wound repairs from the inflammatory phase to the proliferative phase. The inflammatory phase is a critical stage leading to hemostasis and recruitment of the innate immune system, which protects us from invading pathogens and helps clear dead tissue [8]. It is well known that long-term inflammation is harmful and may lead to dysregulation of keratinocyte differentiation and activation, hindering the normal stage of wound healing and resulting in chronic wounds [9]. Severe inflammation is also associated with excessive scar formation [10]. Skin injury can trigger a series of events, among which reactive oxygen species (ROS) are produced around the wound and play a major role in resisting the invading pathogens [11]. However, excessive ROS can lead to oxidative stress [12,13], cellular dysfunction [14], and further cell apoptosis [15,16]. More crucially, the excessive ROS regulate and delay the transition of tissues from the inflammatory stage to the regenerative stage. When the inflammatory phase is prolonged, the wound will be in an inflamed state that delays the wound healing [17,18]. Therefore, many studies have suggested that the wound dressing should contain excellent antioxidant abilities to alleviate the excessive ROS in wound healing [19].
Naturally, ROS mainly come from mitochondria containing hydrogen peroxide (H2O2), superoxide anion (O2•−), hydroxyl radicals (OH), etc. [20]. McCord and Fridovich first introduced a metal-containing antioxidant enzyme named superoxide dismutase (SOD) in living organisms, which is an effective scavenger of free radicals. The primary role of SOD-catalyzed reactions is to convert superoxide radicals (O2•−) into H2O2 and oxygen (O2), playing a key role in antioxidant defense. Concurrently, other enzymes such as peroxidase and catalase participate in the catalytic processes, targeting different ROS to break down hydrogen peroxide (H2O2) into water and oxygen [21]. However, these biocatalysts face severe drawbacks, including poor stability, sensitivity, storage, and reusability, and are easily deactivated and difficult to preserve [22]. Metal nanozymes have emerged as promising alternatives to natural enzymes. Ceria nanoparticles (CeO2 NPs) are particularly notable among metal oxides due to their unique oxidation resistance and self-regeneration potential in redox-imbalance environments, which are beneficial to living systems [23]. CeO2 NPs are composed of cerium atoms bridged by oxygen atoms, where cerium can exist in two oxidation states (Ce3+ and Ce4+), facilitating redox reactions within the crystal lattice [24]. Due to the high oxygen mobility and diffusivity of CeO2 NPs’ surfaces, the conversion between the Ce (IV) and Ce (III) valence states is enhanced, and the resulting oxygen defects serve as catalytic sites for scavenging hydroxyl groups and free radicals [25], offering potential in mimicking antioxidant bioenzymes [26]. Although CeO2 NPs are excellent oxygen buffers in the treatment of disease caused by oxidative stress, studies also have revealed pro-oxidant cytotoxic effects related to the surface properties of nanoparticles. Various adverse effects have been reported both in vivo and in vitro, including pulmonary inflammation, cytotoxicity, genotoxicity, hepatotoxicity, and neurotoxicity [27]. Therefore, further studies should be undertaken to create a safe therapeutic carrier for the high-activity nanoparticle. The incorporation of nanoceria into polymers enables SOD-mimetic activity with low toxicity, offering an alternative catalyst for clinical application.
Numerous studies have demonstrated that polymeric materials containing CeO2 NPs at different concentrations can promote wound healing by catalyzing reactions to scavenge ROS, regulating inflammation and intracellular oxidation, reducing infection, and resisting oxidative damage [26]. In addition, previous studies of wound dressings have focused only on the free radical scavenging ability of CeO2 NPs and the apparent healing effect on skin defect treatment [23]. There was no systematic comparison of the free radical scavenging activities of enzyme-mimetic nanoceria with the natural SOD enzyme, nor was the molecular pathway resolved by gene expression profiling to reveal the differences in the mechanism of action of the two substances on skin wound healing. Although higher concentrations of CeO2 NPs exhibit stronger antioxidant effects, they are also associated with reduced biocompatibility and increased cytotoxicity risk. The challenge is not merely the quantity of nanoceria that can be utilized in wound treatment, but also how to evaluate its catalytic activity to re-establish the oxidative balance between ROS production and scavenging, which is critical for effective wound healing.
In this study, an engineered fiber embedded with nanoceria (n-CeO2) has been designed to regulate ROS levels in a redox-imbalance environment for wound healing through catalytic reactions. Ceria nanoparticles with various morphologies were optimized and chemically modified to stabilize their nanostructure, and their enzyme-mimetic effects were evaluated using superoxide dismutase (SOD) activity. Then, the core–shell fibers (named PU CSFs), based on polycaprolactone (PCL) as the core and polyurethane (PU) as the shell, were developed using coaxial electrospinning. Meanwhile, different doses of citrate-modified n-CeO2 nanoparticles were loaded in the PU matrix to fabricate the functionalized core–shell fibers (named CeO2@PU CSFs) for different levels of catalytic activity, while the bioenzyme SOD was also utilized to replace the n-CeO2 to prepare the positive control CSFs (named SOD@PU CSFs). The enzyme-mimetic functions of the engineered dressings were evaluated both in vitro and in vivo. Following the treatment of skin defects in rats, gene expression profiles were examined to investigate the regulatory mechanisms of different artificial- and biological enzyme-loaded dressings (Scheme 1).

2. Results

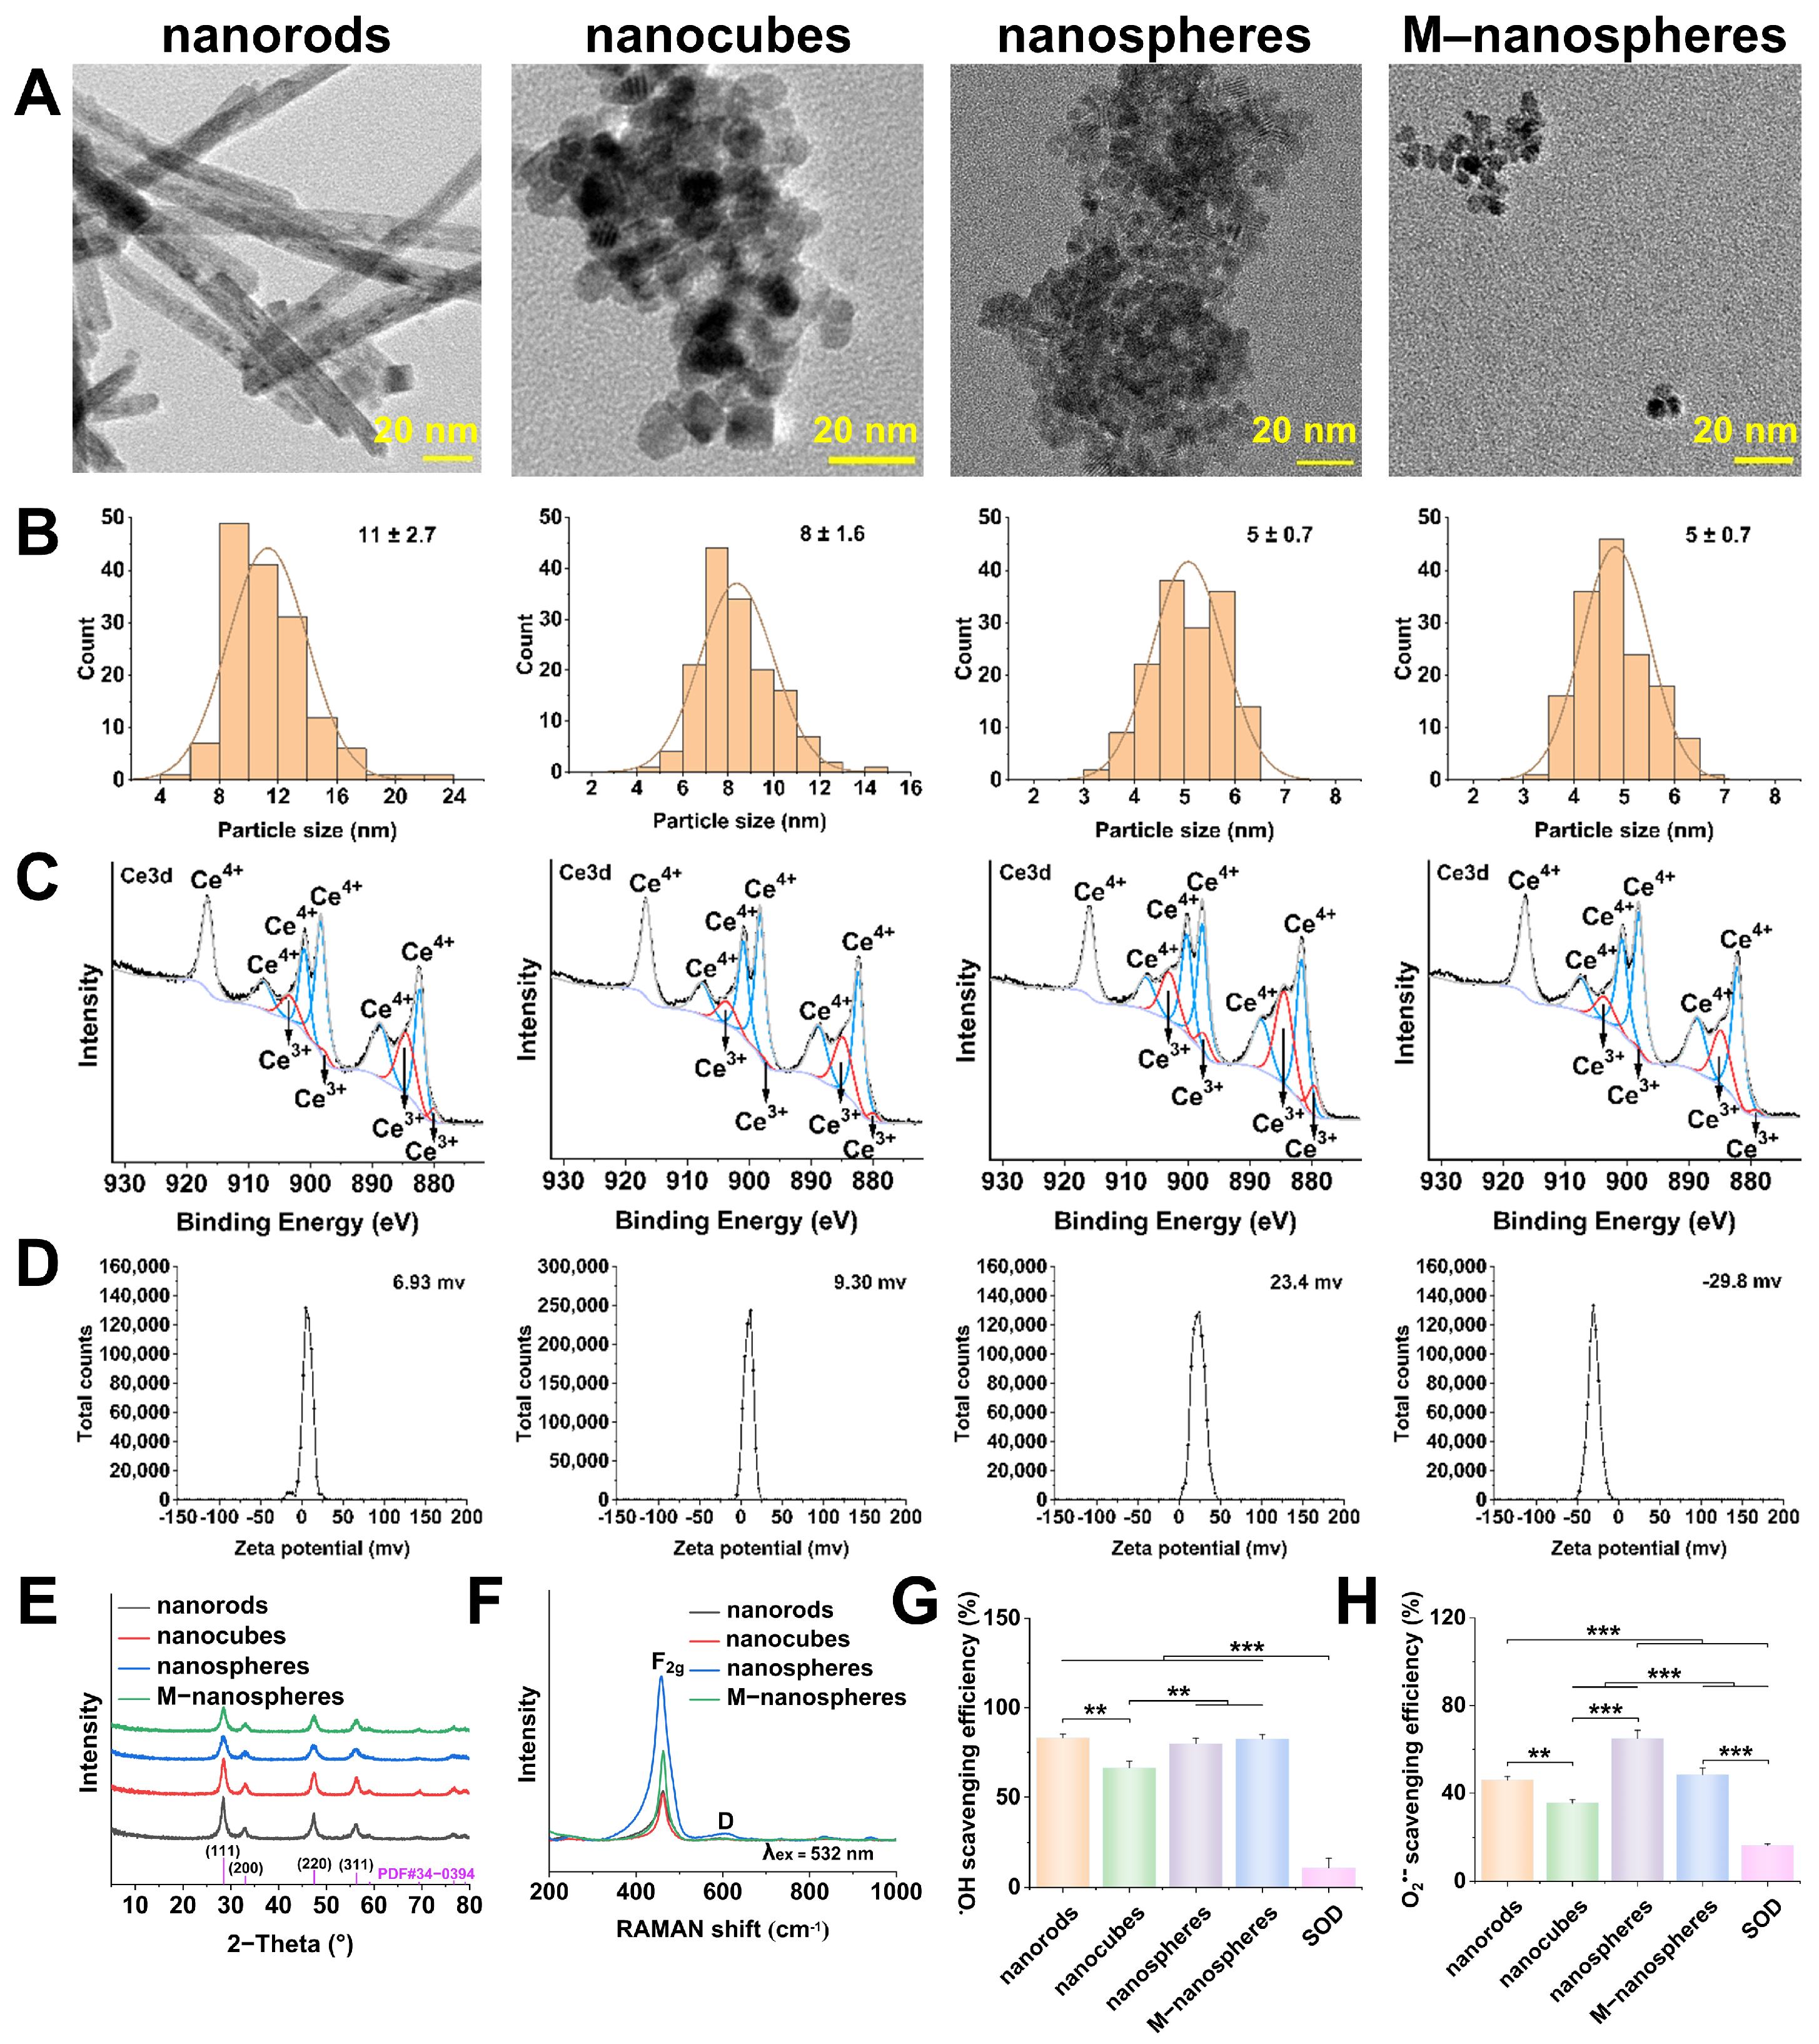
2.1. Optimized CeO2 Nanoparticles

The nanoparticles exhibited characteristic morphologies, including rod-shaped, cubic [28] (featuring distinct straight-edge angular structures), and spherical [29], as seen in Figure 1A. The average particle size determined from TEM images, the specific surface area measured by BET analysis, the Ce3+ content measured by XPS, and the intensity ratio of the two peaks at 600 cm−1 and 460 cm−1 (I600/I460) measured by Raman spectroscopy are summarized in Table 1. The average diameters of ceria nanocubes, nanospheres, and M-nanospheres were within the nano-scale range, while ceria nanorods exhibited an average width of ~11 nm (with lengths of ~200 nm), yielding an aspect ratio of 17 ± 5.5 (Table 1). In Figure 1E, the XRD pattern of all CeO2 nanoparticles confirm the fluorite structure, with the space group Fm3m consistent with JCDPS (No. 65-2795). The XRD patterns of the CeO2 nanoparticles exhibit characteristic peaks at 28.5°, 33.1°, 47.5°, and 56.3°, corresponding to the (111), (200), (220), and (311) crystal planes, respectively [29].
Owing to the unique redox catalytic activity derived from the reversible Ce3+/Ce4+ transition on the crystal surface, oxygen vacancies in CeO2 nanoparticles were characterized using XPS to determine their oxidation states. The Ce 3d spectra were assigned to CeO2, exhibiting a total of ten peaks, as shown in Figure 1C. The peaks marked by the red line at binding energies of 903, 897, 884, and 879 eV were attributed to Ce3+, whereas the peaks indicated by the blue line at 906, 900, 897, 888, and 881 eV correspond to Ce4+. The intensity of the Ce3+ peaks in nanospheres was significantly stronger compared to those in nanorods and nanocubes (Figure 1C), with a higher semi-quantitative content of 33.13% (Table 1). This phenomena may be attributed to the surface of ceria nanosphere crystals exhibiting a higher concentration of oxygen vacancies. However, the presence of minor impurity phases (such as Ce2O3) could potentially disrupt this correlation. Additionally, XPS detection of Ce3+ in CeO2 nanoparticles is not exclusively surface-specific, as Ce3+ signals can also arise from the bulk phase [29].
Zeta potential is a critical parameter for quantifying the surface charge characteristics of particles within colloidal dispersion systems. Higher absolute values of zeta potential are correlated with stronger electrostatic repulsion between particles, thereby enhancing the stability of the dispersion system [30]. The zeta potentials of ceria nanoparticles were measured, showing a consecutive increase in the order of nanocubes, nanorods, nanospheres, and M-nanospheres (Figure 1D). Notably, the value of zeta potential of the M-nanospheres reached the highest at 29.8 mv, indicating the greatest stability, which is beneficial for the synthesis of nanoparticles. The negative zeta potential of the M-nanospheres can be attributed to the negatively charged carboxylic acid groups from citric acid, which enable surface functionalization and enhance colloidal stability during nanocrystal synthesis, as demonstrated by zeta potential and FTIR analysis (Figure 1D and Figure S1).
Two main peaks were observed in the Raman spectra of all ceria nanoparticles in Figure 1F. The peak centered at 460 cm−1 is attributed to the triply degenerate F2g mode, a characteristic vibration of CeO2 that reflects its unique fluorite crystal structure. Raman spectroscopy confirmed the consistent presence of the characteristic peak at 460 cm−1 in different ceria crystallites, demonstrating the potential of enzyme-mimetic catalytic applications. The broad peak observed at approximately 600 cm−1 was attributed to the defect-induced (D) mode associated with oxygen vacancies resulting from the presence of Ce3+ ions [31]. The intensity ratio of the peaks at 600 cm−1 and 460 cm−1 (I600/I460) serves as an indicator of the relative oxygen vacancy concentration [32]. The I600/I460 ratio is higher in spherical nanoceria than in other morphologies (Table 1), indicating a greater concentration of oxygen vacancies. After modifying the nanospheres, the I600/I460 ratio decreased, which may indicate that sodium citrate occupied some oxygen vacancies on the surface of the crystals. The analysis of the Raman spectra confirmed the presence of oxygen vacancies on the surface of different nanoparticles, which were consistent with the findings from XPS (Table 1 and Figure 1C).
The FTIR spectra of the nanospheres before and after citrate modification are shown in Figure S1. The broad peak at approximately 3400 cm−1 is consistent with the stretching vibration of hydroxyl groups. The peaks at 1589 and 1381 cm−1 are attributed to the antisymmetric and symmetric stretching vibrations of carboxyl groups, respectively, thereby confirming the successful binding of citric acid to the nanospheres’ surface [33].
Oxidative stress represents an imbalance between oxidative and antioxidant effects in the body, where ROS are critical environmental signals that can program site-specific cellular behavior [34]. To evaluate the antioxidant properties of CeO2 nanoparticles with varying morphologies, the hydroxyl radicals (OH) generated by the Fenton reaction were used to mimic the effects of intracellular ROS. The quantitative results of OH scavenging efficiency are shown in Figure 1G. It is noteworthy that the nanospheres and nanorods exhibited a significantly enhancement in their OH scavenging effect, achieving efficiencies of 80.06 ± 2.81% and 83.26 ± 2.01%, respectively. These values represent improvements of 1.20 and 1.25 times compared to the nanocubes group. As shown in Figure 1G, there was no statistically significant difference in the scavenging efficiency of the nanospheres before and after modification. Although sodium citrate modification can occupy some oxygen vacancies on the nanospheres, it may reduce their ability to scavenge free radicals. However, other experimental results also suggest that citrate functions as a OH scavenger [35]. At the same time, the OH scavenging efficiency of SOD is notably low, which may be attributed to the specific reaction characteristics of SOD. The quantified results of O2•− scavenging efficiency are shown in Figure 1H. The results showed that the nanospheres significantly enhanced the scavenging efficiency of O2•−, achieving 64.99 ± 3.66%, which was 1.41 and 1.83 times higher than that of nanorods and nanocubes, respectively. Different from the OH generation, the scavenging efficiency of O2•− by the M-nanospheres decreased to 48.43 ± 2.99%, which was significantly lower than that of the nanospheres (p < 0.001) in Figure 1H. After citrate modification, some oxygen vacancies on the nanospheres were occupied, leading to a reduction in catalytic activity. Meanwhile, the O2•− scavenging efficiency of natural SOD was 16.48 ± 0.62%.
The M-nanospheres demonstrated superior dispersibility in the polyurethane matrix compared to unmodified nanospheres, as evidenced by SEM and EDS mapping (Figure 2D–I and Figure S2). The uniform distribution of M-nanospheres effectively prevented aggregation during electrospinning, resulting in more homogeneous fiber morphology. The enhanced dispersion stability of M-nanospheres makes them ideal candidates for fabricating composite membranes with optimal catalytic performance (Figure 2O,P). Based on the above results, M-nanospheres were selected for the fabrication of engineered fibrous dressings, owing to their stable production process and superior OH scavenging efficiency.

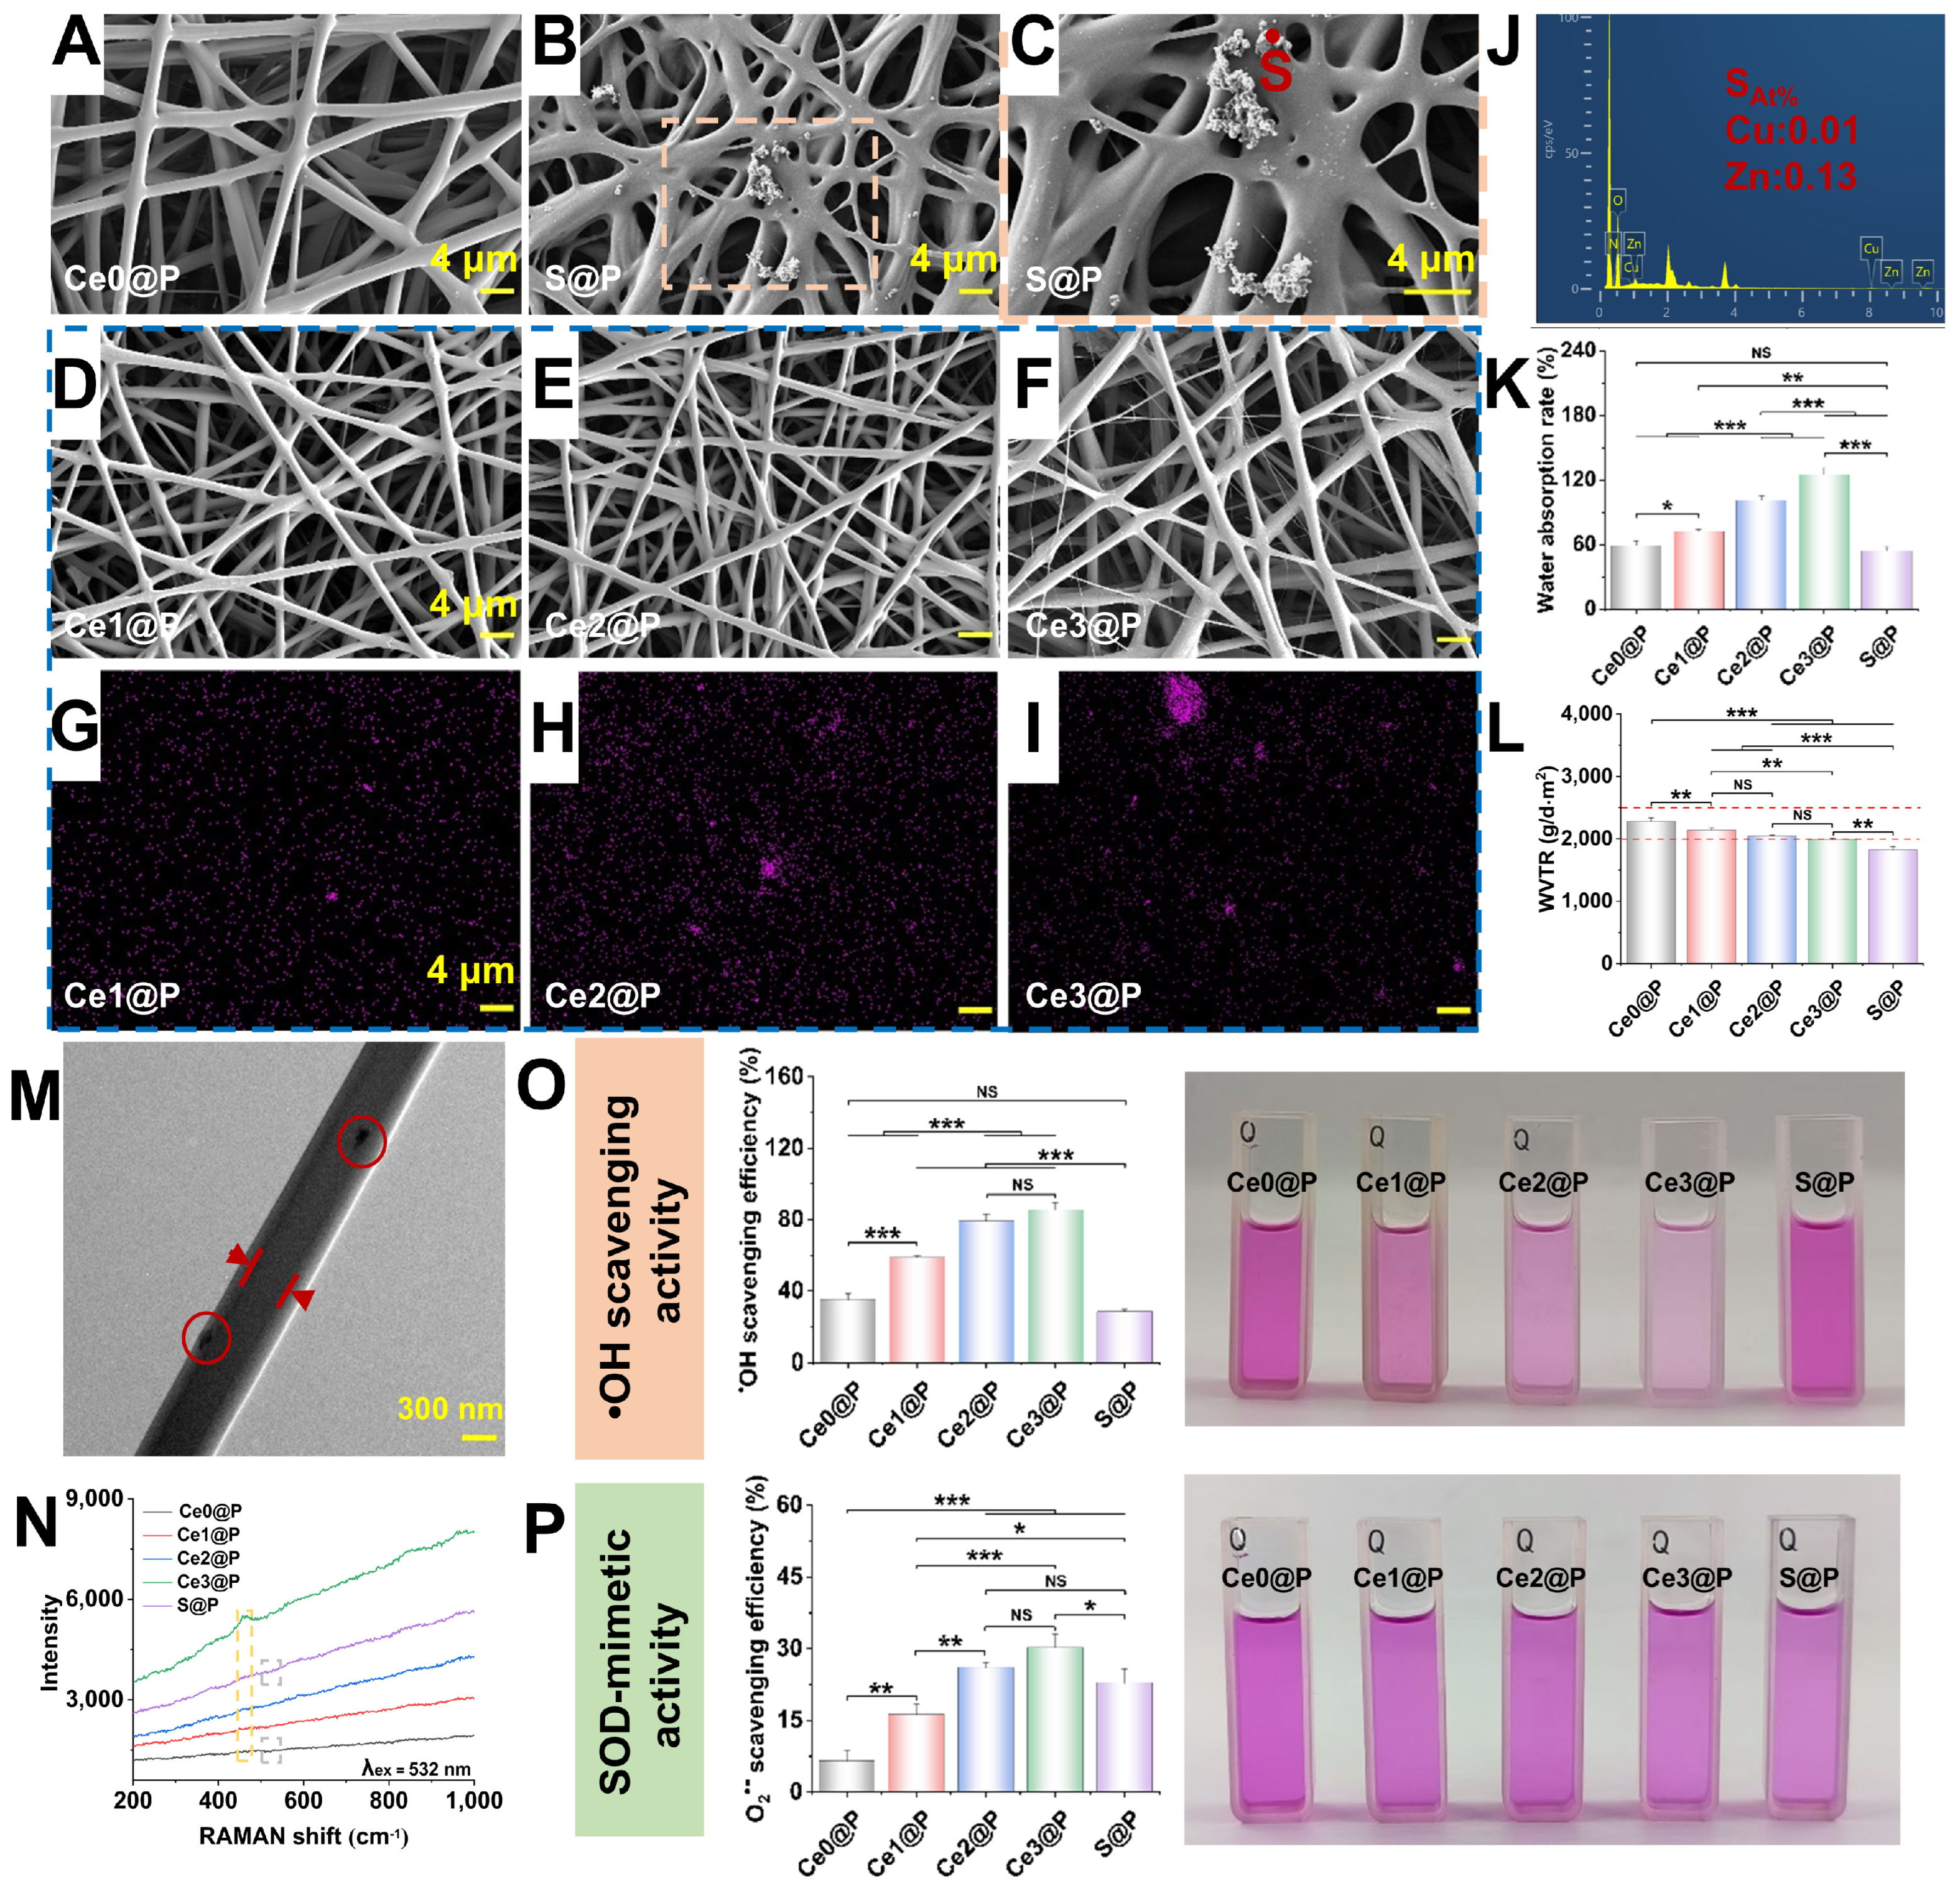
2.2. Characterization of Engineered PU CSFs

The morphology of the PU CSF membranes is shown in SEM images. The fibrous structures exhibit uniformity and are randomly distributed, as shown in Figure 2A–F. The average diameter of filaments in the three Ce@P groups ranged from 1.12 to 1.16 μm, which was not affected by the addition of CeO2 nanoparticles at varying doses, with no significant differences observed (Figure S3). At the same time, the diameters of the CeO2-free membranes (Ce0@P and S@P groups) showed no significant differences between the groups, although they were slightly larger than those CeO2-loaded groups (Figure S3).
Superoxide dismutase is a Cu/Zn-SOD variant that originates from bovine erythrocytes. As the positive control group, the SOD loading process did not alter the fiber structure, and enzyme-like patches were observed on the surface of the S@P membrane (Figure 2B,C). The EDS analysis of the SEM image revealed that the atomic ratios of Cu and Zn in the attachment were 0.01 and 0.13, respectively (Figure 2C,J). In contrast, no significant atomic content of these elements was detected in the matrix material, indicating that Cu/Zn SOD had been successfully adsorbed onto the fibrous membrane. EDS surface scans of SEM images showed that the Ce element (violet) was uniformly distributed on the surfaces of all three Ce@P groups, as seen in Figure 2G–I. With the increase of M-nanosphere loading, cerium aggregation was observed in certain areas (Figure 2H), with the most severe aggregation occurring at a loading of 15% (Figure 2I). High-resolution TEM imaging of Ce1@P revealed a distinct core–shell structure fabricated via coaxial electrospinning, with nanoceria predominantly localized in the shell region near the fiber surface (red circles in Figure 2M).
Raman spectroscopy confirmed the successful incorporation of M-nanospheres into the fiber matrix, as evidenced by the appearance of the distinct F2g characteristic peaks of ceria nanoparticles in the range of 440–480 cm−1, which enhanced with increasing nanoparticle loading (Figure 2N) [31]. However, the characteristic vibrational peaks of the S-S bond were not observed in the 500–550 cm−1 range (Figure 2N), likely because its low loading concentration fell below the detection limit of the instrument.
The electrospinning methodology for fabricating a stable dressing is evaluated based on preliminary experiments of Ce3@P through different electrospinning techniques. The digital images showed that the single electrospun films, prepared via single-electrospinning, presented severe shrinkage after soaking in aqueous solution for 24 h (Figure S4). When contraction and deformation occurred in the single-fiber films, the core–shell structure of the fibrous membrane remained stable after soaking. Therefore, engineered PU-based CSFs have been fabricated via coaxial electrospinning for advanced wound dressing applications.
In wound healing, the water absorption capability of the membrane is the fundamental property for wound dressing, enabling the absorption of wound exudate and reducing possible infection [37]. After 24 h of soaking, the water absorption ratios of the three Ce@P groups (Ce1@P, Ce2@P, and Ce3@P) increased significantly with the increasing nanoceria content compared to the Ce-free group (Ce0@P, from p < 0.05 to p < 0.001). No significant difference was observed in the S@P group (Figure 2K). The different absorption ratios can be attributed to the high specific surface area and enhanced surface activity of cerium oxide nanoparticles, which enable them to adsorb a greater number of water molecules, thereby increasing the water absorption rate of the membrane.
The permeation of water vapor also is a critical parameter of skin dressing, so the water vapor transmission rate (WVTR) was evaluated for gas exchange and controlled evaporation, both of which can accelerate wound healing. The WVTRs of the different composite fiber membranes are shown in Figure 2L. The WVTRs of the PU CSF membranes were 2282.97 ± 53.94 g/m2/d (Ce0@P), 2143.18 ± 33.78 g/m2/d (Ce1@P), and 2047.30 ± 12.27 g/m2/d (Ce2@P), which could effectively prevent wound dehydration according to previous studies [36]. However, the Ce3@P and S@P groups had rates of 1988.07 ± 19.70 g/m2/d and 1826.16 ± 49.06 g/m2/d, respectively, both of which were lower than the effective rate range of 1999.2–2500.8 g/m2/d [36]. Therefore, the Ce@P fiber membranes are expected to sustain an optimal level of moisture around the wound. Thermogravimetric sintering experiments were conducted on the engineered PU CSFs, and their weight loss rates were in the range of 93 to 95% (Figure S5). As the ceria content increases, the rate of weight loss gradually decreases.
The antioxidant properties of the engineered PU CSFs were evaluated using the Fenton reaction to determine the scavenging efficiency against hydroxyl radicals (OH) and superoxide anions (O2•−). In Figure 2O, the quantified data obtained from the colored Fenton solution showed that a higher loading of nanoceria in the engineered dressings led to a significant increase in the scavenging efficiency of OH. The scavenging efficiencies of the Ce2@P and Ce3@P groups were 79.25 ± 3.53% and 85.43 ± 4.26%, with no statistical difference, which were 1.35 times and 1.45 times significantly higher than that of Ce1@P group (p < 0.001). Significantly higher values were observed in the three Ce-loaded groups compared to the enzyme group (S@P, p < 0.001), indicating the superior performance of the Ce-loaded membranes in antioxidant activity. The values of the S@P group and the Ce-free group (Ce0@P) are similar (NS), suggesting that the SOD enzyme does not directly react with hydroxyl radicals.
However, the values of SOD-mimetic activity displayed distinct changes in response to O2•−, with the enzyme-mimetic activity being tested through the O2•− scavenging efficiency of different engineered PU CSFs. Figure 2P demonstrates that the SOD-mimetic activity was significantly promoted with the incremental addition of nanoceria from the Ce0@P to Ce2@P groups (p < 0.01), showing a similar increasing trend to the OH scavenging data presented above (Figure 2O). Remarkably, no significant difference was observed among the three groups (Ce2@P, Ce3@P, and S@P groups), indicating that the two Ce-loaded groups exhibited enzymatic activity similar to that of the S@P group.

2.3. In Vitro Experiments Regulated by Engineered PU CSFs

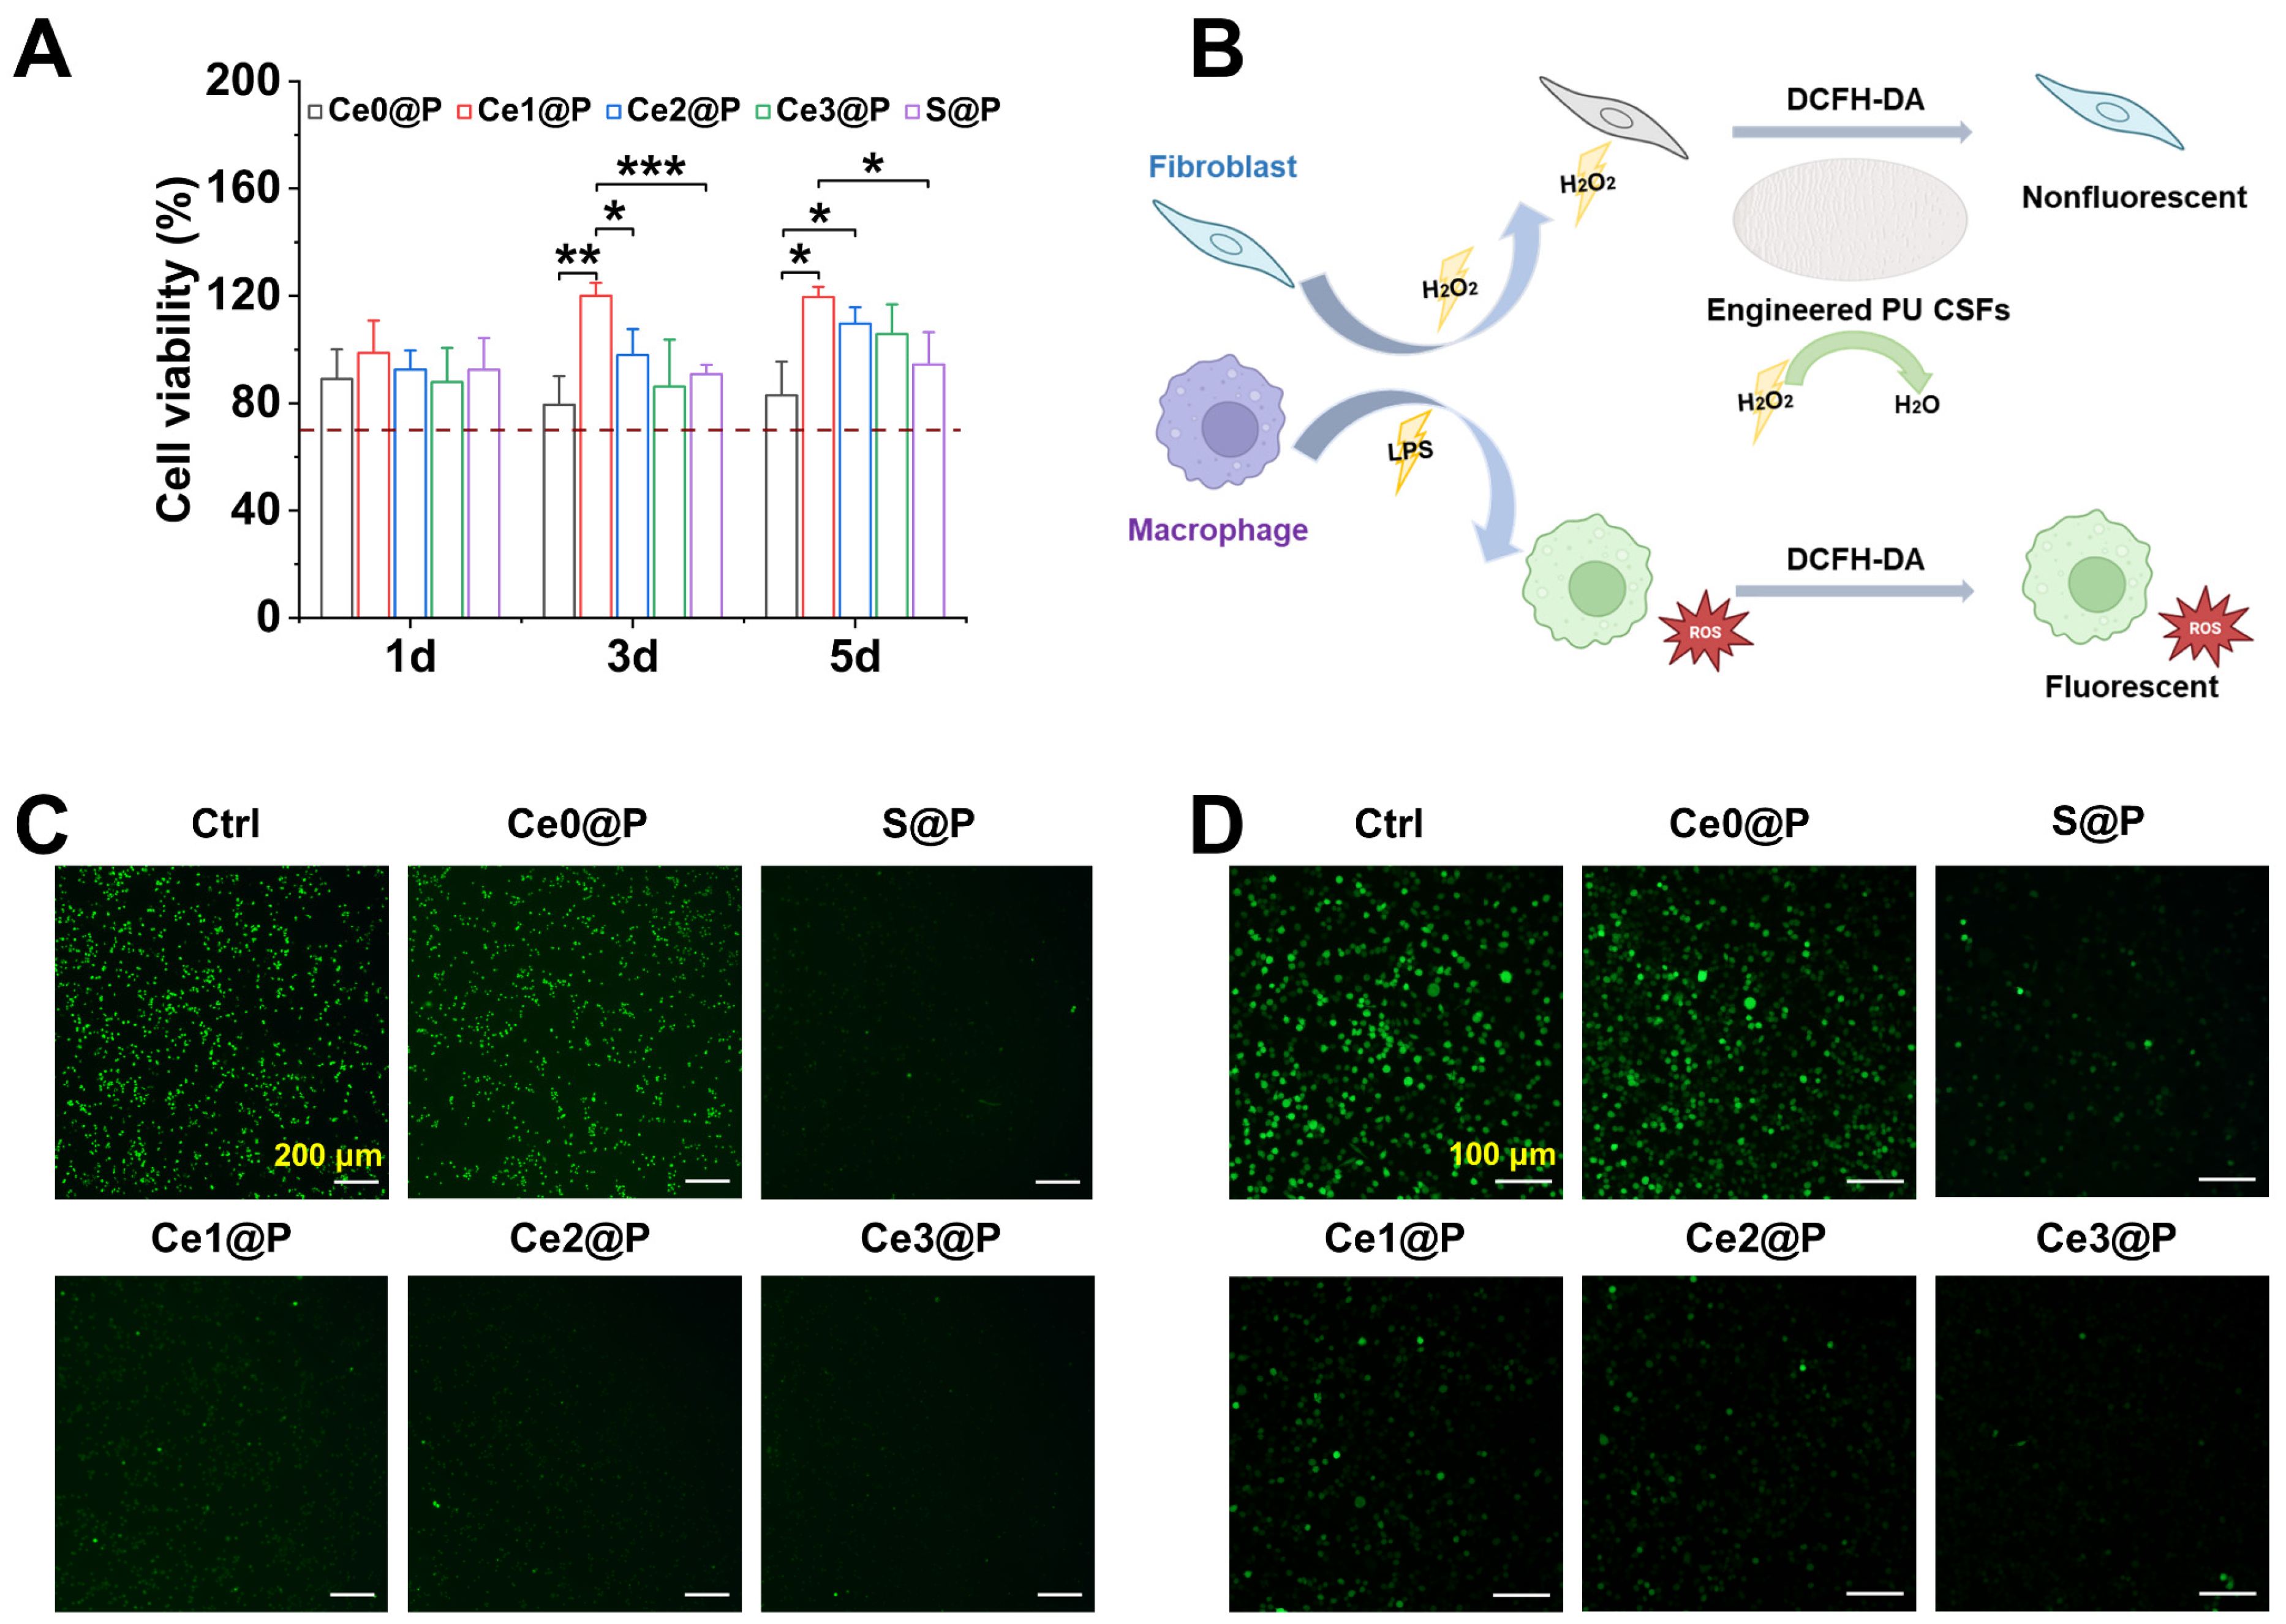
2.3.1. Cellular Compatibility

Despite the excellent anti-inflammatory properties of CeO2 nanoparticles, high doses of nanoceria can lead to increased toxicity in living systems, which is related to the surface Ce3+ content, by elevating oxidative stress and inflammation [38]. Therefore, cytotoxicity is assessed through cell viability assays using the CCK-8 method. The CCK-8 results indicated that the viability of L929 cells did not significant differ among the Ce0@P, Ce2@P, Ce3@P, and S@P groups after 1 and 5 days of culture (Figure 3A). However, cells cultured with Ce1@P showed significant higher proliferation compared to the other groups after 3 and 5 days (p < 0.05 or p < 0.001), which may be attributed to the optimal concentration of nanoceria in the Ce1@P group. The results from all groups demonstrated that cell viability exceeded the biocompatibility requirement of 70% (Figure 3A and Figure S6) in ISO 10993-5 [39].

2.3.2. Cellular ROS Scavenging Activity

ROS act as a critical inflammatory mediator under pathological conditions. Excessive ROS generation and sustained oxidative stress can cause cellular and tissue damage [40]. The schematic diagram in Figure 3B depicts the suppression of intracellular ROS by the engineered membranes in various cultured cells, in order to reveal their antioxidative potential in vitro under inflammatory stimulation. According to the experimental protocol, RAW 264.7 cells were exposed to lipopolysaccharide (LPS) to induce inflammation, while L929 cells were cultured in a medium supplemented with H2O2 to establish an inflammatory environment. After stimulation of RAW 264.7 cells with LPS, the macrophages generated an environment with overexpressed ROS, evidenced by the strong green fluorescence observed in the Ctrl and Ce0@P groups via DCFH-DA staining (Figure 3C). When macrophages were incubated with membranes containing increasing amounts of nanoceria (excluding S@P), the fluorescence intensity of the Ce-loaded groups progressively diminished from Ce0@P to Ce3@P, demonstrating the potential of nanoceria to mitigate oxidative stress (Figure 3C). With the incorporation of nanoceria, the engineered membranes effectively scavenged cellularly generated ROS through redox catalytic reactions, achieving fluorescence levels comparable to those of enzymatic SOD in the S@P group (Figure 3C). These results demonstrate that incorporating nanoceria into the engineered Ce-loaded membranes (Ce@P groups) enhanced the elimination of cellular ROS through antioxidant defense, exhibiting free radical scavenging activity.
As shown in Figure 3D, L929 cells in the Ctrl and Ce0@P groups exhibited stronger fluorescence compared to those in the CeO2-loaded and SOD-loaded groups. The fluorescence intensity of the Ce0@P groups was similar to that of the Ctrl group, indicating that the polymer matrix did not have the ability to scavenge free radicals. The experimental results confirm that engineered membranes (Ce@P groups) effectively protect L929 cells from ROS-induced damage.

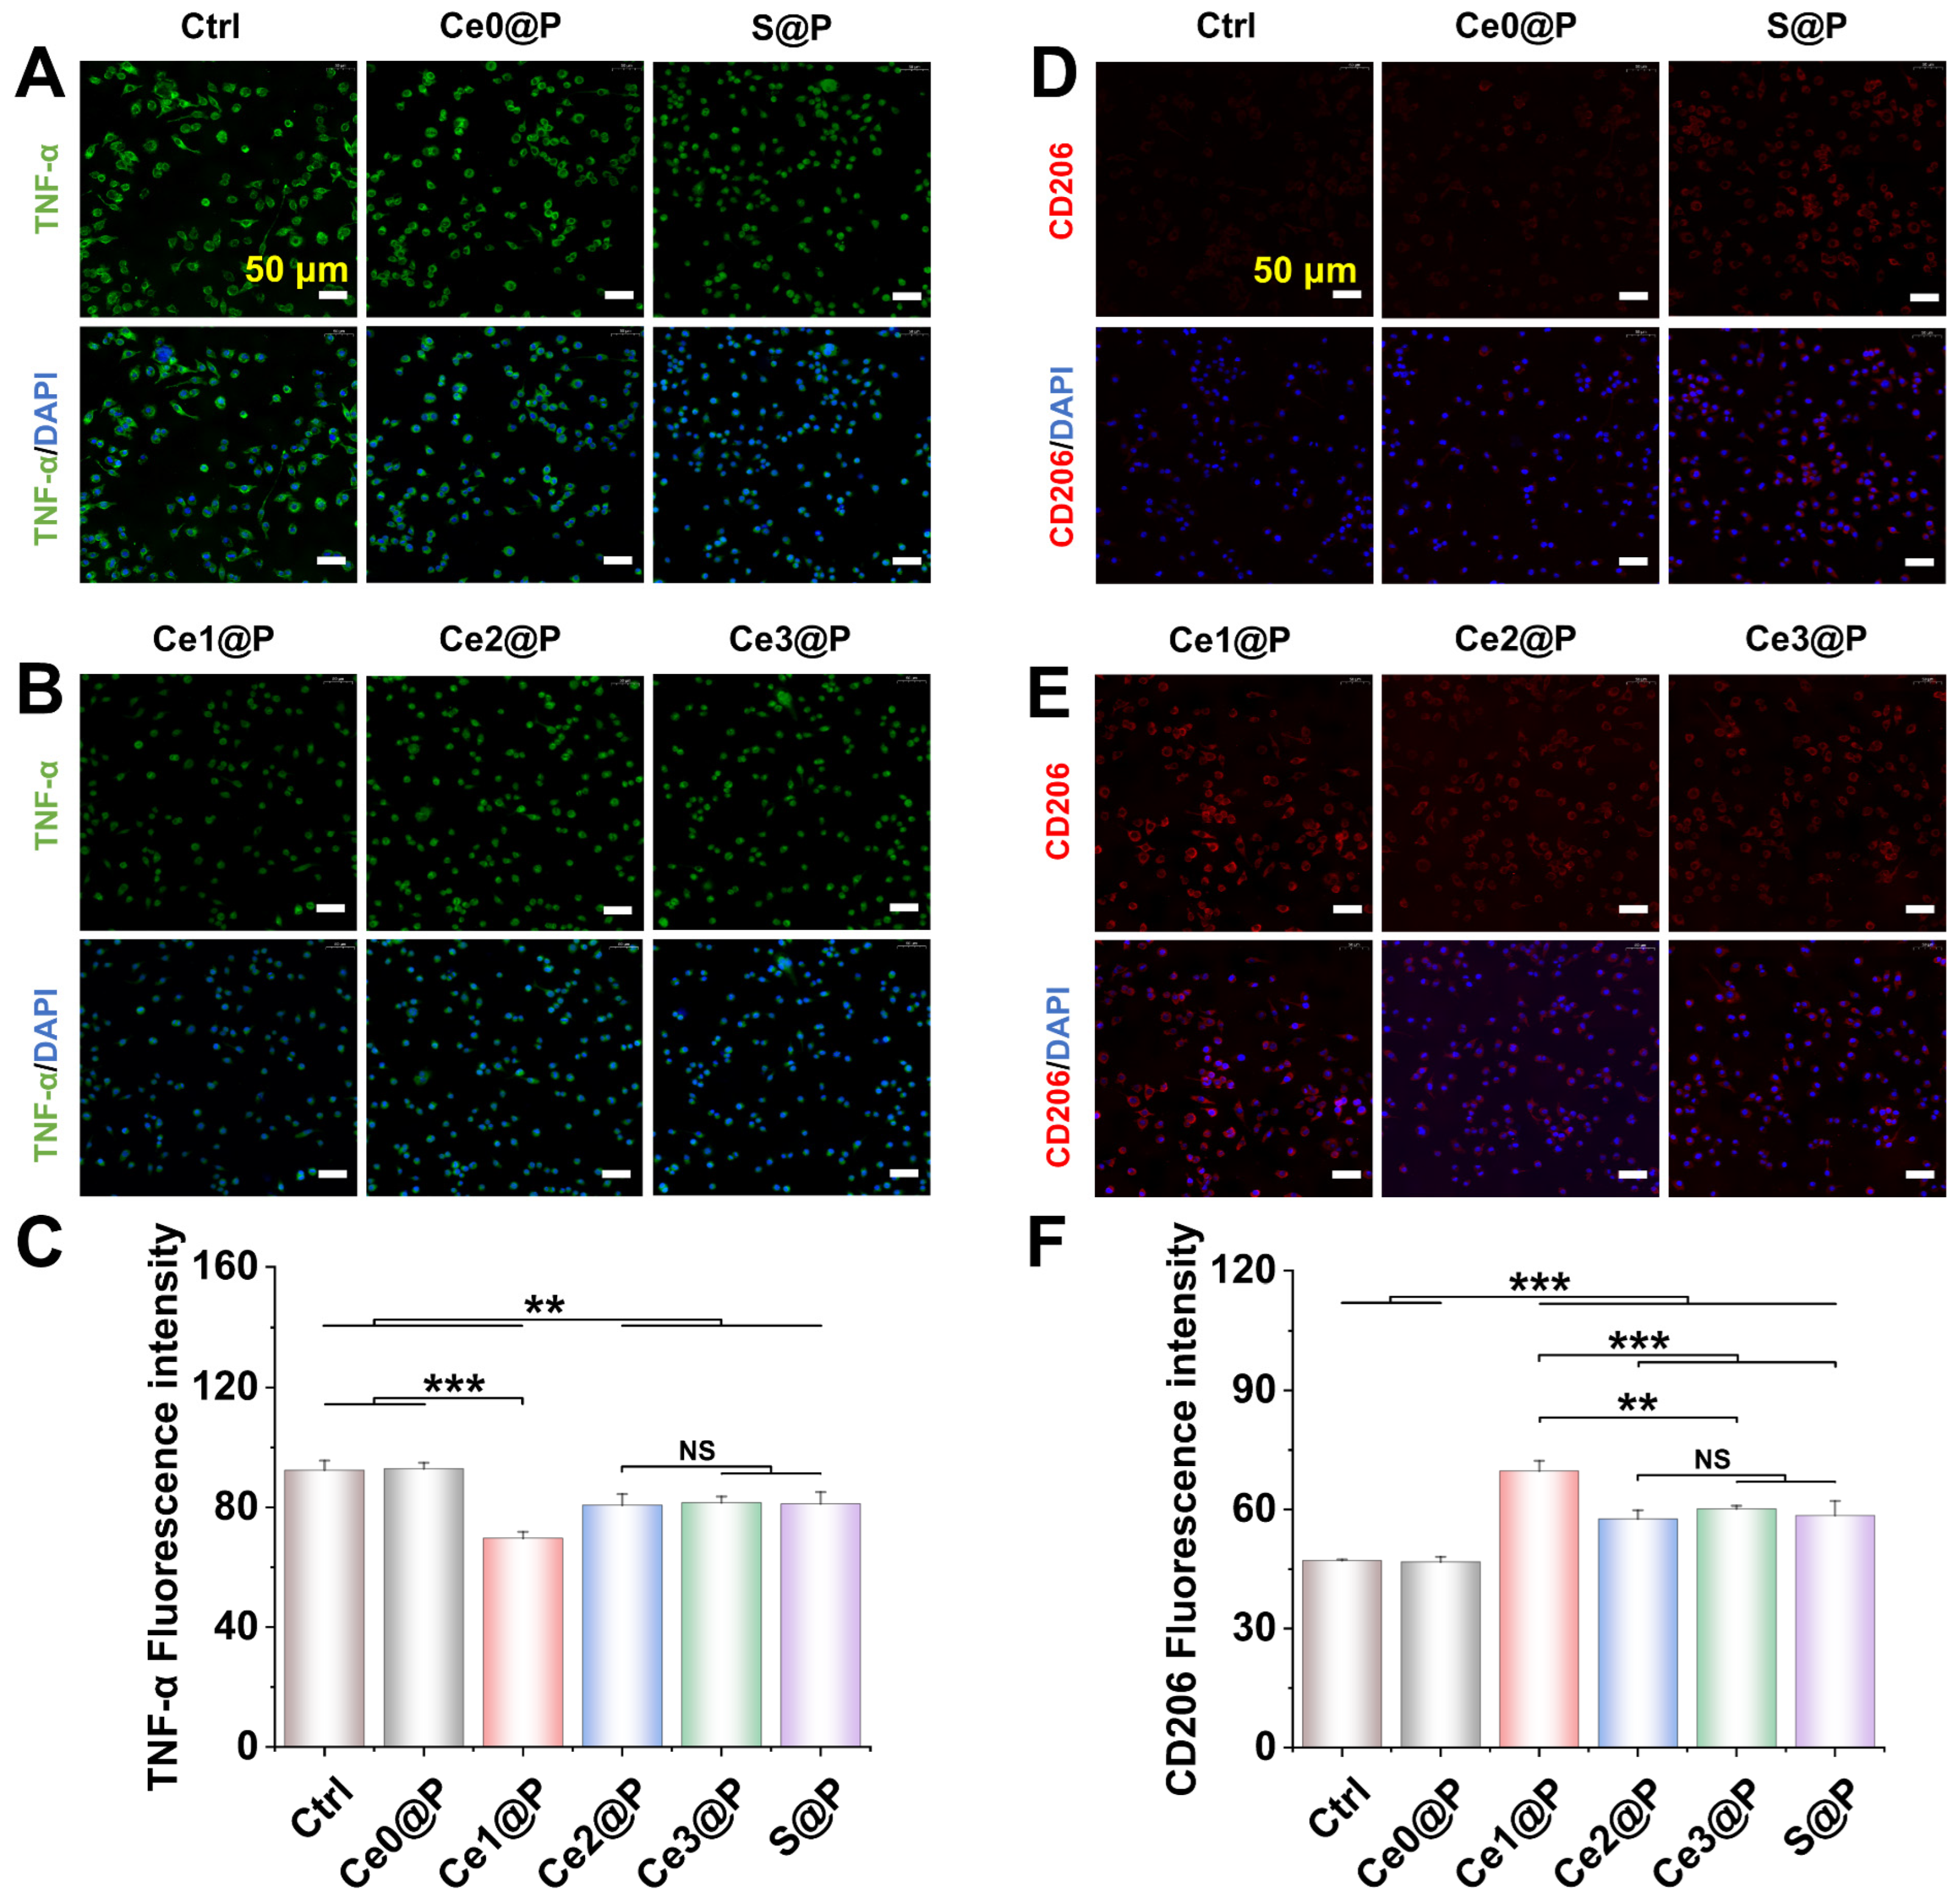
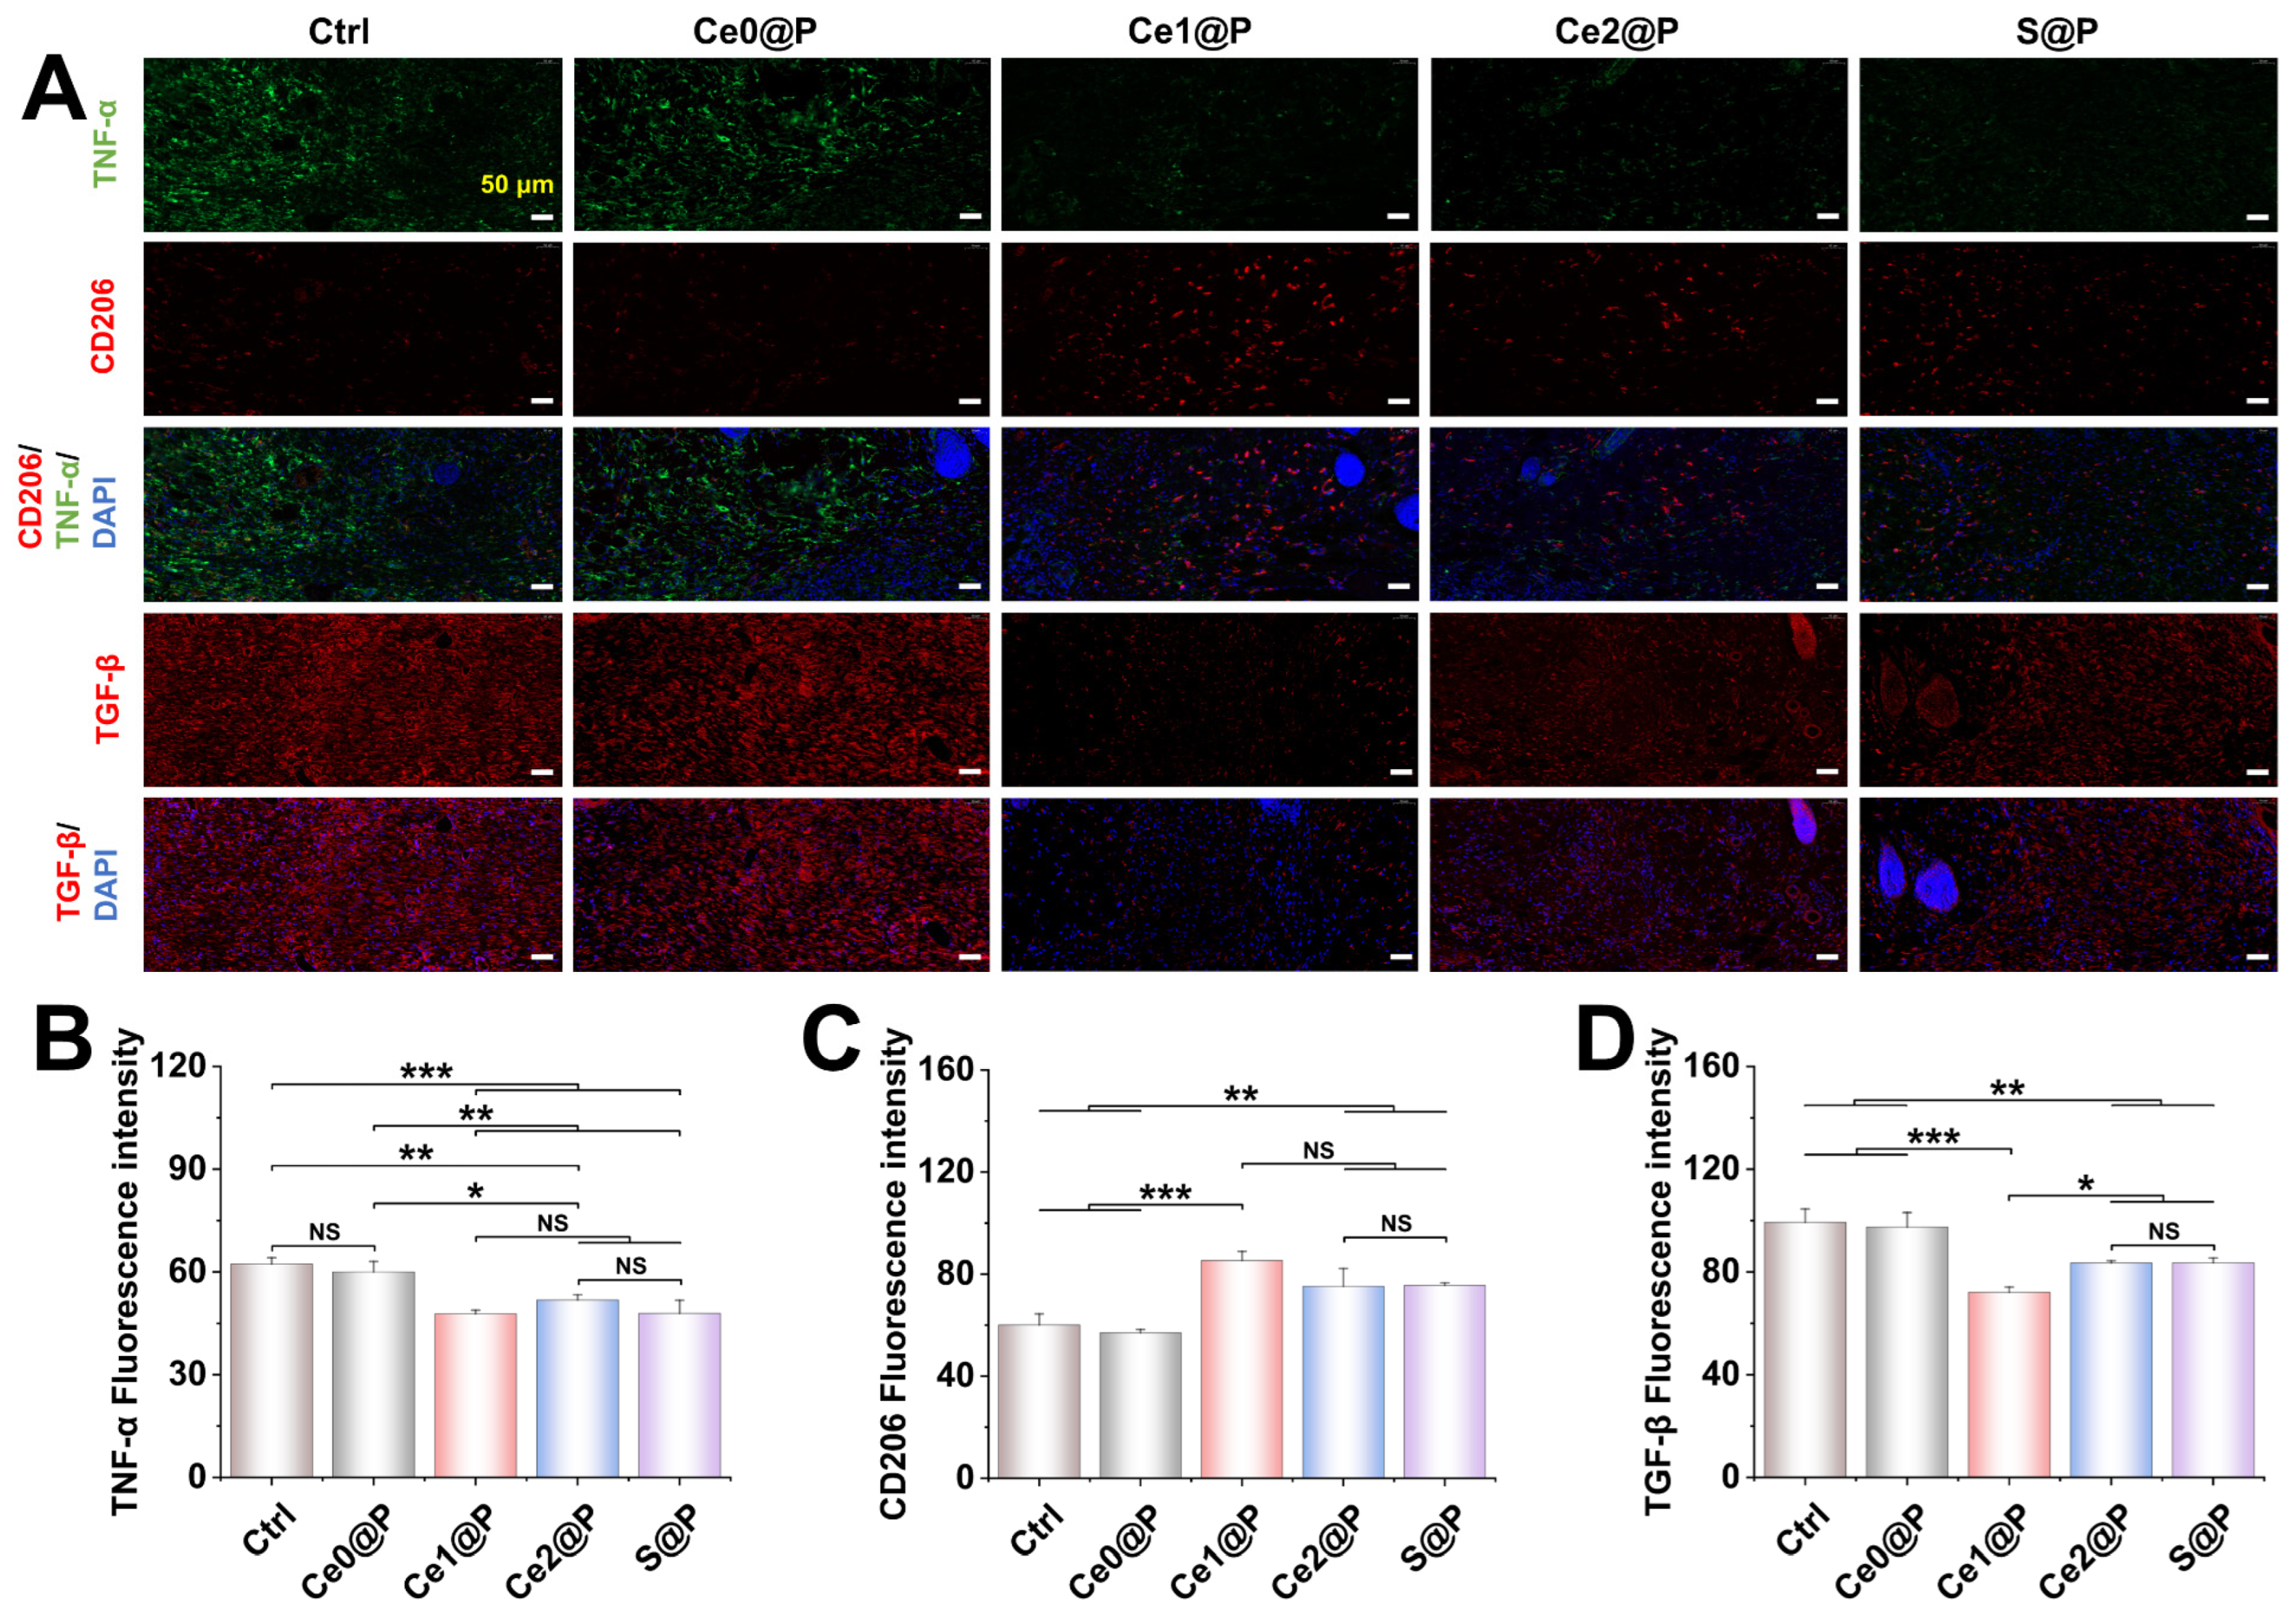
2.3.3. Engineered Membranes Regulating Macrophage Polarization

During the inflammatory phase of wound healing, macrophages play an important role by orchestrating local and systemic defense responses and secreting inflammatory cytokines that are essential for effective wound repair [41]. RAW 264.7 macrophages were selected to assess the anti-inflammatory efficacy of engineered PU CSFs, and LPS was utilized as a stimulant for pre-activation, whereas the potential of engineered PU CSFs to modulate macrophage polarization was assessed using immunofluorescence staining. TNF-α is used as a pivotal pro-inflammatory cytokine (M1 marker) that initiates the inflammatory cascade [42]. Conversely, CD206 serves as a M2 marker for alternatively activated anti-inflammatory macrophages [43].
Inflammatory activation revealed distinct macrophage polarization patterns in different groups (Figure 4). The Ctrl group showed significantly elevated TNF-α levels (an M1 marker; p < 0.001 or p < 0.01 compared to Ce1@P and Ce2@P) and reduced CD206 expression (an M2 marker; p < 0.001). Notably, Ce1@P exhibited superior immunomodulatory effects by markedly decreasing TNF-α (p < 0.01) and increasing CD206 (p < 0.001) relative to S@P. In contrast, Ce2@P did not differ significantly from S@P. Moreover, Ce1@P significantly suppressed TNF-α (p < 0.001 or p < 0.01) and enhanced CD206 (p < 0.001 or p < 0.01) compared to Ce0@P, Ce2@P, and Ce3@P, indicating effective promotion of M2 polarization. However, this trend was weakened at higher nanoparticle loading (Ce3@P), which also demonstrated reduced cytocompatibility (Figure 3A). Consequently, it was deemed unsuitable for further investigation and excluded from subsequent studies.

2.4. Wound Healing with Engineered PU CSFs

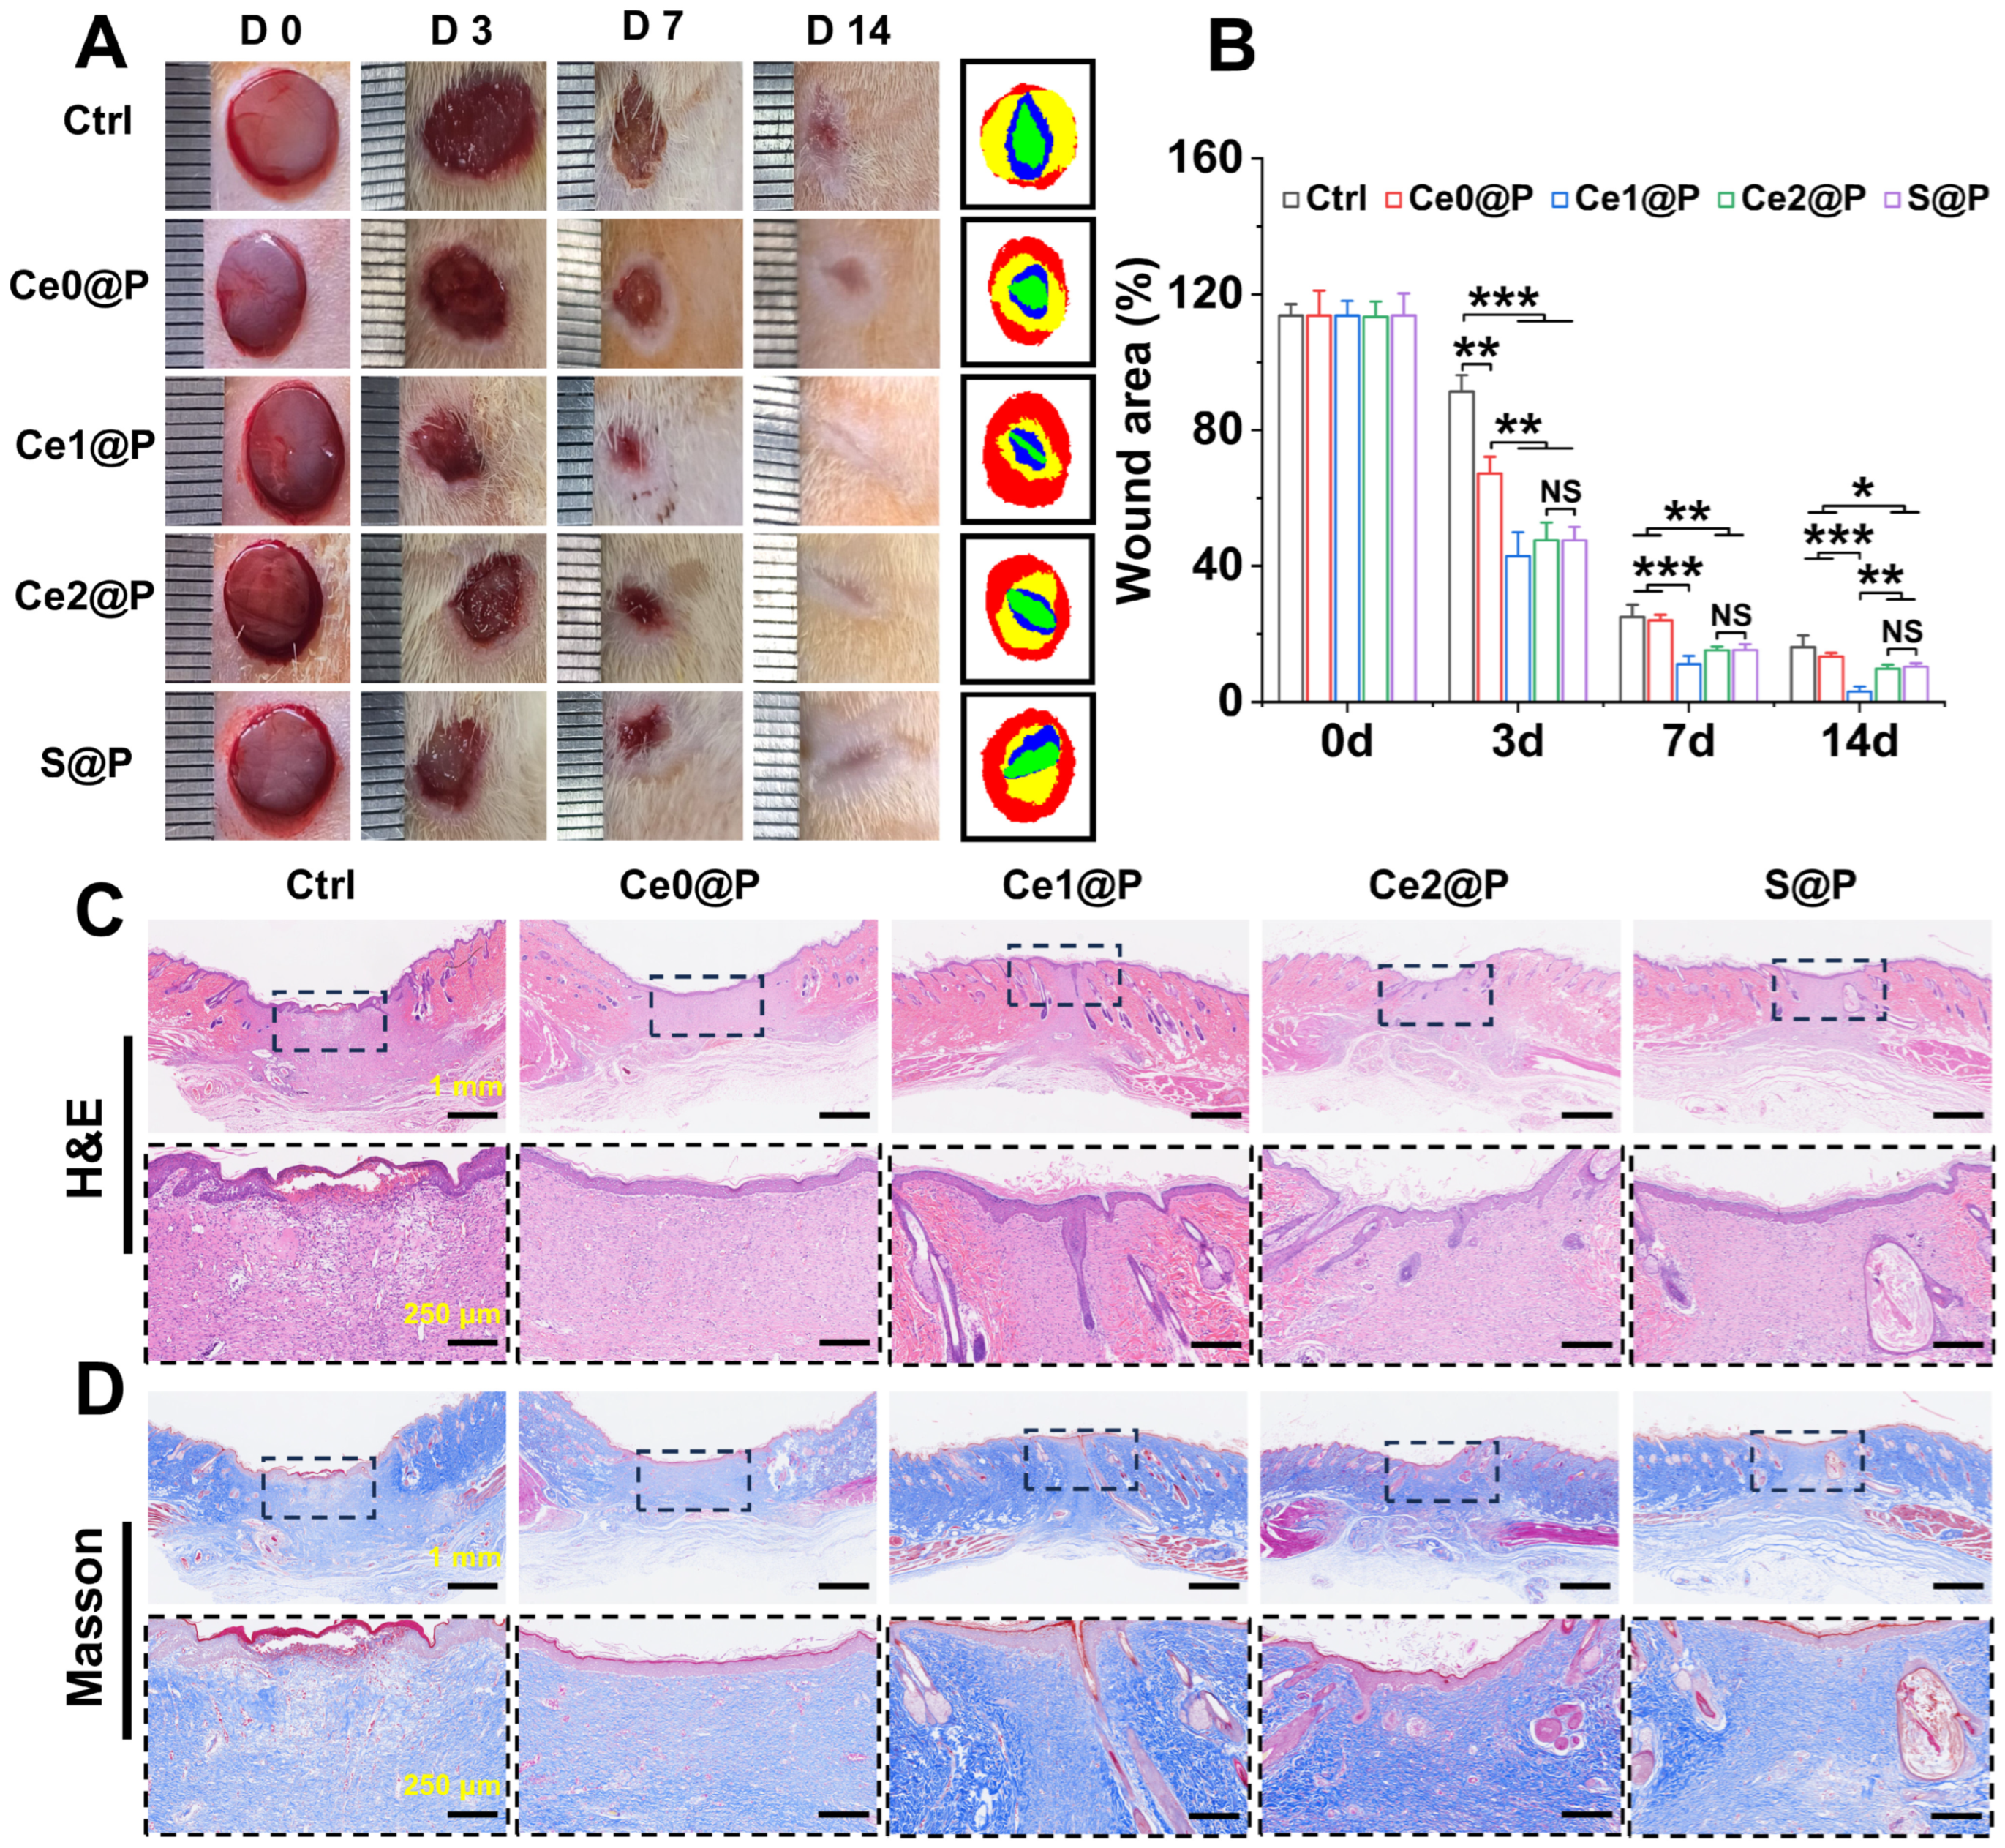
2.4.1. Wound Healing

The prepared engineered PU CSFs were implanted into rats with a wound to evaluate their efficacy in promoting wound closure. The wound treated with these PU CSF membranes exhibited dramatically accelerated wound closure rates compared with the blank groups (Ctrl), as seen in Figure 5A. Additionally, the progressions of the wound healing process are simulated with concentric circles drawn by ImageJ, fitting against the wound size at different time points. At 3 days, the groups treated with membranes showed a significant reduction in the wound size compared to the Ctrl group without a membrane. As shown in Figure 5B, the residual wound areas in three enzyme-loaded groups, including the two artificial enzyme Ce-loaded groups and the biological enzyme S@P group, showed a more significant reduction compared to both the Ctrl group (p < 0.001) and the Ce0@P group (p < 0.01). The three enzyme-loaded groups showed no statistically significant differences in the wound size ratios, which ranged from 42% to 47% relative to the original wound area. In contrast, the Ce0@P group exhibited a significantly higher wound size ratio of 67.21 ± 4.95% compared to these groups (p < 0.01). On the 7th day, wound healing improved significantly in the three enzyme-loaded groups (artificial enzyme Ce1@P and Ce2@P, as well as the biological enzyme S@P), with residual wound ratios markedly reduced to 11–15% compared to the Ctrl and Ce0@P groups (p < 0.01 or p < 0.001). The three enzyme-loaded groups exhibited no significant difference in wound healing after 7 days of treatment; however, a significant difference emerged by day 14. On the 14th day, the wounds in the Ce1@P group exhibited nearly complete healing, with a residual wound ratio of 3.04 ± 1.48%. The improved healing in the Ce1@P group was significantly better than that in both the Ce2@P and S@P groups (p < 0.01) and significantly greater compared to that in the Ctrl and Ce0@P groups (p < 0.001).

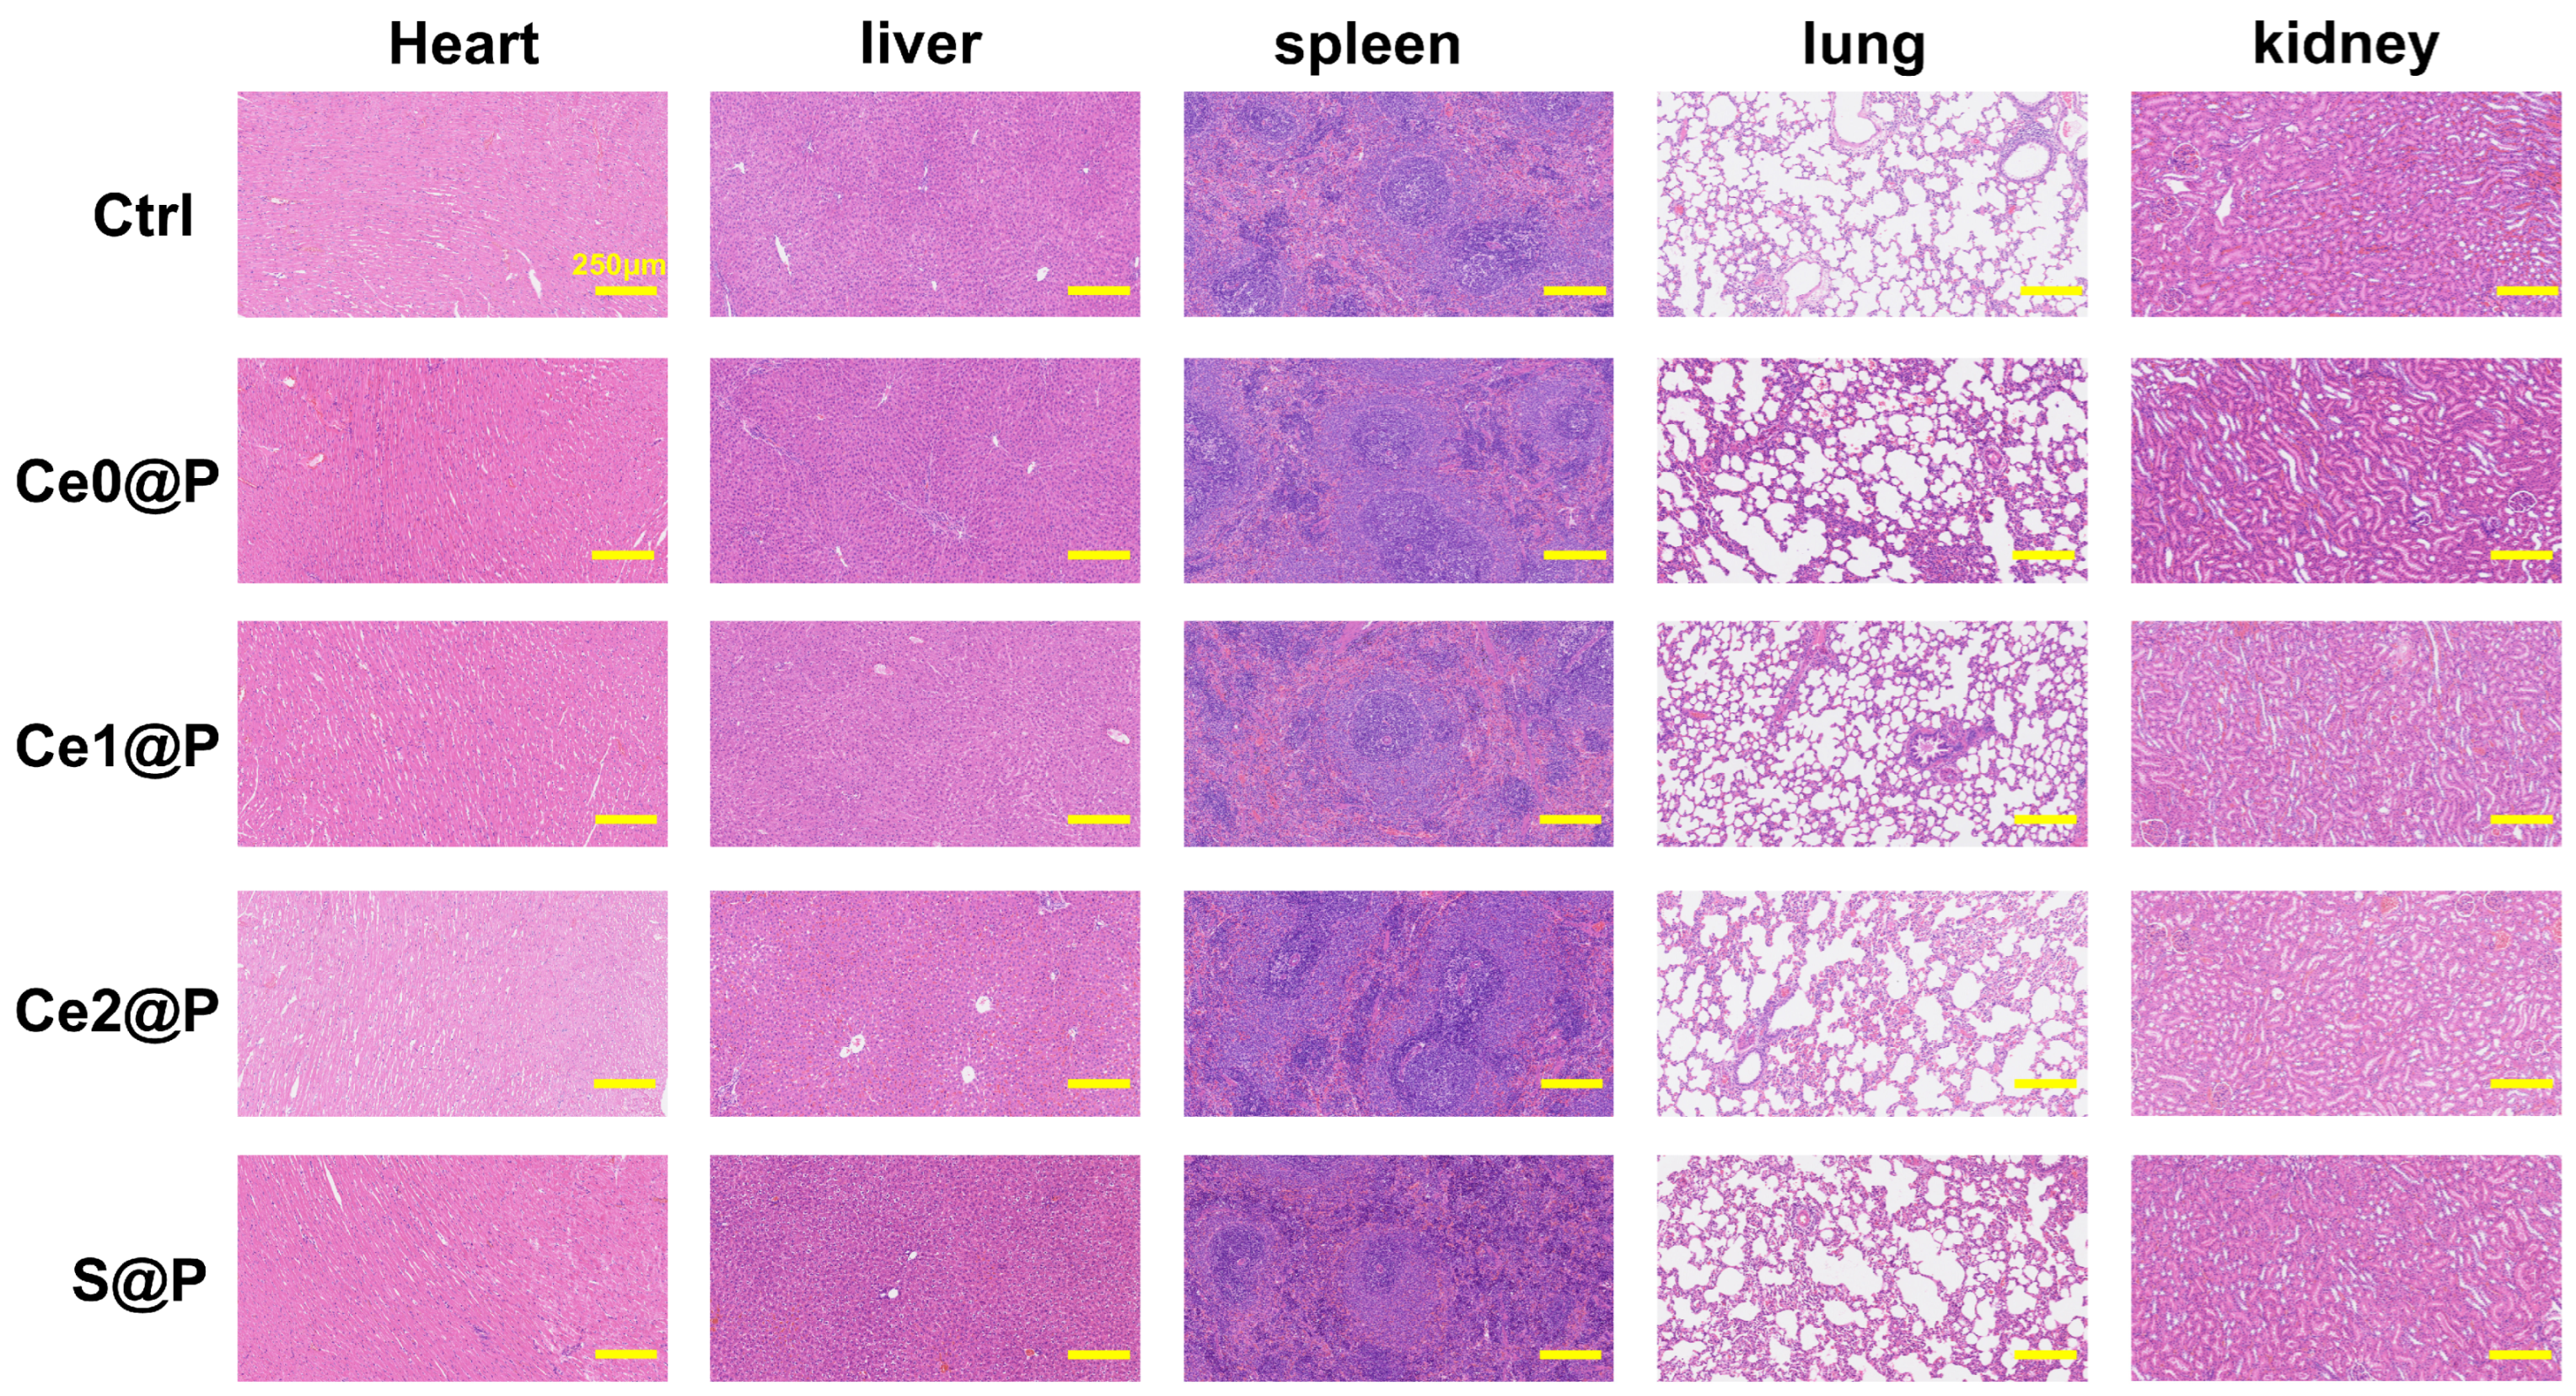
2.4.2. Histological Analysis

After 14 days of treatment, wound healing was evaluated through histological analysis using H&E and Masson’s trichrome staining, and immunofluorescence staining for TNF-α and CD206. In the groups treated with membranes, the formation of continuous epidermis and new blood vessels on the skin surface were observed in HE-stained images after 14 days of treatment (Figure 5C). As expected, the three enzyme-loaded groups exhibited a reduction in inflammatory cell infiltration in the Ce1@P, Ce2@P, and S@P groups compared to the Ctrl group. Notably, secondary skin components, such as hair follicles and sebaceous glands, were observed to form in the enzyme-loaded groups, potentially induced by the enzymatic activity of the membranes. Concurrently, the organization and morphology of collagen were assessed using Masson staining to evaluate the wound tissue healing process. As shown in Figure 5D, the collagen fibers in wound tissues of the three enzyme-loaded groups were arranged in a more orderly and directional manner compared to both the Ctrl and Ce-free groups, with deeper staining indicating enhanced collagen maturation. These results suggest that the enzymatic activity induced by nanoceria and SOD from membranes can modulate the wound healing process by promoting ECM deposition and collagen reorganization.
Considering that inflammatory factors play a critical role in wound healing and can sustain infection during the healing process, immunofluorescence staining for TNF-α and CD206 was performed and quantified to assess the inflammatory levels in the wounds after 14 days of treatment, as shown in Figure 6A. Semi-quantitative analysis of the fluorescence intensity in the images revealed a significant decrease in the levels of the pro-inflammatory cytokine TNF-α with increasing M-nanosphere content in both the Ce1@P group (p < 0.01) and the Ce2@P group (p < 0.05), as compared to the Ce0@P group (Figure 6B). Meanwhile, the expression level of the anti-inflammatory marker CD206 was significantly increased (Figure 6C).
Scar formation is a natural phenomenon in the wound healing process and is also the ultimate requirement of the repair process. In the last stage of wound healing, keratinocytes regulate the activity of fibroblasts by secreting, activating, or inhibiting growth factors such as TGF-β, which directly influence the extent and quality of scar formation [44]. Therefore, immunofluorescence staining for TGF-β was performed on the healed wound tissue on day 14 to evaluate its expression and localization. As shown in Figure 6A, the TGF-β-stained images exhibited a fading trend with the addition of nanoceria in the engineered membranes compared to the Ce-free group. Specifically, the Ce-loaded groups showed a significantly reduction in TGF-β expression, with the Ce1@P group (p < 0.001) and the Ce2@P group (p < 0.01) compared to the Ce0@P group (Figure 6D). Interestingly, the TGF-β expression in the Ce1@P group exhibited a significantly greater decrease compared to that in the Ce2@P group (p < 0.05), showing a different trend from the inflammatory levels of both TNF-α and CD206 (NS in Figure 6B,C).
Based on the residual wound ratio and TNF-α level, the Ce1@P group was selected for further analysis to compare its performance with the blank group (Ctrl) and the positive control group (bioenzyme-loaded membrane, S@P). Both enzyme-functionalized groups, namely the artificial nanozyme Ce1@P and the natural enzyme S@P, exhibited significantly enhanced antioxidant capacity relative to the Ctrl group (p < 0.01 or p < 0.001), as demonstrated by three key biomarkers: reduced pro-inflammatory TNF-α, elevated anti-inflammatory CD206, and attenuated fibrotic TGF-β expression (Figure 6B,C). However, dose-dependent analysis revealed that both the high-dose nanoceria group (Ce2@P) and S@P group showed significantly upregulated TGF-β expression (p < 0.05, Figure 6D), indicating a potential fibrotic tendency that may contribute to scar formation. Thus, transcriptome analysis was conducted on the two groups to investigate whether they modulated scar formation through the same pathways, such as the commonly known TGF-β/Smad signaling pathways. The aforementioned findings indicate that the engineered dressing with optimal oxidative activity exhibits superior efficacy in promoting wound healing compared to those dependent on high levels of redox catalytic activity or antioxidant properties derived from either ceria nanoparticles or the natural SOD enzyme.
In order to investigate whether the different experimental groups had toxic side effects on rats, we performed H&E staining of the heart, liver, spleen, lungs, and kidneys of rats on the 14th day, and the results of H&E staining showed that there were no abnormality in the organs of the rats, and no obvious damage was observed (Figure 7).

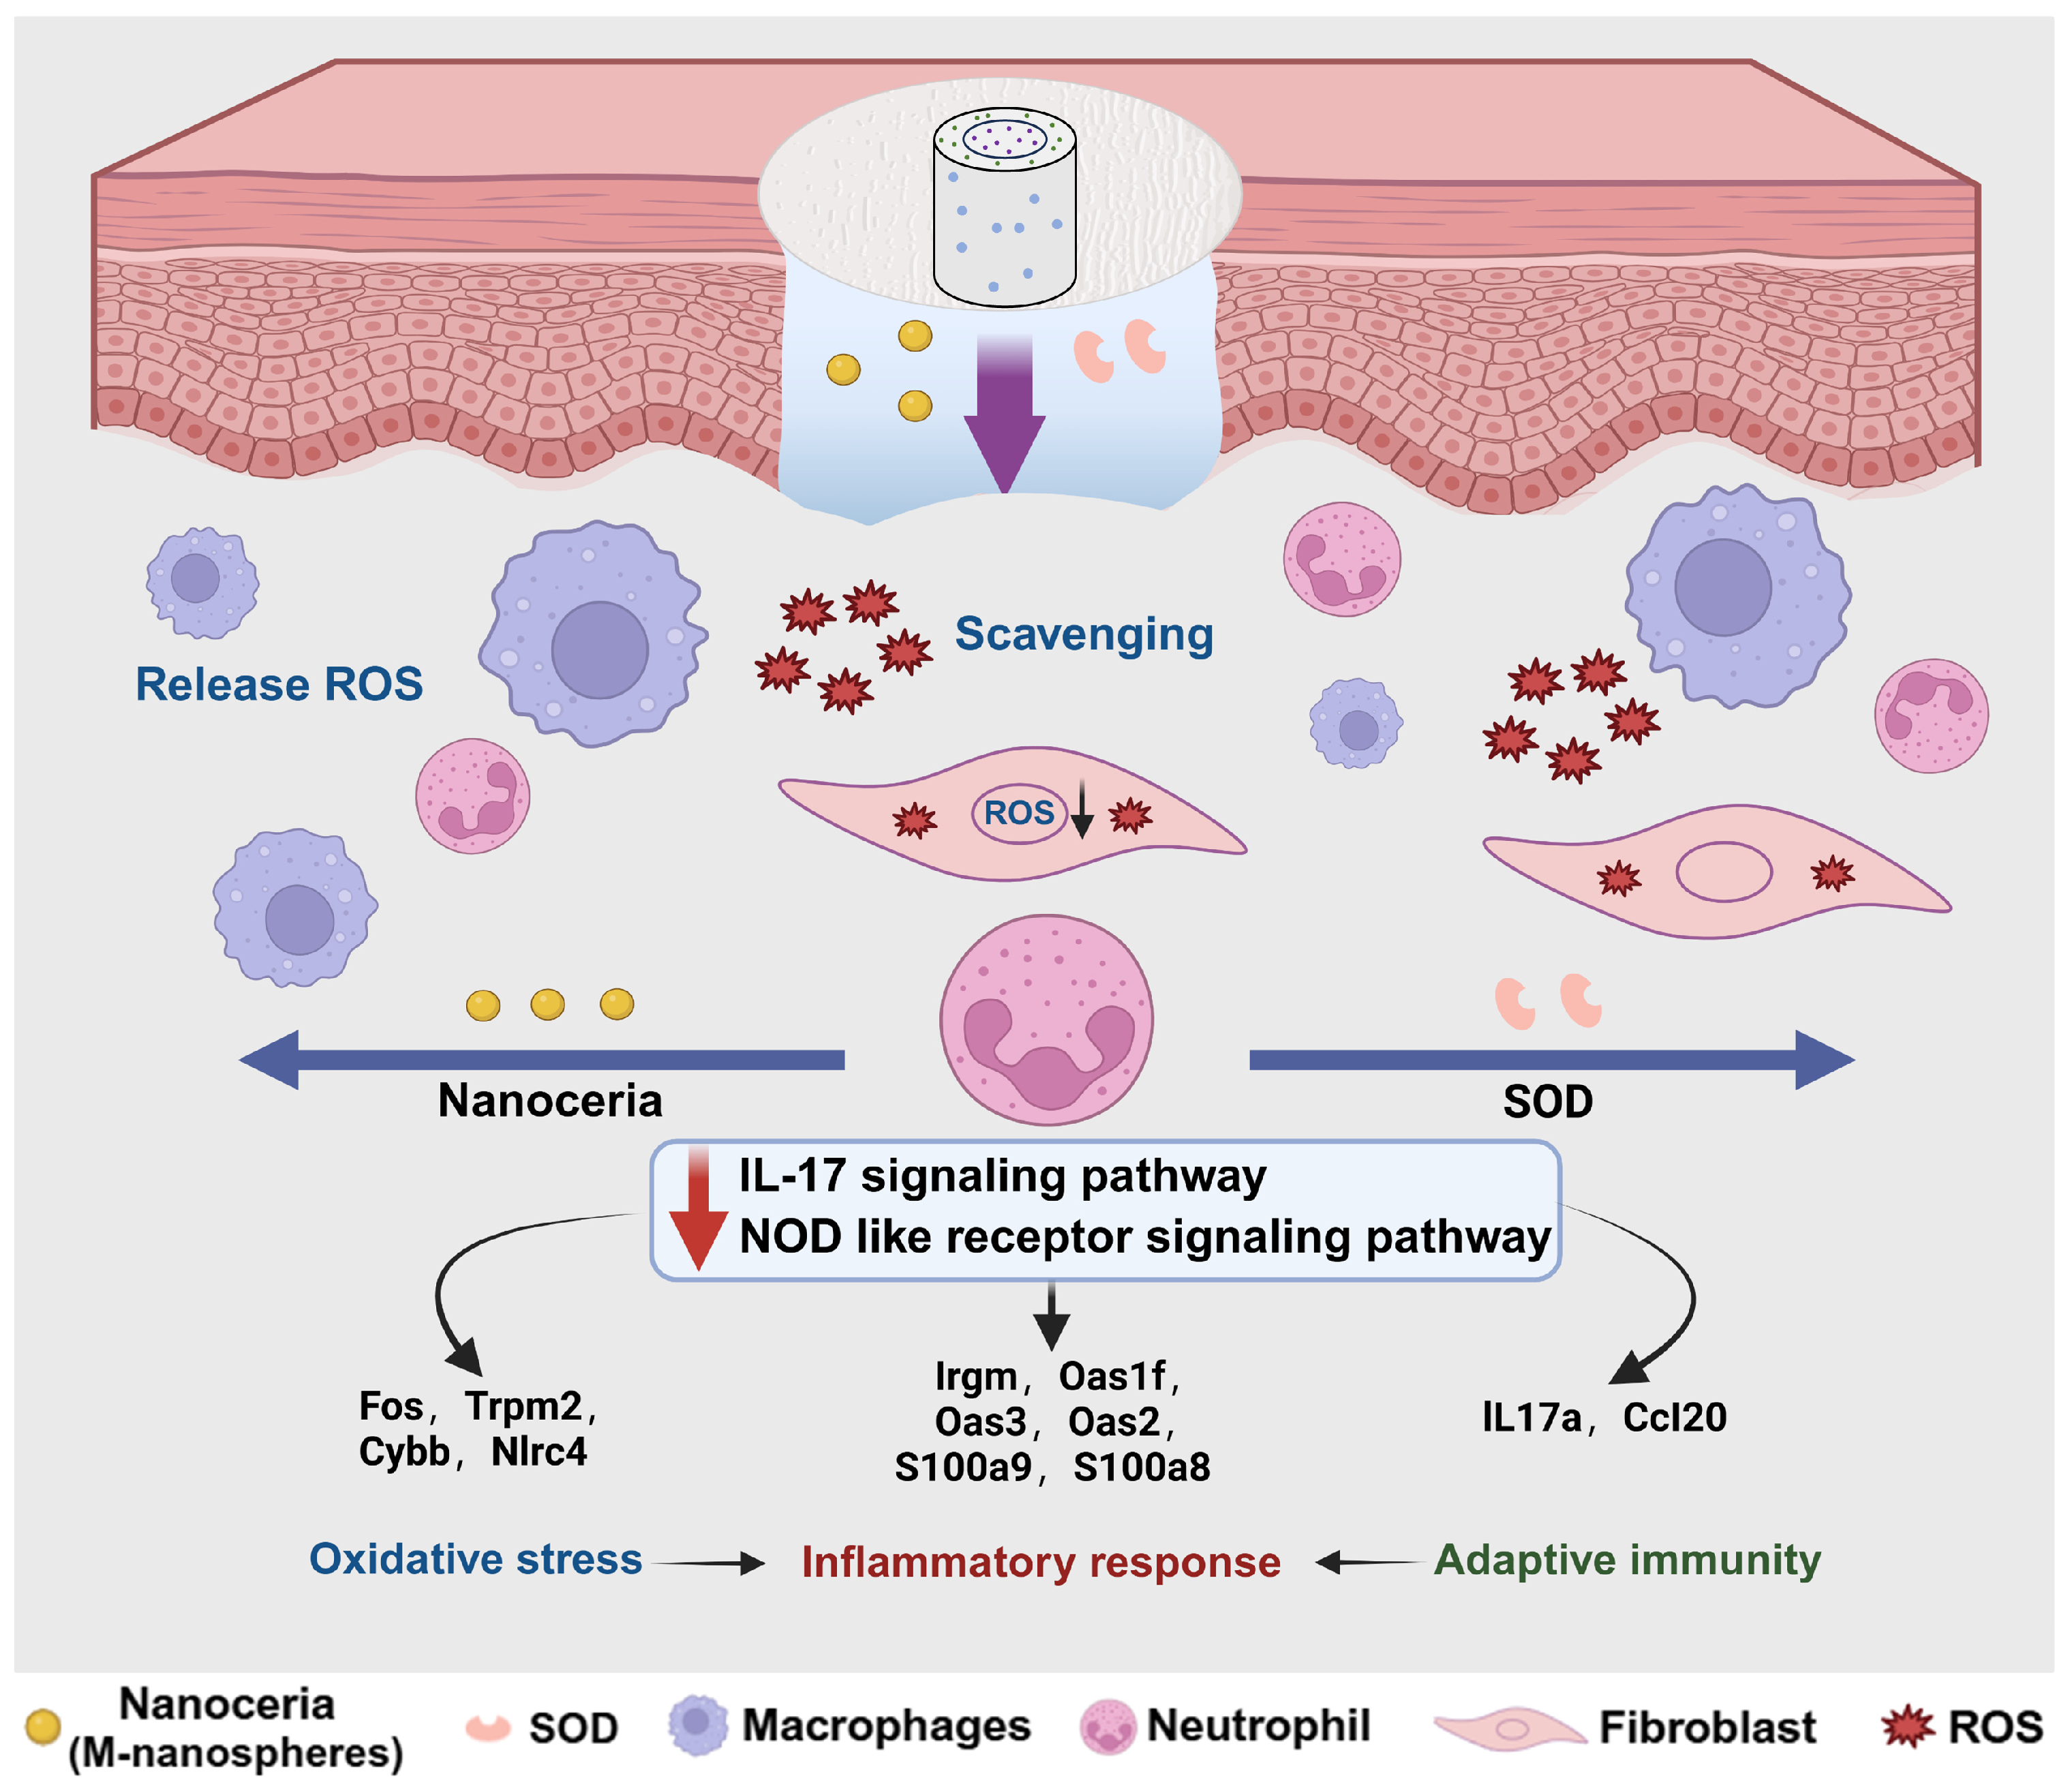
2.5. Regulatory Mechanisms of PU CSFs Embedded with CeO2 vs. SOD

The Ce2@P and S@P groups exhibited no significant differences both in in vitro and in vivo evaluation (Figure 4 and Figure 6), raising the question of whether the artificial enzyme (nanoceria) and the natural enzyme (SOD) regulate wound healing through the same mechanism. Gene expression profiles were analyzed to elucidate the regulatory mechanisms of the engineered membranes loaded with nanoceria and SOD in rat skin defects after 7 days of treatment. Both groups demonstrated similar redox catalytic activities, suggesting comparable antioxidant effects.
The distributions of the volcano maps show significant differences between the Ce2@P and Ctrl groups, as well as between the S@P and Ctrl groups, as shown in Figure 8A. After Ce2@P treatment, a total of 264 genes were upregulated and 409 genes were downregulated. After S@P treatment, a total of 181 genes were upregulated and 593 genes were downregulated. In order to gain a deeper understanding of the pathways of Ce2@P and S@P activation, KEGG pathway enrichment analysis was conducted, and the representative signaling pathways are shown in Figure 8B,D. The representative negative regulation of genes related to oxidative stress and the inflammatory response is shown in Figure 8C,E. Transient receptor potential melatonin 2 (Trpm2), immune related guanosine triphosphatase M protein (Irgm), S100 calcium binding protein a9 (S100a9), NOD-like receptor family CARD domain-containing protein 4 (Nlrc4), and interleukin 17a (IL17a) are included. The results analysis showed that, compared with the Ctrl group, Ce2@P and S@P could simultaneously downregulate the IL-17 signaling pathway and the NOD-like receptor signaling pathway.
When the two enzyme-loaded groups exhibited similar redox catalytic activities in promoting wound healing, the enriched genes in both pathways were categorized and analyzed. Apparently, the Ce2@P and S@P groups demonstrated similar expression patterns of immune response-related genes. The inflammatory regulators included different isoforms of the OAS family (Oas1f, Oas3, and Oas2), which are key effector molecules in the interferon signaling pathway, as well as the calcium-binding proteins S100a9 and S100a8, which act as key regulators of inflammation. Notably, the Ce2@P group exhibited downregulation of the oxidative stress-related genes Fos and Trpm2, different from the S@P group, with the exception of Irgm. The downregulated levels of both Fos and Trpm2 in the Ce2@P group indicate a coordinated cellular response to CeO2 exposure, characterized by attenuated ROS generation (Figure 2P) [45,46]. The adaptive mechanism reflects the mitigation of oxidative stress and reduction of inflammation through the antioxidant properties of ceria nanoparticles. Moreover, the downregulation of Cybb and Nlrc4 in the Ce2@P group also suggests a reduction in oxidative stress and inflammatory signaling, potentially reflecting an adaptive response to CeO2 exposure mediated by its antioxidant and anti-inflammatory properties [47,48]. In contrast, the S@P group demonstrated a more targeted downregulation of the genes IL17a and Ccl20, which are involved in adaptive immunity and inflammation, through the specific SOD role of reducing oxidative stress and inflammatory signaling [49,50]. These genetic differences suggest that the biological responses elicited by the artificial enzyme (nanoceria) involve differential mechanisms and activation pathways compared to those of the natural enzyme (SOD).

3. Discussion

Tarnuzzer et al. reported the SOD-like activity of CeO2 nanoparticles in 2005, revealing the key role of the Ce3+/Ce4+ redox state. Subsequent studies revealed that transition metal materials such as MnO2, flower-like Mn3O4, and Pt/Pd NPs possess SOD-like activities [51], but the Mn2+ released from the dissolution of manganese-based nanoenzymes may trigger neurotoxicity [52], whereas the noble metal Pt/Pd NPs are limited by the scarcity of raw materials, which restricts their practical application value. A comparison and summary of SOD-mimicking nanoenzymes are shown in Table 2. Ceria and its functionalized materials demonstrate excellent potential due to their unique antioxidant abilities, which arise from the self-reversible electronic transfer within their layered crystal structure, enabling enzyme-mimetic capabilities through redox catalytic reactions [53,54,55]. Under the hot topic of nanoceria application in wound healing, the biosafety of these artificial enzymes and their loaded substrates has emerged as a critical concern, balancing high activity with potential nanoscale toxicity, as well as their specific roles in tissue regeneration.
In this study, ceria nanoparticles with different morphologies were optimized to achieve stable dispersion and superior ROS scavenging efficiency, and further incorporated into engineered dressings based on polyurethane core–shell fibers. The redox catalytic activity of these dressings was assessed and compared to that of the natural SOD enzyme, demonstrating their antioxidative capability against inflammatory stimulation and their ability to regulate macrophage polarization, with minimal adverse effects in promoting wound healing. After treating skin defects in rats, gene expression profiles were analyzed to elucidate the regulatory mechanisms of the engineered membranes loaded with nanoceria and SOD, which demonstrated comparable enzymatic activities.

3.1. Optimal Redox Catalytic Performance of CeO2 Nanoparticles

Numerous studies have shown that the antioxidant capacity of CeO2 particles is related to the particle size, with smaller particles exhibiting enhanced antioxidant properties [56]. Additionally, the synthesized CeO2 nanocubes exhibited higher peroxidase activity but lower superoxide dismutase (SOD) activity compared to CeO2 nanorods [28,57]. In fact, the key function of nanoceria is not to trigger high activity but to ameliorate redox imbalance induced by oxidative stress, enhancing its oxidation resistance and self-regeneration potential to modulate cellular behavior and promote tissue regeneration.
Structurally, the enzyme-like properties of CeO2 nanoparticles are governed by their cubic fluorite lattice, where oxygen vacancies are typically accompanied by the reduction of cerium ions from the Ce4+ state to the Ce3+ state [58]. The reversible Ce4+/Ce3+ transition enables nanoceria to continuously regenerate its active sites, generating redox catalytic activity on the crystal surfaces and providing durable antioxidant properties for ROS scavenging [59]. Therefore, the antioxidant properties of CeO2 are closely related to the proportion of Ce3+ in the lattice: as the Ce3+/Ce4+ ratio increases, the antioxidant properties become stronger. Accordingly, the synthesized and modified CeO2 nanoparticles with different morphologies were optimized through a systematic evaluation, including quantified particle size, specific surface area, Ce3+ content, and the I600/I460 ratio, which characterized the oxygen vacancy concentration, as shown in Table 1. From the collected data, ceria nanospheres demonstrate a smaller particle size, larger specific surface area, higher Ce3+ content, and a greater I600/I460 ratio in comparison to nanorods and nanocubes. These prominent physicochemical properties confirm that ceria nanospheres possess higher oxygen vacancy concentrations, which is consistent with their superior antioxidant performance, as evidenced by their enhanced scavenging capacity for OH and O2•− radicals in Figure 1G,H.
Normally, the reduction in ceria size leads to severe agglomeration, primarily attributed to the heightened surface activity and energy of nanoparticles [60]. Therefore, the surface modification of nanospheres represents an effective strategy to enhance the stability of nanocrystals, ensuring their uniform dispersion and facilitating further functionalization. Cerium-organic precursors have been utilized for the synthesis of ceria nanoparticles via hydrothermal crystallization [61]. The negative charge from the carboxylic acid groups of citric acid was introduced to create electrostatic repulsion, thereby stabilizing the colloidal dispersion of ceria nanospheres. As shown in Figure 1A,D, the zeta potential of citrate-modified ceria nanospheres (M-nanospheres) increased, corresponding to improved particle dispersion compared to unmodified nanospheres. Notably, no significant difference was observed in the OH scavenging ability of the nanospheres before and after modification (Figure 1G). However, the O2•− scavenging efficiency of the M-nanospheres significantly decreased because the oxygen vacancies were covered by citrate (Figure 1H). Although the modification of ceria reduced the O2•− scavenging efficiency, the overall ROS scavenging efficiency of M-nanospheres was several times higher than that of the SOD enzyme. Specifically, M-nanospheres exhibited 7.5 times the OH scavenging and 2.9 times the O2•− scavenging efficiency compared to SOD (Figure 1G,H). Thus, the optimal redox catalytic performance of M-nanospheres demonstrates practical potential for mitigating oxidative stress in redox-imbalance environments.

3.2. Enzyme-Mimetic Activity Modulated by Engineered PU CSFs

As ceria nanoparticles attract increasing attention for use as therapeutic agents in clinical applications, their exceptional bioavailability and capacity to cross the blood–brain barrier and enter cells have raised concerns regarding potential toxicity that could compromise tissue structure and function [62]. To address these challenges, the development of composites that integrate the redox catalytic ability of nanoceria with versatile polymers has opened new avenues in emerging biomedical applications [23]. These advanced composites exhibit multiple beneficial effects on living systems while maintaining low systemic toxicity [63]. While most research has focused on the relationship between the concentration of ceria-loaded composites and their effectiveness in wound healing, their biocompatibility is equally critical to the cellular response, extending beyond their strong antioxidant effects. To evaluate whether an optimal balance between the biocompatibility and redox catalytic ability has been achieved, the bioenzyme SOD was used as a positive control by loading it into the same PU CSF matrix, ensuring comparable enzymatic activities with the engineered ceria-loaded dressing.
Determined by CCK-8 assay, the proliferative activity of L929 cells co-cultured with all engineered PU CSFs exceeded the cytotoxicity assessment threshold of 70%, as defined by ISO 10993-5:2009, within 5 days (Figure 3A). Concurrently, the cellular results demonstrated a significant higher cell viability in the low-dose Ce1@P group (5 wt%) compared to the S@P group at both 3 days (p < 0.001) and 5 days (p < 0.05). In contrast, no statistically significant differences were observed between the high-dose Ce2@P (10 wt%) and S@P groups. To assess the scavenging efficiency of the engineered dressings, inflammatory stimulations were applied to L929 fibroblast cells under an H2O2-induced inflammatory environment and to RAW 264.7 macrophages under LPS-induced stimulation. These two distinct modes are widely used for studying skin fibroblasts and macrophages, respectively. The low-dose Ce1@P group exhibited slightly weaker antioxidative capability against various inflammatory stimulations compared to both the high-dose Ce2@P group and the S@P group (Figure 3C,D). Further, the ability of the engineered dressings to regulate macrophage polarization was evaluated using RAW 264.7 macrophages under LPS-induced stimulation. During the macrophage polarization process (Figure 4), the level of TNF-α, an M1 phase marker, was significantly reduced in the low-dose Ce1@P group compared to both the high-dose Ce2@P and the S@P groups (p < 0.05). Conversely, the level of CD206, an M2 phase marker, was significantly increased (p < 0.01). No significant differences were observed between the high-dose Ce2@P and S@P groups in terms of scavenging efficiency, macrophage polarization, or cell proliferation (Figure 2P, Figure 3, and Figure 4). These in vitro results indicate that the low-dose ceria formulation in the engineered dressing provides optimal redox catalytic activity for maintaining cellular viability and modulating macrophage polarization, outperforming both the high-dose ceria group and the bioenzyme group. Unlike traditional Ce-containing dressings [23,26], whose redox catalytic activity and resultant inflammation resistance are dose-dependent, the engineered dressing demonstrates a more balanced and consistent performance.

3.3. Wound Healing Modulated by Engineered PU CSFs

Naturally, the skin plays a vital role in managing essential functions such as oxygen and water transport. Preventing transdermal water loss from wounds is crucial for effective wound healing [64]. Therefore, wound dressings should maintain an appropriate water vapor transmission rate (WVTR) to prevent the wound area from drying out while retaining accumulated exudate. Additionally, the water absorption rate is critical for facilitating nutrient and metabolic waste exchange, which relies on a stable membrane structure achieved through electrospinning. In this study, a polyurethane fibrous matrix with a core–shell structure was fabricated using coaxial electrospinning for the loading of nanoceria. The engineered polyurethane core–shell fibers (PU CSFs) demonstrated excellent stability, with no shrinkage after 24 h of soaking, which renders them highly suitable for wound dressing applications. In contrast, the single-fiber membranes produced through conventional electrospinning exhibited severe shrinkage and deformation (Figure S4). The WVTR values of all engineered Ce-loaded dressings ranged from 2047 to 2143 g/m2/d, falling within the effective range of 1999.2 to 2500.8 g/m2/d for maintaining optimal wound moisture, as reported in previous studies. The water absorption ratios of all engineered membranes exceeded 50% (Figure 2K), higher than those of CeO2-loaded PCL/cellulose acetate (25–50%) and CeO2-loaded PCL/gelatin (10–20%) fiber membrane dressings [37,65]. The superior moisture retention capability of the engineered dressings is attributed to the excellent properties of polyurethane, facilitating more effective nutrient delivery. These properties make the engineered Ce-loaded PU CSF dressings highly suitable for wound dressing applications by providing an optimal moist environment for tissue regeneration.
Given the similar redox catalytic activities of the Ce2@P and S@P groups (Figure 2P and Figure 4), gene expression profiles were analyzed to investigate their regulatory mechanisms in promoting wound healing (Figure 8). Both the Ce2@P and S@P groups were involved in the downregulation of genes in the OAS family (Oas1f, Oas3, and Oas2) and the S100 calcium-binding protein family (S100a9 and S100a8), performing a shared role in modulating immune and inflammatory responses. The downregulation of Oas1f, Oas3, and Oas2 is mediated by interferon (IFN) signaling pathways, which are associated with immunity [66]. Concurrently, S100a8 and S100a9 play important roles in inflammatory responses by activating Toll-like receptor 4 (TLR4), serving as important regulators in the inflammatory process [67]. Additionally, the downregulation of Irgm in the two enzyme-loaded groups indicates a reduction in immune activation and inflammatory responses [68], reflecting a protective or adaptive mechanism that promotes healing. Different gene activations represent distinct biological responses for the two groups, which were influenced by different mechanisms and pathways during the healing process. The downregulation of Fos, Trpm2, Cybb, and Nlrc4 in the CeO2 group shows a broader downregulation of genes involved in cellular activation, oxidative stress, and innate immunity [45,46,47,48], suggesting a comprehensive adaptive response to CeO2 exposure. In contrast, the downregulation of IL17a and Ccl20 in the SOD group demonstrates a more targeted downregulation of genes involved in adaptive immunity and inflammation [49,50], reflecting SOD’s specific role in reducing oxidative stress and inflammatory signaling. These differences demonstrate the differential mechanisms and biological responses to enzyme-mimetic nanoceria and the natural SOD enzyme (Scheme 2). However, further investigation is needed to fully elucidate the long-term effects of reduced gene expression on immune surveillance and ROS clearance, thereby providing a comprehensive understanding of their implications.
While the gross pictures indicated that the low-dose Ce1@P group exhibited significantly better wound healing performance compared to both the high-dose group and the SOD group (p < 0.05), histological analysis revealed no significant differences in collagen deposition, inflammatory cell infiltration, and tissue remodeling between the groups (Figure 5). Although residual wound ratios provide a quantitative measure of wound closure, they are insufficient to fully represent the extent of skin wound repair. In the context of skin wounds, the formation of subepidermal scars serves as a critical parameter for assessing the final stage of healing [69], which reflects the quality of tissue regeneration and functional recovery. Therefore, immunofluorescence staining for TGF-β confirmed the low-dose Ce1@P group had significantly greater reduced scar formation compared to both the high-dose Ce2@P and S@P groups (p < 0.05), with no significant difference observed between the high-dose Ce2@P and S@P groups. These findings suggest that the low-dose Ce1@P group not only promotes wound closure through self-adaptive redox catalytic activity but also enhances the quality of tissue repair by minimizing scar formation, offering an optimal therapeutic strategy for improved skin wound healing. This study establishes low-dose Ce1@P as an optimized nanozyme formulation with superior scar reduction (p < 0.05 vs. high-dose and enzyme controls), enhanced antioxidant capacity (p < 0.001 vs. untreated controls), and balanced immunomodulation via TNF-α suppression and CD206 upregulation. High-dose Ce2@P and natural S@P were selected for comparative transcriptomic analysis due to their paradoxical phenotypic convergence: despite structural differences, both showed equivalent wound closure rates and ROS scavenging efficiency (p > 0.05) with elevated TGF-β expression (p < 0.05 vs. Ce1@P). Transcriptomic profiling revealed that, while these materials achieve similar antioxidant effects through distinct mechanisms, their shared fibrotic tendency arises from pathway activation beyond the canonical TGF-β/Smad axis. These findings highlight that optimal therapeutic outcomes require both robust redox activity and precise dose control to avoid pro-fibrotic effects, establishing a new design paradigm for regenerative nanomaterials.

4. Materials and Methods

4.1. Materials

Materials: Calcium glycerophosphate (CaGP) and polytetrahydrofuran diol (PTHF-diol, Mn = 2000) were purchased from Sigma-Aldrich (St. Louis, MO, USA). Polycaprolactone (PCL, Mn = 80,000), Isophorone diisocyanate (IPDI), 1,1,1,3,3,3-hexafluoro-2-propanol (HFIP), trifluoroethanol (TFE), and stannous salts were purchased from Aladdin Co. Ltd., Shanghai, China. Superoxide dismutase derived from bovine blood (SOD, ≥2500 units/mg) in powder was purchased from Yuanye Bio-Technology Co., Ltd., Shanghai, China. All other chemicals of AR grade were purchased from Kelong Co., Ltd., Chengdu, China. Fetal bovine serum (FBS), Dulbecco’s modified eagle medium (DMEM), RPMI Medium 1640, penicillin, and streptomycin were obtained from Gibco (Grand Island, NY, USA). The Cell proliferation and toxicity test kit (CCK-8) and reactive oxygen species test kit (ROS test kit) were purchased from Meilun Biotechnology Co., Ltd. (Dalian, China). The hydroxyl radical (OH) detection kit and the total superoxide dismutase (SOD) detection kit were provided by Nanjing Jiancheng bioengineering institute (Nanjing, China). The staining method and testing kit were used according to the manufacturer’s instructions.
RAW 264.7 macrophages and mouse fibroblasts (L929) were provided by the State Key Laboratory of Oral Diseases of Sichuan University. RAW 264.7 cells were cultured in RPMI Medium 1640 containing 10% FBS and 1% penicillin/streptomycin. L929 cells were cultured in DMEM supplemented with 10% FBS and 1% penicillin/streptomycin. SD rats (male, 180–200 g) were obtained from Dossy Experimental Animal Co., Ltd. (Chengdu, China). All experimental procedures involving animals had been approved by the Ethics Committee of Sichuan University (20241213007).

4.2. Preparation and Characterization of Nanoceria

4.2.1. Synthesis of Ceria Nanoparticles

Ceria nanoparticles with various morphologies were synthesized according to previous studies.
Nanorods [28]: A total of 20 mL of 12 mol/L sodium hydroxide solution was slowly added dropwise to 20 mL of 0.1 mol/L cerium nitrate hexahydrate solution with continuous stirring for 30 min to make the mixture uniform. Subsequently, the reaction system was transferred to a high-pressure reactor and hydrothermally reacted at 100 °C for 24 h. After the reaction was completed, the product was washed with ethanol and deionized water for three times in sequence, and finally the target product was obtained by vacuum drying.
Nanocubes [28]: A total of 20 mL of 0.4 mol/L sodium hydroxide solution was used to react with 20 mL of 0.1 mol/L cerium nitrate hexahydrate solution in a hydrothermal reaction at 140 °C for 24 h. The rest of the synthesizing steps, including washing and drying treatments, were kept the same as those of the CeO2 nanorods.
Nanospheres [29]: A total of 1 mmol of cerium nitrate hexahydrate (Ce (NO3)3·6H2O) was mixed with 32 mL of 0.078 mol/L sodium hydroxide solution in a 100 mL reaction flask. The reaction system was stirred continuously at 700 rpm in a constant temperature water bath at 25 °C for 22 h. The product was separated by centrifugation (10,000 r/min, 5 min) and washed three times with deionized water, then dried under vacuum and set aside.
Citrate-modified CeO2 nanospheres (M-nanospheres) [70]: A total of 0.1 g of the nanospheres prepared above was taken and dispersed in 40 mL of distilled water containing 40 mg/mL of sodium citrate, and the products were subjected to ultrasonication for 20 min, ethanol, and washed three times to neutrality to obtain the citrate-modified nanospheres (M-nanospheres), then vacuum dried and preserved for subsequent characterization and application studies.

4.2.2. Characterization and Optimization of Ceria Nanoparticles

The microstructure was characterized by transmission electron microscopy (TEM, FEI Tecnai F20, FEI Company, Hillsboro, OR, USA). X-ray photoelectron spectroscopy (XPS, Shimadzu/Kratos AXIS SUPRA+, Kratos Analytical, Manchester, UK) was obtained to characterize the chemical information on the crystal surface. A nanoparticle size and zeta potential analyzer (DLS, Malvern Zetasizer Nano ZS90, Malvern Panalytical, Worcestershire, UK) was used to characterize the zeta potential. X-ray diffraction (XRD, DX-2700BH, Dandong Haoyuan Instrument Co., Ltd., Dandong, China) was obtained through instruments to characterize the structure of diverse ceria nanocrystals. Raman spectroscopy (LRS, LabRAM HR, HORIBA Scientific, Palaiseau, France) was used to characterize the oxygen vacancy concentration. The average particle size was determined from TEM images, the specific surface area was measured by BET analysis, the Ce3+ content was measured by XPS, and the intensity ratio of CeO2 nanoparticles with different morphologies at 600 cm−1 to 460 cm−1 was analyzed from the Raman spectra.
To evaluate the antioxidant properties of CeO2 nanoparticles with different morphologies, the OH generated by the Fenton reaction solution was used to simulate the action of intracellular ROS. Free OH reacts with Griess reagent and appeared pink. The lighter the color, the more OH was removed. After incubation with 3 mg CeO2 nanoparticles of different morphologies, the absorbance of the Fenton solution was tested by a UV spectrophotometer (UV-1800PC, Mapada Instruments Co., Ltd., Shanghai, China) at room temperature. The OH scavenging ability of M-nanospheres and SOD were also analyzed, and the OH scavenging efficiency of 3 mg M-nanospheres and 50 μL (0.001 mg mL−1) SOD were measured using the same experimental steps as described above.
The hydroxylamine method was used to evaluate the scavenging ability of different morphologies of 3 mg CeO2 nanoparticles on O2•−. Hydroxylamine is oxidized by O2•− to form nitrite, which appears purple red under the action of a developer. The lighter the color, the more superoxide radicals are cleared. The same UV spectrophotometer was used to test the absorbance of the hydroxylamine reaction solution at room temperature. In order to further explore the O2•− scavenging ability of M-nanospheres and SOD, the same experimental steps as above were used to measure the O2•− scavenging efficiency of 3 mg M-nanospheres and 50 μL (0.001 mg mL−1) SOD.

4.3. Fabrication of PU Core–Shell Fibers

Polyurethane synthesis: Polyurethane was synthesized using a two-step method according to our previous study [71]. In brief, PTHF-diol and IPDI were pre-polymerized in a three-necked flask with mechanical stirring for 2 h under a nitrogen atmosphere. Calcium glycerophosphate (CaGP) was the chain extender to the above reaction mixture and the reaction was continued for 6–8 h. The feed molar ratio of PTHF-diol, IPDI, and the chain extender (CaGP) was 3:1:2, and the temperature was maintained at 70 °C throughout the reaction process. Finally, PU was obtained by overnight precipitation in deionized water and freeze-drying. After dissolving PU in HFIP, spinning solutions for electrospinning were prepared by incorporating M-nanospheres at different mass fractions. The specific compositions are listed in Table 3.
Electrospinning PU CSFs: Fibrous membranes were fabricated using coaxial electrospinning technology. The spinning solutions of PU containing nanoceria at varying concentrations in HFIP were prepared as the shell layer solution, whereas PCL dissolved in TFE served as the core solution (Table 3). Single fibers were electrospun using the PU composite solution (Ce3@P) as the control group of the electrospinning technology. Under the conditions of a voltage of 7 kV, a flow rate of 1 mL h−1, and a receiving distance of 20 cm, the fibrous membranes were collected on aluminum foil, and then the membranes were placed in a vacuum drying oven at 37 °C for one week. After the solvent had completely evaporated, a membrane with a thickness of 0.1 mm was obtained. All prepared membranes were collected and cut into different samples with a suitable diameter for subsequent experiments. All samples were sterilized using 15 kGy gamma irradiation prior to biological testing, in full compliance with the ISO 11137-2:2006 standard [72] for medical device sterilization.
Preparation of SOD-loaded samples as the enzyme control: The pristine PU CSF membranes, fabricated as described above, were punched into circular discs (φ8 mm) and subsequently sterilized via γ-irradiation (15 kGy) [72]. Maintaining aseptic operation, 50 μL of 0.001 mg mL−1 SOD solution was dropped on the surface of the samples for adsorption, named as SOD@PU CSFs (S@P), which were dried at 37 °C in an incubator.

4.4. Characterization of PU CSFs Membranes

4.4.1. Physicochemical Properties

The microstructure was characterized by transmission electron microscopy (TEM, FEI Tecnai F20, FEI Company, Hillsboro, OR, USA) to test the core-shell structure of the electrospun filament. Scanning electron microscopy (SEM, ZEISS Sigma 360, Carl Zeiss AG, Oberkochen, Germany) was used to characterize the surface microscopic morphology of the fibrous structure. Energy dispersive spectroscopy (EDS, 51-XMX1136, Oxford Instruments, Oxfordshire, UK) was used to analyze the element distribution in the polyurethane matrix. The Fourier transform infrared spectrometer (FTIR, Nicolet 6700, Thermo Fisher Scientific, Milwaukee, WI, USA) was used to study the chemical structure of the composite fiber membranes and nanospheres before and after modification. The ImageJ (ImageJ 1.53k) software was used to measure the fiber diameter in these SEM images.

4.4.2. Water Absorption

The swelling characteristics of different PU CSFs were analyzed to assess the ability of wound dressings to absorb wound exudates. The dry weight (Wd) of the membrane was measured, and then the nanofibers were immersed in PBS at 37 °C for 24 h. Filter paper was used to remove excess water from the swollen membrane, which was then measured for the wet weight (Ww). The water absorption rate was calculated using the following equation [73].
Water absorption (%) = (WwWd)/Wd × 100

4.4.3. Water Vapor Transmission Rate

To determine the moisture permeability of the composite fiber membrane, the water vapor transmission rate (WVTR) was measured. Briefly, each membrane was cut into a circle with a diameter of 14 mm and placed on top of the test tube. The tubes were first filled with 2 mL of distilled water and stored in an incubator at 37 °C for 24 h. The following formula was used to calculate the water vapor transmission rate [74].
WVTR = −ΔW/(A × Δt) × 100
where ΔW is the change in water weight (g), A is the exposed area of the sample (m2), and t is the exposure time (d).

4.4.4. Redox Catalytic Activity

Hydroxyl radical (OH) scavenging assay: In the OH assay, the sample was immersed in 2 mL of Fenton solution for 20 min, followed by absorbance measurement (AM) [75]. The absorbance (AB) of the blank solution without a sample was used as a control. The absorbance (AC) of the aqueous solution (2 mL) contained 200 μL H2O2 (0.03 wt%) as a positive control. All absorbance values were measured on a UV–visible spectrophotometer at 550 nm (UV-1800PC, Mapada Instruments Co., Ltd., Shanghai, China).
OH scavenging efficiency (%) = (AMAB)/(ACAB) × 100
Superoxide anion radical (O2•−) scavenging assay: The total superoxide dismutase assay kit (A001-1-2, Nanjing Jiancheng Bioengineering Research Institute, Nanjing, China) was used to generate O2•− through the reaction system of xanthine and xanthine oxidase. The latter oxidizes hydroxylamine to form nitrite, which appears purple red under the action of a color developer. The absorbance of the sample solution is set as Atreatment, and the absorbance of the without-sample solution is set as Acontrol. The UV–visible spectrophotometer (UV-1800PC, Mapada Instruments Co., Ltd., Shanghai, China) was used to measure the absorbance at 550 nm.
O2•− scavenging efficiency (%) = (AcontrolAtreatment)/Acontrol × 100

4.5. Biocompatibility and Environment Regulation Through PU CSFs

4.5.1. Cell Proliferation and Cytocompatibility Test

The L929 murine fibroblast cell line was utilized in compliance with ISO 10993-5 standards for biocompatibility assessment [39], enabling a sensitive and standardized evaluation of cellular proliferation and the regulation of oxidative stress. L929 was inoculated into different sterilized samples (φ8 mm) in 48-well plates, with a density of 4 × 10³ cells/well, and cultured at 37 °C and 5% CO2, referring to the instruction manual for specific operation methods. The culture medium was changed every two days. According to ISO 10993-5:2009 [34], the proliferation of L929 on the membrane was evaluated using the CCK-8 assay on days 1, 3, and 5. The 1420 multi label counter (PerkinElmer, Waltham, MA, USA) was used to measure the optical density (OD) at 450 nm. The formula for calculating cell viability was as follows:
Cell viability (%) = [AtreatmentAblank]/[AcontrolAblank] × 100
Here, Atreatment represents the OD value of the sample, Acontrol represents the OD value of the control group, and Ablank represents the OD value without cells (n = 5). The Ctrl group represents the cell culture group without engineered PU CSFs.

4.5.2. Cellular Reactive Oxygen Species (ROS) Scavenging Activity

L929 cells were used for ROS scavenging testing, and ROS scavenging activity was measured using a 2,7′-dichlorofluorescein-diacetate (DCFH-DA) probe. L929 (2.0 × 10⁴/well) was inoculated onto sterilized samples in different 24-well plates. After L929 cells adhered to the membrane, the original culture medium was replaced with a medium containing 0.2 mM H2O2 as a ROS solution and incubated for 24 h. The DCFH-DA probe was used to detect ROS levels in L929 cells. The DCFH-DA probe loading procedure was as follows: the DCFH-DA probe (10 mM) was added to the plate and incubated for 20 min, followed by washing L929 cells three times with PBS. Finally, qualitative fluorescence images were captured using an inverted fluorescence microscope (λ excitations = 488 nm, λ emissions = 525 nm). RAW 264.7 macrophages (1.0 × 10⁵ cells/well) were seeded onto sterile composite fiber membranes in a 24-well plate for 24 h, followed by the addition of culture medium containing 1 mL LPS (500 ng mL−1) to each well and further incubation for 4 h. The LPS-containing culture medium was aspirated and washed three times with PBS, followed by the addition of 500 μL of DCFH-DA probe (10 mM) per well, and allowed to stand for 20 min, and then rinsed three times with PBS for RAW 264.7. Finally, an inverted fluorescence microscope was used to observe qualitative results.

4.5.3. In Vitro Polarization of RAW 264.7 Macrophages

RAW 264.7 macrophages are one of the most commonly used macrophage models, and the phenotypic and functional characteristics of the RAW 264.7 cell line remain stable through passaging [76]. RAW 264.7 macrophages were seeded at a density of 6 × 10⁴ cells/well onto a circular cover glass in a 6-well culture plate, and allowed to grow well after the cells adhered to the cover glass. After co-culturing with sterilized samples for 24 h, the original culture medium was replaced with a medium containing 3 mL 100 ng mL−1 LPS for each well of the six-well plate and incubated for 6 h. The cover glass with cells attached was washed twice with PBS, and 1 mL of 4% paraformaldehyde solution was added to each well. The plate was then left to stand for 10–15 min. Immunofluorescence staining of macrophages (TNF-α and CD206) was performed according to the manufacturer’s instructions. The cover glass was stained with the first antibody and the influenza specific labeled second antibody, and the cell nucleus was stained with DAPI. Localization fluorescence microscopy was used to capture the cellular immunofluorescence images. The mean fluorescence intensities of TNF-α and CD206 were independently quantified using ImageJ software.

4.6. Skin Wound Treatment

4.6.1. In Vivo Animal Experiments

Before and after the surgery, rats were kept in the standard animal room of Sichuan University, with a temperature of 25 °C and an environment of alternating light and dark for 12 h. The surgery was performed under sterile conditions. SD rats were anesthetized by inhaling 3% (v/v) isoflurane and the hair on the back skin was shaved off. Then, a full thickness circular incision (8 mm) was created on the back skin of the rats. After treatment with sterilized samples (φ10 mm), they were divided into 5 groups: Ctrl (blank control without engineered PU CSFs), Ce0@P, Ce1@P, Ce2@P, and S@P groups.
The wound length was measured on days 0, 3, 7, and 14 after injury. ImageJ software was used to determine the wound area. The original wound area is denoted as A0, and the wound area at the predetermined time point is denoted as At.
Remaining area rate of wound (%) = At/A0 × 100

4.6.2. Histological Staining

On the 14th day post-treatment, the wound tissue specimens were harvested and fixed in a 4% paraformaldehyde solution. After dehydration with a graded ethanol series, the collected tissue samples of different groups were embedded in paraffin and sectioned into thin slices. Histological evaluation was performed using hematoxylin and eosin (H&E), Masson’s trichrome staining, and immunofluorescence staining (TNF-α, CD206, and TGF-β) performed according to the manufacturer’s instructions. Histological images were captured using a fluorescence microscope equipped for localization. Three distinct regions from parallel immunofluorescence staining images of the same sample group were randomly selected, and the mean fluorescence intensity was quantified using ImageJ software.

4.6.3. Transcriptomic Analysis of Composite Fiber Membrane

Male SD rats (weighing 180–200 g) were used for transcriptome analysis. A total of nine rats were randomly divided into three groups, with three rats in each group. A full-thickness skin defect with a diameter of 8 mm was surgically created on the dorsal skin of SD rats. The defects without any implants served as the sham group (Ctrl), while those covered with sterilized samples constituted the experimental group (Ce2@P and S@P groups). After 7 days of treatment post-operation, skin tissue samples were immediately harvested and placed in RNase-free cryovials, which were subsequently transferred to a −80 °C freezer for storage. RNA sequencing was conducted by Shanghai Majorbio Bio-pharm Technology Co., Ltd. (Shanghai, China).

4.7. Statistical Analysis

All quantitative results were presented as the mean ± standard deviation (mean ± SD), with the corresponding sample sizes indicated. Statistical analysis was carried out using one-way analysis of variance (ANOVA) with Tukey post-test analysis using GraphPad Prism 8.0 software. The values were considered significantly different at * p < 0.05, ** p < 0.01, and *** p < 0.001; NS was used to indicate no significant difference.

5. Conclusions

To address redox imbalance in skin wounds, we developed an engineered dressing incorporating citrate-modified CeO2 nanospheres into a polyurethane core–shell fiber matrix. The biomimetic design exhibits dynamic redox activity responsive to the wound microenvironment, outperforming conventional cerium-based dressings. The low-dose nanoceria formulation maintains antioxidant capacity, preserves cellular homeostasis, and promotes regenerative healing with minimal scarring. Mechanistic studies reveal that enzyme-mimetic nanoceria facilitates tissue repair by self-regulating redox activity, providing a strategy to enhance therapeutic efficacy via precise nanozyme dosing and improved catalytic performance.

Supplementary Materials

The following supporting information can be downloaded at: https://www.mdpi.com/article/10.3390/catal15070617/s1, Figure S1: Infrared spectrum of different engineered PU CSFs, M-nanospheres, and nanospheres, Figure S2: Microstructures of fiber membranes loaded with different contents of nanospheres and corresponding Ce-element EDS surface profiles (yellow), Figure S3: Single filament diameter of different engineered PU CSFs, Figure S4: Comparison of shape stability of the Ce3@P core–shell fiber membranes, Figure S5: Thermogravimetric analysis of different engineered PU CSFs, Figure S6: The OD value of L929 with different engineered PU CSFs measured by CCK-8 assay.

Author Contributions

Y.L. (Yuping Li): Data curation, Writing—original draft, Investigation. J.Z.: Investigation. X.L.: Data curation, Formal analysis. L.L.: Investigation. B.M.: Investigation. Q.D.: Data curation. Y.L. (Yubao Li): Project administration, Conceptualization, Funding acquisition. Y.Z.: Conceptualization, Methodology, Writing—review and editing, Funding acquisition. All authors have read and agreed to the published version of the manuscript.

Funding

This work was supported by the National Key Research and Development Program of China (2021YFA1201300/2021YFA1201304), Sichuan International Science and Technology Innovation Cooperation Project (No. 2024YFHZ0308), and the Fundamental Research Funds for the Central Universities.

Data Availability Statement

All the data supporting the conclusions are presented in the manuscript and the Supporting Information.

Conflicts of Interest

The authors declare no competing interests.

References

  1. MacNeil, S. Progress and opportunities for tissue-engineered skin. Nature 2007, 445, 874–880. [Google Scholar] [CrossRef] [PubMed]
  2. Mazini, L.; Rochette, L.; Admou, B.; Amal, S.; Malka, G. Hopes and Limits of Adipose-Derived Stem Cells (ADSCs) and Mesenchymal Stem Cells (MSCs) in Wound Healing. Int. J. Mol. Sci. 2020, 21, 1306. [Google Scholar] [CrossRef]
  3. Miron, R.J.; Zhang, Y.F. Autologous liquid platelet rich fibrin: A novel drug delivery system. Acta Biomater. 2018, 75, 35–51. [Google Scholar] [CrossRef] [PubMed]
  4. Nqoro, X.; Taziwa, R. Polymer-Based Functional Materials Loaded with Metal-Based Nanoparticles as Potential Scaffolds for the Management of Infected Wounds. Pharmaceutics 2024, 16, 155. [Google Scholar] [CrossRef]
  5. Shimada, K.; Ojima, Y.; Ida, Y.; Komiya, T.; Matsumura, H. Negative-pressure wound therapy for donor-site closure in radial forearm free flap: A systematic review and meta-analysis. Int. Wound J. 2022, 19, 316–325. [Google Scholar] [CrossRef]
  6. Sun, B.K.; Siprashvili, Z.; Khavari, P.A. Advances in skin grafting and treatment of cutaneous wounds. Science 2014, 346, 941–945. [Google Scholar] [CrossRef]
  7. Wei, S.; Wang, W.; Li, L.; Meng, H.Y.; Feng, C.Z.; Dong, Y.Y.; Fang, X.C.; Dong, Q.Q.; Jiang, W.; Xin, H.L.; et al. Recombinant human epidermal growth factor combined with vacuum sealing drainage for wound healing in Bama pigs. Mil. Med. Res. 2021, 8, 18. [Google Scholar] [CrossRef] [PubMed]
  8. Reinke, J.M.; Sorg, H. Wound Repair and Regeneration. Eur. Surg. Res. 2012, 49, 35–43. [Google Scholar] [CrossRef]
  9. Opdenakker, G.; Van Damme, J.; Vranckx, J.J. Immunomodulation as Rescue for Chronic Atonic Skin Wounds. Trends Immunol. 2018, 39, 341–354. [Google Scholar] [CrossRef]
  10. Xue, M.L.; Jackson, C.J. Extracellular Matrix Reorganization During Wound Healing and Its Impact on Abnormal Scarring. Adv. Wound Care 2015, 4, 119–136. [Google Scholar] [CrossRef]
  11. Schäfer, M.; Werner, S. Oxidative stress in normal and impaired wound repair. Pharmacol. Res. 2008, 58, 165–171. [Google Scholar] [CrossRef] [PubMed]
  12. Zhu, Y.Y.; Wang, K.; Jia, X.Y.; Fu, C.L.; Yu, H.N.; Wang, Y.P. Antioxidant peptides, the guardian of life from oxidative stress. Med. Res. Rev. 2024, 44, 275–364. [Google Scholar] [CrossRef] [PubMed]
  13. Hong, Y.H.; Boiti, A.; Vallone, D.; Foulkes, N.S. Reactive Oxygen Species Signaling and Oxidative Stress: Transcriptional Regulation and Evolution. Antioxidants 2024, 13, 312. [Google Scholar] [CrossRef] [PubMed]
  14. Newsholme, P.; Cruzat, V.F.; Keane, K.N.; Carlessi, R.; de Bittencourt, P.I.H. Molecular mechanisms of ROS production and oxidative stress in diabetes. Biochem. J. 2016, 473, 4527–4550. [Google Scholar] [CrossRef]
  15. Deshpande, S.S.; Angkeow, P.; Kuang, J.P.; Ozaki, M.; Irani, K. Rac1 inhibits TNF-α-induced endothelial cell apoptosis: Dual regulation by reactive oxygen species. FASEB J. 2000, 14, 1705–1714. [Google Scholar] [CrossRef]
  16. Su, L.J.; Zhang, J.H.; Gomez, H.; Murugan, R.; Hong, X.; Xu, D.X.; Jiang, F.; Peng, Z.Y. Reactive Oxygen Species-Induced Lipid Peroxidation in Apoptosis, Autophagy, and Ferroptosis. Oxidative Med. Cell. Longev. 2019, 2019, 5080843. [Google Scholar] [CrossRef]
  17. Tsang, C.K.; Liu, Y.; Thomas, J.; Zhang, Y.J.; Zheng, X.F.S. Superoxide dismutase 1 acts as a nuclear transcription factor to regulate oxidative stress resistance. Nat. Commun. 2014, 5, 3446. [Google Scholar] [CrossRef]
  18. Landén, N.X.; Li, D.Q.; Ståhle, M. Transition from inflammation to proliferation: A critical step during wound healing. Cell. Mol. Life Sci. 2016, 73, 3861–3885. [Google Scholar] [CrossRef]
  19. Wu, H.B.; Li, F.Y.; Wang, S.F.; Lu, J.X.; Li, J.Q.; Du, Y.; Sun, X.L.; Chen, X.Y.; Gao, J.Q.; Ling, D.S. Ceria nanocrystals decorated mesoporous silica nanoparticle based ROS-scavenging tissue adhesive for highly efficient regenerative wound healing. Biomaterials 2018, 151, 66–77. [Google Scholar] [CrossRef]
  20. Collin, F. Chemical Basis of Reactive Oxygen Species Reactivity and Involvement in Neurodegenerative Diseases. Int. J. Mol. Sci. 2019, 20, 2047. [Google Scholar] [CrossRef]
  21. McCord, J.M.; Fridovic, I. Superoxide dismutase an enzymic function for erythrocuprein (hemocuprein). J. Biol. Chem. 1969, 244, 6049–6055. [Google Scholar] [CrossRef]
  22. Hemalatha, J.; Senthamil, C.; Sakthivel, C.; Nivetha, A.; Umashankar, J.J.; Prabha, I. Efficient transition metal nanozymes as the alternate for natural enzymes in food analysis and environmental remediation. J. Environ. Chem. Eng. 2024, 12, 112575. [Google Scholar] [CrossRef]
  23. Shcherbakov, A.B.; Reukov, V.V.; Yakimansky, A.V.; Krasnopeeva, E.L.; Ivanova, O.S.; Popov, A.L.; Ivanov, V.K. CeO2 Nanoparticle-Containing Polymers for Biomedical Applications: A Review. Polymers 2021, 13, 924. [Google Scholar] [CrossRef]
  24. Cao, X.F.; Zhao, S.; Yan, S.J.; Hu, J.; Dan, Y. Fabrication and Application of CeO2 Nanostructure with Different Morphologies: A Review. J. Renew. Mater. 2020, 8, 1443–1472. [Google Scholar] [CrossRef]
  25. Abe, H.; Mizoguchi, H.; Eguchi, R.; Hosono, H. Exploration of heterogeneous catalyst for molecular hydrogen ortho-para conversion. Exploration 2024, 4, 20232858. [Google Scholar] [CrossRef]
  26. Xue, Y.J.; Yang, F.; Wu, L.K.; Xia, D.D.; Liu, Y.S. CeO2 Nanoparticles to Promote Wound Healing: A Systematic Review. Adv. Healthc. Mater. 2024, 13, 2302858. [Google Scholar] [CrossRef]
  27. Fu, X.X.; Li, P.; Chen, X.; Ma, Y.Y.; Wang, R.; Ji, W.X.; Gu, J.K.; Sheng, B.W.; Wang, Y.Z.; Zhang, Z.H. Ceria nanoparticles: Biomedical applications and toxicity. J. Zhejiang Univ. Sci. B 2024, 25, 361–388. [Google Scholar] [CrossRef] [PubMed]
  28. Yang, Y.S.; Mao, Z.; Huang, W.J.; Liu, L.H.; Li, J.L.; Li, J.L.; Wu, Q.Z. Redox enzyme-mimicking activities of CeO2 nanostructures: Intrinsic influence of exposed facets. Sci. Rep. 2016, 6, 35344. [Google Scholar] [CrossRef]
  29. Manto, M.J.; Xie, P.F.; Wang, C. Catalytic Dephosphorylation Using Ceria Nanocrystals. ACS Catal. 2017, 7, 1931–1938. [Google Scholar] [CrossRef]
  30. Venkataronappa, A.; Bankaitis, J.; Seo, J. Enhancing dispersion stability and recyclability of ceria slurry with polyacrylic acid for improved glass polishing performance. J. Ind. Eng. Chem. 2024, 138, 623–631. [Google Scholar] [CrossRef]
  31. Wu, Z.L.; Li, M.J.; Howe, J.; Meyer, H.M.; Overbury, S.H. Probing Defect Sites on CeO2 Nanocrystals with Well-Defined Surface Planes by Raman Spectroscopy and O2 Adsorption. Langmuir 2010, 26, 16595–16606. [Google Scholar] [CrossRef]
  32. López, J.M.; Gilbank, A.L.; García, T.; Solsona, B.; Agouram, S.; Torrente-Murciano, L. The prevalence of surface oxygen vacancies over the mobility of bulk oxygen in nanostructured ceria for the total toluene oxidation. Appl. Catal. B-Environ. 2015, 174, 403–412. [Google Scholar] [CrossRef]
  33. Hancock, M.L.; Yokel, R.A.; Beck, M.J.; Calahan, J.L.; Jarrells, T.W.; Munson, E.J.; Olaniyan, G.A.; Grulke, E.A. The characterization of purified citrate-coated cerium oxide nanoparticles prepared via hydrothermal synthesis. Appl. Surf. Sci. 2021, 535, 147681. [Google Scholar] [CrossRef]
  34. Buckley, C.D.; Ospelt, C.; Gay, S.; Midwood, K.S. Location, location, location: How the tissue microenvironment affects inflammation in RA. Nat. Rev. Rheumatol. 2021, 17, 195–212. [Google Scholar] [CrossRef]
  35. Machi, K.; Ono, Y.; Iwahashi, H. Citrate, a TCA cycle metabolite, plays a role as a hydroxyl radical scavenger in vitro. J. Photochem. Photobiol. A-Chem. 2024, 454, 115691. [Google Scholar] [CrossRef]
  36. Fahimirad, S.; Ajalloueian, F. Naturally-derived electrospun wound dressings for target delivery of bio-active agents. Int. J. Pharm. 2019, 566, 307–328. [Google Scholar] [CrossRef] [PubMed]
  37. Kamalipooya, S.; Fahimirad, S.; Abtahi, H.; Golmohammadi, M.; Satari, M.; Dadashpour, M.; Nasrabadi, D. Diabetic wound healing function of PCL/cellulose acetate nanofiber engineered with chitosan/cerium oxide nanoparticles. Int. J. Pharm. 2024, 653, 123880. [Google Scholar] [CrossRef]
  38. Silina, E.V.; Stupin, V.A.; Manturova, N.E.; Ivanova, O.S.; Popov, A.L.; Mysina, E.A.; Artyushkova, E.B.; Kryukov, A.A.; Dodonova, S.A.; Kruglova, M.P.; et al. Influence of the Synthesis Scheme of Nanocrystalline Cerium Oxide and Its Concentration on the Biological Activity of Cells Providing Wound Regeneration. Int. J. Mol. Sci. 2023, 24, 14501. [Google Scholar] [CrossRef]
  39. ISO 10993-5; Biological Evaluation of Medical Devices—Part 5: Tests for in vitro Cytotoxicity. International Organization for Standardization: Geneva, Switzerland, 2009.
  40. Walters, G.; Pountos, I.; Giannoudis, P.V. The cytokines and micro-environment of fracture haematoma: Current evidence. J. Tissue Eng. Regen. Med. 2018, 12, E1662–E1677. [Google Scholar] [CrossRef]
  41. Snyder, R.J.; Lantis, J.; Kirsner, R.S.; Shah, V.; Molyneaux, M.; Carter, M.J. Macrophages: A review of their role in wound healing and their therapeutic use. Wound Repair Regen. 2016, 24, 613–629. [Google Scholar] [CrossRef]
  42. Axelsson, J.; Xu, D.; Kang, B.N.; Nussbacher, J.K.; Handel, T.M.; Ley, K.; Sriramarao, P.; Esko, J.D. Inactivation of heparan sulfate 2-O-sulfotransferase accentuates neutrophil infiltration during acute inflammation in mice. Blood 2012, 120, 1742–1751. [Google Scholar] [CrossRef]
  43. Zhou, Y.; Zhang, X.L.; Lu, S.T.; Zhang, N.Y.; Zhang, H.J.; Zhang, J.; Zhang, J. Human adipose-derived mesenchymal stem cells-derived exosomes encapsulated in pluronic F127 hydrogel promote wound healing and regeneration. Stem Cell Res. Ther. 2022, 13, 407. [Google Scholar] [CrossRef] [PubMed]
  44. Cuttle, L.; Nataatmadja, M.; Fraser, J.F.; Kempf, M.; Kimble, R.M.; Hayes, M.T. Collagen in the scarless fetal skin wound: Detection with Picrosirius-polarization. Wound Repair Regen. 2005, 13, 198–204. [Google Scholar] [CrossRef]
  45. Zielinska, W.; Zabrzynski, J.; Gagat, M.; Grzanka, A. The Role of TRPM2 in Endothelial Function and Dysfunction. Int. J. Mol. Sci. 2021, 22, 7635. [Google Scholar] [CrossRef] [PubMed]
  46. Lo, Y.Y.C.; Conquer, J.A.; Grinstein, S.; Cruz, T.F. Interleukin-1β induction of c-fos and collagenase expression in articular chondrocytes: Involvement of reactive oxygen species. J. Cell. Biochem. 1998, 69, 19–29. [Google Scholar] [CrossRef]
  47. Sundaram, B.; Kanneganti, T.D. Advances in Understanding Activation and Function of the NLRC4 Inflammasome. Int. J. Mol. Sci. 2021, 22, 1048. [Google Scholar] [CrossRef]
  48. Whitehead, N.P. Enhanced autophagy as a potential mechanism for the improved physiological function by simvastatin in muscular dystrophy. Autophagy 2016, 12, 705–706, Editorial Material. [Google Scholar] [CrossRef] [PubMed]
  49. McGeachy, M.J.; Cua, D.J.; Gaffen, S.L. The IL-17 Family of Cytokines in Health and Disease. Immunity 2019, 50, 892–906. [Google Scholar] [CrossRef]
  50. Lee, H.J.; Choi, S.C.; Choi, E.Y.; Lee, M.H.; Seo, G.S.; Kim, E.C.; Yang, B.J.; Lee, M.S.; Shine, Y.I.; Park, K.I.; et al. Iron chelator induces MIP-3α/CCL20 in human intestinal epithelial cells: Implication for triggering mucosal adaptive immunity. Exp. Mol. Med. 2005, 37, 297–310. [Google Scholar] [CrossRef]
  51. Mishra, P.; Lee, J.; Kumar, D.; Lauro, R.O.; Costa, N.; Pathania, D.; Kumar, S.; Lee, J.; Singh, L. Engineered Nanoenzymes with Multifunctional Properties for Next-Generation Biological and Environmental Applications. Adv. Funct. Mater. 2022, 32, 21. [Google Scholar] [CrossRef]
  52. Karmakar, A.; Zhang, Q.L.; Zhang, Y.B. Neurotoxicity of nanoscale materials. J. Food Drug Anal. 2014, 22, 147–160. [Google Scholar] [CrossRef] [PubMed]
  53. Wu, J.J.X.; Wang, X.Y.; Wang, Q.; Lou, Z.P.; Li, S.R.; Zhu, Y.Y.; Qin, L.; Wei, H. Nanomaterials with enzyme-like characteristics (nanozymes): Next-generation artificial enzymes (II). Chem. Soc. Rev. 2019, 48, 1004–1076. [Google Scholar] [CrossRef] [PubMed]
  54. Klein, A.S.; Leiss-Maier, F.; Mühlhofer, R.; Boesen, B.; Mustafa, G.; Kugler, H.; Zeymer, C. A De Novo Metalloenzyme for Cerium Photoredox Catalysis. J. Am. Chem. Soc. 2024, 146, 25976–25985. [Google Scholar] [CrossRef]
  55. Abdelhamid, H.N.; Mahmoud, G.A.E.; Sharmoukh, W. A cerium-based MOFzyme with multi-enzyme-like activity for the disruption and inhibition of fungal recolonization. J. Mat. Chem. B 2020, 8, 7548–7556. [Google Scholar] [CrossRef] [PubMed]
  56. Das, M.; Patil, S.; Bhargava, N.; Kang, J.F.; Riedel, L.M.; Seal, S.; Hickman, J.J. Auto-catalytic ceria nanoparticles offer neuroprotection to adult rat spinal cord neurons. Biomaterials 2007, 28, 1918–1925. [Google Scholar] [CrossRef]
  57. Yadav, N.; Singh, S. Polyoxometalate-Mediated Vacancy-Engineered Cerium Oxide Nanoparticles Exhibiting Controlled Biological Enzyme-Mimicking Activities. Inorg. Chem. 2021, 60, 7475–7489. [Google Scholar] [CrossRef]
  58. Li, J.H.; Wen, J.; Li, B.; Li, W.; Qiao, W.; Shen, J.; Jin, W.H.; Jiang, X.Q.; Yeung, K.W.K.; Chu, P.K. Valence State Manipulation of Cerium Oxide Nanoparticles on a Titanium Surface for Modulating Cell Fate and Bone Formation. Adv. Sci. 2018, 5, 1700678. [Google Scholar] [CrossRef]
  59. Mehta, A.; Scammon, B.; Shrake, K.; Bredikhin, M.; Gil, D.; Shekunova, T.; Baranchikov, A.; Ivanov, V.; Reukov, V. Nanoceria: Metabolic interactions and delivery through PLGA-encapsulation. Mater. Sci. Eng. C-Mater. Biol. Appl. 2020, 114, 111003. [Google Scholar] [CrossRef]
  60. My Kieu, H.; Yoo Jin, S.; Tae Hyun, Y. Effects of agglomeration on in vitro dosimetry and cellular association of silver nanoparticles. Environ. Sci. Nano 2018, 5, 446–455. [Google Scholar] [CrossRef]
  61. Masui, T.; Hirai, H.; Imanaka, N.; Adachi, G.; Sakata, T.; Mori, H. Synthesis of cerium oxide nanoparticles by hydrothermal crystallization with citric acid. J. Mater. Sci. Lett. 2002, 21, 489–491. [Google Scholar] [CrossRef]
  62. Wang, Y.L.; Lee, Y.H.; Chou, C.L.; Chang, Y.S.; Liu, W.C.; Chiu, H.W. Oxidative stress and potential effects of metal nanoparticles: A review of biocompatibility and toxicity concerns. Environ. Pollut. 2024, 346, 123617. [Google Scholar] [CrossRef]
  63. Selvaraj, S.; Chauhan, A.; Radhakrishnan, A.; Rana, G.; Dutta, V.; Batoo, K.M.; Ghotakar, S. Cerium Oxide Nanoparticles and Their Polymeric Composites: Advancements in Biomedical Applications. J. Inorg. Organomet. Polym. Mater. 2024, 34, 5691–5717. [Google Scholar] [CrossRef]
  64. Huangfu, Y.N.; Li, S.Y.; Deng, L.D.; Zhang, J.H.; Huang, P.S.; Feng, Z.J.; Kong, D.L.; Wang, W.W.; Dong, A.J. Skin-Adaptable, Long-Lasting Moisture, and Temperature-Tolerant Hydrogel Dressings for Accelerating Burn Wound Healing without Secondary Damage. ACS Appl. Mater. Interfaces 2021, 13, 59695–59707. [Google Scholar] [CrossRef]
  65. Naseri-Nosar, M.; Farzamfar, S.; Sahrapeyma, H.; Ghorbani, S.; Bastami, F.; Vaez, A.; Salehi, M. Cerium oxide nanoparticle-containing poly (ε-caprolactone)/gelatin electrospun film as a potential wound dressing material: In vitro and in vivo evaluation. Mater. Sci. Eng. C-Mater. Biol. Appl. 2017, 81, 366–372. [Google Scholar] [CrossRef] [PubMed]
  66. Huang, Y.Z.; Zheng, Y.X.; Zhou, Y.; Xu, F.; Cui, Y.Z.; Chen, X.Y.; Wang, Z.Y.; Yan, B.X.; Zheng, M.; Man, X.Y. OAS1, OAS2, and OAS3 Contribute to Epidermal Keratinocyte Proliferation by Regulating Cell Cycle and Augmenting IFN-1-Induced Jak1-Signal Transducer and Activator of Transcription 1 Phosphorylation in Psoriasis. J. Investig. Dermatol. 2022, 142, 2635–2645. [Google Scholar] [CrossRef]
  67. Zheng, J.; Wang, J.; Liu, H.; Chen, F.; Wang, H.; Chen, S.; Xie, J.; Zheng, Z.; Li, Z. Alarmins S100A8/A9 promote intervertebral disc degeneration and inflammation-related pain in a rat model through toll-like receptor-4 and activation of the NF-κB signaling pathway. Osteoarthr. Cartil. 2022, 30, 998–1011. [Google Scholar] [CrossRef] [PubMed]
  68. Goswami, A.B.; Karadarevic, D.; Castaño-Rodríguez, N. Immunity-related GTPase IRGM at the intersection of autophagy, inflammation, and tumorigenesis. Inflamm. Res. 2022, 71, 785–795. [Google Scholar] [CrossRef] [PubMed]
  69. Larouche, J.; Sheoran, S.; Maruyama, K.; Martino, M.M. Immune Regulation of Skin Wound Healing: Mechanisms and Novel Therapeutic Targets. Adv. Wound Care 2018, 7, 209–231. [Google Scholar] [CrossRef]
  70. Ren, S.S.; Zhou, Y.; Zheng, K.; Xu, X.W.; Yang, J.; Wang, X.Y.; Miao, L.Y.; Wei, H.; Xu, Y. Cerium oxide nanoparticles loaded nanofibrous membranes promote bone regeneration for periodontal tissue engineering. Bioact. Mater. 2022, 7, 242–253. [Google Scholar] [CrossRef]
  71. Zhao, Q.; Chen, J.Q.; Tang, J.J.; Lei, X.Y.; Zhang, J.Z.; Zhang, Y.L.; Li, J.D.; Zuo, Y.; Li, Y.B. Self-Activating Phosphorus-Rich Substrate Import Enzyme Catalytic Domains for Bone Regeneration. Adv. Funct. Mater. 2024, 34, 2316428. [Google Scholar] [CrossRef]
  72. ISO 11137-2; Sterilization of Health Care Products–Radiation–Part 2: Establishing the Sterilization Dose. International Organization for Standardization: Geneva, Switzerland, 2006.
  73. Davoudabadi, M.; Fahimirad, S.; Ganji, A.; Abtahi, H. Wound healing and antibacterial capability of electrospun polyurethane nanofibers incorporating Calendula officinalis and Propolis extracts. J. Biomater. Sci.-Polym. Ed. 2023, 34, 1491–1516. [Google Scholar] [CrossRef] [PubMed]
  74. Salehi, M.; Farzamfar, S.; Bastami, F.; Tajerian, R. Fabrication and characterization of electrospun PLLA/collagen nanofibrous scaffold coated with chitosan to sustain release of aloe vera gel for skin tissue engineering. Biomed. Eng. Appl. Basis Commun. 2016, 28, 1650035. [Google Scholar] [CrossRef]
  75. Zhu, Y.; Matsumura, Y.; Velayutham, M.; Foley, L.M.; Hitchens, T.K.; Wagner, W.R. Reactive oxygen species scavenging with a biodegradable, thermally responsive hydrogel compatible with soft tissue injection. Biomaterials 2018, 177, 98–112. [Google Scholar] [CrossRef]
  76. Taciak, B.; Bialasek, M.; Braniewska, A.; Sas, Z.; Sawicka, P.; Kiraga, L.; Rygiel, T.; Król, M. Evaluation of phenotypic and functional stability of RAW 264.7 cell line through serial passages. PLoS ONE 2018, 13, 13. [Google Scholar] [CrossRef] [PubMed]
Scheme 1. Engineered polyurethane core–shell fibers embedding nanoceria for wound healing. (a) The fabrication process of composite fiber membranes. The gray arrows refer to the TEM microstructure of the core-shell fiber membrane. (b) The in vitro immunomodulatory effects of composite fiber membranes. The curved black arrows refer to the loading of SOD or M-nanospheres. (c) The enhancing effect of composite fiber membranes in the wound healing process. The black arrow in the shape of a tree fork refers to the result of a combination of two (M1 and M2 type macrophages) or three (inflammatory regulation, fibroblast activation and collagen deposition). Created with BioRender.com.
Catalysts 15 00617 sch001
Figure 1. Characterization and analysis of CeO2 nanoparticles exhibiting diverse morphologies. (A) TEM images of CeO2 nanoparticles. (B) Particle size distribution measured by ImageJ (ImageJ 1.53k). (C) XPS spectra of Ce 3d. (D) Zeta potential. (E) XRD pattern. (F) Raman spectra. (G) OH scavenging efficiency of different nanoparticles and SOD (n = 3). (H) O2•− scavenging efficiency of different nanoparticles and SOD (n = 3); ** p < 0.01, *** p < 0.001.
Catalysts 15 00617 g001
Figure 2. Characterization of PU CSF membranes embedded with M-nanospheres at varying concentrations. (A,B) SEM images of Ce0@P and S@P. (B,C) are images with different magnifications of S@P. (DF) SEM images of samples Ce1@P, Ce2@P, and Ce3@P. (GI) EDS surface mapping of the Ce element (violet) corresponding to images (DF). Scale bar: 4 μm. (J) The EDS point scan images acquired from point S of image (C). (K) Water absorption (n = 3). (L) Water vapor transmission rate (WVTR) (n = 3). The two red dashed lines represent the effective ranges of WVTR, 1999.2 and 2500.8 g/m2/d [36]. (M) High resolution of TEM image of Ce1@P core–shell fiber structure. Ceria nanoparticles in red circles. (N) Raman spectroscopy. The yellow dashed box at 440–480 cm−1 is the range of F2g characteristic peaks for ceria nanoparticles and the gray dashed box at 500–550 cm−1 is the range of S-S bond characteristic peaks for SOD. (O) OH scavenging activity tested by the same experimental method as in 2.4.4 (n = 3). (P) SOD-mimetic activity tested by the same experimental method as in 2.4.4 (n = 3). * p < 0.05, ** p < 0.01, *** p < 0.001, NS: no significant difference.
Catalysts 15 00617 g002
Figure 3. Biocompatibility and ROS scavenging ability regulated by engineered PU CSF membranes in vitro. (A) The cell viability of L929 with membranes measured by CCK-8 assay (n = 5). The red dashed line represents the 70% cell viability from the ISO standard. (B) Schematic diagram of ROS scavenging in RAW 264.7 macrophages and L929 fibroblast cells cultured with membranes. Created with BioRender.com. (C) Fluorescence images of ROS produced by RAW 264.7 cells co-cultured with membranes under LPS-induced stimulation. Scale bars: 200 µm. (D) Fluorescence images of ROS produced by L929 cells co-cultured with membranes under an inflammatory environment induced by H2O2. Scale bars: 100 µm. DCFH-DA as ROS probe: green fluorescence; * p < 0.05, ** p < 0.01, *** p < 0.001. Ctrl group: Blank control group without engineered PU CSFs.
Catalysts 15 00617 g003
Figure 4. After 6 h of LPS treatment, the polarization of RAW264.7 macrophages regulated by engineered PU CSF membranes. (A,B) Fluorescence images of TNF-α-positive M1 phenotype shown in green. (C) Semi-quantitative analysis of the mean fluorescence intensity of TNF-α (green) (n = 3). (D,E) CD206-positive M2 phenotype shown in red. (F) Semi-quantitative analysis of the mean fluorescence intensity of CD206 (red) (n = 3); ** p < 0.01, *** p < 0.001; NS, no significant difference; Ctrl group: Blank control group without engineered PU CSFs.
Catalysts 15 00617 g004
Figure 5. Evaluation of wound healing effect when treated with various membranes. (A) Representative images of wound healing on 0, 3, 7, and 14 days after surgery and simulated healing process of the wounds by ImageJ. (B) Quantification of wound area (n = 3). (C) Representative image of wound with H&E staining after 14 days of treatment. (D) Representative image of wound with Masson’s trichrome staining after 14 days of treatment. * p < 0.05, ** p < 0.01, *** p < 0.001; NS, no significant difference. Ctrl group: Blank control without engineered PU CSFs.
Catalysts 15 00617 g005
Figure 6. Immunofluorescence staining of skin tissues after 14 days of application of various membranes in full-thickness wounds. (A) Immunofluorescence staining for TNF-α (green), CD206 (red), and TGF-β (red) in different PU CSF groups. Scale bar: 50 μm. (BD) Semi-quantitative analysis of the fluorescence intensity of TNF-α, CD206, and TGF-β in different PU CSF groups. (n = 3), * p < 0.05, ** p < 0.01, *** p < 0.001; NS, no significant difference. Ctrl group: Blank control without engineered PU CSFs.
Catalysts 15 00617 g006
Figure 7. Representative images of H&E staining of various organs (heart, liver, spleen, lungs, and kidneys) of rats after 14 days of treatment in different experimental groups. Ctrl group: Blank control without engineered PU CSFs.
Catalysts 15 00617 g007
Figure 8. Bioinformatics analysis of gene expression profiles. (A) The volcano plots display genes with different expressions (gray represents non-significant genes; red represents upregulated genes; and blue represents downregulated genes). (B) Analysis of differential gene enrichment within the KEGG pathways in the Ce2@P and Ctrl groups. (C) Heat maps of genes related to oxidative stress and immune response in the KEGG pathways in the Ce2@P and Ctrl groups. Orange boxes are oxidative stress-related genes regulated by the Ce2@P group that differ from those regulated by the S@P group, and blue boxes are immune response-related genes regulated by the Ce2@P group that differ from those regulated by the S@P group. (D) Analysis of differential gene enrichment within the KEGG pathways in the S@P and Ctrl groups. (E) Heat maps of genes related to oxidative stress and immune response in the KEGG pathways in the S@P and Ctrl groups. Blue boxes show different immune response-related genes regulated by the S@P group versus those regulated by the Ce2@P group. Red indicates upregulated gene expression and blue indicates downregulated gene expression. Each column in the thermal graph represents a sample and each row represents a gene. Ctrl group: Blank control group without engineered PU CSFs.
Catalysts 15 00617 g008
Scheme 2. Differential mechanisms and biological responses of the engineered membranes loaded with enzyme-mimetic nanoceria versus the natural SOD enzyme in enhanced skin wound healing. The blue arrows point to the direction of the mechanism of action of nanoceria and SOD, and the larger black elongated arrows point to the types of genes enriched in the two signaling pathways. The arrows next to the fibroblasts point to a decrease in ROS, and the arrows that do not go on to describe the experimental procedure refer to the experimental procedure. Created with BioRender.com.
Catalysts 15 00617 sch002
Table 1. Characterizations of CeO2 nanoparticles.
CeO2
Nanocrystals
Size Distribution
from TEM (nm, n = 150)
BET Surface Area
(m2/g)
Ce3+
(%)
I600/I460
Nanorods11 ± 2.7 (width)57.224.150.039
Nanocubes8 ± 1.696.020.510.023
Nanospheres5 ± 0.7123.833.130.043
M-nanospheres5 ± 0.777.319.660.020
Table 2. Comparison and summary of SOD-mimicking nanoenzymes.
TypesStabilityBiocompatibilityCost
Cerium-basedExcellentExcellentLow
Manganese-basedStable in acidic environmentsMediumLow
Pt/Pd NPsExcellentPoorHigh
Table 3. Combinations and abbreviations (Abb) of the engineered polyurethane core–shell fibers (PU CSFs).
GroupsAbb.PU/HFIP
(wt/vol%)
Core: PCL/TFE
(wt/vol%)
Shell: CeO2/PU
(wt%)
SOD (0.001 mg/mL)
CeO2-0@PU CSFsCe0@P3.5120/
CeO2-1@PU CSFsCe1@P3.5125/
CeO2-2@PU CSFsCe2@P3.51210/
CeO2-3@PU CSFsCe3@P3.51215/
SOD@PU CSFsS@P3.512/50 μL
Disclaimer/Publisher’s Note: The statements, opinions and data contained in all publications are solely those of the individual author(s) and contributor(s) and not of MDPI and/or the editor(s). MDPI and/or the editor(s) disclaim responsibility for any injury to people or property resulting from any ideas, methods, instructions or products referred to in the content.

