2.1. Analysis of Catalyst Morphology and Physical Structure
Bi
2WO
6/CFb and Bi
2WO
6/Bi
2S
3/CFb composite photocatalytic materials were synthesized by a two-step synthesis method. In the first step, the Bi
2WO
6 crystal species (Bi ions and W ions) were loaded onto the surface of the carbon fiber using the strong adhesion and self-polymerization of polydopamine. As shown in
Figure 1a, the carbon fibers prepared from bamboo pulp fibers are elongated fibers with a diameter of about 5 µm, and the longitudinal surface of the fibers is very smooth with many grooves. From
Figure 1b–d, it can be observed that the surface of the carbon fibers became rough, with many particles adhering to the fiber surface, and some of the particles showed a laminar structure after immersing the carbon fibers in a mixture of dopamine, Bi(NO
3)
3·5H
2O and (NH
4)
6H
2W
12O
40).
Figure S3 showed the SEM-EDS diagram of the carbon fibers loaded with Bi
2 WO
6 crystal species (Bi ions and W ions), from which it can be observed that Bi and W elements were uniformly distributed on the surface of the carbon fiber, indicating that the Bi
2WO
6 crystal species (Bi ions and W ions) were uniformly adhered to the surface of the carbon fiber through the polymerization and adhesion of polydopamine.
In the second step of the two-step synthesis method, carbon fibers loaded with Bi
2WO
6 crystalline species were used as substrates to form CFb/Bi
2WO
6 and Bi
2WO
6/Bi
2S
3/CFb composite photocatalytic fibers on the surface of carbon fibers by the solvent–thermal method via an in situ growth method, and the SEM images of the specimens are shown in
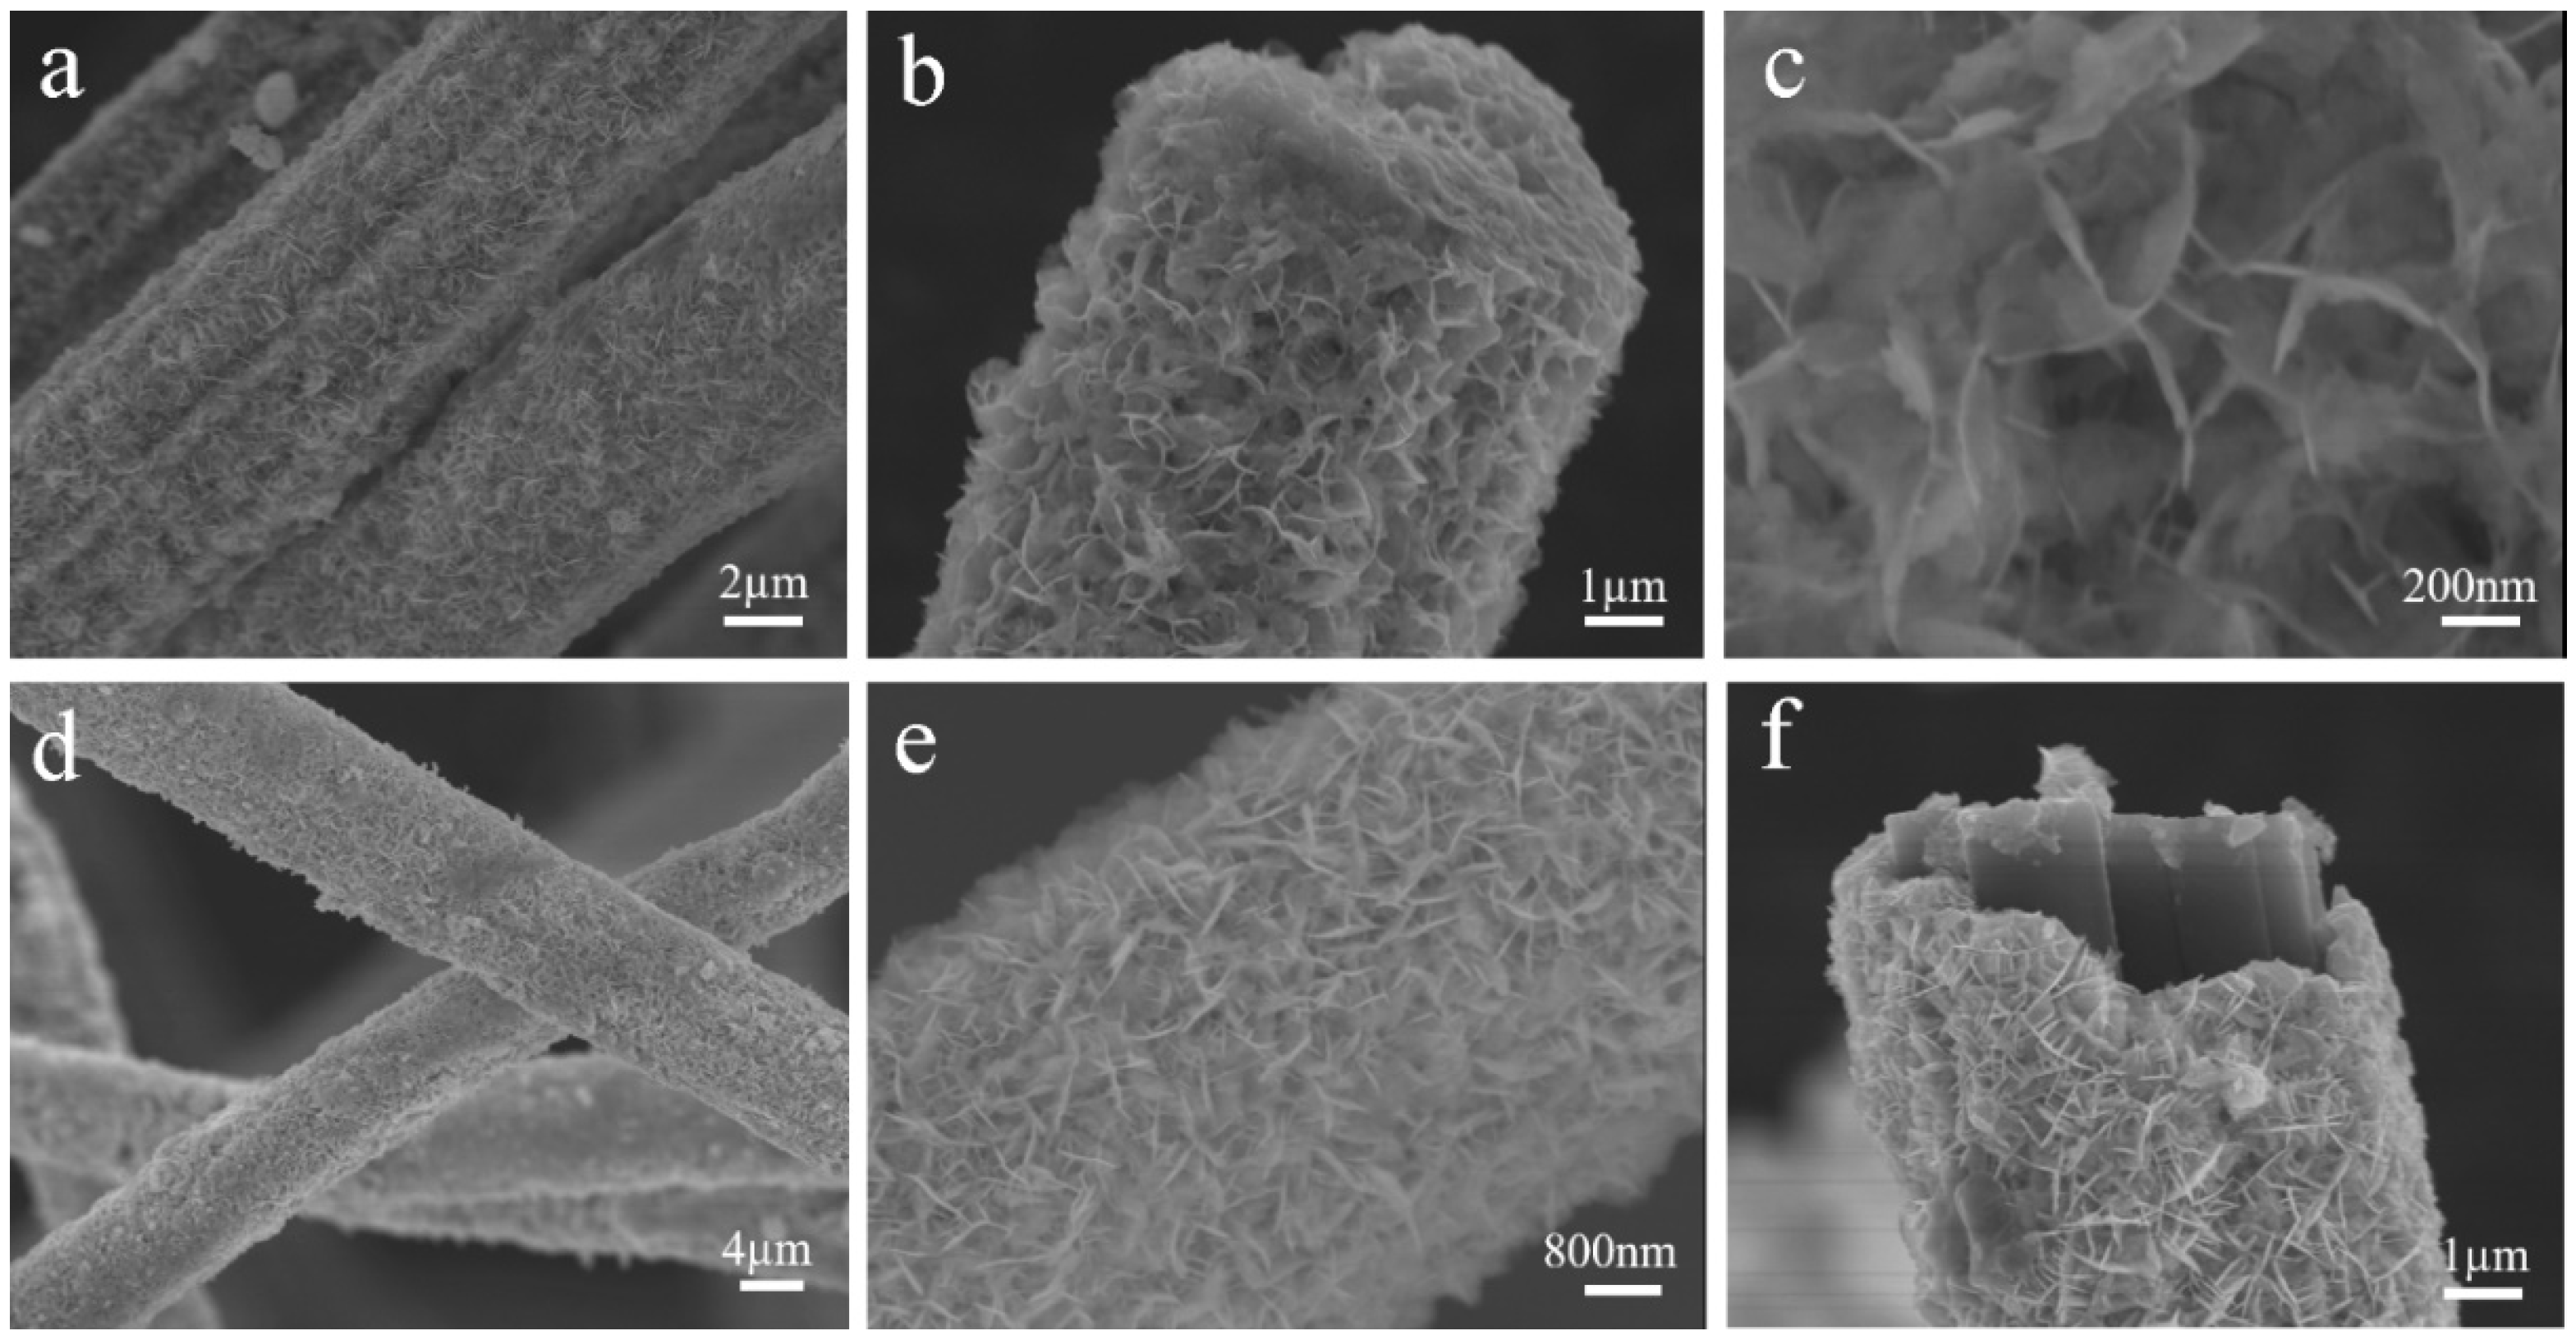
Figure 2.
Figure 2a–c show the SEM images of CFb/Bi
2WO
6 specimens with different magnifications, from which it can be seen that the Bi
2WO
6 nanoflake layer was flower-like, encapsulated on the surface of the carbon fiber, and the encapsulation was relatively uniform and complete. From
Figure 2c, it can be observed that the thickness of the Bi
2WO
6 nanoflake layer on the surface of CFb/Bi
2WO
6 was about 10 nm, which grew uniformly and perpendicularly on the surface of the carbon fiber.
Figure 2d–f show SEM images of Bi
2WO
6/Bi
2S
3/CFb specimens with different ratios, whose surface morphology was similar to that of CFb/Bi
2WO
6. The Bi
2S
3 material was not clearly observed from
Figure 2d–f, which may be due to the low content of Bi
2S
3 and the limitation of resolution, which made it difficult to distinguish the Bi
2S
3 material. To further confirm the presence of Bi
2S
3 material, the Bi
2WO
6/Bi
2S
3/CFb specimens were analyzed by SEM-EDS. The elemental mapping in
Figure S4 shows that the elements Bi, W, S and O were uniformly distributed on the surface of the carbon fiber, but the content of the S element was relatively low.
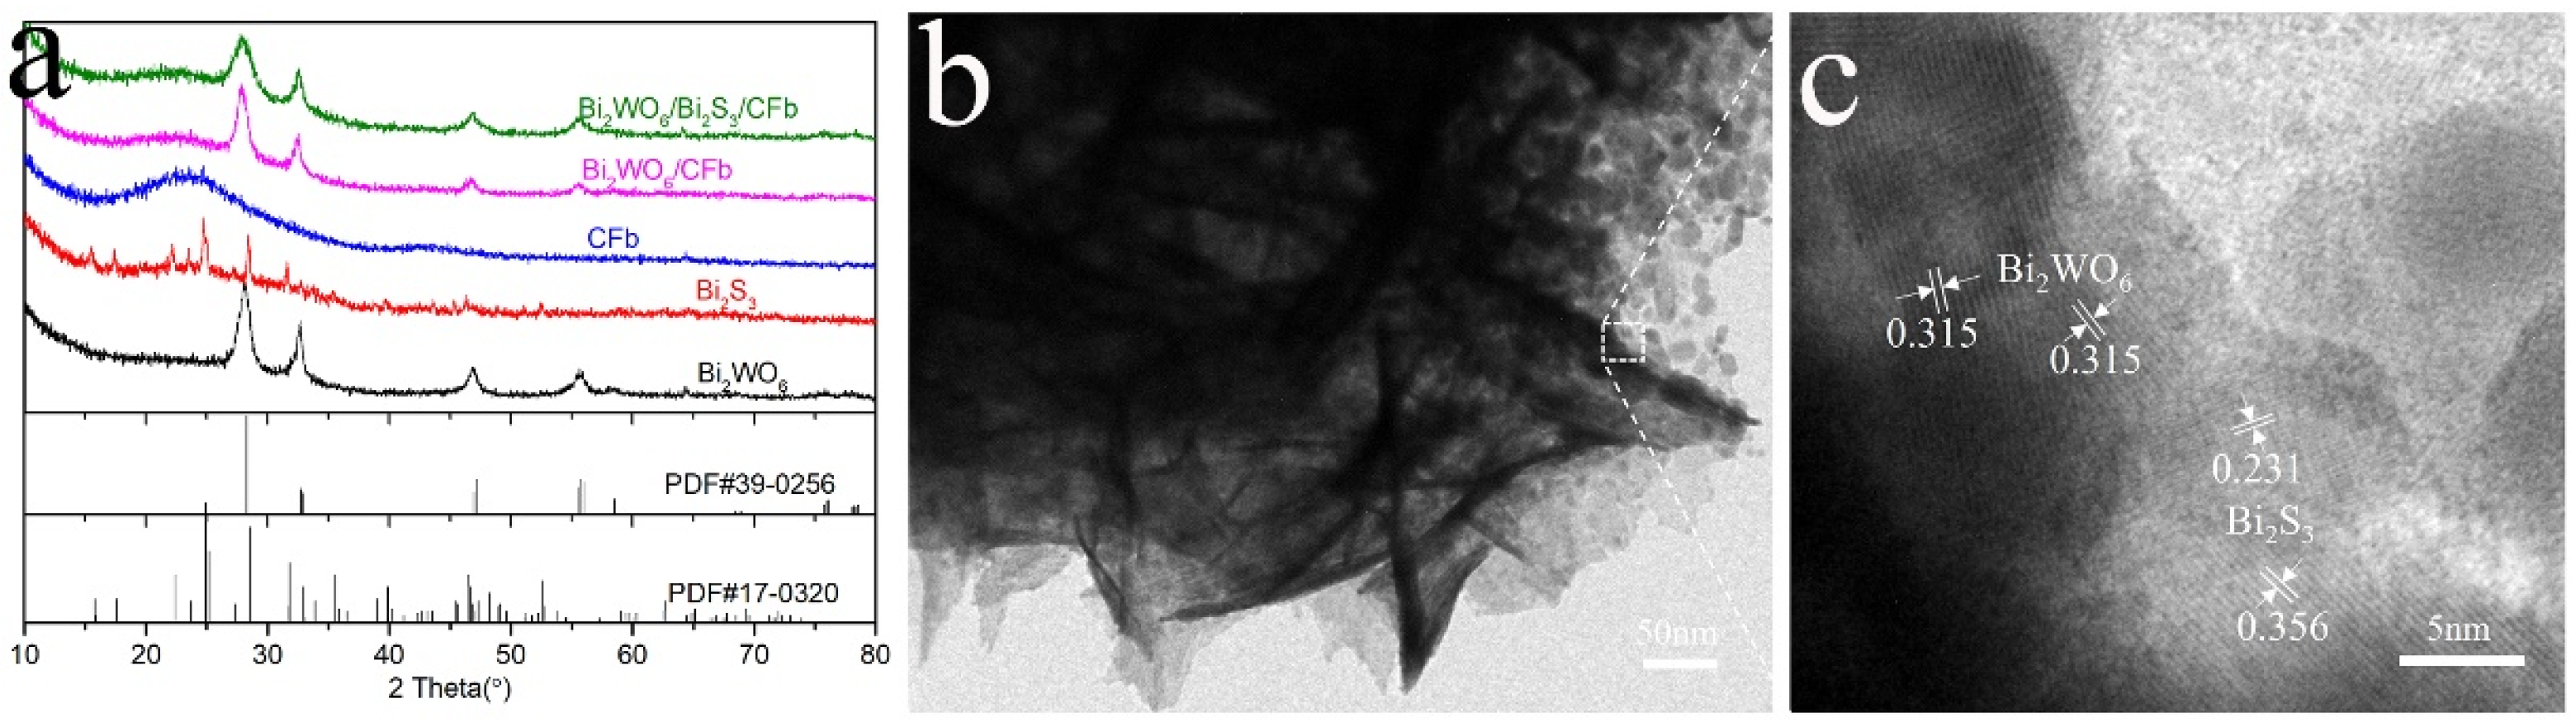
XRD was applied to detect and analyze the crystal structure of the samples. As shown in
Figure 3a, the pure Bi
2WO
6 specimen showed significant peaks at 28.0°, 32.5°, 46.6°, 47.0° and 55.9°, which corresponded to the (131), (060), (260), (202) and (331) facets of Bi
2WO
6 (JCPDS#39-0256) [
13]. The pure Bi
2S
3 specimen showed strong diffraction peaks at 15.7°, 17.4°, 22.2°, 23.6°, 24.8°, 28.5° and 31.7°, which were attributed to the (020), (120), (220), (101), (130), (211) and (221) facets of Bi2S3 (JCPDS#17-0320) [
14]. The remarkable characteristic peaks of CFb/Bi
2WO
6 corresponded to those of Bi
2WO
6 (JCPDS#17-0320), indicating the successful loading of the aureoviris-structured Bi
2WO
6 on the surface of carbon fibers. The XRD spectra of Bi
2WO
6/Bi
2S
3/CFb were similar to that of CFb/Bi
2WO
6, but no obvious diffraction characteristic peaks of Bi
2S
3 were observed, which could be attributed to the relatively low content of Bi
2S
3. The microstructure of the Bi
2WO
6/Bi
2S
3/CFb composite fibers was further examined and analyzed by TEM and HRTEM, and the presence or absence of Bi
2S
3 was determined.
Figure 3b showed Bi
2WO
6/Bi
2S
3/CFb composite fibers that fell off from Bi
2WO
6/Bi
2S
3 nanomaterials, consisting of nanosheets and consistent with the previous SEM images.
Figure 3c shows the HRTEM image, which shows that the lattice spacing of 0.315 nm corresponded to the (131) crystallographic surface of Bi
2WO
6 [
15]. In addition, the lattice spacing of 0.356 nm and 0.231 nm could be attributed to the (130) and (041) crystal planes of Bi
2S
3 [
16], respectively, and this result suggested the presence of Bi
2S
3 material in Bi
2WO
6/Bi
2S
3/CFb.
In summary, the strong adhesion and self-polymerization properties of polydopamine were utilized to enable the uniform and complete encapsulation of Bi2WO6 and Bi2WO6/Bi2S3 nanosheets on the carbon fiber surface through a two-step method.
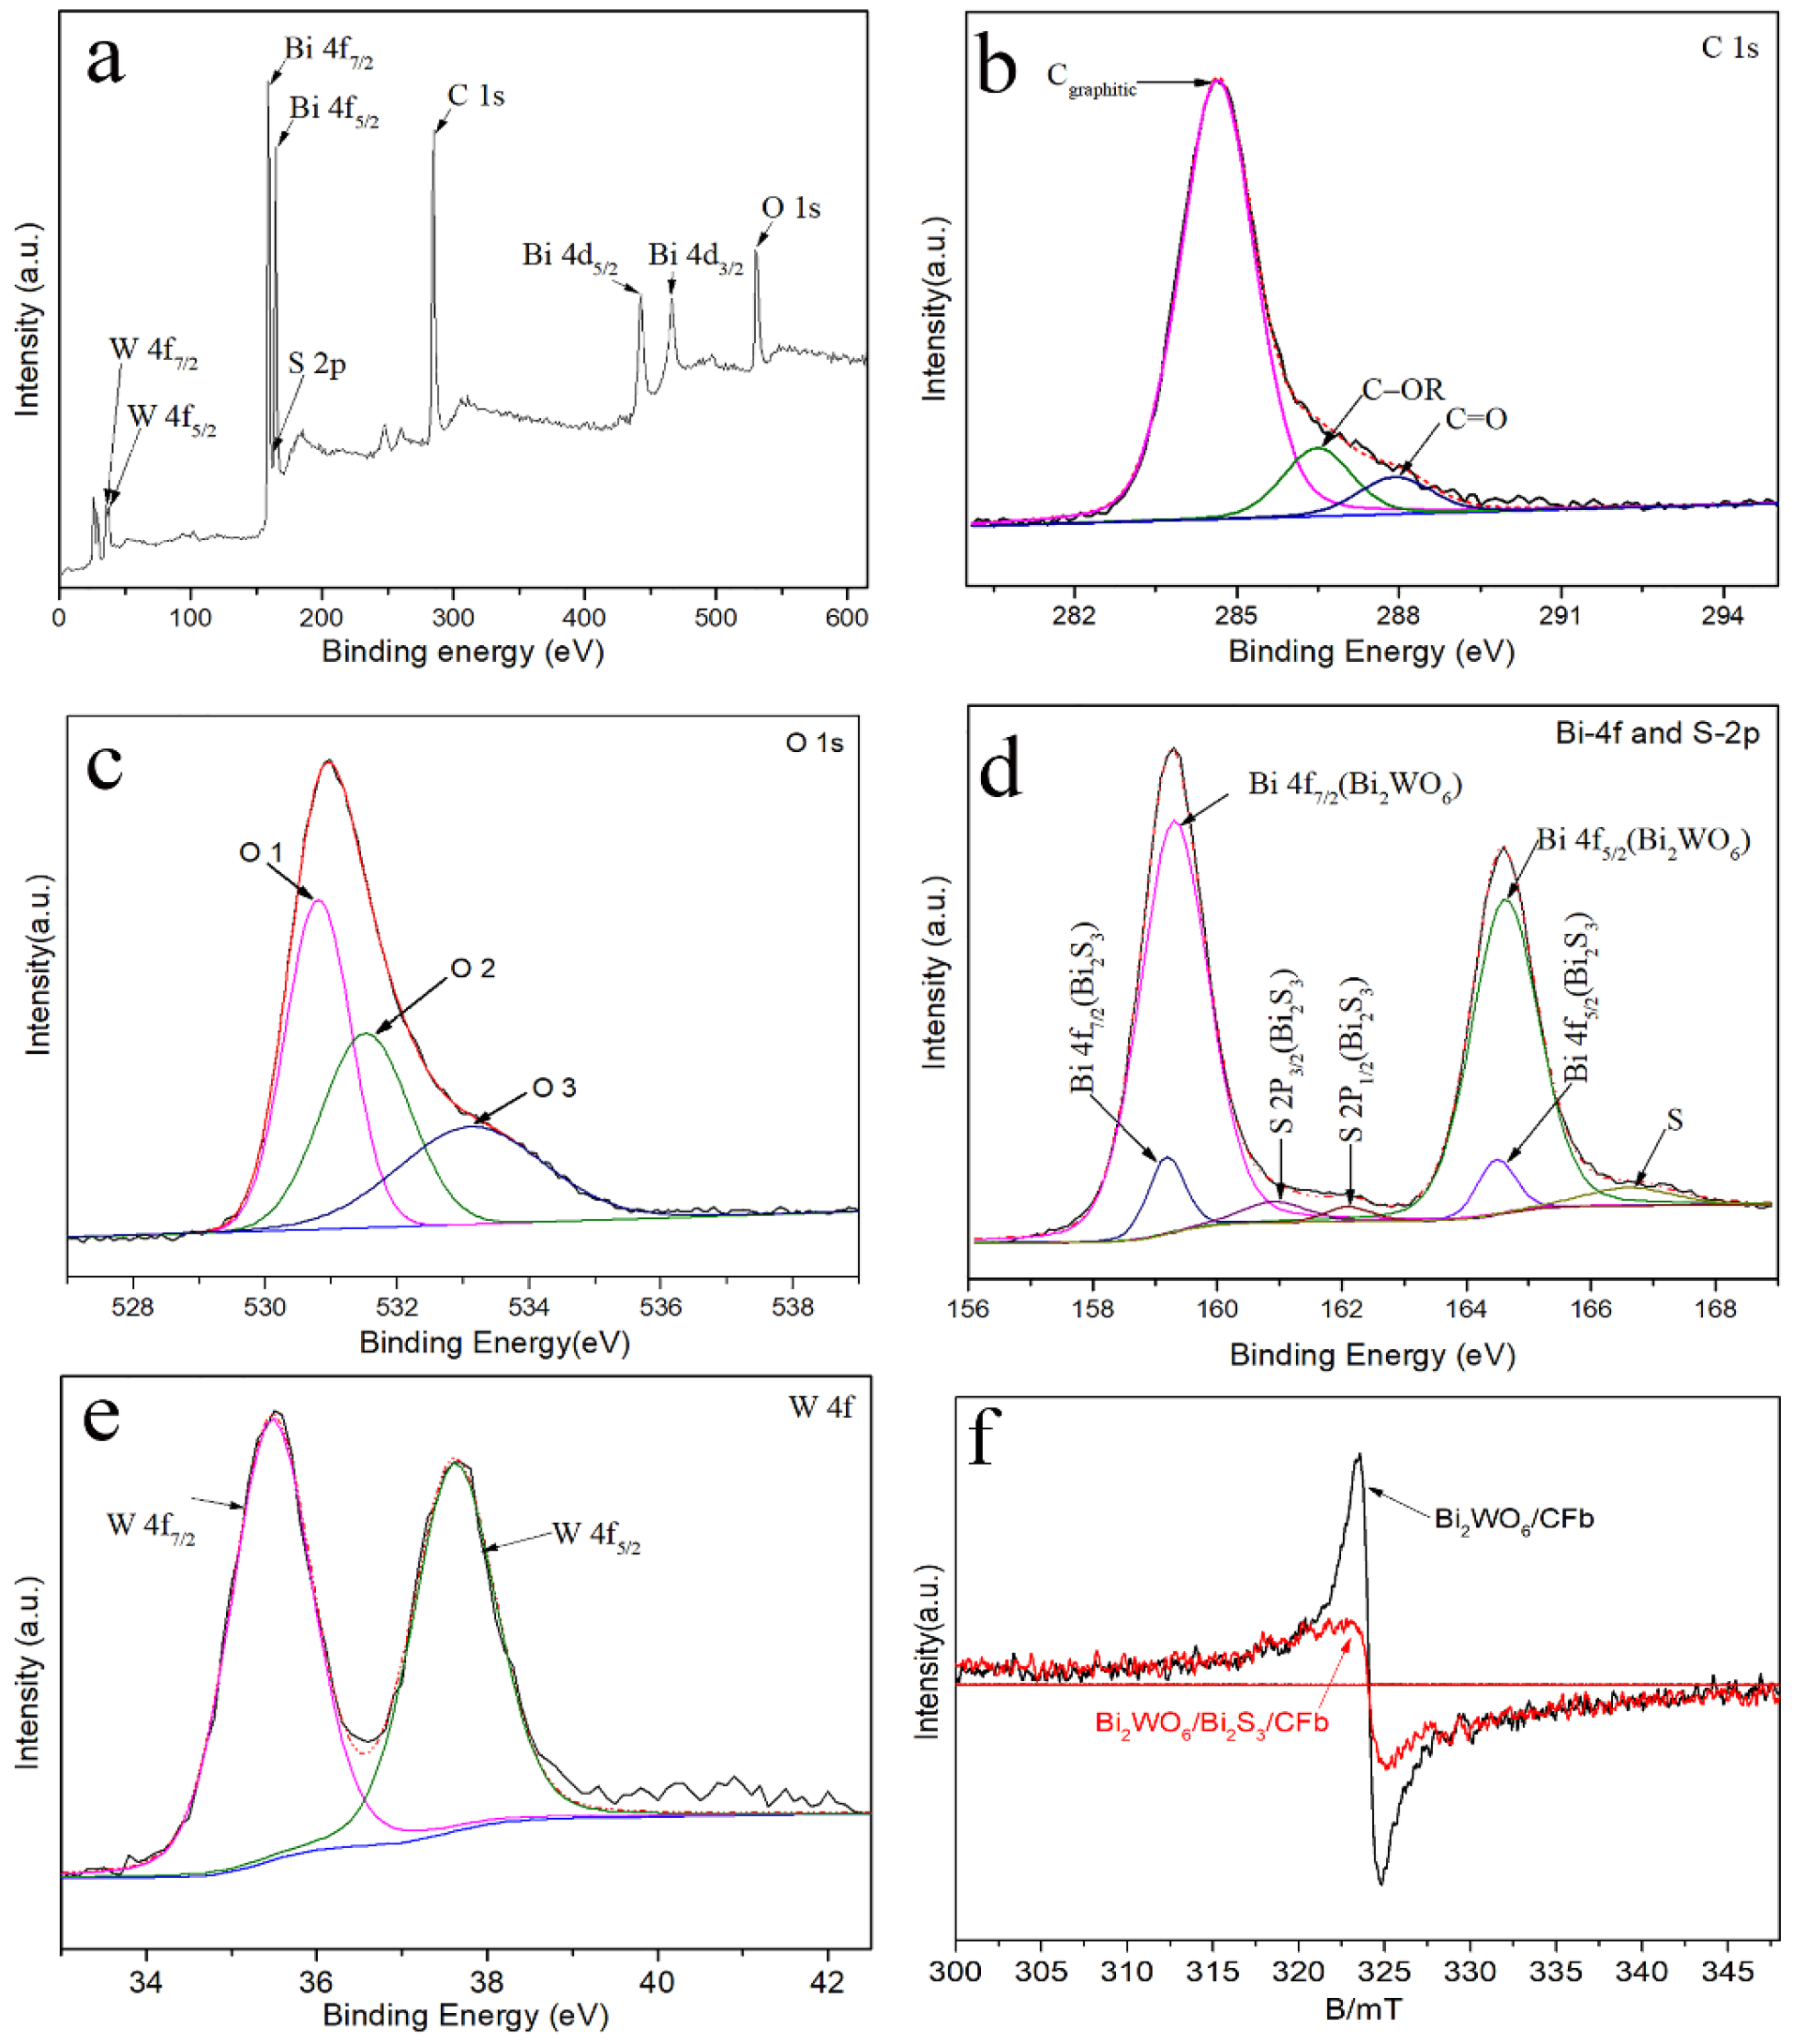
2.2. Surface and Valence Bond Analysis of Materials
The electronic states and surface chemical bonding of the Bi
2WO
6/Bi
2S
3/CFb composite fiber materials were analyzed by XPS measurements, and the results are detailed in
Figure 4a–e.
Figure 4a shows the full spectrum of Bi
2WO
6/Bi
2S
3/CFb, in which the characteristic signals of the elements C, Bi, W and O were more significant, while the signal of the element S was weaker. As shown in
Figure 4b, the high-resolution spectrum of the C 1s spectrum fitted to three characteristic peaks, and the fitted peak at 284.6 eV was attributed to the C–C bond of graphitic carbon, while the fitted peaks at 286.5 eV and 287.9 eV corresponded to the characteristic peaks of the C–O and C=O bonds. As shown in
Figure 4c, there were three fitted peaks in the spectrum of O 1s at 530.8 eV, 531.5 eV and 533.1 eV, where the peak at 530.8 eV corresponded to the lattice oxygen in Bi
2WO
6, and the peak at the binding energy of 531.5 eV corresponded to the surface adsorbed oxygen, while the peak at the binding energy of 533.1 eV corresponded to the adsorbed oxygen of oxygen vacancies, which suggested that there may be oxygen vacancies in the Bi
2WO
6 of Bi
2WO
6/Bi
2S
3/CFb photocatalytic fibers. As shown in
Figure 4d, the fitted peaks located at the binding energies of 159.3 eV and 164.6 eV in the spectrum of Bi 4f (with a difference of 5.3 eV between the two peaks) corresponded to Bi 4f7/2 and Bi 4f5/2 in Bi
2WO
6 [
17], whereas the fitted peaks located at 159.2 eV and 164.5 eV with weaker peak strength should belong to Bi 4f7/2 and Bi 4f5/2 in Bi
2S
3. In the spectra of S-2p, the weakly fitted peaks located at 160.9 eV and 162.1 eV were attributed to S 2p3/2 and S 2p3/2, with a distance of 1.2 eV between the two peaks, which suggested that the predominant state of the S atoms in Bi
2S
3 is S
2− [
17,
18]. In addition, the fitted peak located at 166.6 eV may represent the S–O bond [
19], which was attributed to the interaction of Bi
2S
3 nanoparticles and Bi
2WO
6 nanosheets. The weak intensity of the S-2p fitted peak may be attributed to the weaker content of Bi
2S
3 in the composites. As shown in
Figure 4e, the fitted peaks of W4f in Bi
2WO
6 were located at 35.5 eV and 37.6 eV, the spacing between the two peaks was 2.1 eV, and the main state of W atom in Bi
2WO
6 was W
6+ [
17,
18].
The presence of oxygen vacancies in Bi
2WO
6/CFb and Bi
2WO
6/Bi
2S
3/CFb materials was analyzed by EPR testing. As shown in
Figure 4f, there were oxygen vacancy signal peaks at g = 2.003 in Bi
2WO
6/CFb and Bi
2WO
6/Bi
2S
3/CFb, and the oxygen vacancy signal peaks of Bi
2WO
6/Bi
2S
3/CFb were stronger than those of Bi
2WO
6/CFb, suggesting that both Bi
2WO
6/CFb and Bi
2WO
6/Bi
2S
3/CFb materials had oxygen vacancies, but the number of oxygen vacancies decreased with the introduction of Bi
2S
3. In the photocatalyst synthesis process, ethylene glycol and methanol were used as solvents to load Bi
2WO
6 and Bi
2WO
6/Bi
2S
3 materials onto carbon fibers via an anhydrous solvothermal method. Ethylene glycol, with its higher viscosity and density and weaker polarity, was prone to forming oxygen vacancies in Bi
2WO
6 [
20]. However, the introduction of S ions during the preparation of Bi
2WO
6/Bi
2S
3/CFb could easily fill the oxygen vacancies.
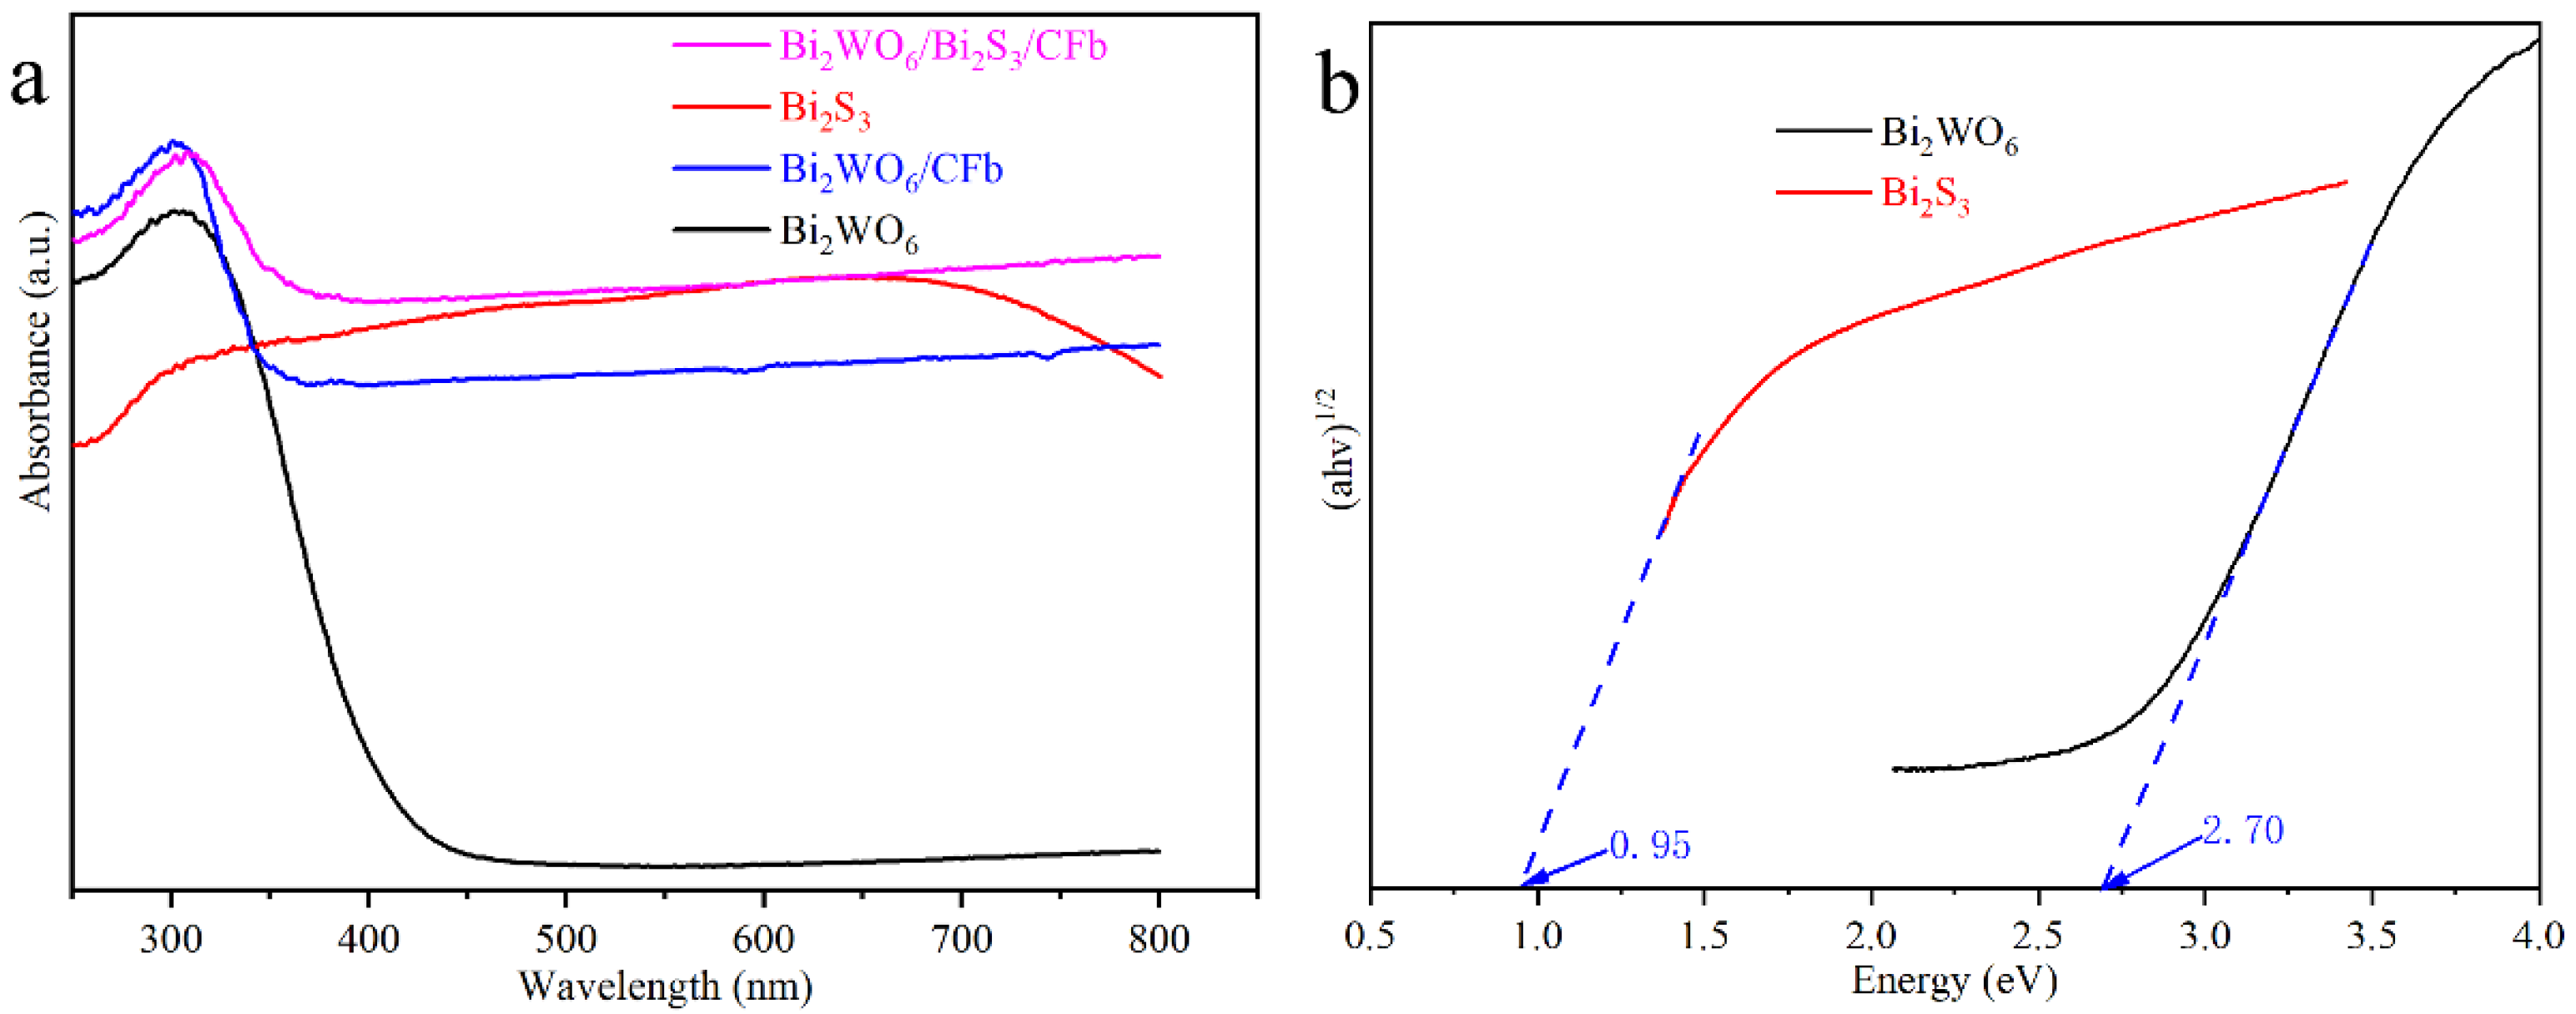
2.4. Optical and Photoelectrochemical Properties of Materials
The activity of photocatalysts is closely related to the light absorption properties of the catalysts, and the optical absorption properties of Bi
2WO
6, Bi
2S
3, Bi
2WO
6/CFb and Bi
2WO
6/Bi
2S
3/CFb were tested and investigated by using the UV-vis DRS. As shown in
Figure 5a, the optical absorption edge of Bi
2WO
6 was located around 420 nm, which was at the edge of the visible light absorption, and Bi
2WO
6/CFb had a certain optical absorption performance in the visible region compared with Bi
2WO
6, which is attributed to the black carbon fiber having good optical absorption performance. Bi
2S
3 showed excellent light absorption in the visible region and even in the near-infrared region. Therefore, the introduction of a small amount of Bi
2S
3 into the Bi
2WO
6/Bi
2S
3/CFb composite photocatalytic fibers significantly improved the light-absorbing properties of the composite fibers. According to Tauc’s law, the semiconductor forbidden bandwidth can be determined according to the absorption spectra. As shown in
Figure 5b, the bandgap widths of pure Bi
2WO
6 and Bi
2S
3 are about 2.70 and about 0.94 eV, respectively.
Here, the semiconductor types and energy band potentials of Bi
2WO
6 and Bi
2S
3 were further investigated by electrochemical Mott–Schottky experiments. As shown in
Figure S7, based on the Mott–Schottky equation and test curves, the slopes of the Mott–Schottky curves for Bi
2WO
6 and Bi
2S
3 were positive, which indicated that the Bi
2WO
6 and Bi
2S
3 catalysts were typical n-type semiconductors. By fitting, the flat-band potentials of pure Bi
2WO
6 and Bi
2S
3 can be inferred to be −0.16 eV and −0.52 eV (glymercury electrode). The saturated calomel electrode (SCE) potential (25 °C) is about 0.24 eV with respect to the standard hydrogen electrode (NHE) potential [
22]. For n-type semiconductors, the flat-band potential is 0.1 eV more positive than the CB potential [
23]. Therefore, the CB of Bi
2WO
6 and Bi
2S
3 should be about −0.02 and −0.38 eV with respect to the NHE by calculation. Combined with the bandgap widths, the VBs of Bi
2WO
6 and Bi
2S
3 can be determined to be about 2.68 eV and 0.57 eV, respectively.
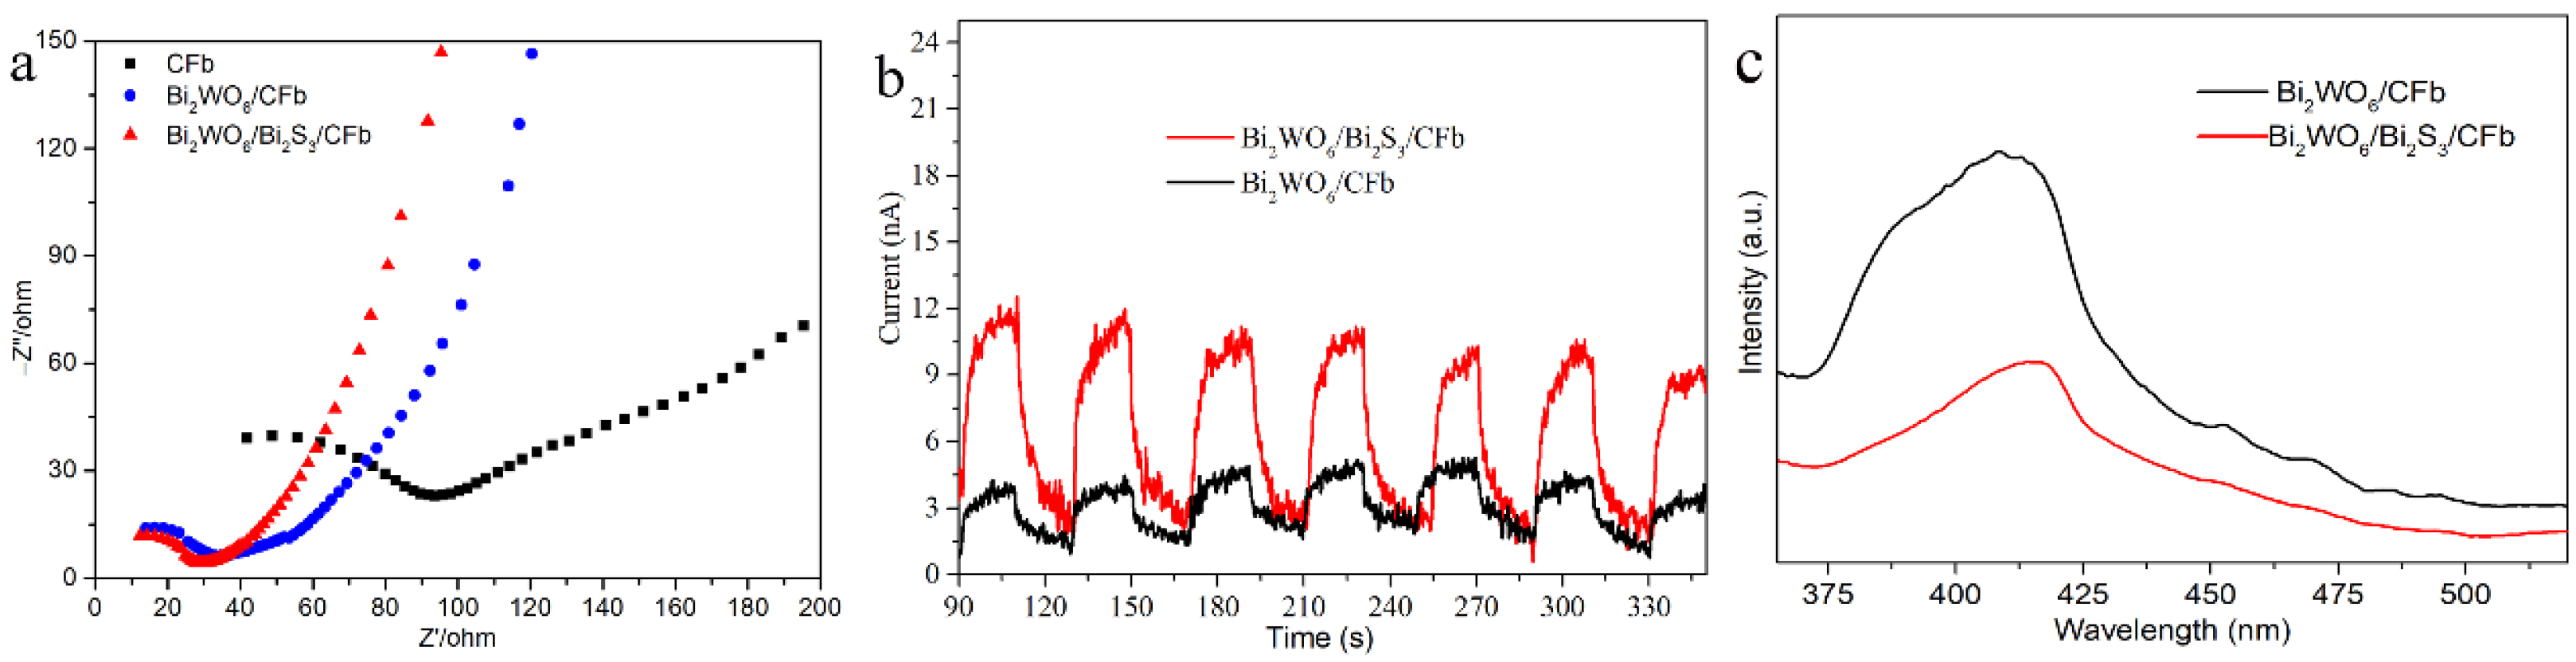
The Interfacial charge separation and migration of Bi
2WO
6/CFb and Bi
2WO
6/Bi
2S
3/CFb were analyzed by means of electrochemical impedance and transient photocurrent. As shown in
Figure 6a, the Nyquist plots of Bi
2WO
6/CFb, Bi
2WO
6/Bi
2S
3/CFb and CFb exhibit a single semicircle in the high-frequency region. The semicircle radius reflects the charge transfer resistance, where a smaller Nyquist radius corresponds to faster carrier migration rates [
24,
25]. Notably, Bi
2WO
6/CFb and Bi
2WO
6/Bi
2S
3/CFb demonstrate significantly smaller semicircle radii than CFb, with Bi
2WO
6/Bi
2S
3/CFb exhibiting the smallest radius. These results indicate that the incorporation of Bi
2S
3 substantially enhances the migration rate of photogenerated electrons and holes in Bi
2WO
6/Bi
2S
3/CFb. As shown in
Figure 6b, the transient photocurrent of Bi
2WO
6/CFb is about 3.5 nA under the same light intensity, while the transient photocurrent of Bi
2WO
6/Bi
2S
3/CFb is about 11 nA, which is about three times that of Bi
2WO
6/CFb. Carbon fibers have no photocurrent, but they have strong electrical conductivity. Therefore, the construction of a Bi
2WO
6/Bi
2S
3 heterojunction improved the separation rate of photogenerated carriers in Bi
2WO
6/Bi
2S
3/CFb materials. Photoluminescence (PL) spectroscopy can be used to study the photogenerated electron–hole pair recombination of the photocatalysts. The charge complexation of Bi
2WO
6/CFb and Bi
2WO
6/Bi
2S
3/CFb composites was investigated by PL at an excitation wavelength of 300 nm, as shown in
Figure 6c. Compared with Bi
2WO
6/CFb, with the complexation of Bi
2S
3, the Bi
2WO
6/Bi
2S
3/CFb underwent a substantial decrease in PL intensity, and the photogenerated electron–hole pair recombination was inefficient, which suggested that the construction of the Bi
2WO
6/Bi
2S
3 heterojunction enhanced the photogenerated carrier mobility efficiency, which effectively hindered photogenerated electron–hole pair recombination; thus, the photocatalytic performance was improved.
2.5. Results and Analyses of Degradation Experiments
To evaluate the photocatalytic activity of Bi
2WO
6/Bi
2S
3/CFb and Bi
2WO
6/CFb fiber materials, photocatalytic degradation experiments were performed using tetracycline hydrochloride (TC) from antibiotics as a target pollutant, as shown in
Figure 7a. In the TC degradation experiments, the degradation curves of CFb and control experiments (without catalyst) were basically the same, which indicated that carbon fiber had no photocatalytic activity for TC. The degradation efficiency of TC in the presence of Bi
2WO
6/CFb reached about 74% after 50 min. Comparatively, the degradation efficiency of TC by Bi
2WO
6/Bi
2S
3/CFb was about 88%, which was significantly higher than that of Bi
2WO
6/CFb. It was clear that the introduction of a small amount of Bi
2S
3 nanoparticles improved the photocatalytic performance, which was attributed to the synergistic effect between Bi
2WO
6 and Bi
2S
3. As shown in
Figure 7b, the photocatalytic degradation process of TC followed a quasi-primary reaction kinetic equation, and it was obvious that the Bi
2WO
6/Bi
2S
3/CFb photocatalytic fibers presented the fastest efficiency for degrading TC. As shown in
Figure S8a, the degradation rate of Bi
2WO
6/Bi
2S
3/CFb only weakly decayed after four cycling experiments and the XRD spectra before and after the cycling experiments. As shown in
Figure S8b, the XRD spectrum before and after the cyclic experiment showed that there was no obvious structural change in Bi
2WO
6/Bi
2S
3/CFb. The above results demonstrated that Bi
2WO
6/Bi
2S
3/CFb had excellent stability and potential practical applications.
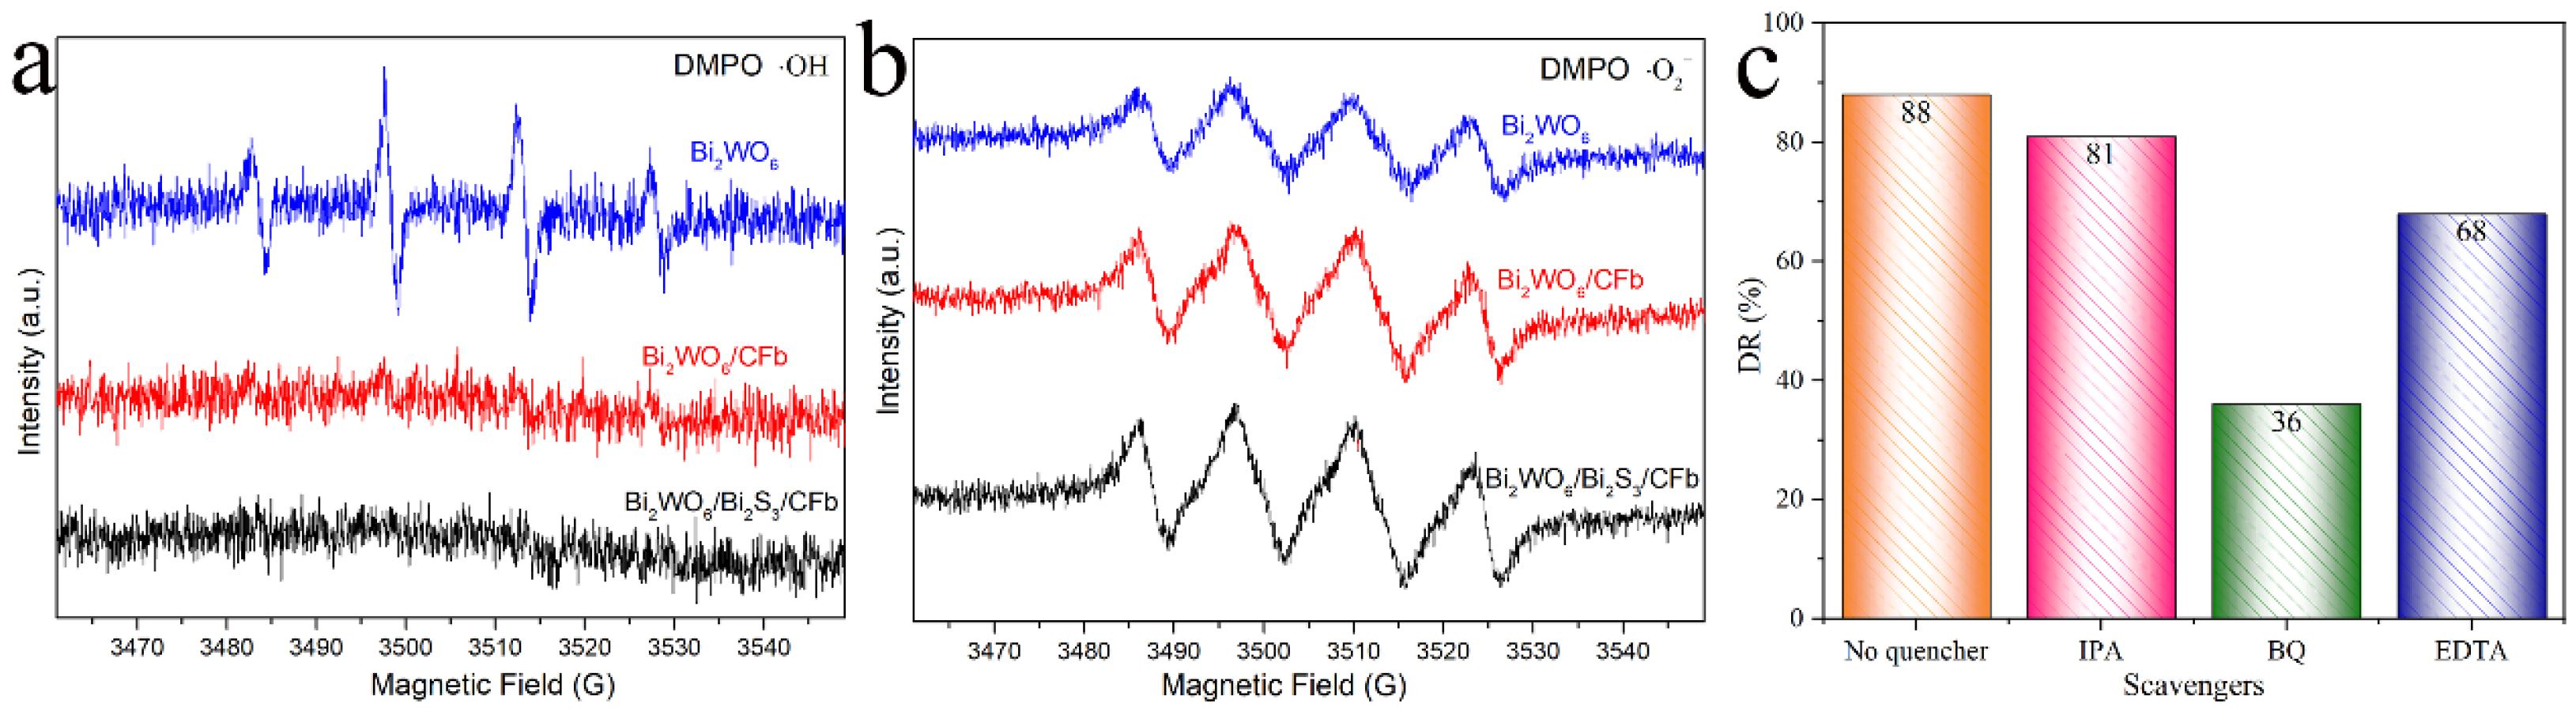
2.6. Identification of Active Species for Photocatalytic Degradation
In this paper, the active radical species generated during photocatalyst degradation were determined by ESR technique. As shown in
Figure 8a, Bi
2WO
6 was detected with significant hydroxyl radical signals after 5 min of light exposure, which was consistent with the findings of many scholars [
26,
27]. A very interesting finding was that Bi
2WO
6/CFb and Bi
2WO
6/Bi
2S
3/CFb failed to be detected with obvious hydroxyl radical signals under the same testing conditions, that is to say, the composite of Bi
2WO
6 with carbon fiber failed to be detected with obvious hydroxyl radical signals, which was consistent with the test results in the research report of Chen Jian’s research team [
28]. As shown in
Figure 8b, superoxide radical signals were detected for Bi
2WO
6, Bi
2WO
6/CFb and Bi
2WO
6/Bi
2S
3/CFb under the effect of light [
29], which may be attributed to the combination of electrons on the catalyst conduction band with the oxygen adsorbed on the surface of the material to generate superoxide radicals. Close observation revealed that the superoxide radical signals of Bi
2WO
6, Bi
2WO
6/CFb and Bi
2WO
6/Bi
2S
3/CFb were sequentially enhanced, suggesting that the stepwise introduction of the carbon fibers and Bi
2S
3 enhanced the photocatalytic activity. To further identify the photocatalytic degradation active species, capture experiments were performed by adding inhibitors to the photocatalytic degradation experiments of TC. Among them, isopropanol (IPA), p-benzoquinone (BQ) and ethylenediaminetetraacetic acid (EDTA) were used as inhibitors of −OH, ‧O
2− and
h+, respectively. As shown in
Figure 8c, the degradation rate of TC changed after the addition of the inhibitors, with the trend of no inhibitor > IPA > EDTA > BQ. After the addition of IPA, the degradation rate was close to that in the case of no inhibitor, indicating that fewer active -OH species was generated during the degradation of TC by Bi
2WO
6/Bi
2S
3/CFb, which was consistent with the previous ESR assay results. The experimental results indicate that the active species produced in this photocatalytic degradation process acted in the following order, ‧O
2− > h
+ > −OH
. ‧O
2−, and h
+ were the most dominant active species [
8].
2.7. Z-Scheme Heterojunction Structure Analysis and Photocatalytic Degradation Mechanism Study
To study and analyze the photocatalytic degradation mechanism of Bi
2WO
6/Bi
2S
3/CFb composite photocatalytic fibers in the removal of TC, it is firstly necessary to determine the type of heterojunction structure as well as the charge transfer path of Bi
2WO
6/Bi
2S
3. Through a Web of Science search, the literature reports on the heterojunction structure of Bi
2WO
6/Bi
2S
3 show discrepancies in terms of two types of structures, that is, 15 papers reported that the heterojunction structure of Bi
2WO
6/Bi
2S
3 was Type-II, whereas 9 papers reported that the heterojunction structure of Bi
2WO
6/Bi
2S
3 was a direct Z-scheme heterojunction. The Type-II and direct Z-scheme heterojunction structures of the Bi
2WO
6/Bi
2S
3 heterojunction are shown in
Figure 9. Based on the previous ESR detection and analysis, the type of heterojunction structure of Bi
2WO
6/Bi
2S
3 in Bi
2WO
6/Bi
2S
3/CFb could not be determined simply by the type of radicals.
Yi-Jun Xu’s research team confirmed that the heterojunction structure of the prepared Bi
2WO
6/TiO
2 material was a direct Z-scheme heterojunction through the inability of Bi
2WO
6 to degrade 4-nitroaniline [
30]. Here, the heterojunction structure of Bi
2WO
6/Bi
2S
3 in Bi
2WO
6/Bi
2S
3/CFb composite photocatalytic fibers was determined by experiments using B
i2WO
6, Bi
2WO
6/CFb and Bi
2WO
6/Bi
2S
3/CFb for the photocatalytic degradation of p-nitrophenol. As shown in
Figure S9, in the degradation test of p-nitrophenol, the CFb, Bi
2WO
6 and Bi
2WO
6/CFb materials were essentially incapable of photocatalytic degradation of p-nitrophenol. Comparatively, the removal of p-nitrophenol by Bi
2WO
6/Bi
2S
3/CFb photocatalytic fibers was about 23% after 80 min of light, indicating that the complexation of a small amount of Bi
2S
3 improved the photocatalytic activity of Bi
2WO
6/Bi
2S
3/CFb photocatalytic fibers. Bi
2WO
6 cannot degrade p-nitrophenol, while Bi
2S
3 can degrade p-nitrophenol [
31,
32]. Assuming that the heterojunction structure of Bi
2WO
6/Bi
2S
3 in Bi
2WO
6/Bi
2S
3/CFb composite photocatalytic fibers was Type-II type, the electrons on the conduction band of the Bi
2S
3 material will migrate to the conduction band of the Bi
2WO
6, while the valence band holes of Bi
2WO
6 will migrate to the lower valence band of Bi
2S
3, and both electrons and holes will be shifted to the low-energy positions. However, electron aggregation at the conduction band position of Bi
2WO
6 cannot drive the degradation of p-nitrophenol and should not enhance the photocatalytic activity of Bi
2WO
6/Bi
2S
3/CFb composite photocatalytic fibers for the degradation of p-nitrophenol, which is obviously inconsistent with the experimental results (
Figure S9). Therefore, it can reasonably be assumed that the heterojunction structure of the Bi
2WO
6/Bi
2S
3 heterojunction in Bi
2WO
6/Bi
2S
3/CFb composite photocatalytic fibers is not Type-II but a direct Z-scheme heterojunction (
Figure 9b).
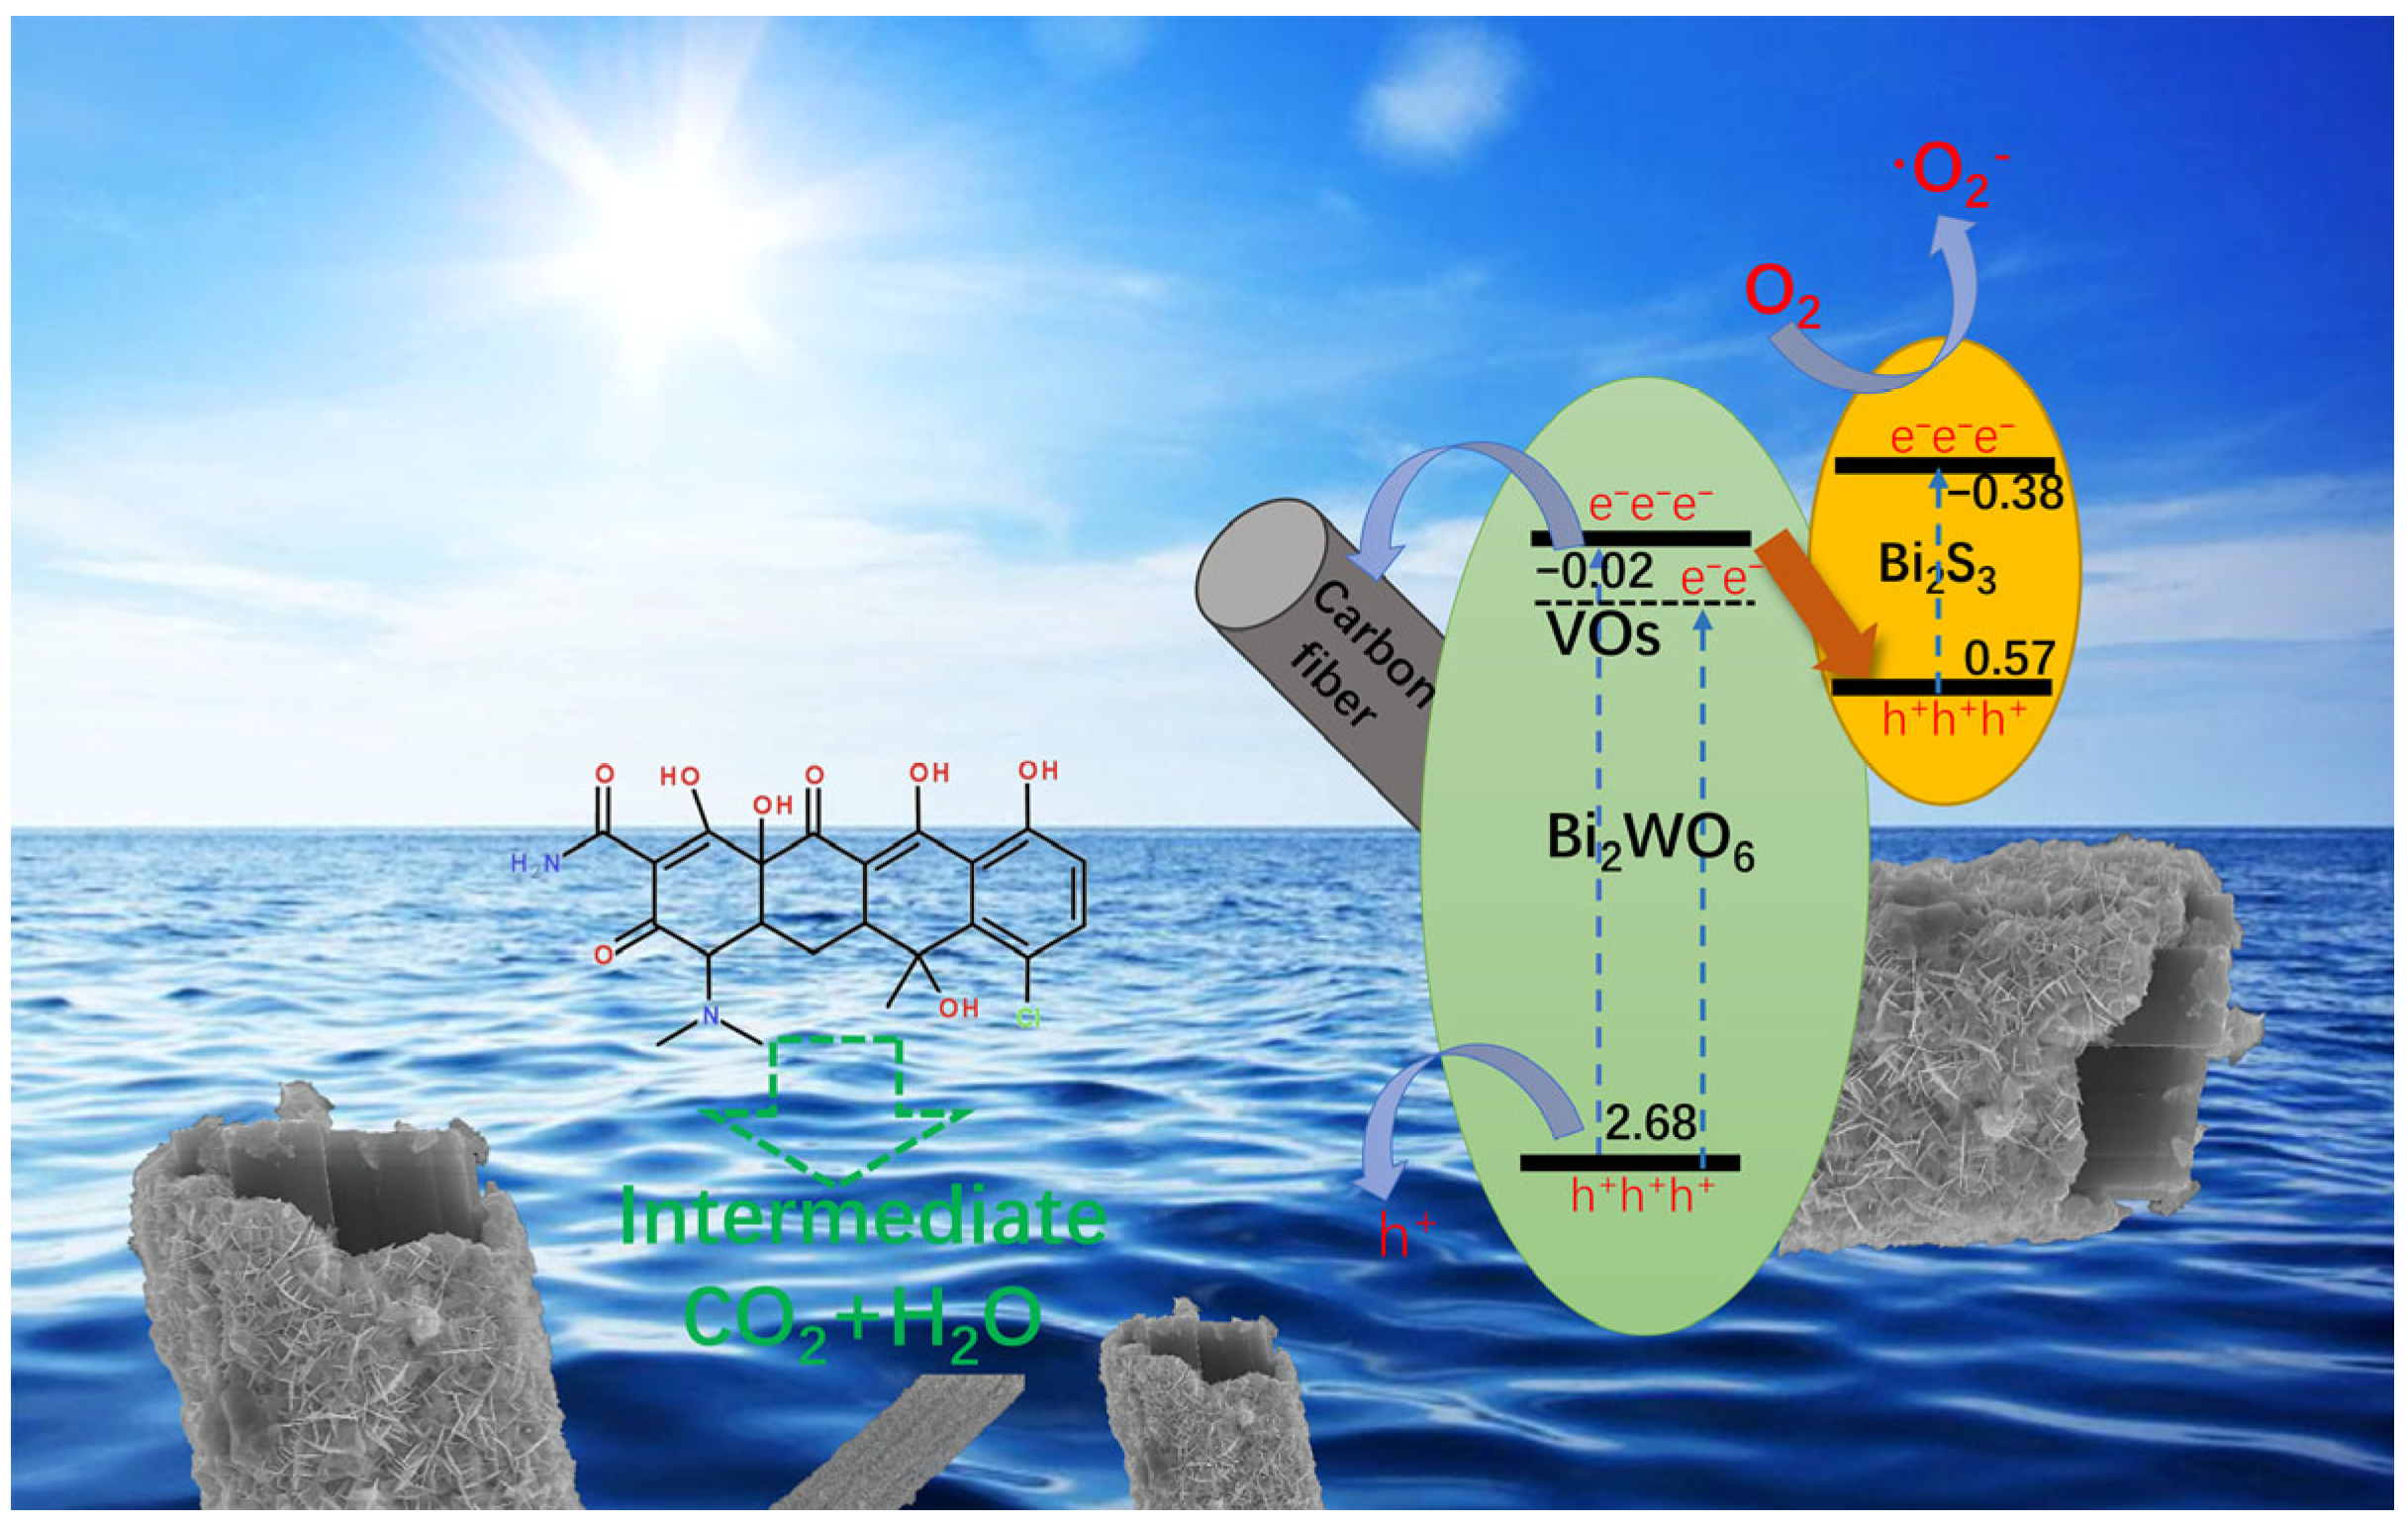
According to the previous results and analysis, the degradation mechanism of Bi
2WO
6/Bi
2S
3/CFb composite fibers was proposed as shown in
Figure 10. Bi
2WO
6 in Bi
2WO
6/Bi
2S
3/CFb contains oxygen vacancies, which will generate a new sodding energy level underneath the conduction band position of Bi
2WO
6 to form the oxygen defective states (VOs). Based on the previous energy band structure analysis, compared with the VB positions of Bi
2WO
6, the VB positions of Bi
2S
3 were closer to the VOs and CB positions of Bi
2WO
6, which made it easier for the electrons on the VOs and CB of Bi
2WO
6 to migrate towards the VB of Bi
2S
3. Therefore, the heterojunction structure of Bi
2WO
6/Bi
2S
3 in Bi
2WO
6/Bi
2S
3/CFb composite photocatalytic fibers should be a direct Z-scheme. The Z-scheme heterojunction makes photocatalytic materials have stronger redox capabilities, which is consistent with the previous conclusion that the superoxide radical signal is strongest in Bi
2WO
6/Bi
2S
3/CFb (
Figure 8b). Bi
2WO
6/Bi
2S
3/CFb is a core–shell-structured photocatalyst with the carbon fiber in the center, and some of the photogenerated electrons on Bi
2WO
6 migrate towards the surface of the carbon fiber, which promotes the separation and migration of the photogenerated electrons and holes.
Based on the previous analysis, it was known that ‧O
2− and h
+ were the main active species produced during the degradation of TC by Bi
2WO
6/Bi
2S
3/CFb photocatalytic fibers, and the reaction mechanism processes were as follows:

