Article

Selective Conversion of Glycerol to Acetol: Effect of the Preparation Method of CuAl Catalysts and Reaction Phase

Thermochemical Processes Group (GPT), Aragon Institute of Engineering Research (I3A), Universidad de Zaragoza, Mariano Esquillor S/N, 50018 Zaragoza, Spain
*
Author to whom correspondence should be addressed.
Catalysts 2025, 15(4), 348; https://doi.org/10.3390/catal15040348
Submission received: 7 March 2025 / Revised: 28 March 2025 / Accepted: 31 March 2025 / Published: 2 April 2025

Abstract

:
A group of CuAl catalysts were synthesized with a Cu/Al molar ratio of 1:1 using different preparation methods: coprecipitation, surfactant assisted coprecipitation, polymeric precursor, and self-combustion and then screened for the selective dehydration of glycerol to acetol. The catalysts were employed in glycerol conversion at the same temperature (227 °C) in two different laboratory-scale systems, the first one at atmospheric pressure (gas phase) and the second one in a pressurized system at 34 absolute bar (liquid phase). The preparation method of the CuAl catalysts influenced the carbon yield to liquids and acetol selectivity. However, the reaction phase had a greater influence than the preparation method of the catalyst. In the gas phase, the carbon yield to liquids reached values above 40% and the carbon selectivity to acetol was higher than 90%. The highest acetol yield, 462.6 mgacetol/gglycerol, was obtained with the CuAl catalyst prepared by the surfactant-assisted coprecipitation method. This study provides a new perspective on catalyst design by highlighting the crucial role of preparation techniques in determining CuAl catalyst performance in the liquid and gas phases.

1. Introduction

Fossil fuels, the primary energy source for decades, are highly polluting and contribute to climate change. Their limited availability [1] further underscores the need for renewable alternatives. OPEC predicts the global fuel demand will rise to 109.4 million barrels per day by 2040, with diesel demand reaching 5.7 million barrels daily [2]. To reduce reliance on petroleum, researchers are exploring renewable options like biomass valorization [3], hydrogen production [4], and biofuels [5].
Biodiesel, a promising biofuel, is produced via the transesterification of triglycerides from sources like vegetable oils and animal fats. It offers advantages such as lower emissions, non-toxicity, and high lubricity [2,6]. However, its high production costs hinder its industry growth. There are several paths to decrease the production costs of biodiesel [7,8], among them being the development of new technologies capable of valorizing biodiesel production’s by-products. The most important byproduct in terms of volume is glycerol, which is produced at 100 kg per ton of biodiesel [9]. With the biodiesel industry expanding, glycerol production is expected to grow significantly [10].
Glycerol, or 1,2,3-propanetriol, has diverse applications in industries like food, cosmetics, and pharmaceuticals [11]. It is also used in concrete additives and aviation fuel production [5]. The surplus of glycerol from biodiesel production has spurred research into its valorization through processes like reforming [4,11], hydrogenolysis [12,13], and dehydration [9]. The catalytic dehydration of glycerol, for instance, produces valuable compounds like acetol and acetone, which can be used to synthesize aviation fuels. The aldol condensation of biomass-derived furan compounds with ketones, such as acetone or acetol, produces liquid intermediates for jet fuels [5]. This technology offers a route to produce sustainable aviation fuels (SAFs), which could be relevant for CO2 emissions’ mitigation [14]. The production of SAFs by aldol condensation with acetol increases the utilization of this molecule [15].
Recent efforts focus on converting glycerol to acetol and acetone via catalytic dehydration and hydrodeoxygenation (HDO). However, producing acetone from glycerol is complex, requiring three steps: dehydration to acetol, hydrogenation to 1,2-propanediol (1,2-PDO), and further dehydration to acetone. This process demands multifunctional catalysts and yields low acetone selectivity (under 6%) [16].
The production of acetol and/or 1,2-PDO involves dehydration and dehydration–hydrogenation, conducted in either the gas (at atmospheric pressure) or liquid (at high pressure) phase. While most studies have focused on gas-phase glycerol dehydration/hydrogenolysis [17,18,19,20,21], the liquid-phase process requires less energy due to the absence of water vaporization and operates at moderate pressures (~34 bar) and low temperatures (227 °C) [13].
Catalysts play a critical role in both phases. Noble metals, although effective, are costly and exhibit low selectivity toward acetol [22,23]. Non-noble metals like Ni catalyze C-C bond cleavage, generating H2, which lowers acetol selectivity due to hydrogenation to 1,2-PDO [24]. Co-based catalysts suffer from severe sintering and deactivation by coking [25,26]. In contrast, Cu-based catalysts preferentially cleave C-O bonds without breaking C-C bonds and with minimal hydrogen generation, making them suitable for acetol production [18,19,27].
The role of the catalyst support is relevant to increase the specific surface area, metallic dispersion, prevention of sintering, and control of product selectivity. Basic supports, such as MgO, CaO or ZnO, show low acetol selectivity [17]. Phosphate supports are negatively affected by the presence of water in the feed and promote the formation of acrolein due to the appearance of Brönsted-type acid centers [28]. Acidic supports with a high specific surface area, such as zeolite, achieve high glycerol conversion and selectivity to acetol [29]. However, in an aqueous-phase medium hydrolyze zeolite structure, neutral supports, such as SiO2, are also hydrolyzed under hydrothermal conditions [30]. Al2O3 as a catalyst support of Cu catalysts in glycerol dehydration shows favorable properties due to metallic dispersion promoting [12,31,32] and glycerol activation [33] via hydrogen bridge formation with the hydroxyl groups of this molecule.
It has been reported that the effectiveness of Cu-based catalysts in glycerol dehydration/hydrogenolysis is greatly influenced by their structure and crystallinity [19]. In other words, the preparation method used for Cu-based catalysts, as well as the synthesis conditions, such as calcination, can significantly influence the performance of the catalysts. Severe calcination conditions, such as high temperatures, can negatively affect the properties of Cu-based catalysts. Additionally, the preparation method and calcination temperature have a strong impact on metal and support interaction. A strong copper–support interaction allows for the formation of crystalline phases capable of stabilizing the active phase, as previously was established by Zihui et al. [27].
The preparation method of the catalysts strongly influences the structural and catalytic properties of the obtained materials [34,35]. Dos Santos et al. [35] studied the effect of the preparation method for glycerol dehydration in the gas phase. They prepared the catalysts by two different methods: wet impregnation and a polymeric precursor. However, there is a lack of information on the effect of the CuAl catalyst preparation method on important factors such as product selectivity, reaction mechanisms, and catalytic activity in glycerol dehydration.
Coprecipitation (CP) is a widely used preparation method that allows the obtention of highly-dispersed materials [15,34,36]. The catalysts obtained via this method tend to show low crystalline structures with a deficient metal–support interaction. However, the works of some researchers, such as Wolosiak-Hnat et al. [31], exhibit a remarkable metal–support interaction. This fact may be due to an aging step during the preparation that favored the metal diffusion. It is important to highlight the effect of the calcination temperature. Thus, a high calcination temperature leads to higher metal–support interaction, promoting the formation of spinel structure [37]. Basag et al. [37] concluded that calcination temperatures between 700–800 °C are required for promoting the metal–support interaction in CP CuAl catalysts. The higher Cu dispersion exhibited by these materials should have a positive effect on their catalytic activity. Furthermore, it could also be affected by the increased selectivity to 1,2-PDO due to an increase in acetol hydrogenation reactions [38].
The surfactant-assisted coprecipitation method (SACP) involves a coprecipitation method together with the use of a surfactant as a structure-directing agent. Several studies have investigated the effect of different surfactants, such as cetyltrimethylammonium bromide (CTAB), tetramethylammonium hydroxide, polyethylene glycol, and Pluronic P123, on several reactions, such as methanol synthesis, methanol steam reforming, and CO2 reforming [39,40,41,42]. The use of a structure-directing agent should result in materials with controlled porosity. This should improve conversion and selectivity compared to the traditional CP method. However, there are few studies where the catalytic dehydration of glycerol in the aqueous phase is studied.
Charisiou et al. [43] previously investigated the catalytic steam reforming of glycerol employing SACP catalysts. Using Al-based catalysts and temperature ranges between 400–750 °C, researchers were able to achieve maximum values of carbon selectivity to acetol and acetone of 30% and 35%, respectively. This demonstrates the potential of catalytic dehydration of glycerol in the gas phase using SACP catalysts, making it an area of great interest for further study [43]. This also opens up an area of great interest for liquid phase research.
Polymeric precursor (PP) and auto-combustion (AC) preparation methods involve a combustion step that strongly affects metal dispersion and intermetallic interaction. PP is a widely studied method [34,35,44,45,46] that involves the chelation of metallic cations by citric acid in a water solution. Then, the remaining carboxylic acid function is polyesterified with ethylene glycol. This chelation step allows obtaining a homogeneous resin that promotes metal interaction. Moreover, the increment of temperature during the chelation step also favors metallic interactions.
The AC preparation method is a straightforward technique that can produce solid materials without the drying step. This approach yields homogeneous materials with a robust intermetallic interaction. Additionally, due to its simplicity and low consumption of raw materials, AC synthesis is highly cost-effective, making it ideal for scaling and industrial use in the preparation of catalysts. This method consists of the spontaneous combustion of an aqueous mixture containing the combustion agent (citric acid, urea, glucose, or glycine) and the metal nitrate precursors [47,48,49,50]. This combustion step is responsible for the intense metal–support interaction. These two preparation methods, PP and AC, are characterized by increased metal–support interaction. This increased interaction is expected to decrease metal dispersion, which in turn reduces the activity of these materials. However, this phenomenon could also increase acetol selectivity.
CuAl catalysts are promising materials for glycerol conversion to value-added products such as acetol/1,2-PDO. These products can be used as intermediates for the production of sustainable aviation fuel (SAF). To the best of our knowledge, there is a lack of information about the influence of the preparation methods of CuAl catalysts on glycerol dehydration/hydrogenolysis, especially in the liquid phase. We aim to study the effect of the preparation method of CuAl catalysts on these processes. For this purpose, CuAl catalysts have been prepared by four different preparation methods: AC, CP, SACP, and PP. In addition, experiments have been carried out in the liquid and gas phases. Characterization of the calcined and the used catalysts determined relevant information to explain the catalytic performance and catalyst stability in the reaction medium.

2. Results and Discussion

2.1. Catalyst Characterization

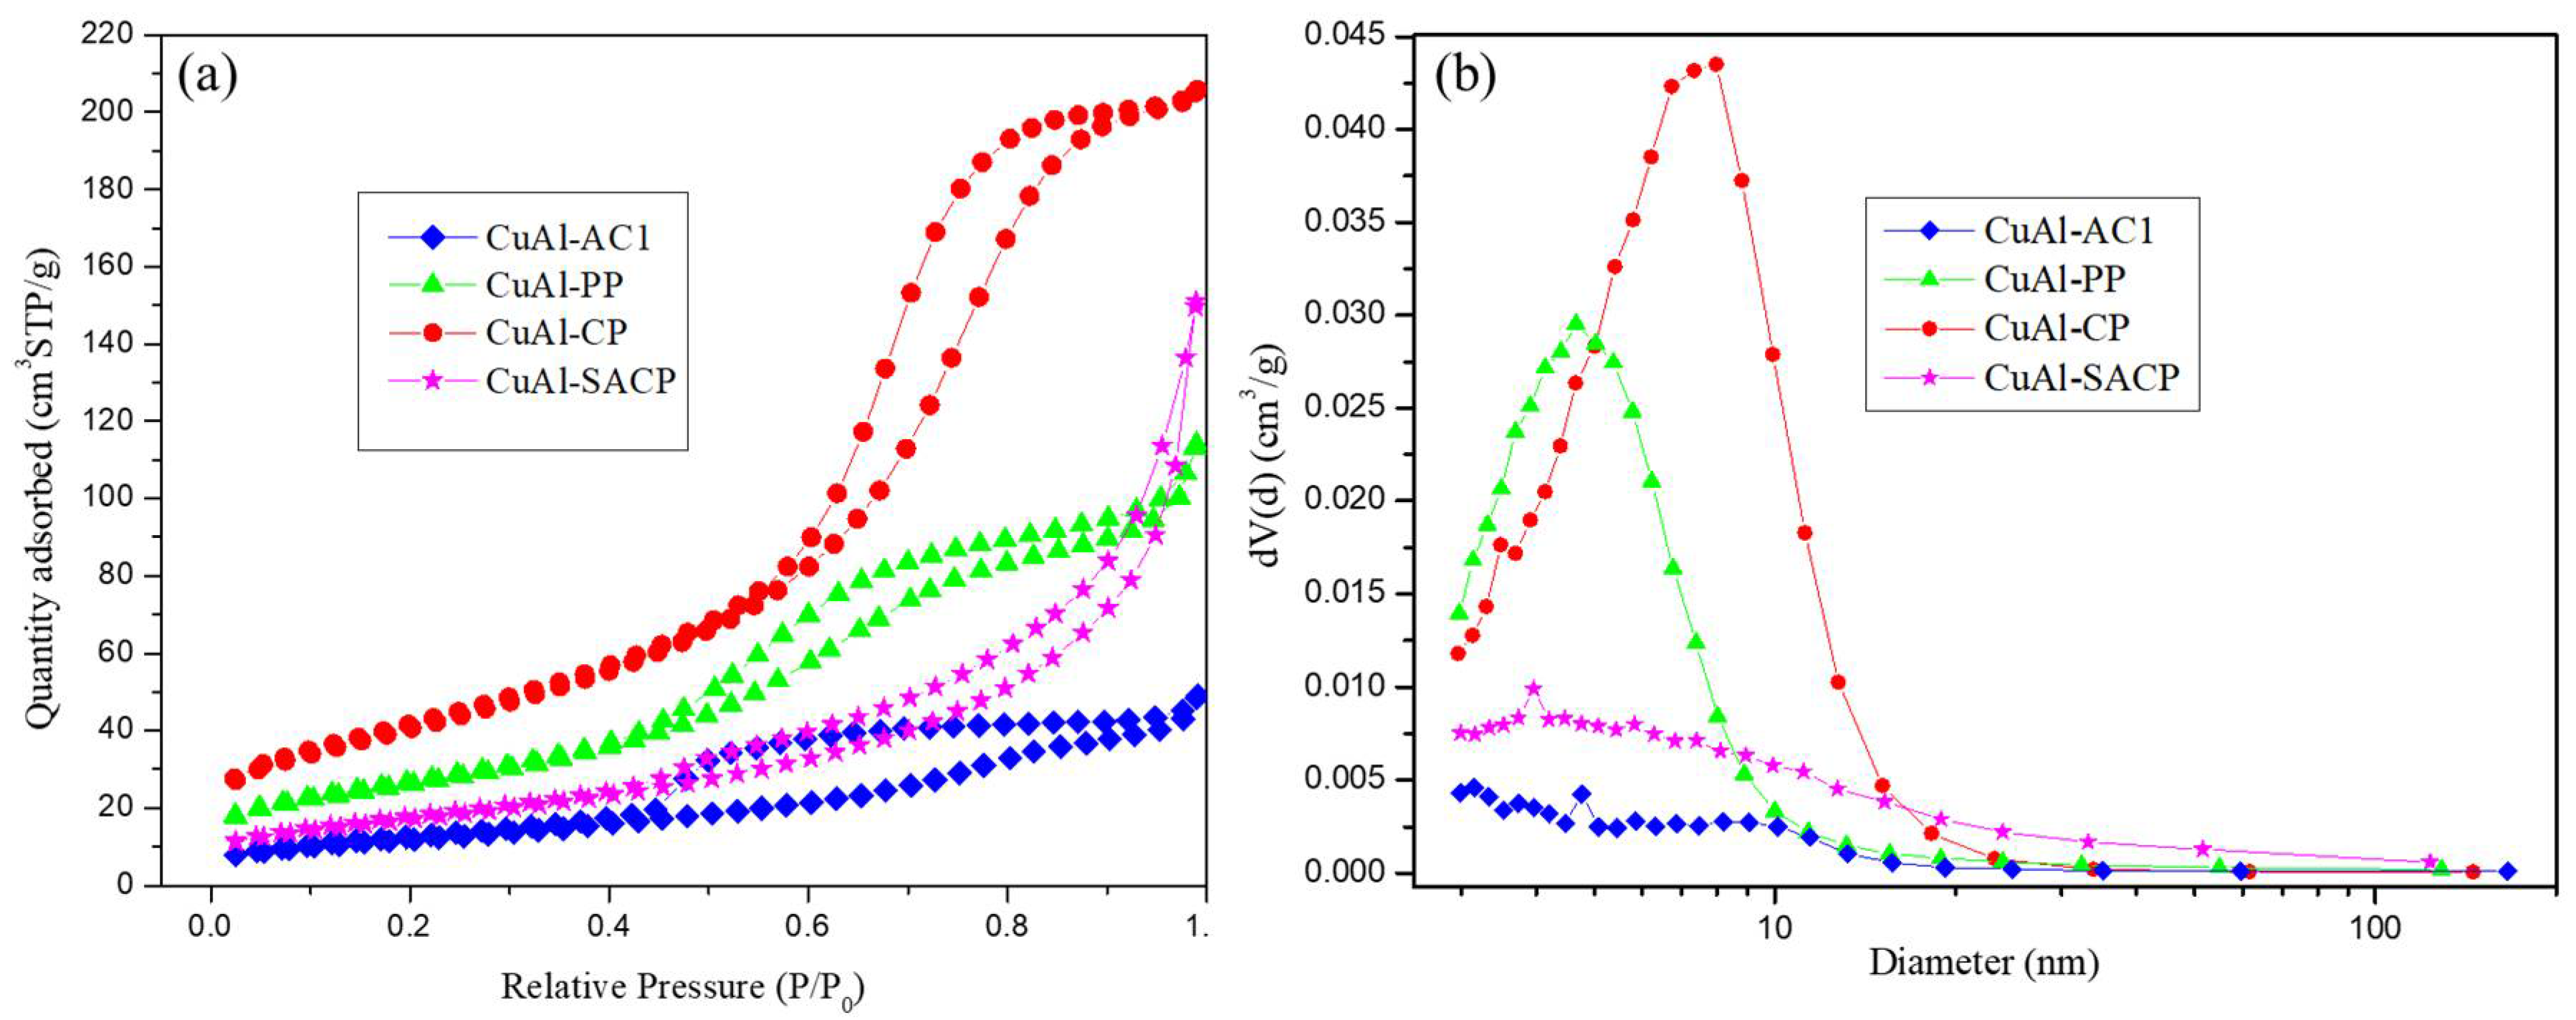
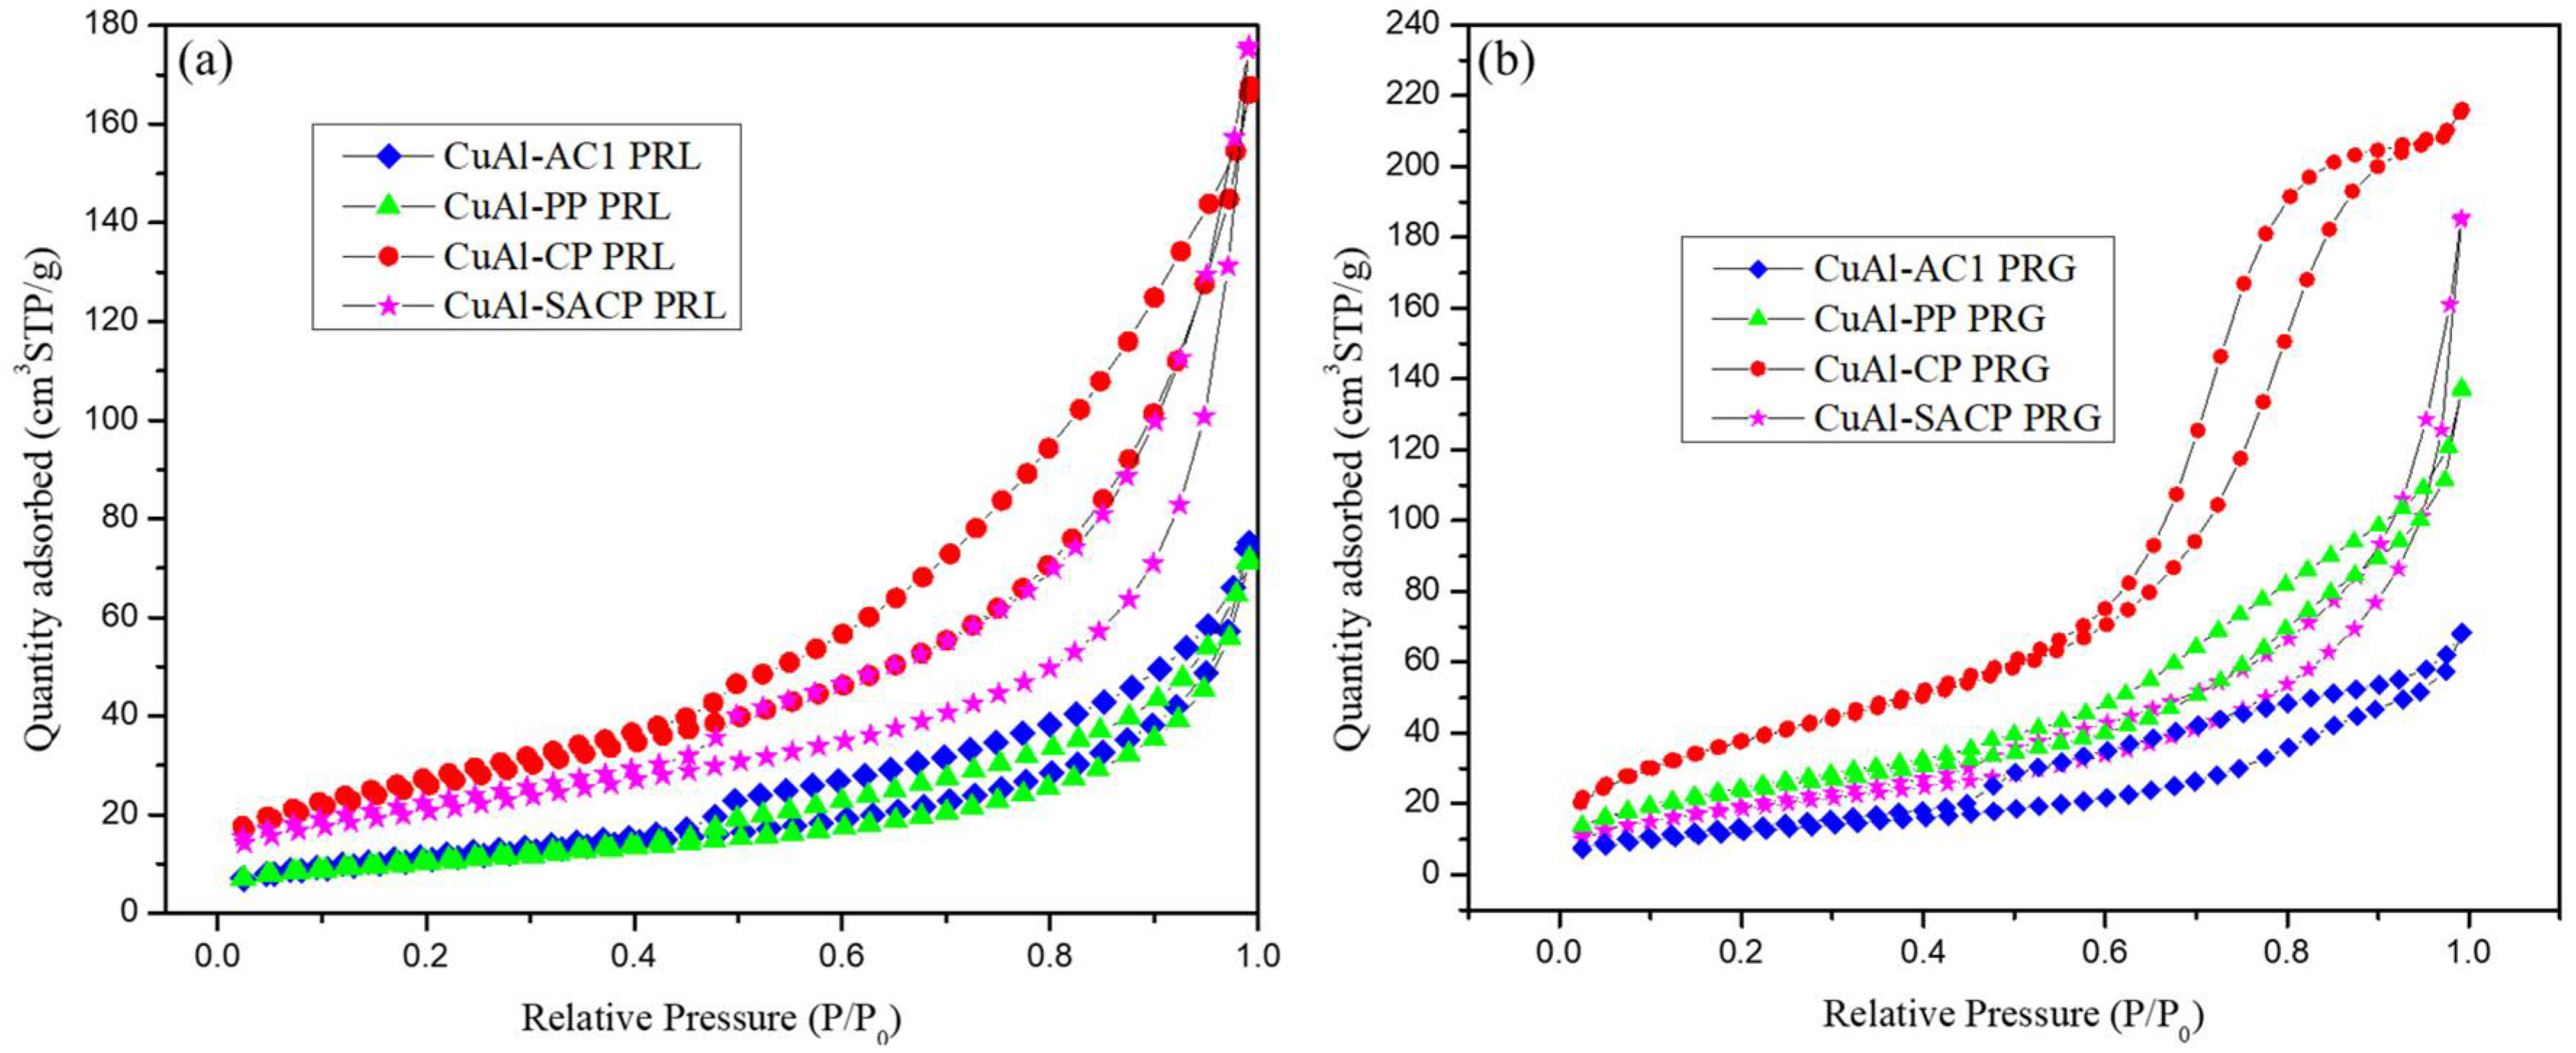
2.1.1. Metal Content and Textural Properties
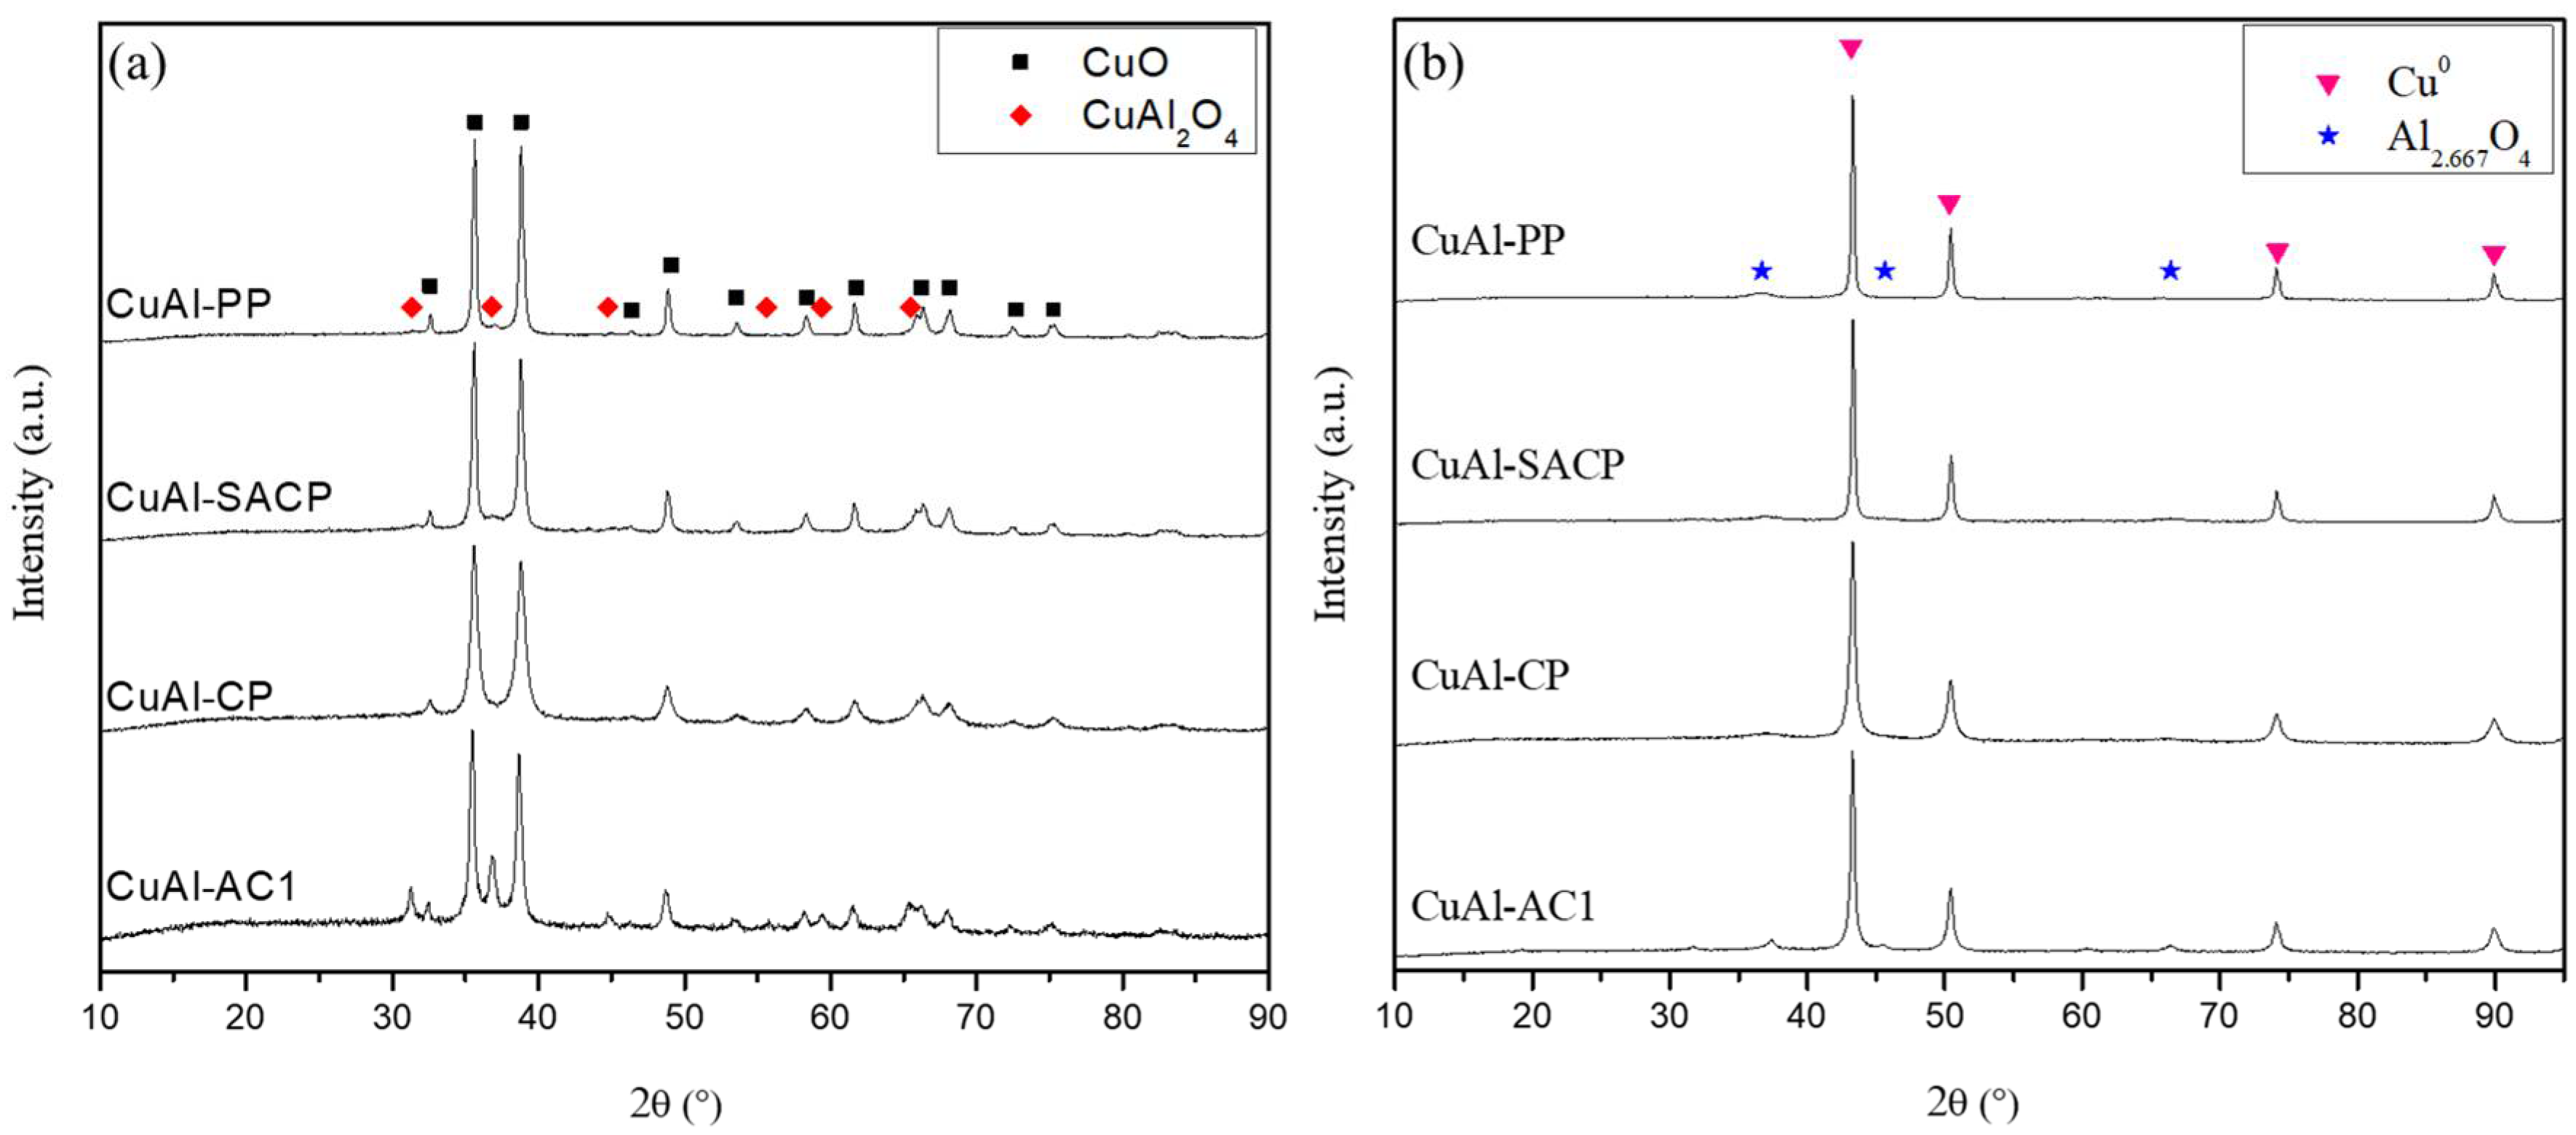
Table 1 shows the metal content in the calcined catalysts determined by ICP-OES. The metal content is expressed as the molar ratio Cu/(Cu + Al) × 100. An adequate agreement is observed between the experimental metal content and the theoretical value of 50%. However, the catalysts prepared by coprecipitation methods, CP and SACP, showed a metal content slightly lower than the theoretical value, which could be due to the formation of copper ammonium complexes, such as [Cu (NH3)4]2+, preventing the complete precipitation of copper [51].
The results of N2 adsorption measurements are also shown in Table 1. The SBET (m2/g) of the calcined catalysts followed the order CuAl-CP (144) > CuAl-SACP (69) > CuAl-PP (63) > CuAl-AC1 (43). The Vp (cm3/g) values presented the same sequence order: 0.32 > 0.24 > 0.17 > 0.06. The highest pore diameter (dp, nm) was reached by CuAl-CP (8.0), followed by CuAl-PP (4.7), CuAl-SACP (3.7), and CuAl-AC1 (3.2). The N2 adsorption–desorption isotherms of the calcined are shown in Figure 1a, while Figure 1b shows the pore distribution. All the calcined CuAl catalysts exhibit a Type IV isotherm, which is associated with mesoporous materials due to hysteresis. The CuAl-PP and CuAl-CP catalysts show a pore size distribution centered at 4.7 and 8 nm, respectively, while the CuAl-SACP and CuAl-AC1 catalysts show a broader pore size distribution.
The results of Table 1 show the influence of the preparation method on the textural properties of calcined catalysts. The catalysts prepared by PP and AC methods, which include a combustion stage, showed lower values of SBET and VP than those prepared by coprecipitation, CP and SACP. Thus, the methods that imply a combustion step, PP and AC, tend to obtain less porous materials due to sintering and agglomeration phenomena. Often, materials prepared by a coprecipitation method exhibit a higher pore diameter value than those prepared by other methods such as PP [34]. This is clearly observed when comparing CuAl-PP and CuAl-CP catalysts. The use of CTAB as a structure-directing agent in the literature has shown opposite tendencies in SBET and pore size compared to preparations without CTAB [40,42]. This has exposed the relevance of the CTAB/metal ratio. Kang et al. [42] concluded that SACP materials with a CTAB/metal ratio higher than the optimized value tend to show a lower specific surface area due to CTAB’s decomposition. CTAB’s decomposition produces gases and heat which can destroy the pore walls of the catalysts and increase the pore diameter. In this work, the CuAl-SACP catalyst (Figure 1b) shows large-diameter pores.
The effect of the reduction step on the textural properties of the catalysts is mainly centered on an increase of the specific surface area, with the exception of the catalyst with the lowest BET surface area of all, the CuAl-AC1, in which instead of increasing it decreases; the other feature to highlight is that the rise for the rest of the catalysts is more noticeable in the polymeric precursor, CuAl-PP. The pore volume increases regularly in all catalysts once they are reduced, while the pore diameter depends on the preparation method.
Table 2 shows the textural properties of the used CuAl catalysts in the liquid and gas phases. Figure 2a,b presents the N2 adsorption–desorption isotherms for the used catalysts in the liquid phase and gas phase, respectively.
After the use of CuAl catalysts in the liquid phase (PRL), most of the catalysts changed their textural properties. Although all catalysts presented a Type IV isotherm (Figure 2a), most of the catalysts changed their hysteresis loop compared to the calcined catalysts. The modification of the textural properties after being in the liquid phase is influenced by the catalyst preparation method. Thus, the CuAl-SACP catalyst showed a high stability, with similar values of SBET and VP compared to the calcined catalyst. The CuAl-PP and CuAl-CP catalysts decreased the SBET significantly, with values of 41% and 63%, respectively, compared to the calcined catalyst. The VP and dp values of these catalysts also decreased, while the SBET and VP values of the CuAl-AC1 catalyst showed a slight increase. The SBET (m2/g) of the catalysts used in the liquid phase followed the order CuAl-SACP (65) > CuAl-CP (53) > CuAl-AC1 (51) > CuAl-PP (37).
After the use of CuAl catalysts in the gas phase, the N2 adsorption–desorption isotherms (Figure 2b) were almost unmodified compared to the calcined catalysts. The SBET, VP, and dp values were similar to those of the reduced catalysts, showing a small decrease in SBET and VP in most of the catalysts.
The SBET value (m2/g) of the catalysts used in the gas phase (PRG) showed the following tendency: CuAl-CP (141) > CuAl-PP (87) > CuAl-SACP (69) > CuAl-AC1 (45).
These results indicate that the operating conditions in the liquid phase with pressurized liquid water significantly decreased the textural properties of most of the catalysts, while the operating conditions in the gas phase barely had any influence. This fact was also reported by Lete et al. [24].

2.1.2. XRD Results

Figure 3a shows the XRD patterns of calcined CuAl catalysts synthesized by different preparation methods: CuAl-AC1, CuAl-PP, CuAl CP, and CuAl-SACP. The diffraction peaks at 32.6°, 35.6°, 38.8°, and 48.9° reveal the presence of a CuO phase (JCPDS file n°. 00-048-1548) [52], while peaks located at 31.1°, 37.0°, and 44.7° correspond to the CuAl2O4 spinel phase (JCPDS file n°. 01-078-1605) [53]. The presence of a CuO phase can be observed in all CuAl catalysts. However, the presence of the CuAl2O4 spinel phase is just elucidated in the CuAl-AC1 and CuAl-PP catalysts. The CuAl materials obtained through preparation methods which include a gelation–combustion step, CuAl-AC1 and CuAl-PP, have shown spinel-type phases (CuAl2O4) which implies a higher level of metal–support interaction, as can be seen in previous reports [47].
The crystallite sizes of the CuO and CuAl2O4 phases are shown in Table 1. The crystallite sizes (nm) of the CuO phase follow the tendency of CuAl-PP (28.4) > CuAl-SACP (24.7) > CuAl-AC1 (21.0) > CuAl-CP (14.9). On the other hand, the crystallite size of the CuAl2O4 phase (nm) is as follows: CuA-PP (23.1) > CuAl-AC1 (21.6).
These results evidence that the CuAl-CP catalyst displayed the lowest average crystallite size of the CuO phase, demonstrating the highest dispersion of this oxide. On the other hand, the CuAl-PP catalyst showed the highest value, which could be due to the combustion step in this synthesis that could promote particle sintering, reducing its dispersion. The preparation of the CuAl-AC1 catalyst showed a combustion stage of higher intensity than the CuAl-PP catalyst. Despite this fact, the CuAl-AC1 catalyst showed a lower average crystallite size of CuO than the CuAl-PP catalyst. This may be due the higher metal–support interaction caused by the greater amount of Cu found in the spinel-like structure.
Figure 3b shows the XRD patterns of the reduced catalysts. It is observed that the reduction treatment completely reduces the CuO phases in all the catalysts to Cu0. The Cu0 phase can be elucidated by diffraction peaks at 2θ = 43.3°, 50.4°, 74.1°, and 89.9° (JCPDS n°. 01-085-1326) [24]. Al2.667O4 phases can be also elucidated by diffraction peaks at 2θ = 36.9°, 45.6°, and 66.4° (JCPDS n°. 01-080-1385) [24]. The Al2.667O4 phase has an Al/O ratio of 0.6675, which is higher than that obtained for the Al2O3 phase. This may be due to the presence of bridging oxygen in our catalysts’ structure.
The crystallite size of the Cu0 phase was also calculated using Scherrrer’s equation. As Table 1 shows, the highest Cu0 crystallite size of the activated catalysts was observed in CuAl-PP (35.4 nm), followed by CuAl-SACP (32.8 nm), CuAl-AC1 (27.7 nm), and CuAl-CP (22.3 nm). This is the same order as that of CuO in the calcined catalysts. However, there appears to be no correlation when comparing preparation methods involving a combustion stage (AC1 and PP) with those involving a precipitation stage (CP and SACP). It is important to highlight that the lowest value of the crystallite size was reached by the CuAl-CP catalyst, showing the beneficial effect of the coprecipitation step referred to metal dispersion.
Figure 4a shows the XRD patterns of the used catalysts in the liquid phase. The signals at 29.8°, 36.4°, 42.3°, 61.4°, and 73.6° reveal the presence of a Cu2O phase (JCPDS n°. 00-005-0667) [54]. The presence of AlO(OH) can be also elucidated by peaks at 28.1°, 49.0°, and 55.2° (JCPDS n°. 00-021-1307) [55]. The Cu0 phase can be also appreciated by peaks at 43.3°, 50.4°, 74.1°, and 89.9° (JCPDS n°. 01-085-1326). The presence of a Cu0 phase, detected in all used catalysts, is a consequence of the catalyst activation treatment with a H2 stream previous to the reaction.
The crystallite size of Cu2O of the catalysts used in the liquid phase at 36.6° was calculated by Scherrer’s equation and is shown in Table 2. The highest value was reached by CuAl-AC1 (38.8 nm), followed by CuAl-PP (31.3 nm), CuAl-CP (24.7 nm), and CuAl-SACP (20.0 nm).
The presence of Cu2O phases in the used Cu catalysts is a common issue [27,56,57]. The presence of this phase may be due to a reversible reduction of the spinel phase or to the partial oxidation of Cu0 to Cu+ during the reaction. Khasin et al. [27,58,59] proposed that Cu species conforming spinel phases showed a reversible reduction property, which could justify the existence of Cu2O phases in our used catalysts prepared by AC1 and PP. Velasquez et al. [50] also showed the reversible reduction to Cu+ from their CuLa2O4 catalysts under experimental conditions. Other works, such as Xiao et al. [27], have suggested the possible electron transfer from Cu0 to chemisorbed acetol during glycerol hydrogenolysis, promoting its oxidation.
Boehmite, AlO(OH), is another phase present in the used catalysts in liquid-phase reactions. The presence of this phase is due to the hydration of Al2O3 phases under reaction conditions and it may decrease the activity of the catalysts [60].
Figure 4b shows the XRD patterns of the CuAl catalysts used in the gas-phase reactions. The Cu0 phase (JCPDS n°. 01-085-1326) [24] can be clearly identified in all used catalysts. The Al2.667O4 phase (JCPDS n°. 01-080-1385) [24] is slightly identified. The tendency of the Cu0 average crystallite size of the reduced catalysts (nm), shown in Table 1, is as follows: CuAl-PP (35.4) > CuAl-SACP (32.8) > CuAl-AC1 (27.7) > CuAl-CP (22.3). A similar tendency of the Cu0 average crystallite size (nm) of the used catalysts in the gas phase can be shown in Table 2, followed the order: CuAl-PP (36.2) > CuAl-SACP (33.6) > CuAl-AC1 (31.2) > CuAl-CP (25.8). A slight sintering effect can be elucidated in the gas phase, as previously reported [24].
In order to study the possible electronic transfer from Cu0 to the substrate in the liquid phase, as proposed above, the CuAl-PP catalyst was analyzed by XRD after being subjected to an aqueous medium without glycerol. Figure 5 shows the XRD patterns after four stages: calcination, activation with H2, aqueous medium at 227 °C and 34 bar, and use in glycerol conversion. It is clearly observed that the hydrothermal conditions strongly promote boehmite formation and the Cu0 phase is almost unaffected. On the other hand, the used CuAl-PP catalyst clearly shows oxidation from Cu0 to Cu2O. The Cu0 phase strongly decreases while Cu2O phases sharply appear. These results are in concordance with those of other authors [27]. They suggested the electron transference from Cu0 to chemisorbed acetol during glycerol hydrogenolysis. In this way, Cu may act as an electron transfer agent for acetol hydrogenation to 1,2-PDO in the liquid phase. In the gas phase (Figure 4b), this phenomenon cannot be elucidated, i.e., Cu0 is not oxidized to Cu2O during the reaction, as previous works established [24]. This fact can suggest the role of pressure in promoting the electron transference phenomenon.

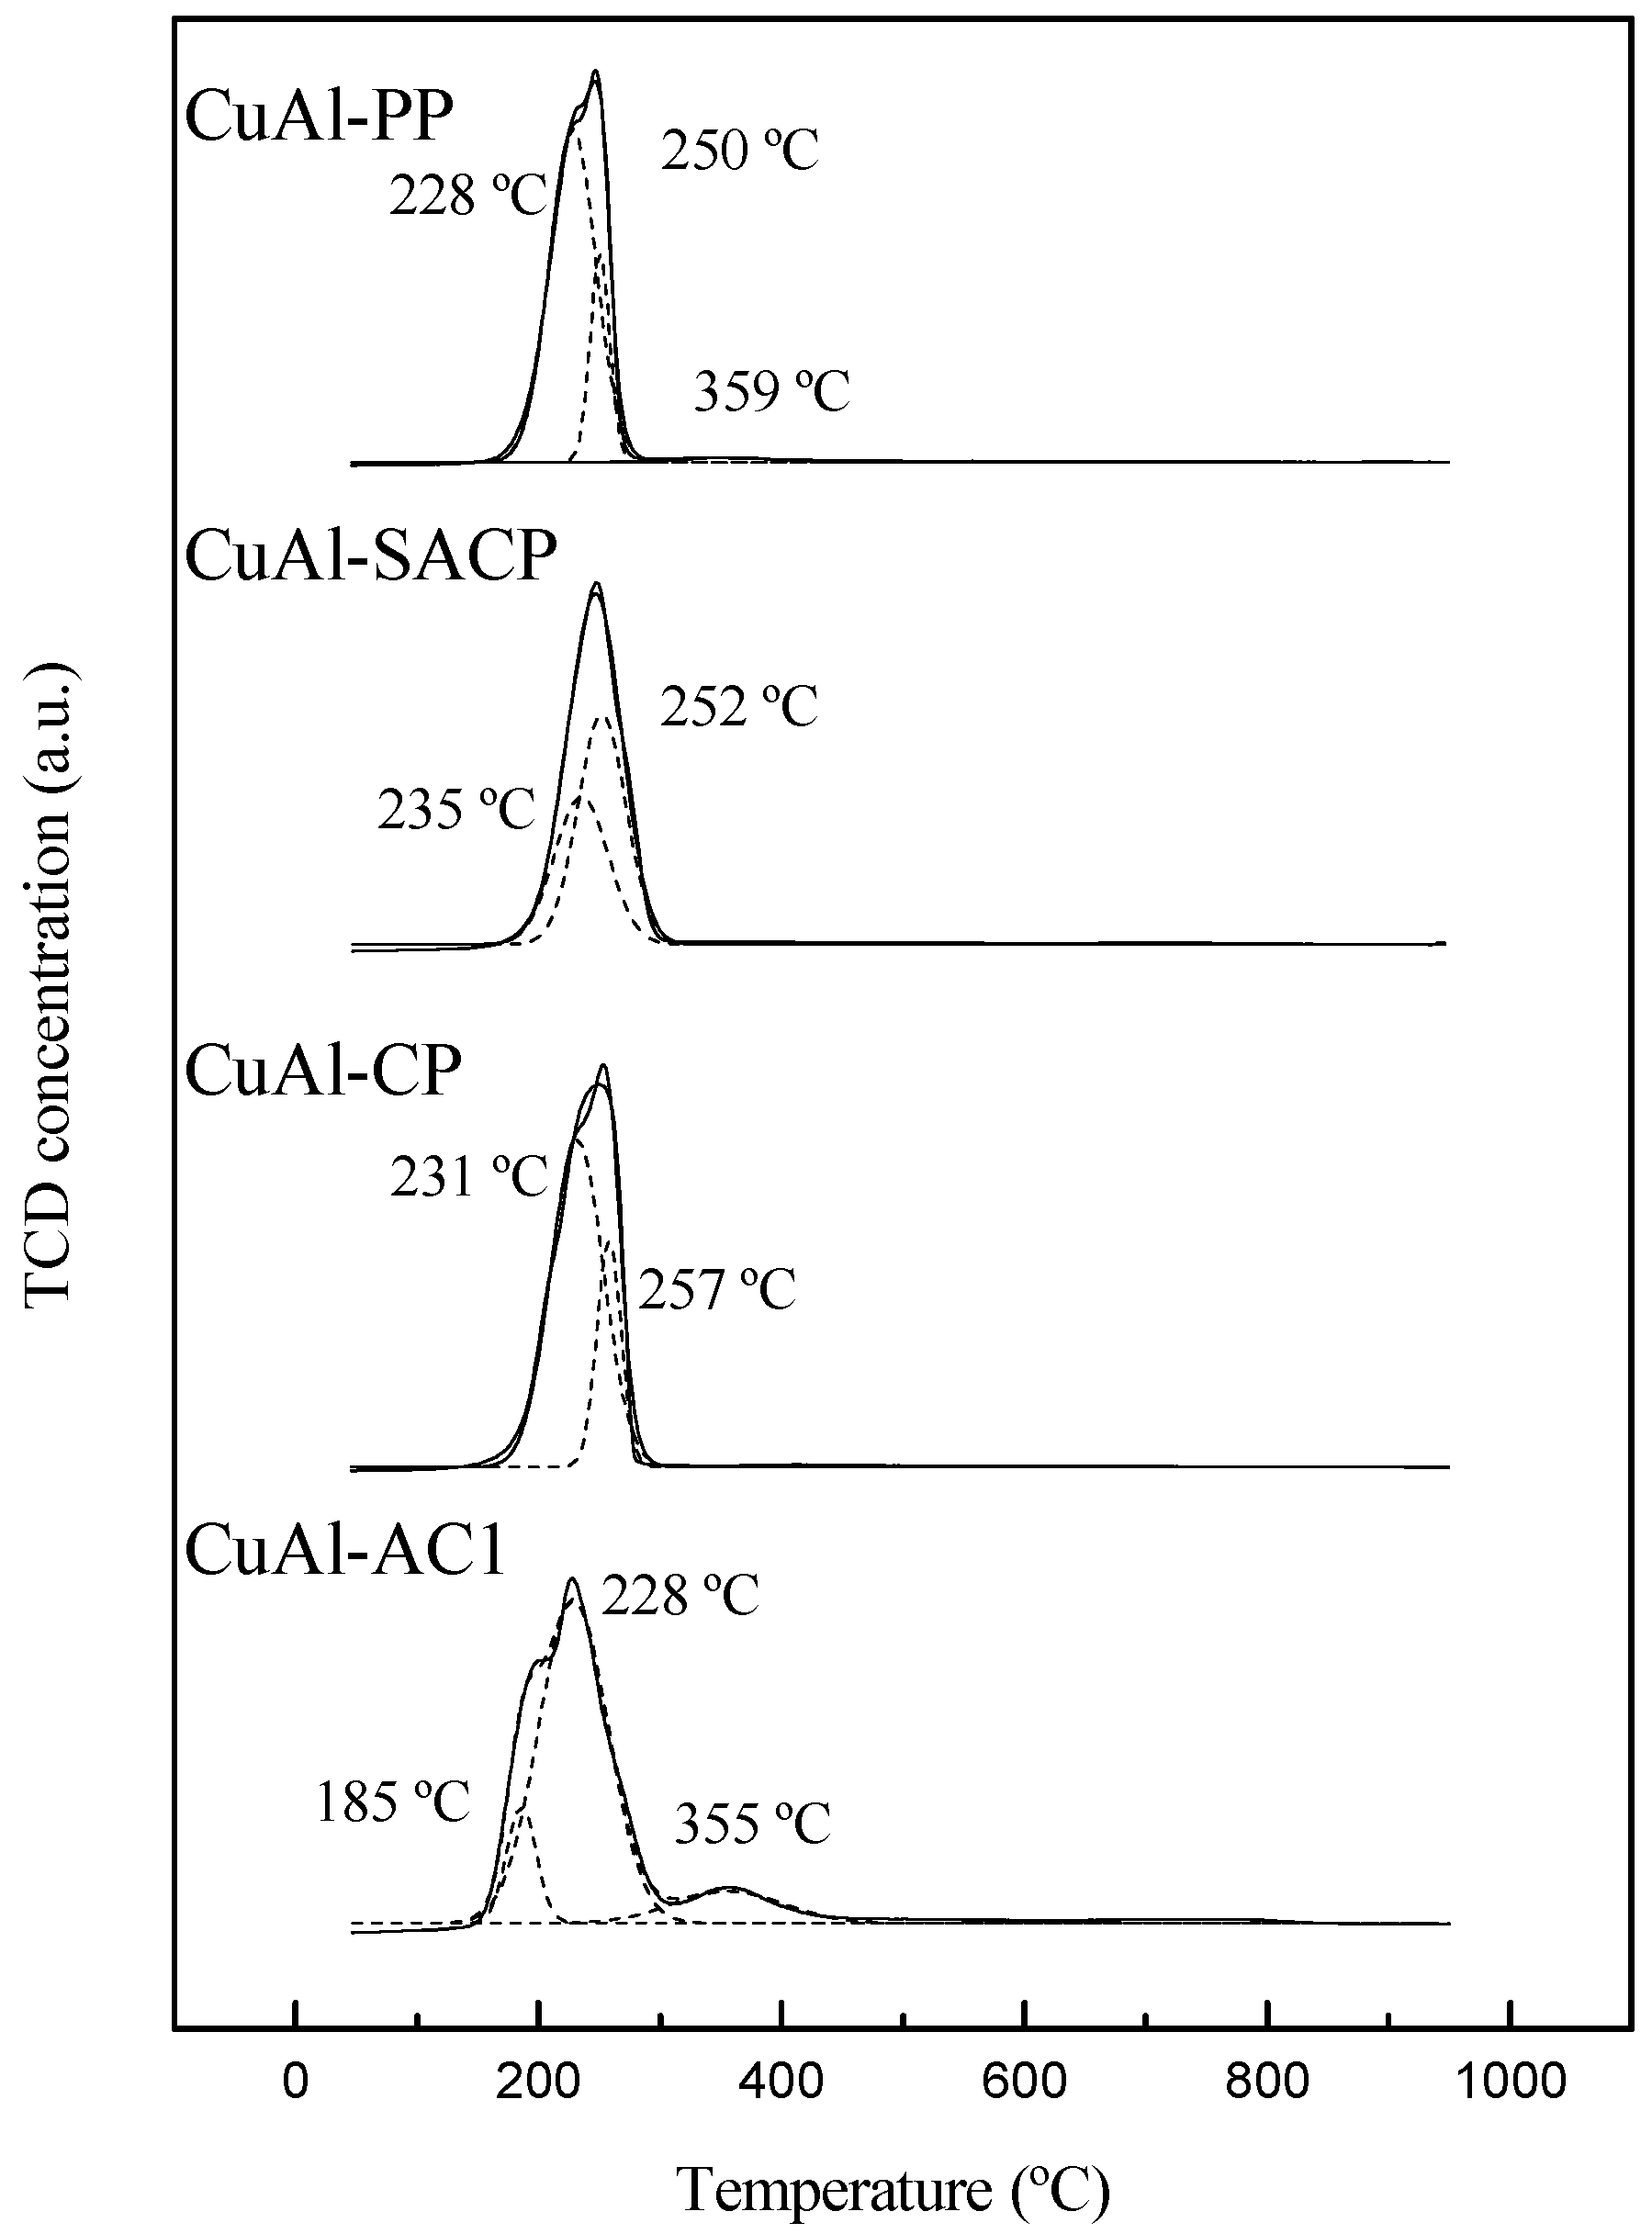
2.1.3. H2 Temperature Programmed Reduction

The H2-TPR profiles are displayed in Figure 6. All CuAl catalysts have reduction peaks between 185–257 °C, which can be roughly divided into two reductive phenomena: low-temperature peaks and high-temperature peaks, as was elucidated previously [61,62]. The low-temperature reduction peaks are attributed to the reduction of Cu2+ phases to Cu0 in highly dispersed CuO with a small particle size, while the high-temperature reduction peaks are related to the reduction of CuO to Cu0 with a larger particle size, as has been previously studied in other works [63,64,65].
The CuAl catalysts that exhibit spinel phases in XRD analysis (Figure 3a), such as CuAl-PP and CuAl-AC1, show additional reduction peaks that correspond to the reduction of the CuAl2O4 spinel phase between 326–359 °C, as previously reported [66]. The ratio of the different phases is displayed in Table 3.
These results are consistent with those obtained using X-ray diffraction (XRD) and justify the presence of CuAl2O4 phases. The PP synthesis also has a characteristic spinel reduction peak but with a lower relative amount. This may be a consequence of the lower temperatures reached during the combustion step, characteristic for AC1 and PP synthesis, since spinel phases need high temperatures to be formed, as previously studied [67].

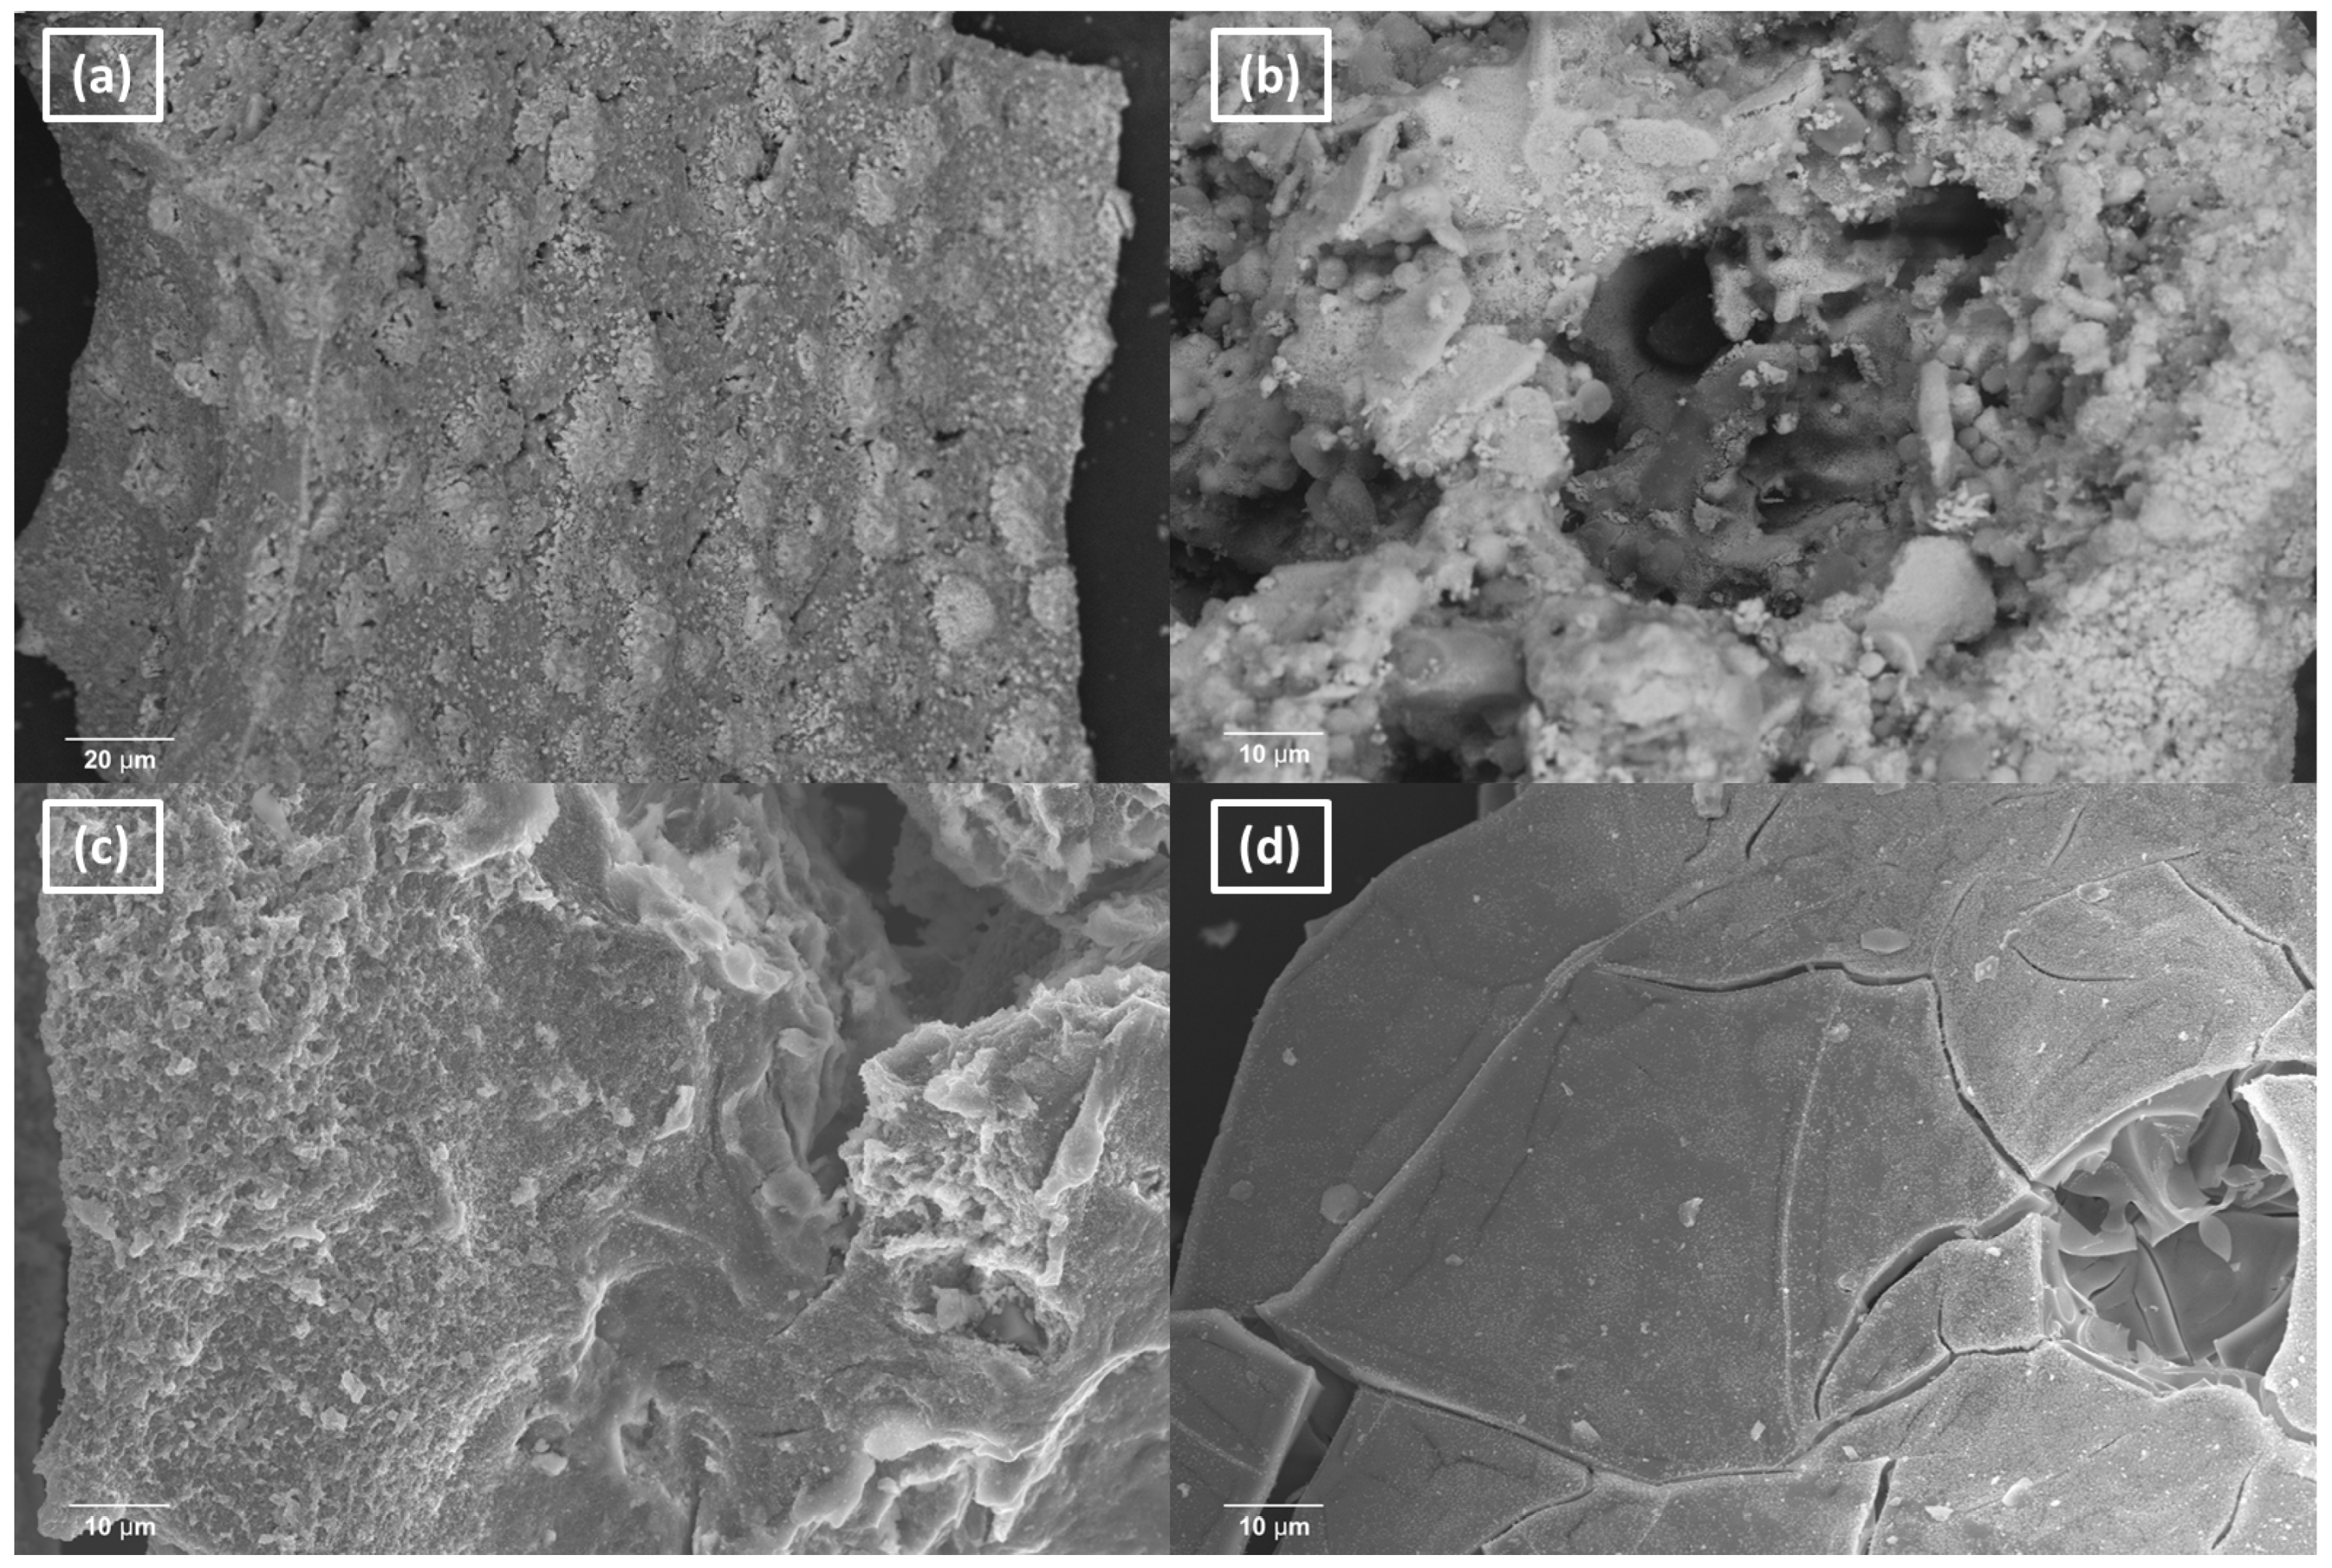
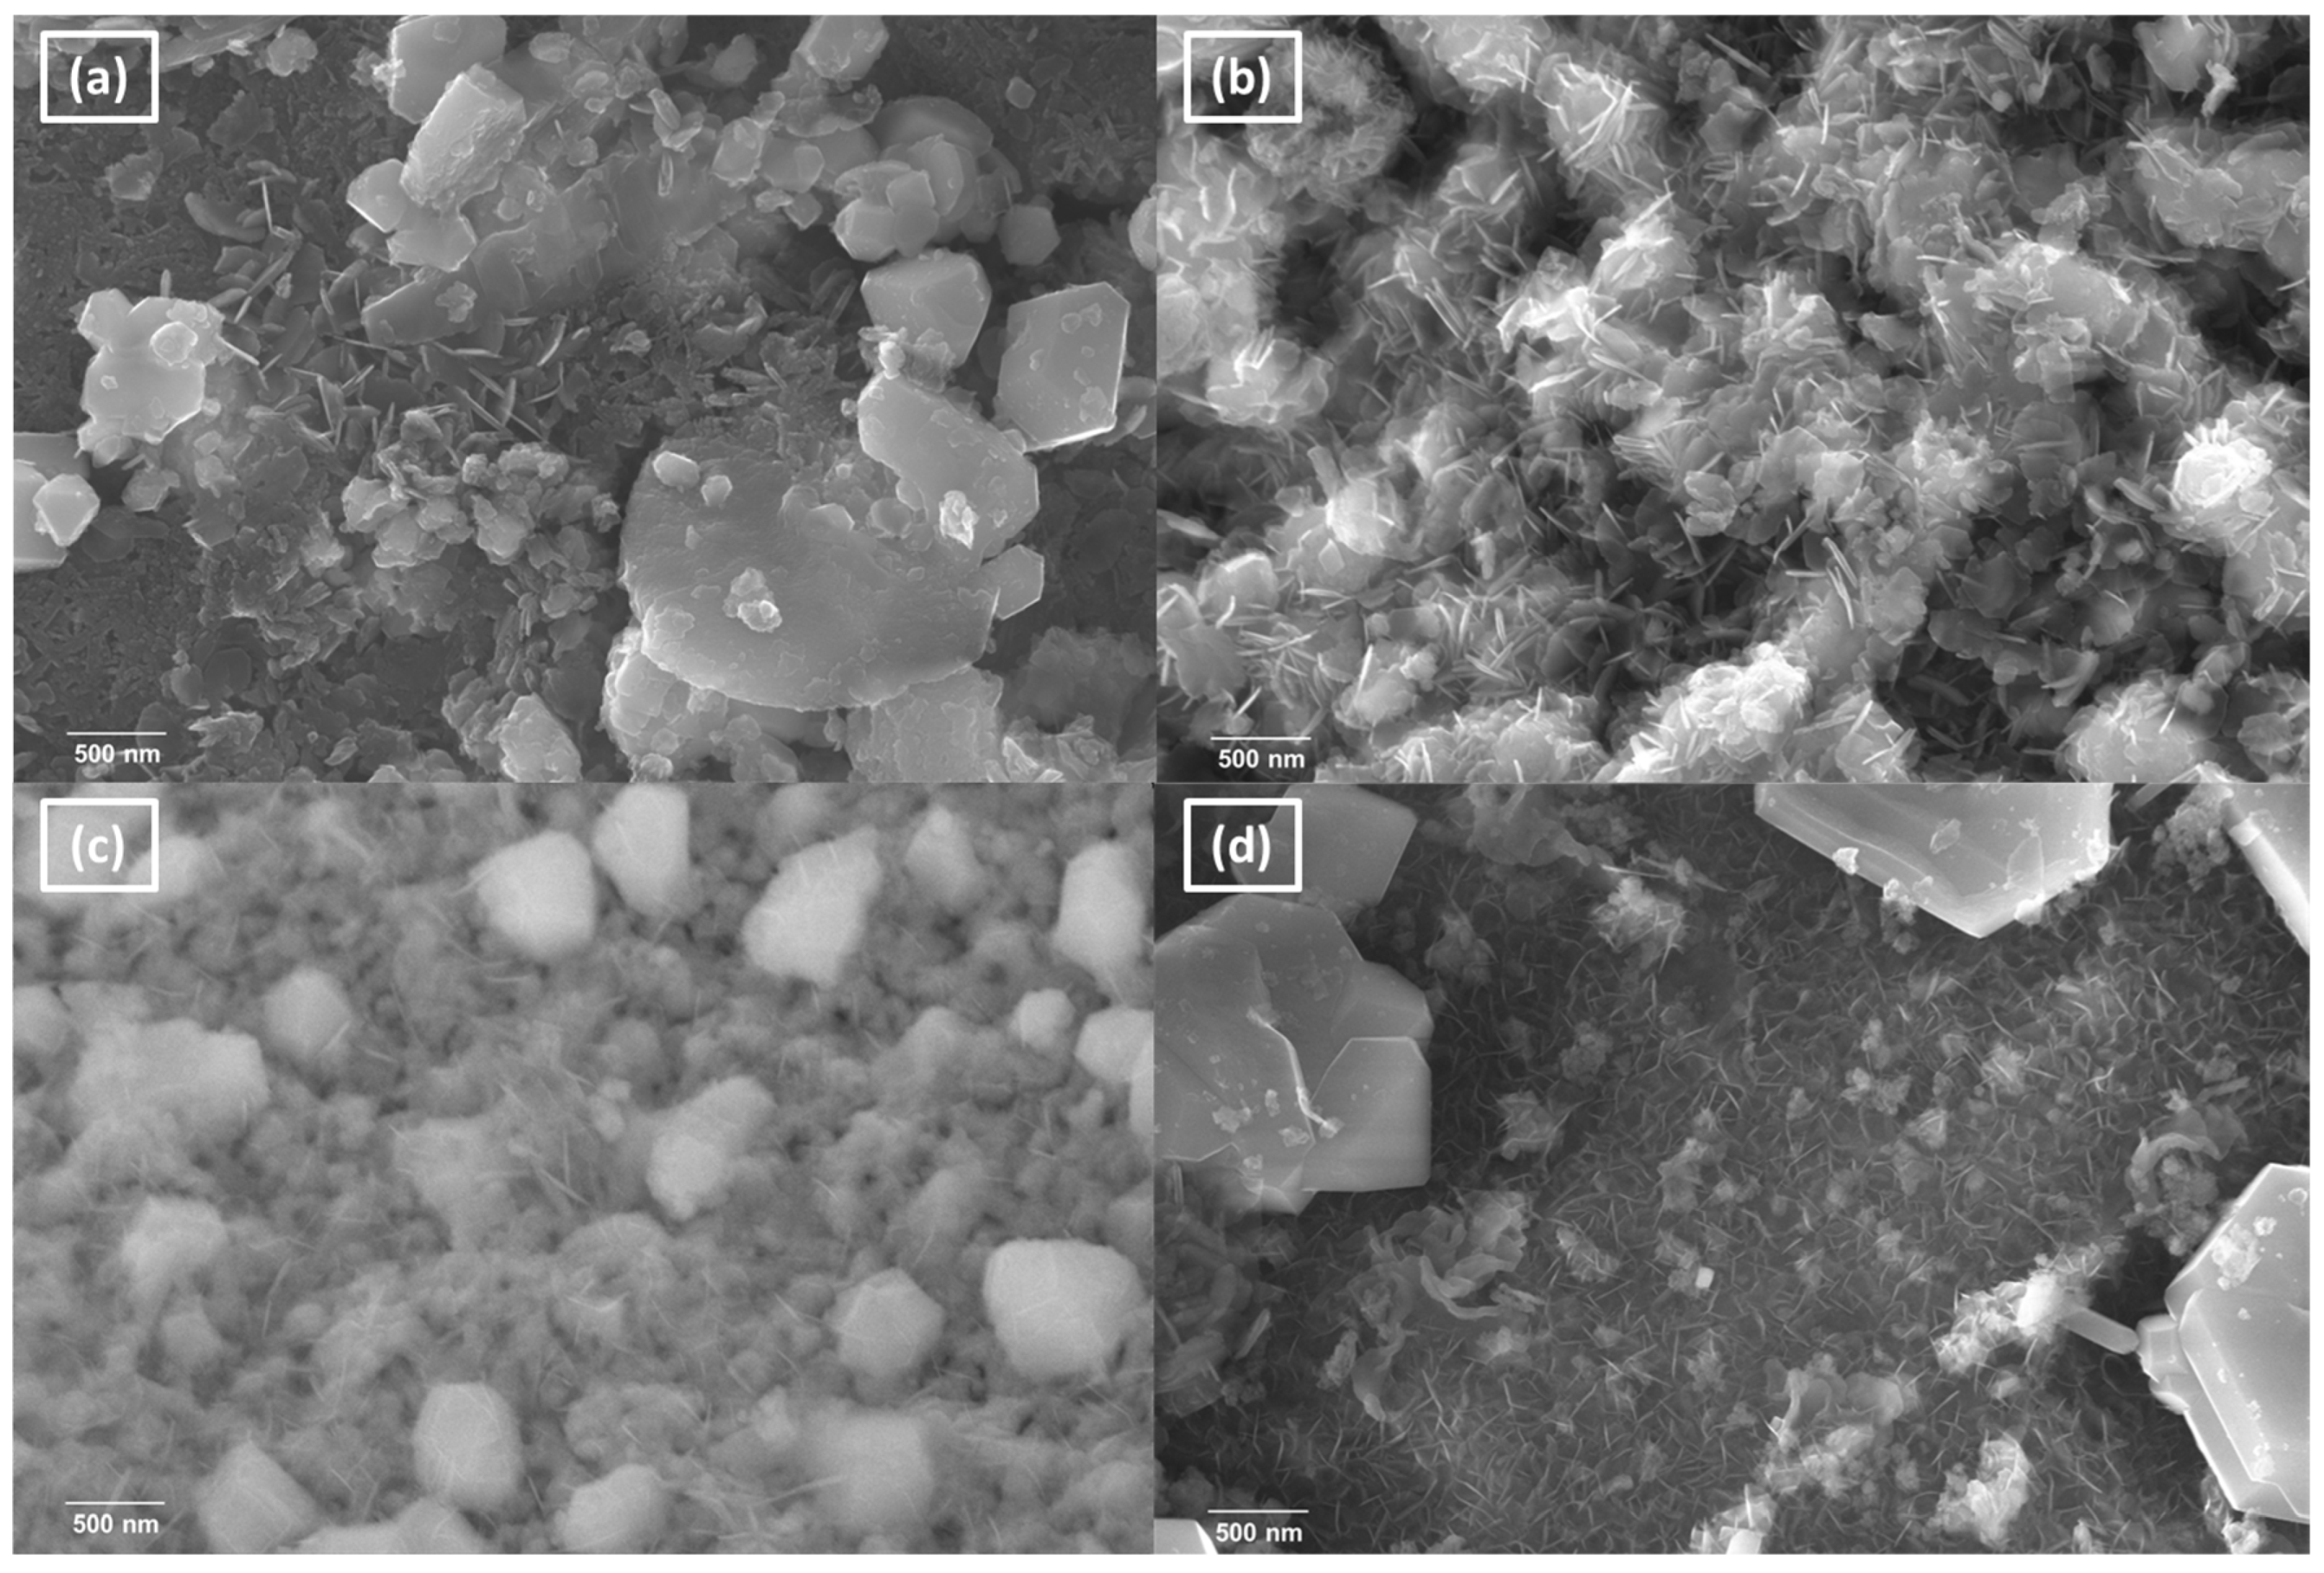
2.1.4. SEM-EDS Analysis and Textural Features

With the aim of studying the surface morphology of the calcined and used catalysts, field emission scanning electron microscopy (FESEM) was used. Figure 7 shows the FESEM images of the CuAl calcined catalysts.
As can be seen in Figure 7, the CuAl catalysts prepared via a coprecipitation method, SACP and CP (Figure 7b and c respectively), tend to show higher surface roughness as well as a more noticeable dispersion of Cu across the catalyst’s surface. This may explain their highest SBET values of 144 and 69 m2/g, respectively. On the other hand, CuAl-PP (Figure 7a) exhibits a lower surface roughness and Cu dispersion, and small spherical Cu domains on the surface can be slightly distinguished. The CuAl-AC1 catalyst (Figure 7d) shows a relatively smooth surface; this may explain its low SBET of 43 m2/g (Table 1). These results clarify the notable influence that the preparation method has on the properties of CuAl catalysts.
Figure 8 shows the effect of the severe liquid-phase reaction conditions on the catalysts. The appearance of Cu0 structures can be observed on the surface of the catalyst due to the reduction treatment. Flower-like particles, elongated shapes, and thick plate structures can be also elucidated in all the used catalysts in the liquid phase. These structures are related to the formation of boehmite phases due to the hydrothermal reaction conditions [68,69]. These results are in concordance with the XRD measurements (Figure 4a).
Figure 8 clearly shows the impact of the preparation method in the properties of the used catalysts in the liquid phase. The CuAl-PP and CuAl-AC1 catalysts (Figure 8a and d, respectively) showed higher particle sizes than the CuAl-SACP and CuAl-CP catalysts (Figure 8b and c respectively), especially the brighter structures, which may correspond to Cu0. These results are in concordance with the calculated average crystallite size of the used catalysts in the liquid phase (Table 2).

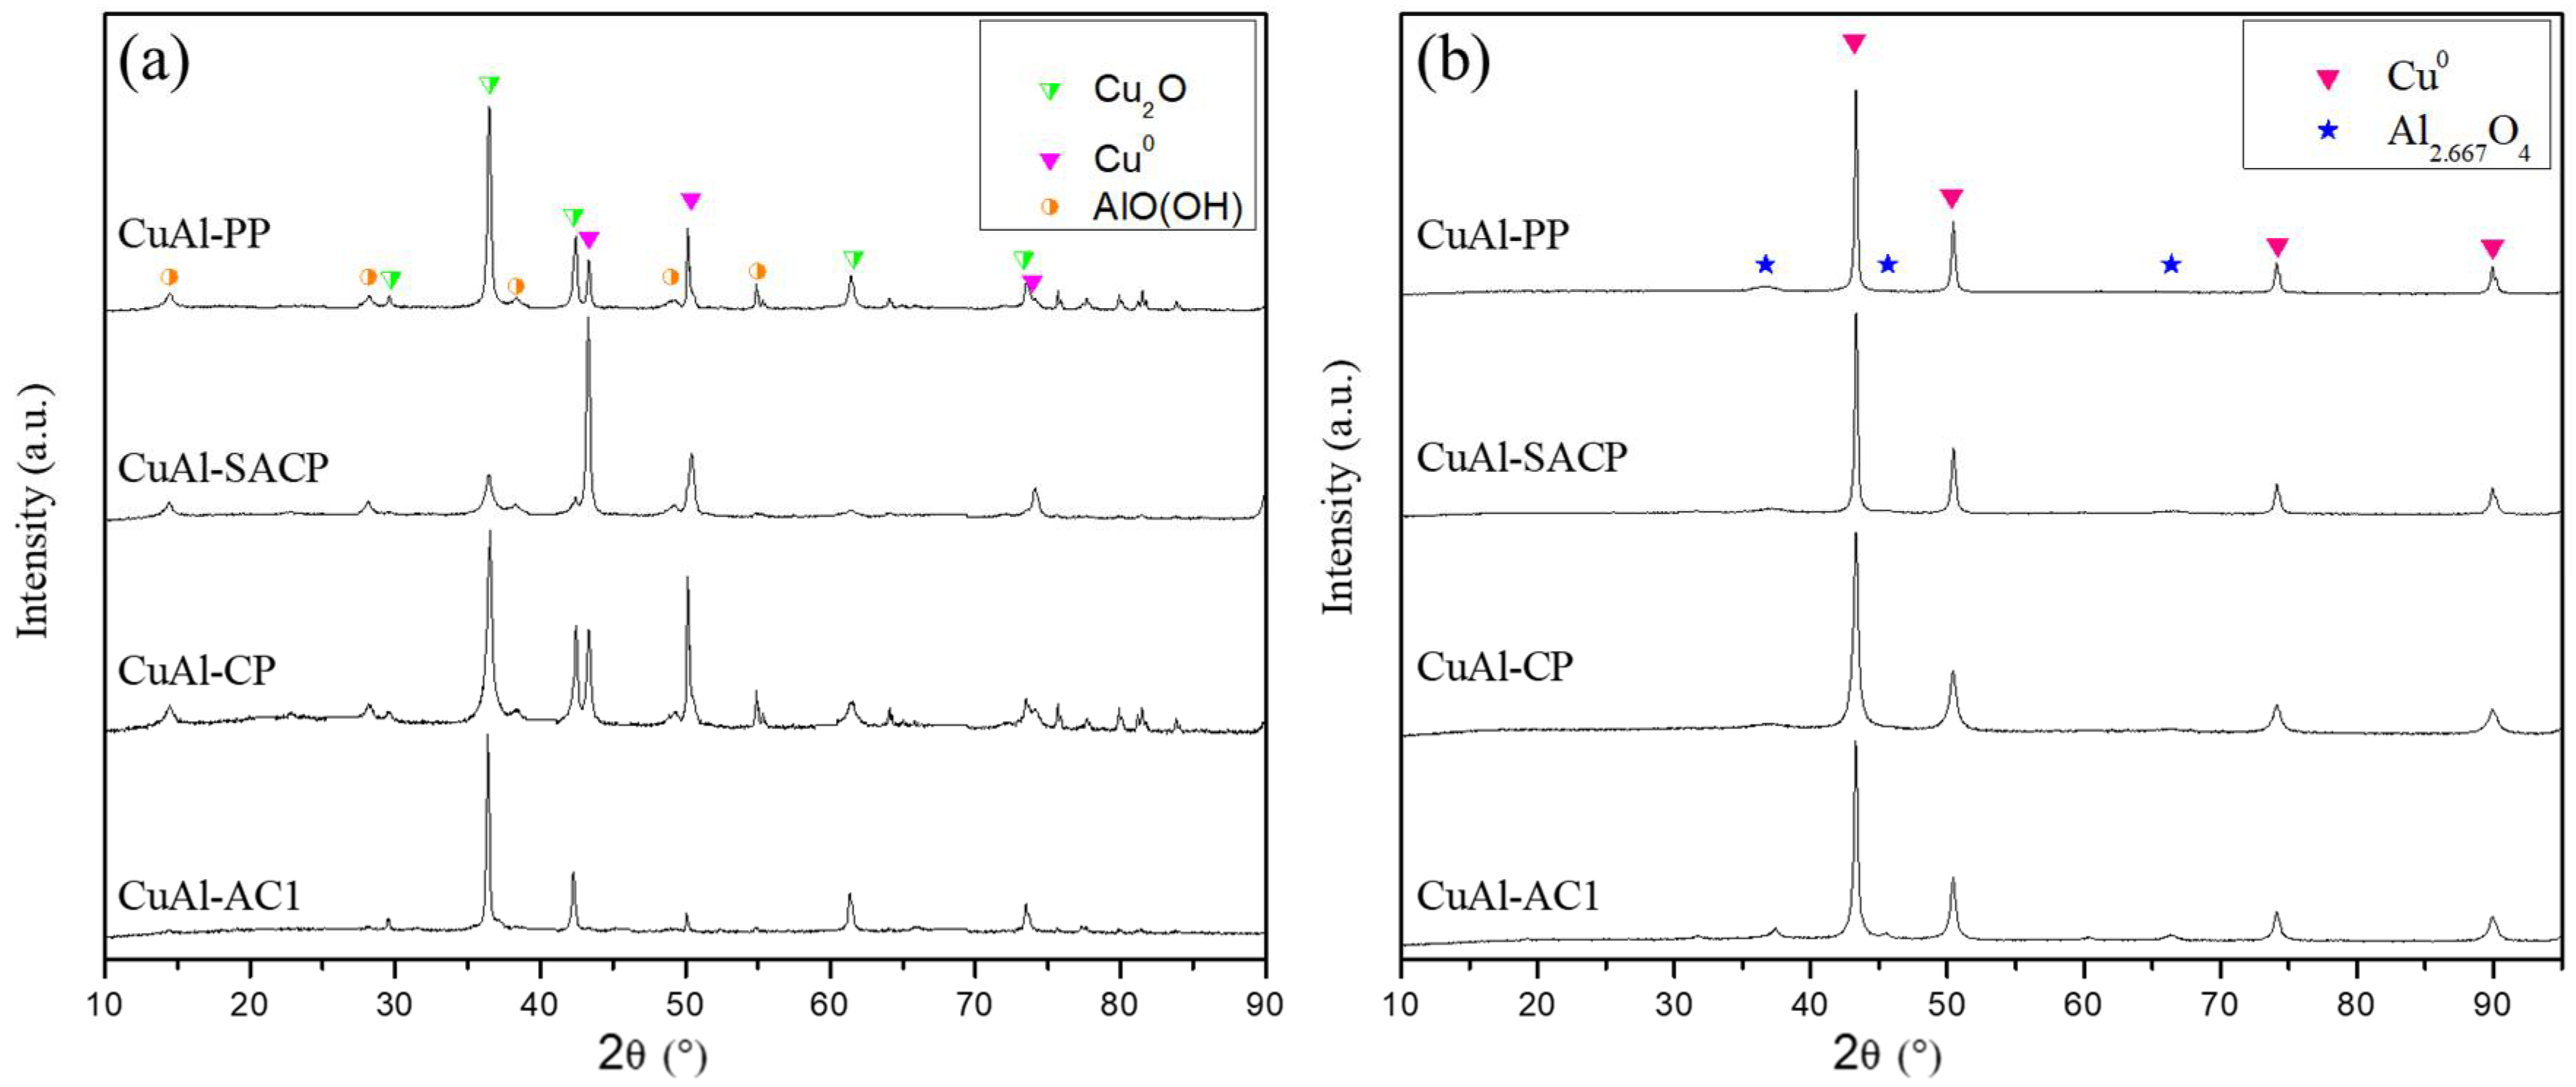
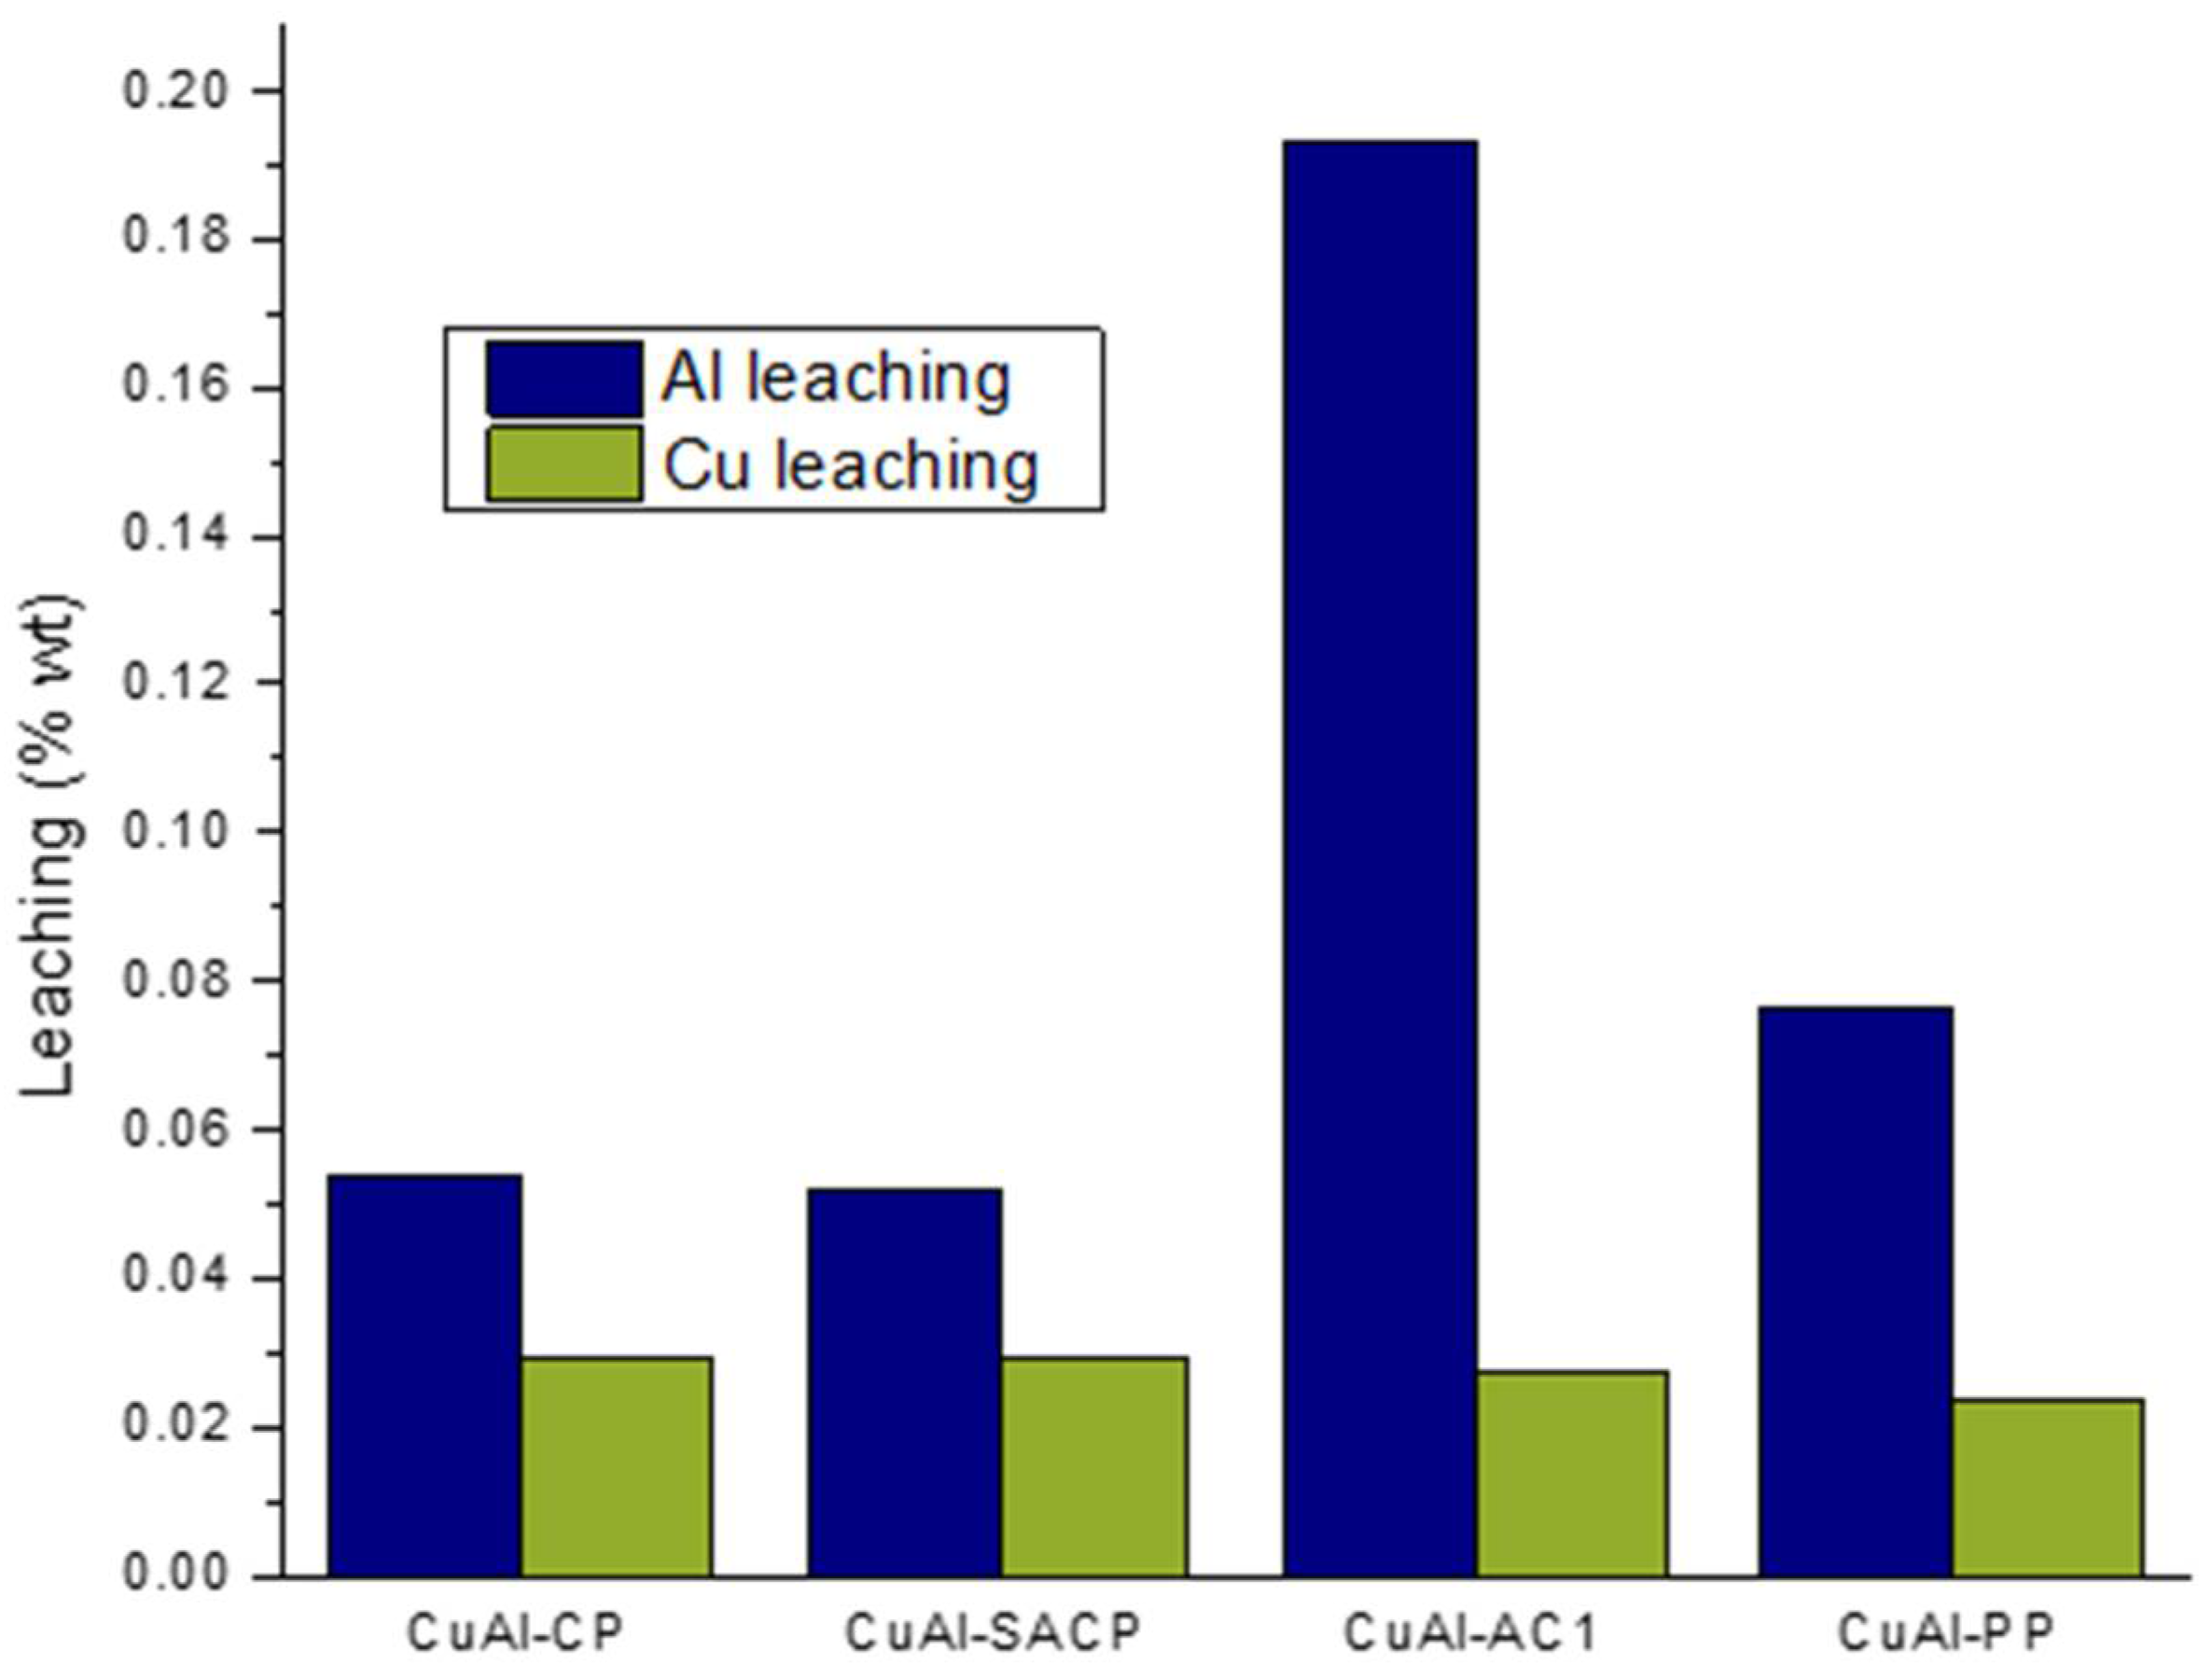
2.1.5. Leaching Studies and Carbon Content in Used Catalysts

The liquid products were analyzed by ICP-OES with the objective of determining the leaching of metals from the catalysts during the liquid-phase reaction. Figure 9 shows the metal mass percentage leaching from the content in fresh catalysts determined by ICP-OES.
It is observed that Al leaching is greater than Cu leaching in all catalysts. The CuAl-AC1 catalysts show the highest Al leaching (0.193%), significantly higher than the rest of the catalysts, with Al leaching less than 0.08%. Cu leaching is smaller than 0.03% for all catalysts. The CuAl-CP catalyst shows leaching values similar to those obtained with the coprecipitated CuAl catalyst of Lete et al. [24]. Cu leaching was very similar in both the present study and Lete’s article. However, Lete’s catalyst showed greater Al leaching than this study, which could be due to the higher Al content.
The carbon content of the used catalysts was studied by elemental analysis. The carbon content on the catalysts used in the liquid phase was undetectable or below the detection limit, while the catalysts used in the gas phase showed detectable carbon deposition values (Table 2). The carbon content, expressed as mg C/(g catalyst g reacted glycerol), followed the order CuAl-CP (31.75) > CuAl-PP (27.17) > CuAl-SACP (15.54) ≈ CuAl-AC1 (15.46).
There could be some reasons to explain the low carbon formation after the reaction in the gas phase, such as the Cu°-Al2O3 assembly in the CuAl-SACP catalyst or the presence of CuAl2O4 spinel in the CuAl-AC1 catalyst. It was clearly observed that these catalysts, CuAl-AC1 and CuAl-SACP, with low carbon formation showed low 1,2-PDO selectivity. Then, in the reaction mechanism, acetol could be desorbed easily from the active site, which hindered acetol conversion to 1,2-PDO and carbon formation. Chiu et al. proposed that in the dehydration of glycerol to acetol the scavenging of hydrogen from the glycerol generates 1,2-PDO and undesired products, including a solid residue [38]. This residue could be the formation of carbon.

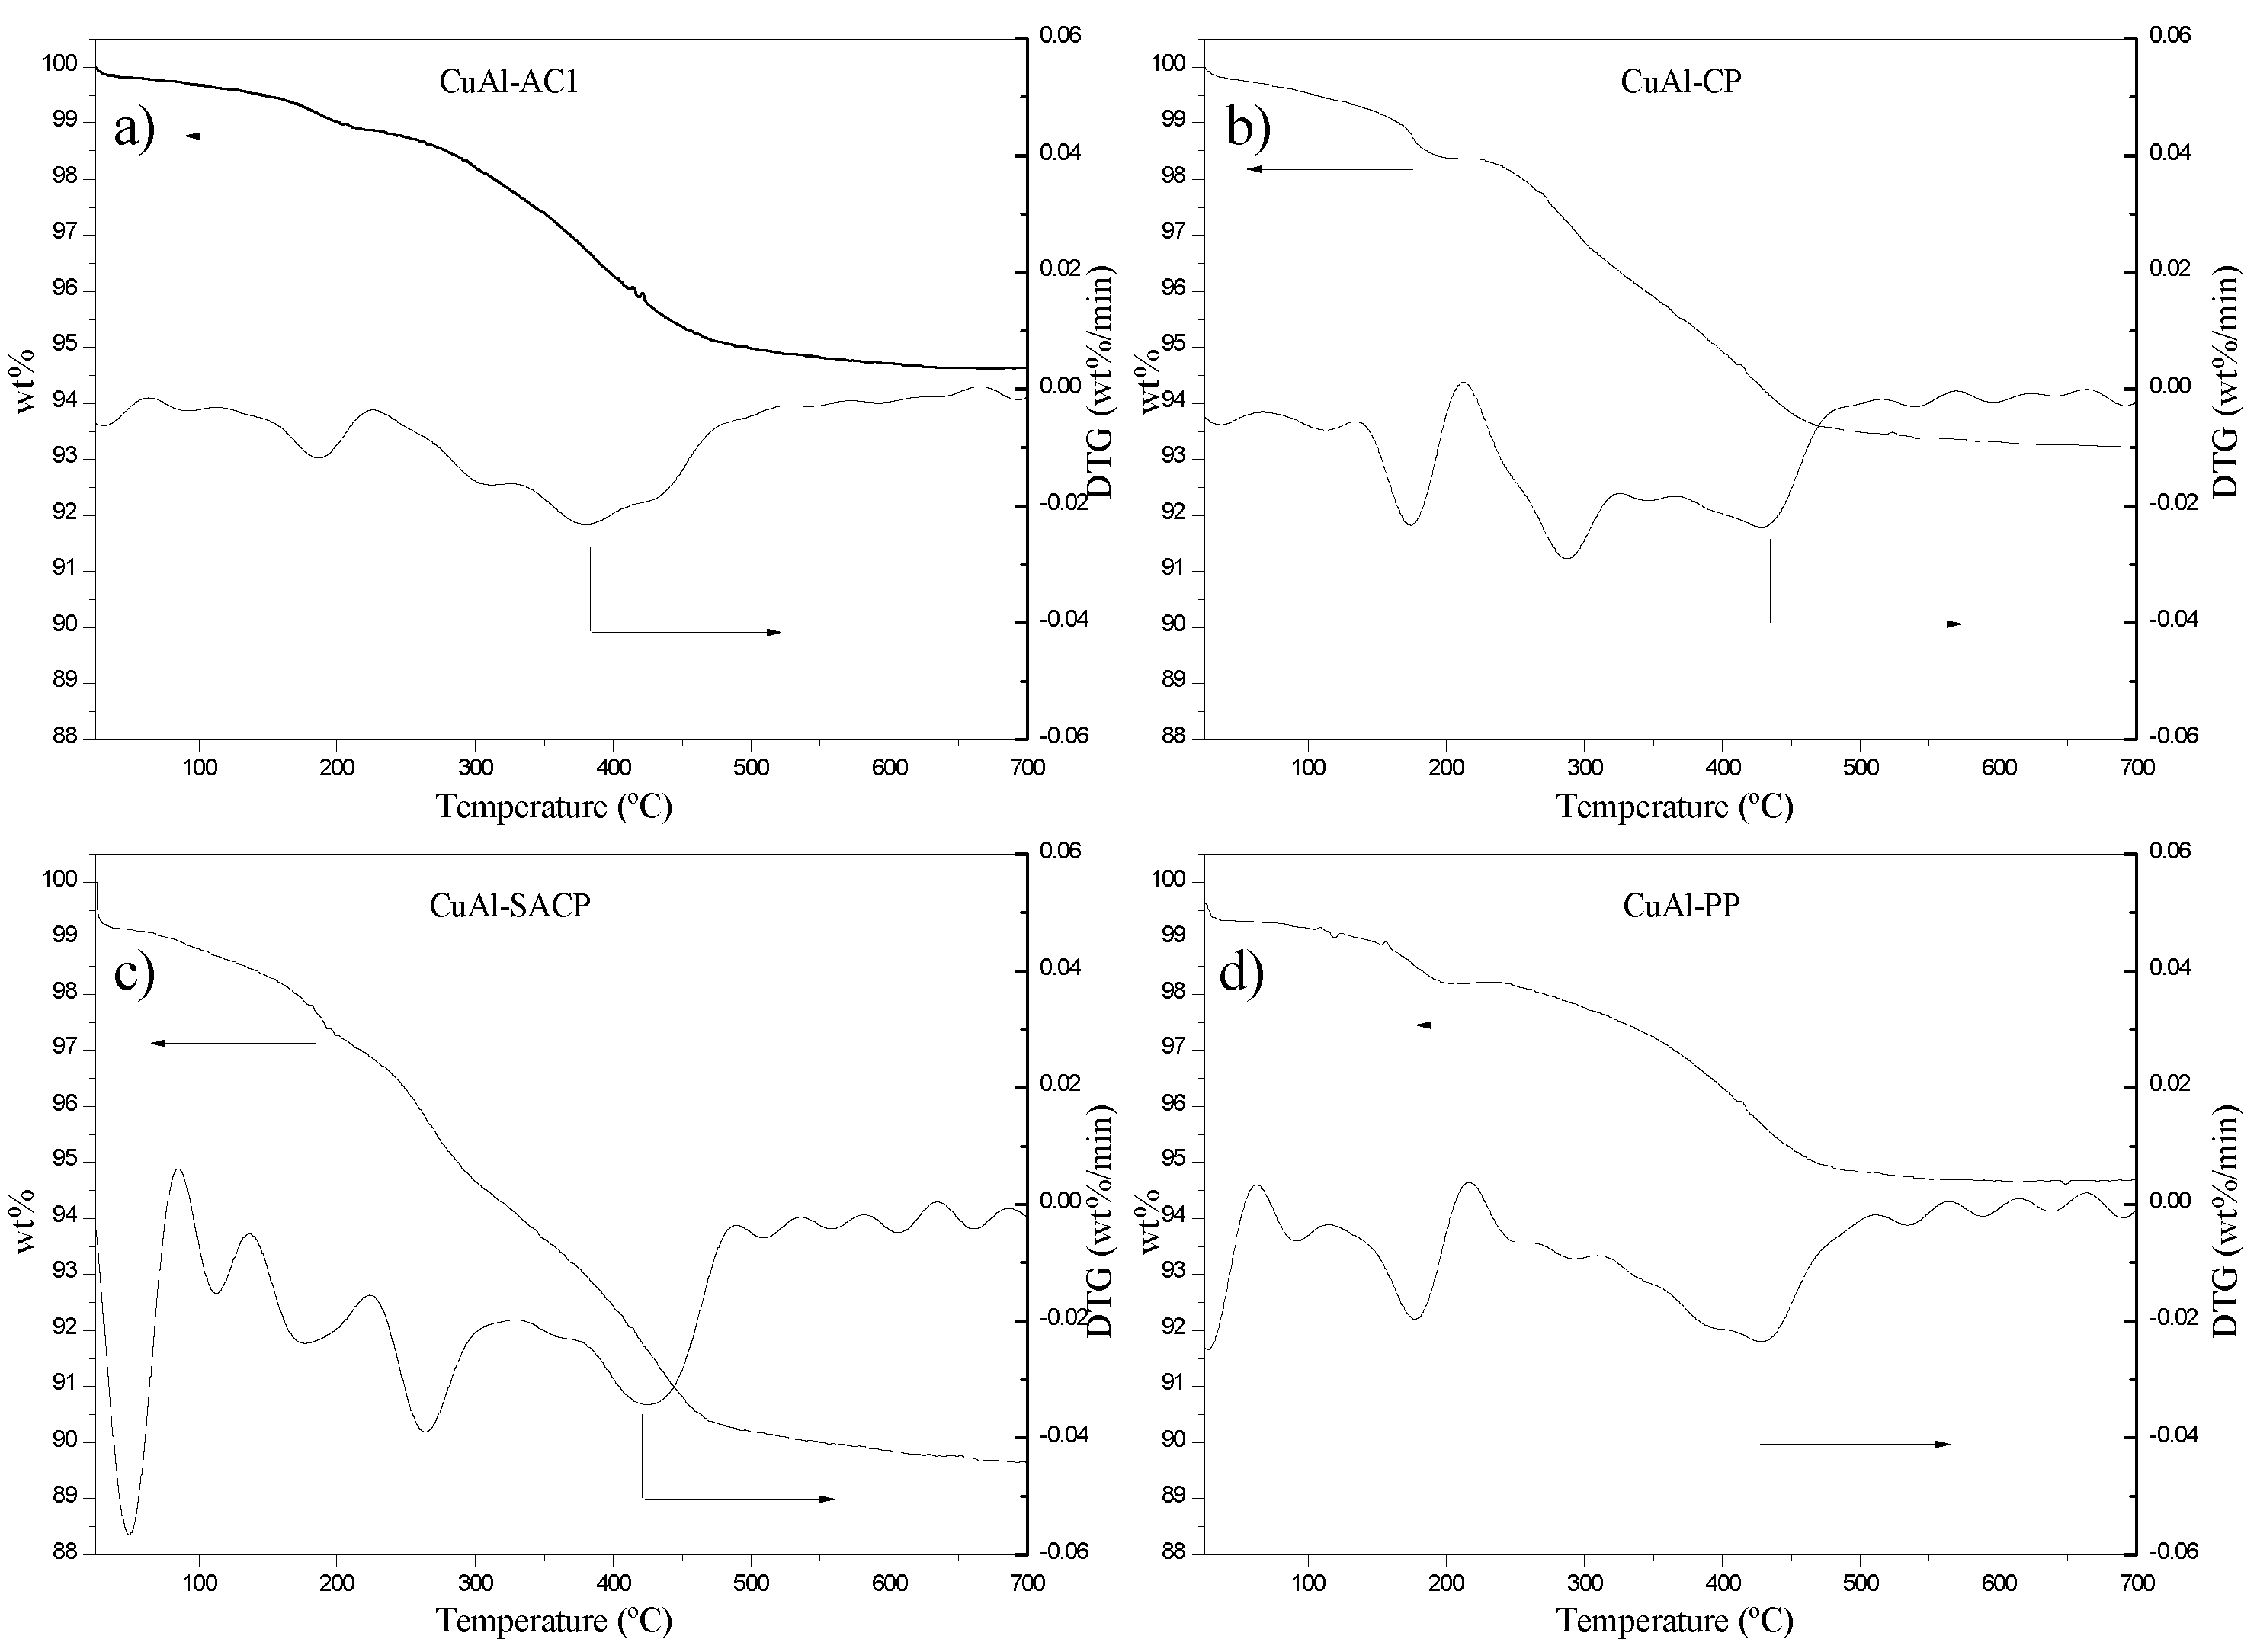
2.1.6. TGA Measurements
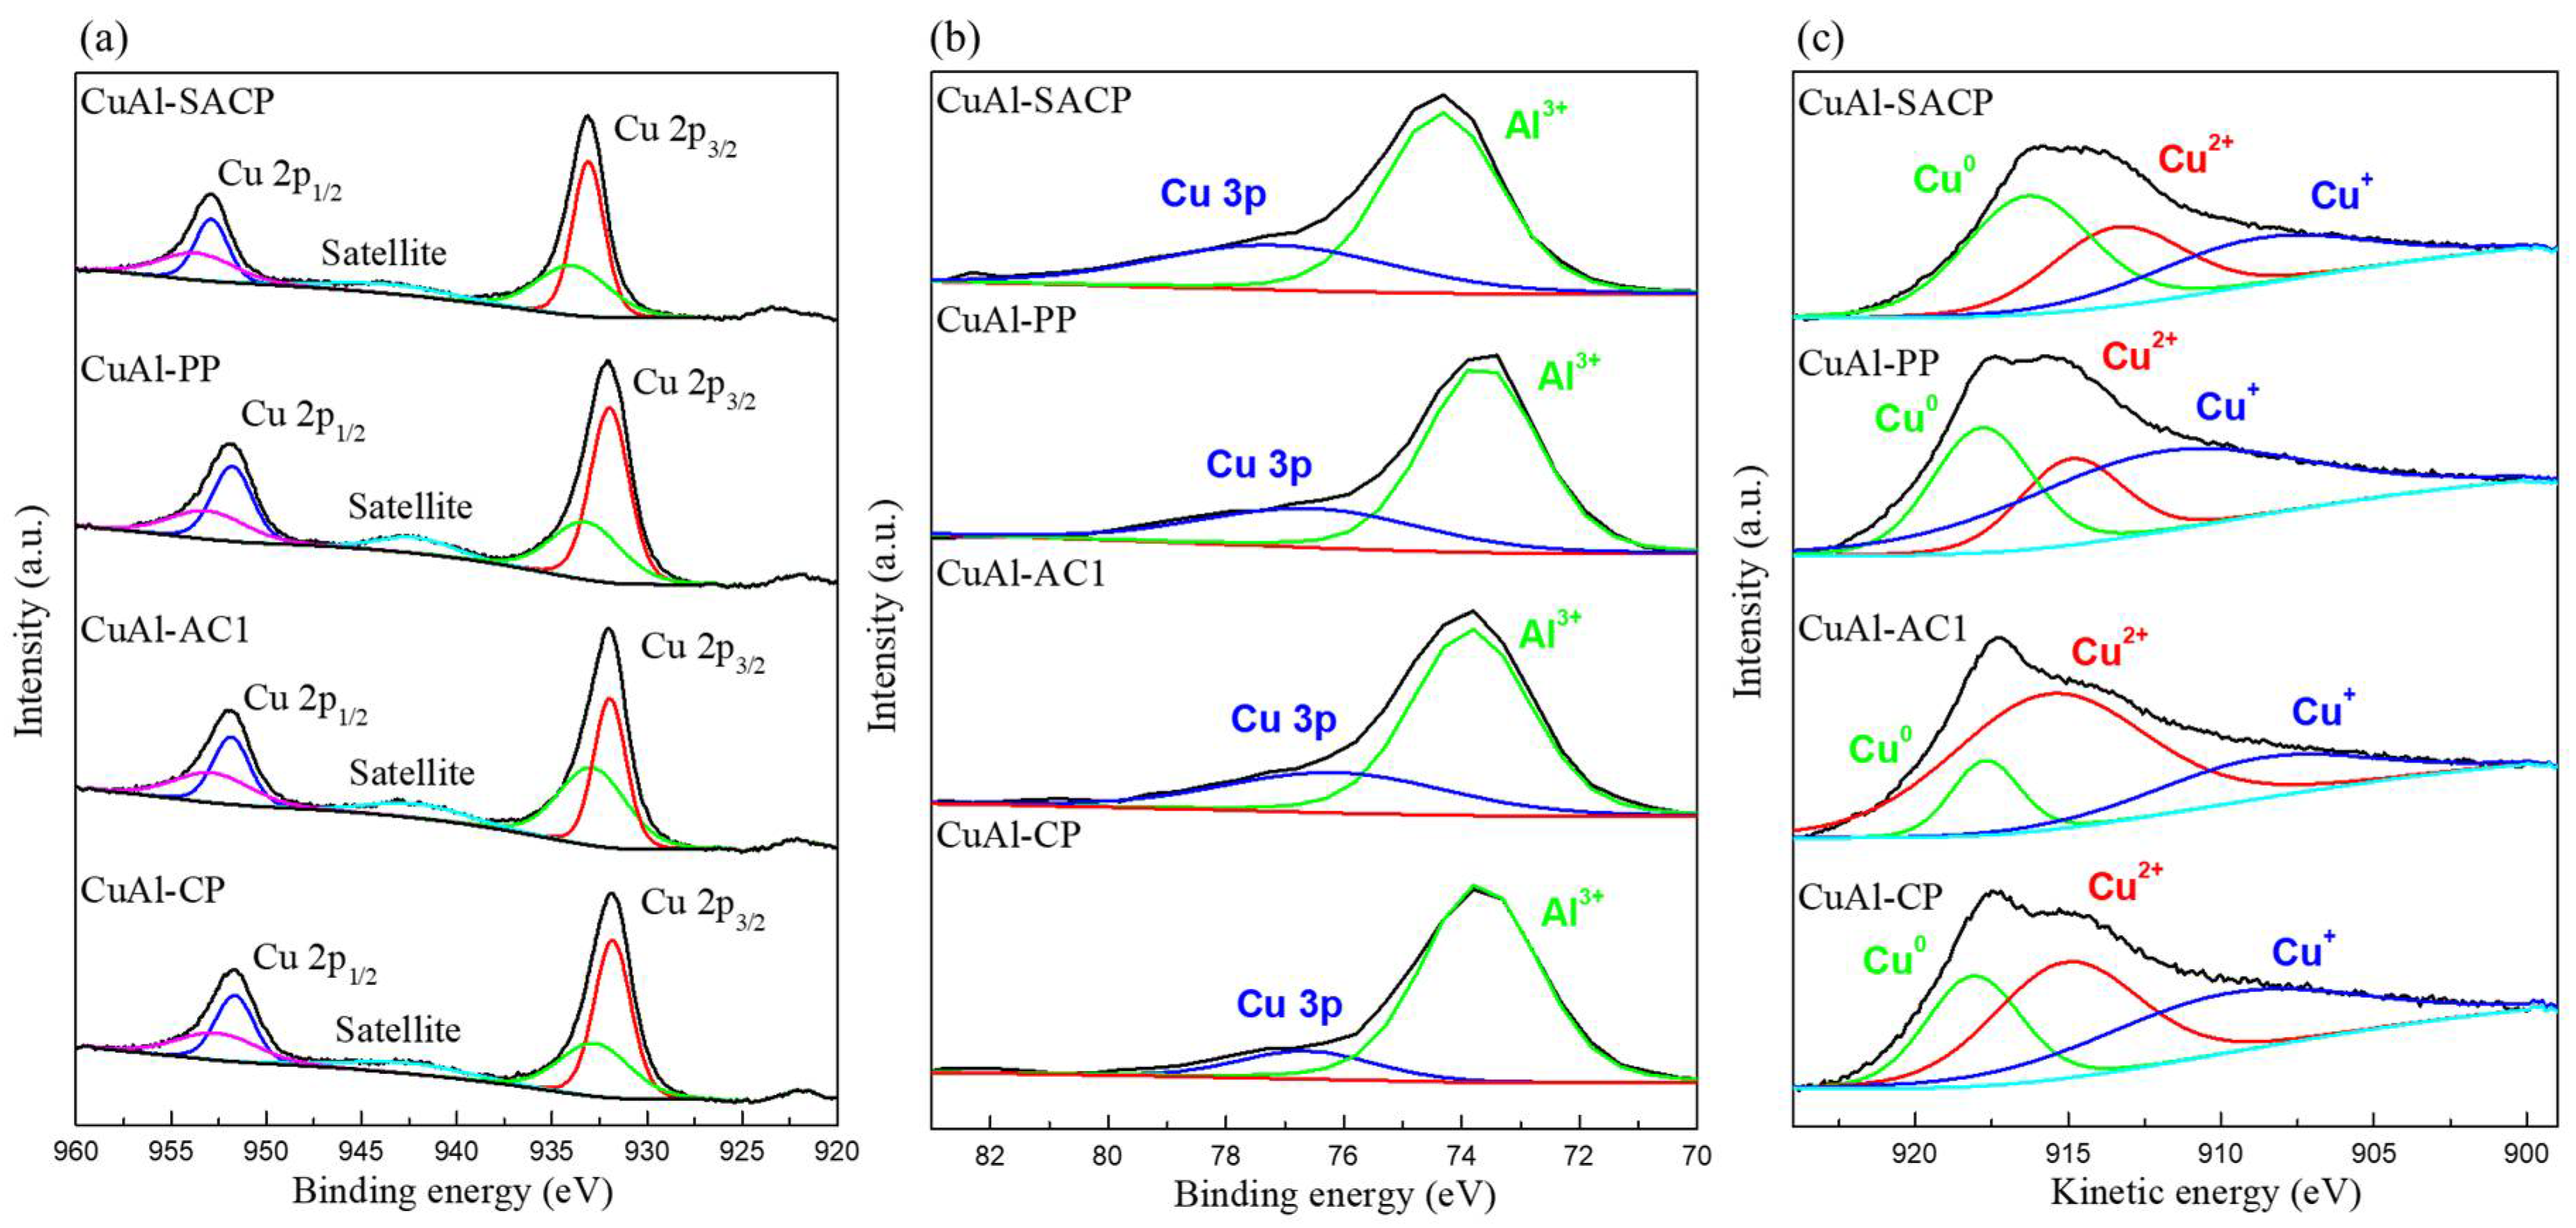
Figure 10 shows the TGA results obtained from the CuAl catalyst used in the liquid phase. Step I, between 25–140 °C, is associated with the loss of physisorbed water, while Step II, between 140–700 °C, is associated with the dehydration of boehmite to Al2O3. Thus, a greater weight loss is due to a greater formation of boehmite during the reaction conditions. The % weight loss in Step II follows the following trend: CuA-SACP (8.78%) > CuAl-CP (6.07%) > CuAl-AC1 (4.89%) > CuAl-PP (4.36%). These results indicate that CuAl catalysts obtained by precipitation methods (CP and SACP) tend to form larger amounts of boehmite under the selected reaction conditions.
There could be a relationship between the formation of the spinel phase, present in CuAl catalysts prepared by AC1 and PP, and the lower formation of boehmite. The existence of the boehmite phase in the CuAl catalyst is not related to the increase in Al leaching. The CuAl-AC1 and CuAl-PP catalysts showed a slightly lower Al content than the rest of catalysts (Table 1), as well as a slightly higher level of Al leaching, and are catalysts with low boehmite formation. This may suggest that the formation of boehmite could prevent the leaching of Al.

2.1.7. XPS Analysis

XPS was used to assess the composition and oxidation state of Cu on the surface of the catalysts used in liquid-phase reactions. XPS data from Cu 2p, Al 2p, and Cu LMM are presented in Figure 11a, b and c, respectively.
The deconvolution of the Cu 2p signal into five contributions is shown in Figure 11a. The contribution of the satellite peaks, intermediate signals, was subtracted. The deconvolution of Cu 2p ½ and 3/2 into two signals confirms the presence of different oxidation states of Cu. The Cu 2p3/2 signal can be deconvoluted into two contributions: at 934.0 eV (referred to Cu2+) and 933.0 eV (referred to Cu0/Cu+) [70,71]. Furthermore, an intermediate signal (satellite peak) at 943.5 eV also confirms the presence of Cu2+ phases on the surface of the catalysts used, as can be seen in previous reports [27,72]. However, in the Cu 2p signal it is not possible to distinguish between Cu0 and Cu+. Figure 11b shows that the Al 2p peak can be assigned to the oxidation state of Al3+, which corresponds to the oxidized phases of Al on the surface [73], also clarified by the XRD data (Figure 4a). The Al 2p peak is subtracted from the deconvoluted signal by removing the Cu 3p contribution.
The Cu LMM signal allows to distinguish the three oxidation states of Cu. The patterns obtained from the samples used are shown in Figure 11c. The XAES spectra obtained corroborate the presence of the three oxidation states of Cu.
The results in Table 4 show that the highest Cu/Al ratio was achieved with CuAl-PP (1.18), followed by CuAl-SACP (0.15) > CuAl-AC1 (0.13) > CuAl-CP (0.11). These results show the notable influence of the preparation method on the properties of the catalysts, as well as on the catalysts used. It is clear that the Cu content of CuAl-PP is much higher than that of the other catalysts used. In this case, the sintering and gelation phenomena, derived from the preparation method, seem to contribute to maintaining a higher Cu content on the surface. The other three catalysts have a very similar value, indicating that the gelation step of the PP preparation method is key to fixing a higher Cu content on the surface.
The percentages of the Cu oxidation state of the catalysts used are also shown in Table 4. The Cu0 (%) follows the following trend: CuAl-SACP (42.4) > CuAl-CP (24.3) > CuAl-PP (23.8) > CuAl-AC1 (12.6). Cu+ follows a different trend: CuAl-PP (46.1) > CuAl-CP (36.5) > CuAl-SACP (28.0) > CuAl-AC1 (21.9). The highest value of Cu2+ (%) on the surface is achieved by CuAl-AC1 (65.5), followed by CuAl-CP (39.2) > CuAl-PP (30.2) > CuAl-SACP (29.5).
It is clear that the two methods that involve a precipitation step (CP and SACP) prevent the oxidation of Cu0 during the liquid-phase reactions. This agrees with our XRD and TPR results. In this way, the presence of spinel phases seems to promote the reoxidation of Cu0 in the liquid phase, as mentioned above. On the other hand, CuAl-PP seems to have a strong tendency to stabilize the Cu+ phases. Thus, the greater metal–support interaction may act to stabilize the Cu+. However, the highest value of Cu2+ (%) is achieved by CuAl-AC1. This oxidation state appears to be extremely stable using this preparation method. As mentioned above, the CuAl2O4 spinel phases exhibit the tendency to promote the reverse oxidation of Cu0. This is consistent with our XPS results. It is clear that the CuAl catalysts with the most intense spinel signal (Figure 3a) are those with the highest Cu2+ content after the reaction. Thus, it is important to choose the correct preparation method to control the presence of relative amounts of spinel phases. These relative amounts of spinel phases in the calcined catalysts can influence the reverse oxidation of Cu during the liquid-phase reaction, affecting the catalyst performance and the selectivity towards the liquid products obtained.
The above results clearly show the oxidation of CuAl catalysts during the liquid-phase experiments. Some modifications can be made to prevent or control Cu oxidation during liquid-phase reactions. Yao et al. [74] demonstrated that Ni can act to prevent Cu from being oxidized through a spillover effect. In this way, Ni can act by dissociating the H2 produced and reducing the oxidized Cu during the liquid-phase reaction.

2.2. Catalytic Activity in the Liquid Phase

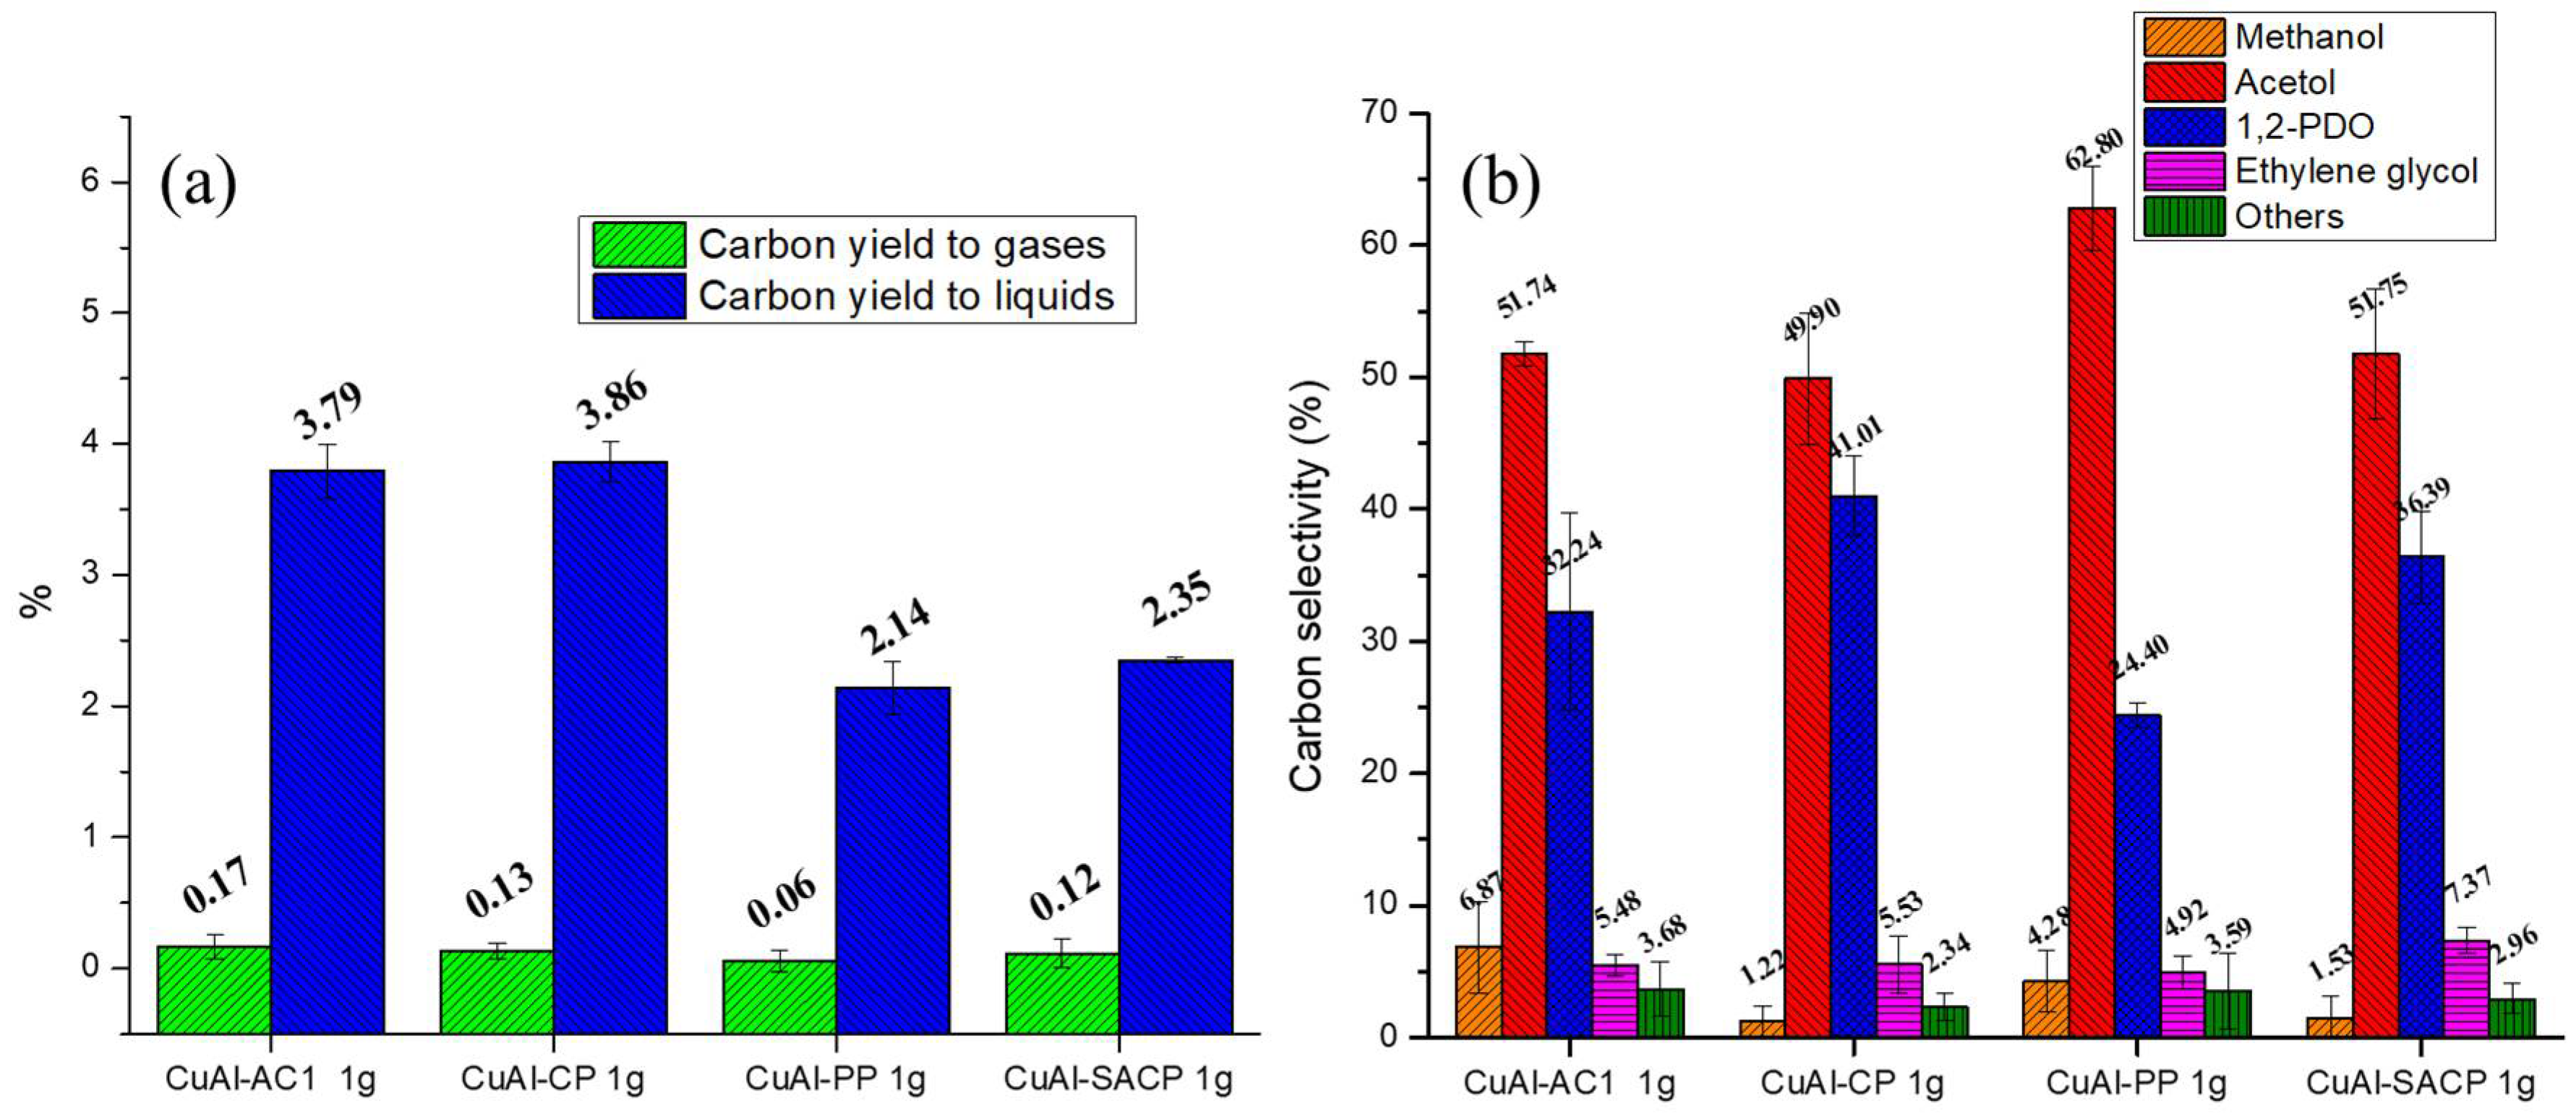
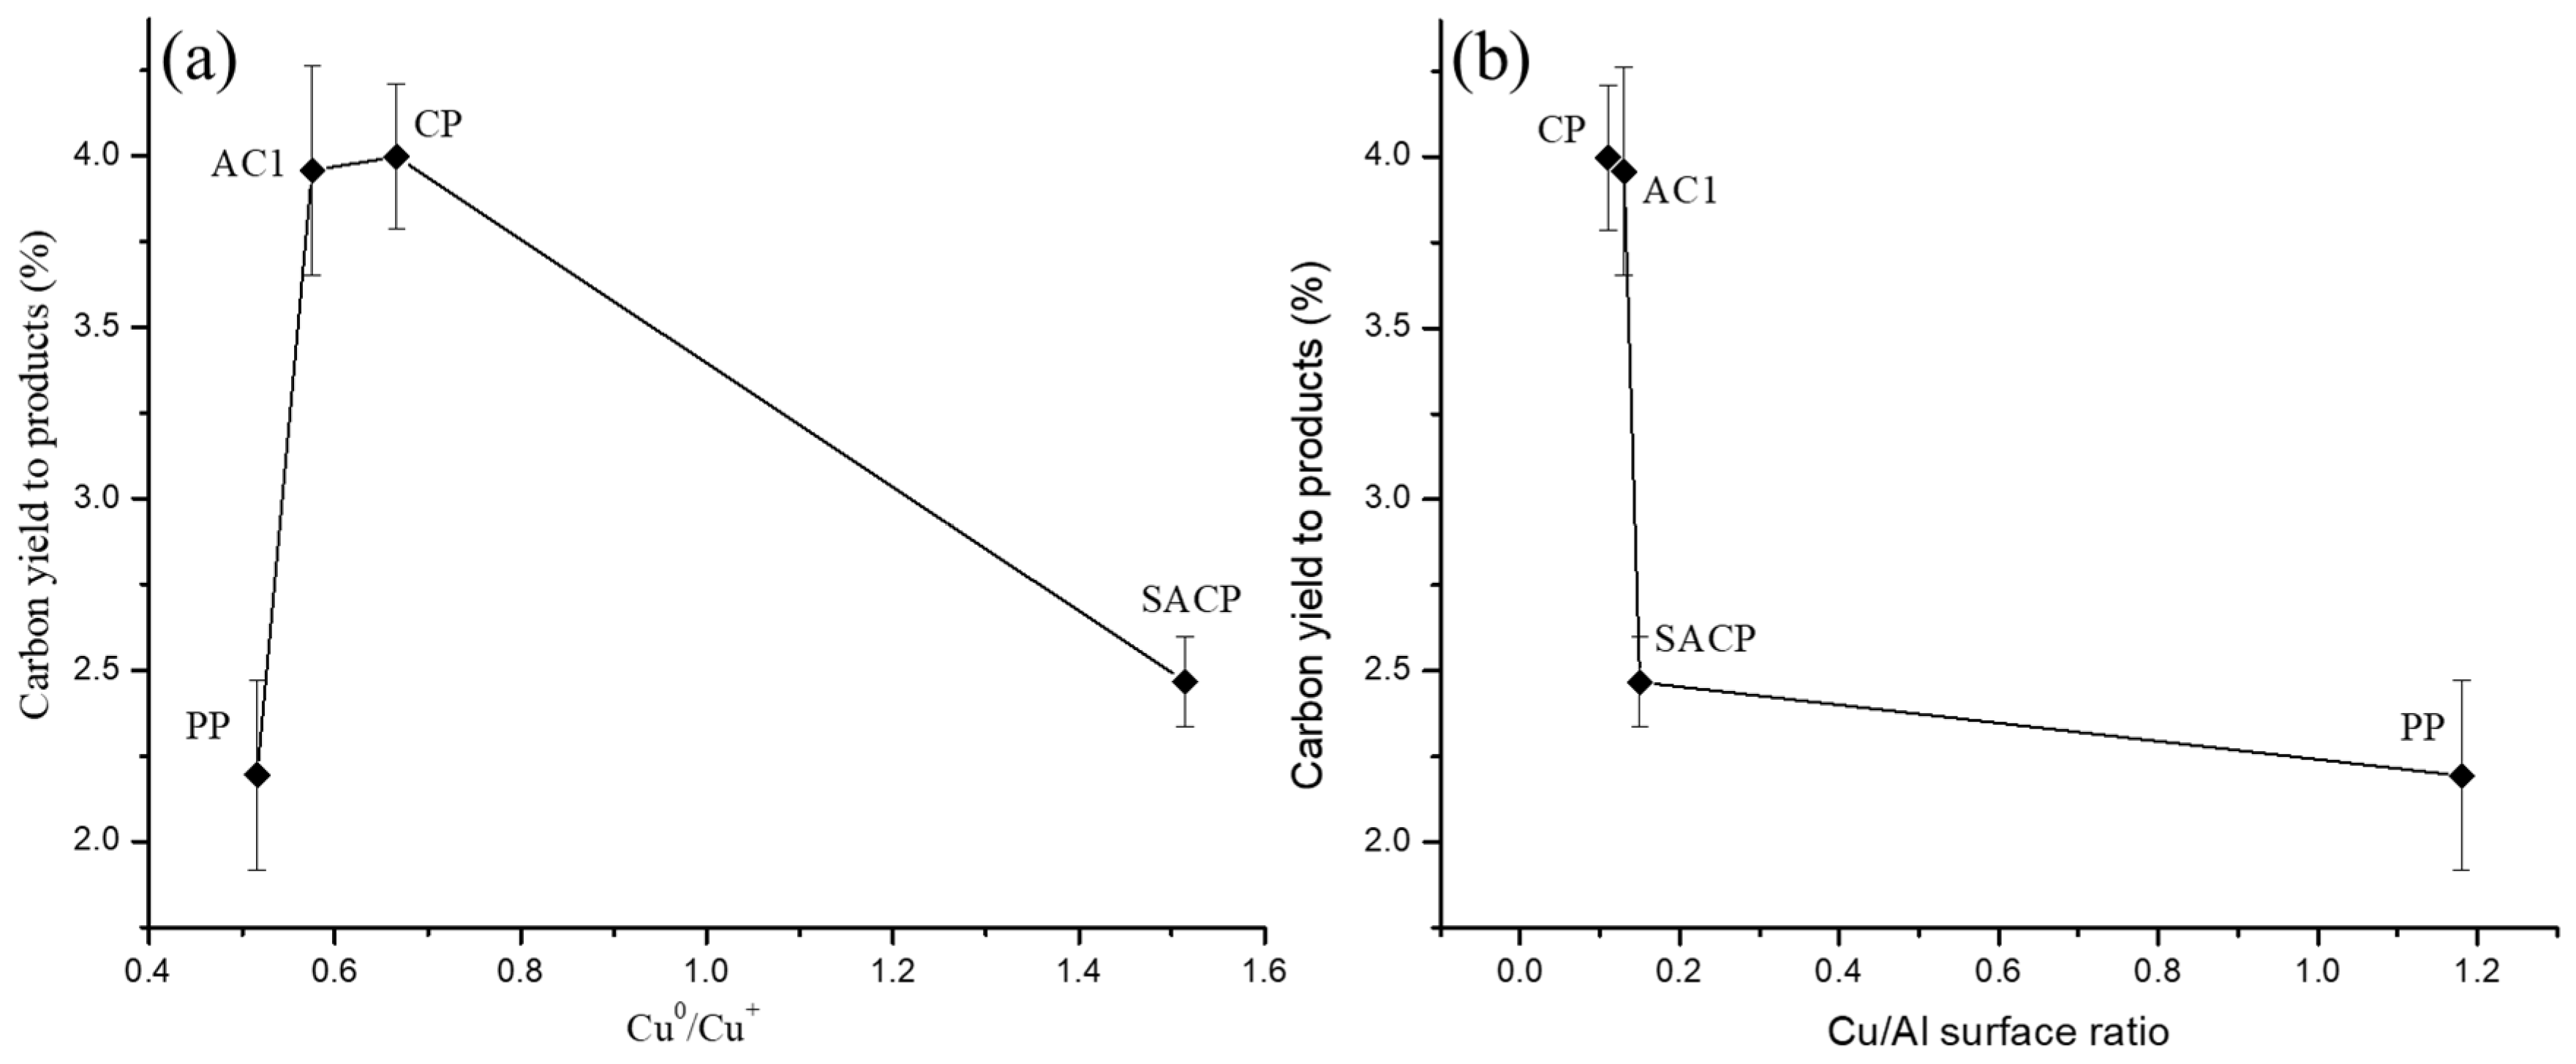
2.2.1. Influence of the Preparation Method

Figure 12a,b shows the experimental results using the CuAl catalysts in the liquid phase with a W/m ratio of 10 gcatalyst·min·gglycerol−1 (g cat min gly−1). The carbon yield to liquids was higher than the carbon yield to gases for all catalysts. The carbon yields to products were very low, with the carbon yield to liquids being less than 4%. The CuAl-AC1 and CuAl-CP catalysts showed carbon yield to liquids values around 3.9%. The carbon yield to liquids obtained with the CuAl-SACP catalysts was around 2.4%, while that generated with CuAl-PP was 2.1%, the lowest value (Figure 12a). The carbon yield to gases was around 0.14% for the CuAl-AC1, CuAl-CP, and CuAl-SACP catalysts, while the CuAl-PP catalyst showed the lowest carbon yield to gases at 0.06%.
Figure 12b shows the carbon selectivity to liquid products. Acetol and 1,2-PDO were the main products, showing in all cases a carbon selectivity for both products greater than 85%. The CuAl-AC1, CuA-CP, and CuAl-SACP catalysts showed similar values of carbon selectivities to acetol and 1,2-PDO, with values around 51% and 39% respectively. The CuAl-PP catalyst showed the highest values of carbon selectivity to acetol, with a value around 63%, while the carbon selectivity to 1,2-PDO was around 24%. Other liquid products were ethylene glycol, and methanol. Minor amounts of acetaldehyde, acetone, methanol, isopropanol, ethanol, and acetic acid were also detected. To measure the real activity of the catalysts, experiments were carried out with inert sand. The results revealed carbon yield values of less than 0.5% in the products. The carbon selectivity to acetol and 1,2-PDO was 10.79% and 65.08%, respectively.
The carbon yield to liquids and gases, the effective activity, followed the order CuAl-CP ≈ CuAl-AC1 > CuAl-SACP > CuAl-PP. These results could be due to the size of the Cu crystallites’ size after reduction (Table 1). The CuAl-CP catalyst had a Cu crystallite size, determined by Scherrer’s equation, of 22.3 nm, a consequence of the high SBET value in the calcined catalyst, 144 m2/g. However, the SBET of this catalyst decreased significantly to 53 m2/g after being used in the liquid phase. The CuAl-AC1 catalyst showed a Cu crystallite size after reduction of 27.7 nm. The SBET of this calcined catalyst and after its use in the liquid phase presented similar values, 43 and 51 m2/g, respectively. The CuAl-SACP catalyst presented a Cu crystallite size after reduction of 32.8 nm. Furthermore, this catalyst showed significant stability in SBET after its use in the liquid phase, with values of 69 and 65 m2/g for the calcined and spent catalyst, respectively. The CuAl-PP catalyst showed the largest Cu crystallite size after reduction with a value of 35.4 nm. The SBET of this catalyst was not stable after use in the liquid phase, 63 and 37 m2/g were the SBET values after calcination and use, respectively.
All these catalysts were modified after being used in the liquid phase, which was observed in XRD patterns with the presence of Cu2O and boehmite phases. As can be observed in Figure 5 for the CuAl-PP catalyst, boehmite is generated from contact with liquid water at a temperature and pressure of 227 °C and 34 bar, respectively, during stabilization to reach the operating conditions prior to the glycerol reaction. On the other hand, the Cu2O phase appeared after glycerol reaction.
Boehmite formation was estimated from TGA analysis (Figure 10). There appeared to be a relationship between boehmite formation and catalyst activity. Thus, the CuAl-PP and CuAl-AC1 catalysts showed low boehmite formation and their activity is very different.
The analysis of SBET and Vp of the catalysts after use in the liquid phase did not show a clear trend with the catalyst activity. The CuAl-PP catalyst showed the lowest activity and this catalyst presented the lowest SBET (37 m2/g) and the lowest Vp (0.11 cm3/g). However, the CuAl-SACP catalyst showed the highest SBET (65 m2/g) and the highest Vp (0.24 cm3/g) and its activity was not the highest.
To explain the activity of the catalyst, two hypotheses have been found in the literature. The first hypothesis supports that these materials only have Cu0 as the active phase, where H2 is activated and glycerol is adsorbed through the hydroxyl group and cleaved [17]. Rasika et al. [15] elucidated the importance of the Cu0 phase for the activation of glycerol, showing a drop in the conversion of glycerol using their catalysts without a prior activation treatment with H2. The second hypothesis suggests that Cu catalysts have two different active sites: Cu0, where H2 is activated, and Cu+, where the adsorption and cleavage of hydroxyl groups take place [38]. Furthermore, the influence of the Cu0/Cu+ ratio on the selectivity of the Cu catalysts has been suggested [15].
From the XPS results, Figure 13a has been prepared, which shows a relationship between the carbon yield to products and the Cu0/Cu+ ratio. The Cu0/Cu+ ratio around 0.6–0.7 showed the best catalytic activity. Xiao et al. [27] previously tested the synergetic effect of an optimal Cu0/Cu+ ratio, for which they obtained a maximum glycerol conversion value. Unlike our case, instead of modifying the preparation methods used, they modified the calcination and reduction temperature used. Their results show an optimal value of the Cu0/Cu+ ratio of 6.6, different from ours (0.58–0.67). This may be due to the different composition of their catalysts, Cu-Cr.
On the other hand, the Cu/Al surface ratio, also obtained from the XPS analysis, is shown in Figure 13b. These results clearly indicate that high concentrations of Cu on the surface of the catalysts negatively affect their activity. Therefore, we tentatively propose that there may be an optimal Cu/Al surface ratio that promotes Cu activity.
The CuAl-PP catalyst showed the lowest carbon yield to gases and the lowest carbon selectivity to EG. This may indicate that the acetol hydrogenation reaction is not favored, resulting in the highest acetol selectivity among all CuAl catalysts tested. On the other hand, EG production is commonly associated with H2 production, as proposed in Figure 14 [75]. This lower H2 production could also reduce the hydrogenation of acetol to 1,2-PDO.

2.2.2. Influence of the Catalyst Amount

Due to the low catalyst activity in the liquid phase using a W/m ratio of 10 g cat min gly−1, a larger amount of catlayst was used, resulting in a W/m ratio of 30 g cat min gly−1. For this, two preparation methods were selected: CuAl-PP, due to its high carbon selectivity to acetol, and CuAl-CP, due to its high carbon yield to liquids. CuAl-AC1 is also an interesting catalyst, but its low density was not appropriate. Figure 15a,b shows the experimental results.
The increase in the amount of catalyst, as a consequence of the W/m ratio, caused an increase in the carbon yields to liquids and gases. For example, the carbon yield to liquids with the CuAl-CP catalyst was 3.9 and 7.7% for W/m ratios of 10 and 30 g cat min gly−1, respectively. The trend observed using a W/m ratio of 10 gcatalyst·min·gglycerol−1, which indicated higher activity of the CuAl-CP catalyst than the CuAl-PP catalyst, is also followed using the ratio of 30 g cat min gly−1. The carbon selectivity to liquid products (Figure 15b) was significantly modified with the increase of the W/m ratio of 30 gcatalyst·min·gglycerol−1. The main liquid product obtained using the CuAl-CP catalyst was 1,2-PDO. When the CuAl-PP catalyst was used, the main liquid product obtained was acetol, but the carbon selectivity to acetol was 56.1%, significantly lower than the value of 62.8% obtained with the W/m ratio af 10 g cat min gly−1.
It is clear that an increase in the amount of catalyst leads to a lower carbon selectivity to acetol while increasing the carbon selectivity to 1,2-PDO. Based on our results, it can be seen that, regardless of the amount of catalyst, an increase in effective activity, quantified as total carbon yield, leads to higher carbon selectivity to 1,2-PDO and lower carbon selectivity to acetol. This trend was also observed in previous studies [76]. This suggests that the selectivity to these products is not only influenced by the catalyst used and its microstructure but also by the kinetic and thermodynamic influence inherent to the process itself. Studies, such as that of Yfanti et al. [77], have concluded that the kinetics of the combined reaction cycle followed a Langmuir–Hinshelwood reaction model with competitive adsorption processes between the reactant (glycerol) and reaction products (acetol). In this way, acetol can act by blocking the active centers, inhibiting the adsorption of glycerol. The hydrogenation of acetol to 1,2-PDO should promote its desorption, allowing greater glycerol activation processes.

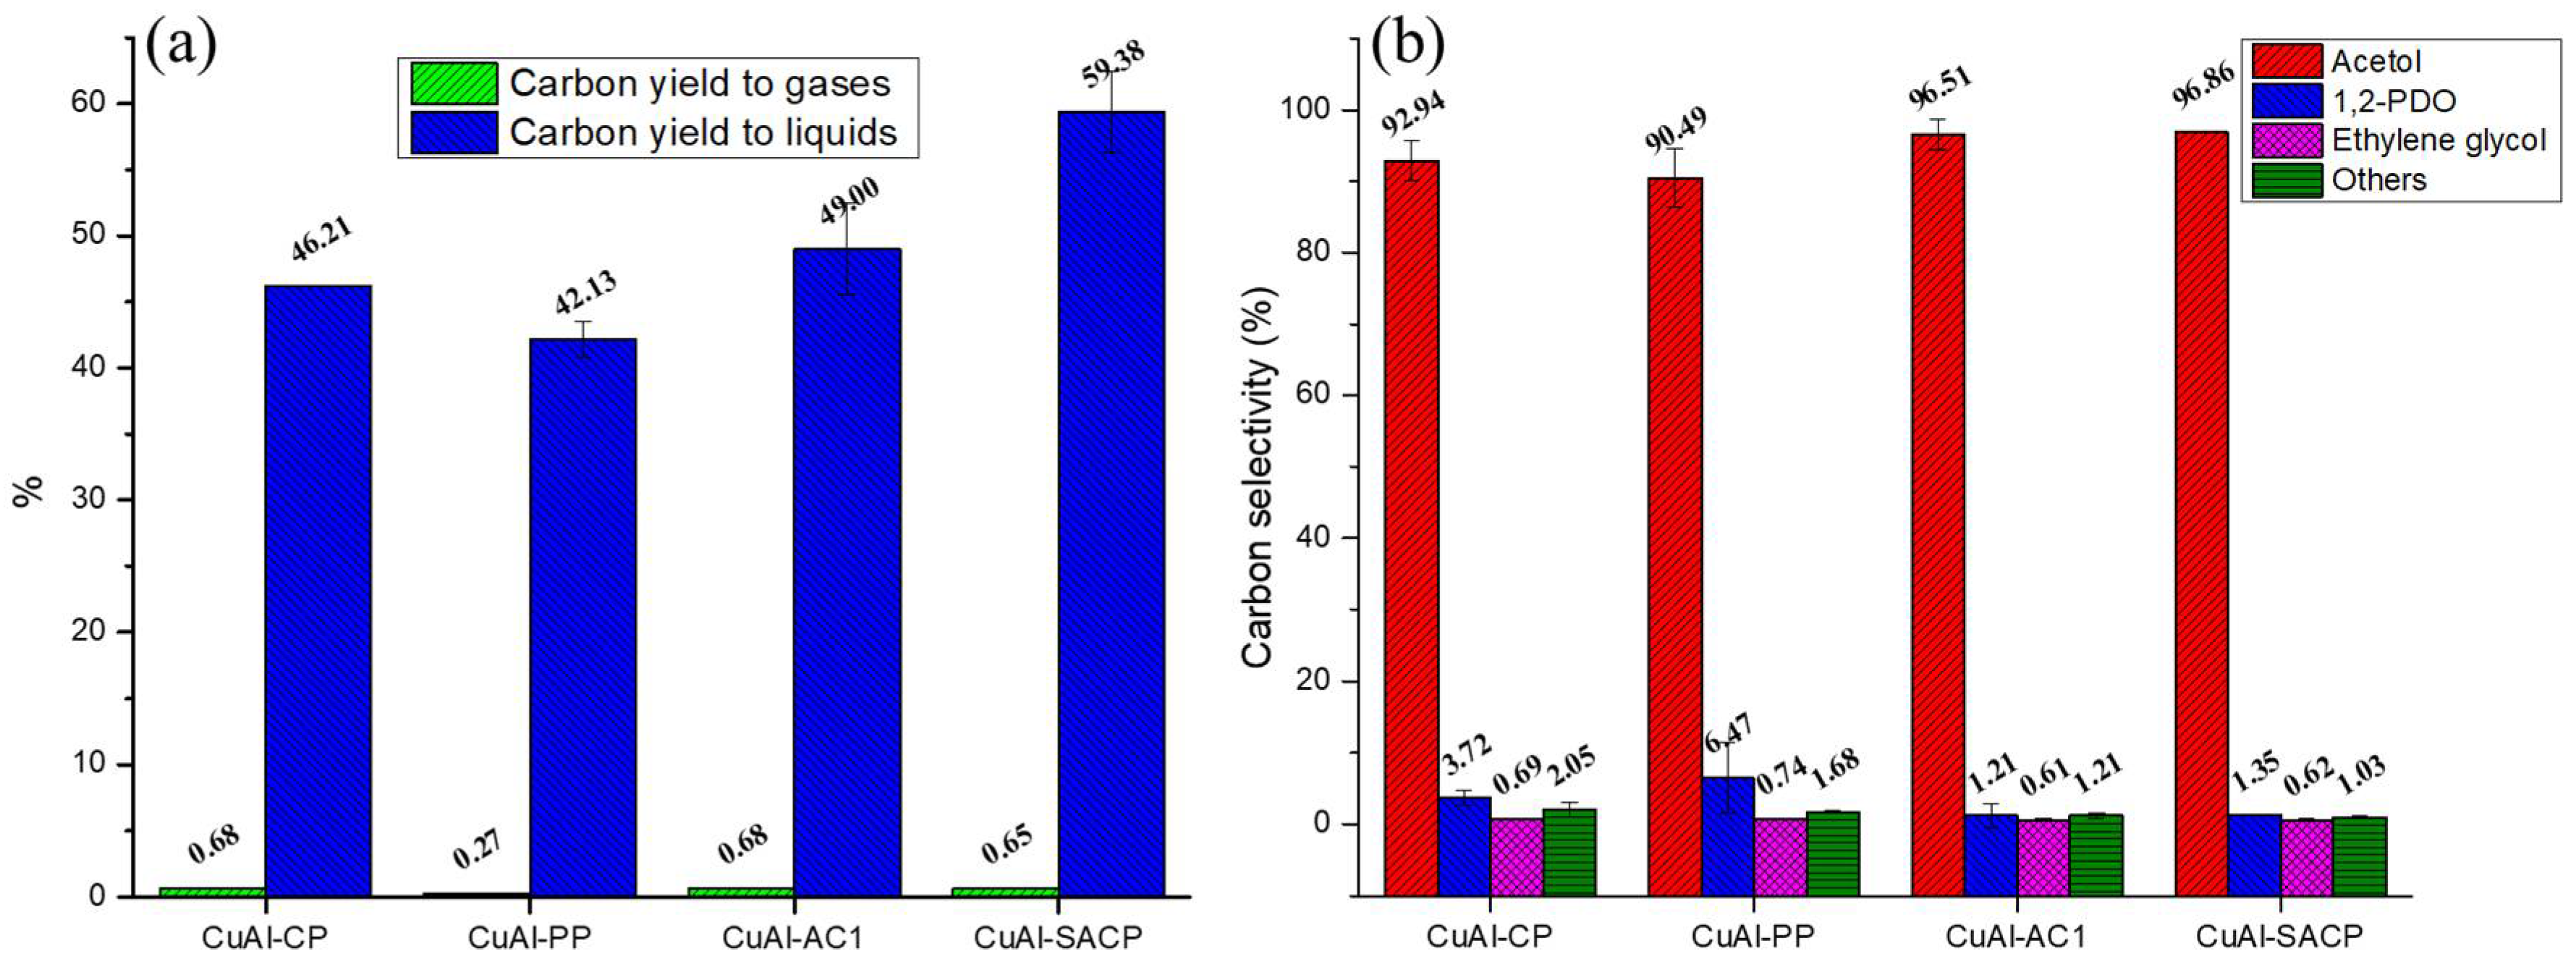
2.3. Catalytic Activity in the Gas Phase

All CuAl catalysts were also studied in the gas phase at 227 °C and atmospheric pressure. As can be seen in Figure 16a, the highest carbon yield to liquid products is achieved by CuAl-SACP (59.38%), followed by CuAl-AC1 (49.00%), CuAl-CP (46.21%), and CuAl-PP (42.13%). The carbon yield to gaseous products is still very low and is very similar for three of the catalysts: CuAl-CP (0.68%), CuAl-AC1 (0.68%), and CuAl-SACP (0.65%). The lowest value is obtained from CuAl-PP (0.27%).
The carbon selectivity to liquid products can be seen in Figure 16b. The main product obtained in all cases is acetol. The highest acetol selectivity is obtained from CuAl-SACP (96.86%) and CuAl-AC1 (96.51%), followed by CuAl-CP (92.94%), and CuAl-PP (90.49%). As can be seen, all catalysts are very selective to acetol. The second major product obtained is 1,2-PDO. CuAl-PP showed the highest carbon selectivity to 1,2-PDO (6.47%) followed by CuAl-CP (3.72%) > CuAl-SACP (1.35%) > CuAl-AC1 (1.21%). The carbon selectivity to ethylene glycol is also very low, with values between 0.6–0.7%. To measure the real activity of the catalysts, experiments were carried out with inert sand. The results revealed values of less than 1% of carbon yield to products. The carbon selectivity to acetol and 1,2-PDO were 22.49% and 75.43%, respectively.
The CuAl-SACP catalyst showed the highest acetol yield, with a value of 462.6 mgacetol/gglycerol, which resulted from an acceptable carbon yield to liquid and a high carbon selectivity to acetol. This result could be related to the low carbon formation (Table 2) 15.5 mg C/gcat·gReacted glycerol. The CuAl-AC1 catalyst with an acetol yield of 380.4 mgacetol/gglycerol showed low carbon formation (15.5 mg C/gcat·g gReacted glycerol) and liquid product selectivity similar to that obtained with the CuAl-SACP catalyst. However, the CuAl-CP and CuAl-PP catalysts showed higher carbon formation with values of 31.8 and 27.2 mg C/gcat·g gReacted glycerol and similar liquid product selectivity with lower selectivity to acetol, around 92%, and higher selectivity to 1,2-PDO, around 4%. The CuAl-PP catalyst showed the lowest acetol yield, 306.6 mgacetol/gglycerol, which is a consequence of the lower carbon yield to liquids and low carbon selectivity to acetol.
A comparison of CuAl-CP and CuAl-SACP catalysts with similar Cu content and different crystallite sizes of spent catalysts, determined by XRD (Scherrer’s equation), 25.8 nm and 33.6 nm for CuAl-CP and CuAl-SACP, respectively, indicated that the larger crystallite size of the CuAl-SACP catalyst than the CuAl-CP catalyst did not adversely affect the acetol yield. Furthermore, the higher SBET of the CuAl-CP catalyst than the CuAl-SACP catalyst, with values of 141 and 69 m2/g, respectively, did not favor the acetol yield. Considering the H2-TPR results (Figure 6), the CuAl-CP catalyst showed a higher proportion of the easily reduced CuO phase around 231 °C, while the CuAl-SACP catalyst presented a higher proportion of the reduced CuO phase at 252 °C. After activation of the catalyst with H2, the Cu0-Al2O3 assembly should be appropriate for the dehydration of glycerol to acetol in the gas phase, generating low carbon formation.
The CuAl-PP catalyst showed in the H2-TPR analysis the greatest relative amount of reduced CuO phase at 228 °C, being the catalyst with the highest Cu crystallite size, determined by XRD, 36.2 nm, and the highest Cu content (52.2%).
The low carbon formation of CuAl-AC1 catalyst, 15.5 mg C/gcat·gglycerol reacted could be related to the presence of CuAl2O4 spinel phase in the calcined catalyst and, as a consequence, a relative amount of 12.1% of reduced oxidized phase at 355 °C in the H2-TPR analysis.
Comparing these results with those obtained in the liquid phase (Figure 12 and Figure 15), it is clear that in the gas phase the carbon selectivity to acetol is much greater than in the liquid phase. In this way, the dehydration pathway seems to be promoted instead of the sequential dehydration–hydrogenation of glycerol. This problem has been previously reported by other authors [24,27] in the liquid and gas phases. Since this phenomenon is observed in all catalysts, regardless of the preparation method, we believe that the reaction mechanism may be similar for both liquid-phase and gas-phase reactions. The differences in glycerol conversion and acetol selectivity favoring gas-phase catalysts are not primarily due to the reaction steps themselves, but rather the lower diffusivity of glycerol in the liquid phase. This reduces access to the catalyst’s active sites, decreasing conversion on one hand, and on the other hand increases the contact time of adsorbed products on the catalyst surface, facilitating subsequent hydrogenation reactions of acetol and lowering its selectivity. In the gas phase, the greater diffusivity of glycerol enhances conversion to acetol, and the higher space velocity, along with shorter contact times, prevents subsequent reactions towards 1,2-PDO, thus explaining the observed increase in acetol selectivity.
However, other phenomena may also influence the catalytic results. The XRD results (Figure 4a,b) indicate that in the liquid phase, Cu0 is oxidized, while this does not occur in the gas phase. We propose that this oxidation during the reaction facilitates electron transfer from the Cu catalyst to acetol, enhancing its hydrogenation to 1,2-PDO, as proposed by previous researchers [27].
On the other hand, textural properties also seem to influence the catalytic behavior of our catalysts. The high SBET values for the catalysts after their use in the gas phase of glycerol dehydration appeared to negatively affect the performance of the catalysts. Therefore, the CuAl-CP and CuAl-PP catalysts exhibited the highest SBET values but demonstrated low glycerol conversion, low acetol selectivity, and high carbon formation.
Textural properties did not appear to be significant in the dehydration of glycerol in the liquid phase. The CuAl-SACP and CuAl-PP catalysts used in the liquid phase showed the highest and lowest SBET values after use, respectively, and both catalysts displayed poor catalytic performance with low glycerol conversion. In this way, diffusion problems as well as the appearance of a Cu0/Cu+ ratio during the reaction, influenced by the microstructure of the catalysts, seem to have a greater influence in the liquid phase.

2.4. Comparison with Other Works of Literature

Although the comparison of the performance of the catalysts shown in this work with other published works is not simple, since the operating conditions, flow rates, catalyst amounts, and other conditions are not identical from one work to another, beyond the values of conversions, selectivities, and yields, one can try to obtain an estimated reaction rate for the disappearance of glycerol by dividing the glycerol conversions of each work by the W/m ratios used and, despite all the limitations of such a simple analysis, obtain a number that allows us to compare the performance of the catalysts in a more objective way than simple conversion values. Thus, if we perform this calculation for the different published catalysts shown in Table 5 and compare them with the results of the catalysts in this work, it can be seen that while the conversion is very low in our catalysts in the liquid phase, and logically increases as the W/m increases, the kinetics of the glycerol disappearance reaction, calculated as mentioned above, is of the same order of magnitude as the catalysts in other works (from 0.169 to 0.399 g gly min−1 g cat−1), and if what we compare is the rate of acetol formation, this is higher for all the catalysts in this work than practically all the catalysts published in other references. The acetol rate, expressed as g glycerol reacted min−1 g cat−1, was calculated by multiplying the glycerol rate by the acetol selectivity. The analysis of these results shows that the behavior of the catalysts in the gas phase notably improves not only the rates but also the selectivity towards the formation of acetol.

3. Materials and Methods

3.1. Materials

The materials employed were Cu(NO3)2·3H2O (Sigma-Aldrich, St. Louis, MO, USA, purity: 99.99%), Al(NO3)3·9H2O (Thermo Scientific, Waltham, MA, USA, purity: >98%), citric acid (Labkem, Dublin, Ireland, purity: 99.7–100.3%), ethylene glycol (Labkem, purity: >99%), ethanol (Panreac AppliChem, Darmstadt, Germany, purity: 96%), milliQ water, NH4OH (Carlo Erba, Cornaredo, Italy, purity: 30%), CTAB (Sigma Aldrich, purity: ≥98%), and citric acid (Labkem, purity: 99.7–100.3%).

3.2. Catalysts Preparation

The CuAl catalysts with a Cu:Al molar ratio of 1:1 were prepared following four different methods: CP, SACP, AC, and PP.
CuAl-AC1 was prepared by AC according to previous reports [47,48,49,50], using citric acid as a combustion agent. This preparation method consists of preparing an aqueous solution containing metallic nitrates (Cu(NO3)2·3H2O and Al(NO3)3·9H2O) and citric acid. The amount of citric acid used was previously determined from the work of Jain et al. [84] using a value of the parameter φ equal to 1. Then, a proportion of 0.24 mol of Cu(NO3)2·3H2O, 0.24 mol Al(NO3)3·9H2O, and 0.33 mol of citric acid in 200 mL of mili-Q water was employed. The solution was heated up to 150 °C until it became a viscous gel. At this point, the gel was heated up to 300 °C until the ignition point was reached. After the ignition point, a solid material was generated.
The CuAl-CP catalyst was prepared via a coprecipitation method employing an NH4OH aqueous solution as a precipitant agent, as described in previous reports [13]. During this preparation 0.5 mol of Cu(NO3)2·3H2O and 0.5 mol Al(NO3)3·9H2O were dissolved in mili-Q water, heated up to 40 °C, and maintained under stirring at this temperature. The precipitant agent was added dropwise until a pH of 6.2 was reached. This pH value was selected to achieve the total incorporation of Cu, as had been studied in previous works [85]. Finally, the precipitate was filtered.
The procedure followed for the synthesis of CuAl-SACP catalyst was similar to that described in CuAl-CP. Previous to the addition of the precipitant, a desired amount of CTAB was added to the mixture. The molar CTAB/metal ratio, 1:4, was selected from the work of Hu et al. [86].
The CuAl-PP catalyst was prepared following the procedure described in several previous works, such as [44,45]. This synthesis started from two different solutions: one was an aqueous solution containing 0.5 mol of Cu(NO3)2·3H2O and 0.5 mol of Al(NO3)3·9H2O, while the other solution was composed of ethanol and a desired amount of citric acid (CA), maintaining a 2:1 CA/metal molar ratio. In a second step, both solutions were mixed and maintained at 60 °C under vigorous stirring for 60 min. After this time under stirring, a desired amount of ethylene glycol (EG) was added to the mixture, setting a 2:3 CA/EG mass ratio, and the mixture was heated up to 100 °C for 12 h until it became a viscous resin.
All prepared materials were dried overnight at 105 °C (except CuAl-AC1, which does not need a drying step), calcined at 650 °C for 3 h, and sieved to a particle size of 160–315 μm.
A descriptive scheme with the key points of each preparation method can be seen in Figure 17.

3.3. Catalysts Characterization
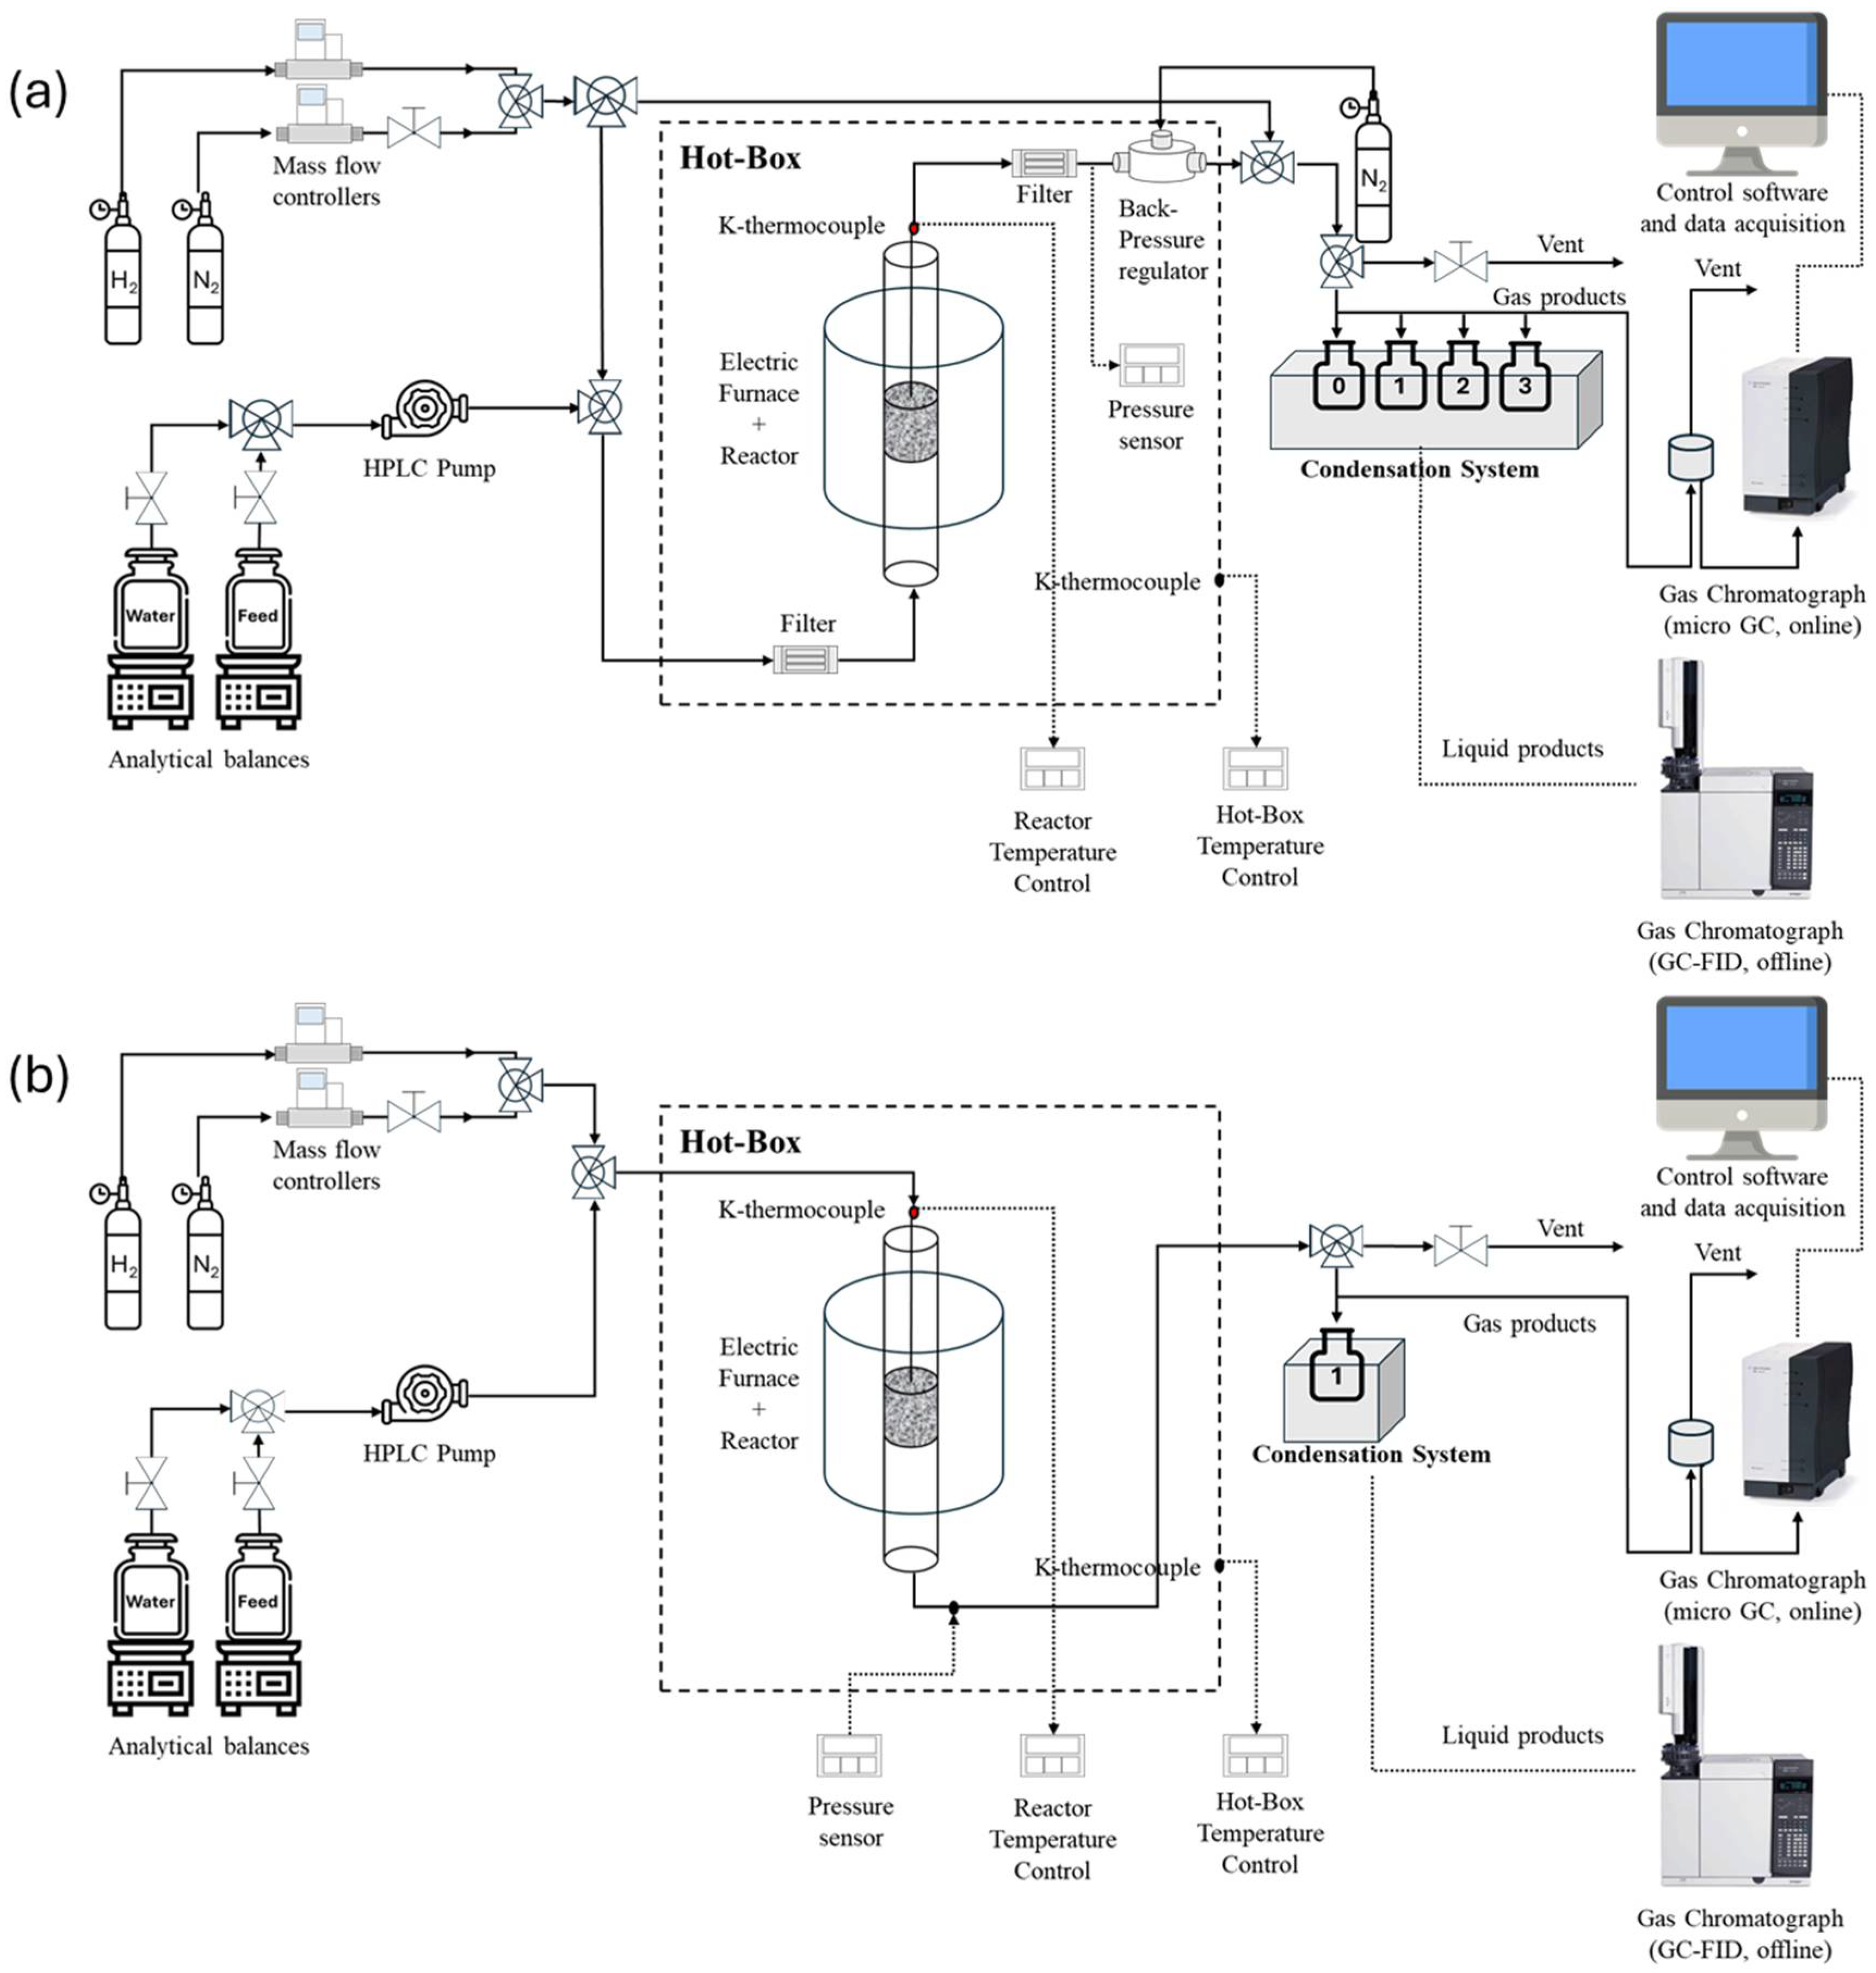
The calcined, reduced, and used catalysts were analyzed by X-ray diffraction (XRD) in a RIGAKU D/max 2500 diffractometer (Tokyo, Japan) which was equipped with a Cu Kα radiation (λ = 0.15418 nm) and a graphite monochromator operated at atmospheric temperature, 40 kV, and 80 mA. Samples were scanned from 5° to 90° (2θ) at a rate of 0.03°/s. Phase identification was conducted employing JCPDS cards.
N2 adsorption–desorption isotherms analyses were conducted in order to study the textural properties of the prepared materials. Analyses were carried out employing a Quantachrome Autosorb iQ3 TPX instrument (Boothwyn, PA, USA). Previous to the analyses, samples were outgassed at 350 °C and 10−3 mmHg for 15 h in order to remove physically adsorbed impurities. The specific surface area (SBET) was determined by the BET method, while the pore size distribution was calculated using the BJH method at the adsorption branch.
H2-TPR profiles were obtained on a Micromeritic Autochem II 2920 instrument (Norcross, GA, USA) equipped with a thermal conductivity detector (TCD). Around 150 mg of each sample was firstly pretreated in an Ar stream at 150 °C for 30 min (heating rate 10 °C/min, total flow 50 mL/min) with the aim of completely eliminating moisture. Then, the catalyst was reduced by passing a 10%H2-Ar 50 mL/min total flow while the temperature was increased up to 950 °C with a heating rate of 10 °C/min.
The metal loadings in each catalyst were determined by inductively coupled plasma optical emission spectrometry (ICP-OES). Previous to the analysis, calcined samples were subjected to microwave digestion employing a mixture of HNO3 and HCl. ICP-OES was also employed to study the metal leaching during the reaction. For this analysis, a representative sample of the product aqueous solution from each experiment was used. With the aim of determining the carbon deposition on the catalysts, the elemental analysis with a LECO CHN 628 instrument (St. Joseph, MI, USA) of the used catalysts was carried out. Samples of around 30 mg were employed in each assessment.
The surface morphology of the catalysts was studied by field emission scanning electron microscopy (FESEM). These measurements were carried out using a Carl Zeiss MERLINTM (Oberkochen, Germany) equipped with secondary and backscattered electron detectors in the chamber and column (in-lens). In addition, it was equipped with an EDS detector (INCA 350 from Oxford Instruments (Bucks, UK) with an energy resolution of 127 eV at 5.9 keV) for qualitative chemical analysis.
In order to study and quantify the transformation of Al2O3 (or non-stoichiometric alumina Al2.667O4) into boehmite, TGA analyses were performed. Weight loss is directly related to boehmite formation [87]. These analyses were carried out using a heating ramp of 5 °C/min under a N2 atmosphere.
X-ray photoelectron spectroscopy (XPS) and X-ray excited Auger electron spectroscopy (XAES) were conducted with the aim of studying the Cu/Al surface ratio, as well as the chemical states of the Cu and Al, respectively. The measurements were done using an ESCAPlus Omicron (Taunusstein, Germany) with a monochromatic Al Kα (1486.7 eV) radiation source. The obtained signals were deconvoluted after Tougaard background subtraction, employing a mixed Gaussian–Lorentzian function. The binding energies (BEs) were calibrated setting C 1s of adventitious carbon as a reference at 284.8 eV. The concentration of the surface elements was determined by adjusting the values with relative atomic sensitivity factors of previous studies [88].

3.4. Catalyst Tests

The selective dehydration of glycerol in the liquid phase was evaluated using a laboratory-scale continuous feeding unit designed and developed by PID (Process Integral Development Eng & Tech, Alcobendas, Spain). The schematic diagram of the pressurized experimental system is shown in Figure 18a. This experimental system has a stainless steel tubular reactor (Autoclave Engineers, Erie, PA, USA) with an inner diameter of 9 mm. The bed, inside the reactor, is placed between quartz wool supports and consists of a mixture of inert sand (with a particle size higher than 315 µm) and catalyst (with a particle size between 315–160 µm). An up-flow liquid feed, consisting of a 10%wt glycerol mixture with deionized water, is fed by means of a high-performance liquid chromatography (HPLC) pump. In order to pressurize the system and control the system’s pressure, an Equilibar LF Series Precision Back Pressure Regulator (Fletcher, NC, USA) was employed.
The outlet stream from the top of the reactor, consisting of a mixture of gas and liquid products, was depressurized by the backpressure regulator and passed to the condensation system, which consisted of a set of four condensers placed in an ice bath. The first one was used to collect the water during the stabilization of the reaction conditions. The next two condensers were used to collect the liquid products obtained during the first and second hour of the experiment (each experiment had a length of two hours). The fourth condenser was used to collect the remaining products.
The gas flow exiting from the condensation system was analyzed with an Agilent 490 Micro GC (Santa Clara, CA, USA) equipped with a molecular sieve column, a Plot U, and Thermal Conductivity Detectors (TCDs), where N2, H2, CH4, CO2, CO, C2H6, and C3H8 were quantified. A N2 gas flow of 75 cm3 (STP)/min was fed by means of a mass flow controller (Hi-Tec Bronkhorst, Ruurlo, The Netherlands) during the reaction after the backpressure regulator, and this was used as an internal standard.
The liquid products collected in the condensation system were analyzed off-line with an Agilent 7820A GC, equipped with a Flame Ionization Detector (FID) and a HP-FFAP Agilent 19091F-105 capillary column, where acetaldehyde, acetone, acrolein, methanol (MeOH), isopropanol, ethanol (EtOH), acetol, acetic acid (AA), 1,2-propanediol (1,2-PDO), ethylene glycol (EG), and unreacted glycerol were quantified. Additionally, 1-butanol was used as internal standard with the aim of reducing the error derived from sample injection variations. The injector and detector temperatures were 275 °C and 300 °C, respectively.
The selective dehydration of glycerol in the gas phase was studied using another laboratory-scale continuous feeding unit designed and developed by PID (Process Integral Development Eng & Tech, Spain). The schematic diagram of the atmospheric experimental system is shown in Figure 18b. This experimental system has a quartz tubular reactor with an inner diameter of 10.0 mm. The reaction bed is placed at a height of 150 mm in the center of the reactor. This bed is composed of 0.6 g of catalysts supported on quartz wool. A 10%wt glycerol aqueous solution was continuously pumped into the reactor with a HPLC pump. Before entering the reactor, the liquid stream was mixed with a gas flow of 40 mL/min of N2, with the aim of using it as an internal standard for the gaseous products and as carrier gas for the liquid mixture. The stream from the lower part of the reactor, composed of a mixture of gas and liquid products, passed through a condensation system where liquid products were collected. This condensation system consisted of a condenser immersed in an ice bath. The outlet gas flow was analyzed on-line employing the same system as described above. The collected liquid products from the two hours experiment were collected in one condenser and analyzed following the same procedure described above.
Catalytic tests in the pressurized system were performed using the same operating conditions, 227 °C and 34 absolute bar, in order to study the effect of the catalyst preparation method. The amounts of catalyst used were 1 and 3 g, which correspond to the catalyst/glycerol mass flow rate (W/m) ratios of 10 and 30 gcatalyst·min·gglycerol−1, respectively. The reaction bed, comprised of catalyst mixed with sand, maintained a constant bed volume of 5.5 cm3. A solution of 10%wt glycerol in mili-Q water with a liquid flow rate of 1 mL/min was used as liquid feed.
Catalytic tests in the atmospheric system were also conducted at 227 °C. These experiments were performed using 0.6 g of catalyst and a liquid flow rate of 0.2 mL/min of a solution of 10wt% glycerol in mili-Q water, which corresponds to a W/m ratio of 30 gcatalyst·min·gglycerol−1. In both systems, each catalyst was tested three times in order to check their repeatability.
Prior to the reaction, each catalyst was reduced. The activation was carried out in situ, using a H2 stream of 100 cm3 (STP)/min during 1 h at temperatures of 300 °C for the CuAl-CP, CuAl-SACP, and CuAl-PP catalysts and 350 °C for the CuAl-AC1 catalyst. The reduction temperatures were selected according to the H2-TPR results. The catalysts were reduced to obtain the active phase, which increases significantly the conversion of glycerol [15].
The catalytic performance was evaluated using the parameters calculated according to Equations (1)–(4).
The carbon yield to gases and carbon yield to liquids were calculated following Equations (1) and (2), respectively:
C a r b o n   y i e l d   t o   g a s ( % ) = n C O 2 + n C O + n C H 4 + 2 · n C 2 H 6 + 3 · n C 3 H 8 3 · n g l y i n × 100 ;
C a r b o n   y i e l d   t o   l i q u i d ( % ) = 2 · n A c e t a l d e h y d e + 3 · n A c e t o n e + 3 · n A c r o l e i n + n M e O H + 3 · n I s o p r o p a n o l + 2 · n E t O H + 3 · n A c e t o l + 2 · n A A + 3 · n 1,2 P D O + 2 · n E G 3 · n g l y i n × 100 ;
where ni refers to the mol of every gaseous or liquid obtained product and n(gly)in refers to the mol of glycerol fed into the reactor.
In this work, we assume that the glycerol conversion, named effective activity (Equation (3)), is the addition of the carbon yield to gas and carbon yield to liquid. We use “effective activity” due to some difficulties during glycerol analysis. These difficulties originated from glycerol polymerization, obstruction, or retention over catalysts’ surfaces, as were also observed in other studies [83].
E f f e c t i v e   a c t i v i t y   ( % ) = C a r b o n   y i e l d   t o   g a s + C a r b o n   y i e l d   t o   l i q u i d ;    
Selectivity to each liquid product is determined by Equation (4):
S e l e c t i v i t y % = n f ( i ) n f ( t o t a l   p r o d u c t s ) × 100
where n(f)i is the total molar amount of carbon detected from a product i, while nf(total products) refers to the total amount of carbon calculated from all the quantified products, both determined by GC-FID.
The carbon recovery in each experiment was calculated as the addition of carbon present in the gas and in liquid products together with the carbon retained in the used catalysts, related to the carbon fed in the glycerol. The carbon in liquid products was determined by a Total Organic Carbon Analyzer (TOC-L, Shimadzu Instrument, Kyoto, Japan), while the retained carbon of the used catalysts was obtained by elemental analysis.

4. Conclusions

CuAl catalysts were prepared by four methods, CP, PP, AC1, and SACP, and tested in the catalytic dehydration of glycerol to acetol. The catalyst preparation method influenced the textural properties, crystalline phases, and reducibility. The catalysts with a combustion stage in the preparation method, the CuAl-AC1 and CuAl-PP catalysts, presented a CuAl2O4 spinel phase in the calcined catalyst and a higher reduction temperature.
The catalytic conversion of glycerol showed higher yields to products and higher selectivity to acetol in the gas phase than in the liquid phase. In the liquid phase with a W/m ratio of 10 g cat min gly−1, the carbon yield to products was less than 5% for all prepared CuAl catalysts. All catalysts used in the liquid phase showed boehmite and Cu2O phases. The catalytic activity could be related to the size of the Cu crystallites and a Cu0/Cu+ ratio on the catalyst surface of around 0.6. The highest carbon selectivity to acetol in the liquid phase was obtained with the CuAl-PP catalyst. Increasing the W/m ratio to 30 g catalyst min g glycerol−1 slightly increased the total yield to products, while the carbon selectivity to acetol decreased.
In the gas phase, the total carbon yield was greater than 40% and the carbon selectivity to acetol was greater than 90%. The catalyst with the best performance in the gas phase was CuAl-SACP, 462.6 mgacetol/gglycerol, which could be due to the low carbon formation and its reducible properties.
As our results indicate, acetol production appears to be more favorable in the gas phase. This suggests that a gas-phase system may be more suitable for the catalytic dehydration of glycerol. However, it is important to consider the significant energy costs associated with water vaporization in this process, which could substantially increase overall production costs. Furthermore, the formation of carbon deposits must be taken into account, as they can deactivate the catalyst and negatively affect the efficiency of the process.
On the other hand, the liquid-phase process offers energy savings by eliminating water vaporization. Nevertheless, it results in lower yields of liquid products and reduced selectivity toward acetol, which may lead to additional costs due to the need for subsequent separation steps.
Therefore, further research is necessary to determine which process configuration (gas or liquid phase) offers the best balance between yield, selectivity, and economic viability for the selective dehydration of glycerol to acetol.

Author Contributions

Conceptualization, F.M.-M. and L.G.; methodology, L.G. and J.R.; validation, F.M.-M.; formal analysis, F.M.-M. and J.R.; investigation, F.M.-M.; writing—original draft preparation, F.M.-M.; writing—review and editing, L.G., J.R., M.O. and J.A.; visualization, F.M.-M.; supervision, L.G., J.R. and J.A.; project administration, L.G.; funding acquisition, L.G., J.R., M.O. and J.A. All authors have read and agreed to the published version of the manuscript.

Funding

Grant PID2020-114985RBI00 funded by MICIU/AEI/10.13039/501100011033. The predoctoral aid granted to Francisco Maldonado Martín PRE2021-100578 funded by MICIU/AEI/10.13039/501100011033 and by ESF+. Funding from the Government of Aragón (Research Group Ref. T22_23R) is also appreciated.

Data Availability Statement

The original contributions presented in this study are included in the article. Further inquiries can be directed to the corresponding author.

Acknowledgments

The authors would like to acknowledge the use of the Servicio General de Apoyo a la Investigación-SAI of the Universidad de Zaragoza.

Conflicts of Interest

The authors declare no conflicts of interest.

References

  1. When Will Fossil Fuels Run out? Available online: https://group.met.com/en/mind-the-fyouture/mindthefyouture/when-will-fossil-fuels-run-out (accessed on 14 December 2023).
  2. Gebremariam, S.; Marchetti, J. Economics of Biodiesel Production: Review. Energy Convers. Manag. 2018, 168, 74–84. [Google Scholar] [CrossRef]
  3. Climent, M.J.; Corma, A.; Iborra, S. Conversion of Biomass Platform Molecules into Fuel Additives and Liquid Hydrocarbon Fuels. Green Chem. 2014, 16, 516–547. [Google Scholar] [CrossRef]
  4. Raso, R.; Abad, E.; García, L.; Ruiz, J.; Oliva, M.; Arauzo, J. Renewable Hydrogen Production by Aqueous Phase Reforming of Pure/Refined Crude Glycerol over Ni/Al-Ca Catalysts. Molecules 2023, 28, 6695. [Google Scholar] [CrossRef] [PubMed]
  5. Faba, L.; Díaz, E.; Ordóñez, S. Aqueous-Phase Furfural-Acetone Aldol Condensation over Basic Mixed Oxides. Appl. Catal. B 2012, 113–114, 201–211. [Google Scholar] [CrossRef]
  6. Hoekman, S.K.; Robbins, C. Review of the Effects of Biodiesel on NOx Emissions. Fuel Process. Technol. 2012, 96, 237–249. [Google Scholar] [CrossRef]
  7. Apostolakou, A.A.; Kookos, I.K.; Marazioti, C.; Angelopoulos, K.C. Techno-Economic Analysis of a Biodiesel Production Process from Vegetable Oils. Fuel Process. Technol. 2009, 90, 1023–1031. [Google Scholar] [CrossRef]
  8. Mulugetta, Y. Evaluating the Economics of Biodiesel in Africa. Renew. Sustain. Energy Rev. 2009, 13, 1592–1598. [Google Scholar] [CrossRef]
  9. Pagliaro, M.; Ciriminna, R.; Kimura, H.; Rossi, M.; Della Pina, C. From Glycerol to Value-Added Products. Angew. Chem.Int. Ed. 2007, 46, 4434–4440. [Google Scholar] [CrossRef]
  10. OECD-FAO. Food and Agriculture Organization of the United Nations; OECD Publication: Paris, France, 2011. [Google Scholar] [CrossRef]
  11. Sabokmalek, S.; Alavi, S.M.; Rezaei, M.; Akbari, E. Fabrication and Catalytic Evaluation of Ni/CaO–Al2O3 in Glycerol Steam Reforming: Effect of Ni Loading. J. Energy Inst. 2023, 109, 101270. [Google Scholar] [CrossRef]
  12. Yuan, Z.; Wang, L.; Wang, J.; Xia, S.; Chen, P.; Hou, Z.; Zheng, X. Hydrogenolysis of Glycerol over Homogenously Dispersed Copper on Solid Base Catalysts. Appl. Catal. B 2011, 101, 431–440. [Google Scholar] [CrossRef]
  13. Raso, R.; García, L.; Ruiz, J.; Oliva, M.; Arauzo, J. Aqueous Phase Hydrogenolysis of Glycerol over Ni/Al-Fe Catalysts Without External Hydrogen Addition. Appl. Catal. B 2021, 283, 119598. [Google Scholar] [CrossRef]
  14. Prather, M.; SSausen, R.; Houghton, J.; Penner, J.; Isaksen, I.; Wang, W.; Dorland, R. Potential Climate Change from Aviation 6; Cambridge University Press: Cambridge, UK, 1999; Volume 1, pp. 231–266. [Google Scholar]
  15. Mane, R.B.; Yamaguchi, A.; Malawadkar, A.; Shirai, M.; Rode, C.V. Active Sites in Modified Copper Catalysts for Selective Liquid Phase Dehydration of Aqueous Glycerol to Acetol. RSC Adv. 2013, 3, 16499–16508. [Google Scholar] [CrossRef]
  16. Corma, A.; Huber, G.W.; Sauvanaud, L.; O’Connor, P. Biomass to Chemicals: Catalytic Conversion of Glycerol/Water Mixtures into Acrolein, Reaction Network. J. Catal. 2008, 257, 163–171. [Google Scholar] [CrossRef]
  17. Sato, S.; Akiyama, M.; Takahashi, R.; Hara, T.; Inui, K.; Yokota, M. Vapor-Phase Reaction of Polyols over Copper Catalysts. Appl. Catal. A Gen. 2008, 347, 186–191. [Google Scholar] [CrossRef]
  18. Sato, S.; Sakai, D.; Sato, F.; Yamada, Y. Vapor-Phase Dehydration of Glycerol into Hydroxyacetone over Silver Catalyst. Chem. Lett. 2012, 41, 965–966. [Google Scholar] [CrossRef]
  19. Dieuzeide, M.L.; Jobbagy, M.; Amadeo, N. Vapor-Phase Hydrogenolysis of Glycerol to 1,2-Propanediol over Cu/Al2O3 Catalyst at Ambient Hydrogen Pressure. Ind. Eng. Chem. Res. 2016, 55, 2527–2533. [Google Scholar] [CrossRef]
  20. Pandhare, N.N.; Pudi, S.M.; Biswas, P.; Sinha, S. Selective Hydrogenolysis of Glycerol to 1,2-Propanediol over Highly Active and Stable Cu/MgO Catalyst in the Vapor Phase. Org. Process. Res. Dev. 2016, 20, 1059–1067. [Google Scholar] [CrossRef]
  21. Pandhare, N.N.; Pudi, S.M.; Biswas, P.; Sinha, S. Vapor Phase Hydrogenolysis of Glycerol to 1,2-Propanediol over γ-Al2O3 Supported Copper or Nickel Monometallic and Copper-Nickel Bimetallic Catalysts. J. Taiwan Inst. Chem. Eng. 2016, 61, 90–96. [Google Scholar] [CrossRef]
  22. Yin, A.Y.; Guo, X.Y.; Dai, W.L.; Fan, K.N. The Synthesis of Propylene Glycol and Ethylene Glycol from Glycerol Using Raney Ni as a Versatile Catalyst. Green Chem. 2009, 11, 1514–1516. [Google Scholar] [CrossRef]
  23. Nakagawa, Y.; Tomishige, K. Heterogeneous Catalysis of the Glycerol Hydrogenolysis. Catal. Sci. Technol. 2011, 1, 179–190. [Google Scholar] [CrossRef]
  24. Lete, A.; Raso, R.; García, L.; Ruiz, J.; Arauzo, J. Synthesis of Ketones from Glycerol and 1,2-Propanediol Using Copper and Nickel Catalysts: Unraveling the Impact of Reaction Phase and Active Metal. Fuel 2024, 371, 132001. [Google Scholar] [CrossRef]
  25. Farias, M.F.; Domingos, Y.S.; Turolla Fernandes, G.J.; Castro, F.L.; Fernandes, V.J.; Fonseca Costa, M.J.; Araujo, A.S. Effect of Acidity in the Removal-Degradation of Benzene in Water Catalyzed by Co-MCM-41 in Medium Containing Hydrogen Peroxide. Microporous Mesoporous Mater. 2018, 258, 33–40. [Google Scholar] [CrossRef]
  26. Wen, G.; Xu, Y.; Ma, H.; Xu, Z.; Tian, Z. Production of Hydrogen by Aqueous-Phase Reforming of Glycerol. Int. J. Hydrogen Energy 2008, 33, 6657–6666. [Google Scholar] [CrossRef]
  27. Xiao, Z.; Wang, X.; Xiu, J.; Wang, Y.; Williams, C.T.; Liang, C. Synergetic Effect between Cu 0 and Cu + in the Cu-Cr Catalysts for Hydrogenolysis of Glycerol. Catal. Today 2014, 234, 200–207. [Google Scholar] [CrossRef]
  28. Lopez-Pedrajas, S.; Estevez, R.; Blanco-Bonilla, F.; Luna, D.; Bautista, F.M. Insight into the Gas-Phase Glycerol Dehydration on Transition Metal Modified Aluminium Phosphates and Zeolites. J. Chem. Technol. Biotechnol. 2017, 92, 2661–2672. [Google Scholar] [CrossRef]
  29. Gharibi Kharaji, A.; Beheshti, M.; Repke, J.U.; Tangestani-nejad, S.; Görke, O.; Godini, H.R. Using Response Surface Method to Analyze the Effect of Hydrothermal Post-Treatment on the Performance of Extrudates HZSM-5 Catalyst in the Methanol to Propylene Reaction. React. Kinet. Mech. Catal. 2019, 127, 375–390. [Google Scholar] [CrossRef]
  30. Zhou, M.; Zhang, L.; Lu, H.; Shao, L.; Chen, M. Reaction of Silicon Dioxide with Water: A Matrix Isolation Infrared and Density Functional Theoretical Study. J. Mol. Struct. 2002, 605, 249–254. [Google Scholar] [CrossRef]
  31. Wolosiak-Hnat, A.; Milchert, E.; Grzmil, B. Influence of Parameters on Glycerol Hydrogenolysis over a Cu/Al2O3 Catalyst. Chem. Eng. Technol. 2013, 36, 411–418. [Google Scholar] [CrossRef]
  32. Zhou, J.; Guo, L.; Guo, X.; Mao, J.; Zhang, S. Selective Hydrogenolysis of Glycerol to Propanediols on Supported Cu-Containing Bimetallic Catalysts. Green Chem. 2010, 12, 1835–1843. [Google Scholar] [CrossRef]
  33. Suprun, W.; Lutecki, M.; Haber, T.; Papp, H. Acidic Catalysts for the Dehydration of Glycerol: Activity and Deactivation. J. Mol. Catal. A Chem. 2009, 309, 71–78. [Google Scholar] [CrossRef]
  34. Kang, S.H.; Bae, J.W.; Sai Prasad, P.S.; Park, S.J.; Woo, K.J.; Jun, K.W. Effect of Preparation Method of Fe-Based Fischer-Tropsch Catalyst on Their Light Olefin Production. Catal. Lett. 2009, 130, 630–636. [Google Scholar] [CrossRef]
  35. Santos, R.C.R.d.; da Silva Júnior, M.J.; Nunes, G.L.; Valentini, A. Effect of Cu and Sb Active Sites on the Acid-Base Properties and Reactivity of Hydrated Alumina for Glycerol Conversion by Dehydrogenation and Dehydration Reactions. Catal. Sci. Technol. 2023, 13, 4223–4245. [Google Scholar] [CrossRef]
  36. Liu, Y.; Guo, X.; Rempel, G.L.; Ng, F.T.T. The Promoting Effect of Ni on Glycerol Hydrogenolysis to 1,2-Propanediol with in Situ Hydrogen from Methanol Steam Reforming Using a Cu/Zno/Al2O3 Catalyst. Catalysts 2019, 9, 412. [Google Scholar] [CrossRef]
  37. Basąg, S.; Piwowarska, Z.; Kowalczyk, A.; Węgrzyn, A.; Baran, R.; Gil, B.; Michalik, M.; Chmielarz, L. Cu-Mg-Al Hydrotalcite-like Materials as Precursors of Effective Catalysts for Selective Oxidation of Ammonia to Dinitrogen—The Influence of Mg/Al Ratio and Calcination Temperature. Appl. Clay Sci. 2016, 129, 122–130. [Google Scholar] [CrossRef]
  38. Chiu, C.W.; Dasari, M.A.; Suppes, G.J.; Sutterlin, W.R. Dehydration of Glycerol to Acetol via Catalytic Reactive Distillation. AIChE J. 2006, 52, 3543–3548. [Google Scholar] [CrossRef]
  39. Chu, Z.; Chen, H.; Yu, Y.; Wang, Q.; Fang, D. Surfactant-Assisted Preparation of Cu/ZnO/Al2O3 Catalyst for Methanol Synthesis from Syngas. J. Mol. Catal. A Chem. 2013, 366, 48–53. [Google Scholar] [CrossRef]
  40. Alvar, E.N.; Rezaei, M.; Alvar, H.N. Synthesis of Mesoporous Nanocrystalline MgAl2O4 Spinel via Surfactant Assisted Precipitation Route. Powder Technol. 2010, 198, 275–278. [Google Scholar] [CrossRef]
  41. Das, D.; Llorca, J.; Dominguez, M.; Colussi, S.; Trovarelli, A.; Gayen, A. Methanol Steam Reforming Behavior of Copper Impregnated over CeO2–ZrO2 Derived from a Surfactant Assisted Coprecipitation Route. Int. J. Hydrogen Energy 2015, 40, 10463–10479. [Google Scholar] [CrossRef]
  42. Kang, H.T.; Zhang, C.Y.; Lv, K.; Yuan, S.L. Surfactant-Assisted Synthesis and Catalytic Activity for SOx Abatement of High-Surface-Area CuMgAlCe Mixed Oxides. Ceram. Int. 2014, 40, 5357–5363. [Google Scholar] [CrossRef]
  43. Charisiou, N.D.; Italiano, C.; Pino, L.; Sebastian, V.; Vita, A.; Goula, M.A. Hydrogen Production via Steam Reforming of Glycerol over Rh/γ-Al2O3 Catalysts Modified with CeO2, MgO or La2O3. Renew. Energy 2020, 162, 908–925. [Google Scholar] [CrossRef]
  44. Braga, T.P.; Essayem, N.; Valentini, A. Correlation Between the Basicity of Cu–MxOy–Al2O3 (M = Ba, Mg, K or La) Oxide and the Catalytic Performance in the Glycerol Conversion from Adsorption Microcalorimetry Characterization. J. Therm. Anal. Calorim. 2017, 129, 65–74. [Google Scholar] [CrossRef]
  45. Dang, H.T.; Le, T.K. Precursor Chain Length Dependence of Polymeric Precursor Method for the Preparation of Magnetic Fenton-like CuFe2O4-Based Catalysts. J. Solgel. Sci. Technol. 2016, 80, 160–167. [Google Scholar] [CrossRef]
  46. Braga, T.P.; Essayem, N.; Prakash, S.; Valentini, A. Gas-Phase Conversion of Glycerol to Acetol: Influence of Support Acidity on the Catalytic Stability and Copper Surface Properties on the Activity. J. Braz. Chem. Soc. 2016, 27, 2361–2371. [Google Scholar] [CrossRef]
  47. Qi, X.; Zhou, J.; Yue, Z.; Gui, Z.; Li, L. Auto-Combustion Synthesis of Nanocrystalline LaFeO3. Mater. Chem. Phys. 2002, 78, 25–29. [Google Scholar]
  48. Kumar, M.; Srikanth, S.; Ravikumar, B.; Lex, T.; Das, S. Synthesis of Pure and Sr-Doped LaGaO3, LaFeO3 and LaCoO3 and Sr,Mg-Doped LaGaO3 for ITSOFC Application Using Different Wet Chemical Routes. Mater. Chem. Phys. 2009, 113, 803–815. [Google Scholar] [CrossRef]
  49. Kondakindi, R.R.; Karan, K.; Peppley, B.A. A Simple and Efficient Preparation of LaFeO3 Nanopowders by Glycine-Nitrate Process: Effect of Glycine Concentration. Ceram. Int. 2012, 38, 449–456. [Google Scholar] [CrossRef]
  50. Velasquez, M.; Santamaria, A.; Batiot-Dupeyrat, C. Selective Conversion of Glycerol to Hydroxyacetone in Gas Phase over La2CuO4 Catalyst. Appl. Catal. B 2014, 160, 606–613. [Google Scholar] [CrossRef]
  51. Beck, M.T.; Nagypál, I. Chemistry of Complex Equilibria. Ellis Horwood Ser. Inorg. Chem. 1990, 95, 647–648. [Google Scholar]
  52. Diachenko, O.; Kováč, J.; Dobrozhan, O.; Novák, P.; Kováč, J.; Skriniarova, J.; Opanasyuk, A. Structural and Optical Properties of Cuo Thin Films Synthesized Using Spray Pyrolysis Method. Coatings 2021, 11, 1392. [Google Scholar] [CrossRef]
  53. Rajesh Ch, L.; Rao, N.M. A Solid-State Reaction Based Study, Synthesis and Characterization for CuAl2O4 Nanocrystalline Powder. Optik 2023, 294, 171472. [Google Scholar] [CrossRef]
  54. Solache-Carranco, H.; Juárez-Díaz, G.; Martínez-Juárez, J.; Peña-Sierra, R. Estudio de La Cristalización de Cu2O y Su Caracterización Por Difracción de Rayos X, Espectroscópica Raman y Fotoluminiscencia. Rev. Mex. Física 2009, 55, 393–398. [Google Scholar]
  55. Jiménez, J.A.; Padilla, I.; Lõpez-Delgado, A.; Fillali, L.; Lõpez-Andrés, S. Characterization of the Aluminas Formed during the Thermal Decomposition of Boehmite by the Rietveld Refinement Method. Int. J. Appl. Ceram. Technol. 2015, 12, E178–E186. [Google Scholar] [CrossRef]
  56. Mane, R.B.; Kondawar, S.E.; Niphadkar, P.S.; Joshi, P.N.; Patil, K.R.; Rode, C. V Effect of Preparation Parameters of Cu Catalysts on Their Physico-Chemical Properties and Activities for Glycerol Hydrogenolysis. Catal. Today 2012, 198, 321–329. [Google Scholar] [CrossRef]
  57. Vasiliadou, E.S.; Lemonidou, A.A. Investigating the Performance and Deactivation Behaviour of Silica-Supported Copper Catalysts in Glycerol Hydrogenolysis. Appl. Catal. A Gen. 2011, 396, 177–185. [Google Scholar] [CrossRef]
  58. Rao, R.; Dandekar, A.; Baker, R.T.K.; Vannice, M.A. Properties of Copper Chromite Catalysts in Hydrogenation Reactions. J. Catal. 1997, 171, 406–419. [Google Scholar] [CrossRef]
  59. Khasin, A.A.; Yur’Eva, T.M.; Plyasova, L.M.; Kustova, G.N.; Jobic, H.; Ivanov, A.; Chesalov, Y.A.; Zaikovskii, V.I.; Khasin, A.V.; Davydova, L.P.; et al. Mechanistic Features of Reduction of Copper Chromite and State of Absorbed Hydrogen in the Structure of Reduced Copper Chromite. Russ. J. Gen. Chem. 2008, 78, 2203–2213. [Google Scholar] [CrossRef]
  60. El Doukkali, M.; Iriondo, A.; Cambra, J.F.; Gandarias, I.; Jalowiecki-Duhamel, L.; Dumeignil, F.; Arias, P.L. Deactivation Study of the Pt and/or Ni-Based γ-Al2O3 Catalysts Used in the Aqueous Phase Reforming of Glycerol for H2 Production. Appl. Catal. A Gen. 2014, 472, 80–91. [Google Scholar] [CrossRef]
  61. Zhu, S.; Gao, X.; Zhu, Y.; Zhu, Y.; Zheng, H.; Li, Y. Promoting Effect of Boron Oxide on Cu/SiO2 Catalyst for Glycerol Hydrogenolysis to 1,2-Propanediol. J. Catal. 2013, 303, 70–79. [Google Scholar] [CrossRef]
  62. Shi, L.; Yan, P.; Gao, Z.; Huang, W. Effect of Copper Source on the Structure–Activity of CuAl2O4 Spinel Catalysts for CO Hydrogenation. Arab. J. Chem. 2023, 16, 104464. [Google Scholar] [CrossRef]
  63. Huang, Z.; Cui, F.; Kang, H.; Chen, J.; Xia, C. Characterization and Catalytic Properties of the CuO/SiO2 Catalysts Prepared by Precipitation-Gel Method in the Hydrogenolysis of Glycerol to 1,2-Propanediol: Effect of Residual Sodium. Appl. Catal. A Gen. 2009, 366, 288–298. [Google Scholar] [CrossRef]
  64. Guo, X.; Mao, D.; Lu, G.; Wang, S.; Wu, G. The Influence of La Doping on the Catalytic Behavior of Cu/ZrO2 for Methanol Synthesis from CO2 Hydrogenation. J. Mol. Catal. A Chem. 2011, 345, 60–68. [Google Scholar] [CrossRef]
  65. Águila, G.; Gracia, F.; Araya, P. CuO and CeO2 Catalysts Supported on Al2O3, ZrO2, and SiO2 in the Oxidation of CO at Low Temperature. Appl. Catal. A Gen. 2008, 343, 16–24. [Google Scholar] [CrossRef]
  66. Barbosa, F.F.; Pergher, S.B.C.; Braga, T.P. Synergistic Effects on Cu, Zn and Al-Based Catalyst: Tracking the Change of Active Sites during Glycerol Dehydration. Braz. J. Chem. Eng. 2024, 13, 1–21. [Google Scholar] [CrossRef]
  67. He, M.; Luo, M.; Fang, P. Characterization of CuO Species and Thermal Solid-Solid Interaction in CuO/CeO2-Al2O3 Catalyst by In-Situ XRD, Raman Spectroscopy and TPR. J. Rare Earths 2006, 24, 188–192. [Google Scholar] [CrossRef]
  68. Filho, R.W.N.D.; De Araujo Rocha, G.; Montes, C.R.; Vieira-Coelho, A.C. Synthesis and Characterization of Boehmites Obtained from Gibbsite in Presence of Different Environments. Mater. Res. 2016, 19, 659–668. [Google Scholar] [CrossRef]
  69. Wang, Z.; Tian, Y.; Fan, H.; Gong, J.; Yang, S.; Ma, J.; Xu, J. Facile Seed-Assisted Hydrothermal Fabrication of γ-AlOOH Nanoflake Films with Superhydrophobicity. New J. Chem. 2014, 38, 1321–1327. [Google Scholar] [CrossRef]
  70. Fang, W.; Liu, S.; Steffensen, A.K.; Schill, L.; Kastlunger, G.; Riisager, A. On the Role of Cu+ and CuNi Alloy Phases in Mesoporous CuNi Catalyst for Furfural Hydrogenation. ACS Catal. 2023, 13, 8437–8444. [Google Scholar] [CrossRef]
  71. Gao, Y.; Yi, W.; Yang, J.; Jiang, K.; Yang, T.; Li, Z.; Zhang, M.; Liu, Z.; Wu, B. Effect of Calcination Atmosphere on the Performance of Cu/Al2O3 Catalyst for the Selective Hydrogenation of Furfural to Furfuryl Alcohol. Molecules 2024, 29, 2753. [Google Scholar] [CrossRef]
  72. Yano, T.; Ebizuka, M.; Shibata, S.; Yamane, M. Anomalous Chemical Shifts of Cu 2p and Cu LMM Auger Spectra of Silicate Glasses. J. Electron Spectrosc. Relat. Phenom. 2003, 131–132, 133–144. [Google Scholar] [CrossRef]
  73. Gomes, E.A.; Antunes, R.A.; Mazzer, E.M.; Lins, V. de F.C. High-Temperature Oxidation of Cu–Al–Ni–Mn Shape-Memory Alloy. Mater. Corros. 2024, 75, 1429–1437. [Google Scholar] [CrossRef]
  74. Yao, Y.; Goodman, D.W. Direct Evidence of Hydrogen Spillover from Ni to Cu on Ni–Cu Bimetallic Catalysts. J. Mol. Catal. A Chem. 2014, 383–384, 239–242. [Google Scholar] [CrossRef]
  75. Wang, Y.; Zhou, J.; Guo, X. Catalytic Hydrogenolysis of Glycerol to Propanediols: A Review. RSC Adv. 2015, 5, 74611–74628. [Google Scholar] [CrossRef]
  76. Yfanti, V.L.; Lemonidou, A.A. Mechanistic Study of Liquid Phase Glycerol Hydrodeoxygenation with In-Situ Generated Hydrogen. J. Catal. 2018, 368, 98–111. [Google Scholar] [CrossRef]
  77. Yfanti, V.L.; Ipsakis, D.; Lemonidou, A.A. Kinetic Study of Liquid Phase Glycerol Hydrodeoxygenation Under Inert Conditions over a Cu-Based Catalyst. React. Chem. Eng. 2018, 3, 559–571. [Google Scholar] [CrossRef]
  78. Freitas, I.C.; Manfro, R.L.; Souza, M.M.V.M. Hydrogenolysis of Glycerol to Propylene Glycol in Continuous System Without Hydrogen Addition over Cu-Ni Catalysts. Appl. Catal. B 2018, 220, 31–41. [Google Scholar] [CrossRef]
  79. Mane, R.B.; Rode, C.V. Simultaneous Glycerol Dehydration and In Situ Hydrogenolysis over Cu-Al Oxide Under an Inert Atmosphere. Green Chem. 2012, 14, 2780–2789. [Google Scholar] [CrossRef]
  80. Cai, F.; Pan, D.; Ibrahim, J.J.; Zhang, J.; Xiao, G. Hydrogenolysis of Glycerol over Supported Bimetallic Ni/Cu Catalysts with and Without External Hydrogen Addition in a Fixed-Bed Flow Reactor. Appl. Catal. A Gen. 2018, 564, 172–182. [Google Scholar] [CrossRef]
  81. Mendonça, V.G.S.; Freitas, I.C.; Manfro, R.L.; Souza, M.M.V.M. Effect of MgO Addition to Cu-Ni/Al2O3 Catalysts on Glycerol Hydrogenolysis in Continuous Reactor Without External Hydrogen. Appl. Catal. A Gen. 2022, 645, 118838. [Google Scholar] [CrossRef]
  82. Mane, R.B.; Rode, C. V Continuous Dehydration and Hydrogenolysis of Glycerol over Non-Chromium Copper Catalyst: Laboratory-Scale Process Studies. Org. Process. Res. Dev. 2012, 16, 1043–1052. [Google Scholar] [CrossRef]
  83. Mazarío, J.; Concepción, P.; Ventura, M.; Domine, M.E. Continuous Catalytic Process for the Selective Dehydration of Glycerol over Cu-Based Mixed Oxide. J. Catal. 2020, 385, 160–175. [Google Scholar] [CrossRef]
  84. Jain, S.R.; Adiga, K.C.; Pal Verneker, V.R. A New Approach to Thermochemical Calculations of Condensed Fuel-Oxidizer Mixtures. Comb Ustion Flame 1981, 40, 71–79. [Google Scholar] [CrossRef]
  85. Jiménez Correa, M.M.; Aliprandini, P.; Soares Tenório, J.A.; Crocce, D.; Espinosa, R. Precipitation of Metals from Liquor Obtained in Nickel Mining. In Towards Materials Resource Sustainability; Springer International Publishing: Berlin/Heidelberg, Germany, 2016; pp. 333–338. ISBN 9783319487687. [Google Scholar]
  86. Hu, W.; Li, W.; Shen, R. Cetyltrimethylammonium Bromide-Promoted, ZnO-Supported, and Mn-Promoted Cu–Fe Catalyst for the Hydrogenation of CO to Low-Carbon Alcohols. Energy Technol. 2017, 5, 557–567. [Google Scholar] [CrossRef]
  87. Mirzaee, M.; Amini, M.M.; Sadeghi, M.; Mousavi, F.Y.; Sharbatdaran, M. Preparation and Characterization of Boehmite, CuO, TiO2 and Nb2O5 by Hydrothermal Assisted Sol-Gel Processing of Metal Alkoxides. J. Solgel. Sci. Technol. 2004, 31, 19–23. [Google Scholar] [CrossRef]
  88. Wagner, C.D.; Davis, L.E.; Zeller, M.V.; Taylor, J.A.; Raymond, R.H.; Gale, L.H. Empirical Atomic Sensitivity Factors for Quantitative Analysis by Electron Spectroscopy for Chemical Analysis. Surf. Interface Anal. 1981, 3, 211–225. [Google Scholar] [CrossRef]
Figure 1. N2 adsorption–desorption isotherms (a). Pore size distribution of adsorption branch (b) of the calcined CuAl catalysts. Calcination temperature: 650 °C.
Catalysts 15 00348 g001
Figure 2. N2 adsorption–desorption isotherms of used CuAl catalyst (a) in liquid phase and (b) in gas phase. Liquid-phase reaction conditions: 227 °C, 34 bar, 10 wt% glycerol, and 10 g cat min/g gly. Gas-phase reaction conditions: 227 °C, 1 bar, 10 wt% glycerol, and 30 g cat min/g gly.
Catalysts 15 00348 g002
Figure 3. XRD patterns of CuAl catalysts, calcined (a) and reduced (b).
Catalysts 15 00348 g003
Figure 4. XRD patterns of used CuAl catalysts in the liquid phase (a) and in the gas phase (b). Liquid-phase reaction conditions: 227 °C, 34 bar, 10 wt% glycerol, and 10 g cat min/g gly. Gas-phase reaction conditions: 227 °C, 1 bar, 10 wt% glycerol, 30 g cat min/g gly.
Catalysts 15 00348 g004
Figure 5. XRD patterns of different stages of CuAl-PP catalyst: calcined, reduced, stabilized in liquid H2O, and used in liquid-phase reaction. Liquid-phase reaction conditions: 227 °C, 34 bar, 10 wt% glycerol, and 10 g cat min/g gly.
Catalysts 15 00348 g005
Figure 6. H2-TPR profiles of calcined CuAl catalysts.
Catalysts 15 00348 g006
Figure 7. FESEM images of the calcined catalysts: CuAl-PP (a), CuAl-SACP (b), CuAl-CP (c), and CuAl-AC1 (d). Calcination temperature: 650 °C.
Catalysts 15 00348 g007
Figure 8. FESEM images of used catalysts in liquid phase: CuAl-PP (a), CuAl-SACP (b), CuAl-CP (c), and CuAl-AC1 (d). Liquid-phase reaction conditions: 227 °C, 34 bar, 10 wt% glycerol, and 10 g cat min/g gly.
Catalysts 15 00348 g008
Figure 9. Mass percentage of Cu and Al leaching of the used catalysts in liquid phase. Liquid-phase reaction conditions: 227 °C, 34 bar, 10 wt% glycerol, and 10 g cat min/g gly.
Catalysts 15 00348 g009
Figure 10. TGA/DTG curves of the used CuAl catalysts in liquid phase: CuAl-AC1 (a), CuAl-CP (b), CuAl-SACP (c), and CuAl-PP (d). Liquid-phase reaction conditions: 227 °C, 34 bar, 10 wt% glycerol, and 10 g cat min/g gly.
Catalysts 15 00348 g010
Figure 11. X-ray photoelectric high-resolution spectra for the catalysts used in liquid phase: (a) Cu 2p; (b) Al 2p; (c) Cu LMM. Liquid-phase reaction conditions: 227 °C, 34 bar, 10 wt% glycerol, and 10 g cat min/g gly.
Catalysts 15 00348 g011
Figure 12. Catalytic performance of CuAl catalysts in the liquid phase. Carbon yield to products (a). Carbon selectivity to liquid products (b). Conditions: 227 °C, 34 bar, 10 wt% glycerol, and g cat min gly−1.
Catalysts 15 00348 g012
Figure 13. Correlation between surface Cu0/Cu+ ratio (a) or surface Cu/Al ratio (b) and carbon yield to products.
Catalysts 15 00348 g013
Figure 14. Reaction pathways of production of acetol, 1,2-PDO, and EG from glycerol.
Catalysts 15 00348 g014
Figure 15. Catalytic performance of CuAl-CP and CuAl-PP catalysts in the liquid phase. Carbon yield to products (a). Carbon selectivity to liquid products (b). Conditions: 227 °C, 34 bar, 10 wt% glycerol, 30 g cat min gly−1.
Catalysts 15 00348 g015
Figure 16. Catalytic performance of CuAl catalysts in the gas phase. Carbon yield to products (a). Carbon selectivity to liquid products (b). Conditions: 227 °C, 1 bar, 10 wt% glycerol, and 30 g cat min gly−1.
Catalysts 15 00348 g016
Figure 17. Scheme of the different preparation methods: auto-combustion (a), polymeric precursor (b), coprecipitation (c), and surfactant-assisted coprecipitation (d).
Catalysts 15 00348 g017
Figure 18. Schematic diagram of the pressurized (liquid phase) experimental system (a) and the atmospheric (gas phase) experimental system (b).
Catalysts 15 00348 g018
Table 1. Metal content, textural properties, and crystallite sizes of calcined/reduced CuAl catalysts.
CatalystComposition a (%)SBET b (m2/g)Vp c (cm3/g)dp c (nm)XRD D d (nm)
CuAl-AC150.543/310.06/0.093.2/9.921.0/21.6/27.7
CuAl-PP52.263/1000.17/0.244.7/6.228.4/23.1/35.4
CuAl-CP47.4144/1530.32/0.398.0/8.014.9/-/22.3
CuAl-SACP48.269/780.24/0.273.7/3.324.7/-/32.8
a Calculated as Cu/(Cu + Al) (mol/mol). b BET method. c BJH adsorption branch. d CuO/CuAl2O4/Cu0 crystal size calculated from Scherrer’s equation of calcined and reduced (Cu0) catalysts.
Table 2. Textural properties, crystallite sizes, and carbon content of CuAl catalysts used in liquid/gas phase.
CatalystSBET a (m2/g)Vp b (cm3/g)dp (nm)XRD D c (nm)Carbon
Content (Gas Phase) d
CuAl-AC151/450.13/0.113.2/6.038.8/31.215.46
CuAl-PP37/870.10/0.203.5/7.431.3/36.227.17
CuAl-CP53/1410.15/0.333.7/8.924.7/25.831.75
CuAl-SACP65/690.23/0.283.1/5.020.0/33.615.54
a BET method. b BJH adsorption branch. c Cu2O/Cu0 crystallite size calculated from Scherrer’s equation of the used samples in liquid/gas phase. d Calculated as mg C/(gcat·gReacted glycerol).
Table 3. H2-TPR results of the calcined CuAl catalysts.
Temperature (°C)/Relative Amount (%) a
CatalystT1/F1T2/F2T3/F3
CuAl-CP231/75.8257/24.2-
CuAl-SACP235/41.8252/58.2-
CuAl-AC1185/11.9228/76.0355/12.1
CuAl-PP228/77.5250/20.5359/2.0
a Calculated from Gaussian deconvolution from H2-TPR profiles.
Table 4. XPS surface analysis of the used catalysts in liquid phase.
Used Catalysts Cu0 (%) aCu+ (%) aCu2+ (%) aCu/Al Ratio b
CuAl-SACP42.428.029.50.15
CuAl-PP23.846.130.21.18
CuAl-AC112.621.965.50.13
CuAl-CP24.336.539.20.11
a Data obtained from Cu LMM analysis. b Data obtained from Cu 2p and Al 2p analysis.
Table 5. Comparison of glycerol and acetol rates with other works in the literature.
CatalystsOperating Conditions (T, P, W/mglycerol)Glycerol Conversion (%)Acetol
Yield (%)
Glycerol Rate
(g gly min−1 g cat−1)
Acetol Rate
(g gly min−1 g cat−1)
Ref.
20%CuNi/Al2O3250 °C, 40 bar, g cat min gly−180.012.00.2620.039[78]
20%Cu/Al2O350.04.50.1640.015[78]
Cu/CuAl2O4 a220 °C, 20 bar, 138.9–416.7 g cat min gly−190.019.80.2160.048[79]
Cu/CuAl2O4 a230 °C, 20 bar, 138.9–416.7 g cat min gly−191.019.10.2180.046[79]
Ni/Cu/ Al2O3230 °C, 35 bar, 259.2 g cat min gly−125.74.40.0990.017[80]
Ni/Cu/ Al2O3 b77.910.70.3010.041[80]
Ni-Cu/Al2O3250 °C, 40 bar, 304.9 g cat min gly−190.010.00.2950.033[81]
CuNi10/MgO-Al2O365.023.50.2130.077[81]
CuNi20/MgO-Al2O360.023.50.1970.077[81]
CuNi30/MgO-Al2O375.025.00.2460.082[81]
Cu:Al-1 (50:50)220 °C, 20 bar, 170.7 g cat min gly−191.047.30.5330.277[82]
CuO/Al2O3 a,c240 °C, 1 bar, 150 g cat min gly−178.035.00.5200.182[83]
Cu-Mg/Al-1 a,c61.553.00.4100.217[83]
Cu-Mg/Al-2 a,c58.046.50.3870.180[83]
Cu-Mg/Al-3 a,c68.046.80.4530.212[83]
Cu-Mg/Al-4 a,c68.055.00.4530.249[83]
Cu-Mg/Al-5 a,c64.046.00.4270.196[83]
Cu-Mg/Al-6 a,c62.532.00.4170.133[83]
CuAl-AC1227 °C, 34 bar, 10 g cat min gly−14.02.00.3960.205TW
CuAl-PP2.21.40.2200.138TW
CuAl-CP4.02.00.3990.199TW
CuAl-SACP2.51.30.2470.128TW
CuAl-PP227 °C, 34 bar, 30 g cat min gly−15.12.80.1690.095TW
CuAl-CP7.92.90.2620.096TW
CuAl-AC1 a227 °C, 1 bar, 30 g cat min gly−149.747.91.6561.598TW
CuAl-PP a42.438.41.4131.279TW
CuAl-CP a46.943.61.5631.453TW
CuAl-SACP a60.058.12.0011.938TW
TW: this work a Gas phase, b 2-propanol as feed solvent, c Methanol as feed solvent. “ same value as the previous one.
Disclaimer/Publisher’s Note: The statements, opinions and data contained in all publications are solely those of the individual author(s) and contributor(s) and not of MDPI and/or the editor(s). MDPI and/or the editor(s) disclaim responsibility for any injury to people or property resulting from any ideas, methods, instructions or products referred to in the content.

