Abstract
Well-defined supported metal nanoparticle catalysts, with high uniformity in particle sizes of the dispersed metal, are crucial for studying their catalyzed reactions that exhibit structure sensitivity. For such catalysts, conventional methods of preparation may prove unsuitable in controlling the nanoparticle size and distribution. In this work, the systematic growth of supported Pd and Pt particles was achieved through the method of electroless deposition (ED), in which additional metal was deposited on preexisting particles of the same metal. The ED process was investigated by varying the pump time, pump speed, and molar ratios of the reagents during the continuous addition of the metal precursor, as well as the reducing agent and stabilizer, which were hydrazine and ethylenediamine, respectively. This allowed for the precise control of deposition rates, thus regulating the supported metal particle size, size distribution, and particle density. A slower deposition rate was achieved by increasing the amount of the ethylenediamine stabilizer and lowering the pumping speed. Slower rates of deposition resulted in smaller particle sizes and tighter size distributions compared to other preparations with the same metal weight loading, as characterized via X-ray diffraction (XRD), chemisorption, and scanning-transmission electron microscopy (STEM) methods.
1. Introduction
The particle size and distribution of particle size are vital for understanding and improving the performance of supported metal catalysts. This is especially significant for structure-sensitive reactions. Boudart was the first to classify heterogeneously catalyzed reactions into structure-sensitive and structure-insensitive reactions in the 1960s. For a structure-insensitive reaction, the turnover per active site is independent of the particle size, whereas, for a structure-sensitive reaction, the turnover per active site changes as a function of the particle size [1]. Structure sensitivity may be explained by both the metal dispersion and the different types of surface atoms varying with changes in the crystallite size. The fraction of corner and edge atoms decreases, while the fraction of atoms on (100) and (111) faces increases, with increasing particle sizes [2]. The distribution of facets as a function of size might substantially affect activities because different exposed facets can participate in reactions differently. Sinfelt found that the catalytic activity of ethane hydrogenolysis with nickel and rhodium decreases as the metal size increases [3]. Lear et al. [4] found that in the Pd hydrogenation of crotonaldehyde to butanol, the crotonaldehyde-to-butanal hydrogenation activity is structure-insensitive, while the se-butanal-to-butanol hydrogenation activity is structure-sensitive. Valent et al. [5] also found Pt-size dependence in methylcyclopentane hydrogenolysis selectivity and activity. With just these few examples, the control and uniformity of particle size are thus important in gaining a better understanding of catalytic reaction fundamentals.
To obtain the tight size distribution of supported Pd and Pt catalysts, an optimal synthesis method is desired. For the synthesis of supported metal nanoparticle catalysts, methods, such as impregnation, deposition–precipitation, strong electrostatic adsorption, reduction–oxidation (redox), and chemical vapor deposition, have been developed [6,7,8,9]. The catalyst preparation method can significantly impact the particle morphology, thereby affecting the catalyst performance. Catalysts made using the widely used impregnation method usually have large particle sizes and wide size distributions because of weak interactions between the precursor and support [10,11]. In addition, previous works manipulated supported palladium and platinum particle sizes via thermal treatment under different temperatures and gas atmospheres [12,13,14,15,16], which can lead to poorly controlled particle growth, resulting in a broader size distribution and non-uniform particle density between samples. Therefore, a synthesis method that can achieve the enhanced control of particle sizes and distribution, with the ability to systematically grow particle sizes, is required to better understand structure-sensitive reactions.
The method of strong electrostatic adsorption (SEA) has been shown to produce ultra-small particles (<1.5 nm average size) with narrow size distributions and uniform densities on the support surface [17]. This work aims to extend the preparation method by using electroless deposition (ED) to manipulate the particle size through the control of additional metal loading and maintaining the narrow size distribution, precisely and systematically increasing particle sizes without producing any additional particles, thus maintaining the original particle density. Electroless deposition (Figure 1) is a reduction–oxidation method where additional metal is deposited via reduction onto the surface of the preexisting primary metal that has been activated by a suitable reducing agent, such as hydrazine, formaldehyde, or formic acid [18,19]. The ED bath conditions are tuned to ensure targeted deposition of the added metal. Many different bimetallic catalysts with better control of their composition and contact between component metals have been made using the ED method, including Ag-Pd, Cu-Pd, Pt-Pd, Pt-Co, Pt-Ru, etc. [20,21,22,23]. There had been limited literature on using ED baths for the growth of Pd or Pt nanoparticles [24,25,26,27,28,29]. Particle growth via ED can be obtained through the deposition of multiple layers of the added metal. Uniform particle size growth can be achieved by controlling and slowing the rate of deposition, which has been demonstrated via the gradual introduction of ED reagents through pumping, resulting in a continuous mode of ED [30,31,32].
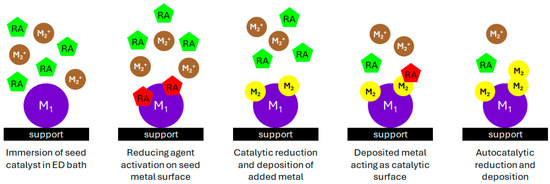
Figure 1.
Illustration of the electroless deposition process for catalyst synthesis (M1: primary metal, M2: deposited metal, RA: reducing agent).
In this work, through the novel combination of SEA and continuous ED method, the precise control of the growth of the nanoparticle size was demonstrated for Pd and Pt on different supports [33]. The goal was to maintain tight size distributions while increasing Pd and Pt particle sizes. Our prior work [32] demonstrated Pt multilayer deposition on a preexisting Pd metal for size growth. In this study, we demonstrated Pt-on-Pt deposition and developed a similar bath for Pd-on-Pd deposition. Controlled ED bath conditions for size growth via Pd-on-Pd deposition and Pt-on-Pt deposition have been successfully developed. The catalysts were characterized via chemisorption, XRD, and STEM to determine the particle sizes, distribution, and morphology of catalysts. The simplicity of continuous ED and flexibility of changing different parameters improve the synthesis, not only on a lab scale but also in commercial applications.
2. Results and Discussion
2.1. Pt/C Catalysts
2.1.1. Kinetics of Controlled Electroless Deposition of Pt
The stability of the Pt ED bath designed for 10 min pumping to obtain 9.0 wt% Pt/C was examined before conducting ED as shown in Figure S2a. About 4 μmol out of 36 μmol of Pt was reduced in solution at 10 min, which was considered an indication of the bath stability as the catalytic deposition during ED will occur faster. Figure 2 shows the Pt ED kinetics using a 6.4 wt% Pt/C seed catalyst by the varying deposition time from 10 to 480 min. Increasing the deposition time would result in a slower deposition rate on the Pt/C catalysts as the pumping of the reagents result in slower accumulation in the bath, resulting in lower concentrations and slower kinetics. Additionally, the prolonged pumping time may have caused some of the hydrazine reducing agent to slowly decompose, thus resulting in a lower amount of hydrazine added to cause reduction. It was expected that catalysts synthesized with a longer ED time would have a more uniform size distribution.
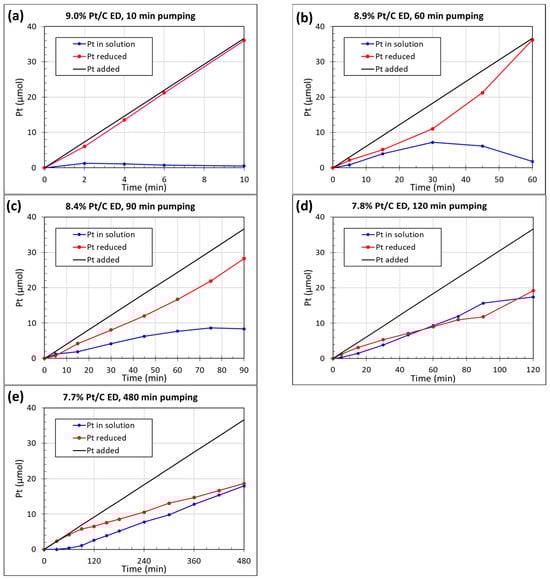
Figure 2.
Time-dependent ED kinetics of Pt/C catalysts with different pumping times: (a) 9.0 wt% Pt/C, 10 min pumping; (b) 8.9 wt% Pt/C, 60 min pumping; (c) 8.4 wt% Pt/C, 90 min pumping; (d) 7.8 wt% Pt/C, 120 min pumping; (e) 7.7 wt% Pt/C, 480 min pumping.
2.1.2. Characterization of Pt/C Catalysts
Table 1 summarizes the Pt/C catalyst ED deposition time, weight loading after ED, and diameters analyzed from different characterization methods. The Pt particle size increases with an increasing Pt weight loading. Overall, the longer the deposition time, with lesser Pt deposited, the smaller the average particle sizes and tighter size distributions, as determined via XRD, chemisorption, and STEM. When the deposition time increased from 120 min to 480 min for 7.8 to 7.7 wt% Pt/C, particle size changes were no longer significant, likely from optimized slowing of the rate of deposition where the slow introduction and accumulation of reagents in the bath have become the rate limiting step. The TPO on 9.0 wt% Pt/C was applied to determine any Pt surface contamination from residual EN or carbon decoration, as shown in Figure S3. The CO2 evolution shows a peak centered at about 190 °C, likely from the catalytic oxidation of carbonaceous material on the surface of Pt, which blocks these surface sites from chemisorption. Therefore, prior to performing chemisorption, the ED-synthesized catalysts were preheated in 10% O2 balance He at 250 °C to fully burn off the residual EN or carbon, followed by reduction in 10% H2 balance Ar at 200 °C to reduce any oxidation layer [34]. No sintering of Pt nanoparticles was observed after 250 °C burn off.

Table 1.
Pt/C samples made via ED from a 6.4 wt% Pt/C seed catalyst. Diameters from STEM generated from around 1000 particle measurements.
XRD patterns of the SEA-synthesized 6.4 wt% Pt/C seed catalysts, as well as DI-synthesized 6.4 wt% Pt/C, are shown in Figure 3a. Compared with DI-made 6.4 wt% Pt/C, the SEA-synthesized seed catalyst has broad Pt peaks, which indicates small Pt particles. The average particle size is 2.1 nm calculated from the Scherrer equation. The XRD patterns of catalysts after ED are shown in Figure 3b. All the catalysts after ED have larger Pt sizes compared with the SEA seed catalyst, which confirmed the success of size growth with the additional Pt deposited on the Pt surface of seed catalysts. The Pt peaks became broader when the ED deposition time increased from 10 min to 480 min, indicating decreasing Pt particle sizes. The XRD-calculated sizes decrease from 4.6 nm to 2.5 nm with an increasing deposition time.
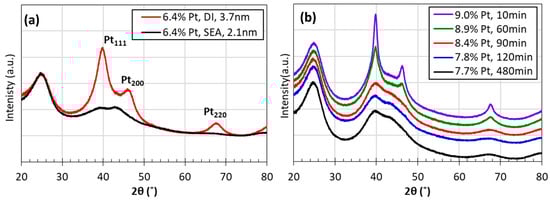
Figure 3.
X-Ray diffraction patterns of (a) 6.4 wt% Pt/C catalysts prepared using SEA and DI. (b) ED-made catalysts.
Representative STEM images of all Pt/C catalysts and corresponding histograms are shown in Figure 4. The 6.4 wt% Pt/C seed catalyst has an average size of 2.1 nm with well-dispersed Pt nanoparticles on the carbon support. For Pt/C catalysts prepared via ED, the surface average particle size from STEM decreased from 4.6 nm to 2.3 nm as the ED deposition time increased from 10 min to 480 min while obtaining a tighter size distribution. The STEM results agree well with Pt size estimates from XRD and the approaching values from the chemisorption characterization with the consideration of residual EN.
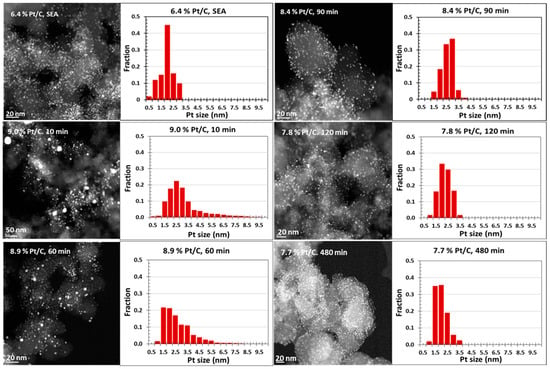
Figure 4.
STEM images and particle size distributions of the 6.4 wt% Pt/C seed catalyst with ED-synthesized Pt/C catalysts using different deposition times.
2.2. Pd/SiO2 Catalysts
2.2.1. Kinetics of Controlled Electroless Deposition of Pd
Figure S2b shows the stability of the Pd ED bath with a molar composition of N2H4/EN/[Pd(NH3)4]2+ = 5/1/1. No instability was detected before 30 min, and thus, the bath stability should not be an issue if ED occurs in 30 min and the concentration of Pd(NH3)4Cl2 in the ED bath remains low. Seed catalysts were pre-reduced in H2 at 180 °C for 1 h before ED to reduce any PdO from exposure to air. First, 8.6 wt% Pd/A150 was synthesized by pumping the Pd precursor and hydrazine solutions for 100 min as shown in Figure 5a. All the added Pd from the Pd(NH3)4Cl2 was deposited. Thus, by keeping the same concentration of the Pd solution in the syringe pump and maintaining the same pumping speed, the total Pd metal loading can be controlled by varying the total pump time. Here, 5.9 wt% Pd/A150, 4.1 wt% Pd/A150, and 3 wt% Pd/A150 were synthesized by pumping 60 min, 35 min, and 20 min, respectively, as shown in Figure 5b–d.
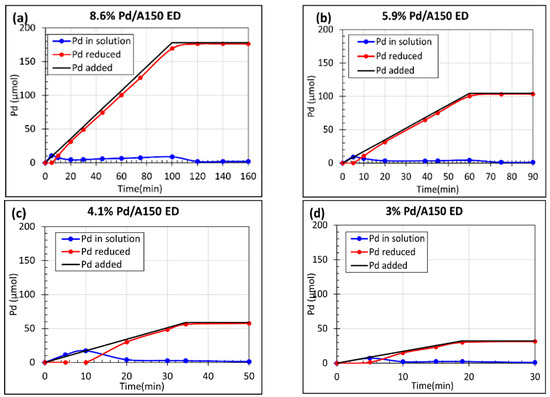
Figure 5.
ED kinetic deposition profiles using N2H4/EN/[Pd(NH3)4]2+ = 5/1/1, (a) 8.6 wt% Pd/A150, (b) 5.9 wt% Pd/A150, (c) 4.1 wt% Pd/A150, and (d) 3 wt% Pd/A150. All ED samples were prepared using an SEA-made 1.75 wt% Pd/Aerosil 150 seed catalyst.
There was an observable induction period in which no Pd was deposited for all samples within 10 min. This could be from the buildup of the Pd precursor and hydrazine concentration or from the reduction of the surface oxide layer of the Pd seed catalyst mediated by the accumulated hydrazine. After the induction period, the rate of Pd deposition equals the rate of pumping. The reduction of the Pd from the solution with hydrazine was expected to follow [28]:
| 2[Pd(NH3)4]2+ + 4e− → 2Pd⁰ + 8NH3 | E⁰ = 0.95 V |
| N2H4 + 4OH− → N2 + 4H2O + 4e− | E⁰ = 1.12 V |
| 2[Pd(NH3)4]2+ + N2H4 + 4OH− → 2Pd⁰ + 8NH3 + N2 + 4H2O | E⁰ = 2.07 V |
To investigate whether a slower deposition rate would result in smaller and more uniform Pd particles, the EN/Pd ratio was increased from 1/1 to 2/1. Figure S2c shows the stability of this ED bath. No instability was detected before 40 min; therefore, the stability of the ED bath had been increased by increasing the EN. Bath instability was not an issue with Pd deposition occurring within 40 min, and the Pd(NH3)4Cl2 in the ED bath remained below 80 μmol. The ED kinetics of prepared catalysts using an ED bath composition of N2H4/EN/[Pd(NH3)4]2+ = 5/2/1 are shown in Figure 6. The 7.4 wt% Pd/A150 was synthesized by pumping for 100 min and stirring for another 20 min. The rate of deposition was slower compared with the ED bath using an EN/Pd ratio of 1/1. There was incomplete reduction of the Pd precursor in the bath. A lower amount of Pd deposition was achieved with 25 min of pump time to obtain 2.8 wt% Pd/A150 as shown in Figure 6b.
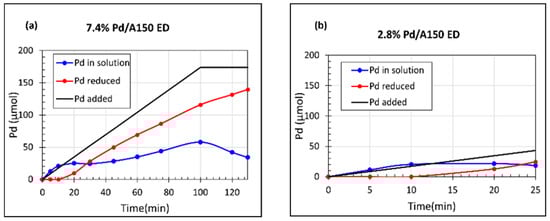
Figure 6.
ED kinetic deposition profiles using N2H4/EN/[Pd(NH3)4]2+ = 5/2/1, (a) 7.4 wt% Pd/A150, (b) 2.8 wt% Pd/A150. All ED samples were prepared using an SEA-made 1.88 wt% Pd/Aerosil 150 seed catalyst.
2.2.2. Characterization of Pd/A150 Made with ED Using N2H4/EN/[Pd(NH3)4]2+ = 5/1/1
Table 2 summarizes the Pd catalysts’ XRD, chemisorption and STEM data using ED baths with a composition of N2H4/EN/[Pd(NH3)4]2+ = 5/1/1. All characterization results indicate that the Pd particle sizes systematically increase as the palladium weight loading increases from 1.75 wt% to 8.6 wt%. All the samples for XRD and STEM were post-chemisorption samples, which means that these samples were already reduced in situ before performing chemisorption in 200 °C H2 for 1 h, and there was no distinction between the chemisorption and XRD samples that were analyzed.
Table 2.
Pd/A150 catalysts made via the ED of Pd on a 1.75 wt% Pd/A150 seed catalyst. ED bath composition: N2H4/EN/[Pd(NH3)4]2+ = 5/1/1. Diameters from STEM generated from 400–600 particle measurements.
The size estimates using the chemisorption analysis yielded larger values than those obtained from XRD. One reason is that the XRD measures the crystallite domains of nanoparticles, while chemisorption measures the actual metallic surface sites [35]. Another reason could be the contamination of Pd surface sites by EN. To investigate this apparent discrepancy, a temperature-programmed oxidation (TPO) was applied on 8.6 wt% Pd/A150 to check if EN blocked the Pd surface sites. Peaks of fragments corresponding to H2O, CO2, and NO were observed, which can be attributed to the oxidation of EN. In Figure S4, the TPO profile for mass 44 (CO2) is displayed showing the evolution of CO2 at around 250 °C and reaching a maximum signal at around 350 °C. A control experiment on TPO of EN-impregnated A150 also resulted in similar peak profiles. These TPO results demonstrate the presence of ethylenediamine in the ED catalysts, considering all the reagents added to the ED bath. The presence of EN could block the Pd surface sites, resulting in larger particle sizes measured via chemisorption. However, attempts to remove the EN on the Pd catalysts through oxidation were not successful, and this is the subject of further studies.
Figure 7a shows the XRD pattern of the SEA-made 1.88 wt% Pd/A150 seed catalyst, along with a dry impregnation (DI) sample with the same loading and reduction treatment. The lack of well-defined peaks for the SEA sample, despite being detectable at the same loading in the DI catalyst, which have 21 nm particles based on the Scherrer formula, signify that Pd particles from SEA are smaller than the detection limit of the instrument (<1.5 nm) [36]. Figure 7b displays the XRD patterns of ED-prepared Pd/A150 samples made from a 1.75 wt% Pd/A150 SEA seed catalyst using the ED bath composition of N2H4/EN/[Pd(NH3)4]2+ = 5/1/1. The sharper peaks as the Pd weight loadings increased indicate the growing crystallite sizes.
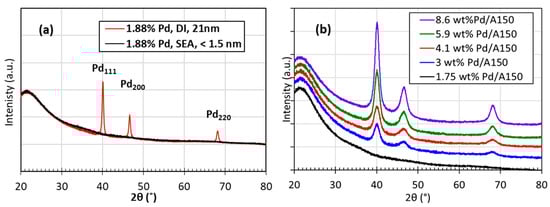
Figure 7.
X-ray diffraction patterns of (a) 1.88 wt% Pd/A150 catalysts prepared using a SEA and DI (b) 1.75 wt% Pd/A150 seed catalyst and ED-made catalysts using an ED bath composition of N2H4/EN/[Pd(NH3)4]2+ = 5/1/1.
Figure 8 shows representative STEM images of different Pd ED samples and SEA-made seed catalysts, as well as their corresponding histograms. The SEA-synthesized seed catalyst has a small size (1.5 nm) and uniform size distribution. The STEM images show that as the Pd wt% increased, the average particle sizes also increased. This trend agreed with the XRD and chemisorption results. For the 8.6 wt% Pd/A150, the larger size estimates and wider size distribution were likely due to fast deposition. An analysis of the particle size distribution revealed that some of the seed catalyst particles, particularly a fraction of those less than 2.5 nm size, did not grow after ED. It was hypothesized that this may be attributed to the presence of residual chloride on the Pd surface that blocks the deposition during ED. Another possibility was that the particles were embedded in the silica pores and could not grow because of the restraint of the pore size. The pore size analysis of A150, shown in Figure S5, did reveal a significant fraction of small pores less than 3 nm.

Figure 8.
STEM images and particle size distributions of different metal-loading Pd/A150 catalysts prepared via ED using N2H4/EN/[Pd(NH3)4]2+ = 5/1/1.
2.2.3. Characterization of Pd/A150 Made with ED Using N2H4/EN/[Pd(NH3)4]2+ = 5/2/1
Table 3 summarizes the XRD, chemisorption, and STEM data of Pd catalysts using an ED bath composition of N2H4/EN/[Pd(NH3)4]2+ = 5/2/1. All characterization results indicate that the Pd particle sizes systematically increased as the palladium weight loading increased from 1.88 wt% to 7.4 wt%. All the samples for XRD and STEM were post-chemisorption samples.
Table 3.
Pd/A150 catalysts made via the ED of Pd on 1.88 wt% Pd/A150. ED bath composition: N2H4/EN/[Pd(NH3)4]2+ = 5/2/1. The seed 1.88 wt% Pd.A150 has chemisorption and XRD size estimates of 2.8 nm and <1.5 nm, respectively.
The XRD patterns of the ED-synthesized 2.8 wt%, 7.4 wt% Pd/A150, and seed catalyst are displayed in Figure 9. The lack of well-defined Pd peaks for the SEA-made seed catalyst again indicate very small particle sizes, below the detection limit of the instrument. The stronger peak intensity and sharper peaks for ED-synthesized Pd/A150 as the metal loading increased indicated the growth of Pd particles.
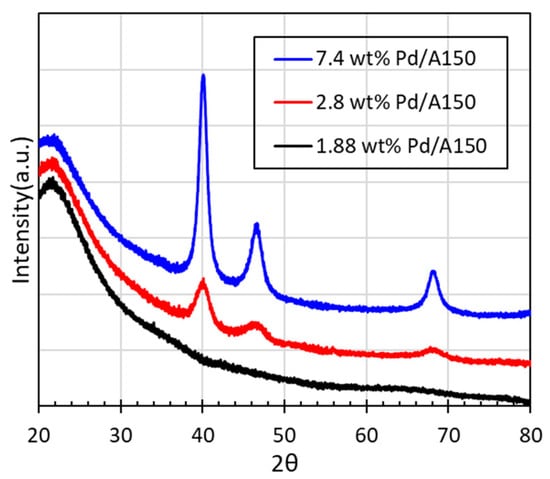
Figure 9.
X-Ray diffraction patterns of 1.88 wt% Pd/A150 seed catalyst and ED-made catalysts using an ED bath composition N2H4/EN/[Pd(NH3)4]2+ = 5/2/1.
Figure 10 shows representative STEM images of the Pd ED samples synthesized with an ED bath composition of N2H4/EN/[Pd(NH3)4]2+ = 5/2/1, as well as their corresponding histograms. The STEM images show that as the Pd loading increased, the average particle sizes also increased. This trend agreed with the XRD and chemisorption results.
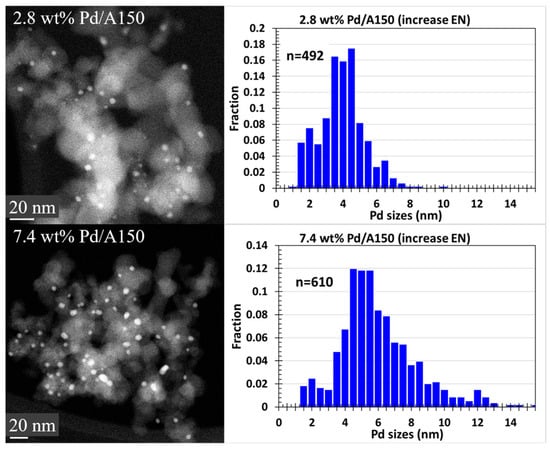
Figure 10.
STEM images and particle size distributions of different metal loading Pd/A150 catalysts prepared via ED using N2H4/EN/[Pd(NH3)4]2+ = 5/2/1.
Comparing the Pd particle size estimates via XRD, chemisorption, and STEM, samples with similar loadings prepared with N2H4/EN/[Pd(NH3)4]2+ = 5/2/1 had smaller average particle sizes and a narrower size distribution than samples prepared with N2H4/EN/[Pd(NH3)4]2+ = 5/1/1. STEM images demonstrate that Pd particle sizes were more uniform with samples prepared with an increased EN, also evident in the STEM histograms showing a tighter distribution of particle sizes. To highlight this as an example, 2.8 wt% Pd/A150 prepared with an increased EN had a STEM volume average diameter of 5.1 ± 1.9 nm, while that of 3 wt% Pd/A150 prepared with N2H4/EN/[Pd(NH3)4]2+ = 5/1/1 was 7.2 ± 3.1 nm. XRD and chemisorption results also concur with this observation for the same catalysts. By adding more EN stabilizer to the Pd ED bath, successful enhancement of Pd ED bath stability was achieved, which slowed down the Pd-deposition rate. With a slower Pd-deposition rate, Pd particles grew more uniformly, also resulting in a smaller average particle size. It should also be noted that some Pd particles did not grow after ED in this series, which may be due to EN or chloride interference in the deposition process or the possible restriction of particles in support pores.
3. Materials and Methods
3.1. Materials
Tetraamminepalladium(II) chloride, Pd(NH3)4Cl2 (99.99% trace metal basis) and tetraamminepalladium(II) nitrate, Pd(NH3)4(NO3)2 supplied by Sigma Aldrich (Saint Louis, MO, USA) were used as Pd precursors. Dihydrogen hexachloroplatinate(IV), H2PtCl6 (99.9% metal basis) supplied by Alfa Aesar (Ward Hill, MA, USA) was used as the Pt precursor. Hydrazine (64 wt% N2H4 solution) supplied by Acros Organics (Pittsburgh, PA, USA) was used as the reducing agent. Ethylenediamine, C2H4(NH2)2 (EN, 99%) supplied by Alfa Aesar was used as an ED bath stabilizer. To adjust the pH of solutions, HCl (VWR Chemicals BDH), NH4OH (VWR Chemicals BDH), or NaOH (Mallinckrodt AR) solutions were added dropwise. All aqueous solutions were prepared using deionized water (18.2 MΩ-cm, prepared with MilliTM-Q system). Aerosil 150 SiO2 (A150, supplied by Evonik, Piscataway, NJ, USA) with a surface area of 137 m2/g and point of zero charge (PZC) of 3.7 was used as support for Pd catalysts. Vulcan XC72 or VXC72 carbon (C, supplied by Cabot, Alpharetta, GA, USA) with a surface area of 250 m2/g and point of zero charge (PZC) of 8.5 was used as support for Pt catalysts.
3.2. Pt/C Catalysts Synthesis
3.2.1. Pt/C Seed Catalyst Prepared via SEA
For supported Pt catalyst synthesis, 6.4 wt% Pt/C carbon seed catalysts were made using the SEA method. The maximum uptake using H2PtCl6 as the precursor is at pH 3 [37]. A 200 ppm H2PtCl6 solution was adjusted to pH 3 using NaOH. The solution was then aged for 2 days and then readjusted back to the same initial pH. This aging cycle was performed twice after which the pH of the solution is stable. Then, 2 g of VXC72 carbon was added into 1 L of the as prepared 200 ppm H2PtCl6 solution, which corresponds to a 500 m2/L surface loading. The slurry was then shaken vigorously (~120 rpm) for an hour. After the 1 h contact time, the slurry pH was measured and was subsequently filtered [11]. The wt% of Pt/C was determined via inductively coupled plasma-optical emission spectroscopy (ICP-OES, PerkinElmer Avio 200, Springfield, IL, USA). The sample was dried in an oven at 120 °C overnight. After drying, the sample was reduced at 200 °C for 1 h with the heating ramp of 2.5 °C/min under 250 sccm flow of 10% H2 in balance He. Another 6.4 wt% Pt/C was made through dry impregnation (DI) for comparison with the 6.4 wt% Pt/C prepared via SEA. The dry impregnation procedure was performed via pore filling, to incipient wetness, of the support powder with a solution containing the precursor. The impregnated material was then dried and subjected to the same thermal treatment as the SEA sample to obtain the final catalyst.
3.2.2. Pt/C Catalysts Prepared via ED
To grow the Pt particles, additional Pt was deposited on the SEA-prepared Pt/C using the ED method. ED was conducted under room temperature using H2PtCl6 as the precursor with a bath total molar composition of [N2H4]/[EN]/[PtCl62−] = 5/2/1. The pH of the Pt ED bath was monitored and maintained at pH 9, which prevents electrostatic adsorption of the Pt precursor on the carbon support. The continuous mode of ED was employed where both the reducing agent and precursor were pumped into the bath [32]. Then, 0.25 g of the 6.4 wt% Pt/C seed catalyst was added to 91.7 mL of deionized water in each ED experiment. H2PtCl6 together with EN in one solution and hydrazine in another solution was pumped into the ED bath using two separate motor-driven syringe pumps. The concentration of Pt in the syringe pump was fixed at 1900 ppm Pt with the corresponding EN added based on the required molar ratio, while the concentration of hydrazine in the other pump was 41.1 mmol/L. For the deposition experiments, fixed volumes of the reagents were added: 3.8 mL of the Pt + EN solution, and 4.5 mL of the hydrazine solution. Different pumping times, thus using different pump speeds, were used to compare the ED kinetics and the resulting Pt particle sizes, pumping the required amount of the Pt precursor and N2H4 for 10 min, 60 min, 90 min, 120 min, and 480 min. A control experiment was conducted at the fastest pumping rate to determine the stability of the Pt ED bath, wherein the precursor with stabilizer and reducing agent solutions were pumped in without the addition of the seed catalyst. Liquid samples were taken periodically from the ED bath and filtered before measurement via ICP-OES to determine the amount of deposited Pt. After ED, the samples were filtered and washed with 2 L of deionized water. The washed sample was dried at room temperature and collected for further characterization.
3.3. Pd/SiO2 Catalyst Synthesis
3.3.1. Pd/SiO2 Seed Catalyst Prepared via SEA
The Pd/A150 seed catalyst was made using the SEA method. Palladium uptake at varying pH values was determined using 150 ppm Pd solutions with Pd(NH3)4Cl2 as the precursor at a surface loading of 1000 m2/L support in the slurry. The initial pH (pHi) was adjusted with either HCl or NH4OH. NaOH was used to obtain a pH higher than 11.5. The slurries were shaken for 1 h at around 120 rpm, and the final pH (pHf) was measured. The amounts of initial Pd, as well as Pd remaining after contact, were measured via Atomic Absorption Spectroscopy (AAS). The concentration difference before and after the contact procedure is termed the metal uptake. The uptake survey at different pHf values is shown in Supplementary Figure S1, which indicates that up to 1.9 wt% Pd loading is achieved on A150 at around pHf of 11.4~12.3. A batch of 1.75 wt% and 1.88 wt% Pd/A150 catalysts was made at this range of pH values as seed catalysts for ED. The resulting catalysts were filtered and then dried in a vacuum oven at room temperature. The catalysts were then dried in Argon flow at 120 °C for 1 h to fully remove water before reduction in a 250 sccm flow of 20% H2-balanced Ar at 180 °C for 1 h at a 5 °C/min heating ramp rate. Another 1.88 wt% Pd/A150 was made via dry impregnation (DI) and the same thermal treatments to compare with the 1.88 wt% Pd/A150 prepared via SEA.
3.3.2. Pd/SiO2 Catalysts Prepared via ED
The SEA-made Pd/A150 was used as a seed catalyst to deposit more Pd using the continuous ED method. Before ED, Pd SEA tests were conducted to determine an appropriate pH of the ED bath such that no metal precursor would adsorb on the silica support. The Pd complex [Pd(NH3)4]2+ was evaluated for electrostatic adsorption on the A150 support at different bath pH values containing EN as a stabilizing agent. These experiments were performed with the immersion of the support in the precursor solution while maintaining the pH for 1 h. The weight of the support and the concentration of the precursor solution are identical to those in the ED process. It was determined that the Pd ED bath needed to be slightly acidic to prevent electrostatic adsorption of the cationic precursor [Pd(NH3)4]2+ on the silica support with a low PZC.
The controlled Pd ED bath continuous process was developed as follows. The baths used Pd(NH3)4Cl2 as the Pd source. The bath total molar composition was [N2H4]/[EN]/[Pd(NH3)4]2+ = 5/1/1, and the experiments were conducted at pH 6 ± 0.5 under room temperature; 0.25 g of the 1.75 wt% Pd/A150 seed catalyst was added to 75 mL of deionized water. The Pd(NH3)4Cl2 together with EN in one solution and hydrazine in another solution was added to the ED bath using two separate motor-driven syringe pumps. The concentration of Pd in the syringe pump was fixed at 1500 ppm Pd with the corresponding EN added based on the required molar ratio, while the concentration of hydrazine in the other pump was 70.5 mmol/L. Control experiments to test bath stability without adding the seed catalyst showed that the ED bath was stable within 30 min such that no Pd precursor reduced to Pd metal particles in solution within 30 min. The Pd weight loadings deposited via ED were determined by controlling the deposition time of Pd salt (1.8 μmol/min pump rate) and hydrazine (9 μmol/min pump rate). Four weight loadings (wt%) of Pd/A150 were made by pumping for 100 min, 60 min, 35 min, and 20 min, respectively. Liquid samples were taken periodically from the ED bath and filtered for elemental analysis using AAS. After ED, the catalysts were filtered and washed with 2 L of deionized water. The washed catalysts were dried at room temperature and collected for further characterization. To slow down the deposition rate, EN was increased such that the molar composition became [N2H4]/[EN]/[Pd(NH3)4]2+ = 5/2/1.
3.4. Catalyst Characterization
Pulse chemisorption analyses were performed in a Micromeritics Autochem II 2920 Analyzer, with a thermal conductivity detector, using O-precovered H2 titration to obtain particle size estimates and dispersion. The supported Pd and Pt catalysts were first reduced in situ at 200 °C for 1 h in hydrogen and then cooled down to 40 °C before exposure to flowing oxygen and purging with argon. Pulses of diluted hydrogen were then introduced, and the unconsumed amount was detected via TCD [38,39,40]. Particle dispersions were then obtained from the hydrogen consumption, which was correlated with surface atom sites based on a stoichiometry of H2:Pt (or Pd) = 1:0.667, and size estimates were calculated assuming hemispherical geometry.
Powder X-ray diffraction (XRD) analyses of catalyst samples were performed on a Rigaku Miniflex II benchtop diffractometer, equipped with a D/tex Ultra Si-slit high sensitivity detector, using a CuKα radiation source (λ = 1.5406 Å) operated at 30 kV and 15 mA. Powder samples were pressed and loaded on a zero-background holder. Scanning was performed over the 2θ range of 20–80° with a sampling width of 0.02° and dwell time of 2°/min. The Scherrer equation was used to calculate crystal sizes.
Aberration-corrected JEOL (Peabody, MA, USA) 2100 F scanning transmission electron microscopy (STEM) was used for Z-contrast imaging. Each sample was taken with more than 20 images at various positions to obtain representative images. Particle size measurements were performed with Image J 1.53k software. The number-averaged diameter (Dn) was calculated using Dn = ∑nidi/∑ni, while the surface-averaged diameter (Ds) was calculated using Ds = ∑nidi³/∑nidi2, and the volume-averaged diameter (Dv) was calculated using Dv = ∑nidi4/∑nidi3, where ni is the number of particles with diameter di using a 0.1 to 0.5 nm bin size, depending on image resolution and Image J scale calibration, assuming a hemispherical particle shape [41]. Details of these calculations are provided in a Supplementary Worksheet File S1 (“STEM Worksheet.xlsx”). Of these values, Ds is compared with chemisorption size estimates, while Dv is compared with XRD size estimates [34,42].
Temperature-programmed oxidation (TPO) was employed to test the possible ethylenediamine remaining on the surface of catalysts originating from the synthesis procedure. Here, 8.6 wt% Pd/A150 and 9.0 wt% Pt/C powders were placed in gas flow with a mass spectrometer detector. These catalysts were dried in Ar flow at 200 °C, monitoring the m/e = 18 signal until it drops to baseline. Then, TPO was performed in a 20 sccm flow of 10% O2 with balance He, ramping at 15 °C/min from 25 °C to 550 °C. The spectrums from 1 to 50 amu were recorded.
4. Conclusions
A controlled and scalable method has been developed for varying the sizes of supported Pd and Pt nanoparticles with enhanced uniformity. Also, a new ED bath for palladium deposition for supported metal catalyst synthesis has been successfully formulated using N2H4 as a reducing agent. The amount of Pd and Pt deposited corresponds to the growth of the Pd and Pt particle size on a pre-existing Pd and Pt core, based on analyses by chemisorption, XRD, and STEM imaging. Small average particle sizes, below 3 nm, with tight size distributions were achieved for Pt and Pd by regulating the rate of deposition. Continuous ED by simultaneously pumping the metal precursor and reducing agent can better control the metal precursor concentration in the ED bath and the ED kinetics. The deposition rate can also be controlled and slowed down by adding more stabilizer and decreasing the pumping speed of the metal precursor and reducing agent. A reduced deposition rate resulted in smaller and more uniformly dispersed particles. Catalysts prepared with such morphology are significant for studying structure-sensitive reactions and gaining insight on intrinsic nanoparticle characteristics, such as structural strain [43]. In addition, the versatility and simplicity of this ED method make it promising in industrial manufacturing. Additional in-depth studies may be conducted on how ED is affected by possible interfering components, such as chloride counterion [42] and mobile oxygen species from the support [44].
Supplementary Materials
Supplementary Information can be downloaded at: https://www.mdpi.com/article/10.3390/catal15020156/s1, File S1: STEM Worksheet. Figure S1: Uptake survey of Pd, as [Pd(NH3)4]2+, on Aerosil 150. Figure S2: ED bath stability of (a) 9.0% Pt/C, 10 min pumping design, (b) Pd/A150 ED bath using N2H4/EN/[Pd(NH3)4]2+ = 5/1/1, and (c) Pd/A150 ED bath using N2H4/EN/[Pd(NH3)4]2+ = 5/2/1. Figure S3: Temperature programmed oxidation profile of 9.0 wt% Pt/C. Figure S4: Temperature programmed oxidation profile of 8.6 wt% Pd/A150 (post-chemisorption). Figure S5: The pore fraction and cumulative pore area of A150. Table S1: Example worksheet for the calculation of average particle size from STEM for 7.7 wt% Pt/C (480 min pumping time).
Author Contributions
Conception and design of the experiments were performed with guidance of J.M.M.T., J.R.M. and J.R.R., as principal investigators; synthesis, characterization experiments, and analysis of data were performed by H.Z., W.X., A.S., Y.L. and J.M.M.T.; H.Z. wrote the paper with contributions from W.X. and J.M.M.T.; all authors participated in the analysis, interpretation, and review of the results and provided input in the writing process of the paper. All authors have read and agreed to the published version of the manuscript.
Funding
This research was funded by Center for Rational Catalyst Synthesis (CeRCaS)—A National Science Foundation (NSF) Industry-University Cooperative Research Center (IUCRC) Award No. 1939876.
Data Availability Statement
The original contributions presented in this study are included in the article/Supplementary Materials. The raw data supporting the conclusions of this article will be made available by the authors on request. Further inquiries can be directed to the corresponding author.
Conflicts of Interest
The authors declare no conflicts of interest. The funders had no role in the design of the study; in the collection, analyses, or interpretation of data; in the writing of the manuscript; or in the decision to publish the results.
References
- Boudart, M. Catalysis by Supported Metals. Adv. Catal. 1969, 20, 153–166. [Google Scholar] [CrossRef]
- Van Hardeveld, R.; Hartog, F. The statistics of surface atoms and surface sites on metal crystals. Surf. Sci. 1969, 15, 189–230. [Google Scholar] [CrossRef]
- Sinfelt, J.H. Catalytic hydrogenolysis over supported metals. Catal. Rev. 1970, 3, 175–205. [Google Scholar] [CrossRef]
- Lear, T. Structure/Activity Correlations in Alumina Supported Palladium Catalysts; University of Glasgow: Glasgow, UK, 2003. [Google Scholar]
- Le Valant, A.; Drault, F.; Maleix, C.; Comminges, C.; Beauchet, R.; Batonneau, Y.; Pirault-Roy, L.; Especel, C.; Epron, F. Effect of the metallic particle size of supported Pt catalysts on methylcyclopentane hydrogenolysis: Understanding of the ring opening products distribution by a geometric approach. J. Catal. 2018, 367, 234–243. [Google Scholar] [CrossRef]
- Zhong, C.J.; Regalbuto, J.R. Metal Nanoparticle Synthesis; Elsevier Ltd.: Amsterdam, The Netherlands, 2013. [Google Scholar]
- Pinna, F. Supported metal catalysts preparation. Catal. Today 1998, 41, 129–137. [Google Scholar] [CrossRef]
- Wrobleski, J.T.; Boudart, M. Preparation of solid catalysts: An appraisal. Catal. Today 1992, 15, 349–360. [Google Scholar] [CrossRef]
- Van Dillen, A.J.; Terörde, R.J.A.M.; Lensveld, D.J.; Geus, J.W.; De Jong, K.P. Synthesis of supported catalysts by impregnation and drying using aqueous chelated metal complexes. J. Catal. 2003, 216, 257–264. [Google Scholar] [CrossRef]
- Mehrabadi, B.A.T.; Eskandari, S.; Khan, U.; White, R.D.; Regalbuto, J.R. A Review of Preparation Methods for Supported Metal Catalysts. In Advances in Catalysis, 1st ed.; Song, C., Ed.; Elsevier Inc.: Amsterdam, The Netherlands, 2017; Volume 61, pp. 1–35. [Google Scholar]
- Tengco, J.M.M. Synthesis of Well Dispersed Supported Metal Catalysts by Strong Electrostatic Adsorption and Electroless Deposition. Ph.D. Thesis, University of South Carolina, Columbia, SC, USA, 2016. [Google Scholar]
- Boubnov, A.; Dahl, S.; Johnson, E.; Molina, A.P.; Simonsen, S.B.; Cano, F.M.; Helveg, S.; Lemus-Yegres, L.J.; Grunwaldt, J.-D. Structure–activity relationships of Pt/Al2O3 catalysts for CO and NO oxidation at diesel exhaust conditions. Appl. Catal. B Environ. 2012, 126, 315–325. [Google Scholar] [CrossRef]
- Hansen, T.K.; Høj, M.; Hansen, B.B.; Janssens, T.V.W.; Jensen, A.D. The effect of Pt particle size on the oxidation of CO, C3H6, and NO over Pt/Al2O3 for diesel exhaust aftertreatment. Top. Catal. 2017, 60, 1333–1344. [Google Scholar] [CrossRef]
- Zhang, W.; Wang, H.; Jiang, J.; Sui, Z.; Zhu, Y.; Chen, D.; Zhou, X. Size dependence of Pt catalysts for propane dehydrogenation: From atomically dispersed to nanoparticles. ACS Catal. 2020, 10, 12932–12942. [Google Scholar] [CrossRef]
- Du, J.; Zhao, D.; Wang, C.; Zhao, Y.; Li, H.; Luo, Y. Size effects of Pd nanoparticles supported over CeZrPAl for methane oxidation. Catal. Sci. Technol. 2020, 10, 7875–7882. [Google Scholar] [CrossRef]
- Murata, K.; Mahara, Y.; Ohyama, J.; Yamamoto, Y.; Arai, S.; Satsuma, A. The Metal-Support Interaction Concerning the Particle Size Effect of Pd/Al2O3 on Methane Combustion. Angew. Chem. 2017, 129, 16209–16213. [Google Scholar] [CrossRef]
- Jiao, L.; Regalbuto, J.R. The synthesis of highly dispersed noble and base metals on silica via strong electrostatic adsorption: I. Amorphous silica. J. Catal. 2008, 260, 329–341. [Google Scholar] [CrossRef]
- Diao, W.; Tengco, J.M.M.; Gaffney, A.M.; Regalbuto, J.R.; Monnier, J.R. Rational synthesis of bimetallic catalysts using electroless deposition methods. Catalysis 2020, 32, 116–150. [Google Scholar]
- Ohno, I.; Wakabayashi, O.; Haruyama, S. Anodic oxidation of reductants in electroless plating. J. Electrochem. Soc. 1985, 132, 2323. [Google Scholar] [CrossRef]
- Diao, W.; Tengco, J.M.M.; Regalbuto, J.R.; Monnier, J.R. Preparation and Characterization of Pt-Ru Bimetallic Catalysts Synthesized by Electroless Deposition Methods. ACS Catal. 2015, 5, 5123–5134. [Google Scholar] [CrossRef]
- Beard, K.D.; Borrelli, D.; Cramer, A.M.; Blom, D.; Van Zee, J.W.; Monnier, J.R. Preparation and Structural Analysis of Carbon-Supported Co Core/Pt Shell Electrocatalysts Using Electroless Deposition Methods. ACS Nano 2009, 3, 2841–2853. [Google Scholar] [CrossRef]
- Rebelli, J.; Rodriguez, A.A.; Ma, S.; Williams, C.T.; Monnier, J.R. Preparation and characterization of silica-supported, group IB–Pd bimetallic catalysts prepared by electroless deposition methods. Catal. Today 2011, 160, 170–178. [Google Scholar] [CrossRef]
- Rebelli, J.; Detwiler, M.; Ma, S.; Williams, C.T.; Monnier, J.R. Synthesis and characterization of Au-Pd/SiO2 bimetallic catalysts prepared by electroless deposition. J. Catal. 2010, 270, 224–233. [Google Scholar] [CrossRef]
- Djokić, S.S. Electroless deposition of metals and alloys. In Modern Aspects of Electrochemistry; Conway, B.E., White, R.E., Eds.; Springer: Boston, MA, USA, 2002. [Google Scholar]
- Ohno, I. Electroless Deposition of Palladium and Platinum. In Modern Electroplating, 5th ed.; John Wiley & Sons, Inc.: Hoboken, NJ, USA, 2010; pp. 477–482. [Google Scholar] [CrossRef]
- Lelental, M. Dimethylamine Borane as the Reducing Agent in Electroless Plating Systems. J. Electrochem. Soc. 1973, 120, 1650. [Google Scholar] [CrossRef]
- Rhoda, R.N. Barrel plating by means of electroless palladium. J. Electrochem. Soc. 1961, 108, 707. [Google Scholar] [CrossRef]
- Cheng, Y.S.; Yeung, K.L. Effects of electroless plating chemistry on the synthesis of palladium membranes. J. Membr. Sci. 2001, 182, 195–203. [Google Scholar] [CrossRef]
- Paglieri, S.N.; Foo, K.Y.; Way, J.D.; Collins, J.P.; Harper-Nixon, D.L. A new preparation technique for Pd/alumina membranes with enhanced high-temperature stability. Ind. Eng. Chem. Res. 1999, 38, 1925–1936. [Google Scholar] [CrossRef]
- Tate, G.; Kenvin, A.; Diao, W.; Monnier, J.R. Preparation of Pt-containing bimetallic and trimetallic catalysts using continuous electroless deposition methods. Catal. Today 2019, 334, 113–121. [Google Scholar] [CrossRef]
- Egelske, B.T.; Xiong, W.; Zhou, H.; Monnier, J.R. Effects of the method of active site characterization for determining structure-sensitivity in Ag-catalyzed ethylene epoxidation. J. Catal. 2022, 410, 221–235. [Google Scholar] [CrossRef]
- Wongkaew, A.; Zhang, Y.; Tengco, J.M.M.; Blom, D.A.; Sivasubramanian, P.K.; Fanson, P.T.; Regalbuto, J.R.; Monnier, J.R. Characterization and evaluation of Pt-Pd electrocatalysts prepared by electroless deposition. Appl. Catal. B Environ. 2016, 188, 367–375. [Google Scholar] [CrossRef]
- Xiong, W. Preparation, Characterization and Evaluation of Rationally Designed Catalysts by Electroless Deposition. Ph.D. Thesis, University of South Carolina, Columbia, SC, USA, 2021. [Google Scholar]
- Tengco, J.M.M.; Lugo-José, Y.K.; Monnier, J.R.; Regalbuto, J.R. Chemisorption–XRD particle size discrepancy of carbon supported palladium: Carbon decoration of Pd? Catal. Today 2015, 246, 9–14. [Google Scholar] [CrossRef]
- Geyer, R.; Hunold, J.; Keck, M.; Kraak, P.; Pachulski, A.; Schödel, R. Methods for determining the metal crystallite size of Ni supported catalysts. Chem. Ing. Tech. 2012, 84, 160–164. [Google Scholar] [CrossRef]
- O’Connell, K.; Regalbuto, J.R. High Sensitivity Silicon Slit Detectors for 1 nm Powder XRD Size Detection Limit. Catal. Lett. 2015, 145, 777–783. [Google Scholar] [CrossRef]
- Hao, X.; Quach, L.; Korah, J.; Spieker, W.A.; Regalbuto, J.R. The control of platinum impregnation by PZC alteration of oxides and carbon. J. Mol. Catal. A Chem. 2004, 219, 97–107. [Google Scholar] [CrossRef]
- Benson, J.E.; Boudart, M. Hydrogen-oxygen titration method for the measurement of supported platinum surface areas. J. Catal. 1965, 4, 704–710. [Google Scholar] [CrossRef]
- Hoang-Van, C.; Michel, C.; Pommier, B.; Teichner, S.J. Hydrogen-oxygen titration and carbon monoxide chemisorption for the measurement of supported palladium surface areas. React. Kinet. Catal. Lett. 1980, 13, 63–67. [Google Scholar] [CrossRef]
- Suh, D.J.; Park, T.-J.; Ihm, S.-K. Hydrogen/oxygen titration method for measurement of Pd dispersion on supported catalysts. J. Catal. 1994, 149, 486–488. [Google Scholar] [CrossRef]
- Datye, A.K.; Xu, Q.; Kharas, K.C.; McCarty, J.M. Particle size distributions in heterogeneous catalysts: What do they tell us about the sintering mechanism? Catal. Today 2006, 111, 59–67. [Google Scholar] [CrossRef]
- Banerjee, R.; Regalbuto, J.R. Rectifying the chemisorption–XRD discrepancy of carbon supported Pd: Residual chloride and/or carbon decoration. Appl. Catal. A Gen. 2020, 595, 117504. [Google Scholar] [CrossRef]
- Guan, D.; Shi, C.; Xu, H.; Gu, Y.; Zhong, J.; Sha, Y.; Hu, Z.; Ni, M.; Shao, Z. Simultaneously mastering operando strain and reconstruction effects via phase-segregation strategy for enhanced oxygen-evolving electrocatalysis. J. Energy Chem. 2023, 82, 572–580. [Google Scholar] [CrossRef]
- Zhang, H.; Guan, D.; Gu, Y.; Xu, H.; Wang, C.; Shao, Z.; Guo, Y. Tuning synergy between nickel and iron in Ruddlesden–Popper perovskites through controllable crystal dimensionalities towards enhanced oxygen-evolving activity and stability. Carbon Energy 2024, 6, e465. [Google Scholar] [CrossRef]
Disclaimer/Publisher’s Note: The statements, opinions and data contained in all publications are solely those of the individual author(s) and contributor(s) and not of MDPI and/or the editor(s). MDPI and/or the editor(s) disclaim responsibility for any injury to people or property resulting from any ideas, methods, instructions or products referred to in the content. |
© 2025 by the authors. Licensee MDPI, Basel, Switzerland. This article is an open access article distributed under the terms and conditions of the Creative Commons Attribution (CC BY) license (https://creativecommons.org/licenses/by/4.0/).