1. Introduction
The growing global energy crisis and environmental pollution are among the most pressing challenges of the twenty-first century [
1,
2]. It is in this respect that semiconductor photocatalysis has been receiving growing interest as an attractive green technology offering a two-fold solution: producing clean hydrogen fuel by splitting water and decomposing organic pollutants to purify wastewater [
3,
4]. The effectiveness of this process is primarily determined by the design of photocatalysts that can use solar energy to generate electron–hole pairs, which can, in turn, initiate the necessary redox reactions [
5,
6].
Metal–organic frameworks (MOFs) are a promising class of photocatalytic materials that have recently moved beyond their conventional uses in gas storage and separation [
7,
8]. The structure of these materials consists of metal ions or small groupings bonded through organic molecules, making them porous and solid [
9,
10]. A relatively high surface area, adjustable pore diameters, and well-defined active sites are only a few advantages of this structure [
10,
11,
12]. Zeolitic Imidazolate Framework-8 (ZIF-8), a well-known member of the MOF family, comprises 2-methylimidazole molecules and Zn
2+ ions. Due to its high chemical stability and ease of production, ZIF-8 has attracted attention [
13,
14]. The organic constituent of the ligand-to-metal charge transfer (LMCT) process is necessary to capture light and convert its energy to the metal centre. It is the source of this material’s photocatalytic behaviour [
15,
16].
The practical use of pristine ZIF-8 is significantly constrained by its inherent shortcomings. Its wide bandgap (~5.0–5.2 eV) limits light absorption mainly to the ultraviolet region, which represents only a small fraction (~4%) of the solar spectrum [
17,
18]. In addition, ZIF-8, similar to many semiconductors, recombines photogenerated charge carriers (electrons and holes) rapidly, resulting in a significant reduction in quantum efficiency [
17,
19]. Consequently, thoughtful structural modifications of the ZIF-8 framework are necessary to address these limitations.
Introducing heteroatoms, especially transition-metal ions, into the framework of MOFs is an effective way to tune their optoelectronic properties [
20,
21]. This “doping” method introduces new energy levels within the bandgap, thereby reducing its width while enabling light absorption in the visible realm [
22]. Most importantly, the synergistic coupling interaction between a variety of metal centres may lead to a fast metal-to-metal charge transfer (MMCT), which can act as an effective and rapid route for electron travelling, thus blocking charge recombination [
23]. The efficacy of this approach is well-illustrated in the recent literature. For instance, Varangane et al. reported that the incorporation of Cu
2+ into ZIF-8 (Cu-ZIF-8) enormously increased the activity of photocatalytic H2 evolution up to 13.9 mmol g
−1 h
−1, 17-fold compared to the pristine ZIF-8 [
24]. This enhancement was suggested due to the smaller bandgap and more effective charge separation caused by Cu doping.
Meanwhile, environmental treatment using doped ZIF-8 has also been investigated. In a pioneering work, Zulfa et al. prepared Ni-doped ZIF-8 (Ni-ZIF-8) using an environmentally friendly aqueous method at room temperature [
25]. Their Ni(20)-ZIF-8 possessed a considerably narrowed bandgap and reduced charge recombination rate, thus achieving a high methylene blue (MB) degradation efficiency of 93.22%. This work elegantly demonstrated the potential of Ni doping to enhance the photocatalytic oxidation capability of ZIF-8 for pollutant degradation.
Despite these significant advances, a critical research gap remains. The current literature presents a fragmented view: studies like that of Varangane et al. focus exclusively on energy applications (H
2 evolution), while works like Zulfa et al. concentrate solely on environmental applications (dye degradation) [
26]. To the best of our knowledge, a comprehensive investigation of the effect of a specific metal dopant on the photocatalytic hydrogen evolution and pollutant degradation performance of ZIF-8 within a single, unified study is still lacking. Nickel, with its excellent corrosion resistance, favourable ionic radius for substitution (Ni
2+ = 0.83 Å vs. Zn
2+ = 0.74 Å), and capacity to introduce new mid-gap states, is an up-and-coming candidate for such a dual-function photocatalyst.
We are now providing a systematic work on the synthesis, characterization, and dual-functional photocatalytic use of Ni-doped ZIF-8. The paper seeks to fill the gap between energy and environmental photocatalysis through a comprehensive study of the effect of Ni doping on the quality of ZIF-8. The aims of this manuscript are the following:
To prepare a family of Ni-ZIF-8 bimetallic MOFs with different Ni/Zn ratios by an easy and sustainable procedure.
To describe the morphological, structural, and, most importantly, the optical and electrochemical properties of the prepared materials in detail in order to understand the effect of Ni doping.
To strictly test the photocatalytic ability of the Ni-ZIF-8 composites for hydrogen evolution of water splitting under simulated solar light.
To simultaneously determine their effectiveness in the degradation of model organic pollutants under photodegradation (e.g., methylene blue), it is necessary to develop a structure-activity relationship.
To suggest a concerted photocatalytic mechanism that will account for the increased activity of both redox processes, with a particular focus on the importance of MMCT and inhibition of charge recombination.
This publication represents an important breakthrough in the evolution of multifunctional MOF-based systems towards a sustainable future because it illustrates the achievement of one effective and stable Ni-ZIF-8 photocatalyst to produce renewable energy and remediate the environment.
2. Result Discussion
2.1. Structural and Crystallographic Characterization
X-ray diffraction (XRD) was used to examine the crystal structure and phase purity of the generated pure ZIF-8 and Ni-doped ZIF-8 composites, as displayed in
Figure 1. All samples exhibit recognizable diffraction peaks at 2θ values of about 7.3°, 10.4°, 12.7°, 14.7°, 16.4°, and 18.0°, these peaks correspond to the (011), (002), (112), (022), (013), and (222) crystal planes of the sodalite (SOD) topology of ZIF-8 (JCPDS card no. 00-062-1030). This demonstrates that a highly crystalline ZIF-8 framework is successfully formed in every instance. No additional peaks corresponding to crystalline nickel oxide or other impurity phases are detected, even at the highest doping level of 10 mol%. This indicates that Ni
2+ ions are successfully incorporated into the framework without disrupting the long-range crystalline order or forming segregated phases.
However, a systematic analysis reveals the significant impact of Ni doping on the material’s microstructure. An apparent decrease in the intensity of the characteristic peaks is observed with increasing Ni concentration. Furthermore, a noticeable peak broadening becomes evident, particularly in the patterns of Ni(7.5)-ZIF-8 and Ni(10)-ZIF-8. This broadening directly indicates a reduction in crystallite size and the introduction of macrostrain within the crystal lattice, likely due to the divergence in ionic radii between Ni
2+ (0.69 Å) and Zn
2+ (0.74 Å).
Figure 1b zooms in on the region between 2θ = 8.89° and 15.72°, where the peak broadening and intensity reduction are most evident.
2.2. FTIR Spectroscopy Analysis
FTIR spectroscopy was used to examine the changes in the chemical environment by Ni doping and verify that the ZIF-8 framework had formed successfully. The spectra of the pure ZIF-8 and the Ni-ZIF-8 composites with varying doping levels (2.5 to 10 mol%) are presented in
Figure 2. The spectrum of pure ZIF-8 shows all of the distinctive vibrational modes and its clearly defined structure. The broad absorption band at approximately 3448 cm
−1 is attributed to O–H stretching vibrations from residual or adsorbed water molecules. The peaks in the range of 3132 cm
−1 and 2930 cm
−1 are assigned to the aromatic and aliphatic C–H stretching vibrations of the 2-methylimidazole (2-MIm) linker, respectively. The most prominent feature across all spectra is a broad absorption band centred around 3500 cm
−1, which is attributed to the O-H stretching vibration of water molecules physically adsorbed on the porous material. The intensity of this band appears to be influenced by the Ni content, suggesting that Ni doping may alter the hydrophilicity or the number of adsorption sites within the framework.
In the fingerprint region (below 1800 cm−1), the spectra of the Ni-doped samples closely overlap with that of the pure ZIF-8, indicating that the primary coordination environment of the imidazolate linkers remains intact. Key bands include those corresponding to the C-N stretching (~1350–1500 cm−1), the entire ring stretching (~900–1350 cm−1), and the out-of-plane ring bending (~400–800 cm−1) vibrations of the 2-methylimidazolate linker. The minimal shifts in these bands suggest that Ni is successfully incorporated into the framework without causing major structural distortion, likely through isomorphous substitution of Zn2+ ions.
The coexistence of both Zn–N and Ni–N vibrations, and the inverse relationship between their intensities with doping level, confirms the formation of a bimetallic Ni/Zn-ZIF-8 structure rather than a simple physical mixture or a separate Ni-based phase. This modification of the first coordination sphere is expected to significantly alter the electronic structure of the MOF, which in turn influences its photocatalytic performance.
2.3. Morphological Analysis
Structural and morphological analysis by SEM revealed that Ni-doped ZIF-8 (10% Ni) crystallizes into a uniform dodecahedral morphology (
Figure 3a). The spatial distribution of elements, as determined by elemental mapping (
Figure 3b–f), was homogeneous for C, N, Ni, and Zn, respectively. The phase of the metallic constituents was identified by XRD, confirming that Zn is present as Zn
2+ ions bound to the organic linker, while the incorporated Ni exists in a metallic state. Moreover, the doping of Ni in the ZiF-8 was confirmed by EDS, as demonstrated by
Table 1.
2.4. Optical Properties and Band Gap Engineering
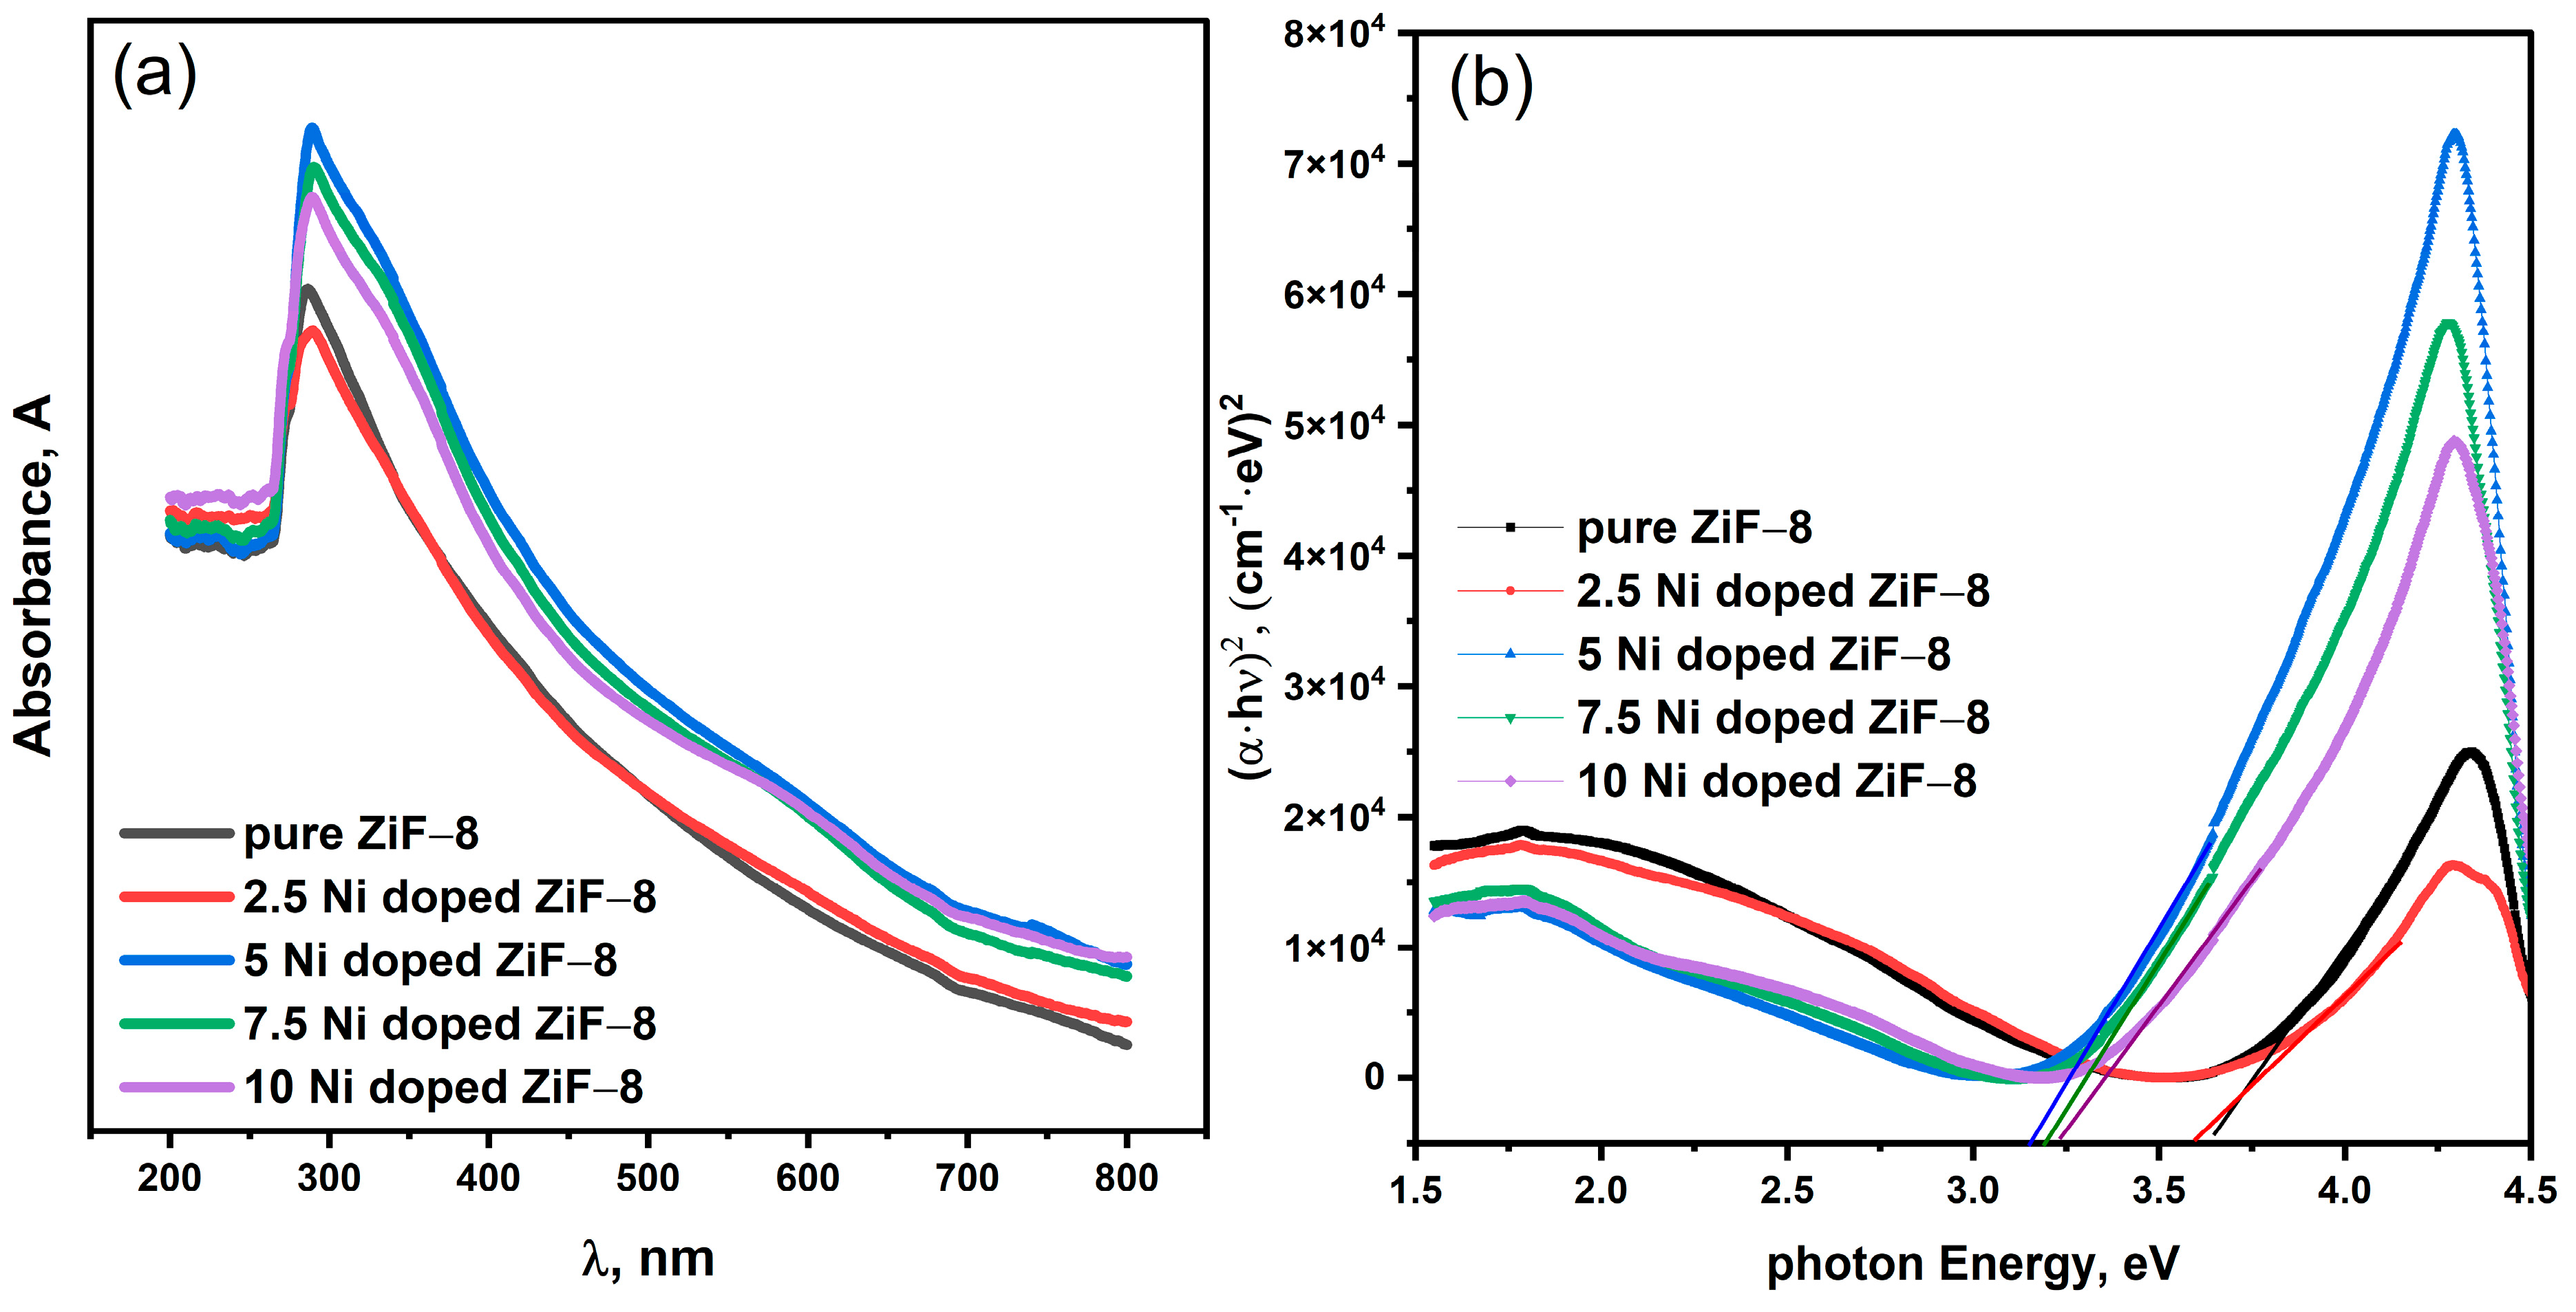
Figure 4a indicates the UV-Vis absorption spectra. The spectra illustrate that the doping of a ZIF-8 with nickel significantly enhances the light absorption of the material in the entire range. To illustrate, an addition of Ni also causes a red shift in the absorption edge (to longer wavelengths), indicating that the electronic structure of the material has changed. The band gaps corresponding to the band gaps used were determined by the Tauc plot method.
Figure 4b shows the Tauc plots assuming that ZIF-8 has a direct band gap transition (αhv)
2 against photon energy (hv). Ni incorporation presents a definite and consistent trend. As per its long-standing reputation as a UV-light-active substance, the crystal-clean ZIF-8 has a band gap of 3.65 eV.
However, the absorption edge is significantly and slowly redshifted when doped with Ni2+ ions. The calculated band gap energies in the case of Ni(2.5)-ZIF-8, Ni(5)-ZIF-8, Ni(7.5)-ZIF-8, and Ni(10)-ZIF-8 progressively decreased to 3.65 eV, namely, 3.58 eV, 3.14 eV, and finally to 3.23 eV with a corresponding increase in the number of Ni atoms in the composition. This continuous reduction in the band gap owes its existence to the successful incorporation of Ni2+ into the ZIF-8 structure. Ni added to ZIF-8 forms new electronic states within the first band-gate of ZIF-8. Namely, it is considered that the d-orbitals of Ni2+ reduce the energy needed to excite electrons in the valence band to the conduction band by giving impurity energy levels higher than the valence band. This effect indicates good band gap engineering by using transition metal doping.
The intentional and continuous decrease in the band gap as the concentration of Ni increases proves that ZIF-8 electronic structure can be fine-tuned. This reduction is of great use to photocatalysis, as it increases the light absorption of the material into the visible part of the solar spectrum, and significantly increases the chances of using it to catalyze solar energy in the process of photocatalytic reactions like the Evolution of hydrogen and degradation of pollutants. This non-monotonic trend is not an anomaly but rather a known phenomenon in heavily doped semiconductors, and we can explain it based on a primary factor:
The Burstein-Moss Effect: At lower doping levels, the incorporation of Ni2+ creates new impurity energy levels within the band gap, leading to a reduction in the effective band gap, as seen from ZIF-8 to Ni(7.5)-ZIF-8. However, at higher doping concentrations (10 mol%), the increased density of charge carriers (electrons) from Ni dopants begins to fill the available states at the bottom of the conduction band. This requires additional energy for electrons to be excited to higher energy states within the conduction band, effectively resulting in an observed widening of the optical band gap. This phenomenon, known as the Burstein-Moss effect, is often observed in heavily doped semiconductors and provides a consistent explanation for the increase in band gap at the highest doping level.
2.5. Photocatalytic Performance for Pollutant Degradation
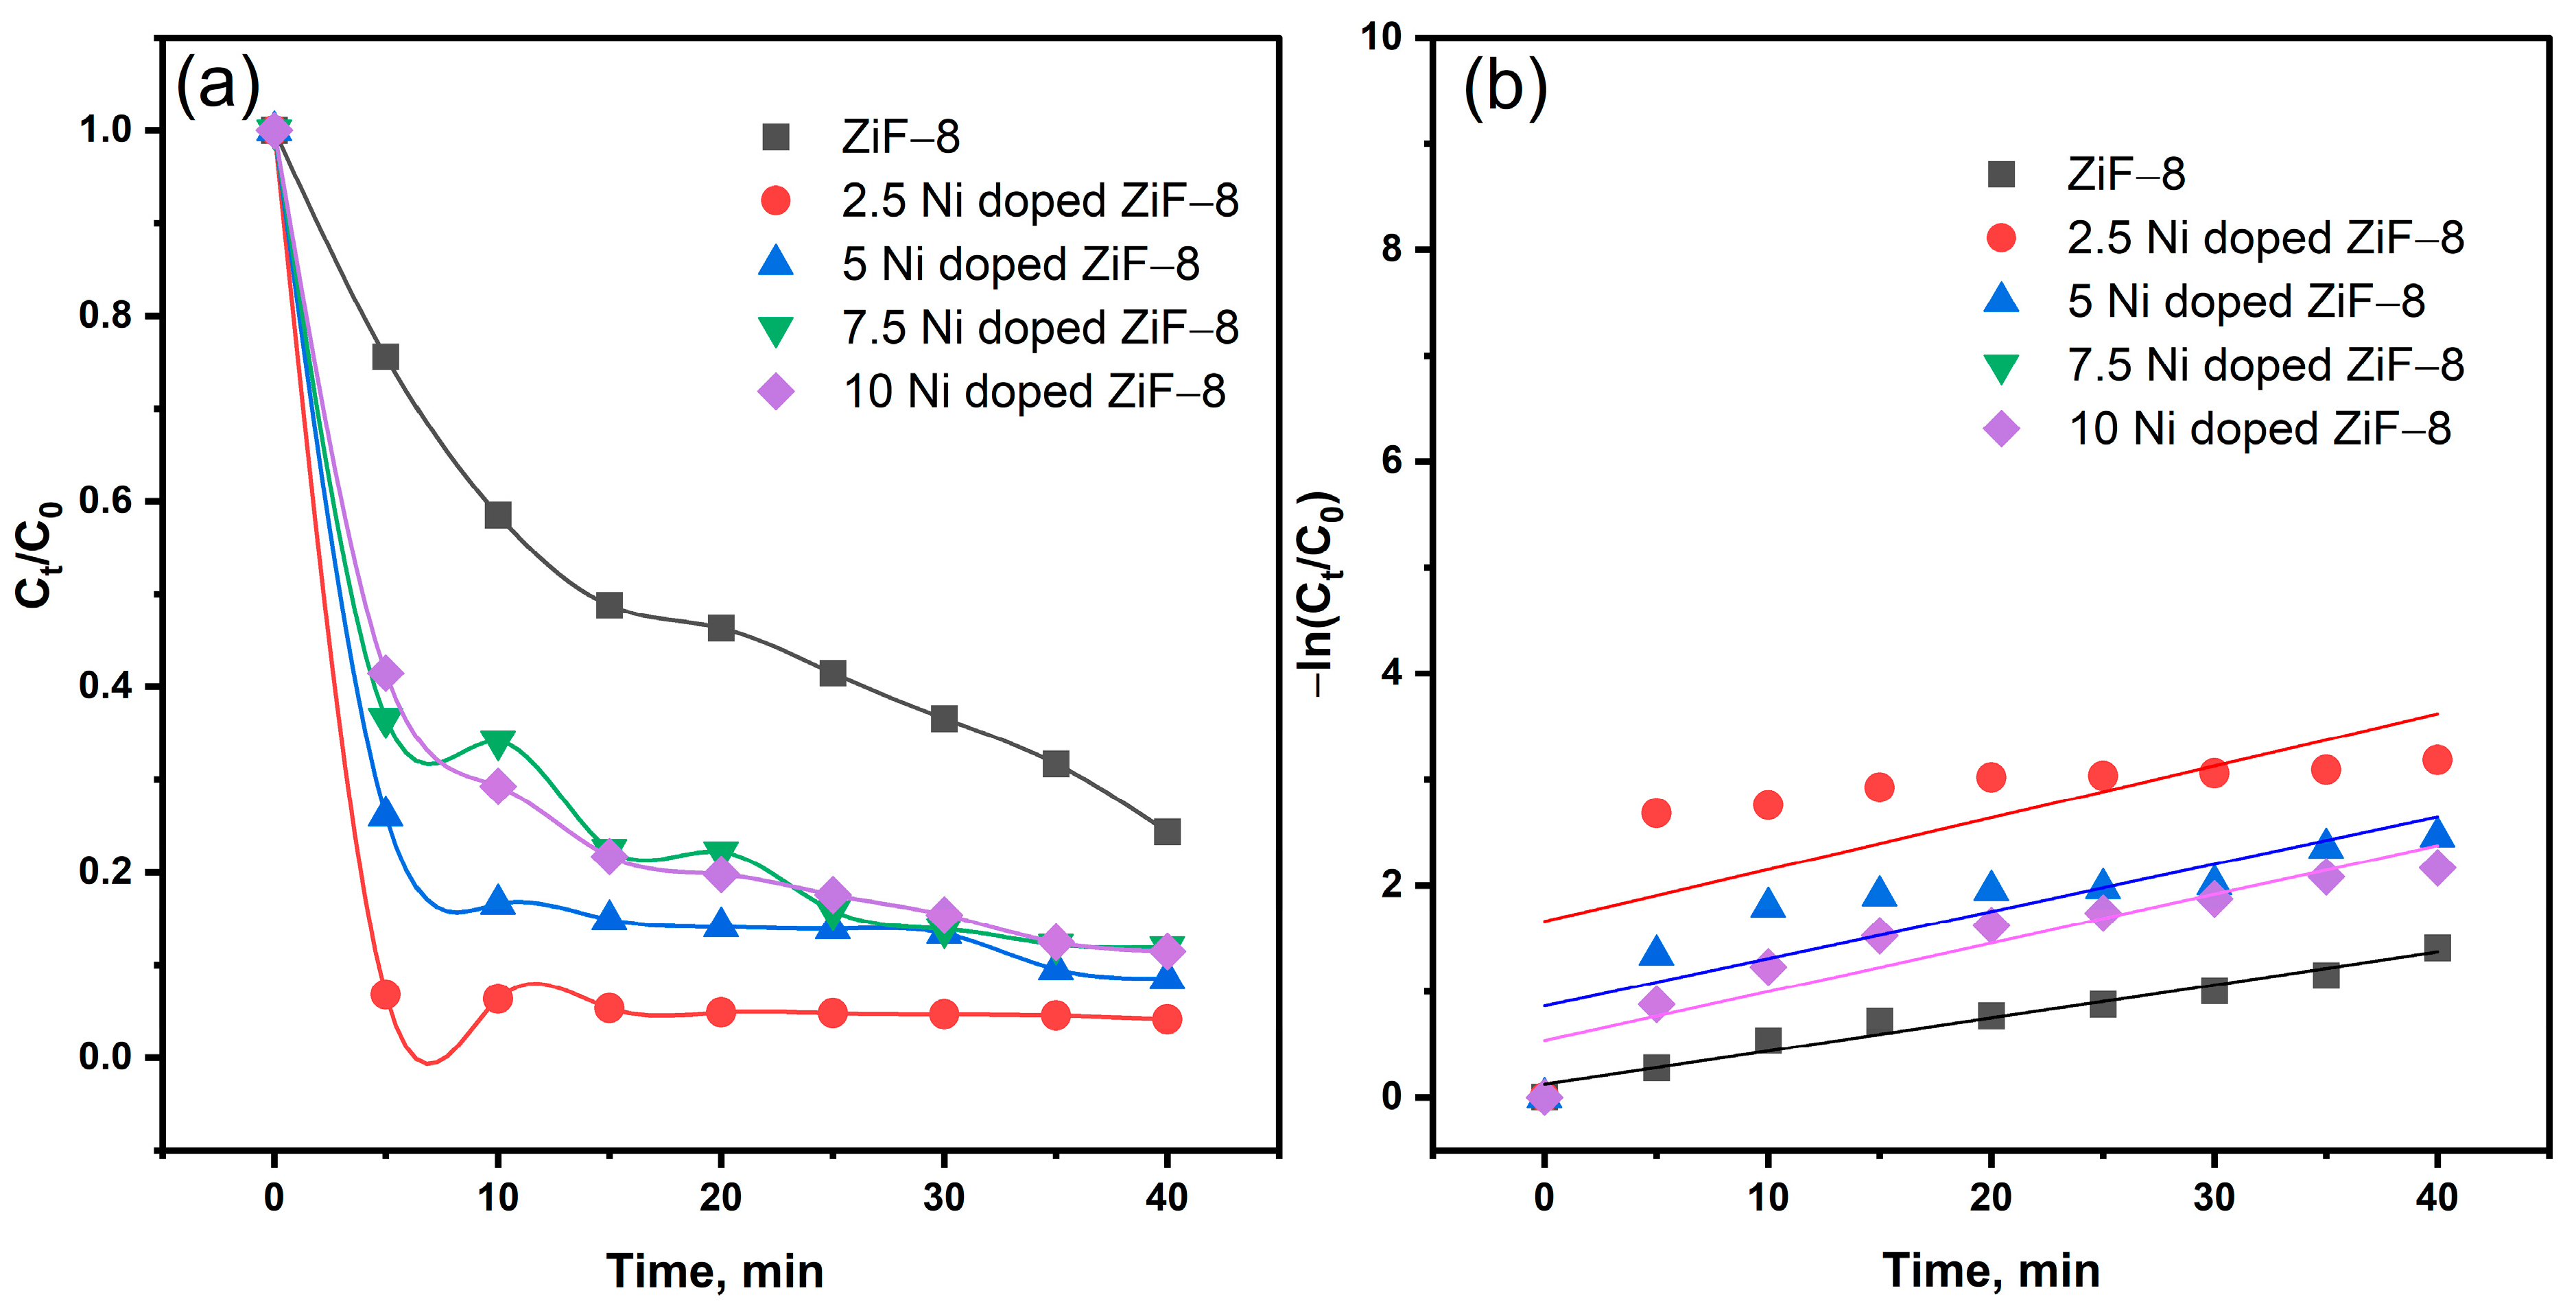
The photocatalytic activity of the virgin and Ni-doped ZIF-8 samples was evaluated by measuring the degradation of Methylene Blue (MB) under simulated sun irradiation. The temporal evolution of the relative MB concentration (C/C
0) as a function of irradiation time is depicted in
Figure 5a, where C
0 and C are the initial concentration and the concentration at time (t), respectively. The pristine and doped samples show a stark contrast in photocatalytic efficiency. Pristine ZIF-8 exhibits only modest activity, achieving a degradation efficiency of approximately 89% after 40 min, consistent with its large bandgap and rapid charge carrier recombination. In contrast, all Ni-doped ZIF-8 composites demonstrate significantly enhanced degradation rates, with the performance scaling directly with the Ni doping concentration. The Ni(2.5)-ZIF-8 photocatalyst is the most efficient, achieving 98.5% degradation within the same timeframe. The kinetic profiles clearly show a rapid decrease in MB concentration for the doped samples, especially within the first 40 min, following the order: Ni(2.5)-ZIF-8 > Ni(5)-ZIF-8 > Ni(10)-ZIF-8 > Ni(7.5)-ZIF-8 > ZIF-8, as shown in
Figure 6.
The photocatalytic degradation kinetics were analyzed using a first-order model, expressed as ln(Ct/C
0) = −kt, where C
0 and Ct represent the initial concentration and the concentration at time t, respectively, and k is the apparent rate constant. The value of k was determined from the slope of the linear regression of −ln(Ct/C
0) versus time. As illustrated in
Figure 5a,b, the calculated rate constants for all Ni-doped ZIF-8 catalysts significantly exceeded that of pure ZIF-8 for the degradation of methylene blue. The 2.5% Ni-doped ZIF-8 sample exhibited optimal performance, achieving a degradation efficiency of 98.5% compared to 89% for the pure material. Furthermore, as quantified in
Table 2, its kinetic constant was more than one and a half times greater than that of pure ZIF-8, confirming its superior photocatalytic activity.
Figure 6a shows that higher initial MB concentrations lead to lower decolorization percentages. This occurs because a more concentrated dye solution shortens the photon path length and blocks active sites on the Ni(2.5) doped-ZnF-8 photocatalyst. As a result, less ultraviolet light is absorbed, reducing the formation of electron–hole pairs and reactive radicals needed for degradation. This effect can cause up to a 15% drop in performance, indicating that the optimal initial MB concentration for this process is 10 ppm or less. Furthermore,
Figure 6b shows that the kinetic constant decreased from 0.53 to 0.33 k
−1 during the first 5 min as the MB concentration increased, and eventually fell to 0.013 k
−1.
2.6. Electrochemical Analysis and Charge Transfer Kinetics
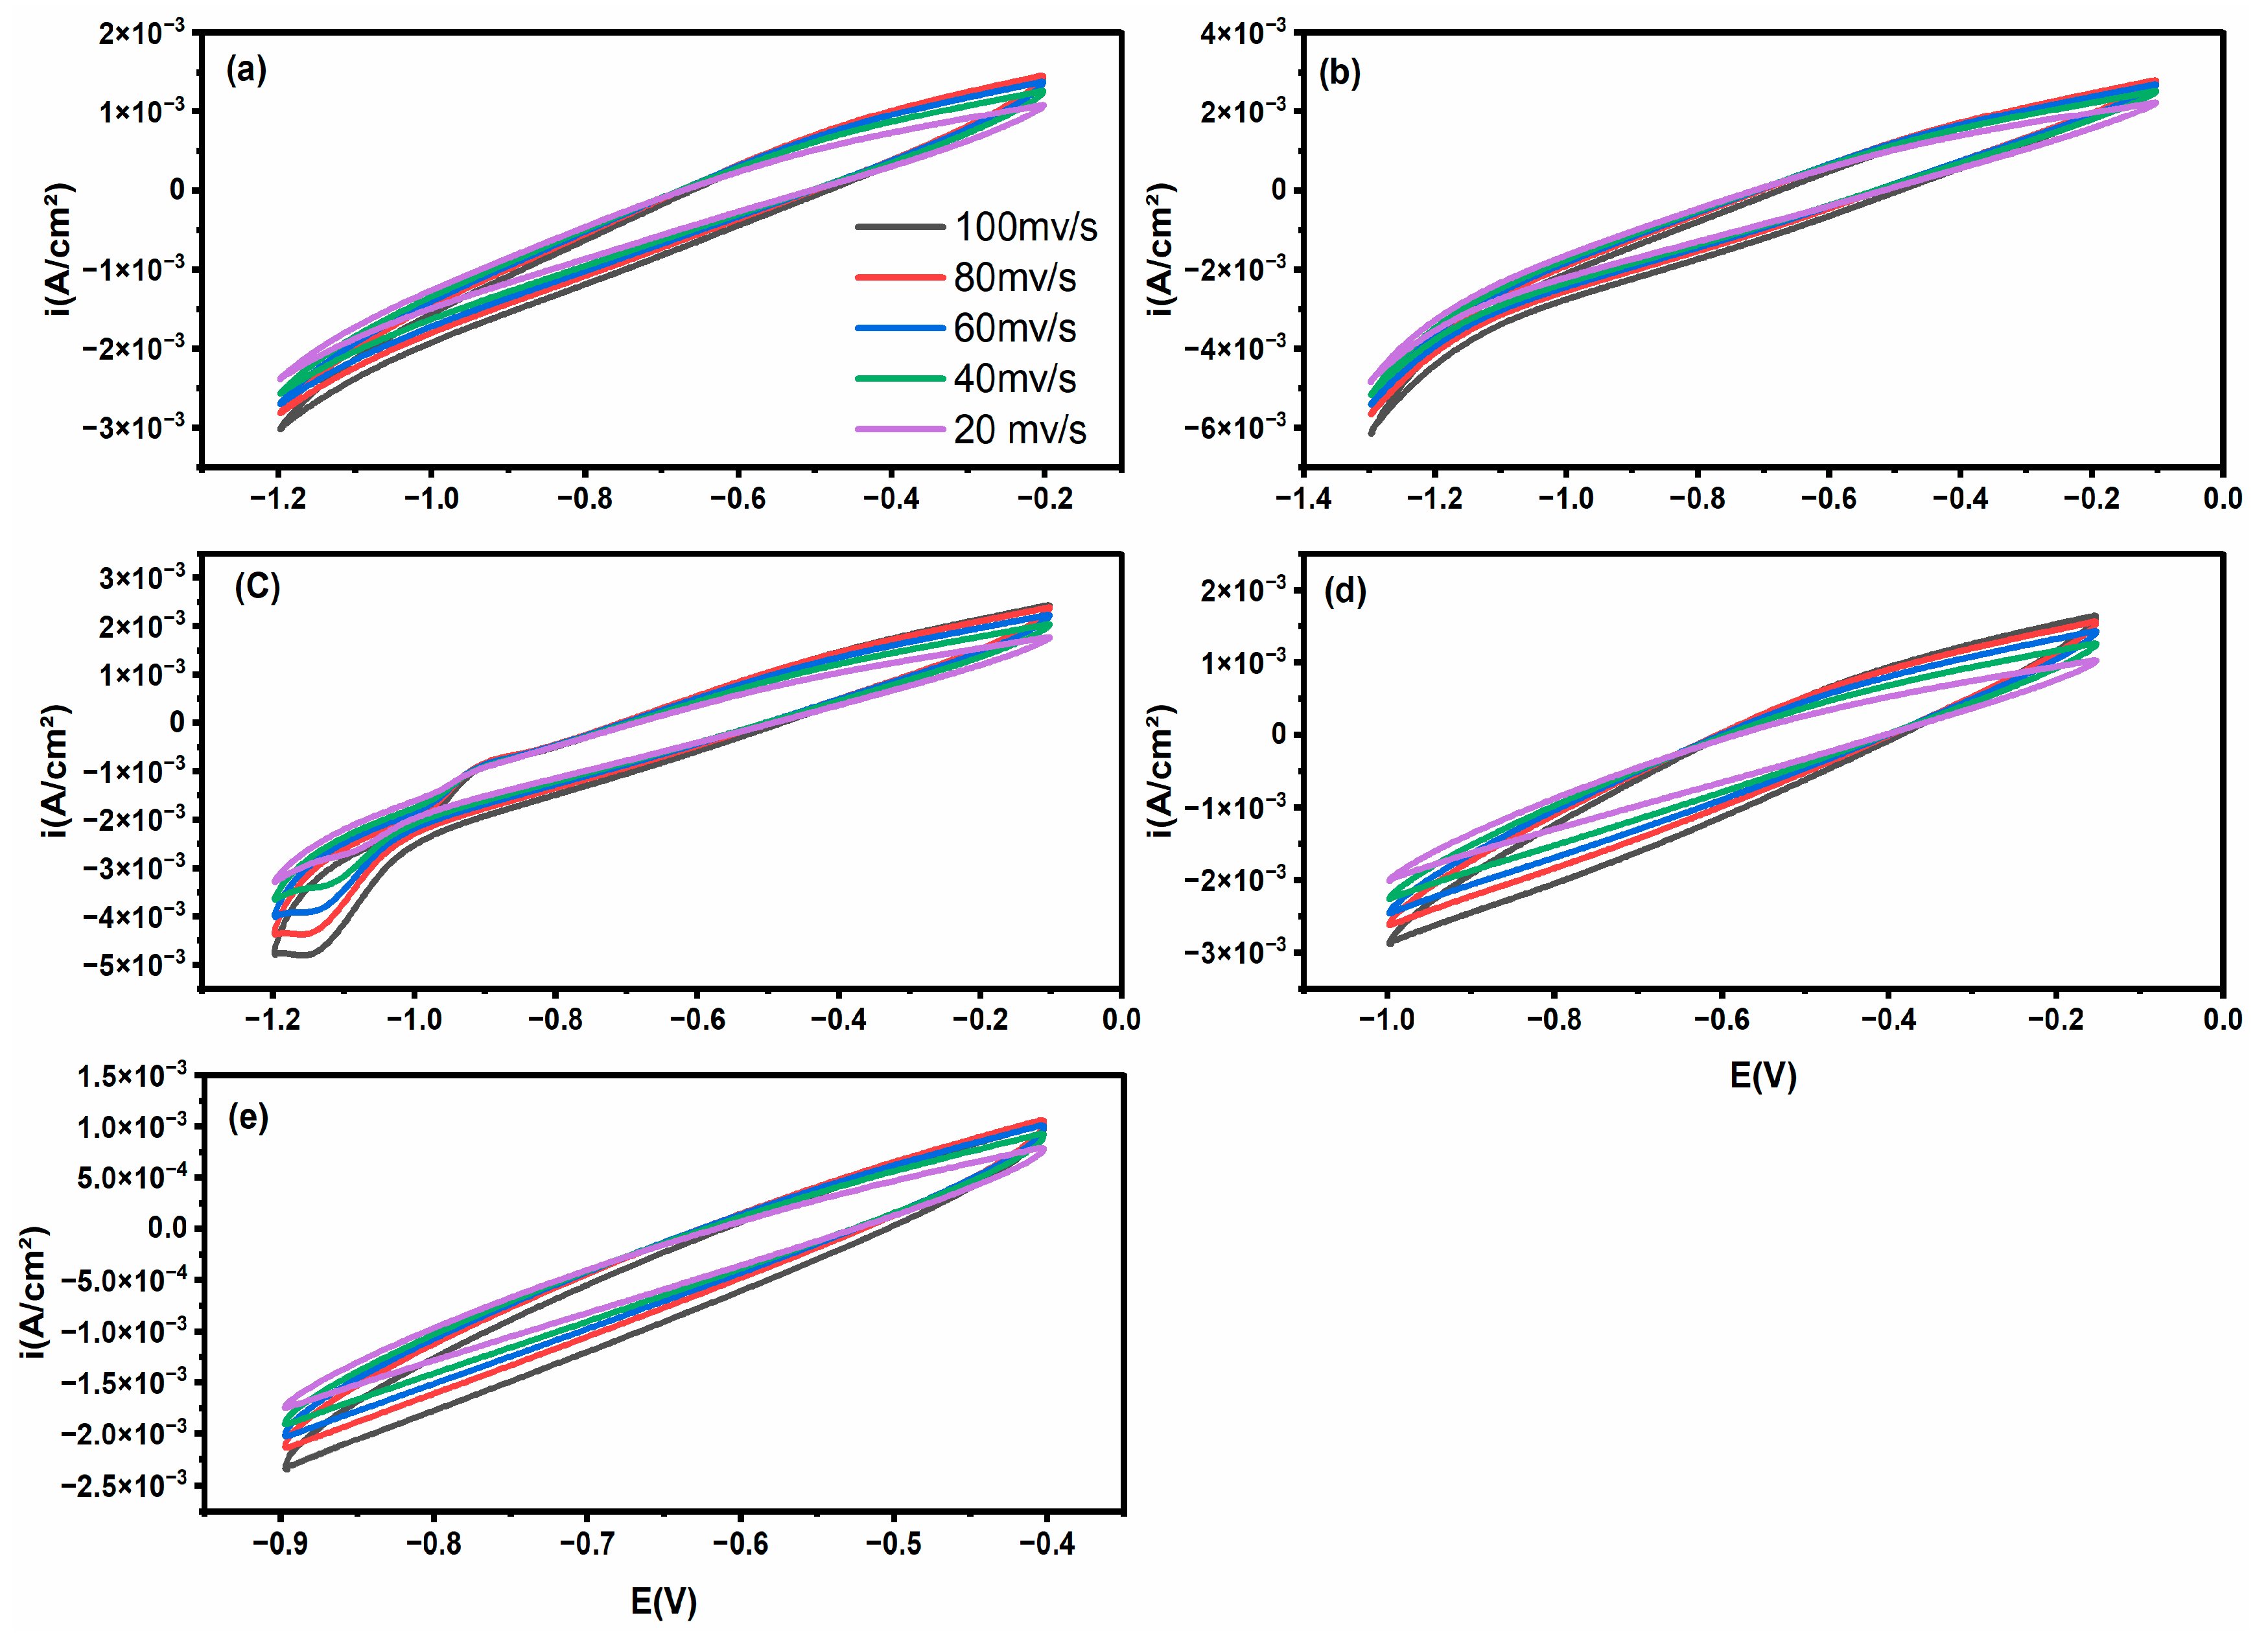
To describe the electrical conductivity and interfacial charge-transfer behaviour of the generated photocatalysts, cyclic voltammetry (CV) was carried out at various scan rates. The resulting voltammograms for pure ZIF-8 and particular Ni-doped ZIF-8 composites are shown in
Figure 7. Ni doping causes a noticeable change in the electrochemical response. Given its insulating properties and low photocatalytic activity, the pristine ZIF-8 (
Figure 7a) displays a CV curve with a minimal enclosed area, which is indicative of high electrical resistance and poor charge storage capacity. On the other hand, the Ni-doped samples (
Figure 7b–d) show a notable increase in the CV curve region and a sharp rise in the current density. This enhancement scales directly with the Ni doping concentration, following the order: Ni(10)-ZIF-8 > Ni(7.5)-ZIF-8 > Ni(5)-ZIF-8 > Ni(2.5)-ZIF-8 > ZIF-8. The CV shapes for the doped samples become more rectangular and exhibit increased current responses at the anodic and cathodic potentials, indicating a transition towards a more capacitive behaviour and the presence of Faradaic processes associated with the Ni
2+/Ni
3+ redox couple. The enhanced electrochemical performance of these modified materials is best illuminated by two crucial findings: Ni(10)-ZIF-8 exhibits a maximum current density that rises nearly tenfold above the pure ZIF-8 benchmark. This dramatic leap confirms a massive surge in charge-carrier density, thereby enabling far quicker charge transfer across the electrode–electrolyte interface. Also, the Ni-doped derivatives maintain their CV curve fidelity at aggressive scan rates (reaching 100 mV/s), a clear sign of their better charge propagation and strong electrochemical stability. This resilience suggests that Ni integration successfully forges highly efficient electronic superhighways within the ZIF-8 lattice, massively accelerating both ion diffusion and electron transport.
The charge separation and transport characteristics of ZIF-8 are significantly enhanced by Ni doping, as demonstrated by the electrochemical measurements. The significantly increased current density and capacitive behaviour correlate directly with the enhanced photocatalytic performance, as the more efficient charge transfer kinetics drastically reduce electron–hole recombination, thereby making more photogenerated charges available for surface redox reactions such as hydrogen evolution and dye degradation.
2.7. Hydrogen Evolution Reaction (Her) Electrocatalytic Activity
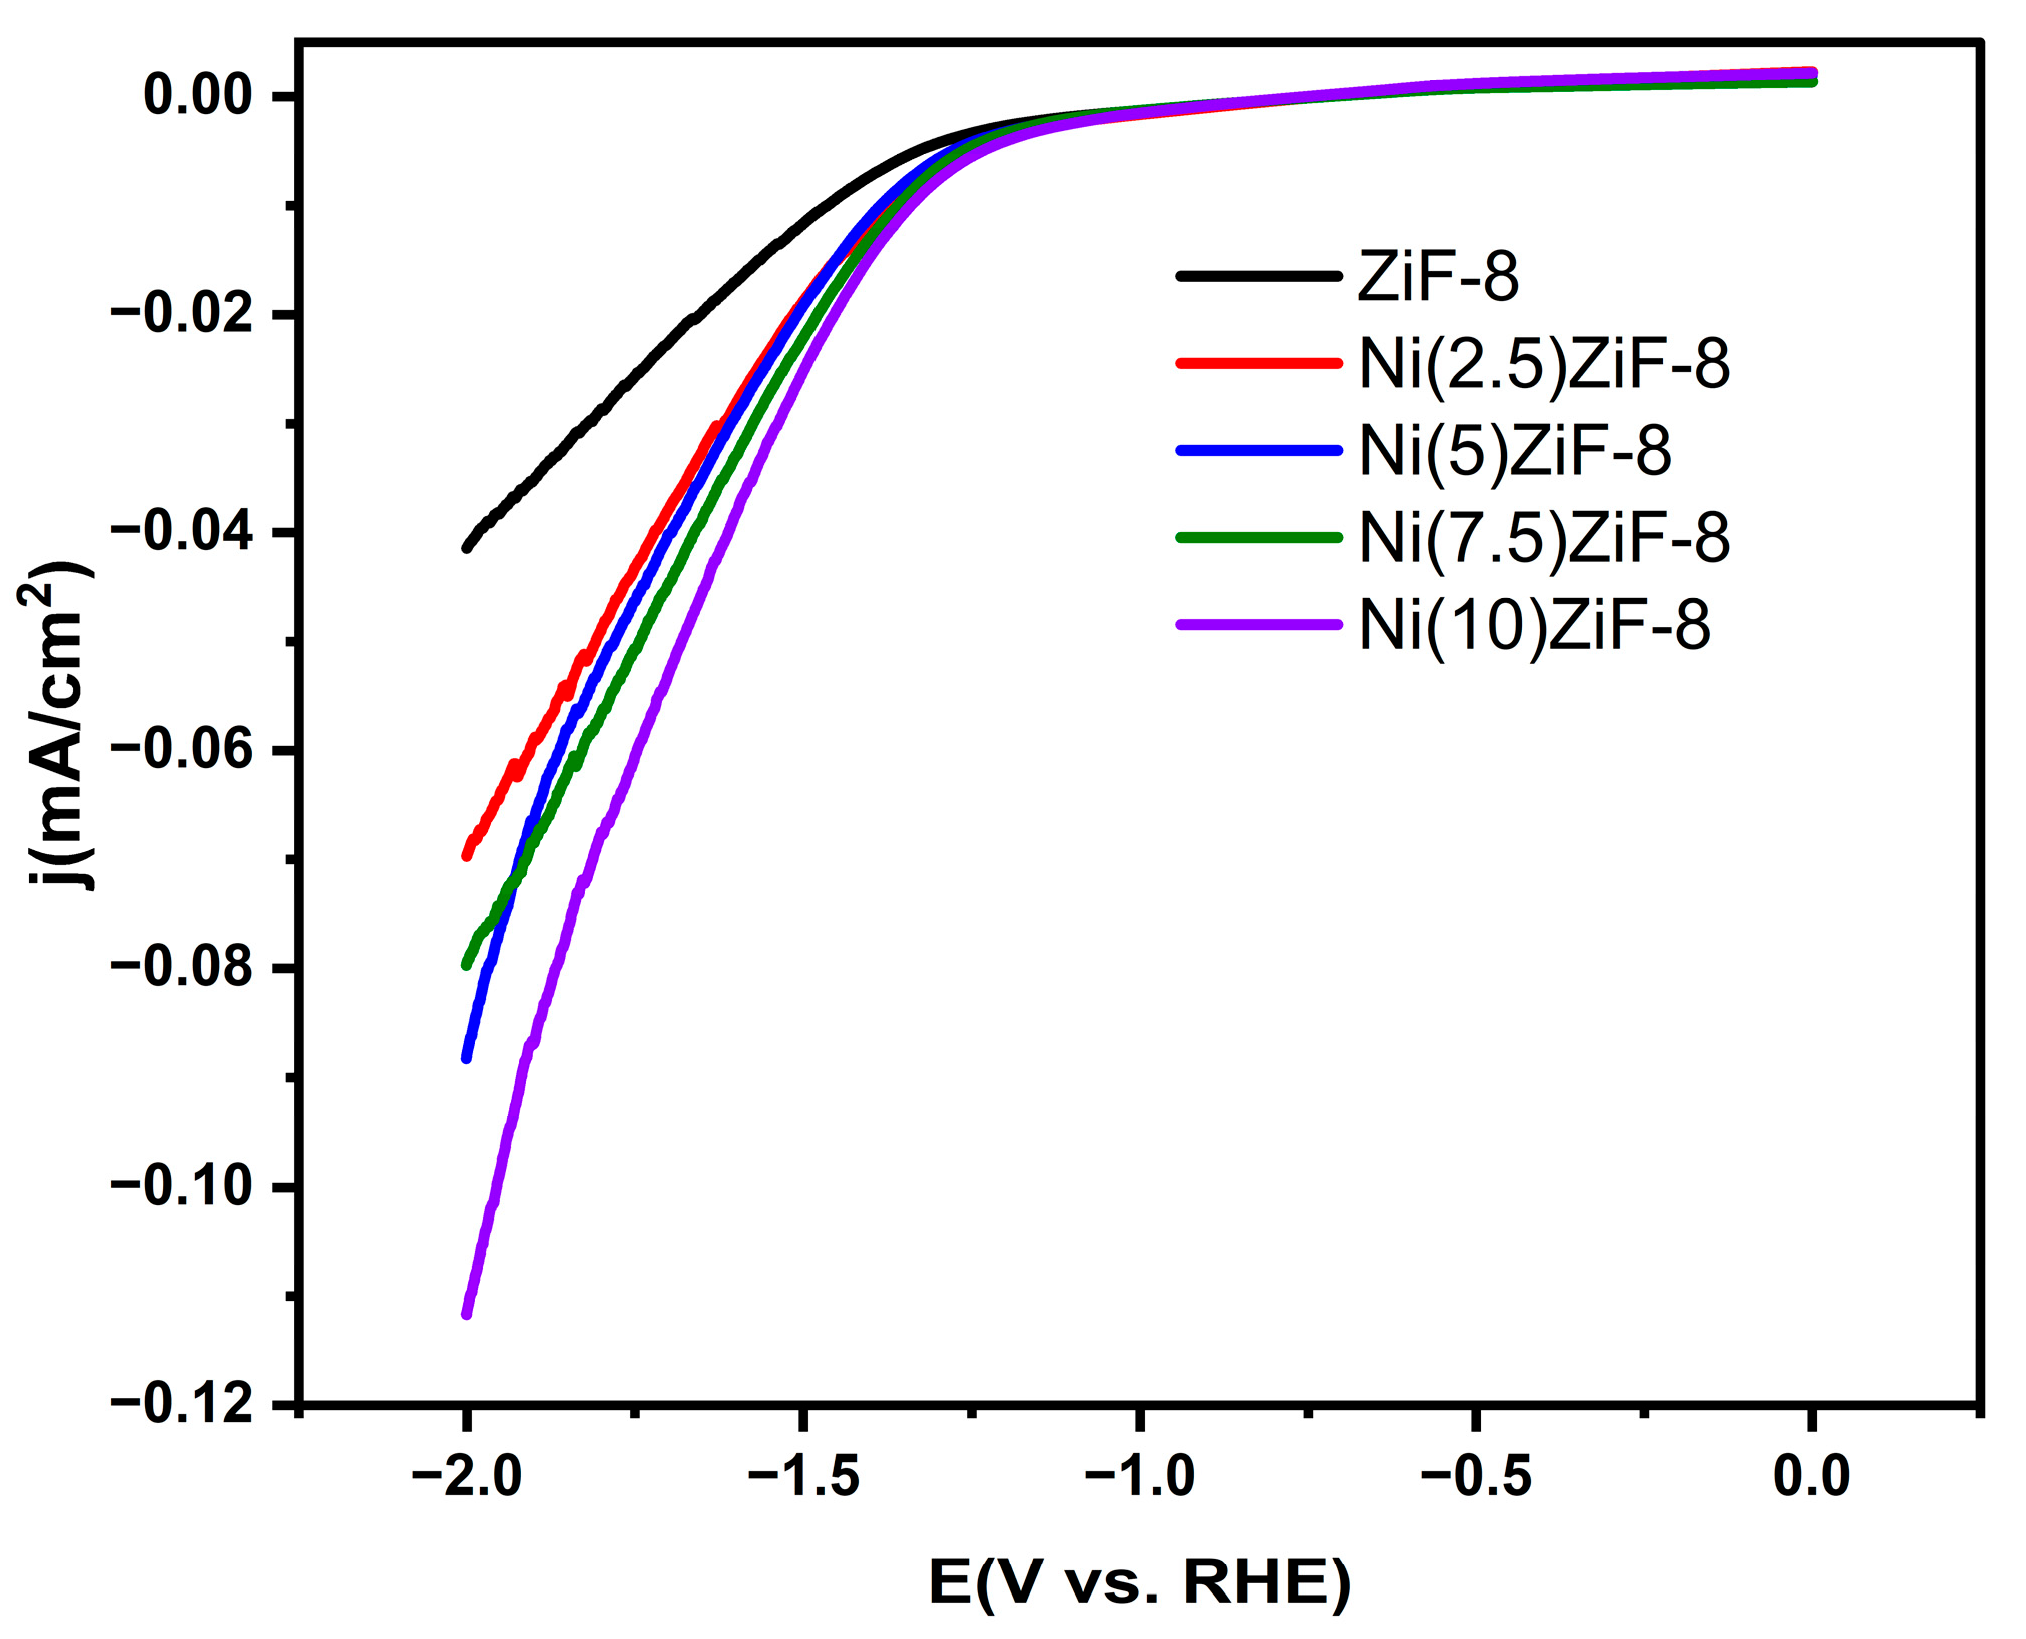
Linear sweep voltammetry (LSV) measurements were performed to assess the synthesized materials’ electrocatalytic performance. The polarization curves that result are shown in
Figure 8, where the current density is normalized to the electrode’s geometric surface area. The addition of nickel (Ni) to the ZIF-8 framework shows a distinct trend. The pristine ZiF-8 sample has the lowest current density and the most positive onset potential, indicating poor activity. Ni doping greatly increases the electrocatalytic activity. A systematic negative shift in the polarization curves indicates that the performance gradually improves as the Ni content rises. With the highest current density at a given potential and the most negative onset potential among the series, the Ni(10) ZiF-8 catalyst exhibits the most advantageous kinetics. This suggests that Ni doping efficiently modifies ZiF-8’s electronic structure, resulting in highly active sites that promote the hydrogen evolution reaction (HER).
These LSV results provide direct electrochemical evidence that Ni doping successfully transforms the inert ZIF-8 framework into an active electrocatalyst for hydrogen generation. The superior performance of Ni(10)-ZIF-8 in this electrochemical assay strongly corroborates its outstanding photocatalytic hydrogen evolution activity, verifying its potential as an extremely effective, non-precious metal-based catalyst for solar-driven hydrogen production.
2.8. Separation Efficiency and Charge Transfer Resistance (Rct)
The separation efficiency and R
ct of photogenerated electron–hole pairs in the pure and Ni-doped ZIF-8 samples were examined using Electrochemical Impedance Spectroscopy (EIS).
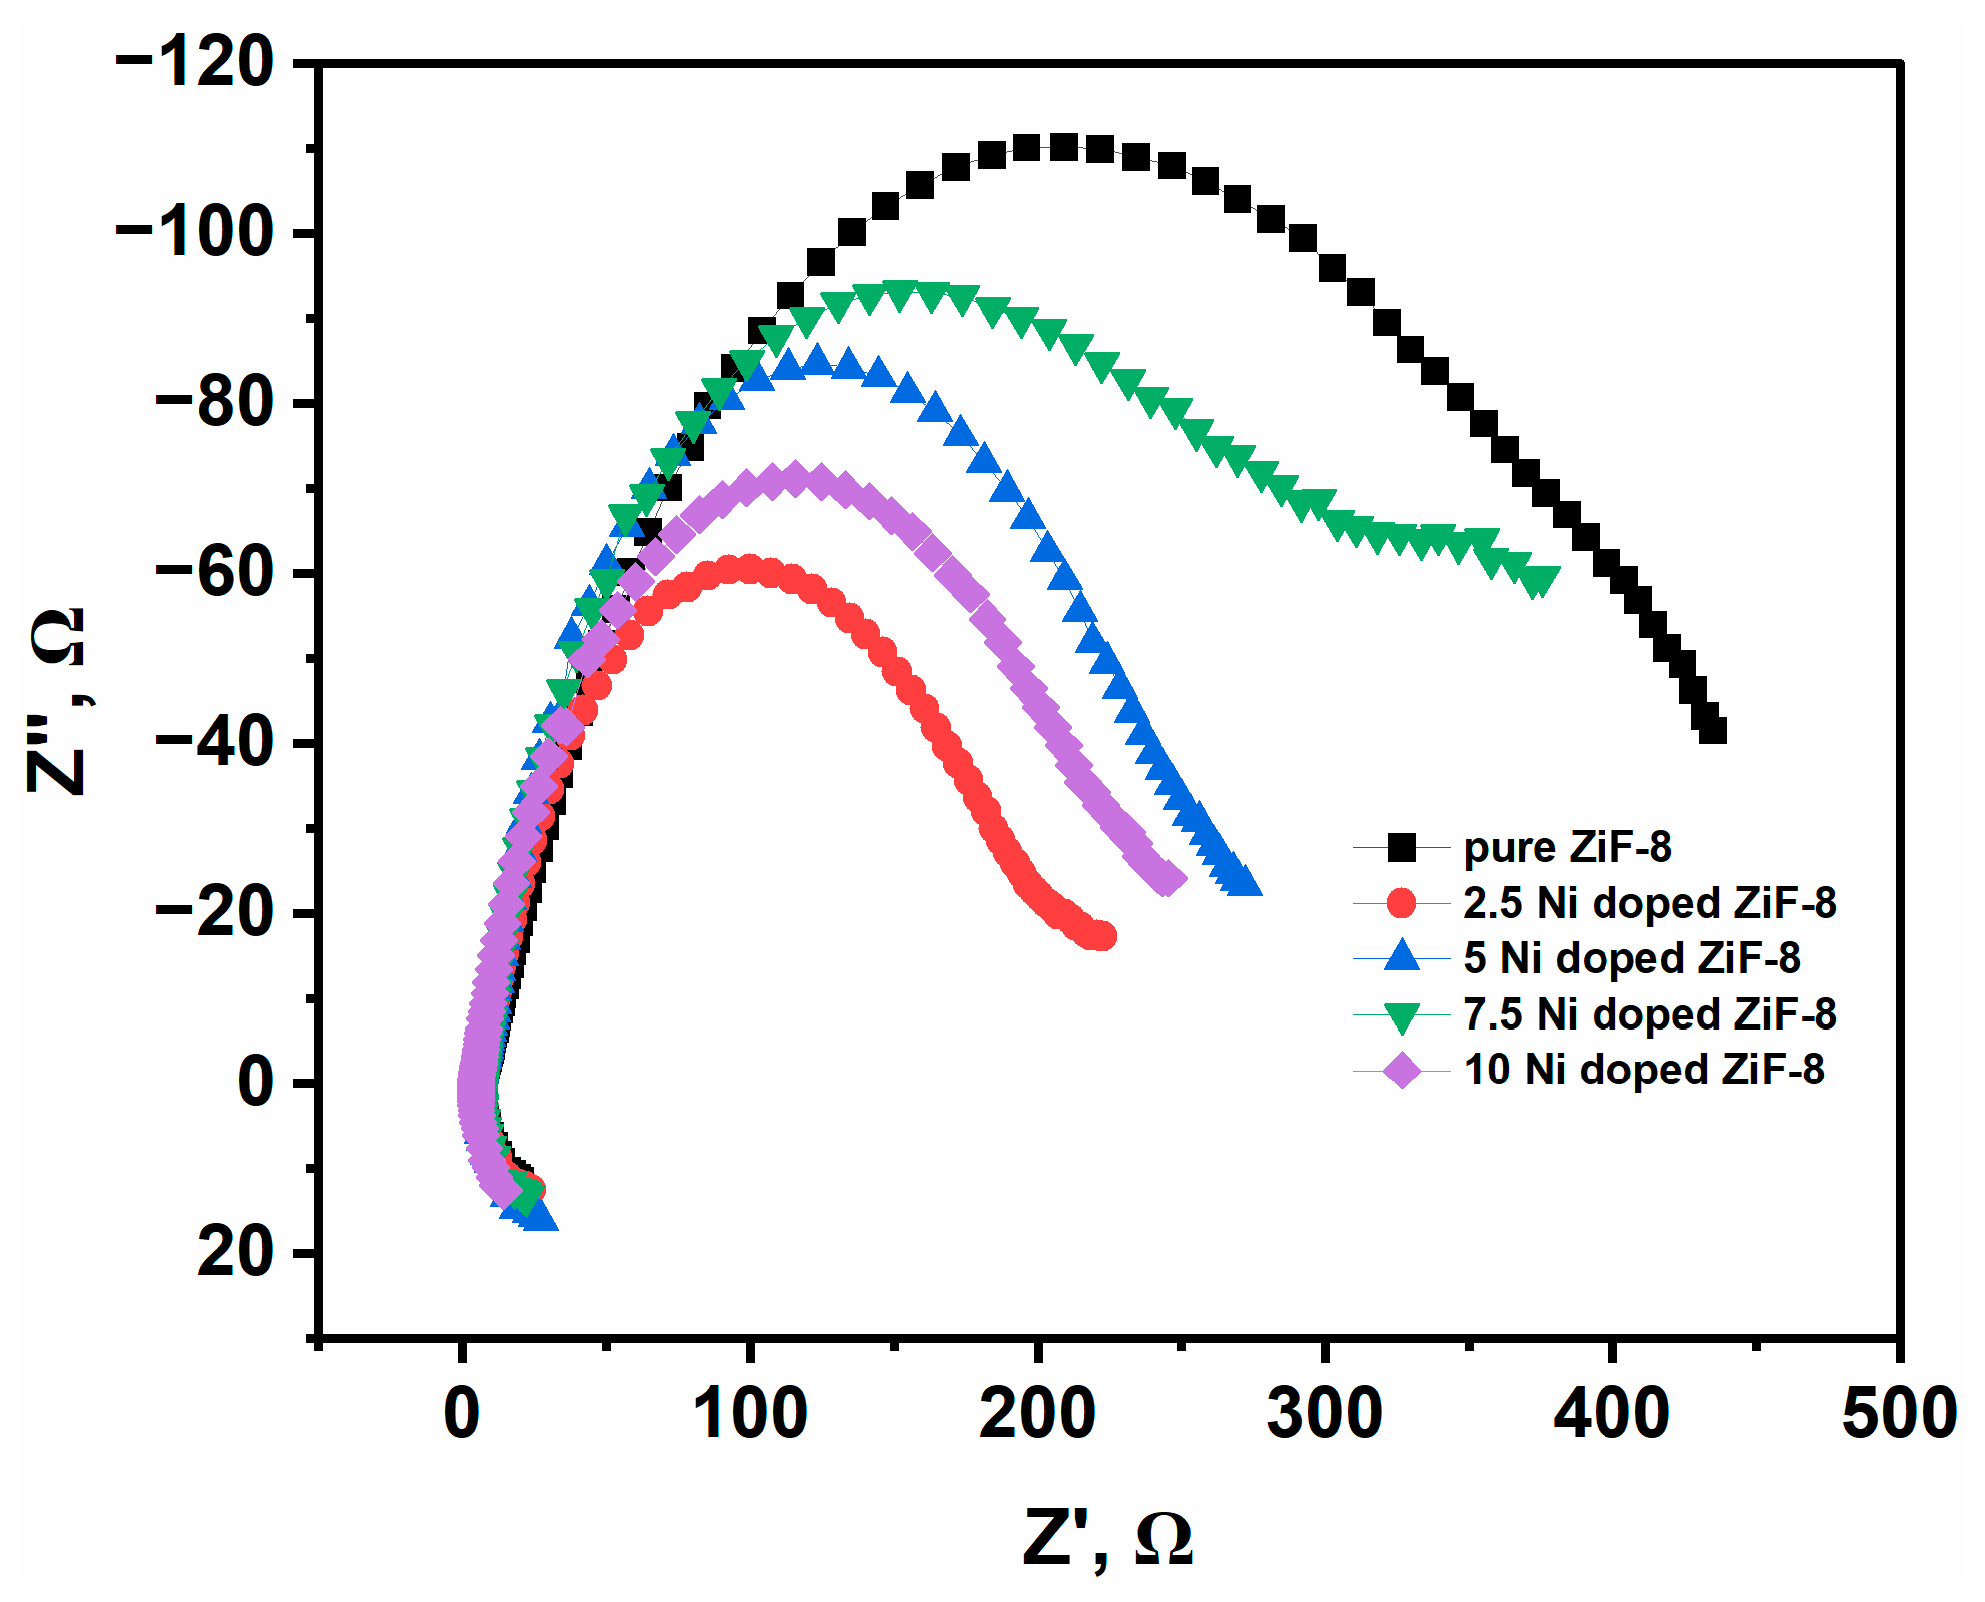
Figure 9 shows the obtained Nyquist plots. The EIS data reveal a profound and systematic
reduction in the values of R
ct with Ni doping. The Nyquist plot for pristine ZIF-8 exhibits a large, depressed semicircle, suggesting that the electrode–electrolyte contact has a
decreased charge transfer resistance (R
ct). This high resistance is key to the charge carriers’ quick recombination and the pure material’s low photocatalytic activity. In contrast, the incorporation of Ni
2+ ions drastically improves the electrical transport properties. A systematic decrease in the diameter of the semicircular arc is noticed with increasing Ni doping concentration, following the order: ZIF-8 > Ni(7.5)-ZIF-8 > Ni(5)-ZIF-8 > Ni(10)-ZIF-8 > Ni(2.5)-ZIF-8. The Ni(2.5)-ZIF-8 sample displays the smallest semicircle diameter, signifying the lowest R
ct of all the tested materials.
Essentially, the electrochemical data demonstrate that integration significantly increases the total photocatalytic capacity by acting as a potent electronic enhancer. Within the lattice, the ions form superior electronic conduits that lead directly to conductivity and a smooth charge current. Moreover, a dramatic acceleration of the charge exchange kinetics at the catalyst–solution interface is shown by the steep drop in charge-transfer resistance (Rct). A larger population of carriers is available to drive the intended reactions thanks to this optimized charge mobility, which drastically reduces electron–hole recombination. The observed order is indeed a key finding, and we apologize for the lack of a clear explanation in the original manuscript. This non-monotonic trend is not a contradiction but a nuanced result that provides deeper insight into the competing effects of Ni doping.
We propose that two primary factors are at play, which shift in their dominance at different doping levels:
Creation of Conductive Pathways vs. Structural Disorder: At low to moderate doping levels (2.5 to 7.5 mol%), Ni2+ ions primarily act as isolated dopants, creating new charge transfer pathways and reducing Rct compared to pristine ZIF-8. However, as the doping concentration increases to 5 and 7.5 mol%, the significant lattice strain and microstrain (as confirmed by our XRD analysis) begin to introduce more structural disorder and defect sites. These defects can act as trapping sites for charge carriers, slightly increasing the charge transfer resistance compared to the lightly doped Ni(2.5)-ZIF-8 sample.
2.9. Mottshotcky Description
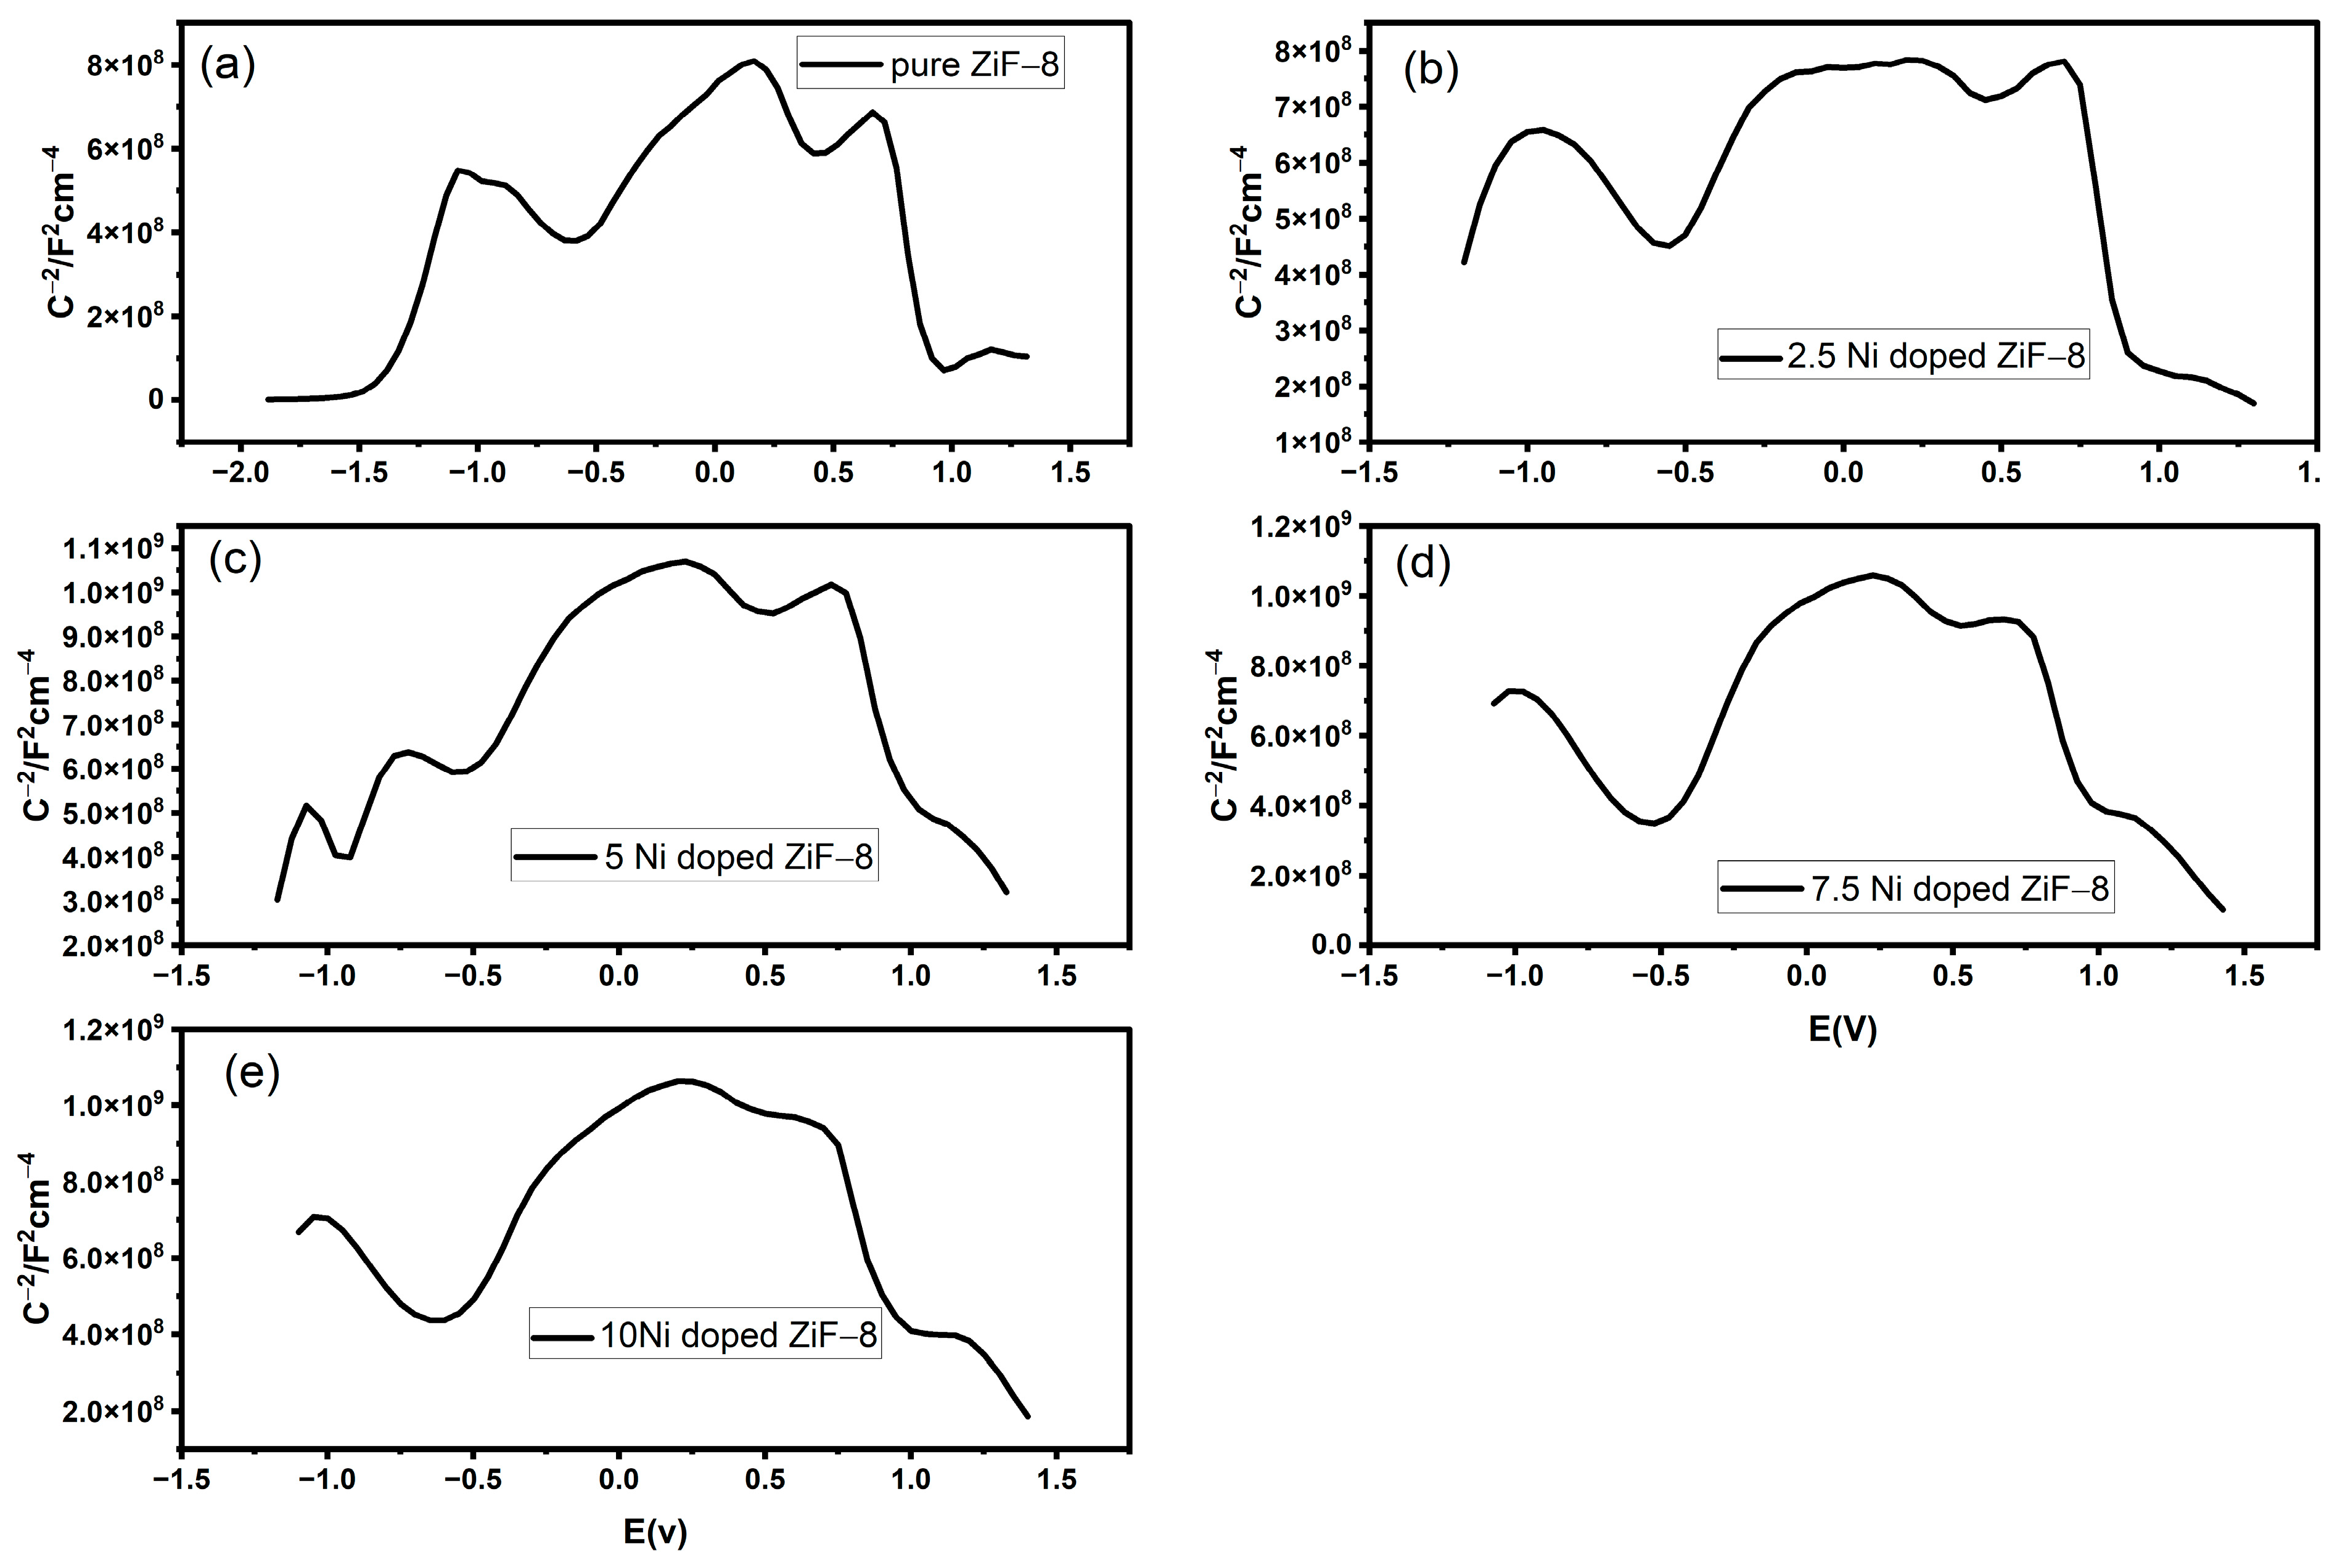
Figure 10a–e shows the Mott–Schottky graphs of pure ZIF-8 and different Ni-doped ZIF-8 materials. A Mott–Schottky study identifies the basic electronic characteristics of a semiconductor using the electrochemical impedance data.
Table 3 provides an electronic description of the recorded variations in the material performance. The versus plots, including the doped forms of these materials, show a positive slope in the C
−2 vs. E plot, validating their essential nature as n-type semiconductors. The significant charge carriers are electrons, which are required during the reduction in photocatalytic. Notably, nickel doping always changes the electrical properties: the Flat-Band Potential (Efb), which is a close estimate of the conduction band edge, is reported to be shifted considerably in
Table 2. This change is especially evident in the 2.5% Ni-doped sample (between −1.388 V of pure ZIF-8 and −0.947 V), indicating that tuning of the band alignment is favourable. Also, 2.5 percent of the Ni-doped sample bears the largest value (ND) (1.06 × 10
22 cm
−3) as the slope of the plot is the opposite of the Donor Concentration (ND). It is this greatly increased concentration of available charge carriers that is the direct electronic mechanism that enhances conductivity, charge separation, and ultimately the high photocatalytic activity of the 2.5% Ni-ZIF-8 material.
3. Experimental Technique
3.1. Materials
All of the compounds were analytical grade and did not require any additional purification. Zinc nitrate hexahydrate (Zn(NO3)2·6H2O, ≥99%), Nickel chloride hexahydrate (NiCl2·6H2O, ≥99%), and 2-Methylimidazole (2-MIm, ≥99%) were supplied from Sigma-Aldrich. Methanol (CH3OH, ≥99.8%) and Triethylamine (TEA, ≥99%) were obtained from Merck. Deionized water (DIW) (18.2 MΩ·cm) was used throughout the synthesis and washing processes. For photocatalytic tests, Methylene Blue (MB, ≥99%) was used, and for hydrogen evolution, a sacrificial agent solution containing 0.35 M Sodium Sulphide (Na2S, ≥99%) and 0.25 M Sodium Sulfite (Na2SO3, ≥99%) was prepared.
3.2. Pristine Zif-8 Synthesis
Pristine ZIF-8 was synthesized via a facile room-temperature method with slight modifications to reported procedures. In a typical synthesis, 1.488 g (5 mmol) of Zn(NO
3)
2·6H
2O was solubilized in 15 mL of DIW (Solution A). Separately, 4.428 g (54 mmol) of 2-Methylimidazole was dissolved in a mixture of 15 mL DIW and 7.8 mL TEA, which acts as a deprotonating agent (Solution B). After that, Solution B was quickly added to Solution A while vigorously stirring. After two hours of constant stirring, the mixture matured for twenty-four hours at room temperature without any disruption. After centrifugation, the white precipitate was collected, cleaned three times with DIW and twice with methanol to remove any unreacted species, and then dried in an oven set to 60 °C for the entire night [
27,
28].
3.3. Preparation of Ni-Doped Zif-8 (Ni-Zif-8)
A similar one-pot co-precipitation technique was used to create Ni-ZIF-8 composites by altering the molar ratio of Ni to Zn. The total molar amount of metal ions (Zn2+ + Ni2+) was kept constant at 5 mmol. Specifically, for Nix-ZIF-8 synthesis (where x represents the nominal molar percentage of Ni), appropriate amounts of Zn(NO3)2·6H2O and NiCl2·6H2O have been dissolved in 15 mL DIW. The molar ratios of Zn:Ni were 97.5%:2.5%, 95%:5%, and 90%:10%, corresponding to Ni(2.5)-ZIF-8, Ni(5)-ZIF-8, and Ni(10)-ZIF-8, respectively. The ligand solution was prepared identically to the pristine ZIF-8 synthesis. The subsequent mixing, stirring, ageing, washing, and drying procedures were identical to those described for pristine ZIF-8. The samples were pale purple, with the intensity deepening with increasing Ni content.
3.4. Characterization
The phase purity and crystallinity of the synthesized materials have been examined by XRD using a Bruker D8 Advance diffractometer (Billerica, MA, USA) with Cu Kα radiation (λ = 1.5418 Å). Data were collected in the 2θ range of 5° to 50° with a step size of 0.02°. The FT-IR has been used to analyze the functional groups and chemical bonding on a Shimadzu IR Spirit spectrometer (Kyoto, Japan) using the ATR mode in the wavenumber range of 4000–500 cm−1. Scanning Electron Microscopy (SEM) and Energy-Dispersive X-ray Spectroscopy (EDS) mapping on a JEOL JEM-2100F (Tokyo, Japan) microscope running at 200 kV were used to examine the morphological characteristics, particle size, and elemental distribution. Samples were prepared by drop-casting a dilute ethanol dispersion of the powder onto a carbon-coated copper grid. The optical properties were studied using a UV-Vis Spectrophotometer (Jasco V-670 (Tokyo, Japan)) equipped with an integrating sphere. The bandgap energies (Eg) were estimated from the resulting spectra using the Tauc plot method. The electrochemical properties, including Cyclic Voltammetry (CV) and Mott–Schottky analysis, were measured on a Corrtest CS 305 potentiostat (Wuhan, China)using a standard three-electrode system. The working electrode was prepared by drop-coating a catalyst ink (2 mg of photocatalyst in 1 mL of ethanol with 50 µL of chetsioan) onto a 1 × 1 cm2 Fluorine-doped Tin Oxide (FTO) glass. A Pt wire and an SCE (sat. KCl) electrode were used as the counter and reference electrodes, respectively. A 0.5 M Na2SO4 aqueous solution (pH ~ 6.8) was used as the electrolyte. Mott–Schottky plots were generated at a fixed frequency of 1 kHz in the dark to determine the flat-band potential and semiconductor type.
3.5. Photocatalytic Hydrogen Evolution
A 100 mL sealed Pyrex reactor coupled to a closed-gas circulation system was used to conduct the photocatalytic hydrogen evolution reaction. In a standard test, 80 mL of an aqueous solution containing 0.5 M Na2SO4 as a sacrificial agent was mixed with 20 mg of the photocatalyst. The system was evacuated for 30 min to remove dissolved air before irradiation. A 500 W Xenon lamp with an AM 1.5G filter was used as a simulated solar light source.


