Article

Selective Ammoxidation of Methanol to Hydrogen Cyanide over Silica-Supported FeMo Oxide Catalysts: Experiments and Kinetic Modeling

1
Department of Chemical Engineering, China University of Petroleum Huadong, Qingdao 266580, China
2
Qingdao PTK Chemical Co., Ltd., Qingdao 266400, China
*
Author to whom correspondence should be addressed.
Catalysts 2025, 15(11), 1004; https://doi.org/10.3390/catal15111004
Submission received: 26 September 2025 / Revised: 16 October 2025 / Accepted: 18 October 2025 / Published: 22 October 2025
(This article belongs to the Section Catalytic Materials)

Abstract

We investigated the ammoxidation of methanol for the production of hydrogen cyanide. Silica-supported FeMo oxide catalysts achieved above 98% conversion of methanol, with more than 90% selectivity for the ammoxidation reaction product, HCN. The oxidation products, CO and CO2, were formed with a molar selectivity less than 10%, depending on the operating conditions. The kinetics of the ammoxidation of methanol were investigated in a fixed-bed tubular reactor at 320–445 °C and atmospheric pressure. A Mars–van Krevelen model accounted for the ammoxidation of methanol as well as the formation of CO and CO2. The Levenberg–Marquardt algorithm was used to estimate the model parameters, which were statistically significant and fit the experimental data well. The model can be used to simulate and guide the operation of the industrial reactor.

1. Introduction

Hydrogen cyanide is commonly utilized in the synthesis of numerous industrially critical bulk chemicals, such as adiponitrile, methyl methacrylate, herbicide, chelating agents and various fine and specialty chemicals. Commercial production of HCN primarily includes the Andrussow process, the by-product from acrylonitrile manufacture, and the Degussa process, with the Andrussow process accounting for more than 70% of global hydrogen cyanide production capacity [1].
The Andrussow process produces hydrogen cyanide by the ammoxidation of methane on a Pt/Rh gauze catalyst at roughly 1100 °C [2]. The plentiful natural gas resources in North America made this technique dominant. More recently, it has been shown that hydrogen cyanide can be produced in large yields by the ammoxidation of methanol on mixed oxide catalysts [3,4,5,6,7]. In addition to hydrogen cyanide as the major product, only small quantities of carbon monoxide and carbon dioxide gas are formed. For example, Sasaki reported [3] an FeSb oxide catalyst for application in the vapor-phase catalytic ammoxidation of methanol. Hydrogen cyanide was obtained in a high yield from a mixture of methanol, oxygen and ammonia on a metal oxide catalyst comprising iron, copper, antimony and phosphorus as key components. Y. Wu examined catalytic active components of an FeMo catalyst for methanol ammoxidation to HCN in a boiling bed reactor. The investigation revealed that iron and molybdenum were present in the catalyst as Fe2(MoO4)3, α-Fe2O3 and MoO3, with Fe2(MoO4)3 and α-Fe2O3 acting synergistically to promote the selective ammoxidation reaction [4]. N. Koryabkina reported the ammoxidation of methanol to produce hydrogen cyanide using a MnP catalyst, achieving an 89% HCN yield at complete methanol conversion [5].
The generation of hydrogen cyanide by the ammoxidation of methanol offers various benefits over the conventionally employed Andrussow process. First, the reaction temperature is relatively modest, in the region of 400–500 °C. Second, toxic nitrogen oxides are not produced, and the denitrification of vent gas is therefore unnecessary, making this method more environmentally friendly. Third, the method is cost-effective, as high HCN yields can be achieved using non-noble metal catalysts. In addition, methanol is easily obtained in places where natural gas resources and transportation infrastructures are limited. With the rapid expansion of methanol production capacity, its cost has decreased considerably, making HCN generation via methanol ammoxidation increasingly competitive.
Previous studies have primarily focused on the screening of catalysts and reaction conditions [6,7]. From a process design perspective, however, a rigorous kinetic model is essential. In the present study, the ammoxidation of methanol over FeMo oxide catalysts was investigated. The catalysts and operating conditions were optimized, and a rigorous kinetic model was developed. This model provides a valuable tool for process scale-up and operational guidance.

2. Results and Discussion

2.1. Kinetic Experiments

2.1.1. Definition of Conversions and Selectivities

The conversion of methanol is defined as
X C H 3 O H = mols   C H 3 O H   i n   f e e d m o l s   C H 3 O H   in   e f f l u e n t mols   C H 3 O H   i n   f e e d
The conversion of methanol to product i is defined as
X i = m o l s   i   i n   e f f l u e n t m o l s   C H 3 O H   i n   f e e d
The selectivity of product i is defined as
S e l e c t i v i t y = m o l s   p r o d u c t   i   i n   e f f l u e n t m o l s   C H 3 O H   c o n v e r t e d
where i refers to HCN, CO and CO2, respectively.

2.1.2. Intrinsic Kinetic Experiment

Figure 1 shows the XRD pattern of the catalyst. The diffraction results indicated that Fe2(MoO4)3 was the dominant crystalline phase, accompanied by a small amount of α-Fe2O3. Characteristic reflections of Fe2(MoO4)3 were observed at 19.5°, 20.5°, 21.8°, 23.1, 25.9 and 27.7 ° (2θ). In addition, α-Fe2O3 was identified through its diffraction peaks at 33.3°, 35.7°, 54.1°, 62.6° and 64.6° (2θ) [8,9].
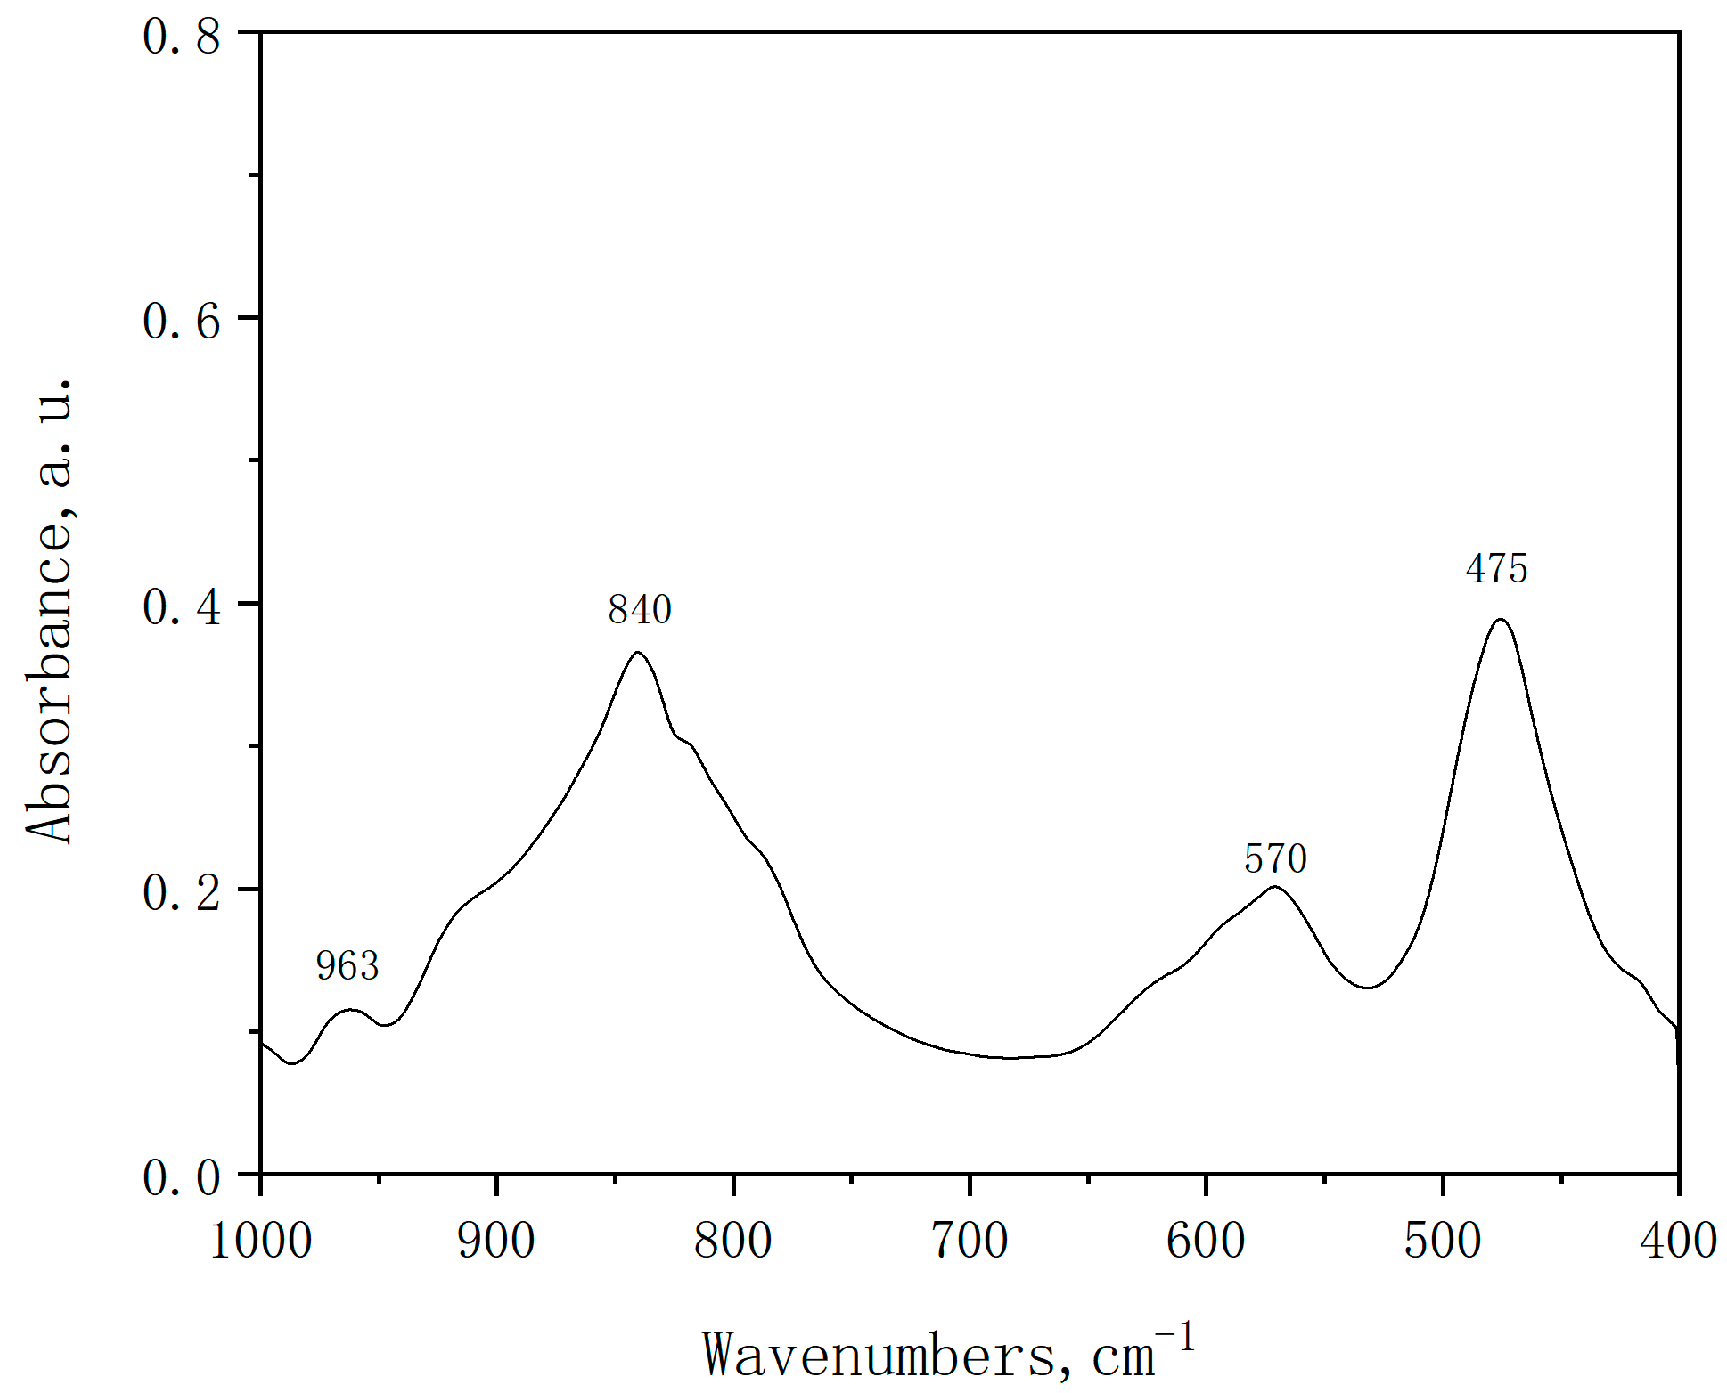
Figure 2 shows the FT-IR spectra of the as-synthesized FeMo/SiO2 catalysts. Absorption peaks at 965 and 838 cm−1 were attributed to the Mo–O stretching vibrations of Fe2(MoO4)3, with 965 cm−1 corresponding mainly to asymmetric stretching and 838 cm−1 to symmetric stretching [10]. Peaks at 570 and 470 cm−1 corresponded to the Fe–O bending vibrations of α-Fe2O3 [11]. These results were in agreement with the XRD analysis.
Experimental conditions were carefully selected to eliminate both internal and external mass and heat transfer effects in order to obtain an intrinsic kinetic model. The prepared catalyst (denoted FeMo/SiO2) was crushed and sieved into different size fractions for testing under the same operating conditions. It was observed that internal diffusional limitations were negligible with a catalyst particle size smaller than 0.15 mm. This conclusion was further supported by the calculation of the Weisz–Prater criterion: c w p = R e a c t i o n   r a t e D i f f u s i o n   r a t e = r A ( o b s ) ρ c R 2 D e C A s = 0.0887 < 1 , which confirmed the absence of internal diffusional resistance [12,13]. In the calculation, the reaction rate was −rA(obs) = 3.85 × 10⁻⁶ kmol/kgcat·s and the effective diffusivity was De = 6.71 × 10⁻⁵ m2/s.
The operating conditions were also selected to eliminate external mass and heat transfer limitations during the experiments by varying the catalyst loading while maintain a fixed ratio of catalyst to feed. Furthermore, the calculation of the Mears criterion for external diffusion, r A ρ b R n k c C A b = 8.32 × 10 4 < 0.15 , confirmed the absence of external mass transfer resistance. In this calculation, the mass transfer coefficient was determined as Kc = 2.638 m/s.
The Mears criterion for combined interphase and intraparticle heat and mass transport [14], r A R 2 C A b D e < 1 + 0.33 γ χ n γ b β b 1 + 0.33 n ω , was also evaluated, yielding a value of r A R 2 C A b D e = 4.44 × 10 5 < 1.01 , thereby confirming the absence of transport limitations. Thus, the intrinsic kinetics of the reaction were derived.

2.1.3. Effect of Temperature

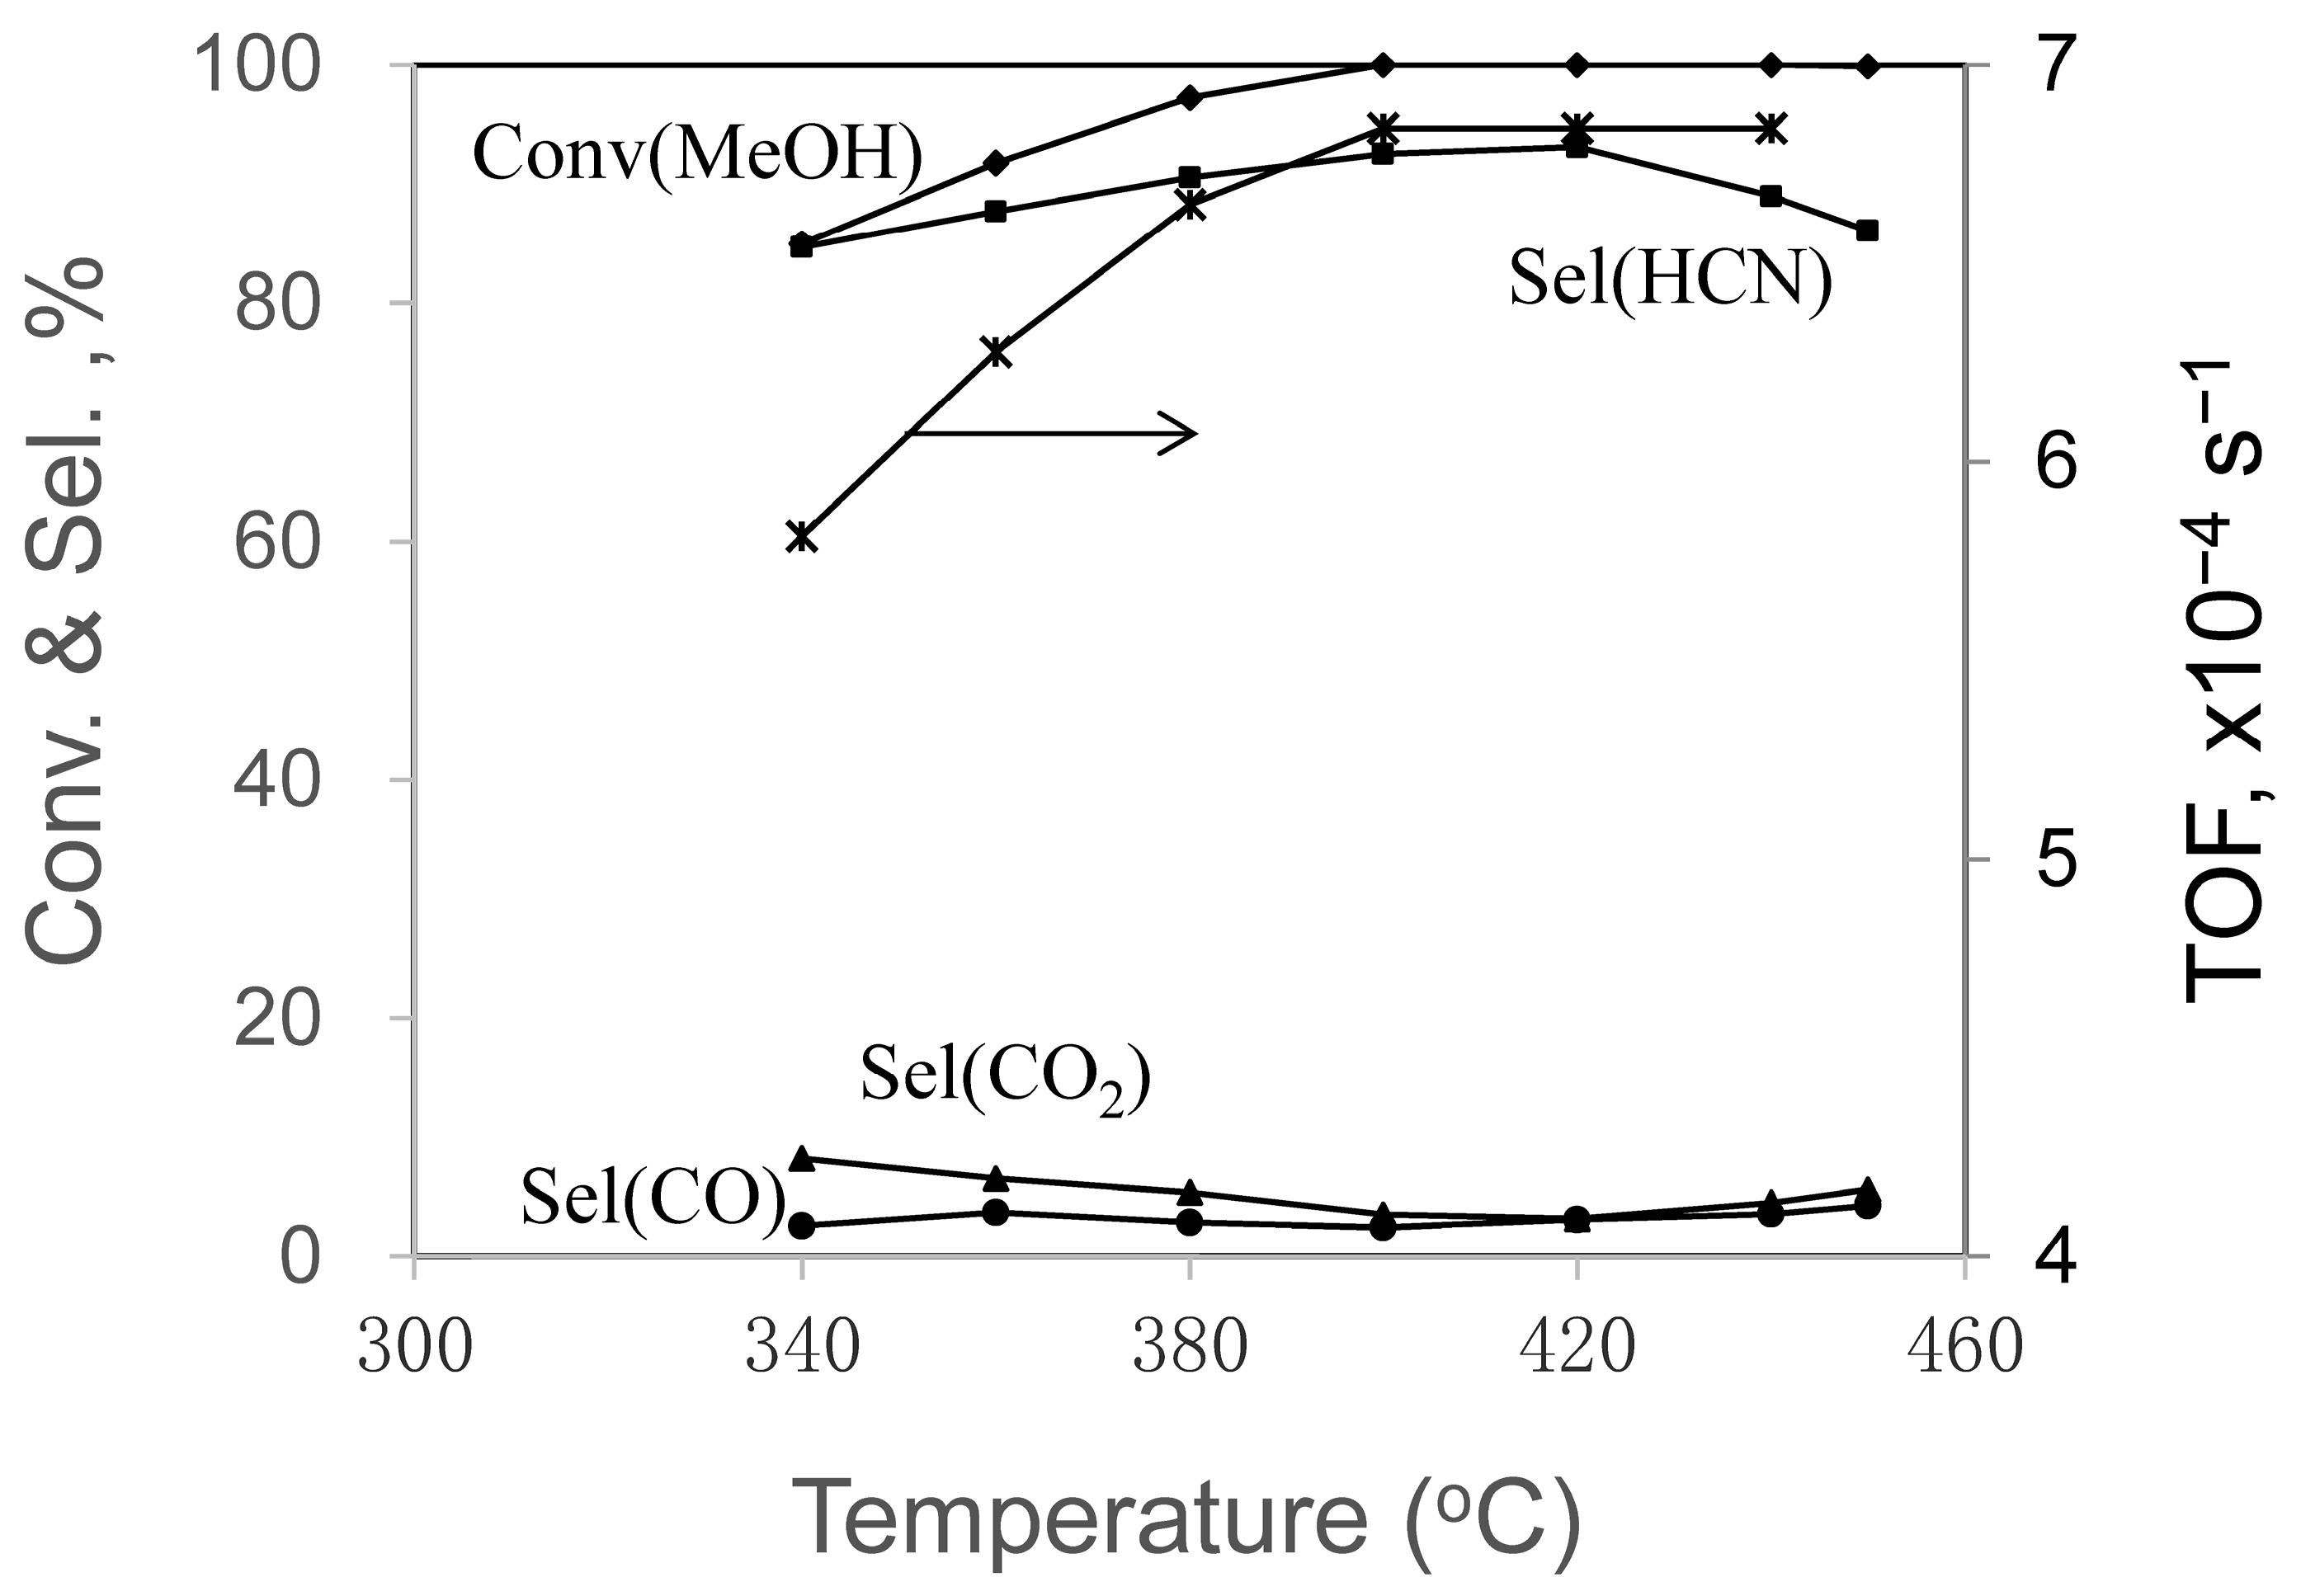
The ammoxidation of methanol was carried out at atmospheric pressure, 340–450 °C; a space time of 125 gcat h/mol; and an ammonia gas/oxygen/methanol molar ratio of 1.1/2.7/1.0. Table 1 shows that the catalyst was characterized by high activity and good selectivity. The nitrogen balance was good, indicating that the catalyst did not decompose ammonia and that the low ratio of ammonia to methanol reduced the cost. The carbon balance was also good, indicating that, except for the generation of hydrogen cyanide, only a small amount of CO and CO2 was produced. As shown in Figure 3, the conversion of methanol increased from 85% at 340 °C to complete conversion at temperatures above 400 °C. With increasing temperature, the selectivity for HCN peaked at 93.7% at 400 °C and then started to decrease. The sum of the selectivities for CO and CO2 at all temperatures was less than 10%, which meant that the catalyst was more selective for ammoxidation than for oxidation of methanol.
Table 2 summarizes the ICP-OES composition and BET surface area analysis of the samples. Based on the weight percentage of Fe, the turnover frequencies (TOFs), calculated from the total Fe active sites, increased from 5.81 × 10⁻⁴ to 6.84 × 10⁻⁴ s−1 as the reaction temperature increased from 340 to 400 °C.
The specific surface area of the samples was 17.08 m2/g. According to the t-plot method, micropores (<2 nm) contributed only about 18.4% of the total surface area, whereas the “non-microporous portion” accounted for 81.6%, indicating that the material surface was dominated by non-microporous structures. The pore system was therefore primarily composed of mesopores and macropores, a feature that was beneficial for maintaining catalytic stability by alleviating pore blockage caused by coke deposition and other by-products. Moreover, such a pore architecture facilitated mass transfer and lowered the probability of undesirable side reactions.

2.1.4. Catalyst Stability

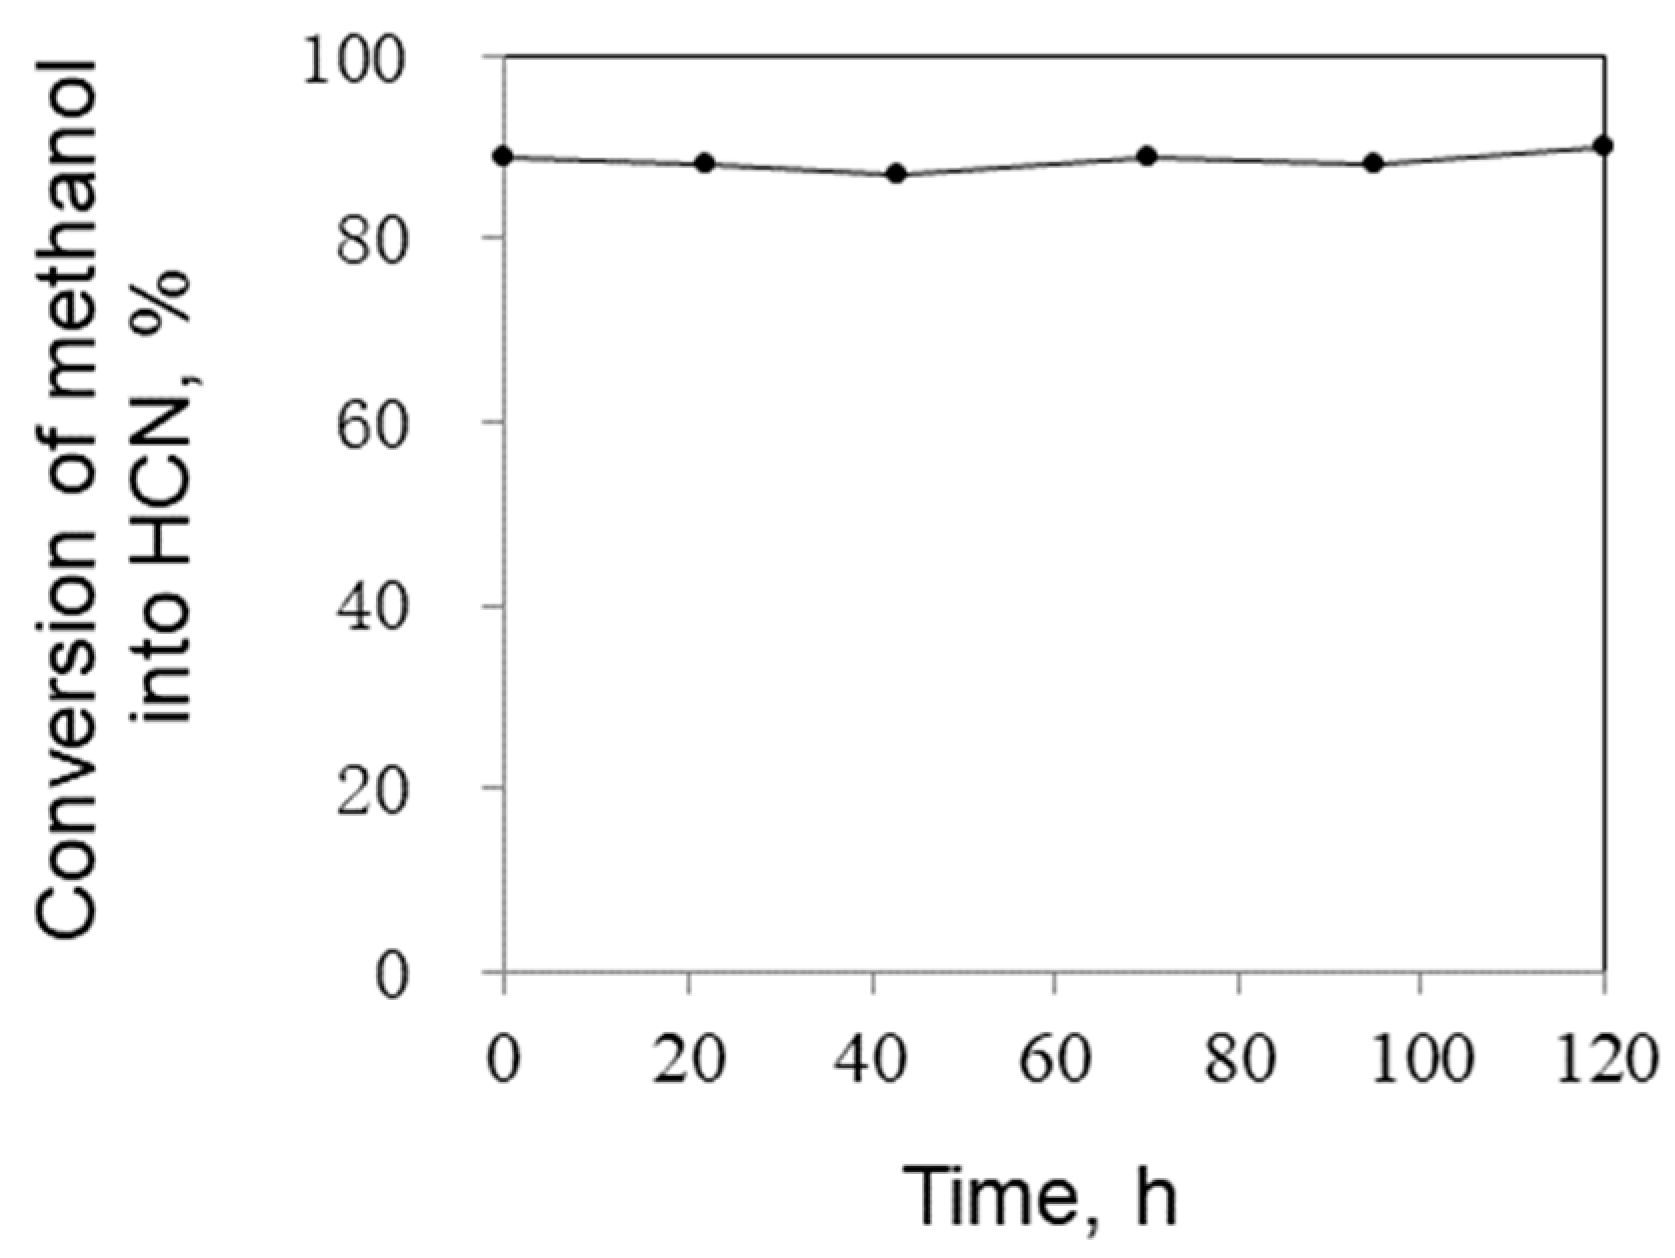
The stability of the FeMo/SiO2 catalyst in the ammoxidation of methanol was tested at 380 °C. The conversion of methanol as a function of reaction time is shown in Figure 4. The FeMo/SiO2 catalyst was stable, and no decrease in methanol conversion was observed during the 120 h run. Coking of the catalyst did not occur at reaction temperatures above 380 °C due to the specific catalyst texture and the presence of oxygen.

2.1.5. Effect of Space Time

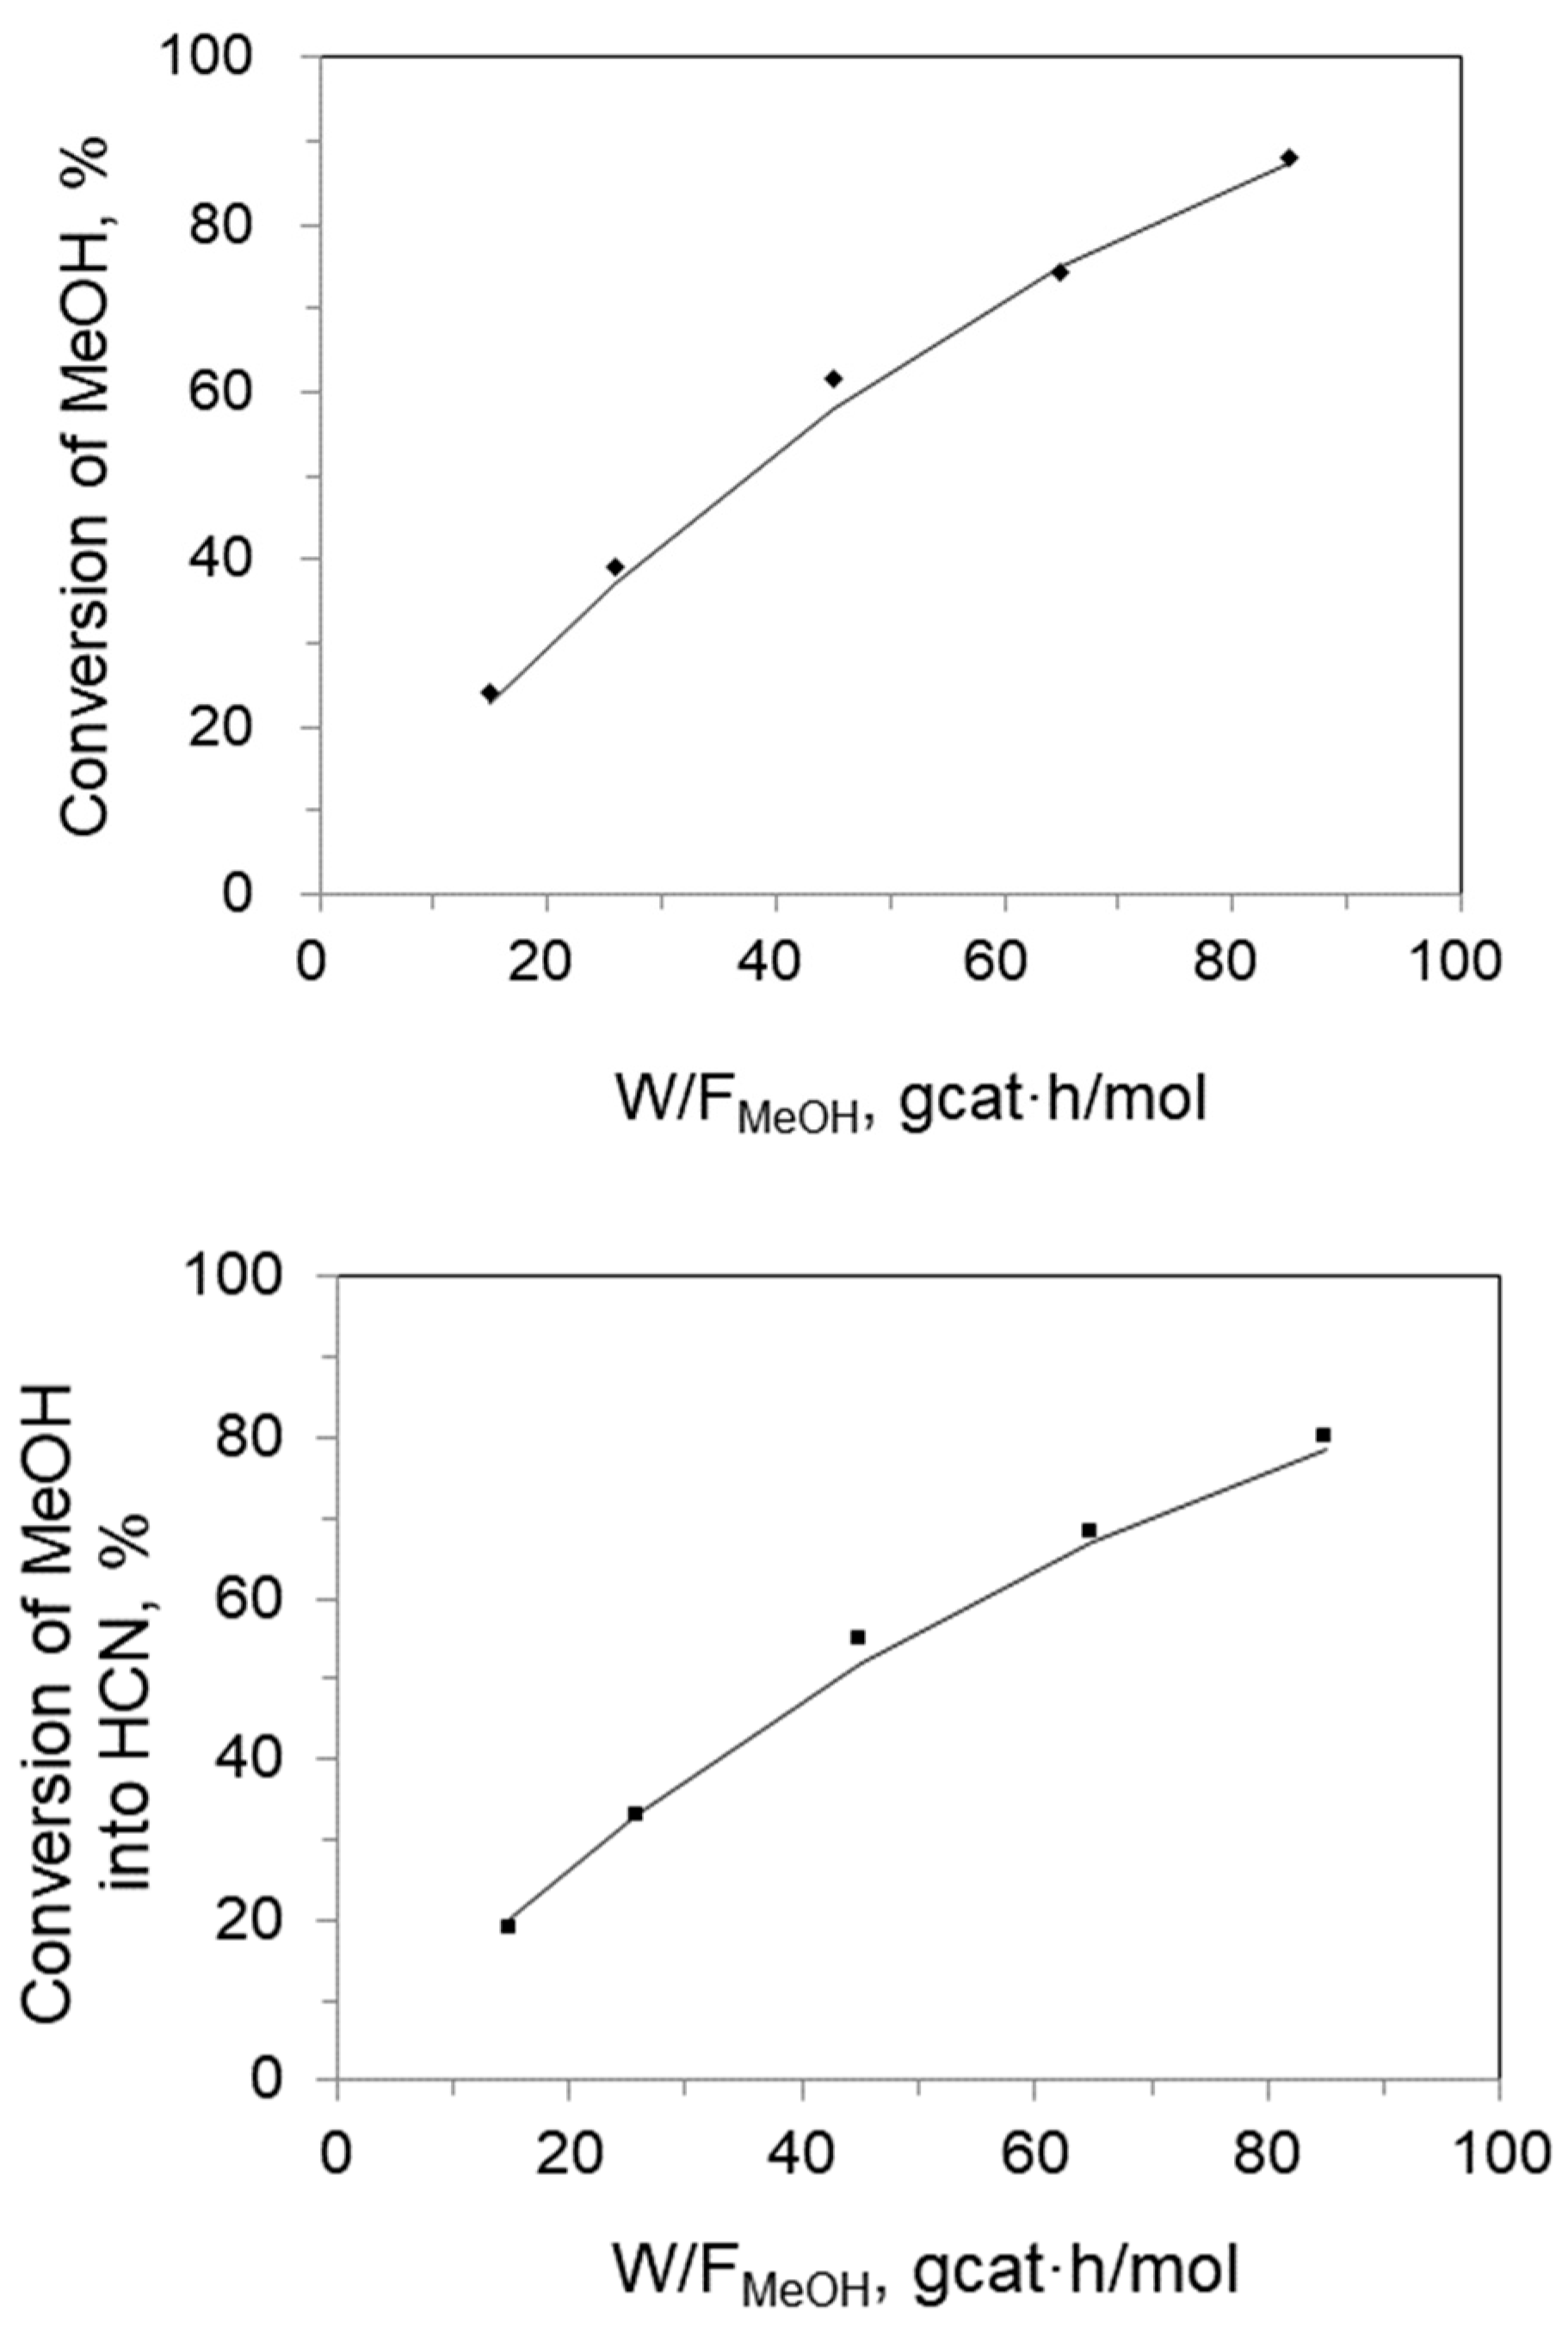
For a fixed temperature and a NH3/O2/CH3OH molar ratio of 1.1/2.7/1.0, the methanol feed rate was varied to investigate the effect of the space time on the conversion. Figure 5 shows an example of the conversion of methanol and the conversion to HCN, CO and CO2 as a function of space time at 380 °C. (The points represent the experimental data, and the curve will be discussed later.) It was seen that the conversion of methanol and the conversion to HCN both increased with space time. The total conversion to CO and CO2 was less than 8.0%. Similar experiments were carried out at 360, 400 and 420 °C.

2.1.6. Effect of O2/Methanol Molar Ratios in the Feed

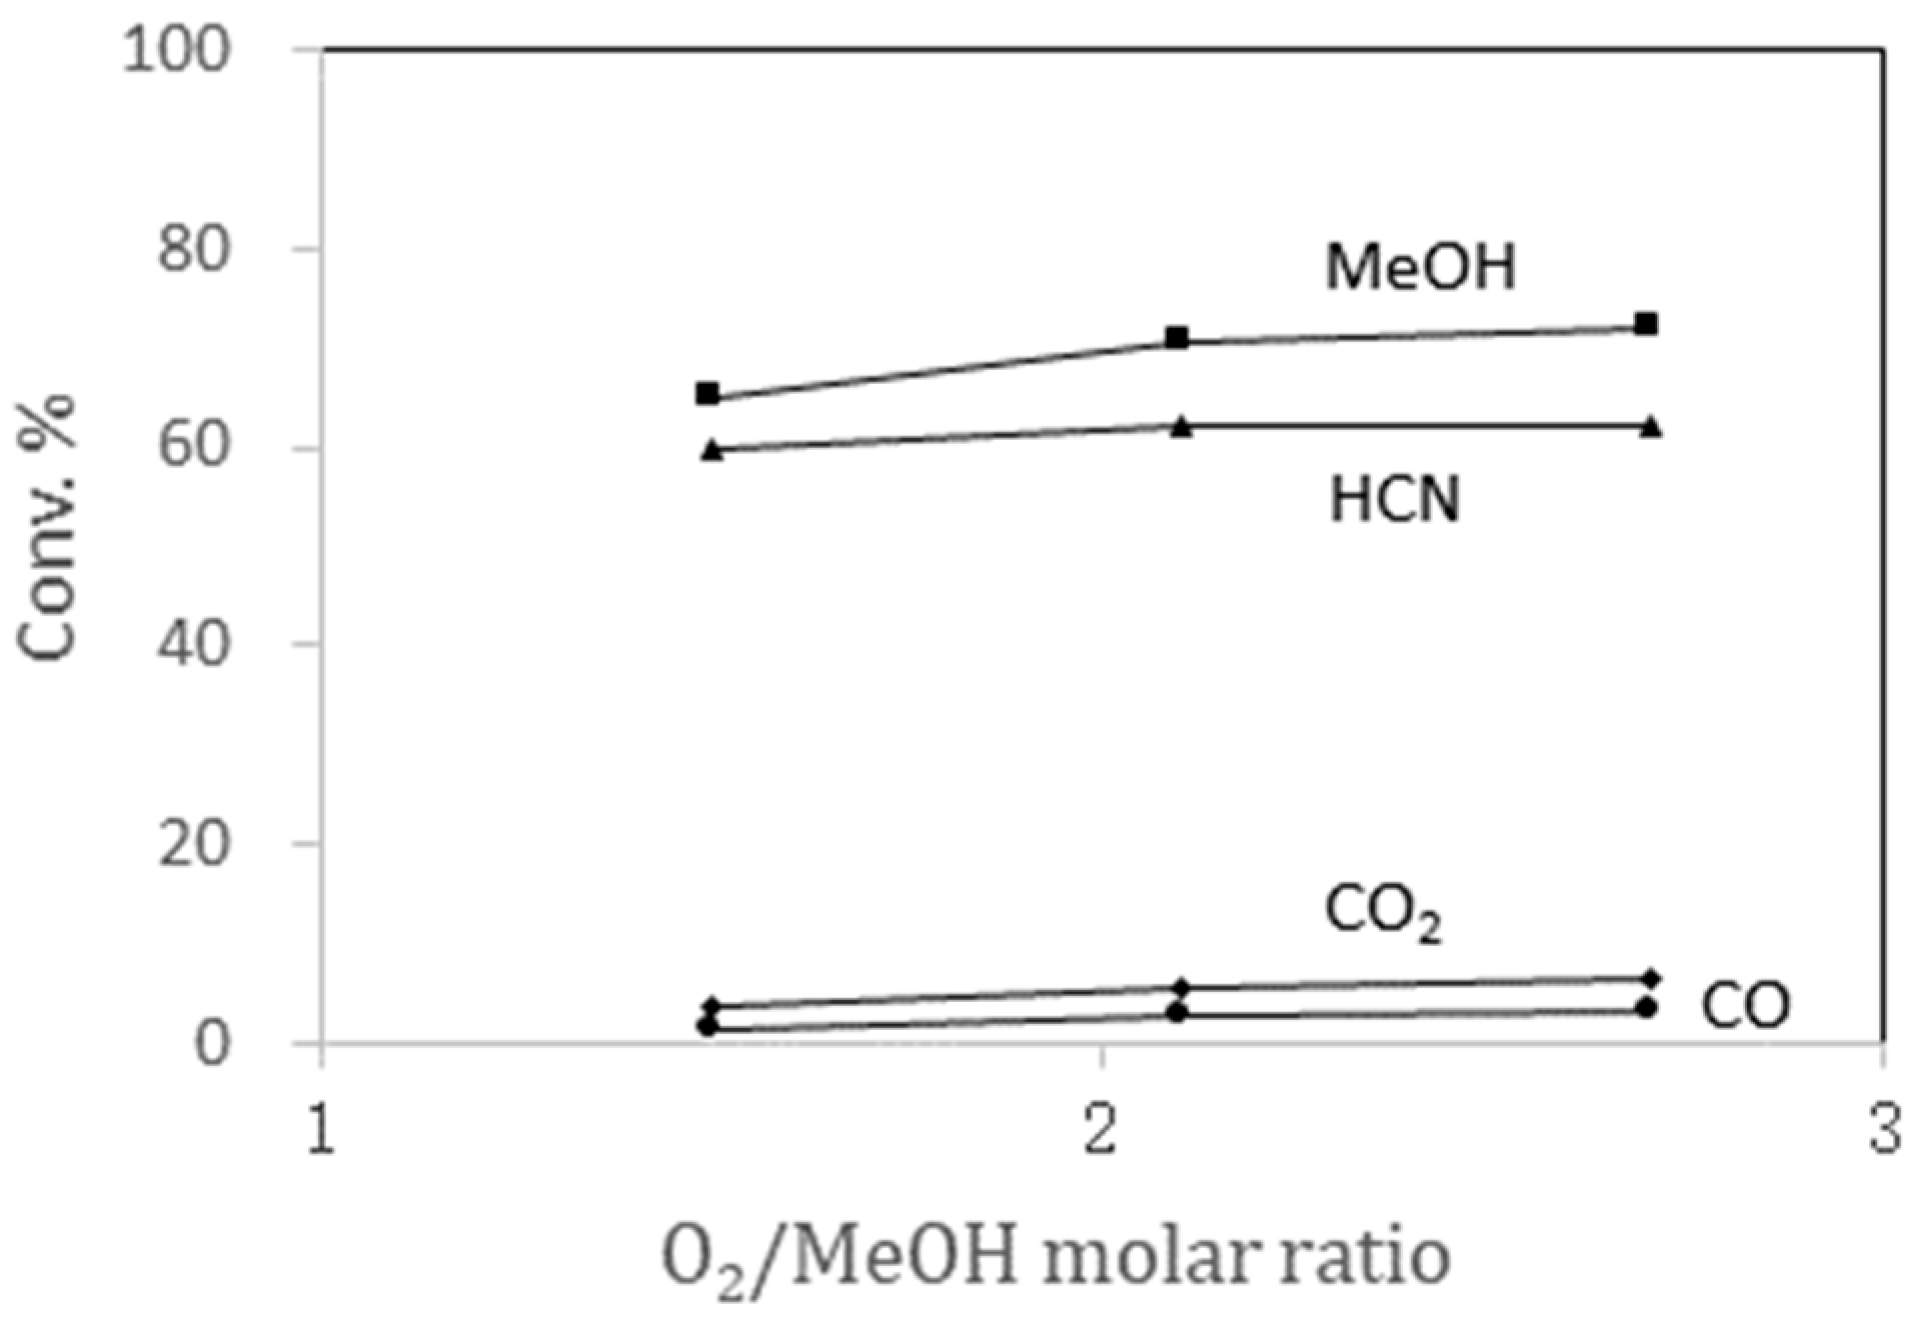
The ammoxidation of methanol was studied at different O2/methanol molar ratios at 360 °C, with an NH3/CH3OH molar ratio of 1.1 and a space time of 125 g cat h/mol. As the O2/methanol molar ratio increased from 1.5 to 2.7, Figure 6 shows that the conversion to CO and CO2 increased slightly due to the high O2 concentration. The conversion to HCN showed no obvious effect.

2.2. Kinetic Modeling

2.2.1. Thermodynamic Aspects

The equilibrium constant of each possible reaction in the ammoxidation of methanol is shown in Figure 7. Three reactions were involved in the ammoxidation of methanol. Methanol could be ammoxidized to form the target product, HCN, or oxidized to by-products, CO and CO2. The equilibrium constants at 400 °C for the ammoxidation of methanol to HCN, the oxidation to CO and the oxidation to CO2 were 5.66 × 1033, 3.38 × 1037 and 8.74 × 1054, respectively. These values were very large, indicating that the reverse reactions could be neglected. Therefore, all these reactions were treated as irreversible in the model.

2.2.2. Reaction Scheme

Under the operating conditions investigated, the ammoxidation of methanol on silica-supported FeMo oxide catalysts produced HCN as the main product. Only small amounts of oxidation products, CO and CO2, were formed as by-products. The Mars–van Krevelen redox mechanism is the basis for most kinetic studies of oxidation and ammoxidation reactions using oxide catalysts [15,16,17]. The rate equations for the ammoxidation of methanol were formulated with the participation of the oxygen from the catalyst lattice in the reaction.

2.2.3. Rate Equations

As in case I, based on literature reports of molybdate catalysts for ammoxidation reactions [18,19], ammonolysis of the surface molybdenum oxo species occurs, resulting in surface -NH groups. Methanol reacts with the -NH to form a CH3NH surface species which is dehydrogenated to HCN with surface lattice oxygen.
Case I:
O 2 + ( ) k 1 ( O 2 ) + (   ) 2 ( O )                           N H 3 + ( O )   k 2 ( N H ) + H 2 O ( N H ) + C H 3 O H k 3 ( C H 3 O N H 2 ) ( C H 3 O N H 2 ) + ( O ) k 3 H C N + 2 H 2 O + 2 (   ) C H 3 O H + ( O ) k 4 ( I 1 ) + ( O ) k 4 C O + 2 H 2 O + 2 (   ) C H 3 O H + ( O ) k 5 ( I 2 ) + 2 ( O ) k 5 C O 2 + 2 H 2 O + 3 (   )
(O) is the fraction of lattice oxygen of the catalyst and ( ) is the fraction of the reduced vacant site. For the steady-state approximation of intermediates, (NH), its fraction can be obtained as
k 2 P A ( O ) = k 3 P M ( N H ) ( N H ) = k 2 P A k 3 P M ( O )
Similarly, (O) can be obtained.
2 k 1 P O 2 ( ) = 2 k 2 P A ( O ) + 2 k 4 P M ( O ) + 3 k 5 P M ( O ) ( O ) = k 1 P O 2 (   ) k 2 P A + k 4 P M + 1.5 k 5 P M
As
( ) + ( O ) + ( N H ) = 1
Substituting Equations (1) and (2) into Equation (3), we obtain
S O x d = k 1 k 3 P M P O 2 k 2 k 3 P M P A + k 1 k 3 P M P O 2 + k 1 k 2 P A P O 2 + k 3 P M 2 ( k 4 + 1.5 k 5 )
Thus, the rate equations for forming HCN, CO and CO2 are as follows:
r H C N = k 2 P A ( O ) = k 1 k 2 k 3 P O 2 P M P A k 2 k 3 P M P A + k 1 k 3 P M P O 2 + k 1 k 2 P A P O 2 + k 3 P M 2 ( k 4 + 1.5 k 5 )
r C O = k 4 P M ( O ) = k 1 k 3 k 4 P M 2 P O 2 k 2 k 3 P M P A + k 1 k 3 P M P O 2 + k 1 k 2 P A P O 2 + k 3 P M 2 ( k 4 + 1.5 k 5 )
r C O 2 = k 5 P M ( O ) = k 1 k 3 k 5 P M 2 P O 2 k 2 k 3 P M P A + k 1 k 3 P M P O 2 + k 1 k 2 P A P O 2 + k 3 P M 2 ( k 4 + 1.5 k 5 )
Case II:
O 2 + (   ) k 1 ( O 2 )                         C H 3 O H + N H 3 + ( O 2 ) k 2 H C N + 3 H 2 O + (   ) C H 3 O H + ( O 2 ) k 3 ( I 1 ) C O + 2 H 2 O + (   ) C H 3 O H +   ( O 2 ) k 4 ( I 2 ) + 1 / 2 ( O 2 ) C O 2 + 2 H 2 O + 3 / 2 (   )
In case II, gaseous methanol and ammonia are oxidized to HCN in a single step by lattice oxygen.
For the steady-state approximation of (O2), we obtain
k 1 P O 2 ( ) = k 2 P M P A ( O 2 ) + k 3 P M ( O 2 ) + 1.5 k 4 P M ( O 2 )
As
( ) + ( O 2 ) = 1
Substituting Equation (9) into Equation (8), we obtain
( O 2 ) = k 1 P O 2 k 1 P O 2 + k 2 P A P M + k 3 P M + 1.5 k 4 P M
Thus, the rate equations for forming HCN, CO and CO2 are as follows:
r H C N = k 2 P M P A ( O 2 ) = k 1 k 2 P O 2 P M P A k 1 P O 2 + k 2 P A P M + k 3 P M + 1.5 k 4 P M
r C O = k 3 P M ( O 2 ) = k 1 k 3 P O 2 P M k 1 P O 2 + k 2 P A P M + k 3 P M + 1.5 k 4 P M
r C O 2 = k 4 P M ( O 2 ) = k 1 k 4 P O 2 P M k 1 P O 2 + k 2 P A P M + k 3 P M + 1.5 k 4 P M
The set of steady-state continuity equations for the reacting components in a plug-flow reactor can be written as
d X i d W / F MeOH 0 = r i     ,       i = 1 ,   , 3
where X1, X2 and X3 represent the conversions of methanol to HCN, CO and CO2, respectively. FMeOH0 represents the feed rate of methanol.

2.2.4. Parameter Estimation

The integral method was used for the kinetic analysis [20]. The foregoing set of differential equations was numerically integrated by a fourth-order Runge–Kutta method to yield the reactor effluent composition. Values for the model parameters were estimated by means of regression methods. When the experimental errors were normally distributed with a zero mean, the parameters were estimated by minimization of the following multiresponse objective function:
S = j = 1 m l = 1 m W j l i = 1 n ( y i j y ^ i j ) ( y i l y ^ i l ) ,
where m is the number of responses, n is the number of experiments and the Wjls are elements of the inverse of the covariance matrix of the experimental errors on response y. These can be estimated from replicated experiments. Because the equations are nonlinear in the parameters, the parameter estimates were obtained by minimizing the objective function using Marquardt’s algorithm for multiple responses. The foregoing model I had eight parameters. The parameter estimation was performed simultaneously on all of the data obtained at all temperatures by directly substituting the temperature dependence of the parameters into the corresponding rate equations: for the rate coefficient,
k i = A i exp ( E i / R T )
Discrimination between competing models was based on the requirement that all parameters be positive and statistically significant, and on the residual sum of squares (RRS) as a test of the fit of the data. The RRS along with the calculated F-values (the ratio of the regression sum of squares to the residual sum of squares) for the model of case I were 0.01982 and 6619, respectively. Whereas those for the model of case II were 0.02351 and 6990. Apparently, the case I model, which was based on ammonolysis of the surface molybdenum oxo species resulting in surface -NH groups, fitted the experimental data slightly better than the case II model. The Student’s t-test showed that all parameters in the case I and II models were statistically significant.
For each model we carried out nonlinear parameter estimation (Levenberg–Marquardt), computed the parameter covariance matrix, evaluated pairwise correlation coefficients and performed local sensitivity analysis (±10% perturbation of each parameter).
The 10-parameter model (case I), although capable of reproducing the experimental profiles, exhibited one pair of parameters with a slightly high absolute (|r| ≈ 0.912), indicating a moderate correlation but not a severe identifiability problem. In addition, two parameters (A3 and E3) showed negligible sensitivity (<1% effect on the model output). These observations indicated partial parameter compensation and limited identifiability for a subset of parameters.
In contrast, the reduced eight-parameter model (case II) yielded off-diagonal correlation coefficients below 0.9 for all parameter pairs and retained a similar fit quality. Local sensitivity analysis for the reduced model showed that the predicted conversion was dominated by E1 and E2, while remaining parameters had moderate or low sensitivity (Table 3). Together, these findings favored the case II model on the grounds of parsimony and parameter identifiability.
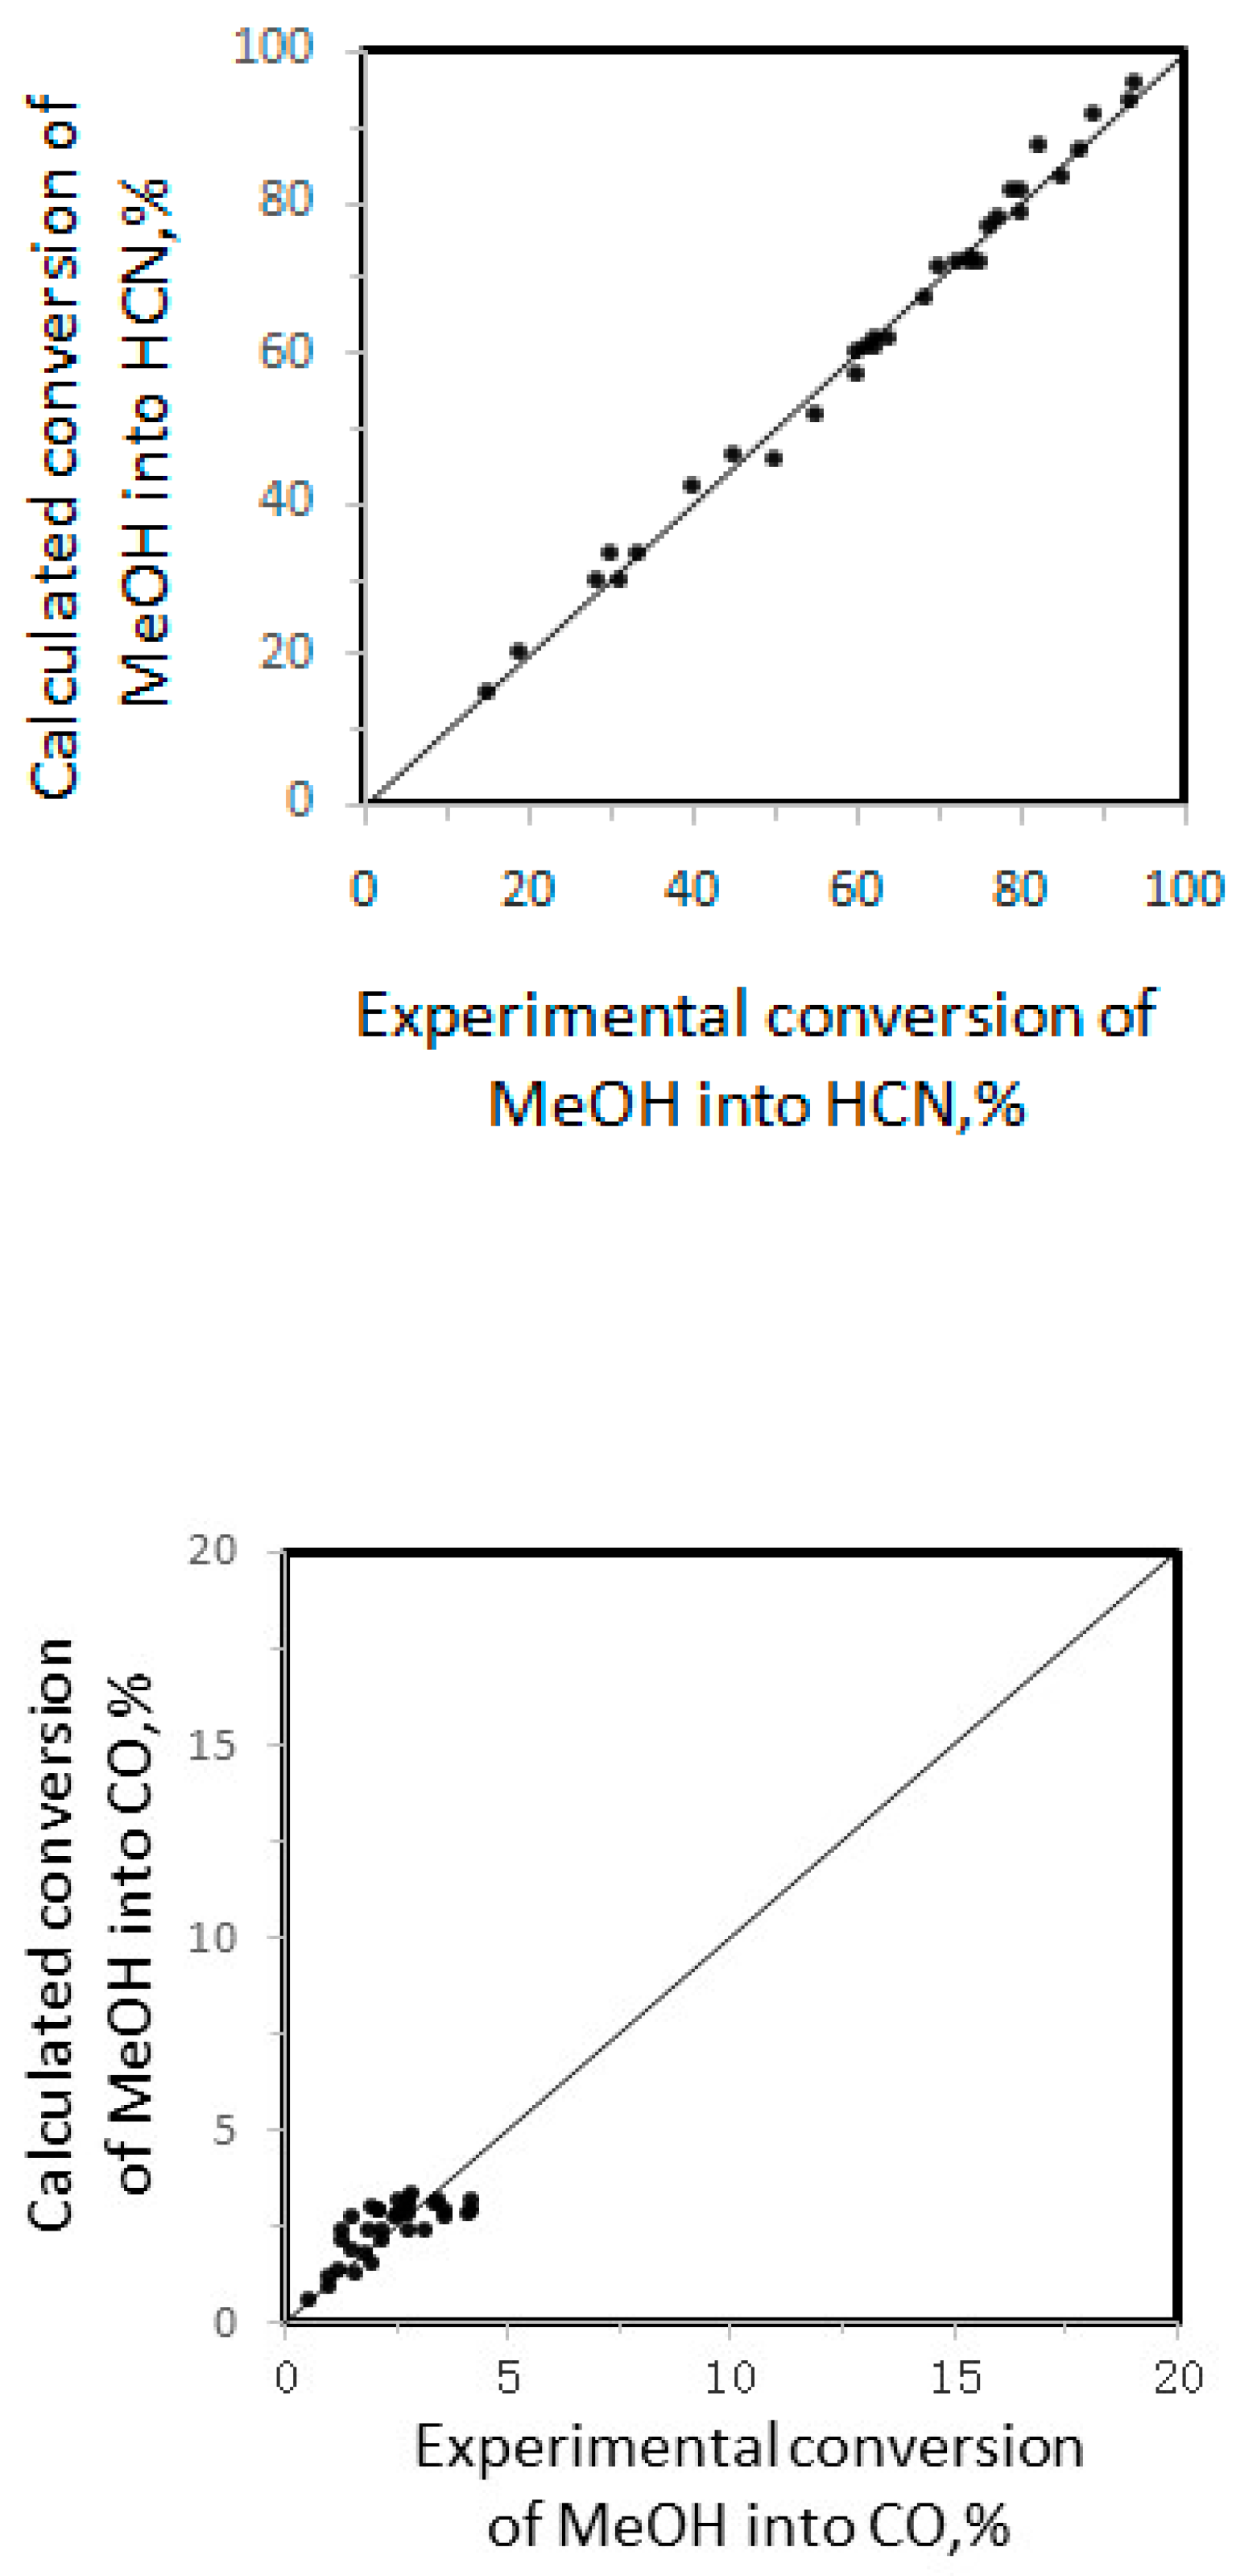
Therefore, the case II model was retained. The excellent fit was also illustrated by the parity plots in Figure 8, including all experiments performed over the entire temperature range. Table 4 lists the eight parameter estimates that were generated by the Fortran program using the Levenberg–Marquardt algorithm for this retained model. The rate coefficients increased with temperature. As an example, Figure 5 compared the experimental conversions versus space time at 380 °C with the values calculated using the retained model.

3. Experimental

3.1. Material and Catalyst Preparation

Ammonium paramolybdate tetrahydrate (NH4)6Mo7O24·4H2O), ferric nitrate nonahydrate (Fe(NO3)·39H2O), aqueous ammonia and methanol were purchased from Sinopharm chemical regent Co., Ltd. (Shanghai, China). All chemicals were of analytical grade. Helium, air and hydrogen gases were purchased from Xinkeyuan Co., Ltd. (Qingdao, China) and were of 99.99% purity.
A solution of ammonium paramolybdate, designated as solution A, was prepared by dissolving 26.5 g (NH4)6Mo7O24·4H2O in a diluted aqueous ammonia solution, comprising 13.4 g 25 wt.% aqueous ammonia and 60 g deionized water. Solution B, a solution of ferric nitrate, was prepared by dissolving 102.62 g Fe(NO3)3·9H2O in 147.3 g deionized water. Solution A was added dropwise with vigorous stirring to solution B over 1 h in a three-neck reaction flask. The pH of the mixture was adjusted to 2.25, and the mixture was refluxed at 100 °C for 2 h, followed by aging at 70 °C overnight. Subsequently, 127.4 g of 30 wt% aqueous silica sol (SW-30) was added to the mixture with vigorous stirring over 1 h. The resulting slurry was refluxed at 100 °C for 3 h, then dried at 130 °C to remove water and finally calcined at 760 °C in air for 2 h.

3.2. Reactor Setup

The ammoxidation of methanol was carried out over silica-supported FeMo oxide catalysts in a fixed-bed reactor operating at atmospheric pressure (Figure 9). The gas feeds (NH3, air and He) were controlled by mass flow controllers, while the liquid methanol and water were supplied using a syringe pump. The liquid feeds were vaporized in a mixing chamber and mixed with the gas streams before entering the reactor. The reactor consisted of a 1.2 cm i.d. stainless steel tube heated by a tubular furnace. The axial temperature profile was monitored using a sliding thermocouple. To maintain an isothermal temperature in the catalyst bed during the kinetic experiments, the catalyst was diluted with ten times its mass of silicon carbide with a similar particle size.
The reactor effluent was directed along different pathways by switching two ball valves. When valve V1 was closed and valve V2 was open, the effluent was introduced into a 1.0 M NaOH solution for HCN analysis using the standard silver nitrate titration method. When V1 was open and V2 was closed, the effluent was directed into an absorption bottle containing 2 M sulfuric acid in a water bath at 80 °C for ammonia analysis, followed by an ice-water bath to capture any remaining methanol. When V3 was open and the needle valve (V4) was closed, the effluent gas was sent into a 1.5 M NaOH solution to remove toxic HCN and then vented through a cumulative flow meter. When V4 was open, a portion of the effluent gas was directed into a gas chromatograph (GC) for CO and CO2 analysis.
The quantity of unreacted ammonia was determined by titrating the absorbed sulfuric acid solution with a standardized NaOH solution. The unreacted methanol was analyzed using a gas chromatograph (Fuli 9890 II, Zhejiang Fuli Analytical Instrument Co., Ltd., Taizhou, China) equipped with a 50 m × 0.25 mm i.d. × 0.25 μm B-WAX UI capillary column and a flame ionization detector (FID). The CO and CO2 generated from the reaction were analyzed on a gas chromatograph (Fuli 9890 II) fitted with a methanizer and an FID. Separation of CO and CO2 was achieved using a carbon molecular sieve column (3 m × 3 mm i.d., 60/80 mesh). The methanizer, packed with a nickel catalyst, converted CO and CO2 into methane for subsequent detection by the FID.

3.3. Material Characterization

The structural properties of the samples were investigated by X-ray diffraction (XRD, X’PertPro MPD) using a CuKa monochromator and a Ni filter in a 2θ range = 5–75°. The crystalline phases were identified by comparison with the diffraction peaks of standard pure materials. The surface areas (BET) were determined by nitrogen adsorption at −196 °C using an automated gas adsorption analyzer (ASAP2020-M, Micromeritics, Norcross, GA, USA). The elemental composition of the catalyst was measured using an inductively coupled plasma optical emission spectrometer (ICP-OES) (Optima 7000 DV, PerkinElmer Inc., Springfield, IL, USA). FT-IR spectra were recorded at room temperature using a Perkin-Elmer Model 2000 spectrometer (PerkinElmer Inc., Springfield, IL, USA). The spectrometer was connected to a personal computer equipped with the IR Data Manager software, version 5.3.1, for spectral acquisition and processing. Samples were prepared by pressing the specimens into small discs with spectroscopically pure KBr as the matrix.

4. Conclusions

The work reported here demonstrated that the ammoxidation of methanol over the FeMo/SiO2 catalyst could be used to produce HCN. The catalyst was stable and the ammoxidation of methanol was the dominant reaction, with only minor oxidation by-products, i.e., CO and CO2, being formed. The rate equations were written in terms of the Mars-van–Krevelen approach, i.e., the redox of the oxygen from the catalyst lattice involved in the reaction. Ammonolysis of the surface molybdenum oxo species occurs, resulting in surface -NH groups which react with methanol to form a surface CH3NH species which is dehydrogenated to HCN by surface lattice oxygen.
Two kinetic models were compared. The 10-parameter model (case I) reproduced the experimental data well but showed moderate inter-parameter correlation (|r| ≈ 0.91) and negligible sensitivity for two parameters, indicating limited identifiability. The reduced eight-parameter model (case II) achieved a comparable fit with all correlation coefficients below 0.9 and well-defined sensitivity behavior.
Considering both statistical performance and model parsimony, the eight-parameter model was retained as the most reliable representation of the reaction kinetics. The estimated parameters followed the expected Arrhenius trends, and the model accurately described the experimental conversions across the temperature range, providing a robust basis for process design and optimization of methanol ammoxidation.

Author Contributions

B.W.: Conceptualization, Methodology, Data Curation, Formal Analysis, Investigation, Validation, Writing—Original Draft, Writing—Review and Editing; Y.Z.: Project Administration, Resources, Equipment. All authors have read and agreed to the published version of the manuscript.

Funding

The support of this work by the Fundamental Research Funds for the Central Universities (Grant No. 24720094028) is gratefully acknowledged.

Data Availability Statement

The data will be made available upon request.

Acknowledgments

The support of this work by Qingdao PTK Co. Ltd. is gratefully acknowledged.

Conflicts of Interest

Author Yuhuan Zhao was employed by the company Qingdao PTK Chemical Co., Ltd. The remaining authors declare that the research was conducted in the absence of any commercial or financial relationships that could be construed as a potential conflict of interest.

Glossary

AiFrequency factor for elementary reaction step i, kmol/(kgcat h)
EiActivation energy for elementary reaction step i, J/mol
riRate of reaction step i, kmol/(kgcat h)
FiMolar feed rate of reactant i, kmol/h
W/FMeOH0Space time in terms of methanol feed, kgcat h/kmol
DeEffective diffusivity, m2/s
CAsGas concentration of A at the catalyst surface, kmol/m3
CAbBulk gas concentration of A, kmol/m3
ρbBulk density of catalyst bed, kg/m3
ρcSolid catalyst density, kg/m3
RCatalyst particle radius, m
−r’A(obs)Observed reaction rate of reactant A, kmol/kgcat·s

References

  1. Horn, R.; Schlogl, R. Methane activation by heterogeneous catalysis. Catal. Lett. 2015, 145, 23–29. [Google Scholar] [CrossRef]
  2. Dietz, A.G.; Schmidt, L.D. Conditions for HCN synthesis and catalyst activation over Pt–Rh gauzes. Appl. Catal. A Gen. 1999, 180, 287–298. [Google Scholar] [CrossRef]
  3. Sasaki, U.; Utsumi, H.; Morishita, K.; Miyaki, K. Process for Production of Prussic Acid. U.S. Patent 5,976,482, 2 November 1999. [Google Scholar]
  4. Wang, Y.F.; Jia, S.X.; Wu, Y.N.; Wu, Y. Catalytic active components of iron-molybdenum catalyst and catalytic ammoxidation. J. Chem. Ind. Eng. 1991, 5, 638–641. [Google Scholar]
  5. Koryablina, N.; Khramov, M.; Monical, V. Process of Catalytic Ammoxidation for Hydrogen Cyanide Production. U.S. Patent 776,322,5B2, 27 July 2010. [Google Scholar]
  6. Sasaki, Y.; Utsumi, H.; Otani, M.; Morishita, V. Process for Preparing Iron-Antimony-Phosphorus-Containing Catalyst for Fluidized Bed Process. U.S. Patent 4,981,830, 1 January 1991. [Google Scholar]
  7. Sasaki, Y.; Utsumi, H.; Otani, M. Process for Production of Hydrogen Cyanide. U.S. Patent 5,158,787, 27 October 1992. [Google Scholar]
  8. Hassani, H. Synthesis, characterization and catalytic performance of iron molybdate Fe2(MoO4)3 nanoparticles. Catal. Commun. 2015, 60, 19–22. [Google Scholar] [CrossRef]
  9. Hidalgo, G.; Tonelli, M.; Burel, L.; Millet, J. Microwave-assisted hydrothermal synthesis, characterization and catalytic performance of Fe2(MoO4)3 in the selective oxidation of propene. Catal. Today 2021, 363, 36–44. [Google Scholar] [CrossRef]
  10. Devendran, P.; Ayyar, M. One-pot synthesis and characterization studies of iron molybdenum mixed metal oxide (Fe2(MoO4)3) nano-photocatalysts. J. Mater. Sci. 2016, 51, 1–10. [Google Scholar]
  11. Basavaraja, S.; Balaji, D.; Bedre, M.D.; Raghunandan, D.; Swamy, P.M.P.; Venkataraman, A. Solvothermal synthesis and characterization of acicular α-Fe2O3 nanoparticles. Bull. Mater. Sci. 2011, 34, 1313–1317. [Google Scholar] [CrossRef]
  12. Wiesz, P.B.; Prater, C.D. Interpretation of measurements in experimental catalysis. Adv. Catal. 1954, 6, 143–196. [Google Scholar]
  13. Oyama, S.; Zhang, X.; Lu, J.; Gu, Y.; Fujitani, T. Epoxidation of propylene with H2 and O2 in the explosive regime in a packed-bed catalytic membrane reactor. J. Catal. 2008, 257, 1–4. [Google Scholar] [CrossRef]
  14. Mears, D.E. Tests for transport limitations in experimental catalytic reactors. Ind. Eng. Chem. Process. Des. Dev. 1971, 10, 541–547. [Google Scholar] [CrossRef]
  15. Chuang, K.T.; Zhou, B.; Tong, S. Kinetics and mechanism of catalytic oxidation of formaldehyde over hydrophobic catalysts. Ind. Eng. Chem. Res. 1994, 33, 1680–1686. [Google Scholar] [CrossRef]
  16. Radheshyam, A.; Reddy, V.S.; Dwivedi, R.; Prasad, R. Kinetic studies and mechanism evolution of the ammoxidation of 3-picoline over V2O5/ZrO2 catalyst. Can. J. Chem. Eng. 2005, 83, 274–280. [Google Scholar] [CrossRef]
  17. Golodets, G.I.; Ross, J.R.H. Chapter XXIV: The ammoxidation of organic substances, Stud. Surf. Sci. Catal. 1983, 15, 767–792. [Google Scholar]
  18. Ebner, J.R.; Gleaves, J.T.; Kuechler, T.C.; Li, T.P. Ammoxidation of methanol to hydrogen cyanide binary oxide catalysts and mechanistic aspects. In Industrial Chemicals via C1 Processes; Fahey, D., Ed.; ACS Symposium Series; American Chemical Society: Washington, DC, USA, 1987; pp. 189–205. [Google Scholar]
  19. Burrington, J.D.; Kartisek, C.; Grasselli, R.K. Surface intermediates in selective propylene oxidation and ammoxidation over heterogeneous molybdate and antimonate catalysts. J. Catal. 1984, 87, 363–380. [Google Scholar] [CrossRef]
  20. Froment, G.F.; Bischoff, K.B. Chemical Reactor Analysis and Design; Wiley: New York, NY, USA, 1992. [Google Scholar]
Figure 1. XRD patterns of the as-synthesized FeMo/SiO2 catalysts. Symbols denote the crystalline phases: Fe2(MoO4)3 (■) and α-Fe2O3 (▲).
Catalysts 15 01004 g001
Figure 2. FT-IR spectra of the as-synthesized FeMo/SiO2 catalysts.
Catalysts 15 01004 g002
Figure 3. Effect of temperature on the ammoxidation of methanol. Operating conditions: FeMo/SiO2 catalyst, space time = 125 kgcat h/kmol, NH3/O2/CH3OH molar ratio of 1.1/2.7/1.0.
Catalysts 15 01004 g003
Figure 4. Stability of FeMo/SiO2 catalyst in the ammoxidation of methanol at 380 °C and space time = 125 gcat h/mol.
Catalysts 15 01004 g004
Figure 5. Comparison of experimental (■) and calculated (—) conversions as a function of space time at 380 °C for retained model I.
Catalysts 15 01004 g005aCatalysts 15 01004 g005b
Figure 6. Effect of O2/methanol molar ratios in the feed.
Catalysts 15 01004 g006
Figure 7. Values of the equilibrium constants of the reactions involved in the ammoxidation of methanol.
Catalysts 15 01004 g007
Figure 8. Parity plots for the various conversions of methanol.
Catalysts 15 01004 g008aCatalysts 15 01004 g008b
Figure 9. Fixed-bed experimental setup for the ammoxidation of methanol.
Catalysts 15 01004 g009
Table 1. The ammoxidation of methanol over FeMo/SiO2 as a function of reaction temperature.
Temp,
°C
Conv (MeOH)Yield of Products, %C BalanceN Balance
%HCNCOCO2%%
34085.072.02.27.095.596.7
36091.880.53.46.097.995.6
38097.288.02.85.298.898.6
400100.092.52.53.598.598.7
420100.093.13.13.299.497.6
440100.089.03.64.597.199.0
Table 2. Elemental composition and textural properties of the synthesized sample.
SampleComposition (wt.%)BET Analysis
FeMoSiOa Surface Area, m2/gPore Volume, cm3/g
FeMo/SiO218.2819.4931.6230.6117.080.0957
a The t-plot method indicated that micropores (<2 nm) accounted for 18.4% of the total surface area, with the remainder attributed to mesopores and macropores.
Table 3. Sensitivity of model (case II)-predicted output to kinetic parameters.
ParameterBase Value+10% Change (ΔOutput %)−10% Change (ΔOutput %)Sensitivity Level
A16.87401 × 10−13.9–4.7Moderate
A26.03154 × 1061.3–1.5Moderate
A35.72650 × 100–0.20.2Low
A42.10023 × 103–0.50.6Low
E11.34061 × 104–11.49.5High
E26.70289 × 104–22.412.2High
E32.57893 × 104–1.1–1.2Moderate
E45.35679 × 1043.6–8.2Moderate
Note: ΔOutput (%) denotes the percentage change in the model-predicted HCN yield caused by a ±10% variation in each parameter, with all other parameters held constant at their optimized values.
Table 4. Estimates of frequency factors, A, and activation energies, E, for the model of case II using the Levenberg–Marquardt algorithm.
Name of 95% Confidence Limits
ParameterEstimateLowerUppert-Value
A16.87401 × 10−16.39988 × 10−17.34815 × 10−12.89961 × 101
A26.03154 × 1065.20929 × 1066.85378 × 1061.46709 × 101
A35.72650 × 1004.56727 × 1006.88574 × 1009.87979 × 100
A42.10023 × 1031.87744 × 1032.32302 × 1031.88538 × 101
E11.34061 × 1041.29879 × 1041.38243 × 1046.41132 × 101
E26.70289 × 1046.58934 × 1046.81645 × 1041.18054 × 102
E32.57893 × 1042.42561 × 1042.73224 × 1043.36417 × 101
E45.35679 × 1045.19286 × 1045.52072 × 1046.53538 × 101
Disclaimer/Publisher’s Note: The statements, opinions and data contained in all publications are solely those of the individual author(s) and contributor(s) and not of MDPI and/or the editor(s). MDPI and/or the editor(s) disclaim responsibility for any injury to people or property resulting from any ideas, methods, instructions or products referred to in the content.