Article

Mechanistic Distinction Between Oxidative and Chlorination Transformations of Chloroperoxidase from Caldariomyces fumago Demonstrated by Dye Decolorization

1
Department of Chemistry, Lewis University, One University Parkway, Romeoville, IL 60446, USA
2
Advanced Technology and Manufacturing Institute, Oregon State University, Corvallis, OR 97330, USA
3
Department of Chemistry and Biochemistry, DePaul University, 1110 West Belden Ave, Chicago, IL 60614, USA
*
Authors to whom correspondence should be addressed.
Catalysts 2025, 15(10), 965; https://doi.org/10.3390/catal15100965 (registering DOI)
Submission received: 25 August 2025 / Revised: 3 October 2025 / Accepted: 5 October 2025 / Published: 9 October 2025
(This article belongs to the Special Issue Enzyme Engineering—the Core of Biocatalysis)

Abstract

Effluents from the textile industry, particularly those containing synthetic azo dyes, poses a significant environmental threat, necessitating the development of more effective and sustainable pollutant removal methods. Traditional dye removal techniques often fall short in efficiency and environmental impact, prompting the exploration of enzymatic degradation as a promising alternative. This study focuses on chloroperoxidase, a natural biocatalyst recognized for its ability to oxidize synthetic dyes into less harmful products. By exploring the mechanistic distinction between chlorination and oxidative processes, we investigate the enzyme’s specific degradation pathways for azo dyes and the resulting by-products. Utilizing analytical techniques, including liquid chromatography/mass spectrometry (LC/MS), and density functional theory (DFT), we gain insights into the decolorization mechanism, revealing that the enzyme preferentially generates oxidative products through C–N bond cleavage as its initial degradation step. These findings underscore not only the unique mechanistic properties of chloroperoxidase but also its potential as a biocatalyst for industrial applications. This study advocates further research into the optimization of enzyme-based systems, highlighting their relevance in advancing greener chemical practices in the textile industry, thus contributing to more sustainable manufacturing processes.

1. Introduction

Environmental pollution, driven largely by human activities, is a global issue with far-reaching consequences [1,2,3]. The textile industry is a major contributor to this problem, particularly through the introduction of dye pollutants into aquatic systems. Textile dyes, which vary widely in their origins, chemical structures, and applications, are often synthetic and include categories such as azo dyes [4,5]. These dyes are extensively used to color both natural and synthetic fibers. However, during textile production, toxic chemicals, including dyes, are released into the environment, primarily because these dyes do not form strong bonds with the fabric [5]. As a result, when these dyes enter aquatic ecosystems, they can cause significant ecological harm [6,7,8,9].
Azo dyes, which are characterized by an N=N azo bond in their chemical structure, represent the largest category of textile dyes (see Figure 1), accounting for over 60% of the total used [6,10]. It is estimated that between 15% and 50% of these dyes end up in wastewater, with some being treated while others are directly released into water bodies, potentially reaching 280,000 tons of dye-contaminated discharged worldwide [11,12]. These dyes pose a dual threat: they are toxic to aquatic organisms when ingested, and by reducing the amount of light that penetrates the water, they hinder the growth of algae and other aquatic plants, disrupting the ecosystem [6,7,8,9,13,14,15].
In humans, the ingestion of azo dyes can lead to their conversion by gut microflora into more toxic compounds, which may contribute to intestinal diseases [16]. Additionally, azo dyes can be absorbed through the skin, where bacteria on the skin can transform them into carcinogenic aromatic amines [17]. As a result, when degrading azo dyes, it is crucial to also monitor the degradation products, as they may be even more toxic than the parent compounds. These factors must be carefully considered when developing effective wastewater treatment methods aimed at mitigating the harmful effects of azo dyes [14,18].
Azo dye degradation has been studied extensively through both chemical and biochemical methods [19]. In wastewater treatment, traditional physical and chemical processes are commonly employed to remove azo dyes. These include techniques such as membrane filtration, precipitation, ion exchange, electrolysis, and advanced chemical oxidation methods [20,21]. While effective, these treatments often require high energy inputs and can produce secondary waste, leading to concerns about their sustainability [22]. On the other hand, biological treatment methods offer a promising, environmentally friendly alternative for azo dye degradation. Microorganisms, in particular, play a key role in this process through the use of enzymes like azoreductases, laccases, and peroxidases, which break down azo compounds into less harmful byproducts [23,24,25]. These biological approaches not only offer an eco-friendly solution but also have the potential to be more cost-effective and energy-efficient compared to traditional methods [8,26].
While promising, biological approaches for dye degradation face limitations concerning operational stability, efficiency, and formation of toxic by-products. For example, many biological systems can be kinetically slow, with incubation times required to achieve over 95% decolorization efficiency ranging from hours to several days [27,28]. While enzymes like azoreductases and laccases can effectively cleave the N=N azo bond, this reduction often leads to the formation of toxic aromatic amines that require further processing for complete degradation [29,30]. Similarly, oxidative enzymes like peroxidases can decolorize dyes, but the specific mechanisms and by-products are not always fully understood [31].
Chloroperoxidase (CPO) is a P450-like heme-thiolate enzyme that displays diverse catalytic activity [6,7,8,9,32,33,34,35,36,37,38]. In terms of azo dye degradation, significant work has focused on enhancing the catalytic efficiency of free CPO by immobilizing or co-immobilizing it onto a solid substrate [36,37,38]. Research has shown dramatic improvements to CPO’s stability, activity, and reusability across various temperatures and pH values when these solid supports are used to immobilize CPO.
Previous studies have indicated that the degradation method of azo dyes proceeds via a halogen-dependent pathway with the formation of hypochlorous acid (HOCl), thereby requiring chloride ions for the reaction [6,7,8,9]. However, this proposed mechanism is called into question when no chlorinated products are observed after degradation with hypochlorous acid. Furthermore, it is known that CPO catalyzes the oxidation of C–H bonds, aligning with dye products seen previously and suggesting an alternative, non-halogenating pathway may be operative [32]. Understanding the detailed mechanism of CPO azo dye degradation is therefore necessary for optimizing and designing efficient catalytic systems that can be easily scaled to industrial needs.
In this study, we investigate the degradation of azo dyes, specifically methyl orange and Orange G, using a chloroperoxidase enzyme derived from the marine fungus Caldariomyces fumago. Employing experimental enzyme assays, liquid chromatography coupled with mass spectrometry (LC/MS), and density functional theory (DFT) analyses, we identify C–N bond cleavage as the predominant reaction pathway, followed by subsequent oxidations. This mechanistic approach leads to the formation of by-products that are significantly less toxic than the original azo dyes (vide infra). The growing interest in microbial degradation and enzymatic processes for azo dye remediation underscores the importance of optimizing these biocatalytic treatments for industrial applications. By leveraging the unique mechanistic properties of chloroperoxidase and its dual chlorination and oxidative capabilities, we are poised to develop sustainable and efficient strategies for azo dye removal from wastewater.

2. Results

The efficiency of azo dye degradation by chloroperoxidase (CPO) depends on pH, with a pKa of approximately 2.7. This pKa is linked to a nearby glutamate-183 residue that supplies protons to the enzyme’s active site (see Figure 2) [33,34,35]. Using a combination of enzymatic assays, LC/MS analysis, and DFT calculations, we propose a detailed mechanism for how C. fumago chloroperoxidase enzymatically degrades azo dyes. Additionally, we provide evidence that the presence of chloride ions enhances both the rate and efficiency of the degradation process.

2.1. Optimizing Reaction Conditions for MO and OG Degradation

Figure 3a shows that the efficiency of decolorization of azo dyes is sensitive to peroxide concentration, where 0.5–1 mM are the concentrations yielding the maximum degradation. Therefore, 0.5 mM was used in all of our further trials. Figure 3b shows degradation efficiency with respect to temperature, where the T50 is 65.7 °C. It is not surprising that chloroperoxidase shows temperature dependence, but its temperature stability—T50 (the temperature at which the enzyme retains 50% of its activity over 5 min)—is similar to that of enzymes from mesophilic organisms. This suggests that chloroperoxidase has relatively enhanced stability compared to enzymes from more thermally active sources, leading to a potentially more stable biocatalyst for industrial processes [39,40].

2.2. Halogen Dependence of the Decolorization of Azo Dyes by Chloroperoxidase

Previous studies have shown that the presence of chloride ions improves the efficiency of azo dye degradation [41,42]. For example, one study found that without chloride ions, the decolorization of Orange G (an azo dye) was nearly negligible [6]. To investigate how halogen ions influence the azo dye degradation efficiency of chloroperoxidase, we conducted the following experiments:
  • Measured degradation efficiency at varying chloride and fluoride concentrations.
  • Analyzed the degradation products of azo dyes with and without chloride ions using LC/MS.
  • Examined azo dye degradation by hypochlorous acid (HClO) and analyzed the products with LC/MS.

2.2.1. Degradation Efficiency with Chloride and Fluoride Ions

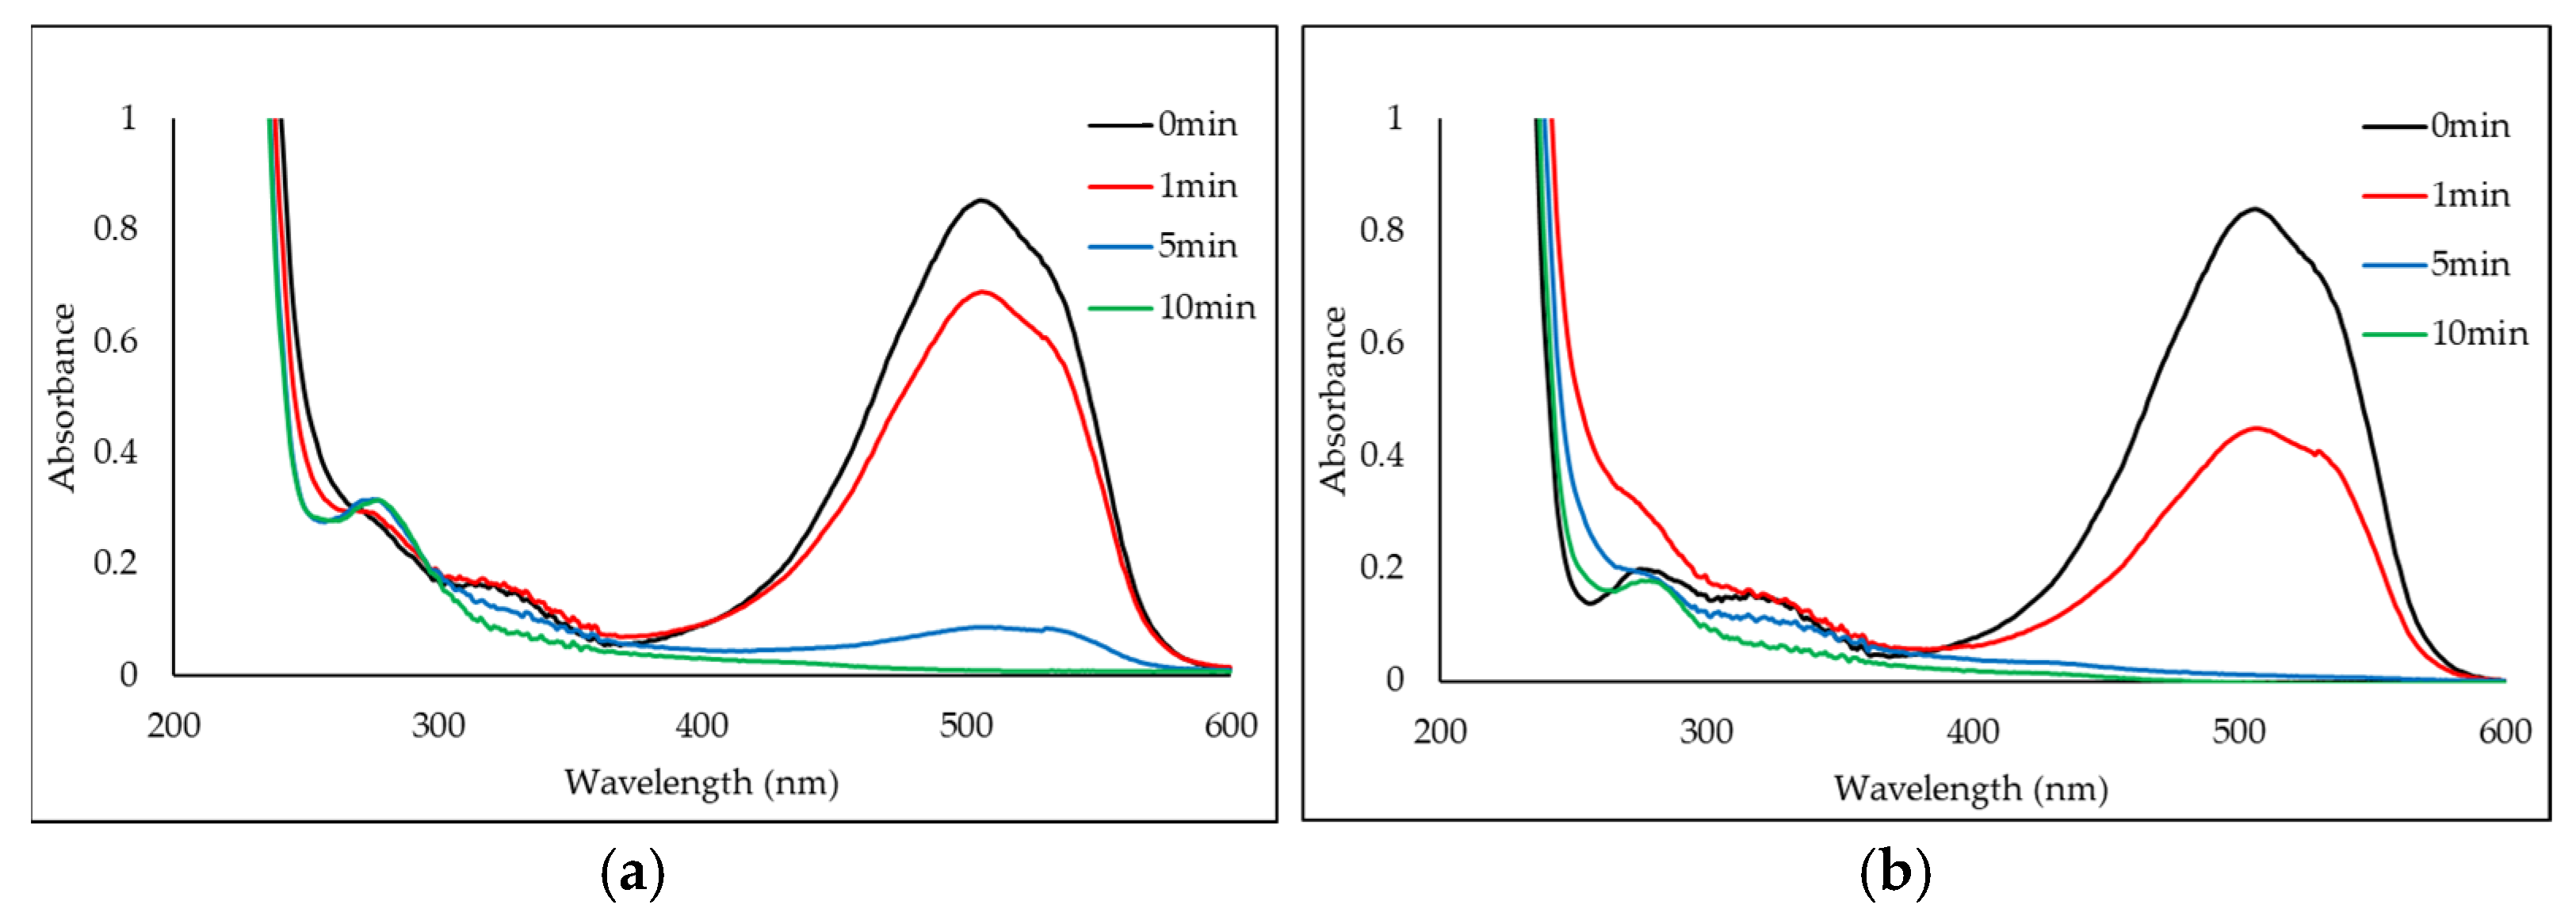
Because adventitious chloride ions are present even in carefully prepared solutions, the lowest achievable chloride concentration was 5 ppm as detected by a Vernier chloride ion-selective electrode. Therefore, all added chloride ions in our experiments were above this threshold. UV/vis spectra comparison of methyl orange degradation with and without 5 ppm chloride is shown in Figure 4. We examined how the addition of chloride ions affected the degradation of methyl orange over time, as shown in Figure 5. In all experiments, we used 0.5 mM H2O2 and 60 nM chloroperoxidase (CPO).
Using the Henderson–Hasselbalch equation (pH = pKa + log [A/HA]), the availability of fluoride ions can be compared to chloride ions used in the experiment shown in Figure 4. For this reaction, where the pH is 2.65 and the pKa of HF is 3.17, the calculated ratio of [F]/[HF] is 0.30 [43]. This indicates that F ion is only partially available, whereas 100% of the chloride is available as the active Cl ion. Therefore, reaction conditions were determined using this method.
Although our findings indicate that chloride ions are not essential for the CPO-mediated degradation of methyl orange (MO), their presence appears to activate the enzymatic system as a co-substrate. CPO’s catalytic conditions in the presence of Cl ions were determined to be as follows: Vmax = 22.9 μM/min, Km = 12.6 μM, and kcat = 382 min−1. Previous research has proposed that fluoride ions can inhibit chloroperoxidase activity through competitive inhibition. In our experiments, the addition of fluoride ions resulted in minimal differences compared to the addition of chloride ions (Figure 5), with only a slight reduction in the reaction rate observed. Since fluoride ion does not act as a co-substrate for CPO, catalytic parameters could not be extracted, but an instantaneous rate of 22.5 μM/min was observed at [Cl] = 5 ppm, and 10.3 μM/min at [F] = 16.6 ppm. The lack of concentration-dependent response and constant methyl orange degradation rates indicate fluoride does not serve in activating or dramatically inhibiting the catalytic activity of CPO. Based on these observations, we hypothesize about the potential role of chloride ions within the reaction mechanism underlying CPO-mediated azo dye decolorization (vide infra).

2.2.2. Degradation Products of Azo Dyes by CPO with and Without Chloride Ions by LC/MS

Liquid chromatography time-of-flight mass spectrometry (LC-TOF-MS) was used to analyze the degradation products of methyl orange (MO) and Orange G (OG) in the presence of CPO and H2O2 (pH = 2.56). Given that both MO and OG are sulfonic acid-functionalized azo dyes, the negative ion mode was deemed most appropriate due to the strong acidity of the sulfonic acid group [44,45]. The positive ion mode was also tested, but the complexity of the reaction mixture and the low intensity of degradation products led to a number of unidentified peaks that could not be rationalized based on the reaction conditions.
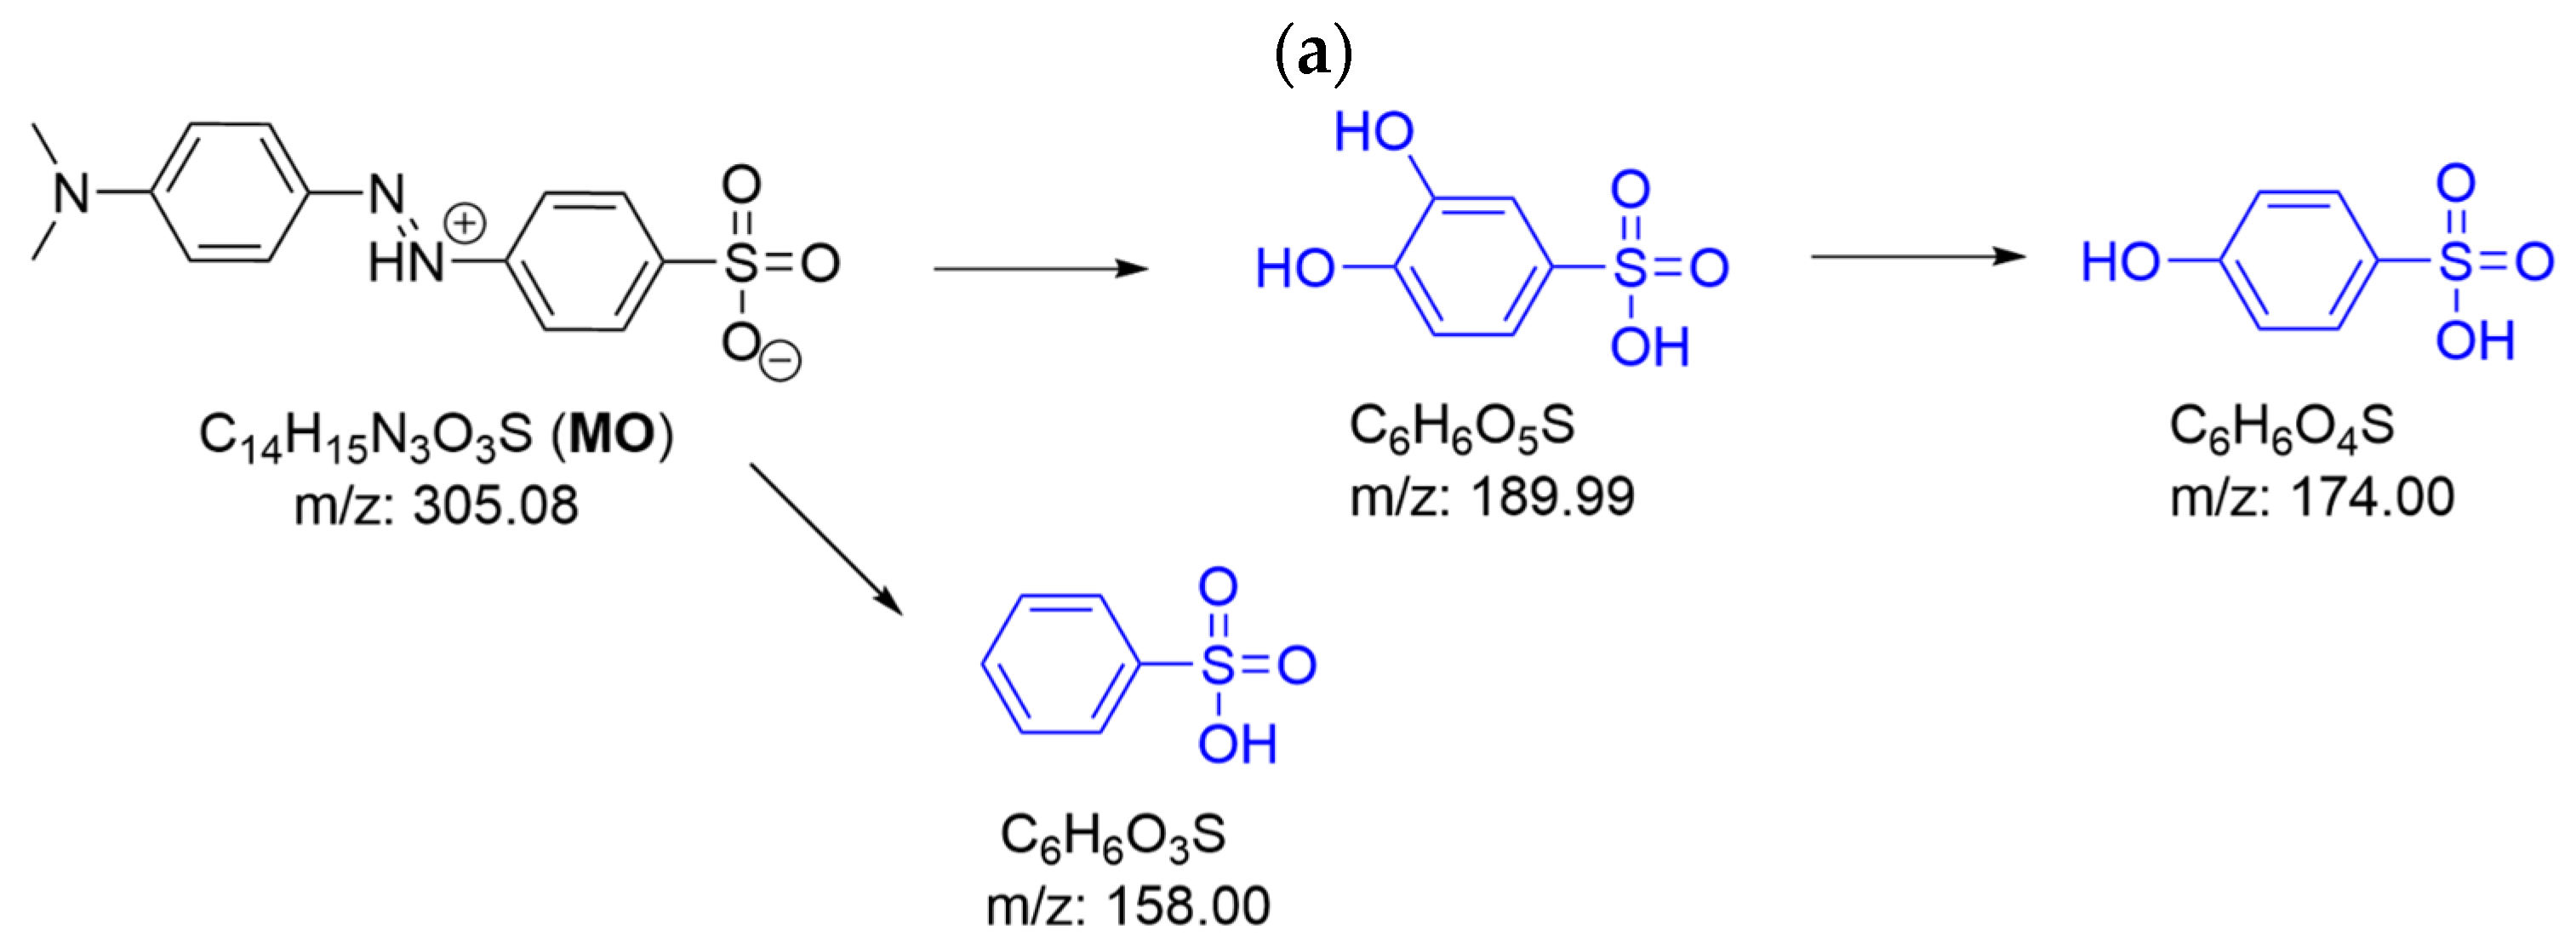
The decomposition of MO in the presence of H2O2 and CPO led to an intense chromatographic peak at 0.296 min (Figure S2) that showed peaks in the negative ion mode mass spectrum at m/z = 188.99 (minor) and 172.99 (parent). These two peaks are well modeled by the monoisotopic molecular ions of [C6H6O5S-H] (calc. m/z = 188.986, Figure S3) and [C6H6O4S-H] (calc. m/z = 172.991, Figure S4), respectively, and likely correspond to the monoanionic species dihydyroxybenzenesulfonate (and corresponding quinone) and hydroxybenezenesulfonate (Figure 6). A smaller LC peak at 0.513 min (Figure S5) corresponds to m/z = 156.99 and is well modeled by the monoisotopic molecular ion [C6H6O3S-H] (calc. m/z = 156.996, Figure S6) and can be assigned as benzenesulfonate. These products suggest C-N bond cleavage by CPO at the benzenesulfonic acid ring to eliminate the azo fragment.
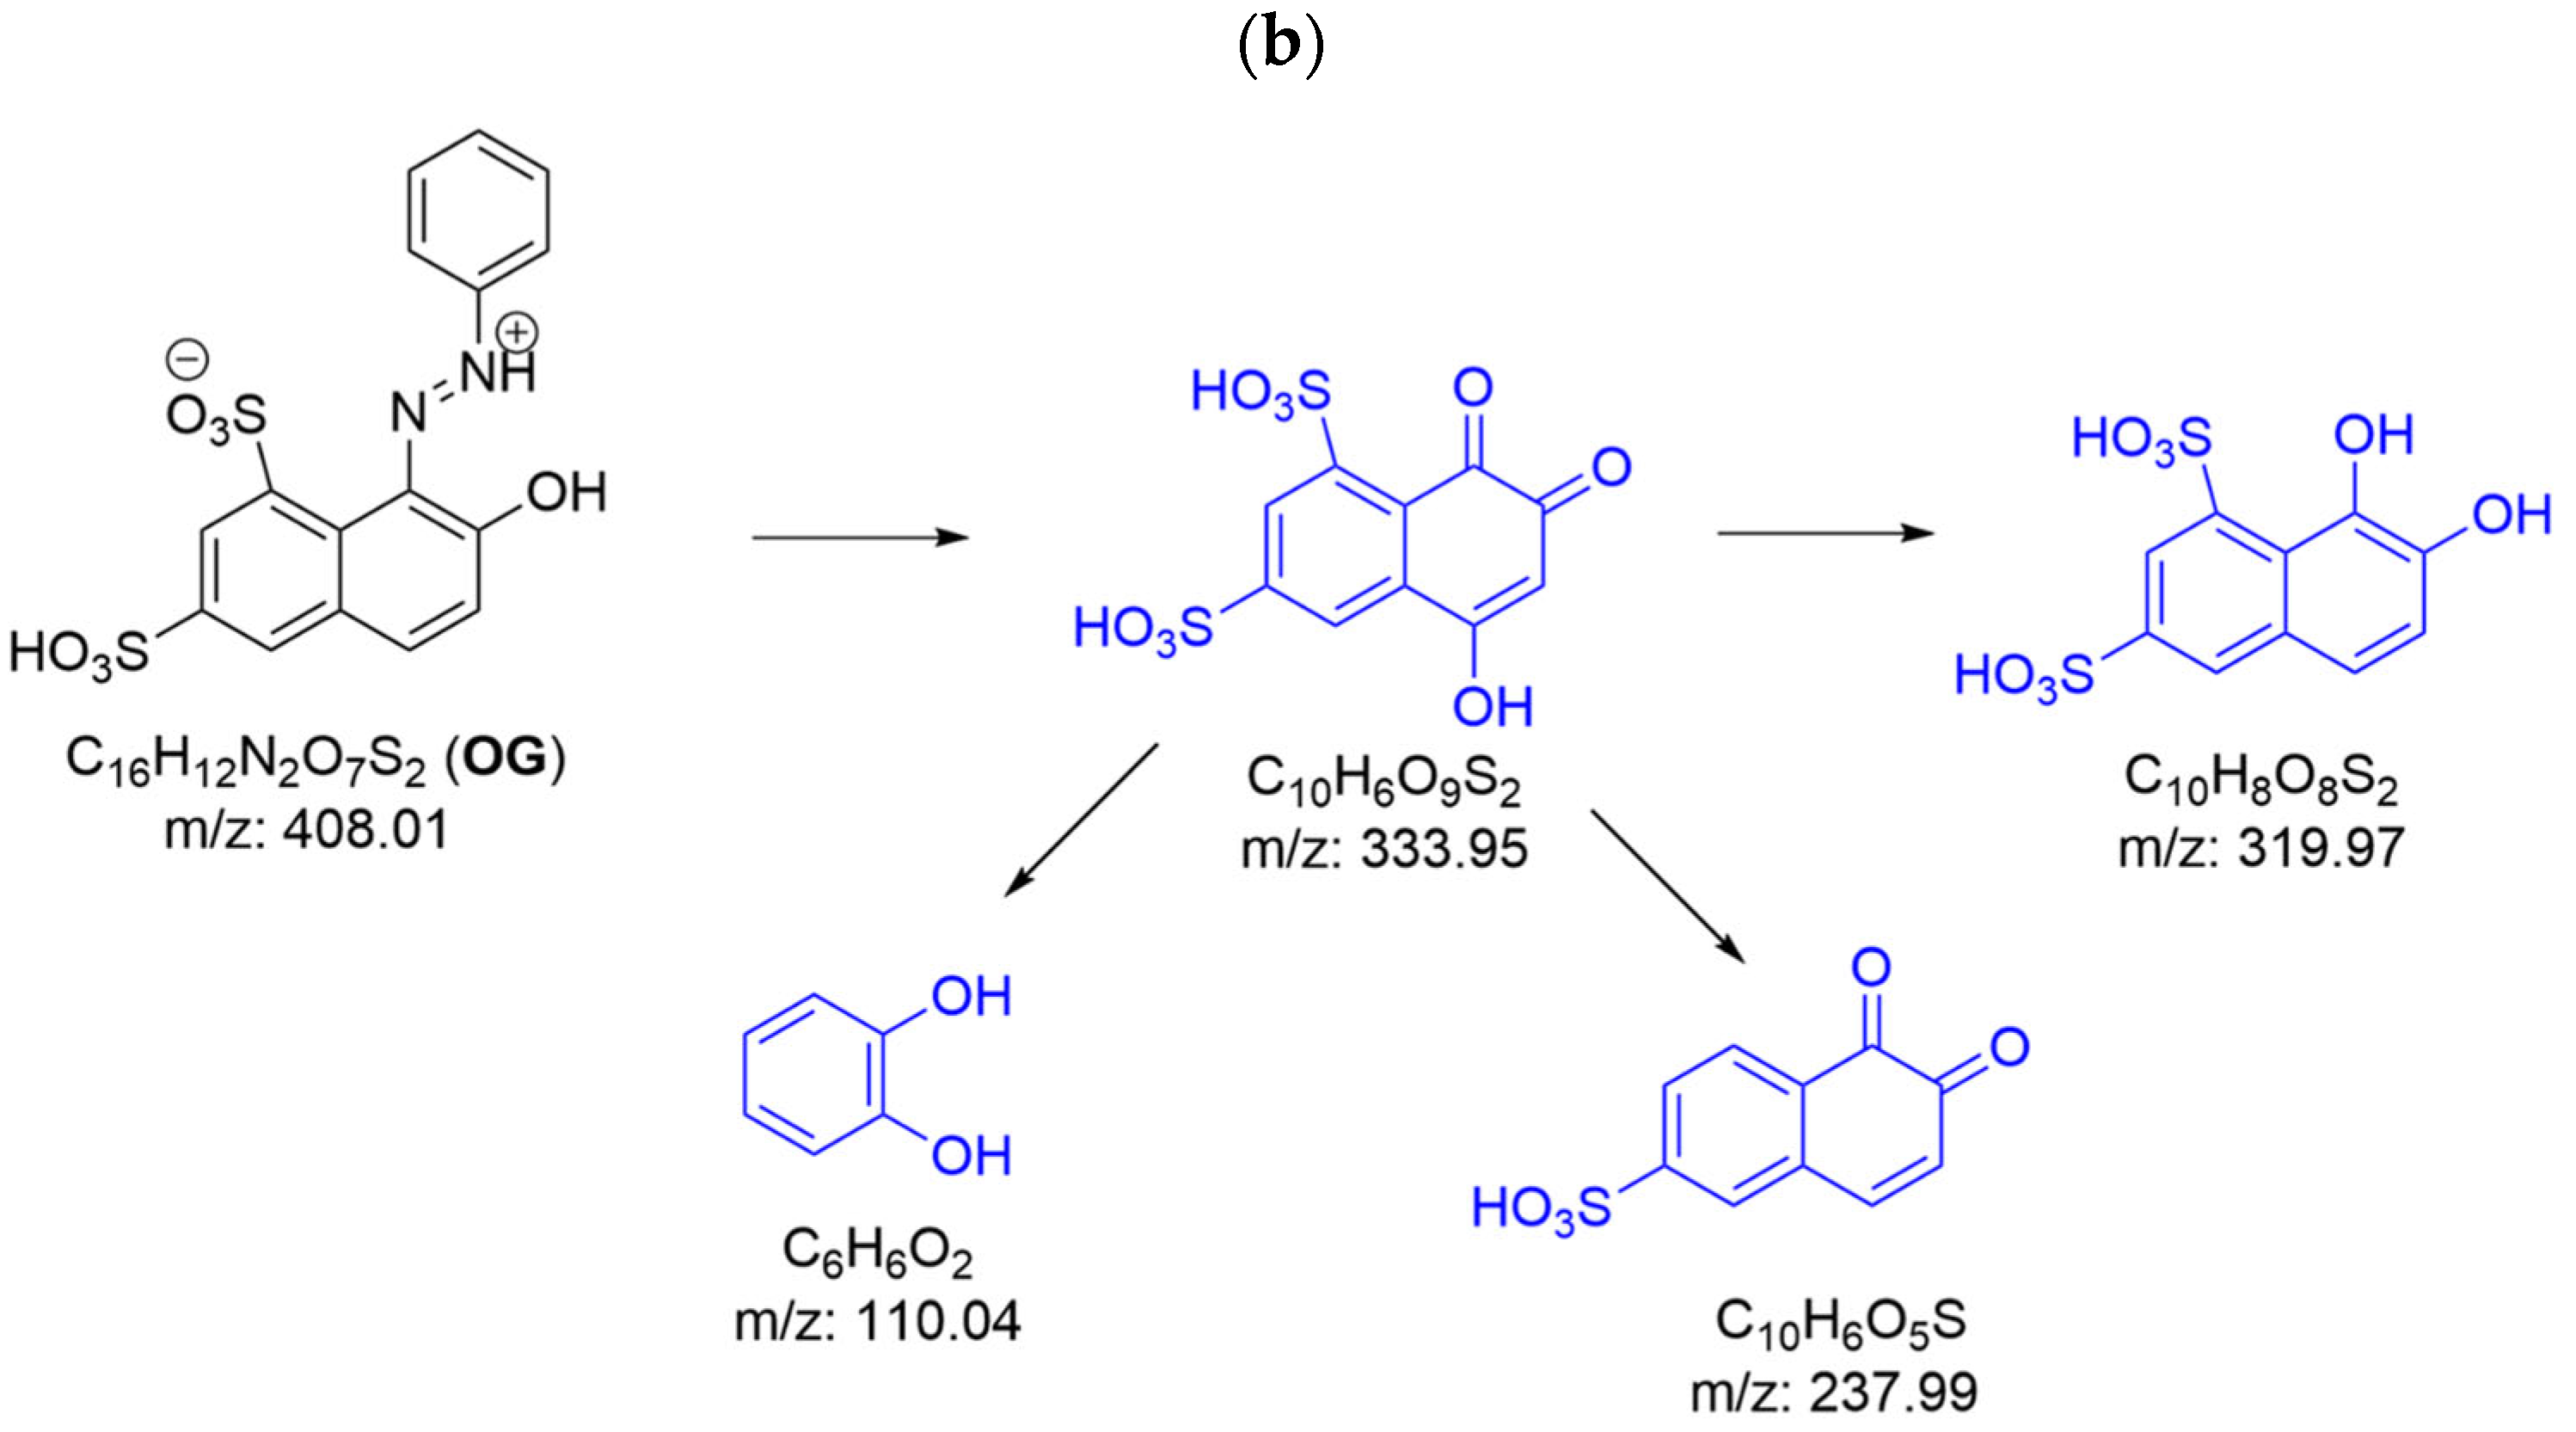
The degradation of OG by CPO in the presence of H2O2 also led to hydroxylated products. The LC exhibits an intense peak at 0.306 min (Figure S7) and a corresponding major ion peak in negative ion mode with m/z = 332.94. This species is well modeled by the monoisotopic molecular ion [C10H8O9S2-H] (calc. m/z = 332.938, Figure S8) and was tentatively assigned to hydroxy-disulfonic-napthoquinone (Figure 6b) with some contribution from the corresponding hydroxy-disulfonic-napthocatechol (Figure S9). A similarly intense LC peak at 0.440 min (Figure S10) has a corresponding major ion at m/z = 318.96 and is well modeled by the monoisotopic molecular ion [C10H8O8S2-H] (calc. m/z = 318.958, Figure S11). It should be noted that these peaks are early-eluting and not symmetrical, possibly due to column overload based on the low concentration of the samples. Attempts to reduce peak tailing were unsuccessful. A smaller LC peak at 0.906 min (Figure S12) has a major ion peak at m/z = 109.03, which is well modeled by the monoisotopic molecular ion [C6H6O2-H] (calc m/z = 109.029, Figure S13) and likely corresponds to the catecholate ion.

2.2.3. Azo Dye Decolorization Products with Hypochlorous Acid

Additional experiments were conducted to elucidate the role of chloride ions in the enzyme-mediated dye degradation process. Previous hypotheses have proposed the formation of an Fe(III)–OCl intermediate during azo dye degradation. To investigate this, we examined the reaction products resulting from the interaction of hypochlorous acid (HOCl) with methyl orange (MO). Analysis of the reaction of methyl orange in the presence of NaOCl and H2O2 led to chlorinated products with tentative structures shown in Figure 7. In the positive ion mode, a peak at 1.22 min (Figure S14) in the LC and a corresponding parent ion peak with m/z = 206.01 (calc. m/z = 206.013, Figure S15) were observed. This species corresponds to a tentative dichloro-dimethylaniline product, [C8H9NOCl2+H]+, in which cleavage of the opposite C–N bond and hydroxylation occurred. Fragmentation of this species by loss of HO• resulted in the observation of a peak with m/z = 189.01 (calc. m/z = 189.011, Figure S16), strengthening this assignment. In the negative ion mode, the LC showed a single peak at 1.58 min (Figure S17) and a corresponding parent ion peak at m/z = 185.03 (calc. m/z = 185.028, Figure S18). This ion is well modeled by [C8H10O3S-H]. Interestingly, for a sample without H2O2, the LC exhibited this same peak at 1.58 min along with a new peak at 2.67 min (Figure S19), corresponding to a negative ion peak at m/z = 218.99 (calc. m/z = 218.988, Figure S20). These species observed in the negative ion mode are unexpected due to the “addition” of an ethyl group and may have resulted from reaction with the media under ionization. Inclusion of a diazo group based on C–N bond cleavage leads to poor modeling of both of these species ([C6H6N2O3S-H], calc. m/z = 185.003, Figure S21; [C6H5N2O3SCl-H], calc. m/z = 218.964, Figure S22). Although the addition of sodium hypochlorite (NaOCl) led to rapid decolorization of MO, the chlorinated products observed, as illustrated in Figure 7, did not resemble those formed during the CPO/H2O2 system’s reaction, whether in the presence or absence of chloride ions. Furthermore, quantitative analysis of hypochlorite ions (OCl) using TMB indicated that no detectable OCl was generated by the CPO/H2O2 system under chloride-containing conditions (see Figure S1).
Although Orange G is considered to be relatively safe compared to methyl orange, based on a comparison of known data found in their respective SDSs, a major concern of azo dye degradation is the formation of carcinogenic aromatic amines. Unfortunately, toxicological data for many of these proposed degradation products are unknown, but relative toxicity can be estimated through structural similarities to known compounds and/or functional groups using such programs as ProTox3.0. The following toxicology comparison leverages known (or estimated) LD50 values typically found in Safety Data Sheets and estimated LD50 values using ProTox3.0 (Table 1). The LD50 values cited are used as a proxy and should not be taken as reflective of ecotoxicity or species-specific toxicity, as these studies are lacking for many of the compounds in Table 1 [46,47].
The above-mentioned LC-MS analysis of the degradation products of Orange G and methyl orange by CPO suggests that N=N bond cleavage is not the preferred mechanism, but rather C–N bond cleavage. The implications of this difference are that C–N bond cleavage will result in minimal aromatic amine formation for either cleavage fragment. This C–N bond cleavage in methyl orange is proposed to release a diazo-dimethylaniline cation Figure 6) and a benzenesulfonate fragment. While the diazo-dimethylaniline fragment will most likely hydrolyze to 4-dimethylaminophenol (not detected by LC-MS), the relative toxicity of 4-dimethylaminophenol is much less than that of methyl orange. Likewise, all of the sulfonic acid fragments are predicted to be less toxic than methyl orange.
In the case of Orange G, cleavage of the naphthalenic C–N bond is proposed to release a diazobenzene radical, which can be envisioned to hydrolyze to phenol. The relatively low predicted toxicity of Orange G results in all cleavage products (Figure 6b) having predicted toxicities greater than the starting azo dye.

2.3. DFT Analysis of Reaction Products

The oxidative degradation of azo dyes involves the loss of the diazo group, and we were curious about the early steps in the mechanism, such as which C–N bond is most easily broken upon oxidation. Density functional theory (DFT) was used to calculate the reaction energies during the degradation of two dyes: methyl orange and Orange G. The functional and basis set used were MN15 and def2-TZVP, with SMD solvation to model the water solvent [48,49,50].
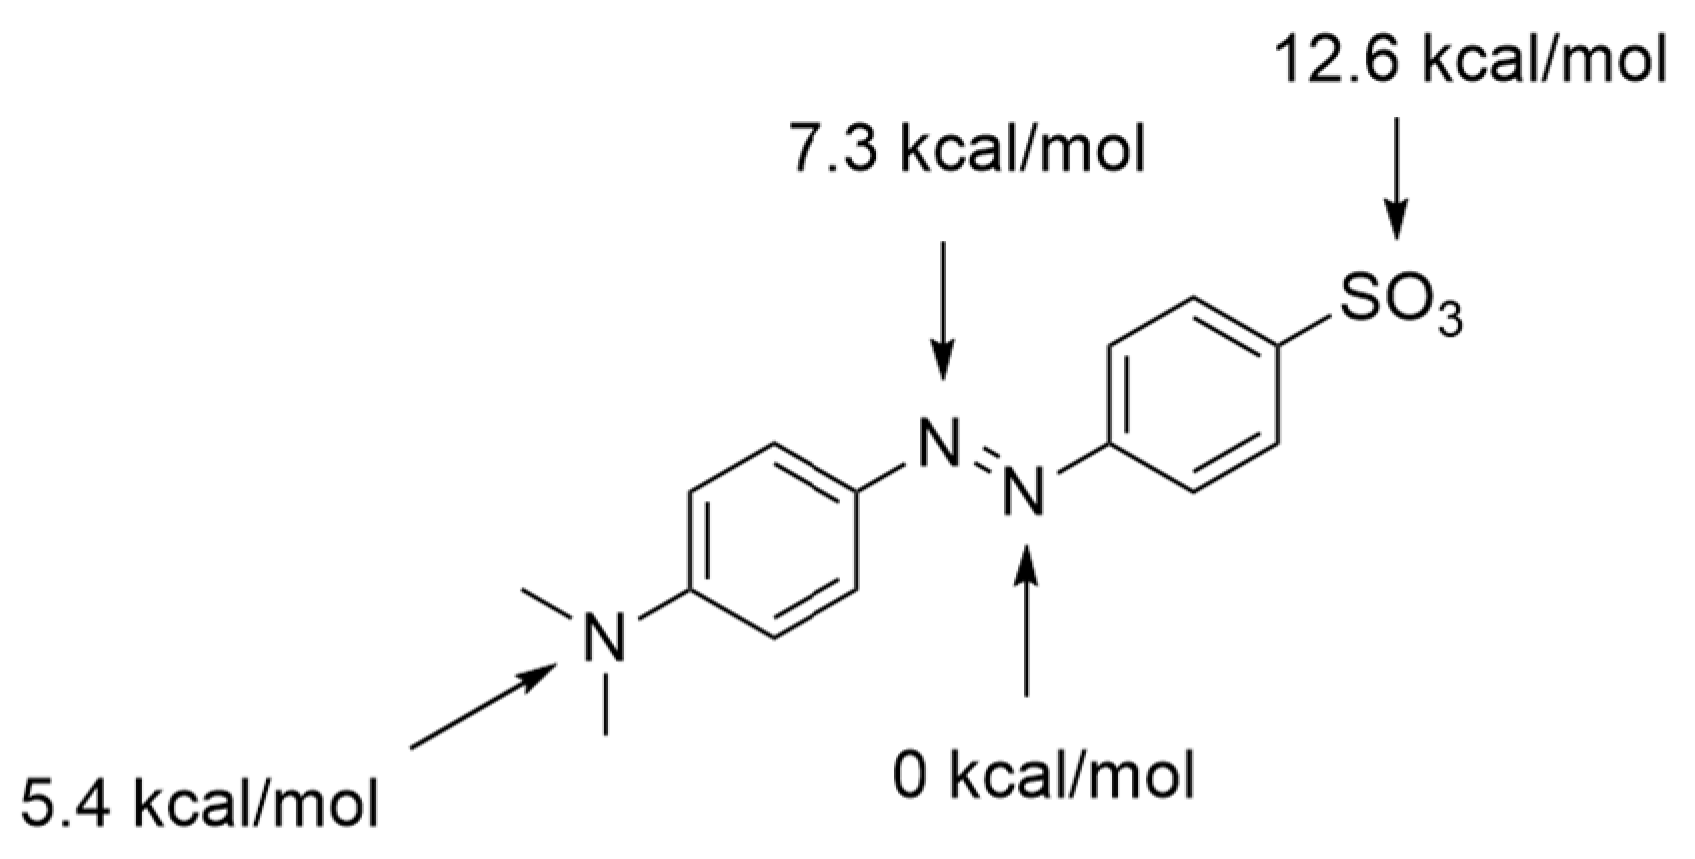
Before examining the oxidation of the dyes, the protonation state needed to be established. In the acidic solution, MO and OG would be in their protonated form, but several different structures have been drawn for these species in other studies that examine them. We calculated the energies of the protonated forms of methyl orange and Orange G, and found that in both cases, the proton is most stable on the azo linker, with the proton on the nitrogen of the azo that is closest to the sulfonated side for MO (see Figure 8 for the relative energies of protonation sites of MO). The protons being present on the azo group instead of another site on MO and OG are also observed in the crystal structures of these dyes [51,52].
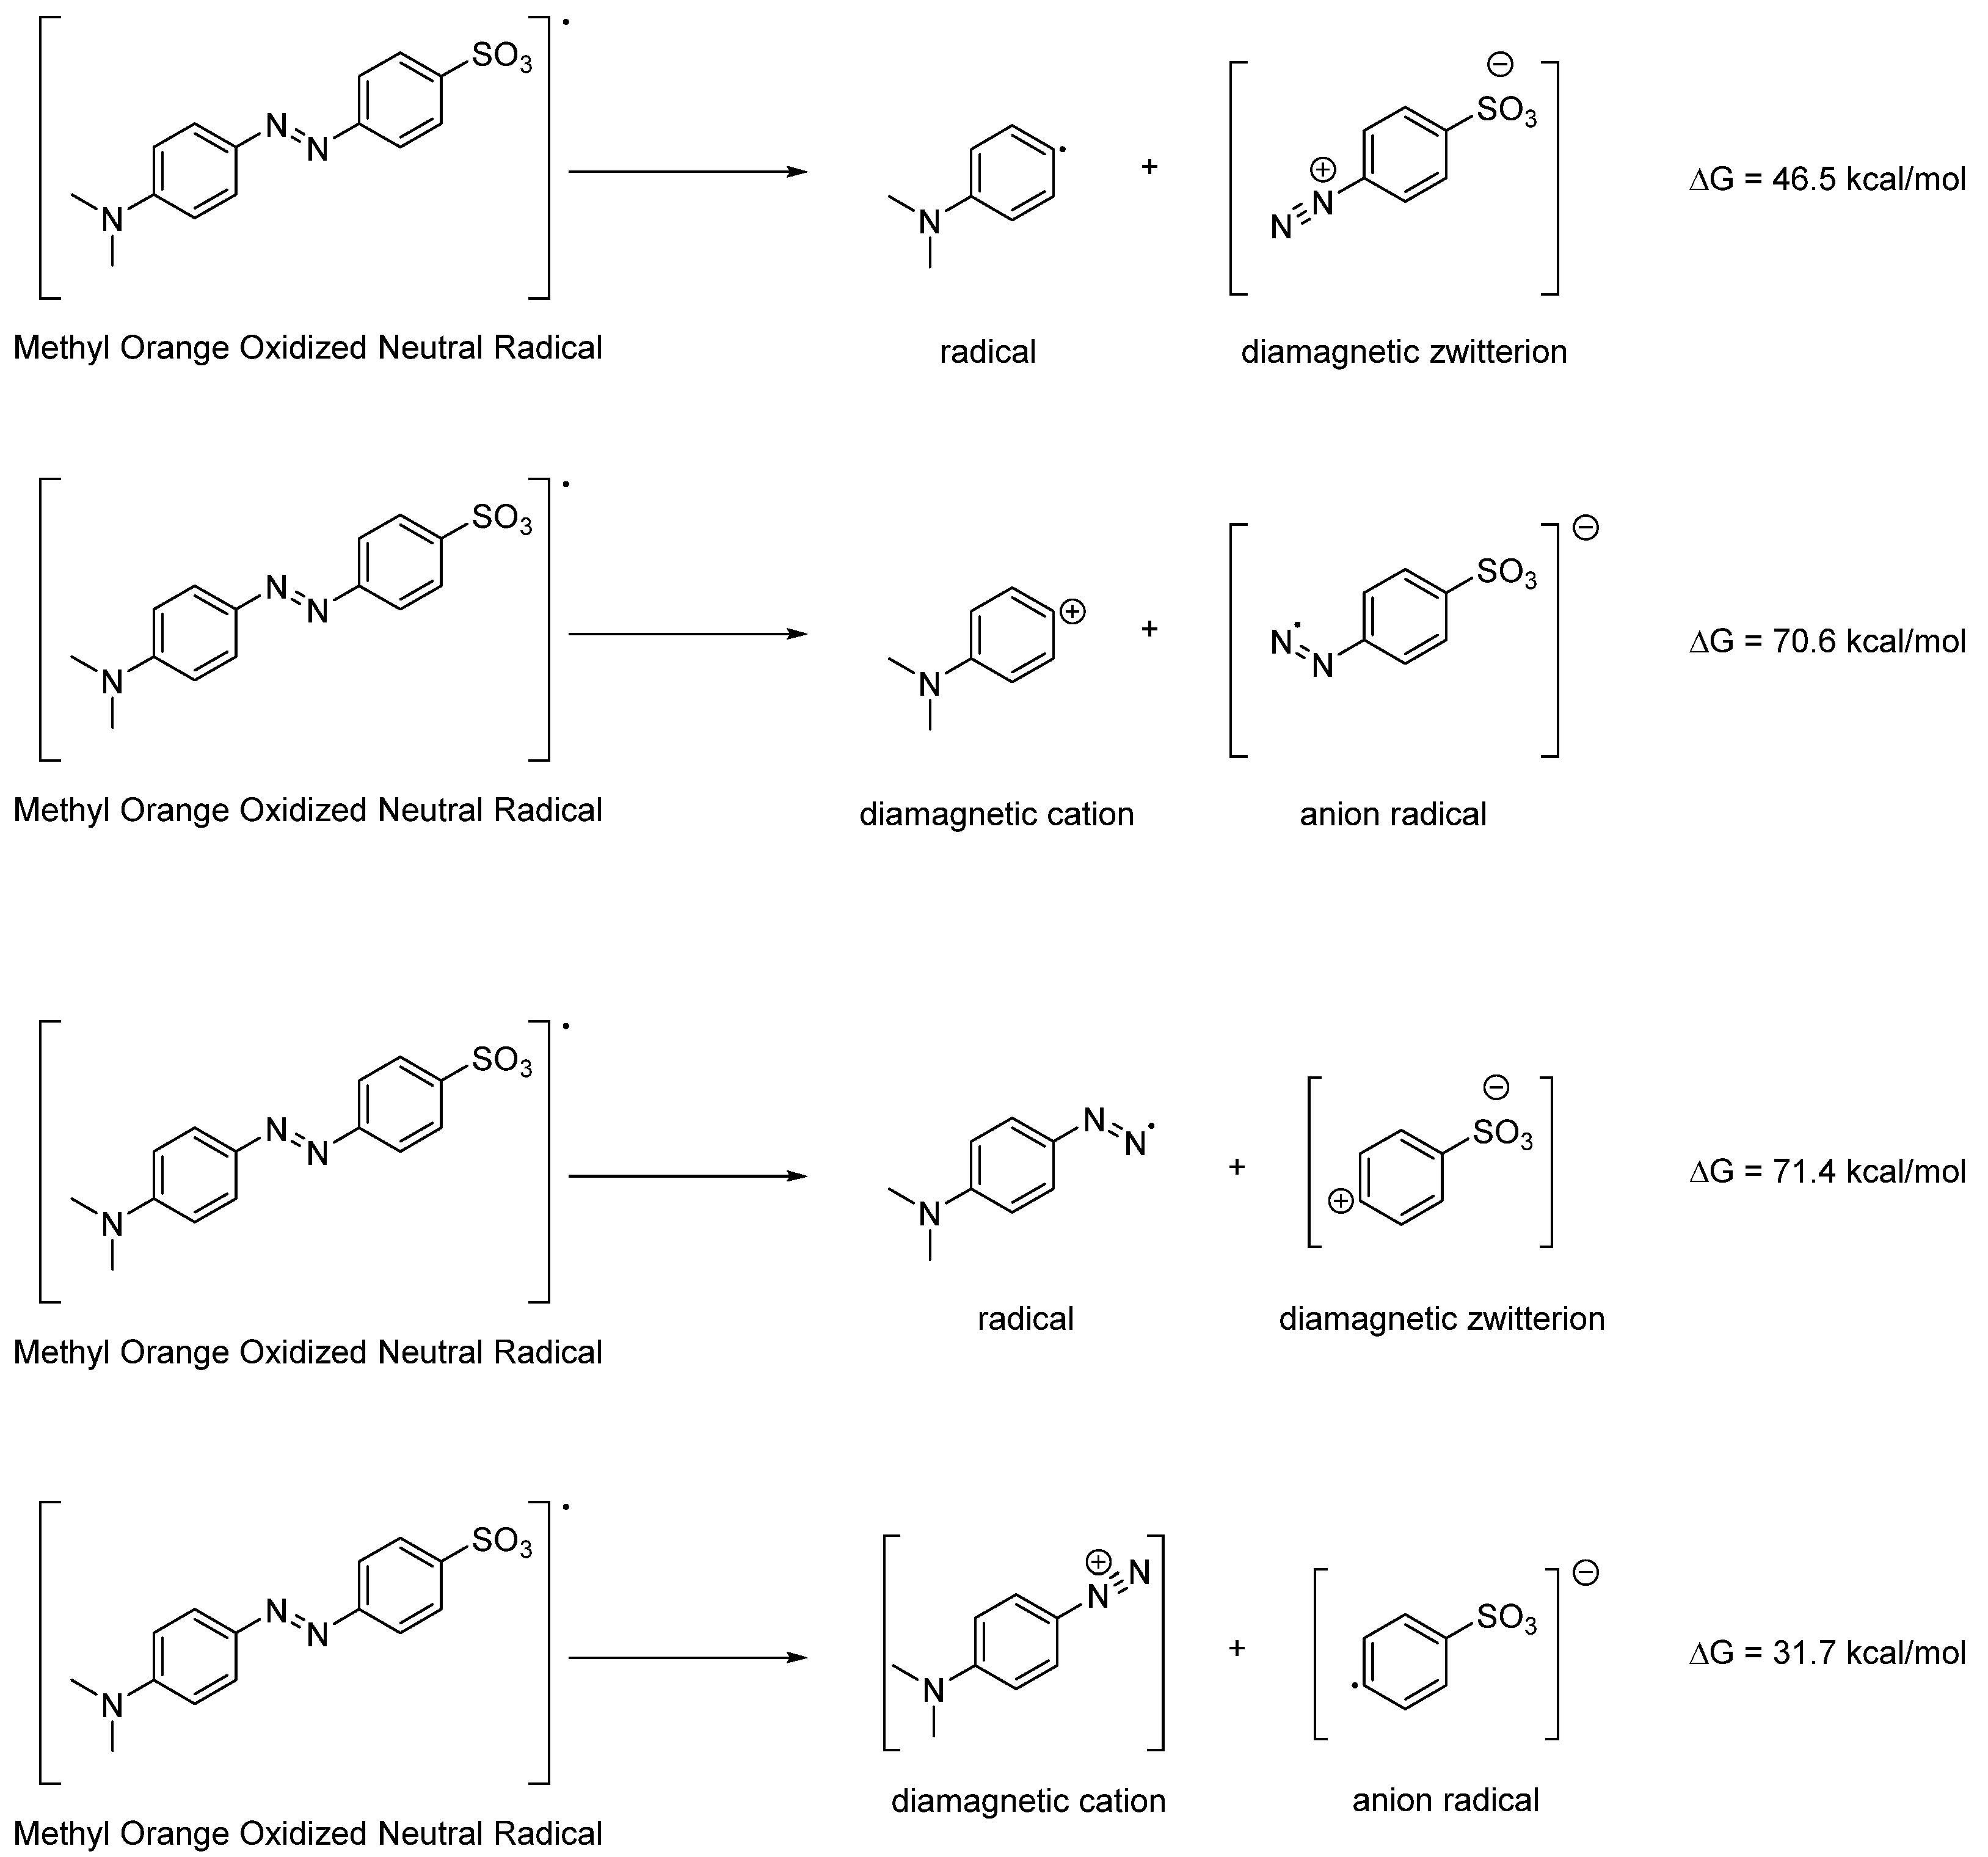
Upon oxidation, the dyes would become much more acidic and would lose the acidic proton. This proton-coupled electron transfer process could occur by oxidation followed by deprotonation, or as hydrogen atom abstraction by an iron oxo, peroxo, or similar species in the CPO active site. No matter the mechanism, the result would be a deprotonated, 1e-oxidized dye. In the case of MO, it would be a neutral paramagnetic radical, and we examined the thermodynamics of C–N cleavage from this species. Four options were explored, shown in Figure 9. The lowest energy process would form a diazonium on the dimethylaminophenyl side, which is consistent with the use of diazonium species to make azo dyes like MO and OG. These initial calculations provide overall thermodynamics of the C–N bond cleavage steps, and ongoing work will examine the transition states and further steps in the degradation process. It should be noted that these are overall dissociative bond-breaking energies, and the bond cleavage may also be enabled by nucleophilic attack of the oxidized species by water, hydrogen peroxide, or another species. These mechanistic options will be examined in subsequent work. Further, the full catalytic mechanism will need to include a study of the processes in the enzyme active site.
We similarly examined the C–N bond cleavage of the oxidized, deprotonated form of Orange G, and the four options are shown in Figure 10. Interestingly, the lowest energy bond breaking involves the formation of a phenyldiazo radical. However, transition state calculations are ongoing. Phenyl diazonium has been observed from the oxidation of Orange G in solution [6], and this suggests that the reaction possibilities shown in Figure 10 are the pathways for the decomposition of the oxidized and deprotonated Orange G, but further studies are ongoing to assess the transition states for these possibilities and others involving reaction with water or other species. Note that these reactions would only be the first in a series of steps, and that the intermediate products could be further oxidized by the reaction conditions.

2.4. DFT Analysis of Anion Binding by an Arginine Side Chain

Given the clear effects of the halides, chloride and fluoride, on catalysis, but the lack of halogenated products, these halides are likely interacting with CPO in a site other than the iron center. The experimental findings reported above prompted us to reevaluate the role of chloride ions in the activation of CPO during azo dye decolorization. CPO is not the only enzymatic system that utilizes anions to facilitate reaction activation; for instance, Photosystem II employs chloride ions in its catalytic cycle [53,54]. Studies have demonstrated that the absence of chloride ions impairs the water-oxidizing capacity of the water-oxidizing complex (WOC). Supporting this mechanistic framework, a study by Olesen and Andréasson proposes the existence of an anion-binding site near the active site, involving a positively charged amino acid that participates in a proton-relay system responsible for proton transfer during catalysis [55]. We propose that the presence of chloride in the distal pocket may serve two functions: (1) acting as a “gate” that regulates the proton transfer relay, and (2) engaging in electrostatic interactions with the iron center, similar to thiolate ligation. In contrast, fluoride binds more strongly, which prevents proton transfer and inhibits interaction with the iron. This highlights the critical role of arginine (Arg-111) in CPO. As illustrated in Figure 11, the proposed proton-relay network suggests a potential connection between the catalytically active Glu-183 and a nearby arginine residue.
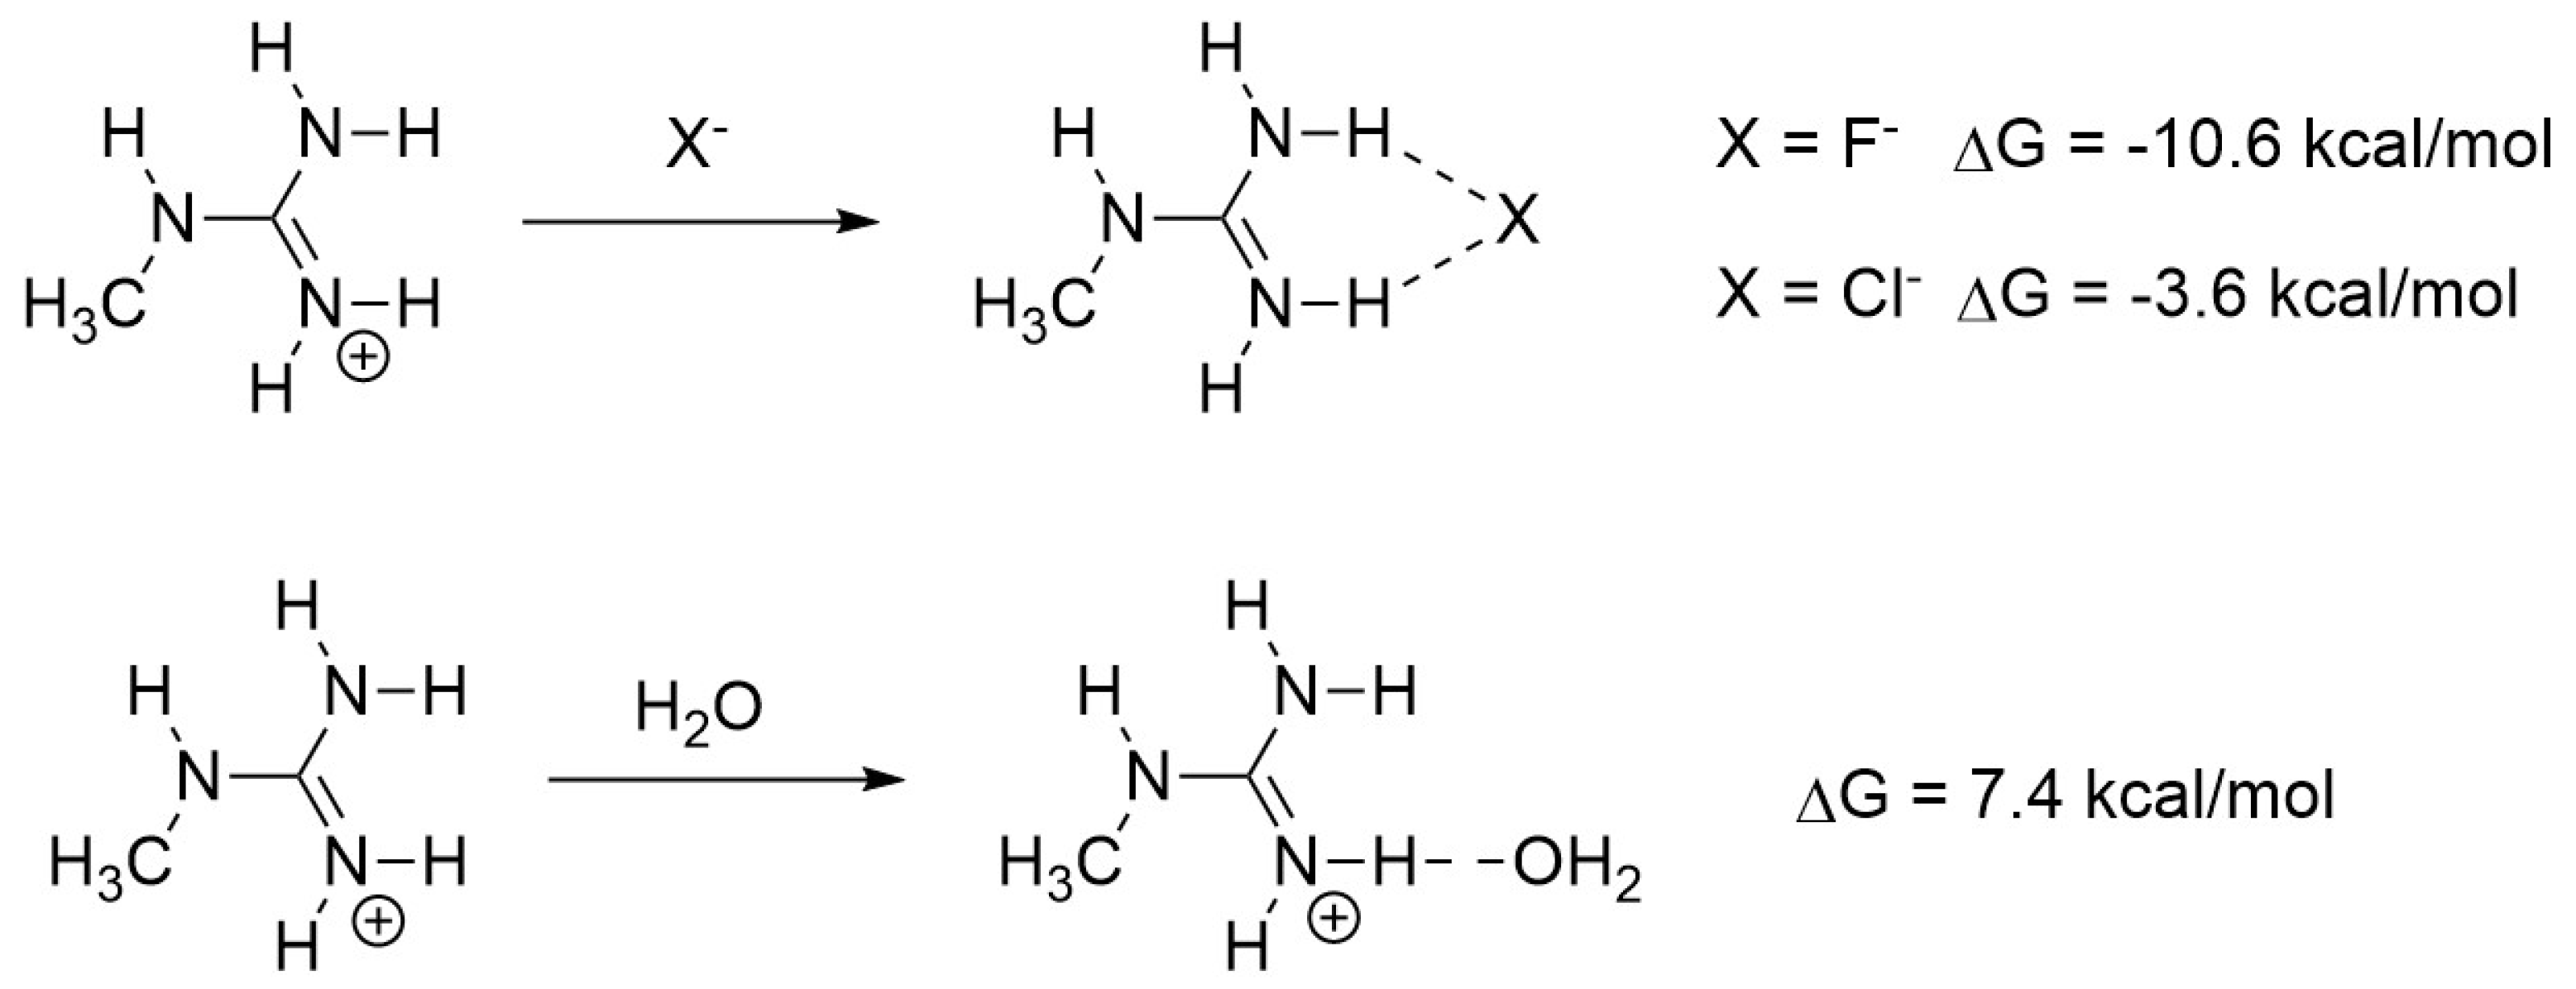
To examine the binding of chloride and fluoride to the guanidinium in Arg-111, we again turned to DFT calculations. We modeled the arginine side chain as a methyl guanidinium and compared the binding of chloride and fluoride with guanidinium. For comparison, we also examined a water molecule interacting with the guanidinium. The fluoride formed a much more stable adduct (Figure 12), which would prevent the N–H’s involved in binding fluoride from participating in other hydrogen bonding interactions during catalysis. Molecular dynamics calculations have also shown that the guanidinium group in arginine strongly binds fluoride [56]. Previous work has shown that fluoride competes for binding sites of chloride and hydrogen peroxide in CPO when it halogenates organic substrates (which do not include diazo dyes) [57]. The guanidinium of Arg-111 could also hydrogen bond with a fluoride that is bound to the iron, as is seen in Arg-48 in cytochrome c peroxidase [58]. Further work is needed to elucidate the full role of Arg-111 in CPO catalysis, such as by removal of the guanidinium side chain using a single point mutation at Arg-111.

3. Discussion and Conclusions

In this study, we examined the reaction products resulting from CPO-mediated azo dye degradation using enzymatic assays, LC/MS analysis, and DFT computational modeling. The integration of these three approaches supports a consensus mechanism involving oxidative cleavage of the C–N bond, followed by hydroxylation of the resultant intermediates. Significantly, no evidence of chlorinated species was observed during the CPO-mediated decolorization process, which challenges the hypothesis of an Fe(III)–OCl intermediate. Additionally, there is no indication of free hypochlorite (OCl) formation within the system as shown by a hypochlorite-specific assay (Figure S1). This conclusion is corroborated by four key findings: (1) the reaction proceeds without the addition of chloride ions; (2) fluoride ions show no activating effects; (3) no chlorinated products are detected even in the presence of chloride ions; and (4) DFT calculations of reaction energies for C–N bond cleavage are reasonable alternatives to the formation of chlorinated intermediates.
In conclusion, we have investigated the oxidative mechanism mediated by CPO in the decolorization of azo dyes, specifically using methyl orange and Orange G as representative members of the azo dye family. Our findings indicate that the decolorization process is initiated with the cleavage of the C–N bond, followed by hydroxylation of phenyl radical intermediates to produce catechol-like compounds. This mechanism differs from NaOCl-mediated dye decolorization, which produces chlorinated products. We propose that an Fe(IV)=O radical intermediate (often called Compound I) plays an important role in the initial step, leading to phenol derivatives via hydroxylation. This pathway appears to diverge from previously suggested mechanisms involving Fe(III)–OCl intermediates. Our conclusions are based on several observations: (1) LC/MS analysis showed no evidence of chlorinated products; (2) there was no indication of free OCl− formation; and (3) DFT calculations indicated that products resulting from hydrogen atom transfer can cleave C–N bonds to produce species that may form phenyl radicals, consistent with prior studies of CPO and other thiolate-ligated heme enzymes [59,60,61]. Additionally, we believe that chloride ions act as activators, possibly facilitated by a nearby chloride binding pocket that supports hydrogen bonding at the active site. Overall, these findings suggest that the oxidative degradation of azo dyes likely proceeds through the well-known hydroxylation process via the oxygen rebound mechanism characteristic of thiolate-ligated heme enzymes.

4. Materials and Methods

4.1. Materials

All reagents were purchased from Sigma Aldrich (St. Louis, MO, USA) and used as supplied. Chloroperoxidase was derived from Caldariomyces fumago (ATCC: 16373) and cultured according to literature protocols [62].

4.2. Production of CPO

Caldariomyces fumago was initially grown in 110 mL of fructose-salts medium at 22 °C for 5 days. Following this period, the biomass was transferred to 1 L of fructose-salts medium and incubated at 22 °C for an additional 10 days. The resulting media underwent acetone precipitation (−20 °C) to achieve a final concentration of 40%. After freezing overnight at −20 °C, “gel-like” carbohydrates were removed by centrifugation, and the acetone was evaporated under air. The protein was then washed with Milli-Q water and concentrated using an Amicon® Ultra Centrifugal Filter (Millipore, Darmstadt, Germany) with a 3 kDa molecular weight cutoff and resuspended in 20 mM formic acid buffer or 50 mM citric acid/sodium phosphate at pH 2.65 and used as prepared.

4.3. CPO Driven Degradation of Methyl Orange with and Without Anions (Cl/F)

The degradation of methyl orange was performed at room temperature in a citric acid–sodium phosphate buffer. In 4 mL reactions, methyl orange (1–50 μM) was subjected to degradation studies by the addition of H2O2 (0.1–1 mM) and CPO (60 nM) with a pH range of 1.4–5 for 5 min. Controls were done without CPO, and all trials were run in triplicate.
Methyl orange was measured at 507 nm for decolorization efficiency using a Vernier SpectroVis and a Persee (Auburn, CA, USA) T6U UV–vis spectrometer.
Decolorization   efficiency   ( % ) = A 0 A t A 0 × 100
For anion trials, KCl and NaF provided anions with concentrations of 0–10 ppm and 0–34 ppm, respectively, in accordance with [A/HA] ratios to maintain comparable concentrations of anions.

4.4. Detection of ClO via TMB Assay

In the detection of ClO, a reaction mixture containing phosphoric acid buffer (750 µL, pH = 6.8, 200 mM) and 3,3′,5′5′-tetramethylbenzidine (TMB) (600 µL, 5 mM) was initiated by the addition of different NaClO concentrations [63]. The detection of the ClO ion was observed as the reaction mixture changed from colorless to blue as the TMB oxidized due to the ClO. The colorimetric response was measured at 655 nm using UV–vis spectroscopy. A standard curve was prepared to evaluate ClO concentrations in solution using NaClO with a range of 0.05–23 µM.
To determine ClO generation by CPO in the reaction, a TMB solution was used to determine the extent of ion generation. To ensure ClO generation, CPO was reacted with and without a Cl ion present. The Cl present reaction mixture consisted of H2O2 (7.5 µL, 1 mM), KCl (750 µL, 20 mM), and citric buffer (2.22 mL, pH = 2.76, 25 mM). The Cl free reaction mixture consisted of H2O2 (7.5 µL, 1 mM) and citric buffer (2.905 mL, pH = 2.76, 25 mM). Reaction was initiated by the addition of CPO (20 µL) to each reaction mixture. Each reaction ran for 3 min before being quenched with Tris buffer (2.5 mL, pH = 8.63, 50 mM) to reach a pH level of 8.31–8.43. A solution of TMB (600 µL, 5 mM), citric buffer (750 mL, pH 2.76, 25 mM), and deionized water was initiated by the addition of the prior reaction mixtures to a final reaction pH = 3.2–4.8. The generation of ClO from CPO was determined using the UV–vis absorption spectroscopy.

4.5. CPO Quantification and Activity

The concentration of free chloroperoxidase (CPO) was determined using the Bradford protein assay [36]. A standard curve was prepared using bovine serum albumin (BSA) in the range of 0–2000 µg/mL to correlate absorbance at 595 nm with protein concentration. CPO samples were diluted appropriately in citric acid/sodium phosphate buffer (50 mM, pH 2.65) to fall within the linear range of the assay. After adding Bradford reagent and incubation for 5 min at room temperature, absorbance was measured at 595 nm using a UV–vis spectrophotometer. Protein concentrations were calculated from the standard curve and used to normalize enzymatic activity to units per milligram of protein [36,37].
To evaluate catalytic performance, CPO activity was assessed using the monochlorodimedone (MCD) assay [37,38,64]. The reaction mixture consisted of equal volumes of the following components: 20 mM H2O2, 20 mM KCl, 300 µM MCD, and 20 mM formic acid buffer (pH 2.75). To initiate the reaction, the initial absorbance of the reagent mixture was recorded, followed by the addition of CPO at each time point (1, 3, 8, and 15 min as needed). The enzymatic conversion of MCD was monitored by the decrease in absorbance at 285 nm, corresponding to the formation of dichlorodimedone [37,38]. Activity was calculated as the rate of MCD consumption (ΔA/min) and normalized to enzyme units (U/mg) based on the Bradford assay.

4.6. Density Functional Theory Calculations

Density functional theory (DFT) calculations were carried out using Gaussian 16, revision C.01, and visualized with GaussView 6.1.1. The functional and basis set used were MN15 and def2-TZVP, with SMD solvation to model the water solvent [48,49,50]. MN15 was selected over other functionals based on the reported benchmarking for this functional as being broadly applicable and more accurate than other approaches [48]. Frequency calculations were used to ensure that the calculated species were at a ground state. If imaginary frequencies were found, the structure was modified along the frequency vector and re-optimized. In the case of the sulfonated phenyl groups from the breakdown of methyl orange, a small imaginary frequency due to a sulfonate group rotation (ca. 31 cm−1 or smaller) could not be removed despite multiple attempts at re-optimization, and the calculations were used assuming this small value would have minimal effects on the overall energy.

4.7. Liquid Chromatography–Mass Spectrometry

An Agilent 1290 Infinity HPLC and Agilent 6230 Accurate Mass LC-TOF-MS were employed using a Dual AJS ESI source in positive and negative modes, equipped with a Zorbax extended C-18 rapid resolution high-throughput column (2.1 × 50 mm) maintained at 35 °C. LC-MS grade H2O with 0.1% formic acid (A) and MeCN (B) were used as eluents. A 1.0 or 5.0 μL aliquot of sample was eluted at 0.600 mL min−1 with an eluent ratio starting at 95:5 A:B and increasing to 5:95 A:B over 10 min for all CPO degradation samples. The eluent was then held for up to 3.0 min at 5:95 A:B. A post-time run of 1.5 min at 95:5 A:B allowed for equilibration of the system prior to the next sample injection. A sample blank (H2O) was injected between every two samples, and a control (no injection) followed the sample set before switching ion polarity. The ESI-MS data were collected using an internal mass calibrant in the positive ion mode with peaks at m/z = 121.0508 and 922.00, and m/z = 68.9957 and 1033.9881 in negative ion mode. ESI-MS was performed using a capillary voltage of 3500 V, a nozzle voltage of 1000 V, and a fragmentor voltage of 175 V. Additional control experiments utilizing NaClO were performed using a capillary voltage of 3500 V, a nozzle voltage of 1000 V, and a fragmentor voltage of 125 V.

Supplementary Materials

The following supporting information can be downloaded at: https://www.mdpi.com/article/10.3390/catal15100965/s1. Figure S1: Detection of ClO via TMB assay; Figure S2: TOF-MS data of m/z = 188.99 product peak from the degradation of methyl orange by CPO; Figure S3: TOF-MS data of m/z = 172.99 product peak from the degradation of methyl orange by CPO; Figure S4: TOF-MS data of m/z = 156.99 product peak from the degradation of methyl orange by CPO; Figure S5: TOF-MS data of m/z = 332.94 quinone product peak from the degradation of Orange G by CPO; Figure S6: TOF-MS data of m/z = 332.94 product peak from the degradation of Orange G by CPO; Figure S7: TOF-MS data of m/z = 109.03 product peak from the degradation of Orange G by CPO; Figure S8: TOF-MS data of m/z = 206.01 product peak from the degradation of methyl orange by CPO; Figure S9: TOF-MS data of m/z = 189.01 product peak from the degradation of methyl orange by CPO; Figure S10: TOF-MS data of m/z = 185.03 product peak from the degradation of methyl orange by CPO; Figure S11: TOF-MS data of m/z = 218.99 product peak from the degradation of methyl orange by CPO; Figure S12: Simulated spectrum for the degradation of methyl orange to a diazo degradation product for the m/z = 185.03 mass spectrum peak; Figure S13: Simulated spectrum for the degradation of methyl orange to a diazo degradation product for the m/z = 218.99 mass spectrum peak; Figure S14: LC-TOF-MS TIC/EIC for degradation of Orange G; Figure S15: TOF-MS comparison of m/z = 206.01 product peak; Figure S16: TOF-MS comparison of m/z = 189.01 product peak; Figure S17: LC-TOF-MS TIC/EIC for degradation of MO with NaOCl/H2O2; Figure S18: TOF-MS comparison of m/z = 185.03 product peak; Figure S19: LC-TOF-MS TIC/EIC for degradation of MO with NaOCl; Figure S20: TOF-MS comparison of m/z = 218.99 product peak; Figure S21: Simulated azo spectrum for the m/z = 185.03; Figure S22: Simulated azo spectrum for the m/z = 218.99.

Author Contributions

Conceptualization, K.L.S.; methodology, K.L.S., K.A.G. and M.A.C.; formal analysis, N.P.-R., K.A.G. and M.A.C.; investigation, N.P.-R. and J.R.; data curation, N.P.-R.; writing—original draft preparation, K.L.S., K.A.G., M.A.C. and N.P.-R.; writing—review and editing, K.L.S., K.A.G., M.A.C. and N.P.-R.; supervision, K.L.S.; project administration, K.L.S.; funding acquisition, K.L.S. All authors have read and agreed to the published version of the manuscript.

Funding

This research is supported by an internal grant at Lewis University sponsored by the Brother Bernard Rapp Research Fellowship award (KLS) and support provided by the James Girard summer undergraduate research experience (SURE) for NPR. This research received no external funding.

Data Availability Statement

The data presented in this study are available upon request from the corresponding authors.

Acknowledgments

The authors would like to acknowledge the following individuals that have offered support and expertise: Anthony Baudino, Audrey Ang, and Elisa Morales.

Conflicts of Interest

The authors declare no conflicts of interest.

References

  1. Edo, G.I.; Itoje-akpokiniovo, L.O.; Obasohan, P.; Ikpekoro, V.O.; Samuel, P.O.; Jikah, A.N.; Nosu, L.C.; Ekokotu, H.A.; Ugbune, U.; Oghroro, E.E.A.; et al. Impact of Environmental Pollution from Human Activities on Water, Air Quality and Climate Change. Ecol. Front. 2024, 44, 874–889. [Google Scholar] [CrossRef]
  2. Shetty, S.S.; Deepthi, D.; Harshitha, S.; Sonkusare, S.; Naik, P.B.; Kumari, N.S.; Madhyastha, H. Environmental Pollutants and Their Effects on Human Health. Heliyon 2023, 9, e19496. [Google Scholar] [CrossRef] [PubMed]
  3. Siddiqua, A.; Hahladakis, J.N.; Al-Attiya, W.A.K.A. An Overview of the Environmental Pollution and Health Effects Associated with Waste Landfilling and Open Dumping. Environ. Sci. Pollut. Res. 2022, 29, 58514–58536. [Google Scholar] [CrossRef]
  4. Adane, T.; Adugna, A.T.; Alemayehu, E. Textile Industry Effluent Treatment Techniques. J. Chem. 2021, 2021, 5314404. [Google Scholar] [CrossRef]
  5. Shabbir, M. (Ed.) Textiles and Clothing, 1st ed.; Wiley: Hoboken, NJ, USA, 2019. [Google Scholar] [CrossRef]
  6. Zhang, R.; He, Q.; Huang, Y.; Wang, X. Spectroscopic and QM/MM Investigations of Chloroperoxidase Catalyzed Degradation of Orange G. Arch. Biochem. Biophys. 2016, 596, 1–9. [Google Scholar] [CrossRef]
  7. Liu, L.; Zhang, J.; Tan, Y.; Jiang, Y.; Hu, M.; Li, S.; Zhai, Q. Rapid Decolorization of Anthraquinone and Triphenylmethane Dye Using Chloroperoxidase: Catalytic Mechanism, Analysis of Products and Degradation Route. Chem. Eng. J. 2014, 244, 9–18. [Google Scholar] [CrossRef]
  8. Li, X.; Zhang, J.; Jiang, Y.; Hu, M.; Li, S.; Zhai, Q. Highly Efficient Biodecolorization/Degradation of Congo Red and Alizarin Yellow R by Chloroperoxidase from Caldariomyces Fumago: Catalytic Mechanism and Degradation Pathway. Ind. Eng. Chem. Res. 2013, 52, 13572–13579. [Google Scholar] [CrossRef]
  9. Zhang, J.; Feng, M.; Jiang, Y.; Hu, M.; Li, S.; Zhai, Q. Efficient Decolorization/Degradation of Aqueous Azo Dyes Using Buffered H2O2 Oxidation Catalyzed by a Dosage below Ppm Level of Chloroperoxidase. Chem. Eng. J. 2012, 191, 236–242. [Google Scholar] [CrossRef]
  10. El-Sayed, E.; Abd El-Aziz, E.; Othman, H.; Hassabo, A. Azo Dyes: Synthesis, Classification and Utilisation in Textile Industry. Egypt. J. Chem. 2024, 67, 87–97. [Google Scholar] [CrossRef]
  11. Chamorro, A.F.; Lerma, T.A.; Palencia, M. CTAB Surfactant Promotes Rapid, Efficient, and Simultaneous Removal of Cationic and Anionic Dyes through Adsorption on Glycerol/Citrate Polyester. Water 2024, 16, 1860. [Google Scholar] [CrossRef]
  12. Sonwani, R.K.; Swain, G.; Jaiswal, R.P.; Singh, R.S.; Rai, B.N. Moving Bed Biofilm Reactor with Immobilized Low-Density Polyethylene–Polypropylene for Congo Red Dye Removal. Environ. Technol. Innov. 2021, 23, 101558. [Google Scholar] [CrossRef]
  13. Lin, J.; Ye, W.; Xie, M.; Seo, D.H.; Luo, J.; Wan, Y.; Van Der Bruggen, B. Environmental Impacts and Remediation of Dye-Containing Wastewater. Nat. Rev. Earth Environ. 2023, 4, 785–803. [Google Scholar] [CrossRef]
  14. Al-Tohamy, R.; Ali, S.S.; Li, F.; Okasha, K.M.; Mahmoud, Y.A.-G.; Elsamahy, T.; Jiao, H.; Fu, Y.; Sun, J. A Critical Review on the Treatment of Dye-Containing Wastewater: Ecotoxicological and Health Concerns of Textile Dyes and Possible Remediation Approaches for Environmental Safety. Ecotoxicol. Environ. Saf. 2022, 231, 113160. [Google Scholar] [CrossRef] [PubMed]
  15. Garg, A.; Chopra, L. Dye Waste: A Significant Environmental Hazard. Mater. Today Proc. 2022, 48, 1310–1315. [Google Scholar] [CrossRef]
  16. Simpson, J.B.; Sekela, J.J.; Carry, B.S.; Beaty, V.V.; Patel, S.; Redinbo, M.R. Diverse but Desolate Landscape of Gut Microbial Azoreductases: A Rationale for Idiopathic IBD Drug Response. Gut Microbes 2023, 15, 2203963. [Google Scholar] [CrossRef]
  17. Stingley, R.L.; Zou, W.; Heinze, T.M.; Chen, H.; Cerniglia, C.E. Metabolism of Azo Dyes by Human Skin Microbiota. J. Med. Microbiol. 2010, 59, 108–114. [Google Scholar] [CrossRef]
  18. Haque, M.M.; Hossen, M.N.; Rahman, A.; Roy, J.; Talukder, M.R.; Ahmed, M.; Ahiduzzaman, M.; Haque, M.A. Decolorization, Degradation and Detoxification of Mutagenic Dye Methyl Orange by Novel Biofilm Producing Plant Growth-Promoting Rhizobacteria. Chemosphere 2024, 346, 140568. [Google Scholar] [CrossRef]
  19. Donkadokula, N.Y.; Kola, A.K.; Naz, I.; Saroj, D. A Review on Advanced Physico-Chemical and Biological Textile Dye Wastewater Treatment Techniques. Rev. Environ. Sci. Biotechnol. 2020, 19, 543–560. [Google Scholar] [CrossRef]
  20. Selvaraj, V.; Swarna Karthika, T.; Mansiya, C.; Alagar, M. An over Review on Recently Developed Techniques, Mechanisms and Intermediate Involved in the Advanced Azo Dye Degradation for Industrial Applications. J. Mol. Struct. 2021, 1224, 129195. [Google Scholar] [CrossRef]
  21. Georgin, J.; Ramos, C.G.; De Oliveira, J.S.; Dehmani, Y.; El Messaoudi, N.; Meili, L.; Franco, D.S.P. A Critical Review of the Advances and Current Status of the Application of Adsorption in the Remediation of Micropollutants and Dyes Through the Use of Emerging Bio-Based Nanocomposites. Sustainability 2025, 17, 2012. [Google Scholar] [CrossRef]
  22. Saini, D.; Dumra, S.; Kumar, V.; Aggarwal, R.; Naziruddin, A.R.; Sonkar, S.K. Magnetic Graphene Nanosheets from Expired Iron-Supplemented Tablets for Hydroxyl-Mediated Photocatalytic Oxidation of Azo Dyes. ACS Appl. Nano Mater. 2023, 6, 1573–1581. [Google Scholar] [CrossRef]
  23. Hodges, G.; Smith, J.R.L.; Oakes, J. Metalloporphyrin-Catalysed Oxidation of Azonaphthol Dyes: The Mechanism of Oxidative Bleaching by Oxoiron(IV) Porphyrins in Aqueous Solution. In Studies in Surface Science and Catalysis; Elsevier: Amsterdam, The Netherlands, 1997; pp. 653–662. [Google Scholar] [CrossRef]
  24. Singh, R.L.; Singh, P.K.; Singh, R.P. Enzymatic Decolorization and Degradation of Azo Dyes—A Review. Int. Biodeterior. Biodegrad. 2015, 104, 21–31. [Google Scholar] [CrossRef]
  25. Alneyadi, A.; Shah, I.; AbuQamar, S.; Ashraf, S. Differential Degradation and Detoxification of an Aromatic Pollutant by Two Different Peroxidases. Biomolecules 2017, 7, 31. [Google Scholar] [CrossRef] [PubMed]
  26. Velusamy, K.; Periyasamy, S.; Kumar, P.S.; Femina Carolin, C.; Jayaraj, T.; Gokulakrishnan, M.; Keerthana, P. Transformation of Aqueous Methyl Orange to Green Metabolites Using Bacterial Strains Isolated from Textile Industry Effluent. Environ. Technol. Innov. 2022, 25, 102126. [Google Scholar] [CrossRef]
  27. Bharatbhai Vishani, D.; Shrivastav, A. Enzymatic Decolorization and Degradation of Azo Dyes. In Development in Wastewater Treatment Research and Processes; Elsevier: Amsterdam, The Netherlands, 2022; pp. 419–432. [Google Scholar]
  28. Weerasinghe, K.; De Silva, S.M.; Abeyrathna, H.; Cooray, A.T.; Walpita, J. Sequential Anaerobic/Aerobic Methods in Dye Elimination. In Advanced Removal Techniques for Dye-Containing Wastewaters; Muthu, S.S., Khadir, A., Eds.; Sustainable Textiles: Production, Processing, Manufacturing & Chemistry; Springer: Singapore, 2021. [Google Scholar]
  29. Ali, S.S.; Al-Tohamy, R.; Sun, J. Performance of Meyerozyma Caribbica as a Novel Manganese Peroxidase-Producing Yeast Inhabiting Wood-Feeding Termite Gut Symbionts for Azo Dye Decolorization and Detoxification. Sci. Total Environ. 2022, 806, 150665. [Google Scholar] [CrossRef]
  30. Dixit, S.; Garg, S. Enzymatic Degradation of Sulphonated Azo Dye Using Purified Azoreductase from Facultative Klebsiella Pneumoniae. Folia Microbiol. 2021, 66, 79–85. [Google Scholar] [CrossRef]
  31. Singh, G.B.; Vinayak, A.; Mudgal, G.; Kesari, K.K. Azo Dye Bioremediation: An Interdisciplinary Path to Sustainable Fashion. Environ. Technol. Innov. 2024, 36, 103832. [Google Scholar] [CrossRef]
  32. Ullrich, R.; Hofrichter, M. Enzymatic Hydroxylation of Aromatic Compounds. Cell. Mol. Life Sci. 2007, 64, 271–293. [Google Scholar] [CrossRef]
  33. Sundaramoorthy, M.; Terner, J.; Poulos, T.L. The Crystal Structure of Chloroperoxidase: A Heme Peroxidase–Cytochrome P450 Functional Hybrid. Structure 1995, 3, 1367–1378. [Google Scholar] [CrossRef]
  34. Bhandari, Y.; Sajwan, H.; Pandita, P.; Koteswara Rao, V. Chloroperoxidase Applications in Chemical Synthesis of Industrial Relevance. Biocatal. Biotransformation 2023, 41, 403–420. [Google Scholar] [CrossRef]
  35. Kühnel, K.; Blankenfeldt, W.; Terner, J.; Schlichting, I. Crystal Structures of Chloroperoxidase with Its Bound Substrates and Complexed with Formate, Acetate, and Nitrate. J. Biol. Chem. 2006, 281, 23990–23998. [Google Scholar] [CrossRef]
  36. He, J.; Zhang, Y.; Yuan, Q.; Liang, H. Catalytic Activity and Application of Immobilized Chloroperoxidase by Biometric Magnetic Nanoparticles. Ind. Eng. Chem. Res. 2019, 58, 3555–3560. [Google Scholar] [CrossRef]
  37. Ahmad, R.; Rizaldo, S.; Shaner, S.E.; Kissel, D.S.; Stone, K.L. Immobilization of a Bienzymatic System via Crosslinking to a Metal-Organic Framework. Catalysts 2022, 12, 969. [Google Scholar] [CrossRef]
  38. Ahmad, R.; Shanahan, J.; Rizaldo, S.; Kissel, D.S.; Stone, K.L. Co-Immobilization of an Enzyme System on a Metal-Organic Framework to Produce a More Effective Biocatalyst. Catalysts 2020, 10, 499. [Google Scholar] [CrossRef]
  39. Ang, D.L.; Hoque, M.Z.; Hossain, M.A.; Guerriero, G.; Berni, R.; Hausman, J.-F.; Bokhari, S.A.; Bridge, W.J.; Siddiqui, K.S. Computational Analysis of Thermal Adaptation in Extremophilic Chitinases: The Achilles’ Heel in Protein Structure and Industrial Utilization. Molecules 2021, 26, 707. [Google Scholar] [CrossRef]
  40. Hakamada, Y.; Hatada, Y.; Ozawa, T.; Ozaki, K.; Kobayashi, T.; Ito, S. Identification of Thermostabilizing Residues in a Bacillus Alkaline Cellulase by Construction of Chimeras from Mesophilic and Thermostable Enzymes and Site-Directed Mutagenesis. FEMS Microbiol. Lett. 2001, 195, 67–72. [Google Scholar] [CrossRef]
  41. Meghlaoui, F.Z.; Merouani, S.; Hamdaoui, O.; Alghyamah, A.; Bouhelassa, M.; Ashokkumar, M. Fe(III)-catalyzed Degradation of Persistent Textile Dyes by Chlorine at Slightly Acidic Conditions: The Crucial Role of Cl2●− Radical in the Degradation Process and Impacts of Mineral and Organic Competitors. Asia-Pac. J. Chem. Eng. 2021, 16, e2553. [Google Scholar] [CrossRef]
  42. Ikram, M.; Naeem, M.; Zahoor, M.; Hanafiah, M.; Oyekanmi, A.; Ullah, R.; Farraj, D.; Elshikh, M.; Zekker, I.; Gulfam, N. Biological Degradation of the Azo Dye Basic Orange 2 by Escherichia Coli: A Sustainable and Ecofriendly Approach for the Treatment of Textile Wastewater. Water 2022, 14, 2063. [Google Scholar] [CrossRef]
  43. Harris, D.C. Quantitative Chemical Analysis, 8th ed.; W. H. Freeman: New York, NY, USA, 2010. [Google Scholar]
  44. Holčapek, M.; Jandera, P.; Fischer, J.; Prokeš, B. Analytical Monitoring of the Production of Biodiesel by High-Performance Liquid Chromatography with Various Detection Methods. J. Chromatogr. A 1999, 858, 13–31. [Google Scholar] [CrossRef]
  45. López, J.F.; Grimalt, J.O. Phenyl- and Cyclopentylimino Derivatization for Double Bond Location in Unsaturated C37-C40 Alkenones by GC-MS. J. Am. Soc. Mass. Spectrom. 2004, 15, 1161–1172. [Google Scholar] [CrossRef]
  46. Banerjee, P.; Kemmler, E.; Dunkel, M.; Preissner, R. ProTox 3.0: A Webserver for the Prediction of Toxicity of Chemicals. Nucleic Acids Res. 2024, 52, W513–W520. [Google Scholar] [CrossRef]
  47. Banerjee, P.; Eckert, A.O.; Schrey, A.K.; Preissner, R. ProTox-II: A Webserver for the Prediction of Toxicity of Chemicals. Nucleic Acids Res. 2018, 46, W257–W263. [Google Scholar] [CrossRef] [PubMed]
  48. Yu, H.S.; He, X.; Li, S.L.; Truhlar, D.G. MN15: A Kohn–Sham Global-Hybrid Exchange–Correlation Density Functional with Broad Accuracy for Multi-Reference and Single-Reference Systems and Noncovalent Interactions. Chem. Sci. 2016, 7, 5032–5051. [Google Scholar] [CrossRef] [PubMed]
  49. Weigend, F.; Ahlrichs, R. Balanced Basis Sets of Split Valence, Triple Zeta Valence and Quadruple Zeta Valence Quality for H to Rn: Design and Assessment of Accuracy. Phys. Chem. Chem. Phys. 2005, 7, 3297. [Google Scholar] [CrossRef] [PubMed]
  50. Marenich, A.V.; Cramer, C.J.; Truhlar, D.G. Universal Solvation Model Based on Solute Electron Density and on a Continuum Model of the Solvent Defined by the Bulk Dielectric Constant and Atomic Surface Tensions. J. Phys. Chem. B 2009, 113, 6378–6396. [Google Scholar] [CrossRef]
  51. Shibata, H.; Sato, K.; Mizuguchi, J. Crystal Structure of Methyl Orange Derivatives and Their Electronic Spectra. J. Imaging Sci. Technol. 2009, 53, 50302-1–50302-7. [Google Scholar] [CrossRef]
  52. Ojala, W.H.; Lu, L.K.; Albers, K.E.; Gleason, W.B.; Richardson, T.I.; Lovrien, R.E.; Sudbeck, E.A. Intermolecular Interactions of Sulfonated Azo Dyes: Crystal Structures of the Diammonium, Dilithium, Magnesium and Calcium Salts of 7-Hydroxy-8-(Phenylazo)-1,3-Naphthalenedisulfonic Acid (Orange G). Acta Crystallogr. B Struct. Sci. 1994, 50, 684–694. [Google Scholar] [CrossRef]
  53. Skitchenko, R.K.; Usoltsev, D.; Uspenskaya, M.; Kajava, A.V.; Guskov, A. Census of Halide-Binding Sites in Protein Structures. Bioinformatics 2020, 36, 3064–3071. [Google Scholar] [CrossRef]
  54. Sauer, K.; Yano, J.; Yachandra, V.K. X-Ray Spectroscopy of the Mn4Ca Cluster in the Water-Oxidation Complex of Photosystem II. Photosynth. Res. 2005, 85, 73–86. [Google Scholar] [CrossRef]
  55. Olesen, K.; Andréasson, L.-E. The Function of the Chloride Ion in Photosynthetic Oxygen Evolution. Biochemistry 2003, 42, 2025–2035. [Google Scholar] [CrossRef]
  56. Heyda, J.; Hrobárik, T.; Jungwirth, P. Ion-Specific Interactions between Halides and Basic Amino Acids in Water. J. Phys. Chem. A 2009, 113, 1969–1975. [Google Scholar] [CrossRef] [PubMed]
  57. Hager, L.P.; Morris, D.R.; Brown, F.S.; Eberwein, H.  Chloroperoxidase. J. Biol. Chem. 1966, 241, 1769–1777. [Google Scholar] [CrossRef] [PubMed]
  58. Edwards, S.L.; Poulos, T.L. Ligand Binding and Structural Perturbations in Cytochrome c Peroxidase. A Crystallographic Study. J. Biol. Chem. 1990, 265, 2588–2595. [Google Scholar] [CrossRef] [PubMed]
  59. Stone, K.L.; Behan, R.K.; Green, M.T. X-Ray Absorption Spectroscopy of Chloroperoxidase Compound I: Insight into the Reactive Intermediate of P450 Chemistry. Proc. Natl. Acad. Sci. USA 2005, 102, 16563–16565. [Google Scholar] [CrossRef]
  60. Stone, K.L.; Behan, R.K.; Green, M.T. Resonance Raman Spectroscopy of Chloroperoxidase Compound II Provides Direct Evidence for the Existence of an Iron(IV)–Hydroxide. Proc. Natl. Acad. Sci. USA 2006, 103, 12307–12310. [Google Scholar] [CrossRef]
  61. Stone, K.L.; Borovik, A. Lessons from Nature: Unraveling Biological CH Bond Activation. Curr. Opin. Chem. Biol. 2009, 13, 114–118. [Google Scholar] [CrossRef]
  62. Stone, K.L. Exploring the Role of the Axial Ligand in Thiolate-Ligated Heme Enzymes: Spectroscopy of High-Valent Iron Intermediates of Chloroperoxidase. Ph.D. Dissertation, Pennsylvania State University, State College, PA, USA, 2008. Available online: https://etda.libraries.psu.edu/catalog/8224 (accessed on 20 August 2025).
  63. Guo, Y.; Ma, Q.; Cao, F.; Zhao, Q.; Ji, X. Colorimetric Detection of Hypochlorite in Tap Water Based on the Oxidation of 3,3′,5,5′-Tetramethyl Benzidine. Anal. Methods 2015, 7, 4055–4058. [Google Scholar] [CrossRef]
  64. Griffin, B.W.; Ashley, P.L. Evidence for a Radical Mechanism of Halogenation of Monochlorodimedone Catalyzed by Chloroperoxidase. Arch. Biochem. Biophys. 1984, 233, 188–196. [Google Scholar] [CrossRef]
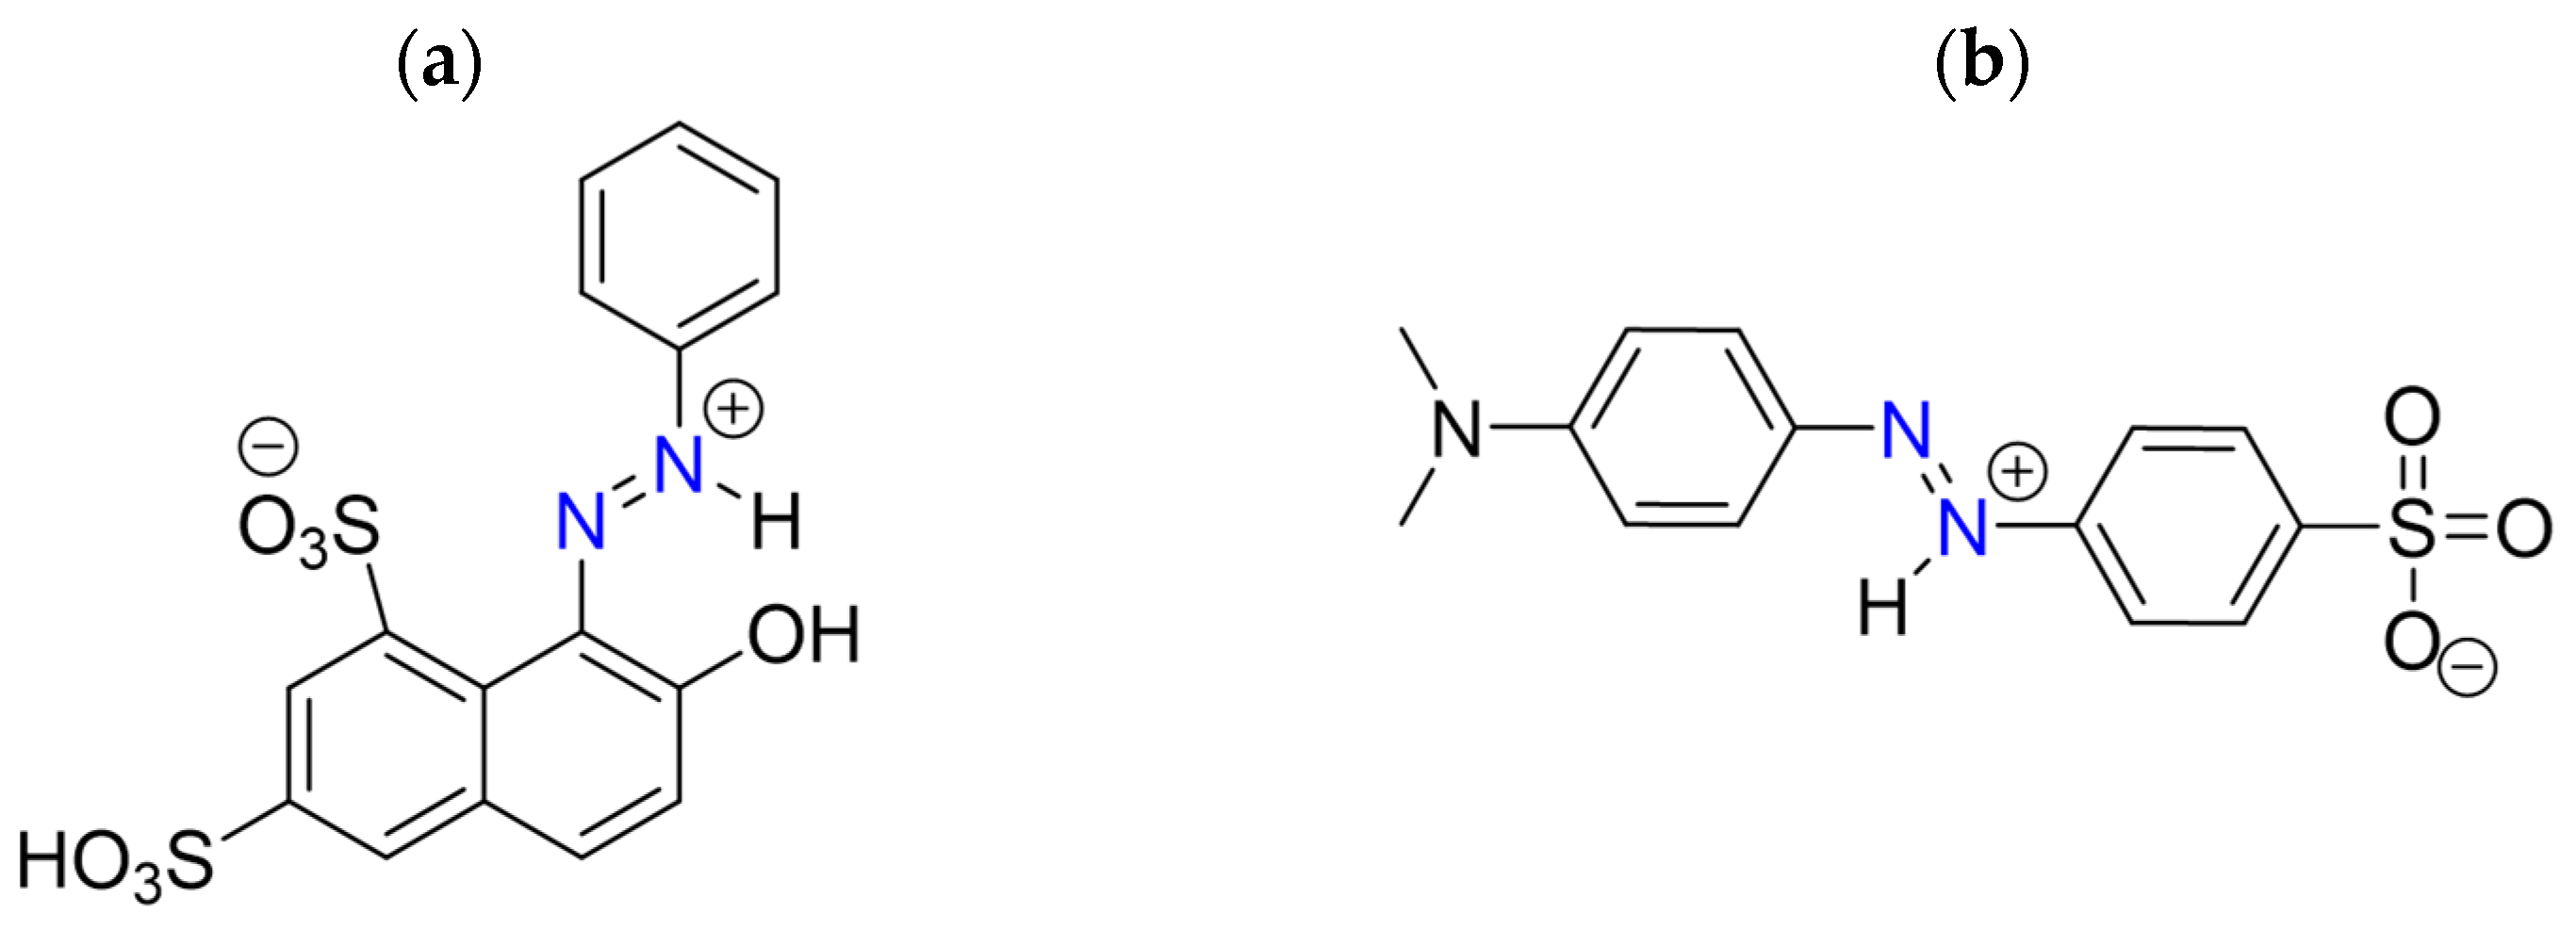
Figure 1. Chemical structure of the azo dyes used in this study, with the azo bond shown in blue (a) of Orange G and (b) methyl orange.
Catalysts 15 00965 g001
Figure 2. Active site of CPO showing catalytic residues (Glu-183 and His-105). PDB accession number: 1CPO [36].
Catalysts 15 00965 g002
Figure 3. Efficiency of methyl orange degradation with (a) H2O2 (mM) concentrations and (b) temperature (red circles with error bars) fit to sigmoid functions (black line) over 5 min trials. Experimental conditions: 50 mM citric acid/sodium phosphate buffer pH = 2.65, [methyl orange] = 25 µM, and [CPO] = 60 nM. All experiments were run in triplicate.
Catalysts 15 00965 g003
Figure 4. UV/vis spectra of methyl orange degradation via CPO-H2O2 with (a) 0 ppm KCl and (b) 5 ppm KCl added. Experimental conditions: 50 mM citric acid/sodium phosphate buffer pH = 2.65, methyl orange = 25 µM, H2O2 = 1 mM, [CPO] = 60 nM at room temperature. All samples were run in triplicate.
Catalysts 15 00965 g004
Figure 5. Fluoride (red circles) and chloride (black diamonds) dependence of the efficiency of decolorization of methyl orange over 0.5 (solid lines) and 1 min (dotted lines). The Henderson–Hasselbalch equation (pH = pKa + log [A/HA]) was used to compare fluoride ions to chloride ions, where the pH of the reaction is 2.65, the pKa of HF is 3.17, and [A/HA] gives the ratio of [F/HF] = 0.30. Experimental conditions: 50 mM citric acid/sodium phosphate buffer pH = 2.65, [methyl orange] = 25 µM, added [F] = 0–34 ppm, [Cl] = 0–10 ppm, [H2O2] = 0.5 mM, [CPO] = 60 nM at room temperature. All experiments were run in triplicate.
Catalysts 15 00965 g005
Figure 6. Possible products predicted by LC/MS for the degradation of methyl orange (a) and Orange G (b) by CPO and H2O2.
Catalysts 15 00965 g006aCatalysts 15 00965 g006b
Figure 7. Possible neutral products predicted by LC/MS of methyl orange degradation by hypochlorous acid.
Catalysts 15 00965 g007
Figure 8. Relative energies of the protonation site of MO, with the lowest energy site consistent with the crystal structure.
Catalysts 15 00965 g008
Figure 9. Energies of reaction for breaking C–N bonds in the oxidized and deprotonated form of MO.
Catalysts 15 00965 g009
Figure 10. Energies of reaction for breaking C–N bonds in the oxidized and deprotonated form of Orange G.
Catalysts 15 00965 g010
Figure 11. Active site of CPO highlighting the proposed proton-relay system that extends to a nearby arginine (highlighted with a black circle) that may be a potential chloride ion binding site. Glu-183 → His-105 → Ser-108 → heme propionate → Phe-109 (amide) → Ser-110 → Arg-111. PDB accession number: 1CPO.
Catalysts 15 00965 g011
Figure 12. DFT-calculated energies for the interactions of methyl guanidinium with fluoride, chloride, and water.
Catalysts 15 00965 g012
Table 1. Toxicity information for dyes and their degradation by-products.
LD50Est. LD50 bEst. Tox. Class b
Compound(mg/kg) a(mg/kg)
Methyl orange60603
Orange G--80006
Proposed Product c
4-hydroxybenzenesulfonic acid3486 d18004
Benzenesulfonic acid117511004
3,4-dihydroxybenzenesulfonic acid--32004
Catechol3001003
6,7-dihydroxy-1,3-naphthalenedisulfonic acid--20004
5-hydroxy-7,8-dioxo-1,3-naphthalenedisulfonic acid--10004
5,6-dioxonaphthalenesulfonic acid--2603
3-chloro-4-ethyl-benzenesulfonic acid--19003
4-ethyl-benzenesulfonic acid--19004
2,4-dichloro-3-hydroxy-dimethylamine--4804
Dimethylamine9519514
4-dimethylaminophenol--5654
Phenol1002703
benzene>20009304
a Oral toxicity, rat, from SDS accessed through the Millipore Sigma website. b Estimated LD50 and toxicology class from ProTox3.0. c Proposed from LC-MS analysis or DFT predictions. d Estimated.
Disclaimer/Publisher’s Note: The statements, opinions and data contained in all publications are solely those of the individual author(s) and contributor(s) and not of MDPI and/or the editor(s). MDPI and/or the editor(s) disclaim responsibility for any injury to people or property resulting from any ideas, methods, instructions or products referred to in the content.