Article

Optimizing Gadolinium Promoted SBA-16 Supported Ni-Catalysts for Syngas Production via Dry Reforming of Methane

by
Ebtisam Ali Alghamdi
1,
Ghzzai Almutairi
2,*,
Wasim Ullah Khan
3,*,
Salwa B. Alreshaidan
4,
Omalsad H. Odhah
5,
Ahmed A. Bhran
6,
Rashid Mehmood
7,
Mohammed O. Bayazed
8,
Ahmed A. Ibrahim
8 and
Ahmed S. Al-Fatesh
8,*
1
Department of Chemistry, Princess Nourah bint Abdulrahman University, Riyadh 11671, Saudi Arabia
2
Hydrogen Technologies Institute, King Abdulaziz City for Science & Technology (KACST), Riyadh 11442, Saudi Arabia
3
Interdisciplinary Research Center for Refining & Advanced Chemicals, King Fahd University of Petroleum & Minerals, Dhahran 31261, Saudi Arabia
4
Department of Chemistry, College of Science, King Saud University (KSU), P.O. Box 2455, Riyadh 11451, Saudi Arabia
5
Department of Mathematical Sciences, College of Science, Princess Nourah bint Abdulrahman University, P.O. Box 84428, Riyadh 11671, Saudi Arabia
6
Chemical Engineering Department, College of Engineering, Imam Mohammad Ibn Saud Islamic University (IMSIU), Riyadh 11432, Saudi Arabia
7
Center of Materials Science and Optoelectronics Engineering, University of Chinese Academy of Sciences, Beijing 100049, China
8
Department of Chemical Engineering, College of Engineering, King Saud University (KSU), P.O. Box 800, Riyadh 11421, Saudi Arabia
*
Authors to whom correspondence should be addressed.
Catalysts 2025, 15(10), 966; https://doi.org/10.3390/catal15100966
Submission received: 2 September 2025 / Revised: 28 September 2025 / Accepted: 2 October 2025 / Published: 9 October 2025
(This article belongs to the Special Issue Recent Advances in Nanostructured Catalysts for Hydrogen Production)

Abstract

The reforming of methane using carbon dioxide, also known as dry reforming (DRM), is an environmentally benign method that utilizes greenhouse gases (methane and carbon dioxide) to produce a mixture of carbon monoxide and hydrogen. This study evaluated the catalytic performance of nickel-based catalysts supported over SBA-16 (5Ni/SBA-16) promoted with 0.5 to 3 wt% of gadolinium (Gd). The characterization results of the catalysts, including textural properties, crystallite size, reducibility, morphology, acidity/basicity, and carbon deposition, facilitated the understanding of the insights of catalytic activity and stability performance of these catalysts. The incorporation of a suitable amount (1 wt%) of Gd promoter had a significant impact on the activity, resulting in the highest CH4 and CO2 conversions 69 and 78%, respectively. The higher specific surface area, higher reducibility, better dispersion, and smaller active metal particle size were the major factors contributing to the relatively better performance of 5Ni+1Gd/SBA-16. Morphological analysis using a transmission electron microscope showed the formation of carbon nanotubes over unpromoted 5Ni/SBA-16, in contrast to no significant carbon formation over 5Ni+1Gd/SBA-16. The process optimization results indicated that the experimental results were in agreement with the theoretically optimized findings.

1. Introduction

The Earth has recently been suffering from global warming, which is considered one of the most dangerous environmental phenomena in our modern era. Harmful gases, such as CO2 and CH4, have contributed to this increase [1]. CO2 is the main heat-trapping factor in the atmosphere [2]. Accumulated carbon emissions have reached 1000 gigatons and are likely to cause a rise in the global temperature by 3–4 °C, which could lead to unavoidable climate change [3]. According to the US Environmental Protection Agency, most polluting emissions are caused by human activities, such as the combustion of fossil fuels, power plants, vehicles, and factories, which lead to air pollution in urban areas [4]. Fossil fuel energy remained the primary source of energy consumption in 2019, reaching 84.32% [5]. One of the main reasons for the increase in energy demand is the increase in population and economic growth, which is projected to raise electricity consumption by 26% by 2035 [6]. Hence, the world is facing two major crises: global warming caused by harmful gases and the depletion of fossil fuels [7]. Considering these global challenges, countries have sought solutions to reduce carbon emissions and decrease their reliance on fossil fuels by shifting to low-carbon energy [8]. Dry reforming of methane (DRM) is an ideal solution to the global warming crisis because it relies mainly on the reaction between CH4 and CO2 to produce synthetic gas consisting of H2 and CO (CH4 + CO2 → 2H2 + 2CO; ΔH = 247 kJ/mol) [9]. However, this approach faces challenges, the most prominent of which is the degradation or deactivation of the catalyst due to carbon deposition (coking) and/or sintering/agglomeration of the metal nanoparticles, thus reducing the production rate of synthetic gas (H2/CO) [9,10]. Therefore, many studies have sought to develop catalysts capable of overcoming the problem of catalyst deactivation, extending their life, and increasing their activity and effectiveness. Studies have demonstrated the effectiveness of catalysts based on noble metals (Rh, Ru, Pt, Ir, and Pd) with good performance and high stability under high-temperature conditions; however, they are considered expensive and low in availability [7,11]. Therefore, other studies have focused on developing inexpensive nickel-based catalysts, which are the most common for this type of reaction [12]. Nickel also exhibits high activity in DRM [9].
Owing to its ability to host loaded metal particles in its pores, ordered mesoporous silica has been widely utilized as a supporting material in reforming procedures [1]. Mesoporous silica materials MCM-41 and SBA-15 have large specific surface areas, making them ideal supports for dispersing Ni active sites [13,14]. The smaller pore widths of these supporting materials compared to impregnated Ni particles make it almost impossible for metallic Ni nanoparticles to aggregate at high temperatures. In these cases, it is effective to disperse Ni nanoparticles using cubic three-dimensional SBA-16. SBA-16 is a well-known support owing to its thick pore walls, large surface area, and high thermal and hydrothermal durability [15].
Several researchers have used mesoporous silica (SBA-16) as a nickel support to study the role of various factors, such as metal-support interaction, the impact of metal particle size and support framework stability, and the influence of promoters and synthesis techniques [15,16,17,18,19,20]. For instance, Sun et al. [15], in their study, used three methods, including the ammonia evaporation method, wet impregnation method and impregnation assisted with citric acid. Among these techniques, ammonia evaporation-based catalysts exhibit superior performance associated with strong metal-support interactions, high metal particle dispersion, reduced carbon formation, and limited metal particle agglomeration. In another study by Kiani et al. [19], hydrothermal treatment was used to prepare lanthanum-modified SBA-16 by adjusting the pH, which had a significant impact on the effectiveness of the impregnated nickel-based catalyst. The incorporation of lanthanum ions within the structure of SBA-16 facilitated the formation of highly dispersed nickel particles, which had a positive impact on the activity performance of these catalysts. Researchers have also used many promoters to increase the activity of the catalyst, such as ceria [16] and metal oxides such as MgO [18]. In a recent work by Panda et al. [21], it was found that using a precipitation–deposition method, the active components (Ru and Ni) and promoter (Gd) could be successfully distributed over the molybdenum-modified alumina support. For dry reforming reaction investigations, the optimal composition was determined to be 4% Ni, 0.5% Gd, and 0.5% Ru with Mo-promoted modified alumina, which exhibited outstanding stability for up to 500 h. To prevent surface carbon accumulation and enable high catalytic stability and activity, two redox cycles—Mo+6 to Mo+4 and Ce+4 to Ce+3—facilitated a considerable number of oxygen vacancies. By conducting in situ DRIFT experiments, we were able to identify metal carbonyls, carboxylate species, and surface hydroxyl groups as potential reaction routes and stable surface intermediates. The DRIFT experiments were backed up by CH4-TPSR analysis, and the DFT studies showed that CHx species were formed and then oxidized. One more benefit of using molybdenum is its remarkable S-tolerance capacity, which has been thoroughly tested both experimentally and conceptually. Among the rare earth metal-based promoters, gadolinium (Gd) offers unique features, such as (a) increasing the specific surface area and inhibiting the formation of metal carbide [22], (b) promoting oxygen exchange capacity [23], (c) facilitating electron exchange with nickel [24], (d) reducing nickel nanoparticle sintering and enhancing coke gasification [25], and promoting nickel particle dispersion, surface carbonate species, and metal-support interaction, leading to enhanced activity [26].
Considering the features of mesoporous SBA-16 and Gd promoter, this study aimed to investigate the role of Gd incorporation into Ni supported over SBA-16 catalysts synthesized through a wet impregnation process during DRM. Moreover, the process parameters were optimized to obtain the operating conditions that lead to higher activity and long-term stability.

2. Results and Discussion

2.1. Characterization Results

The X-ray diffraction results of the 5Ni/SBA-16 and 5Ni + (x = 0.5, 1, 2, 3 Gd)/SBA-16 samples showed different peaks in the structural composition of the catalysts. The typical peaks of SBA-16 are at low angles, that is, 2θ = 0.9–2.5° [27]; however, as shown in Figure 1, these peaks appear at a higher angle of 2θ = 3°, indicating a highly organized porous structure with a stable three-dimensional crystalline arrangement even after nickel loading. The diffraction peaks at 2θ = 37.2°, 43.2°, and 62.8° correspond to the 111, 200, and 220 crystal phases, respectively, demonstrating the presence of nickel in its oxidized form within the samples [28]. Scherrer’s Equation (1) was applied to the catalysts promoted at ratios of x = 0, 2, and 3 wt% to observe the difference in the size of the NiO crystals. A significant decrease in the size of nickel oxide crystals was observed following the addition of a promoter. Specifically, the crystals in the sample without Gd measured 9.7–14 nm, whereas those in the sample with 0.5 wt% Gd measured 6.66–10.10 nm. Continuing to increase the Gd content caused further shrinkage until the crystals reached their minimum size of 6.5–7 nm, when the Gd content increased by 2%. However, when the Gd content increased to 3%, the crystals began to increase in size to 6.5–14.9 nm, as shown in Table 1. This indicates that the addition of the promoter helped disperse the nickel better and spread it more widely on the surface of the SBA-16 support, which increased the active surface area for the DRM reaction owing to the absence of agglomeration in the particles during preparation or calcination. In contrast, for the catalyst promoted with 3 wt% Gd, the crystal size increased, demonstrating metal particle sintering as a result of heat treatment (calcination), leading to a lower distribution of active sites and thus a decrease in the activity and effectiveness of the catalyst, which might promote coking.
Scherer’s equation:
d X R D = 0.89 λ β β ° cos θ
where d X R D is the volume average diameter of the crystallite, λ the wavelength, and β ° the instrumental line broadening found experimentally from sintered NiO samples.
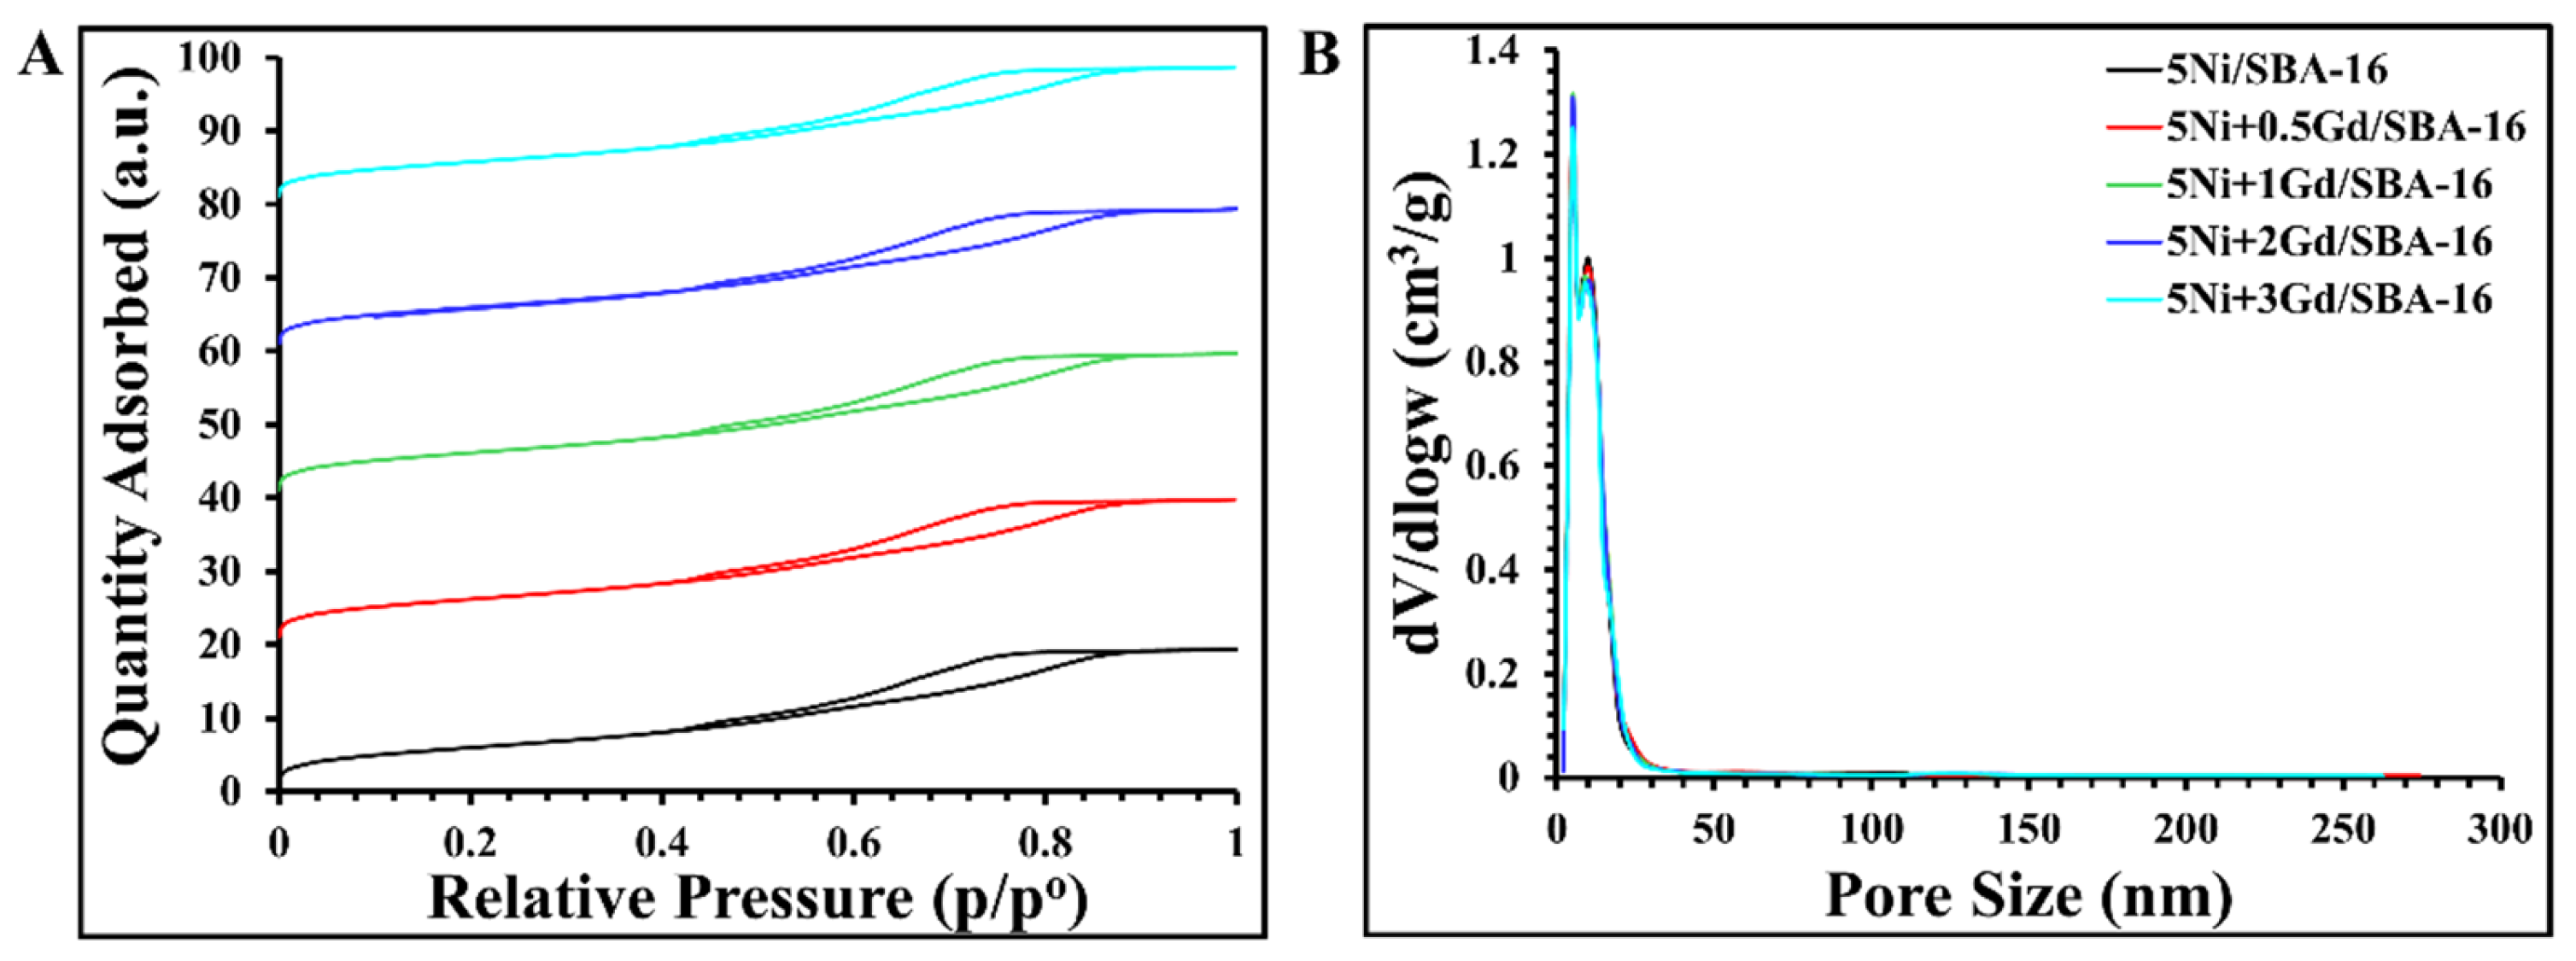
Surface area and porosity analysis showed an increase in relative pressure (p/p°) from 0.6 to 0.86, which was similar for all samples. However, the increase in the amount of adsorption with increasing promoter loading indicates an increase in the number of adsorption sites. The surface remained open because there was no sintering, resulting in a greater amount of nitrogen being adsorbed, as shown in Figure 2A. The pore density peaked at a pore size of 48.8 nm with increasing catalyst loading. However, a decrease in the surface area, pore diameter, and pore volume is observed with increasing catalyst levels of 2–3 wt%, in contrast to catalysts loaded with 0.5–1 wt% Gd, where these values increase, as shown in Table 2 (in comparison with SBA-16), indicating reduced agglomeration of nickel particles and improved dispersion on the support surface. Notably, the decrease in pore diameter and volume at high catalyst ratios is small and statistically insignificant, as the increase and decrease are approximately equal, indicating that the effectiveness of the catalyst in improving the pore structure is evident in Figure 2B where bimodal pore size distribution falls within the mesopore region (2–50 nm).
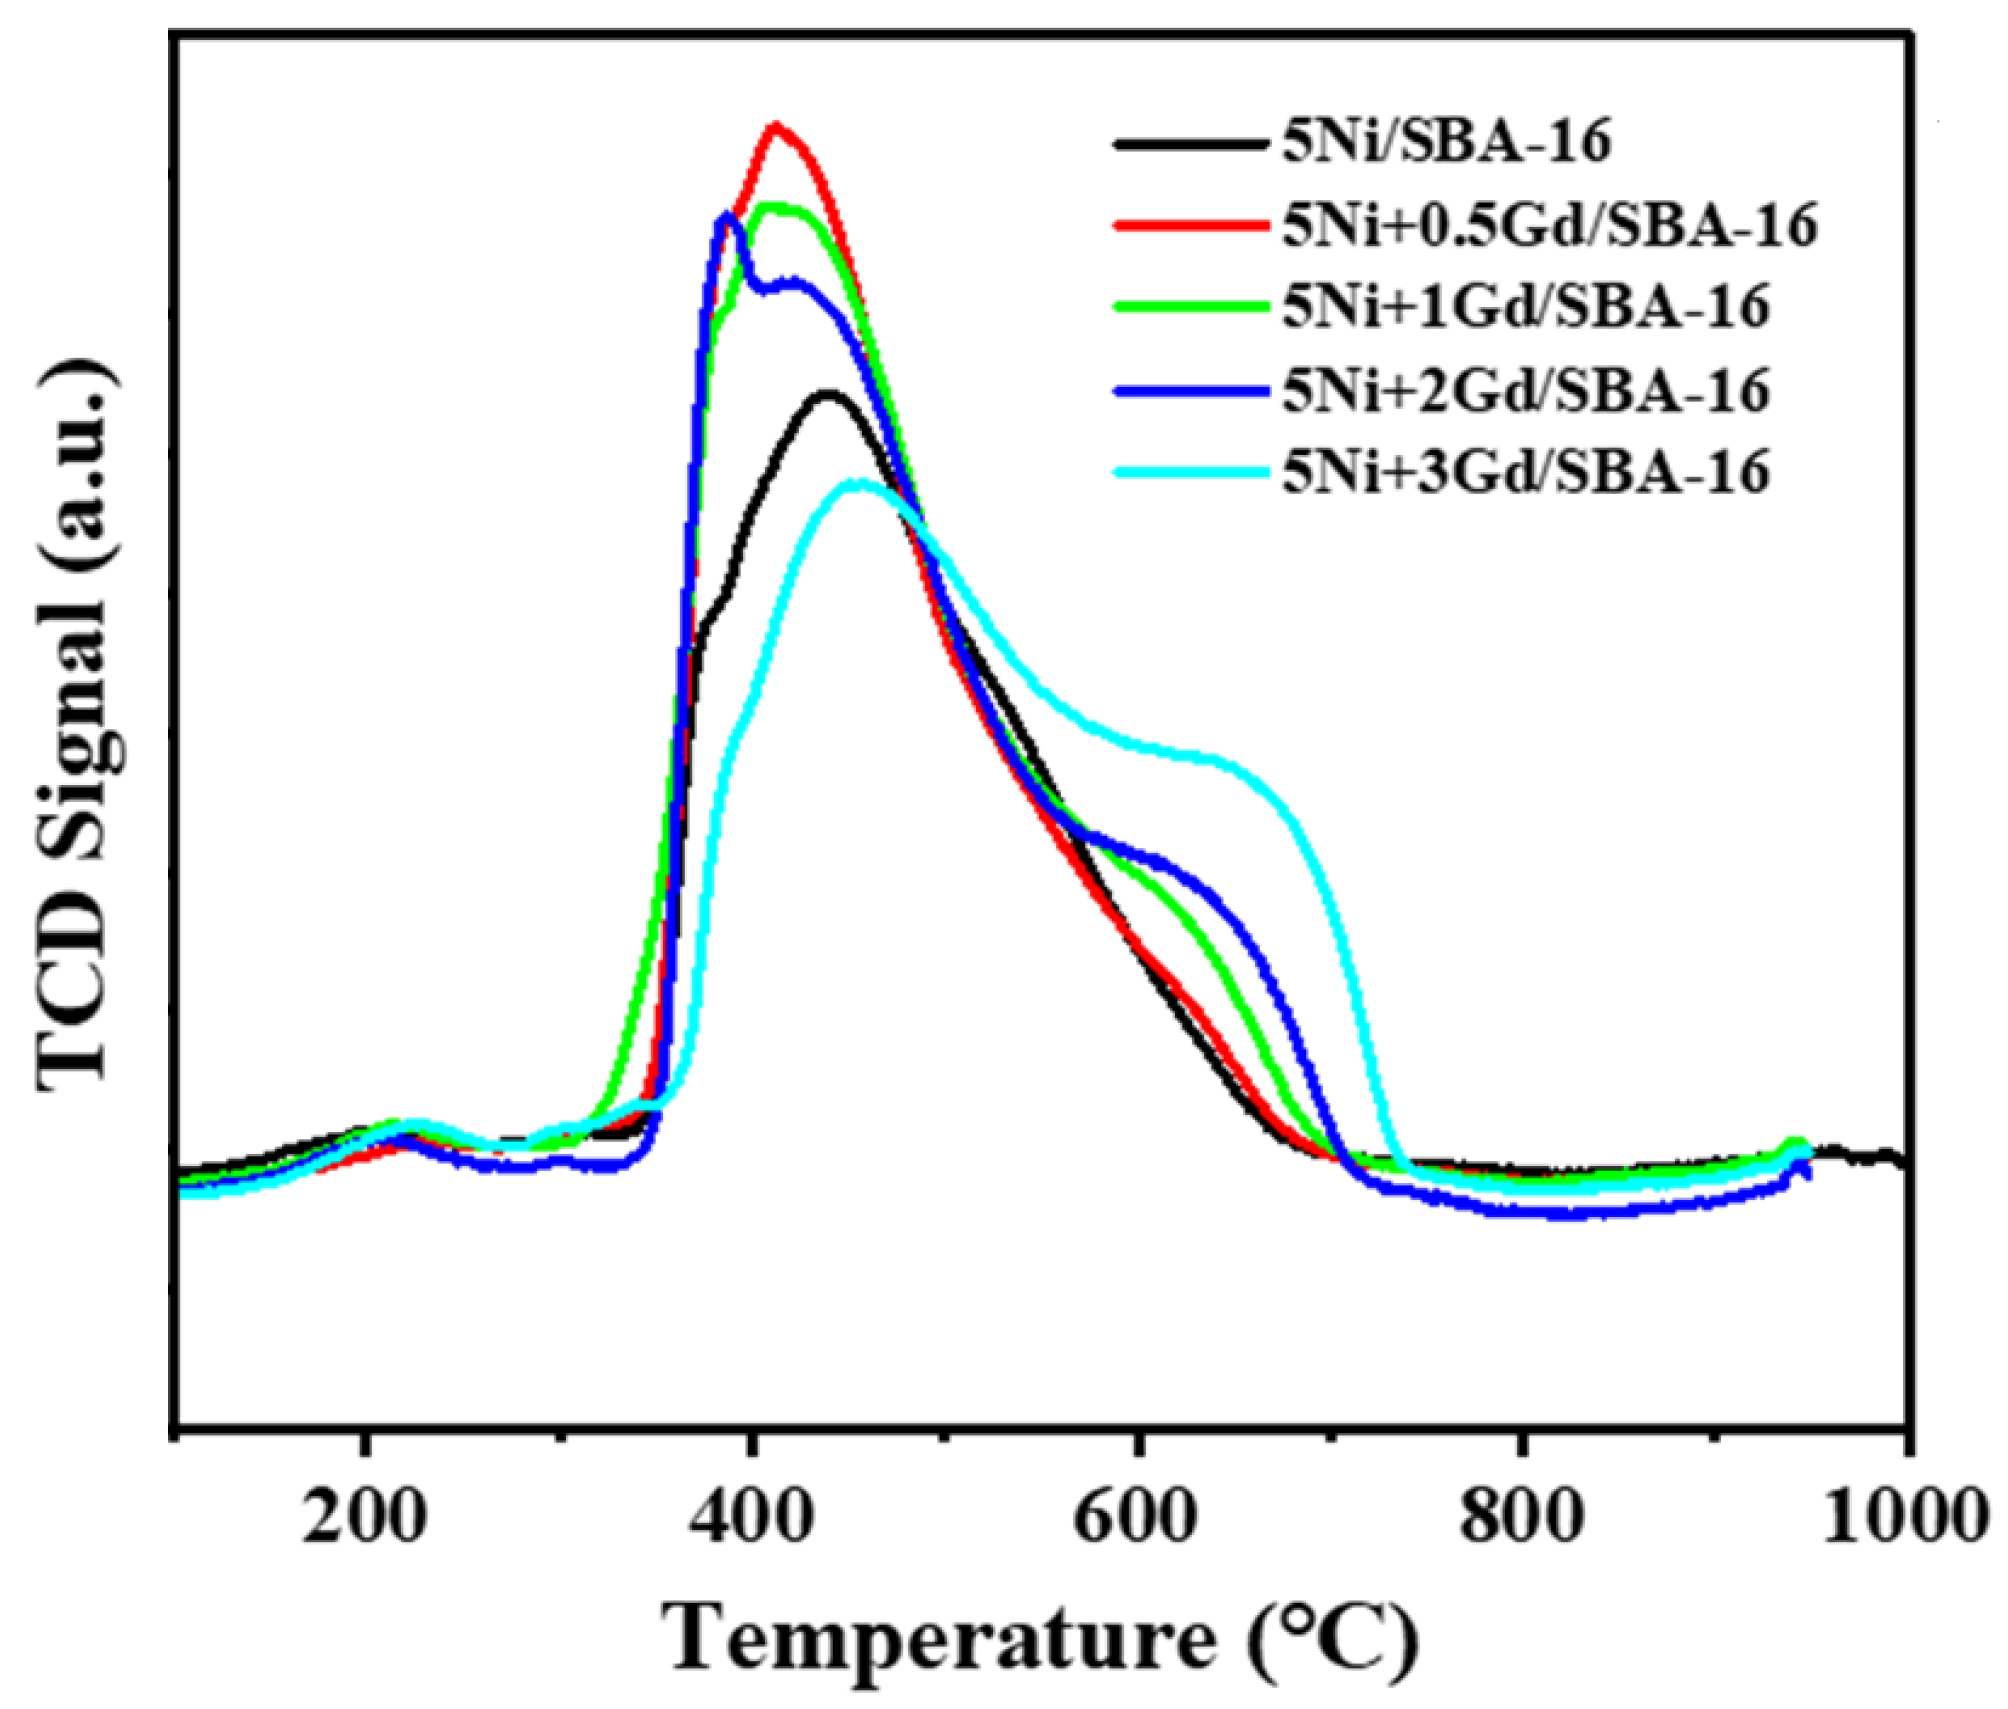
The analysis in Figure 3 demonstrating H2-temperature programmed reduction, reveals that the reduction peaks occur at varying temperatures, with the peak temperature decreasing gradually as the promoter content increases from 0.5 to 2 wt%. Gd promotion facilitates the reduction in Nio by increasing the number of active sites susceptible to reduction; however, the catalyst loaded with 3 wt% Gd requires a higher reduction temperature, as shown in Table 3. Loading the catalyst with more than 2 wt% Gd may negatively influence the structure, with nickel agglomerating on the support, resulting in a compound that is both more stable and more resistant to reduction, potentially leading to undesirable outcomes. In addition, the catalyst loaded with the 2 wt% promoter exhibited the narrowest peak among the investigated catalysts. To further explore these findings, the TPR profiles were deconvoluted (Figure S1), and it was evident that each catalyst had three deconvoluted peaks. The first peak had a maxima at 380, 385, 385, 385, and 435 °C for 5Ni/SBA-16, 5Ni+0.5Gd/SBA-16, 5Ni+1Gd/SBA-16, 5Ni+2Gd/SBA-16, and 5Ni+3Gd/SBA-16, respectively (Table S1). This suggests that all the catalysts had approximately similar types of surface nickel oxide species, except 5Ni+3Gd/SBA-16, which showed a shift of nickel oxide species from the surface to the bulk. The second reduction peak temperatures were 430, 430, 435, 440, and 540 °C, indicating a similar behavior as that of the first reduction peak. The final reduction peaks were shifted to higher temperatures at 515, 515, 560, 570, and 665 °C for 5Ni/SBA-16, 5Ni+0.5Gd/SBA-16, 5Ni+1Gd/SBA-16, 5Ni+2Gd/SBA-16, and 5Ni+3Gd/SBA-16, respectively (Table S1). These findings indicate that the third peak is mainly associated with nickel oxide bulk species having strong interactions with the support. The weakly bonded surface species and medium-strength nickel oxide species could play a significant role in influencing the catalytic performance of these catalysts. These results show that all nickel oxide surfaces and medium-strength species were reduced at approximately similar temperatures, suggesting a high degree of nickel homogeneity on the support [29,30].
Strong interaction of NiO may refer to NiO, which resides in the channels of SBA-15 [29]. After the addition of 0.5 wt% Gd, reduction peaks in the low temperature region are grown, which indicates the growing concentration of NiO, which is held by weak to medium-strength interaction over the support. Interestingly, upon increasing the loading of Gd further, the intensity of the lower temperature peaks is decreased, and the intensity of the high temperature peak is increased. It indicates the progressive shift in the moderate interaction of NiO with support into a strong interaction upon increasing loading of Gd from 0.5 to 3 wt%. The growing interaction between NiO and the support induces better dispersion of NiO over the support.
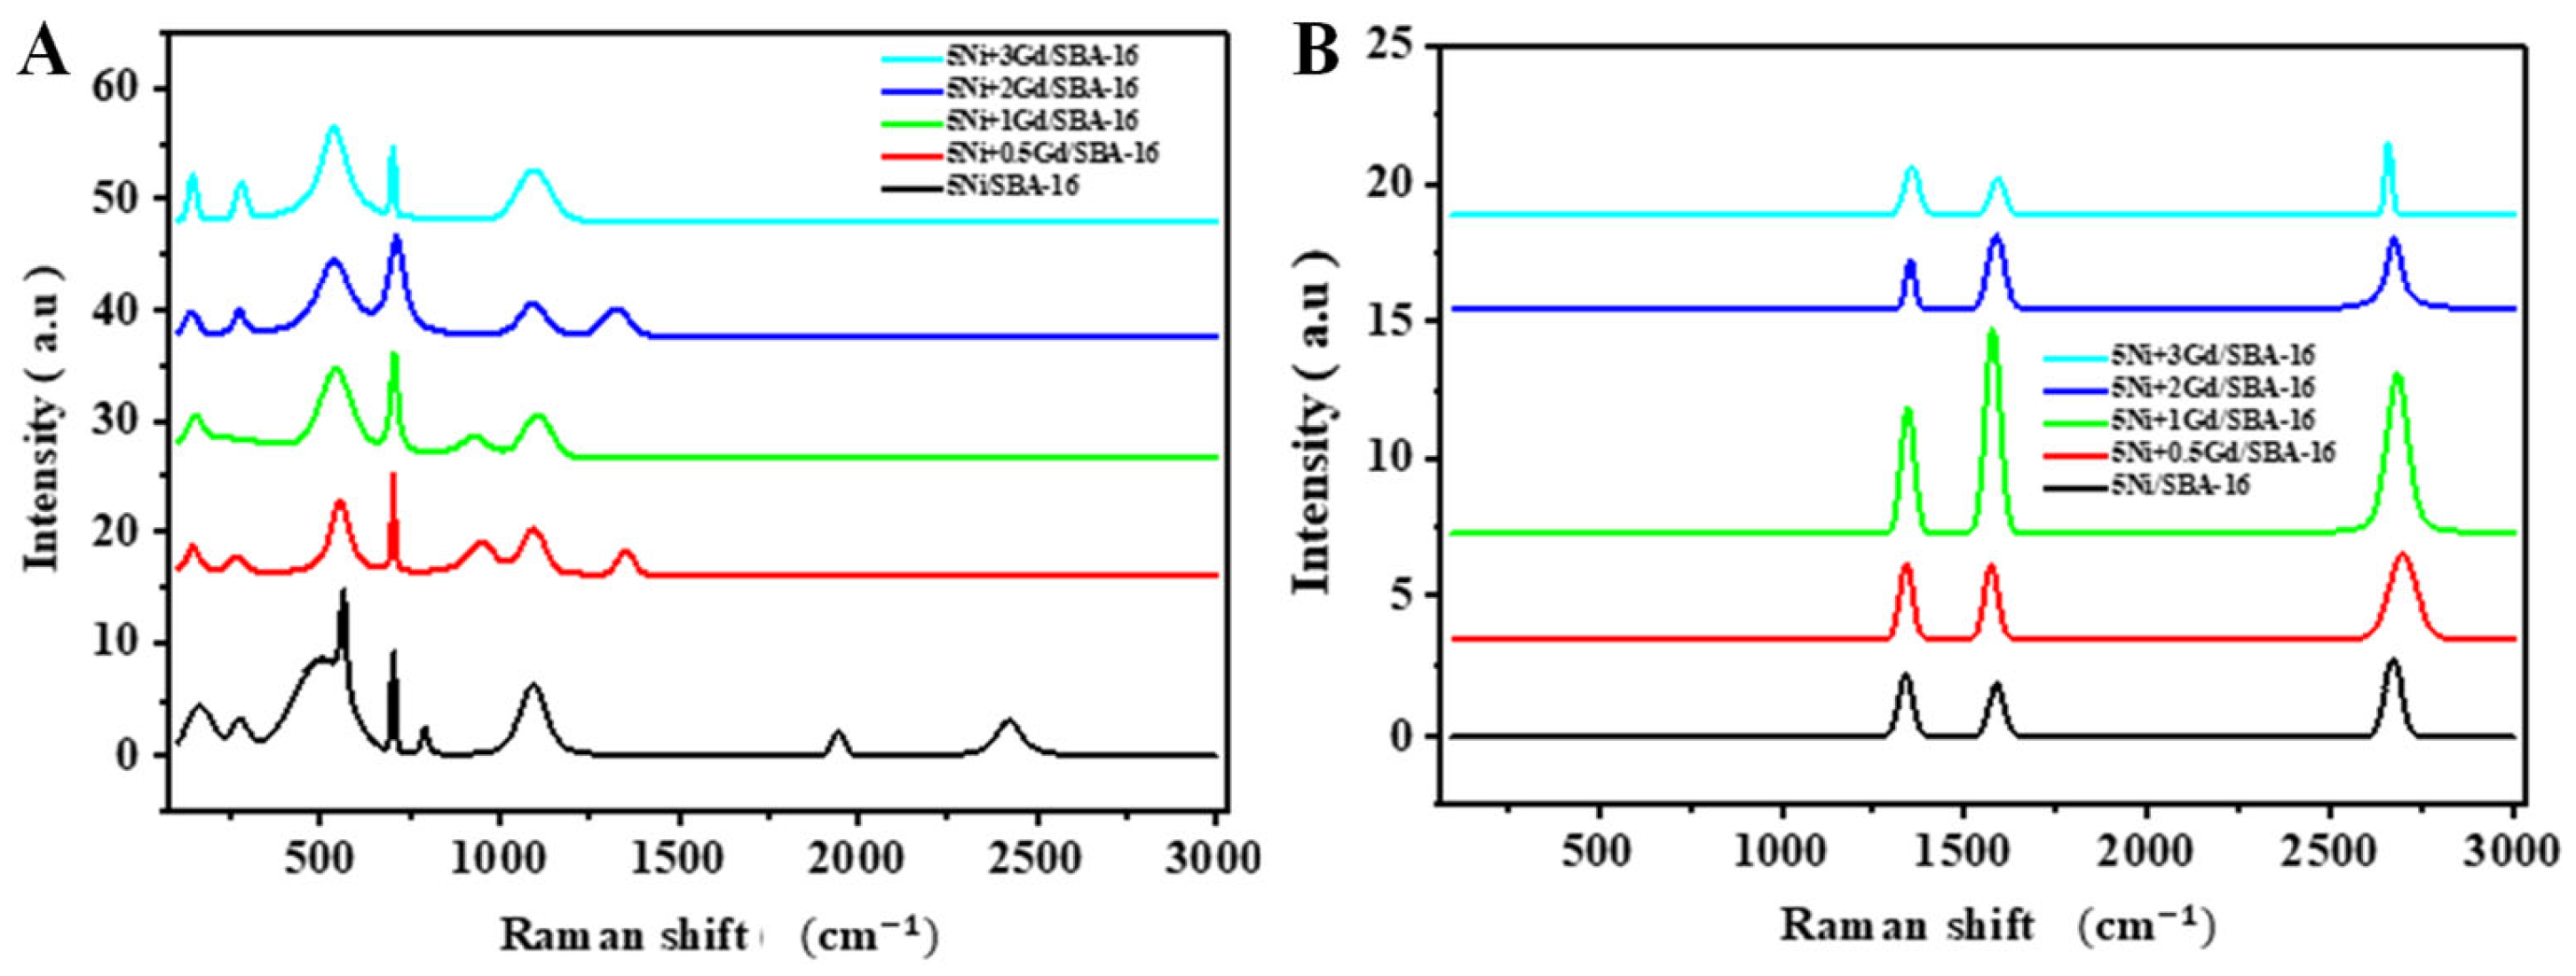
Raman spectroscopy results show peaks for the fresh catalysts in Figure 4A, which indicate the reference structure of the catalyst. A peak at (143.7 cm 1 ) shift indicates the presence of certain oxide phases such as TiO2 and SiO2, which are attributed to SBA-16 lattice vibrations, indicating that the support retains its porous structure after preparation [31]. The peak at a 500 cm 1 shift is attributed to the typical vibrations of NiO bonds, indicating its presence on the catalyst surface [32]. Peaks appearing at the (≥1300 cm 1 ) shift indicate the presence of carbon in the catalysts [33], which may be attributed to CO2 adsorbed on the catalyst surface during calcination. It Is worth noting that the shift observed in the (1900, 2400 cm 1 range was only seen in the promoter-free catalyst, suggesting that Gd was involved in altering the catalyst’s surface structure, possibly by eliminating impurities during calcination or by decreasing the surface’s capacity to adsorb CO2, which could indicate improved catalyst stability prior to reaction. No distinct peaks related to gadolinium oxides were visible in the data, suggesting that the gadolinium was either evenly distributed across the catalyst surface or integrated into the SBA-16 support framework [34]. In Figure 4B, Raman spectroscopy shows three main peaks for the used catalysts: shift (1344, 1576, 2680 cm 1 ) which indicates amorphous carbon (D band) due to defects in the carbon structure, regular graphitic carbon (G band), and accumulated carbon (2D band), respectively [16,33]. The disappearance of the original peaks of the catalyst structure after the DRM reaction and the emergence of only carbon spectral peaks suggest that the catalyst surface is entirely covered with carbon layers, thereby preventing Raman spectroscopy from detecting the original phases of the catalysts. The addition of a promoter at a rate of 2–3 wt% resulted in a decrease in the intensity of the carbon peaks, indicating reduced carbon deposition during the reaction. The data indicate a greater resistance of the catalyst to coke formation and improved stability under the reaction conditions, as illustrated in Table 4.
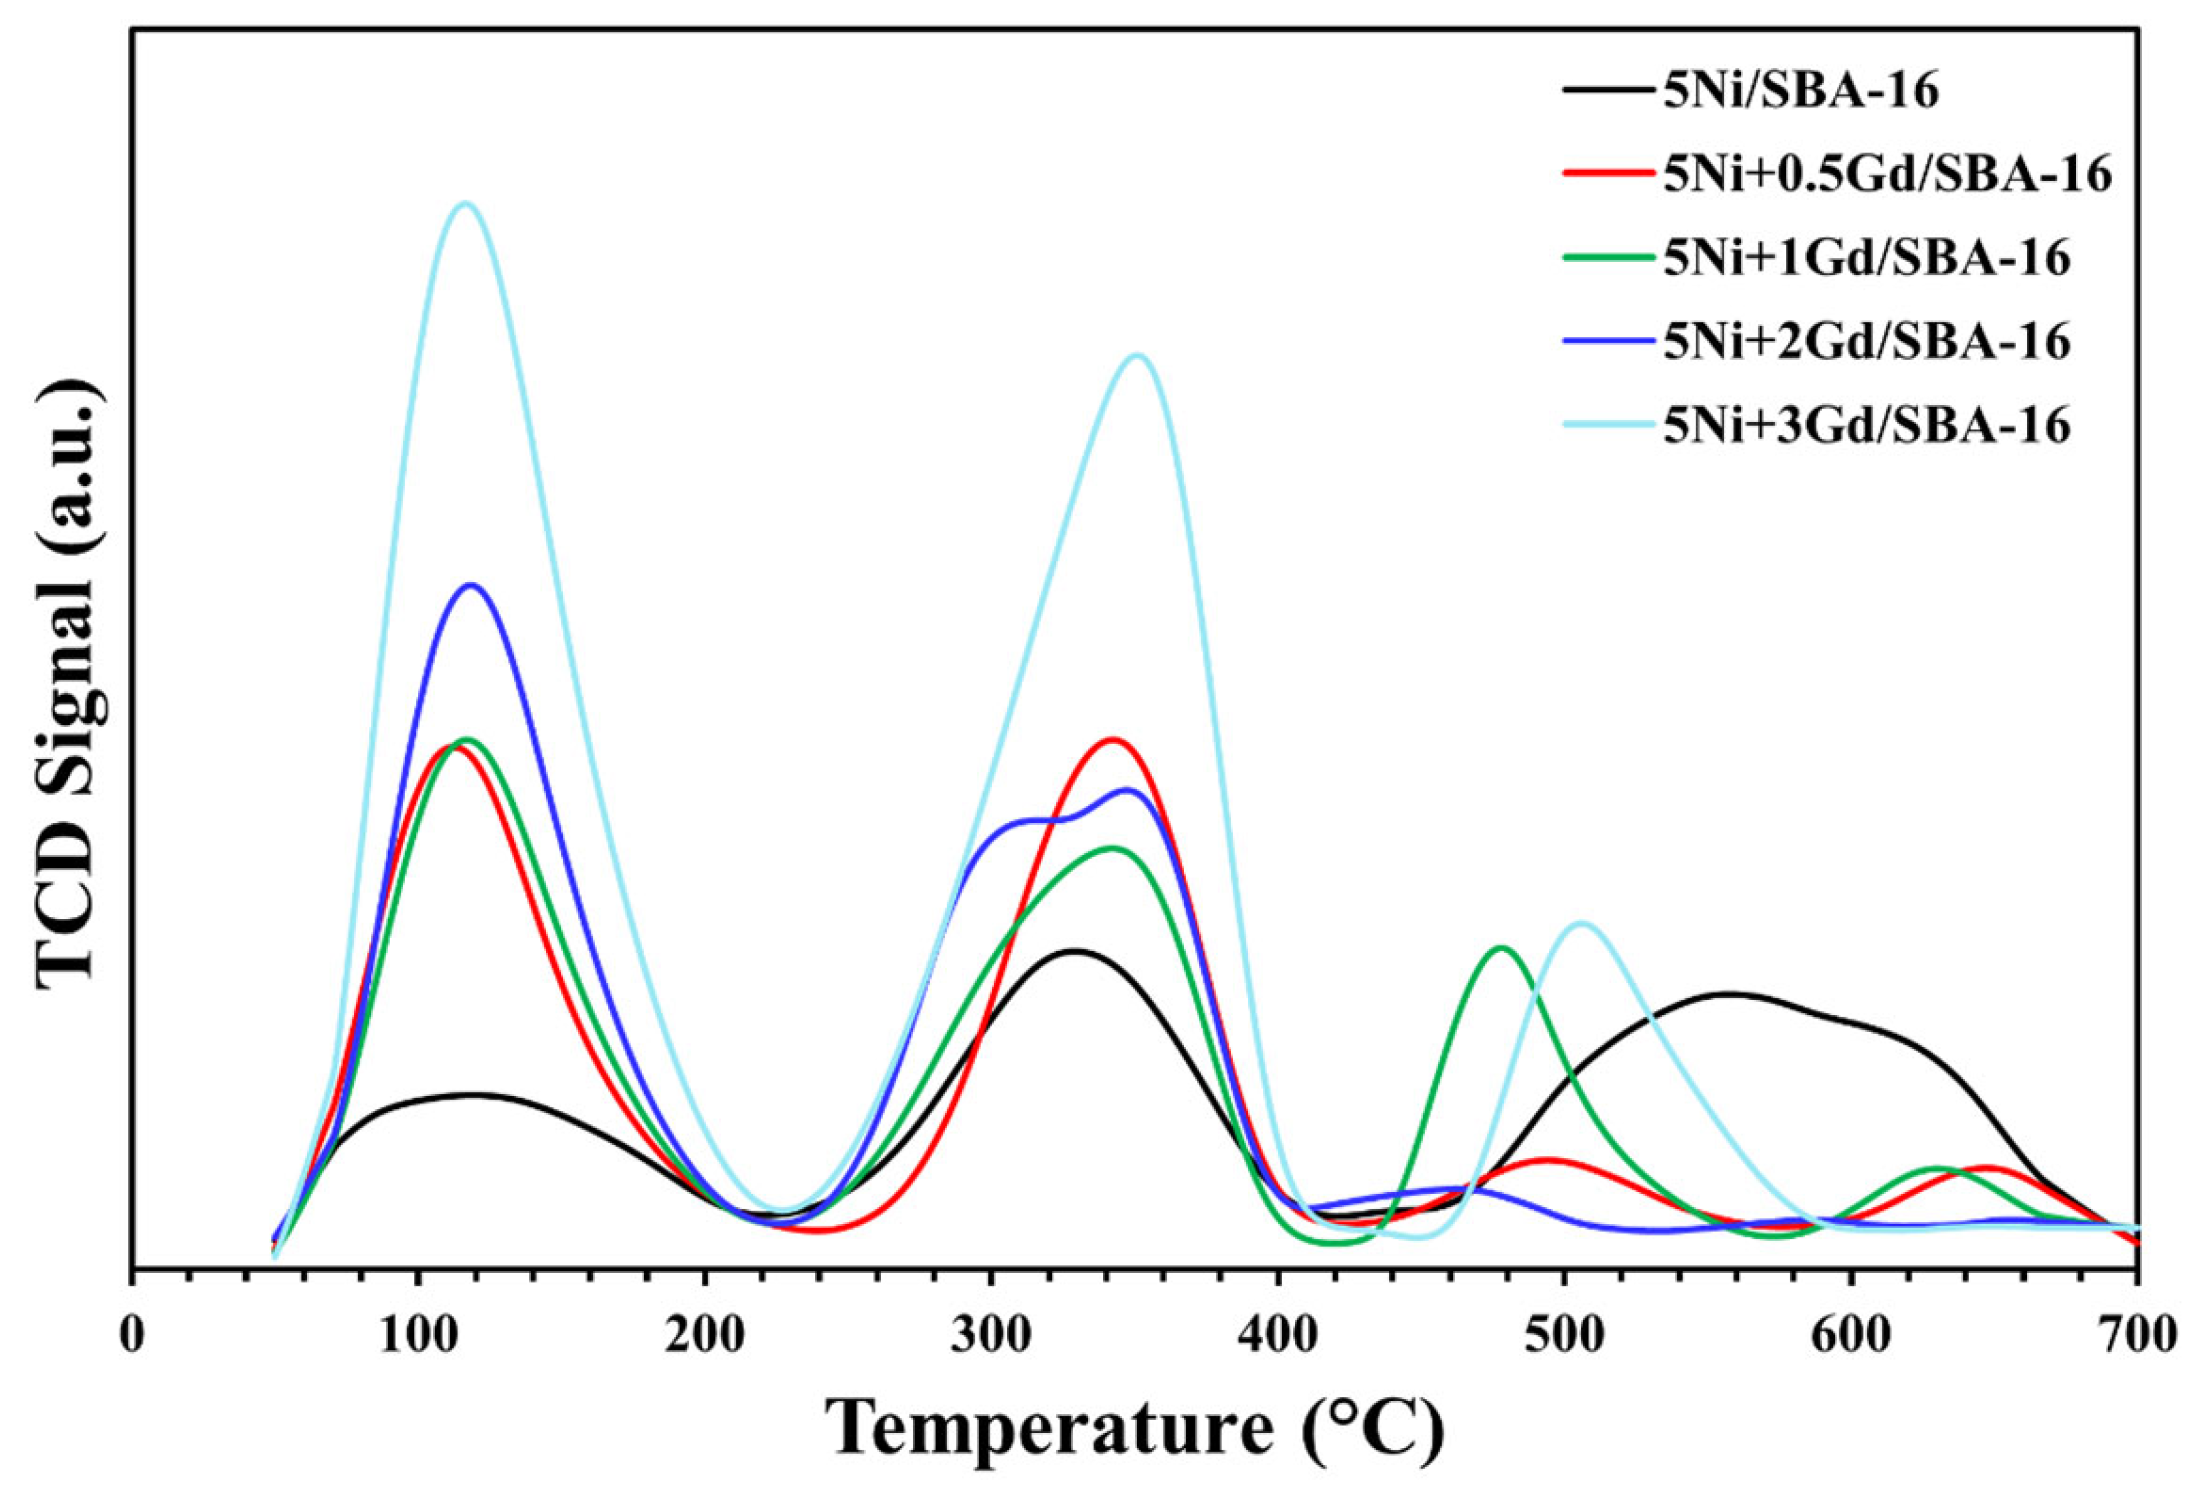
Temperature-programmed desorption profiles using ammonia (NH3) as the probe gas, shown in Figure 5, for fresh catalysts exhibited desorption peaks that could be divided into three sections. Section I represents desorption peaks within the temperature range of 60 and 210 °C, Section II contains peaks between 210 and 410 °C, while Section III comprises desorption peaks at temperatures above 410–700 °C. Sections I and II indicate desorption peaks associated with weak- and medium-strength acidic sites present on the surface of the catalysts, while Section III indicates strong acidic sites. In comparison with 5Ni/SBA-16, the Gd-promoted catalysts demonstrated enhanced acidic sites in all sections, especially in Sections I and II, indicating enhanced weak- and medium-strength acidic sites. These results indicate that the Gd promoter significantly influenced the acidic sites, which could potentially affect the activity results. Previous studies have shown that weak- and medium-strength acidic sites facilitate the adsorption and activation of methane molecules [35]. Hence, it can be concluded that the Gd promoter contributed to improving the acidic sites favorable for methane activation, resulting in higher activity of these catalysts, as discussed in Section 3.2.
In Figure 6, the SEM images reveal a substantial modification in the surface morphology of the catalysts, which is ascribed to the variance in their chemical makeup resulting from the inclusion or exclusion of the Gd promoter. The catalyst without Gd in image A appears highly agglomerated on the surface, suggesting an uneven nickel distribution on the support surface, whereas image B shows more dispersed particles with better distribution, making them appear smoother, indicating that the addition of 0.5 wt% promoter enhanced particle dispersion. The surface in image C appears to be free of agglomerations; however, the particles are larger and more irregular in shape. The particles in image D exhibit a more uniform and even distribution, suggesting a potential benefit from incorporating the promoter at a concentration of 2 wt%. However, image E reflects significant surface roughness and severe sintering of the metal oxide due to the addition of 3 wt% promoter to the catalyst. Moreover, SEM-EDX profiles (Figure S2) indicate that metal particles are well dispersed over the surface of the catalyst.
In Figure 7, images of the promoter-free sample taken before the DMR reaction using transmission electron microscopy (TEM) revealed a clear agglomeration of NiO particles, which is depicted by the dark area on the support surface in image A. The evaluation of metal particle size is challenging because of excessive sintering. Moreover, the agglomeration of metal particles resulted in a decrease in the number of active sites on the surface, leading to carbon deposition and the formation of nanofibers (Figure 7B) [36,37]. Figure 7B shows that the metal particles are surrounded by carbon and dispersed within the fibers as dark spots. On the contrary, the sample loaded with 2 wt% Gd promoter displayed an even distribution of nickel particles prior to the reaction as depicted in Figure 7C. The metal nanoparticles range from 10 nm up to 150 nm showing a wide range of metal particles well dispersed over the surface of SBA-16. Highly dispersed Gd-promoted catalyst exhibited excellent stability under reaction conditions enabling the catalyst to sustain the reaction for an extended period as demonstrated in Figure 7D, which displays metal particles retaining a spherical shape without any indication of carbon nanofibers [35].
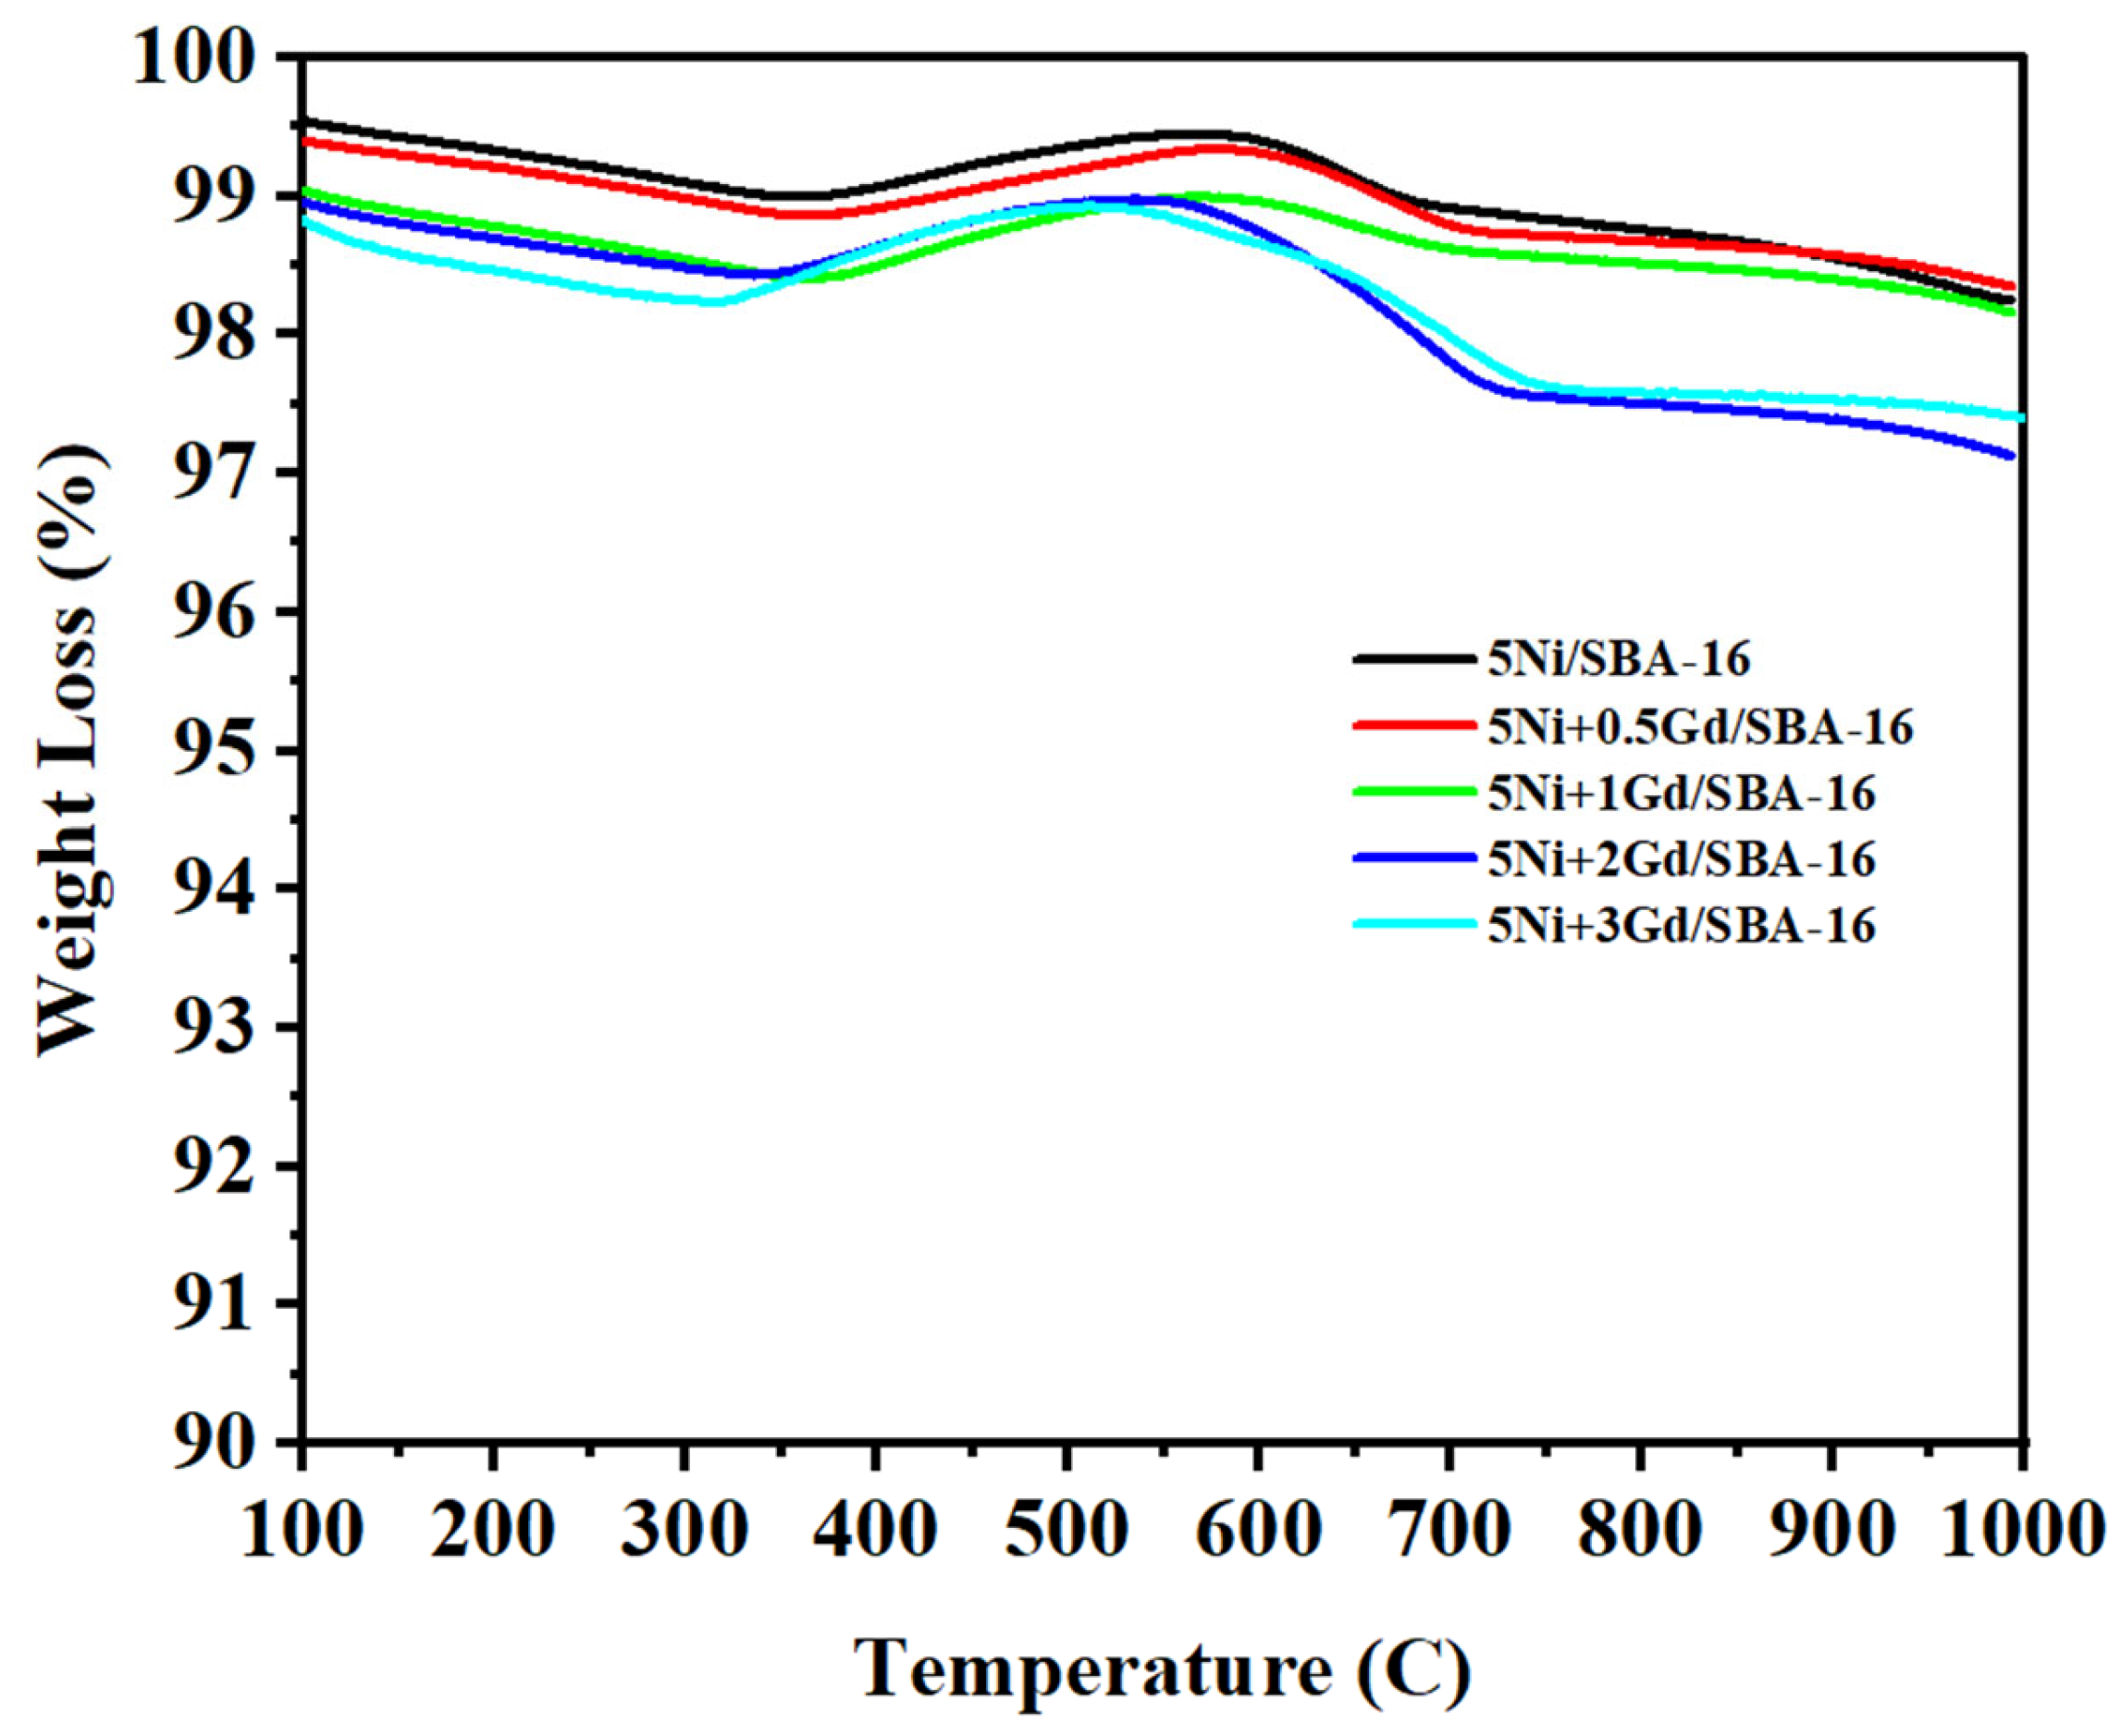
The amount of carbon deposited on the catalyst surface during the DMR reaction was determined by TGA Figure 8. Mass loss at low temperatures (≤300 °C) is primarily caused by the removal of moisture [28], whereas mass loss at high temperatures (≤650 °C) is due to the formation of graphitic carbon on the surface during the reaction [37]. A slight increase in weight could be associated with the oxidation of metal nanoparticles. The TGA reveals a more stable thermal stability and composition for all catalysts, as the mass loss did not exceed 4% of the sample’s mass, signifying that the catalysts can endure high temperatures during the reaction.

2.2. Catalytic Activity Results

The catalytic activity of the different catalysts at a reaction temperature of 800 °C, 42 L h−1 gcat−1 gas hour space velocity, and CH4: CO2: N2 (3:3:1) gas feed are shown in Figure 9. The unpromoted catalyst (5Ni/SBA-16) exhibited initial CH4 and CO2 conversion values of 62 and 73%, respectively. The Gd incorporation as a promoter enhanced the catalytic activity with initial CH4 conversions of 62.5, 69.5, 69.5, and 66% for 5Ni+0.5Gd/SBA-16, 5Ni+1Gd/SBA-16, 5Ni+2Gd/SBA-16, and 5Ni+3Gd/SBA-16, respectively. Similarly, initial CO2 conversions were found to be 74.5, 76, 77, and 79% for 5Ni+0.5Gd/SBA-16, 5Ni+3Gd/SBA-16, 5Ni+2Gd/SBA-16, and 5Ni+1Gd/SBA-16, respectively. All the catalysts have displayed good stability and the highest conversions of CH4, and CO2 were obtained for 5Ni+1Gd/SBA-16. Incorporating Gd to the catalyst modified its surface properties and the abundance of active elements necessary for methane activation, as well as enhanced CO2 adsorption by dispersing nickel and improving surface basicity. This increased adsorption facilitated carbon gasification resulting from the reverse Boudouard reaction, and hence cleaning the catalyst surface, ultimately increasing H2 production [15]. The higher CO2 conversions and H2/CO ratios less than unity also indicated the occurrence of reverse water gas shift side reaction that consumed CO2 to produce more CO. The H2/CO ratio results also showed that the gadolinium-enriched catalysts led to an improvement and a higher production rate than the catalyst without a promoter. However, increasing the promoter concentration may cause a decline in performance, as in the sample to which 2 and 3 wt% Gd were added. A catalyst with 1 wt% Gd was the optimal ratio for increased H2 production, balancing enhanced performance with the avoidance of negative effects associated with high concentrations.
The 1 wt% Gd (5Ni+1Gd/SBA-16) incorporation has played a significant role in enhancing the catalytic performance of this catalyst because Gd (a) promoted the amount of weak and moderate reducible NiO species over the surface of the catalyst (Table S1), (b) enhanced NiO dispersion, (c) reduced active metal particle size, (d) increased specific surface area, (e) improved acidic sites, and (f) suppressed carbon formation and metal particle agglomeration.
The comparison of this work with previous reports (Table 5) shows that the 5Ni+1Gd/SBA-16 catalyst outperforms several catalysts, including a noble metal (Ruthenium) based catalyst (1GdRuCeZr) [38]. Under similar operating conditions, 5Ni+4Gd/YZr [39] showed better catalytic performance than 5Ni+1Gd/SBA-16. Most of these catalysts either had a higher amount of active metal (Ni) or a lower space velocity, and even with lower space velocities, these catalysts [40,41,42,43,44] remained less active than 5Ni+1Gd/SBA-16. These findings highlight the role of Gd promoter in enhancing the catalytic activity that could potentially be further tuned to test under industrial conditions.

2.3. Response Surface Methodology Approach (RSM)

The Central Composite Design (CCD) methodology was employed, in this study, the experimental variables, namely space velocity, reaction temperature, and the CH4/CO2 molar ratio, were systematically varied within predefined ranges. These factors were normalized into standardized, dimensionless values spanning from −1 to +1, facilitating uniformity in statistical modeling and response surface analysis. The midpoint of each range represents the central level of the corresponding factor, while deviations from these midpoints define the extent of variation considered. This normalization enhances the interpretability of the regression coefficients and ensures consistency in the construction of the response surface. The overall central point, derived from the mean values of all variables, acts as a key reference for identifying potential curvature in the system’s response, thereby enabling a more accurate assessment of the interactions and effects of the experimental parameters on the outcome variable.
In this investigation, a quadratic model was used while preserving model simplicity and interpretability. Although higher-order models offer greater flexibility, they typically demand a larger number of experimental runs to achieve statistical reliability and may introduce unwarranted complexity. This added complexity can elevate the risk of overfitting, potentially compromising the model’s generalizability without yielding substantial improvements in predictive performance.
Y ^ = β 0 + i = 1 3 β i X i + i = 1 3 β i i X i 2 + i = 1 2 j = i + 1 3 β i j X i X j + ε
The predicted response variable Y ^ modeled as a function of the input factors X 1 , X 2 , X 3 , that can be expressed in either coded (standardized) or real values. The regression equation takes the form of a second-order polynomial, incorporating multiple components: the intercept ( β 0 ), linear ( β i X i ) that describe the main effect of each individual factor, quadratic terms ( β i i X i 2 ) capturing the nonlinear impact or curvature, interaction terms ( β i j X i X j ) accounting for the collective impact of simultaneous variation in two variables, and ε represents the residual variability which cannot be explained by the model [47]. The model’s accuracy is evaluated through ANOVA [48]. Table 6 presents the actual and coded values of the studied factors.

2.4. Process Modeling and Analysis of Variance

To improve model fitting, stabilize response variance, and normalize its distribution, a suitable power transformation was applied using the Central Composite Design (CCD) methodology [48]. This transformation was instrumental in achieving homoscedasticity and enhancing the statistical robustness of the regression analysis. Model adequacy was evaluated using ANOVA and predictive performance metrics, as summarized in Table S2. The presence of high F-values and low p-values across model terms indicates their statistical significance at the 95% confidence level. Additionally, elevated R2 values suggest a strong agreement between the experimental data and the model predictions.
Further validation of the model’s predictive capability was performed by comparing the estimated responses with observed experimental outcomes, as detailed in Table S3. Moreover, Figure S3 illustrates a strong linear correlation between the actual and predicted values for CH4 conversion, CO2 conversion, and the H2/CO product ratio, thereby reinforcing the reliability and predictive strength of the developed model [48].

2.5. Model Equation Based on the Real Factor Values

The dataset was subjected to ANOVA with a 0.05 significance threshold, and the Stat-Ease tool was employed to derive the following models.
C H 4 ^   C o n v e r s i o n % = 809.28986 + 1.95736 T 0.002512 S V + 172.45055 C H 4 C O 2 + 0.00000332099   T S V 0.125891 T C H 4 C O 2 0.000397 S V C H 4 C O 2 0.001075 T 2 0.00000000504158 S V 2 44.83243 C H 4 C O 2 2
C O 2 ^   C o n v e r s i o n % = 764.57071 + 1.83338 T 0.002473 S V + 170.15545 C H 4 C O 2 + 0.00000393784   T S V 0.009834 T C H 4 C O 2 0.000353 S V C H 4 C O 2 0.00112 T 2 0.00000000911281 S V 2 60.88105 C H 4 C O 2 2
H 2 C O ^   r a t i o = 2.63976 + 0.007076 T 0.000019 S V + 1.23235 C H 4 C O 2 + 0.0000000193002 T   S V + 0.00033 T C H 4 C O 2 0.00000275479 S V C H 4 C O 2 0.00000447065 T 2 + 0.0000000000592984 S V 2 0.575657 C H 4 C O 2 2
The models (3)–(5) include multiple components such as β0’s are intercept terms representing the expected response variable value when all other factors are set to 0; main effects i = 1 3 β i X i , reflecting the linear variation in the response variable for a single-unit increment in a factor at fixed values of remaining factors; interaction terms i = 1 2 j = i + 1 3 β i j X i X j , capturing the collective impact of two factors on the value of the response variable, and quadratic terms i = 1 3 β i i X i 2 , which account for nonlinear relationships between the factors and the response variable.
Table S2 and the values of the determination coefficient R2 show that the first fitted model accounts for around 99.48% of the variation in CH4 conversion, the second model for around 99.30% in CO2 conversion, and the third model for about 97.87% in H2/CO ratio. Reasons outside the purview of this experiment are responsible for the remaining variances in the response variable in each case.

2.6. Simulation Using Design-Expert Software

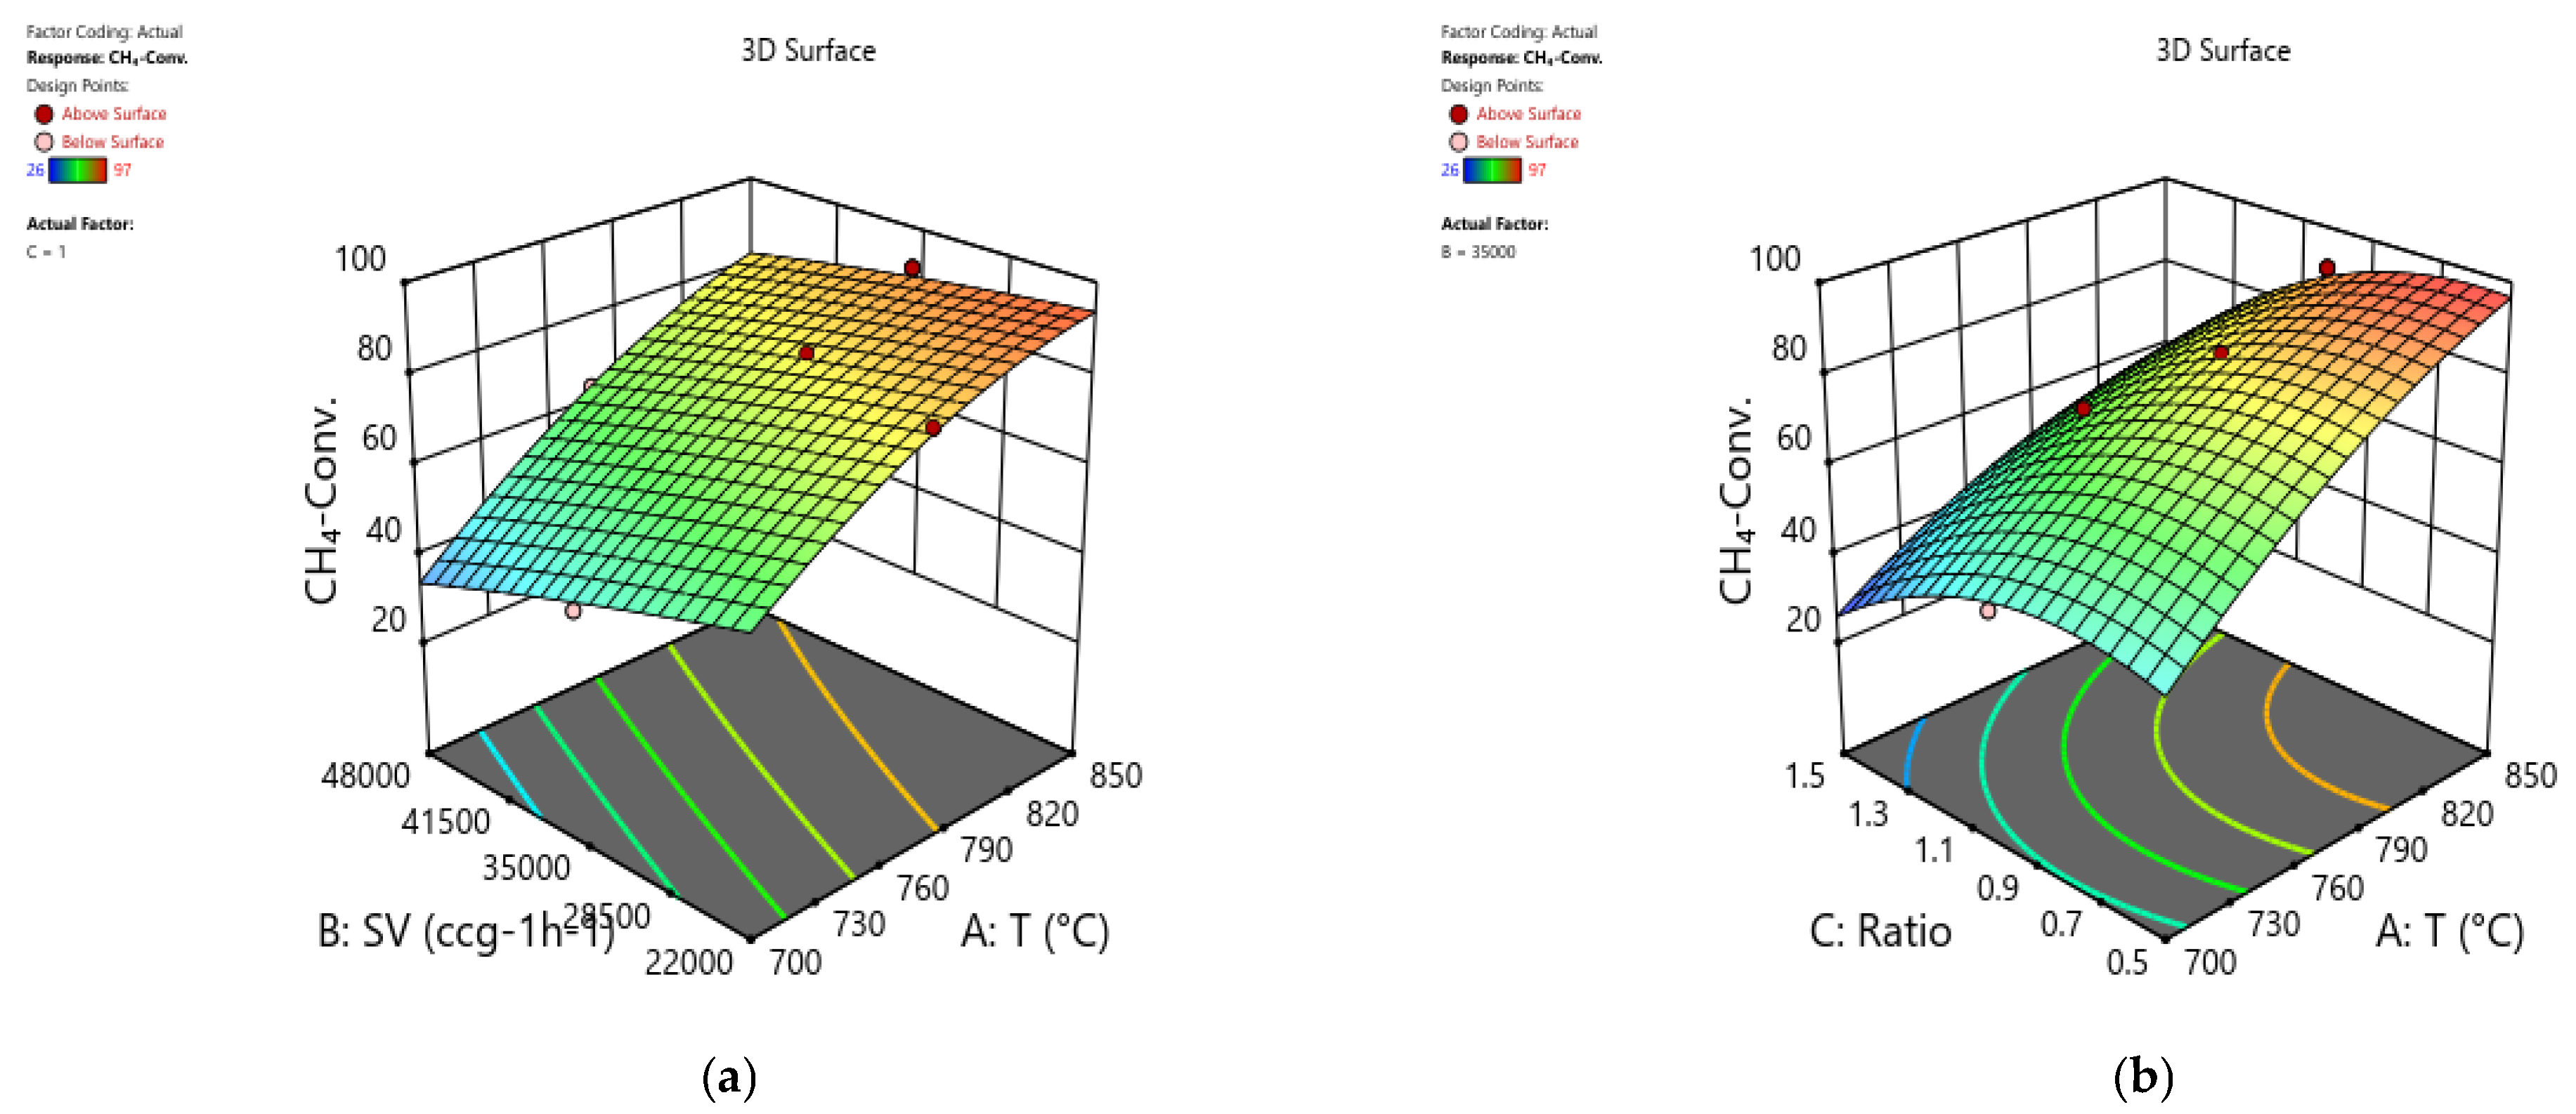
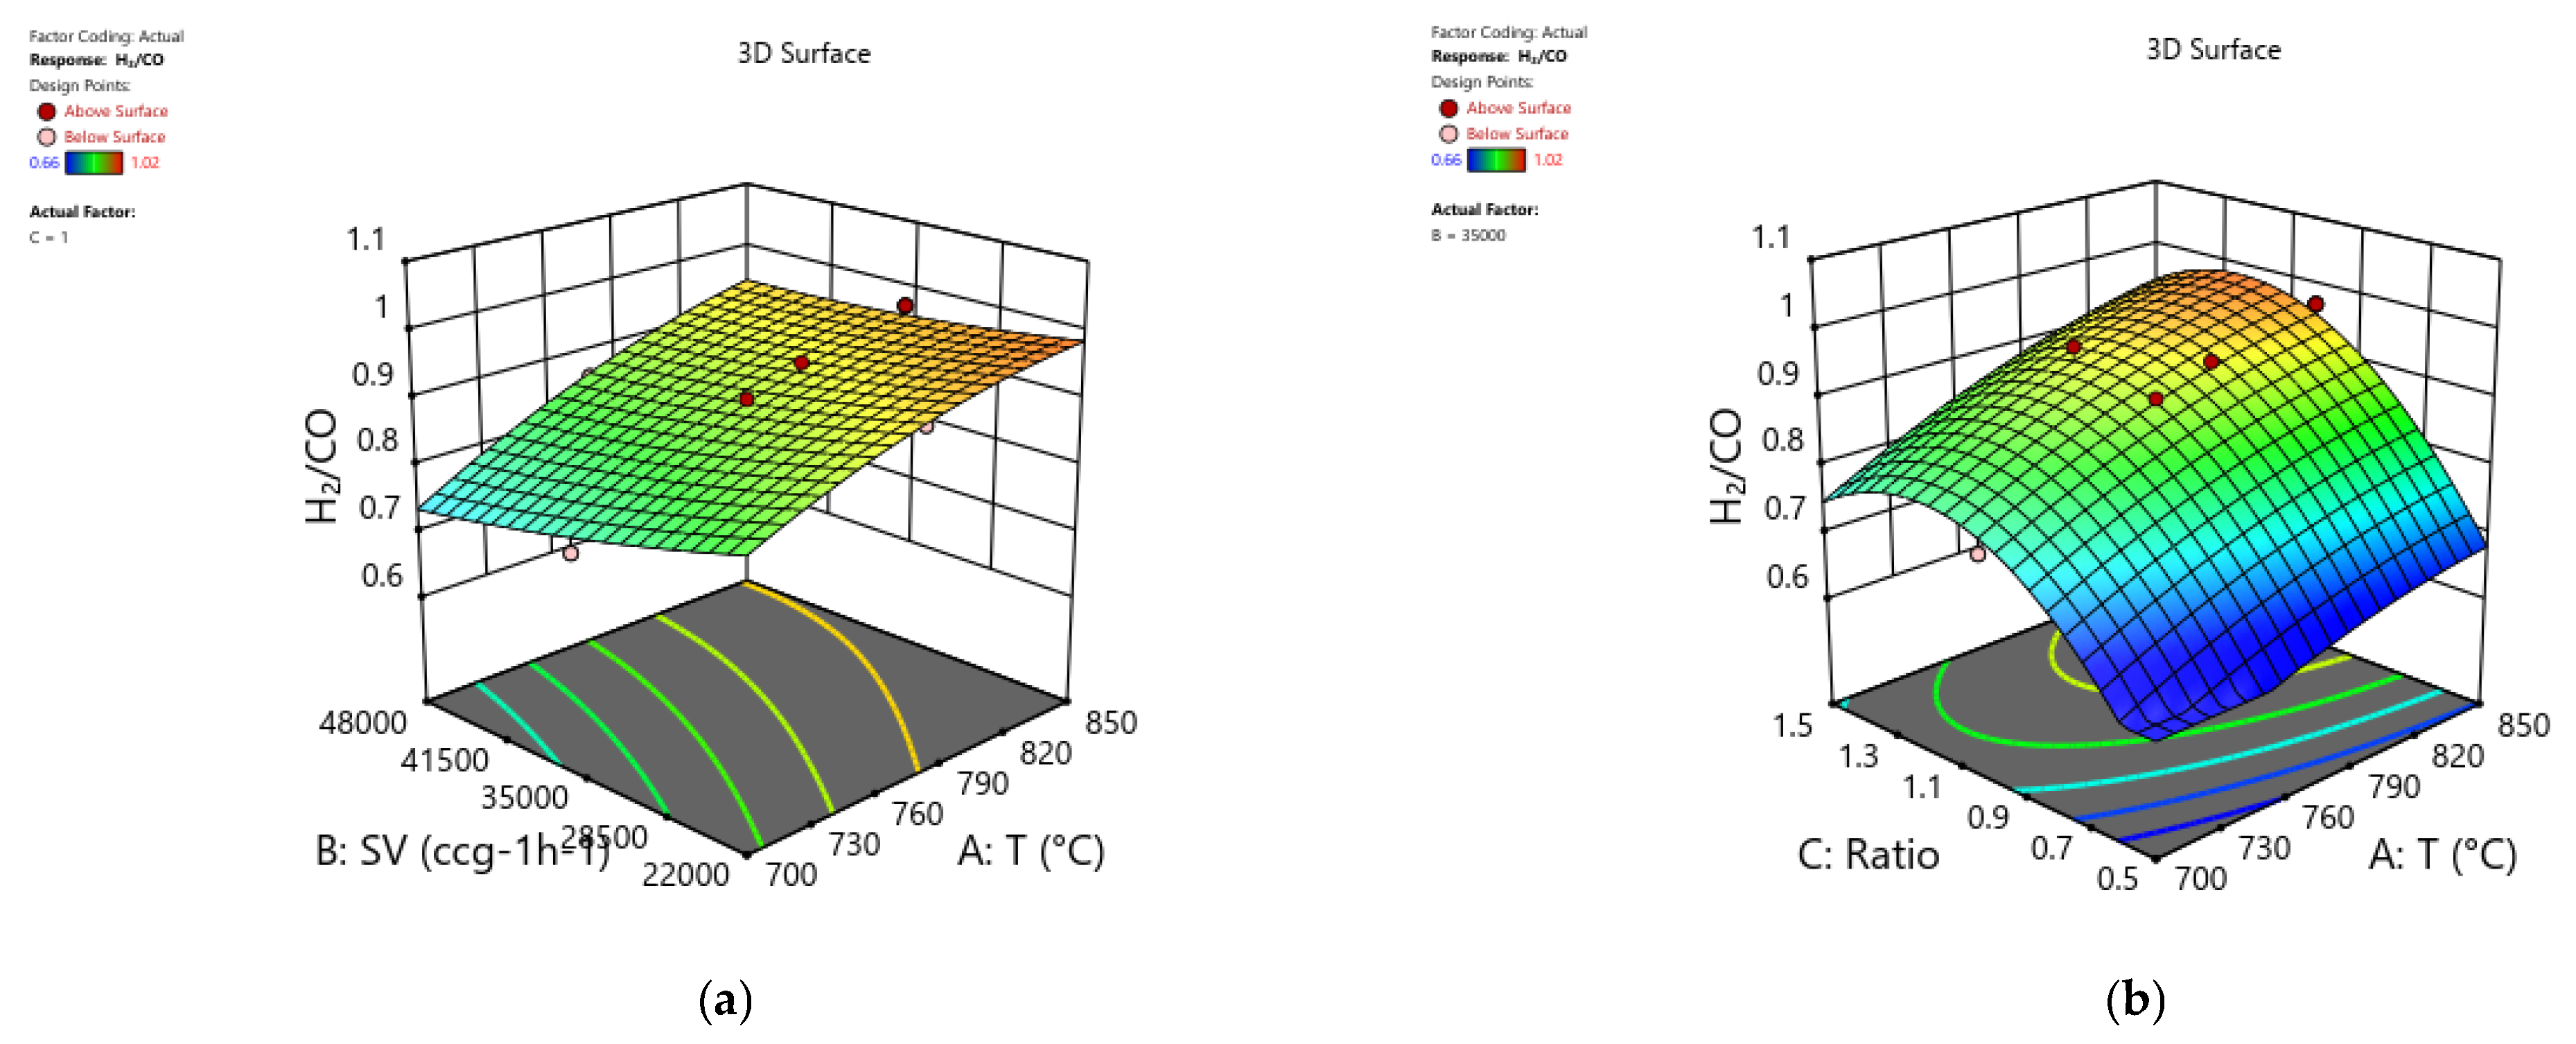
In this section, 3D presentation of the models in Equations (3)–(5) are shown in Figure 10, Figure 11 and Figure 12. The response variable’s models at their expected levels with each element can be seen in these charts.
Figure 10 displays the impact of temperature, space velocity, and CH4/CO2 ratio on CH4 conversion in 3D response surface plots. Figure 10a presents a relation between CH4 conversion, space velocity, and temperature at fixed CH4/CO2 ratio of 1. The response surface signifies that CH4 conversion increases as temperature rises and SV decreases. Figure 10b shows that increasing temperature and decreasing CH4/CO2 ratio significantly enhance CH4 conversion at fixed SV of 35,000 mL h−1 gcat−1. In both cases, CH4 conversion improves from 26.3% at 700 °C to 97.5% at 850 °C, with temperature employing the most significant impact on its variation.
Figure 11 depicts the effects of temperature, GHSV, and CH4/CO2 ratio on the variation of CO2 conversion through three-dimensional response surface plots. In Figure 11a, where CH4/CO2 is fixed at the center range, one, an increase in temperature and a decrease in SV result in a rise in CO2 conversion as follows from 39.84% at 700 °C to 95.67% at 850 °C. Similarly, Figure 11b shows that as both temperature and CH4/CO2 ratio increase, leading to a higher CO2 Conversion change to follow the same range with SV fixed at 35,000 cc g−1 h−1.
The strong impacts of temperature, GHSV, and CH4/CO2 ratio on H2/CO are shown in 3D response surface plots in Figure 12, which concludes the discussion. Figure 12a shows that, with CH4/CO2 set at 1, the gas hourly space velocity (GHSV) increases H2/CO from 0.66 at 700 °C to a maximum of 1.02 at 850 °C as a function of temperature. At SV = 35,000 cc g−1 h−1, Figure 12b demonstrates that a larger H2/CO is achieved by raising both the temperature and the CH4/CO2 ratio, within the same range of values.
Figures S4–S6 exhibit a two-dimensional representation of all these relations, and original units are used for all these factors.

2.7. Performance Optimization

This section identifies the optimal process conditions using the Stat-Ease 360 software, which applied numerical optimization to maximize the response variables. Among the multiple solutions generated, the one with the highest desirability was selected. The optimal temperature, GHSV, and CH4/CO2 ratio are listed in Table 7. Experimental validation showed strong agreement with the predicted results, confirming the model’s reliability.

3. Materials and Methods

3.1. Catalyst Preparation

The catalysts were prepared using a wet impregnation process consisting of an aqueous Ni(NO3)2·6H2O solution (equivalent to 5 wt% Ni = 0.371 g/mol), aqueous solutions with different concentrations of Gd(NO3)2·6H2O (equivalent to 0–3 wt% = 0.0215, 0.0430, 0.0861 g/mol), and the remaining SBA-16 (0.95, 0.945, 0.94, 0.93, 0.92 g/mol). All of these precursors were dissolved in high-purity distilled water, mixed thoroughly, and heated continuously until Ni and Gd were loaded into the support structure, and a slurry was formed. The slurry was dried at 120 °C for 2 h, then the temperature was gradually increased by 3 °C/min to 600 °C inside the box furnace under continuous air flow, and maintained at this temperature for 5 h to remove all unwanted impurities and adjust the nickel distribution on the surface of the SBA-16 support. The slurry was then spontaneously cooled to room temperature and ground into a powder.

3.2. Catalyst Characterization

To evaluate the reaction performance, physical and chemical properties, and structure of the catalyst, several sophisticated analytical tools were used to characterize the catalyst samples. To study the catalytic performance throughout the reaction, as well as the ideal degree of reduction for preparing the active catalyst, a temperature-programmed reduction (TPR) experiment was conducted on a Micromeritics Auto Chem II 2920 (Norcross, GA, USA). In the H2-TPR experiment, a 10%H2/Ar mixture was applied to a 0.07 g sample at a flow rate of 40 mL/min while subjected to a temperature ramp of 10 °C/min from room temperature to 1000 °C. The quantity of hydrogen used at various temperatures was measured using a thermal conductivity detector (TCD). A Rigaku (Miniflex) diffractometer (Bruker, Billerica, MA, USA) was used to conduct X-ray diffraction (XRD) investigation, with CuKα radiation operating at 40 kV and 40 mA, and a 2θ scan range of 10–90°. After downloading the instrument data file, X’pert High Score Plus (5.3a) was used for analysis. To determine the crystal structure and composition of the catalyst, X’pert High Score Plus software was used to compare the existing phases of the material with the JCPDS reference files. The porosity and specific surface area were measured using the Brunauer–Emmett–Teller (BET) on a Micromeritics Tristar II 3020 analyzer (Norcross, GA, USA). Initially, the catalyst samples were subjected to degassing at 200 °C for 3 h to extract adsorbed moisture and volatile gases. A Laser Raman Spectrometer (NMR-4500) (JASCO, Tokyo, Japan) was used to analyze the crystal structure and chemical composition of the fresh and used catalyst samples. JEOL’s transition electron microscope (JEM-2100F) (Akishima, Japan) was utilized to record the morphology of the 5Ni/SBA-16 and 5Ni+2Gd/SBA-16 samples before and after reaction. A surface elemental analysis was conducted using a scanning electron microscope equipped with an Oxford energy-dispersive X-ray spectroscopy module. To measure the amount of carbon formed over the surface of the catalyst during reaction, the samples were subjected to thermogravimetric analysis (TGA) using a Shimadzu TGA-51 (Kyoto, Japan) to track the physical changes in the sample as the temperature was increased. A total of 10 to 15 mg of spent catalyst samples were placed in a sampling pan and the temperature was raised under flowing air (50 mL/min) from room temperature to 1000 °C using a ramp rate of 20 °C min−1 to evaluate the weight loss.

3.3. Catalyst Activity Test

100 mg of each catalyst was charged into a 9.1 mm internal diameter (with a length of 30 cm) stainless-steel tubular reactor (purchased from PID Eng. & Tech, Madrid, Spain). The tube was sealed on both sides, and reactor temperature was monitored using a K-type thermocouple placed at its core. The reactor tube was placed inside an electric furnace connected to a temperature controller, pressure gauge, and pressure relief valve to prevent pressure buildup inside the reactor. The flow of gases from the feed units connected to four gas feed lines (N2, H2, CH4, and CO2) was ensured by opening the flow valve until the catalyst was reduced under flowing hydrogen (20 mL/min) for an hour at 800 °C. Under similar conditions, the reactor was purged with nitrogen to remove hydrogen before feed gas containing an equal volume ratio of methane and carbon dioxide balanced with nitrogen (CH4/CO2/N2 = 3:3:1) was flown (70 mL/min) at atmospheric pressure through the reduced catalyst at a gas hourly space velocity (GHSV) of 42 L h−1 gcat−1. The best catalyst was selected for optimization at different temperatures: 700, 775, 800, and 850 °C. Feed gas mixtures with varying volume ratios were passed through the reactor to attain GHSV values of 22,000, 35,000, and 48,000 mL h−1 gcat−1 and the reactor was fed with different ratios of reactant gases CH4 and CO2, namely 1.25, 1, and 0.75. An online gas chromatograph (Shimadzu GC-2014) was used to analyze the product gas stream using a thermal conductivity detector (TCD). CH4 and CO2 conversions and H2/CO ratio are determined using the following equations:
C H 4   c o n v e r s i o n   % =   C H 4 ,   i n C H 4 , o u t   C H 4 , i n   × 100
C O 2   c o n v e r s i o n   % = C O 2 ,   i n C O 2 , o u t C O 2 , i n × 100
H 2 C O   R a t i o = m o l e   o f   H 2   p r o d u c e d m o l e   o f   C O   p r o d u c e d

3.4. Design Experiment and Process Optimization

The 13th version of Design Expert software was used to analyze the design of experiments by employing the response surface-based central composite design (CCD) technique. The yield of hydrogen (a product of methane dry reforming) was determined based on the effects of different operating variables on process performance. In this experiment, three variable parameters were adopted: CH4/CO2 feed ratio (1.25, 1, and 0.75), GHSV (22,000, 35,000, and 48,000 mL h−1 gcat −1), and temperature (700, 775, 800, and 850 °C). On the basis of previous literature on methane dry reforming, a range of reaction conditions were selected, and the limits (both minimum and maximum) were defined [49,50]. The resulting yield value obtained at maximum range, was attained according to the experimental work. The main goal of the optimization design is to reduce unfavorable or undesirable outputs. There are models for optimization design, but the best model is the quadratic model, which is represented by Equation (9) [49]
Y = β ° + t = 1 3 β i X i + i 3 β i i X i 2 + i 1 2 j = i + 1 3 β i j X i X j
In Equation (9), Y represents the response, β ° , β i , β i i , and β i j are the intercept, linear, quadratic, and interaction regression coefficients, respectively. Two independent variables, X i and X j , have coded values. Parameters like R-squared and mean error (MAE) are used to compare the expected and actual values in order to find the residuals to evaluate the model’s performance [50] which is represented by the following equations:
R 2   =   1     i = 1 n E i P i 2 i = 1 n P i E ¯ 2 + i = 1 n E i P i 2
APE = 100 E i P i E i %
MAE = 1 n i = 1 n E i P i E i
MAPE = 100 × 1 n i = 1 n E i P i E i %
E i and p i are the experimental/actual and predicted values of the i-th observation, respectively, and n is the total number of experiments. E ¯ is the mean value of the response variable across all observations. After that, by entering the necessary values, the optimization step can be advanced.

4. Conclusions

This work evaluated the dry methane reforming reaction using a 5 wt% Ni-based catalyst supported on SBA-16. The role of the Gd promoter was also studied by incorporating Gd in various amounts ranging from 0.5 to 3 wt%. The Gd-free catalyst displayed less dispersed nickel oxide species with relatively larger particle size while Gd incorporation facilitated better dispersion and reduced active metal particle size of nickel oxide species. The Gd-promoted catalyst characterization results revealed the formation of smaller, well-dispersed active sites, a higher specific surface area, higher amounts of acidic sites, and better reducibility. All these factors contributed to better activity of these promoted catalysts in comparison with 5Ni/SBA-16. For instance, initial CH4 and CO2 conversion of 62 and 74%, respectively, for 5Ni/SBA-16 reached 69.5 and 79% with the addition of 1 wt% of Gd (5Ni+1Gd/SBA-16). Moreover, the spent catalyst characterization results revealed the formation of carbon nanotubes over the surface of 5Ni/SBA-16 in contrast to no significant carbon formation over 5Ni+1Gd/SBA-16. These results suggest that Gd incorporation not only enhanced activity but also facilitated long-term stability. The process optimization results also showed that the theoretical findings were consistent with the experimental outcomes.

Supplementary Materials

The following supporting information can be downloaded at: https://www.mdpi.com/article/10.3390/catal15100966/s1, Figure S1: Deconvoluted peaks of TPR (Figure 3); Figure S2: SEM-EDX of fresh (a) 5Ni/SBA-16 and (b) 5Ni+1Gd/SBA-16; Figure S3: Comparison between the actual and estimated data for the three responses variables; Figure S4: 2D relationship between factors (Temperature (T), Space Velocity (SV), and C H 4 / C O 2 ) and CH4 Conversion; Figure S5: 2D relationship between factors (Temperature (T), Space Velocity (SV), and H 2 / C O ) and CO2 Conversion; Figure S6: 2D relationship between factors (Temperature (T), Space Velocity (SV), and C H 4 / C O 2 ) and H2/CO; Table S1: Reduction peak temperatures; Table S2: Analysis of variance (ANOVA) for the quadratic models of the three response variables; Table S3: Experimental (Exp.) and estimated (Est.) values for various components of the reaction system.

Author Contributions

Conceptualization, G.A., W.U.K., S.B.A. and A.S.A.-F.; formal analysis, E.A.A., W.U.K., A.A.I. and O.H.O.; investigation, E.A.A., A.A.B. and M.O.B.; writing—original draft preparation, E.A.A., W.U.K. and M.O.B.; writing—review and editing, G.A., W.U.K., S.B.A., O.H.O., A.A.B., R.M., A.A.I. and A.S.A.-F.; supervision, G.A. and A.S.A.-F.; project administration, G.A. and A.S.A.-F.; funding acquisition, A.S.A.-F. All authors have read and agreed to the published version of the manuscript.

Funding

Ongoing Research Funding program (ORF-2025-779), King Saud University, Riyadh, Saudi Arabia, and Researchers Supporting Project number (PNURSP2025R743), Princess Nourah bint Abdulrahman University.

Data Availability Statement

The data presented in this study are available in this paper.

Acknowledgments

The authors would like to extend their sincere appreciation to the Ongoing Research Funding program (ORF-2025-779), King Saud University, Riyadh, Saudi Arabia. Also, authors would like to extend their sincere appreciation to the Princess Nourah bint Abdulrahman University Researchers Supporting Project number (PNURSP2025R743), Princess Nourah bint Abdulrahman University, Riyadh, Saudi Arabia.

Conflicts of Interest

The authors declare no conflicts of interest.

References

  1. Wang, Y.; Li, R.; Zeng, C.; Sun, W.; Fan, H.; Ma, Q.; Zhao, T.-S. Recent Research Progress of Methane Dry Reforming to Syngas. Fuel 2025, 398, 135535. [Google Scholar] [CrossRef]
  2. Kabir, M.; Habiba, U.E.; Khan, W.; Shah, A.; Rahim, S.; Rios-Escalante, P.R.D.L.; Farooqi, Z.-U.; Ali, L.; Shafiq, M. Climate Change Due to Increasing Concentration of Carbon Dioxide and Its Impacts on Environment in 21st Century; a Mini Review. J. King Saud Univ. Sci. 2023, 35, 102693. [Google Scholar] [CrossRef]
  3. Nunes, L.J.R. The Rising Threat of Atmospheric CO2: A Review on the Causes, Impacts, and Mitigation Strategies. Environments 2023, 10, 66. [Google Scholar] [CrossRef]
  4. Wang, L.; Wang, L.; Li, Y.; Wang, J. A Century-Long Analysis of Global Warming and Earth Temperature Using a Random Walk with Drift Approach. Decis. Anal. J. 2023, 7, 100237. [Google Scholar] [CrossRef]
  5. Li, L.; Lin, J.; Wu, N.; Xie, S.; Meng, C.; Zheng, Y.; Wang, X.; Zhao, Y. Review and Outlook on the International Renewable Energy Development. Energy Built Environ. 2022, 3, 139–157. [Google Scholar] [CrossRef]
  6. International Energy Agency (IEA). World Energy Outlook 2024; IEA: Paris, France, 2024. [Google Scholar]
  7. Hantoko, D.; Khan, W.U.; Osman, A.I.; Nasr, M.; Rashwan, A.K.; Gambo, Y.; Al Shoaibi, A.; Chandrasekar, S.; Hossain, M.M. Carbon–Neutral Hydrogen Production by Catalytic Methane Decomposition: A Review. Environ. Chem. Lett. 2024, 22, 1623–1663. [Google Scholar] [CrossRef]
  8. Jiang, T.; He, X.; Su, B.; Havea, P.H.; Wei, K.; Kundzewicz, Z.W.; Liu, D. COP 28: Challenge of Coping with Climate Crisis. Innovation 2024, 5, 100559. [Google Scholar] [CrossRef]
  9. de Medeiros, F.G.M.; Lopes, F.W.B.; Rego de Vasconcelos, B. Prospects and Technical Challenges in Hydrogen Production through Dry Reforming of Methane. Catalysts 2022, 12, 363. [Google Scholar] [CrossRef]
  10. le Saché, E.; Reina, T.R. Analysis of Dry Reforming as Direct Route for Gas Phase CO2 Conversion. The Past, the Present and Future of Catalytic DRM Technologies. Prog. Energy Combust. Sci. 2022, 89, 100970. [Google Scholar] [CrossRef]
  11. Bahari, M.B.; Mamat, C.R.; Jalil, A.A.; Hassan, N.S.; Hatta, A.H.; Alhassan, M.; Aziz, M.A.; Le, V.G.; Siang, T.J.; Timmiati, S.N. Mitigating Deactivation in Dry Methane Reforming by Lanthanum Catalysts for Enhanced Hydrogen Production: A Review. Int. J. Hydrogen Energy 2025, 104, 426–443. [Google Scholar] [CrossRef]
  12. Wittich, K.; Krämer, M.; Bottke, N.; Schunk, S.A. Catalytic Dry Reforming of Methane: Insights from Model Systems. ChemCatChem 2020, 12, 2130–2147. [Google Scholar] [CrossRef]
  13. Soomro, S.; Sun, Z.; Lu, D.Y.; Zhou, Z.; Li, L.; Duan, L. Optimizing the CH4/CO2 Dry Reforming Catalysts: Insights from Ni/SBA-16, Ni/KIT-6, and Ni/MCM-41 Supported on Silica with Different Mesopore Symmetries. Can. J. Chem. Eng. 2025. [Google Scholar] [CrossRef]
  14. Park, H.-R.; Kim, B.-J.; Ryu, S.-J.; Jeon, Y.; Lee, S.S.; Bae, J.-W.; Roh, H.-S. Super-Dry Reforming of Methane over Surface Oxygen Mobility Enhanced Ni/MgO-Ce/SBA-15 Catalysts. Catal. Today 2025, 453, 115257. [Google Scholar] [CrossRef]
  15. Sun, C.; Summa, P.; Wang, Y.; Świrk Da Costa, K.; Miró i Rovira, A.; Casale, S.; Świerczek, K.; Hu, C.; Rønning, M.; Da Costa, P. Boosting CO2 Reforming of Methane via the Metal-Support Interaction in Mesostructured SBA-16-Derived Ni Nanoparticles. Appl. Mater. Today 2022, 26, 101354. [Google Scholar] [CrossRef]
  16. Zhang, S.; Muratsugu, S.; Ishiguro, N.; Tada, M. Ceria-Doped Ni/SBA-16 Catalysts for Dry Reforming of Methane. ACS Catal. 2013, 3, 1855–1864. [Google Scholar] [CrossRef]
  17. Taherian, Z.; Khataee, A.; Han, N.; Orooji, Y. Hydrogen Production through Methane Reforming Processes Using Promoted-Ni/Mesoporous Silica: A Review. J. Ind. Eng. Chem. 2022, 107, 20–30. [Google Scholar] [CrossRef]
  18. Taherian, Z.; Khataee, A.; Orooji, Y. Nickel-Based Nanocatalysts Promoted over MgO-Modified SBA-16 for Dry Reforming of Methane for Syngas Production: Impact of Support and Promoters. J. Energy Inst. 2021, 97, 100–108. [Google Scholar] [CrossRef]
  19. Kiani, P.; Meshksar, M.; Rahimpour, M.R.; Iulianelli, A. CO2 Utilization in Methane Reforming Using La-Doped SBA-16 Catalysts Prepared via PH Adjustment Method. Fuel 2022, 322, 124248. [Google Scholar] [CrossRef]
  20. Moravvej, Z.; Rahimpour, M.R. Comparative Study of Modified Ni Catalysts over Hexagonal & Cubic-Ordered Mesoporous Al2O3 and Cubic-Ordered Mesoporous SBA-16 Support for Effective Hydrogen Production through CO2/CH4 Reforming. Int. J. Hydrogen Energy 2025, 142, 1168–1183. [Google Scholar] [CrossRef]
  21. Panda, S.; Singh, G.; Kaishyop, J.; Gazi, M.J.; Mule, H.M.; Khan, T.S.; Sharma, O.; Bordoloi, A. Essentials of Mo+6/Mo+4 and Ce+4/Ce+3 Redox Couples in Auto-Regenerated Catalyst for Dry Methane Reforming. Chem. Eng. J. 2025, 522, 167586. [Google Scholar] [CrossRef]
  22. Silva, C.L.S.; Marchetti, S.G.; da Costa Faro Júnior, A.; de Freitas Silva, T.; Assaf, J.M.; do Carmo Rangel, M. Effect of Gadolinium on the Catalytic Properties of Iron Oxides for WGSR. Catal. Today 2013, 213, 127–134. [Google Scholar] [CrossRef]
  23. Wu, Y.; Wang, H.; Xiao, F.-S.; Wu, Z. Gadolinium-Mediated Oxygen Affinity Induced Efficient Covalorization of CH4 and N2O in an Ir–Gd2O3 Single-Atom Catalyst. J. Am. Chem. Soc. 2025, 147, 25787–25798. [Google Scholar] [CrossRef] [PubMed]
  24. Gurav, H.R.; Dama, S.; Samuel, V.; Chilukuri, S. Influence of Preparation Method on Activity and Stability of Ni Catalysts Supported on Gd Doped Ceria in Dry Reforming of Methane. J. CO2 Util. 2017, 20, 357–367. [Google Scholar] [CrossRef]
  25. Kryuchkova, T.A.; Sheshko, T.F.; Kost’, V.V.; Chislova, I.V.; Yafarova, L.V.; Zvereva, I.A.; Lyadov, A.S. Dry Reforming of Methane over GdFeO3-Based Catalysts. Pet. Chem. 2020, 60, 1052–1058. [Google Scholar] [CrossRef]
  26. Qi, H.; Su, X.; Qiu, P.; Zhang, T.; Liu, D.; Han, S.; Cui, D.; Cheng, M.; Tu, B. Fine Interface Contact and High Activity of Nickel-Based Anode Modified by Gadolinium for Hydrogen and Methane Fuel. Int. J. Hydrogen Energy 2022, 47, 22192–22202. [Google Scholar] [CrossRef]
  27. Esperanza Adrover, M.; Pedernera, M.; Bonne, M.; Lebeau, B.; Bucalá, V.; Gallo, L. Synthesis and Characterization of Mesoporous SBA-15 and SBA-16 as Carriers to Improve Albendazole Dissolution Rate. Saudi Pharm. J. 2020, 28, 15–24. [Google Scholar] [CrossRef]
  28. Fakeeha, A.H.; Al-Fatesh, A.S.; Srivastava, V.K.; Ibrahim, A.A.; Abahussain, A.A.M.; Abu-Dahrieh, J.K.; Alotibi, M.F.; Kumar, R. Hydrogen Production from Gadolinium-Promoted Yttrium-Zirconium-Supported Ni Catalysts through Dry Methane Reforming. ACS Omega 2023, 8, 22108–22120. [Google Scholar] [CrossRef]
  29. Wang, X.; Hu, D.; Wang, K.; Xu, W.; Wei, W.; Sun, N. Ni-MgO-ZrO2 Dual-Functional Materials for Integrated CO2 Capture and Conversion: Effect of Metal-Support Interactions. Sep. Purif. Technol. 2025, 377, 134466. [Google Scholar] [CrossRef]
  30. Huang, L.; Li, D.; Tian, D.; Jiang, L.; Li, Z.; Wang, H.; Li, K. Optimization of Ni-Based Catalysts for Dry Reforming of Methane via Alloy Design: A Review. Energy Fuels 2022, 36, 5102–5151. [Google Scholar] [CrossRef]
  31. Cao, Z.; Zhang, X.; Xu, C.; Duan, A.; Guo, R.; Zhao, Z.; Wu, Z.; Peng, C.; Li, J.; Wang, X.; et al. The Synthesis of Al-SBA-16 Materials with a Novel Method and Their Catalytic Application on Hydrogenation for FCC Diesel. Energy Fuels 2016, 31, 805–814. [Google Scholar] [CrossRef]
  32. Aminzadeh, A.; Sarikhani-fard, H. Raman Spectroscopic Study of Ni/Al2O3 Catalyst. Spectrochim. Acta Part A Mol. Biomol. Spectrosc. 1999, 55, 1421–1425. [Google Scholar] [CrossRef]
  33. Marshall, C.P.; Edwards, H.G.M.; Jehlicka, J. Understanding the Application of Raman Spectroscopy to the Detection of Traces of Life. Astrobiology 2010, 10, 229–243. [Google Scholar] [CrossRef] [PubMed]
  34. Artini, C.; Pani, M.; Carnasciali, M.M.; Buscaglia, M.T.; Plaisier, J.R.; Costa, G.A. Structural Features of Sm- and Gd-Doped Ceria Studied by Synchrotron X-Ray Diffraction and μ-Raman Spectroscopy. Inorg. Chem. 2015, 54, 4126–4137. [Google Scholar] [CrossRef] [PubMed]
  35. Khani, Y.; Bahadoran, F.; Shariatinia, Z.; Varmazyari, M.; Safari, N. Synthesis of Highly Efficient and Stable Ni/CexZr1-XGdxO4 and Ni/X-Al2O3 (X = Ce, Zr, Gd, Ce-Zr-Gd) Nanocatalysts Applied in Methane Reforming Reactions. Ceram. Int. 2020, 46, 25122–25135. [Google Scholar] [CrossRef]
  36. Park, C.; Keane, M.A. Catalyst Support Effects in the Growth of Structured Carbon from the Decomposition of Ethylene over Nickel. J. Catal. 2004, 221, 386–399. [Google Scholar] [CrossRef]
  37. Li, Y.; Zhang, B.; Xie, X.; Liu, J.; Xu, Y.; Shen, W. Novel Ni Catalysts for Methane Decomposition to Hydrogen and Carbon Nanofibers. J. Catal. 2006, 238, 412–424. [Google Scholar] [CrossRef]
  38. Das, S.; Sengupta, M.; Bag, A.; Saini, A.; Muhler, M.; Bordoloi, A. Gd–Ru Nanoparticles Supported on Zr0.5Ce0.5O2 Nanorods for Dry Methane Reforming. ACS Appl. Nano Mater. 2021, 4, 2547–2557. [Google Scholar] [CrossRef]
  39. Alreshaidan, S.B.; Al-Fatesh, A.; Lanre, M.S.; Alanazi, Y.M.; Ibrahim, A.A.; Fakeeha, A.H.; Albaqi, F.; Anojaidi, K.; Bagabas, A. Effect of Adding Gadolinium Oxide Promoter on Nickel Catalyst over Yttrium-Zirconium Oxide Support for Dry Reforming of Methane. Materials 2023, 16, 1158. [Google Scholar] [CrossRef]
  40. Al-Fatesh, A.S. Promotional Effect of Gd over Ni/Y2O3 Catalyst Used in Dry Reforming of CH4 for H2 Production. Int. J. Hydrogen Energy 2017, 42, 18805–18816. [Google Scholar] [CrossRef]
  41. Al-Fatesh, A.S.; Atia, H.; Ibrahim, A.A.; Fakeeha, A.H.; Singh, S.K.; Labhsetwar, N.K.; Shaikh, H.; Qasim, S.O. CO2 Reforming of CH4: Effect of Gd as Promoter for Ni Supported over MCM-41 as Catalyst. Renew. Energy 2019, 140, 658–667. [Google Scholar] [CrossRef]
  42. Fakeeha, A.H.; Bagabas, A.A.; Lanre, M.S.; Osman, A.I.; Kasim, S.O.; Ibrahim, A.A.; Arasheed, R.; Alkhalifa, A.; Elnour, A.Y.; Abasaeed, A.E.; et al. Catalytic Performance of Metal Oxides Promoted Nickel Catalysts Supported on Mesoporous γ-Alumina in Dry Reforming of Methane. Processes 2020, 8, 522. [Google Scholar] [CrossRef]
  43. Pájaro, K.C.; de Antonio, R.; Martínez-Arias, A.; Cortés Corberán, V. Catalytic Performance and Regenerability of Ni/CeZrSmOx Catalysts for Dry Reforming of Methane. J. CO2 Util. 2025, 98, 103146. [Google Scholar] [CrossRef]
  44. Zhang, G.; Wang, Y.; Li, X.; Bai, Y.; Zheng, L.; Wu, L.; Han, X. Effect of Gd Promoter on the Structure and Catalytic Performance of Mesoporous Ni/Al2O3–CeO2 in Dry Reforming of Methane. Ind. Eng. Chem. Res. 2018, 57, 17076–17085. [Google Scholar] [CrossRef]
  45. Guo, J.; Gao, J.; Chen, B.; Hou, Z.; Fei, J.; Lou, H.; Zheng, X. Catalytic Conversion of CH4 and CO2 to Synthesis Gas on Ni/SiO2 Catalysts Containing Gd2O3 Promoter. Int. J. Hydrogen Energy 2009, 34, 8905–8911. [Google Scholar] [CrossRef]
  46. Nisa, K.S.; Suendo, V.; Sophiana, I.C.; Susanto, H.; Kusumaatmaja, A.; Nishiyama, N.; Budhi, Y.W. Effect of Base Promoter on Activity of MCM-41-Supported Nickel Catalyst for Hydrogen Production via Dry Reforming of Methane. Int. J. Hydrogen Energy 2022, 47, 23201–23212. [Google Scholar] [CrossRef]
  47. Nainggolan, E.A.; Banout, J.; Urbanova, K. Application of Central Composite Design and Superimposition Approach for Optimization of Drying Parameters of Pretreated Cassava Flour. Foods 2023, 12, 2101. [Google Scholar] [CrossRef]
  48. Njoku, C.N.; Otisi, S.K. Application of Central Composite Design with Design Expert V13 in Process Optimization. In Response Surface Methodology: Recent Advances and Applications; Springer: Singapore, 2023. [Google Scholar]
  49. Beg, S.; Swain, S.; Rahman, M.; Hasnain, M.S.; Imam, S.S. Application of Design of Experiments (DoE) in Pharmaceutical Product and Process Optimization. In Pharmaceutical Quality by Design: Principles and Applications; Academic Press: Cambridge, MA, USA, 2019; pp. 43–64. [Google Scholar]
  50. Serrano-Lotina, A.; Daza, L. Influence of the Operating Parameters over Dry Reforming of Methane to Syngas. Int. J. Hydrogen Energy 2014, 39, 4089–4094. [Google Scholar] [CrossRef]
Figure 1. XRD scan for fresh catalysts.
Catalysts 15 00966 g001
Figure 2. (A) BET analysis of fresh catalysts to measure surface area, (B) BET analysis of fresh catalysts to measure pore size.
Catalysts 15 00966 g002
Figure 3. H2-temperature programmed reduction profiles of fresh catalysts.
Catalysts 15 00966 g003
Figure 4. (A) Raman spectra analysis of fresh catalysts, (B) Raman spectra analysis of used catalysts.
Catalysts 15 00966 g004
Figure 5. NH3 TPD profiles of the fresh catalysts.
Catalysts 15 00966 g005
Figure 6. SEM images of the catalysts ((A) = 5Ni/SBA-16, (B) = 5Ni+0.5Gd/SBA-16, (C) = 5Ni+1Gd/SBA-16, (D) = 5Ni+2Gd/SBA-16, (E) = 5Ni+3Gd/SBA-16).
Catalysts 15 00966 g006
Figure 7. TEM images of samples before and after reaction ((A) = 5Ni/SBA-16 fresh, (B) = 5Ni/SBA-16 used, (C) = 5Ni+2Gd/SBA-16 fresh, (D) = 5Ni+2Gd/SBA-16 used).
Catalysts 15 00966 g007
Figure 8. TGA to determine the amount of carbon deposited.
Catalysts 15 00966 g008
Figure 9. (F1) CH4 conversion, (F2) CO2 conversion, and (F3) H2/CO ratio of 5Ni+xGd (x = 0, 0.5, 1, 2, 3)/SBA-16 catalysts [Reaction conditions: T = 800 °C, catalyst weight = 0.1 g, CH4/CO2/N2 = 3/3/1, GHSV = 42 L h−1 gcat−1.].
Catalysts 15 00966 g009
Figure 10. The relation between (a) CH4 conversion, space velocity (SV), and Temperature (T), at fixed methane to carbon dioxide ratio of 1; (b) CH4 conversion, methane to carbon dioxide ratio, and Temperature (T) at fixed SV = 35,000 mL h−1 gcat−1.
Catalysts 15 00966 g010
Figure 11. The relation between (a) CO2 conversion, space velocity (SV), and Temperature (T), at fixed methane to carbon dioxide ratio of 1; (b) CO2 conversion, methane to carbon dioxide ratio, and Temperature (T) at fixed SV = 35,000 cc g−1 h−1.
Catalysts 15 00966 g011
Figure 12. The relation between (a) hydrogen/CO ratio, space velocity (SV), and Temperature (T), at fixed methane to carbon dioxide ratio of 1; (b) hydrogen to CO ratio, methane to carbon dioxide ratio, and Temperature (T) at fixed SV = 35,000 mL h−1 gcat−1.
Catalysts 15 00966 g012
Table 1. NiO crystallite size using Scherrer equation for fresh catalysts.
0%Gd0.5%Gd1%Gd2%Gd3%Gd
37.2°9.7 nm6.7 nm6.7 nm6.5 nm6.5 nm
43.2°14 nm12.7 nm10.1 nm7 nm14.8 nm
62.8° 10 nm7.9 nm7.5 nm7 nm13.9 nm
Table 2. Surface area, diameter, volume, and pore size of fresh catalysts by BET.
CatalystBET Surface Area (m2/g)Pore Diameter (nm)Pore Volume (cm3/g)Pore Size (A°)
SBA-16549.250.30.764.7
5Ni/SBA-16493.548.80.7256.7
5Ni+0.5Gd/SBA-16508.448.80.7456.4
5Ni+1Gd/SBA-1650749.20.7356.5
5Ni+2Gd/SBA-16492.249.10.7257
5Ni+3Gd/SBA-16476.448.80.756.7
Table 3. Reduction temperature differences in the catalysts.
CatalystTemperature (°C)
5Ni/SBA-16445
5Ni+0.5Gd/SBA-16412
5Ni+1Gd/SBA-16409
5Ni+2Gd/SBA-16384
5Ni+3Gd/SBA-16456
Table 4. The intensity of the carbon spectral peaks of the catalysts was used.
Raman Shift
cm 1
Intensity (a.u)
5Ni/SBA-165Ni+2Gd/SBA-165Ni+3Gd/SBA-16
13442.11.71.7
15761.82.61.3
26802.62.52.5
Table 5. Comparison of this work with previous reports.
CatalystNi (wt%)GHSV (Lh−1gcat−1)Temperature (°C)CH4/CO2 Conv. (%)Ref.
4 wt%Gd+10%Ni/Y2O310870085/82[40]
3Gd5Ni/MCM-4153980071/74.5[41]
Ni/Ce-Zr-Gd-γAl2O31054 *70064/-[35]
5Ni+1Ga/Al529.970079/84.5[42]
5Ni+1Gd/Al529.970083/89[42]
5Ni+4Gd/YZr54280080/86[39]
NiGd1.0/SiO259 *70067.5/72.5[45]
Ni-K/MCM-4156070060/50[46]
Ni-Ca/MCM-4156070070/60[46]
Ni-Sm/CeO2-1.4470045/59[43]
1GdRuCeZr-2075050.6/53[38]
NiAlCe-1.2Gd2O3122780086/93[44]
5Ni+1Gd/SBA-1654280069.5/79This work
* GHSV in h−1.
Table 6. Actual and coded values for the process parameters.
ParametersLevels
−1 (Low)+1 (High)
SV: Gas Hourly Space velocity (ccg−1 h−1)22,00048,000
T: Temperature (°C)700850
CH4/CO2 ratio0.51.5
Table 7. Objectives of optimization and consequential optimum parameters.
VariablesGoals Function
TSVCH4:CO2CH4-Conv.CO2-Conv.H2/CO
Criteria700–85022,000–48,0000.5–1.5Max.Max.Max.
Theoretical conditions85022,000.1221.11889.24295.671.013
Excremental conditions85022,0001.1289.4296.191.01
Disclaimer/Publisher’s Note: The statements, opinions and data contained in all publications are solely those of the individual author(s) and contributor(s) and not of MDPI and/or the editor(s). MDPI and/or the editor(s) disclaim responsibility for any injury to people or property resulting from any ideas, methods, instructions or products referred to in the content.