Article

Hydrodeoxygenation of Bio-Oil over an Enhanced Interfacial Catalysis of Microemulsions Stabilized by Amphiphilic Solid Particles

1
State Key Laboratory of Coal Combustion, School of Energy and Power Engineering, Huazhong University of Science and Technology, Wuhan 430074, China
2
Department of New Energy Science and Engineering, School of Energy and Power Engineering, Huazhong University of Science and Technology, Wuhan 430074, China
3
China-EU Institute for Clean and Renewable Energy, Huazhong University of Science and Technology, Wuhan 430074, China
*
Author to whom correspondence should be addressed.
Catalysts 2023, 13(3), 573; https://doi.org/10.3390/catal13030573
Submission received: 13 February 2023 / Revised: 8 March 2023 / Accepted: 10 March 2023 / Published: 12 March 2023

Abstract

:
Bio-oil emulsions were stabilized using coconut shell coke, modified amphiphilic graphene oxide, and hydrophobic nano-fumed silica as solid emulsifiers. The effects of different particles on the stability of bio-oil emulsions were discussed. Over 21 days, the average droplet size of raw bio-oil increased by 64.78%, while that of bio-oil Pickering emulsion stabilized by three particles only changed within 20%. The bio-oil Pickering emulsion stabilized by Ni/SiO2 was then used for catalytic hydrodeoxygenation. It was found that the bio-oil undergoes polymerization during catalytic hydrogenation. For raw bio-oil hydrodeoxygenation, the polymerization reaction was little affected by the temperature below 200 °C, but when the temperature raised to 250 °C, it was greatly accelerated. However, the polymerization of monocyclic aromatic compounds in the reaction process was partially inhibited under the bio-oil Pickering emulsion system. Additionally, a GC-MS analysis was performed on raw bio-oil and hydrodeoxygenated bio-oil to compare the change in GC-MS-detectable components after hydrodeoxygenation at 200 °C. The results showed that the Pickering emulsion catalytic system greatly promoted the hydrodeoxygenation of phenolic compounds in bio-oil, with most monocyclic phenolic compounds detected by GC-MS converting to near 100%.

1. Introduction

Renewable energy sources are essential in the face of increasing energy demand and environmental concerns [1,2]. As a liquid product of the rapid pyrolysis process of biomass, bio-oil is a renewable liquid fuel which is expected to replace fossil fuels in the future [3,4]. However, due to the high content of oxygen, high acidity, high viscosity, low calorific value, and poor chemical stability, it needs to be upgraded for further use [5,6,7,8].
Hydrodeoxygenation is an effective way to improve the quality of bio-oil [9]. It can reduce the oxygen content in bio-oil, thereby lowering acidity, as well as improving calorific value and stability [10,11,12]. Low temperatures, however, often limit the efficiency of bio-oil hydrodeoxygenation. Only aldehydes, furans, alcohols, and other compounds with relatively simple chemical structures can be converted into hydrocarbons [13]. Bio-oil is rich in phenolic compounds [14], which contain stable oxygen-containing groups such as phenolic hydroxyl, so it often needs a high temperature and catalyst conditions for hydrodeoxygenation [15]. Nevertheless, high-temperature hydrodeoxygenation requires more energy, and coking occurs due to cross-linking between phenolic compounds [16]. As a result, the yield of oil is reduced greatly, and the coke adheres to the catalyst surface, leading to its deactivation [17,18]. In addition, bio-oil contains a large amount of water (15–30 wt.%) and water-soluble components, which is a complex water–oil two-phase system. The catalysts employed are either hydrophilic or hydrophobic, which cannot disperse uniformly in bio-oil. The diffusion restriction between the water and oil phase reduces the catalytic activity and selectivity of the catalyst [19]. In order to overcome these problems and achieve higher efficiency under relatively mild conditions, it is necessary to mix oil and water evenly before hydrodeoxygenation.
Emulsification is the common way to make the oil–water two-phase distribution uniform, which can increase the interface surface area and enhance molecular mass transfer between different phases [20]. However, the high cost of the surfactant, high energy consumption, and the inability to remove unfavorable chemical substances of bio-oil limit its large-scale application for hydrodeoxygenation [21]. It is reported that solid particles with both hydrophilicity and lipophilicity can be used to stabilize water–oil emulsion, which is called Pickering emulsion [22]. Interface catalysis can be achieved by supporting catalysts on the surface of solid particles. It has attracted extensive attention due to its high catalytic efficiency and selectivity in the last few years [23]. A number of studies have been conducted on the model compound of bio-oil Pickering emulsion catalytic hydrodeoxygenation. Zhu et al. studied the hydrodeoxygenation of vanillin as a bio-oil model in the water phase and Pickering emulsions and investigated the effects of the wettability of the solid particles on the performances of water-phase-involved HDO of vanillin [24]. Yang et al. discussed the effect of catalyst supports, solvents, bi-solvents, and reaction temperature on the catalytic activity and selectivity of the supported Au catalysts for the hydrodeoxygenation of vanillin [19]. Yang et al. prepared an amphipathic Pd/MCSA-24 catalyst which showed the highest conversion of bio-oil model compound phenol (98.0%) and highest selectivity for cyclohexane (87.7%) at 200 °C [25]. Nevertheless, there are so many components in bio-oil, and the interaction between these components in the process of hydrodeoxygenation is extremely complex. There have been limited studies on all components of bio-oil hydrodeoxygenation under a Pickering emulsion system. Thus, there is an urgent need for deep insight into Pickering emulsion catalytic hydrodeoxygenation of bio-oil.
In this paper, coconut coke, cetyltrimethylammonium-bromide-modified graphene oxide (CTAB-GO), and hydrophobic nano-fumed silica were prepared as solid emulsifiers to stabilize bio-oil emulsion. The effects of different particles on the stability of bio-oil emulsions were studied. Then, the hydrophobic nano-fumed silica impregnated with Ni was used as solid emulsifier to stabilize the bio-oil emulsion. The emulsified bio-oil was put into a high-pressure reactor for hydrodeoxygenation at different temperatures. The effect of temperature on bio-oil hydrodeoxygenation was studied, and the difference in hydrodeoxygenation between the Pickering emulsion system and raw bio-oil was compared. The promotion effect of the Pickering emulsion system on bio-oil hydrodeoxygenation was evaluated.

2. Results and Discussion

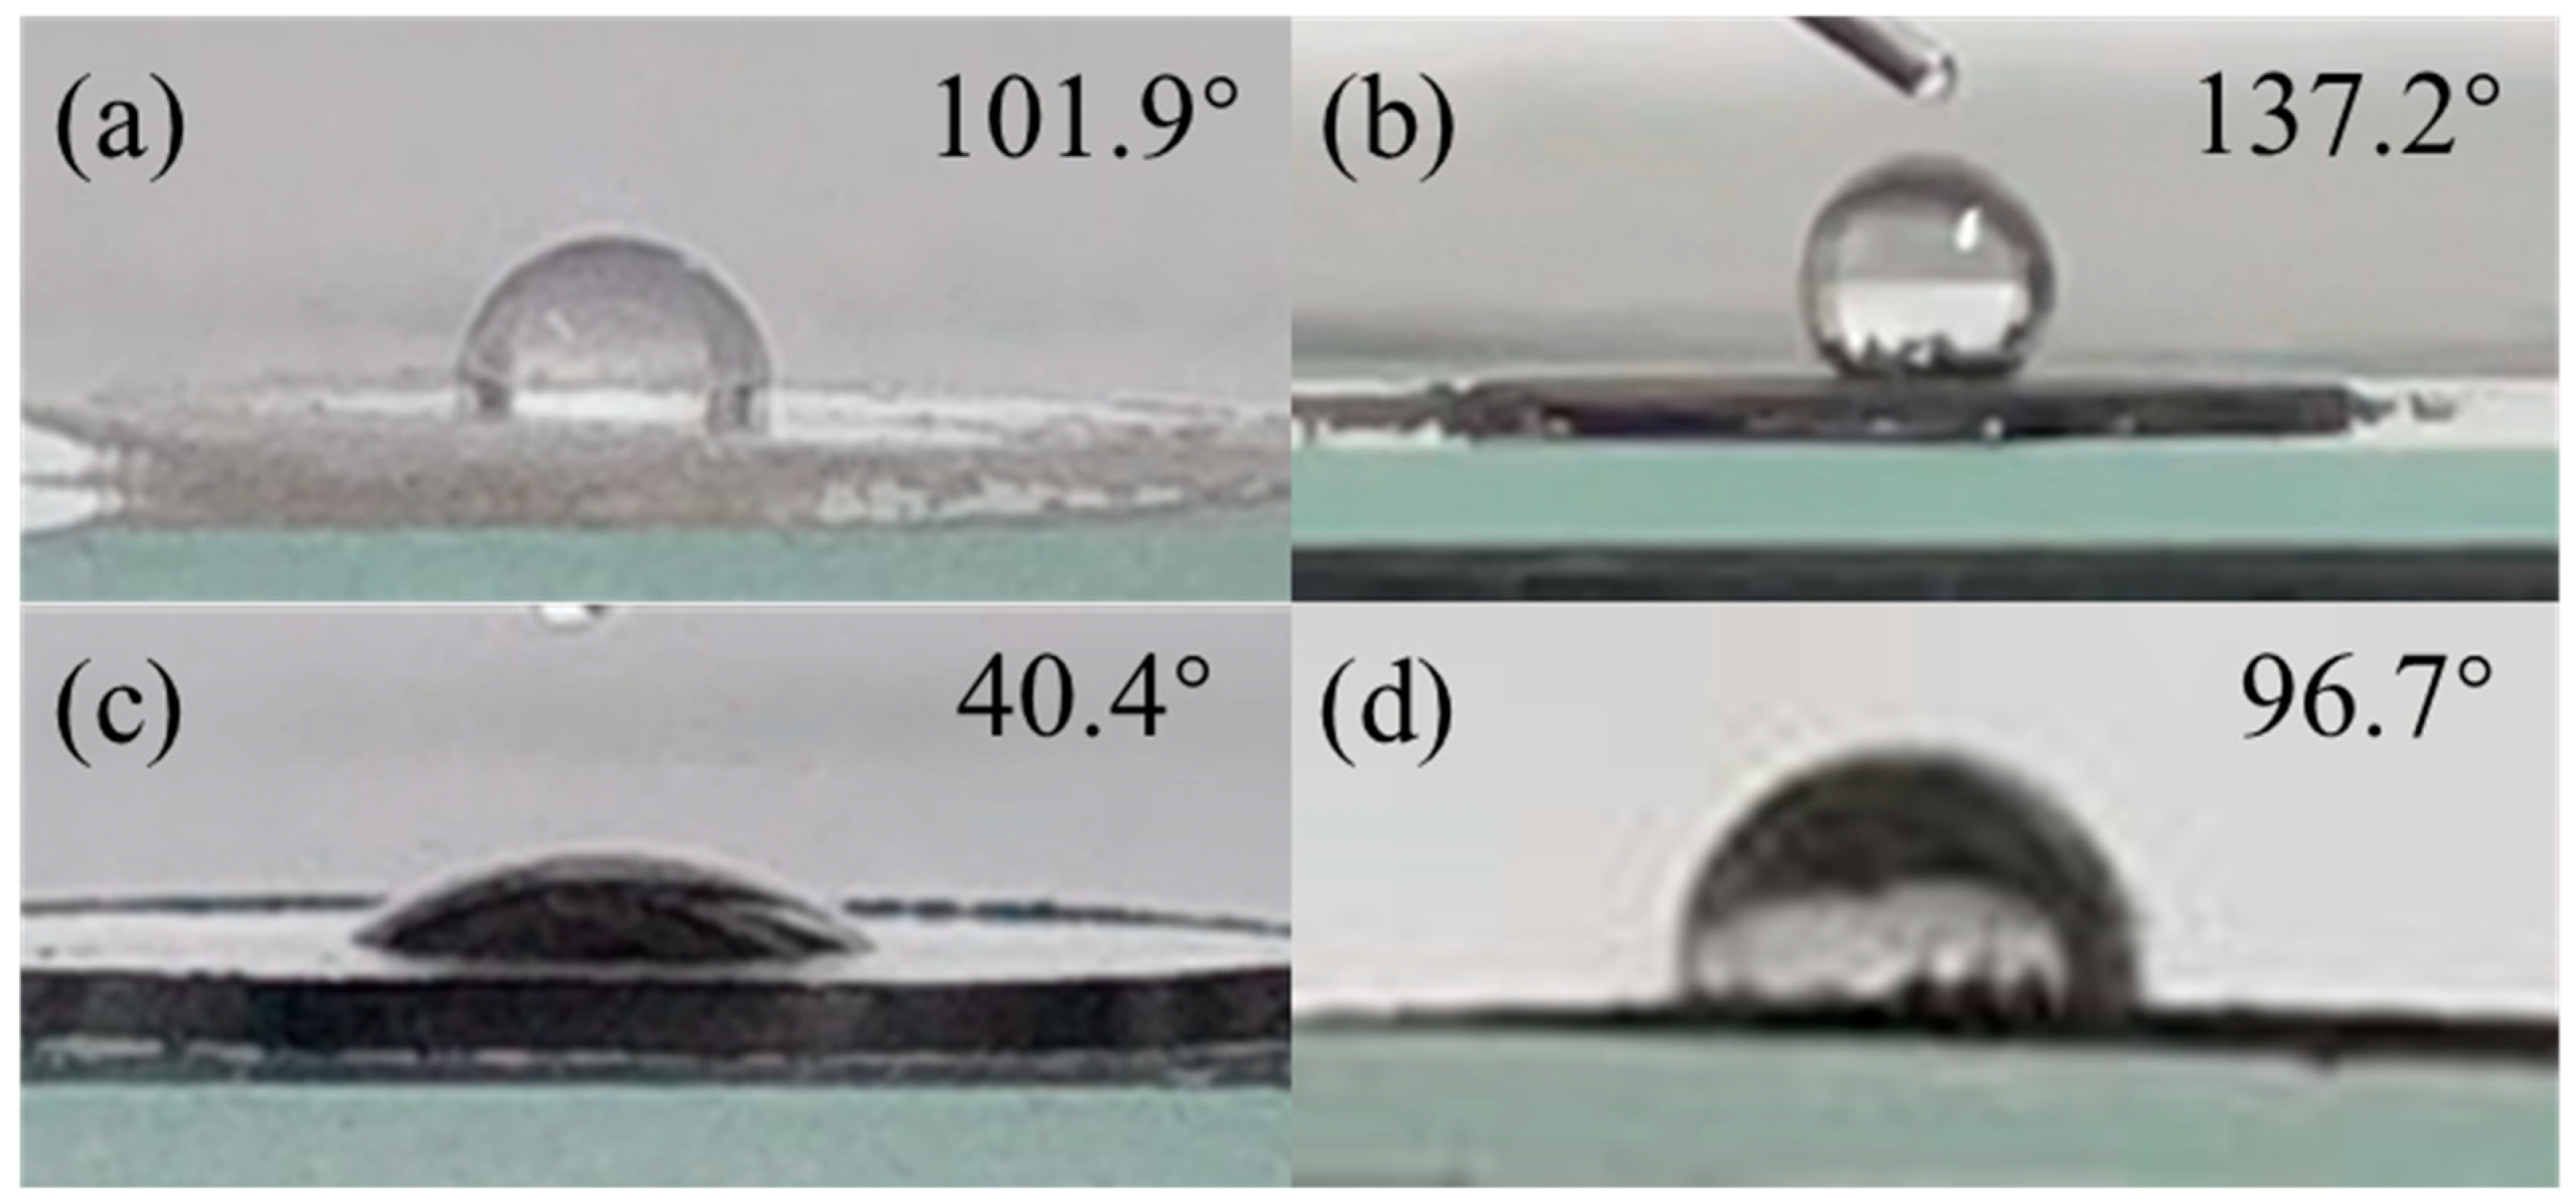
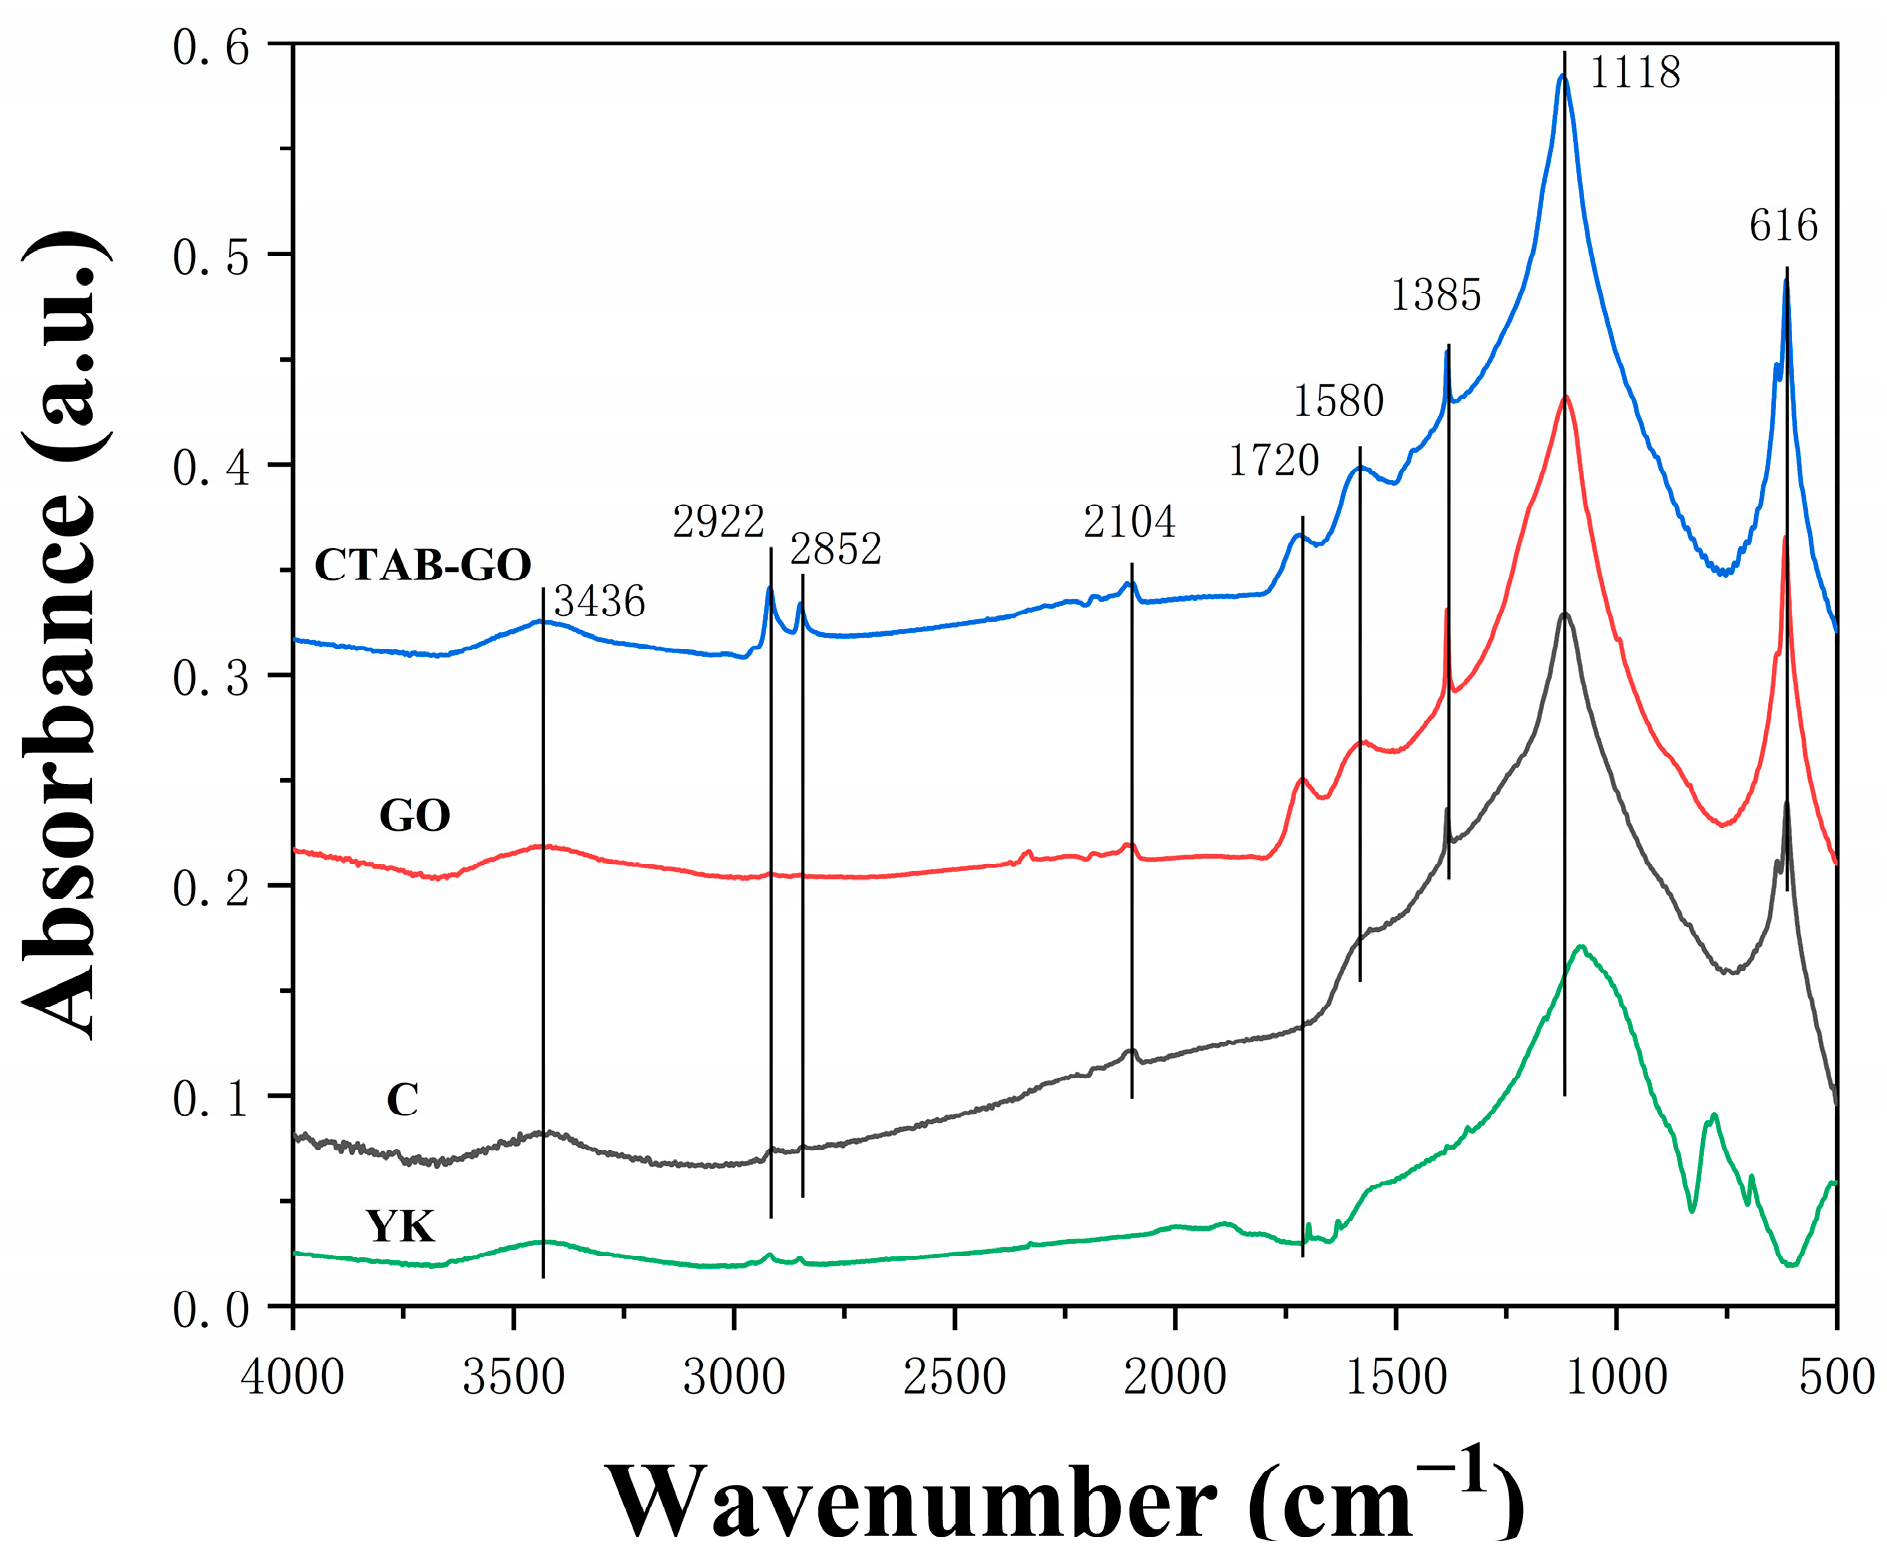
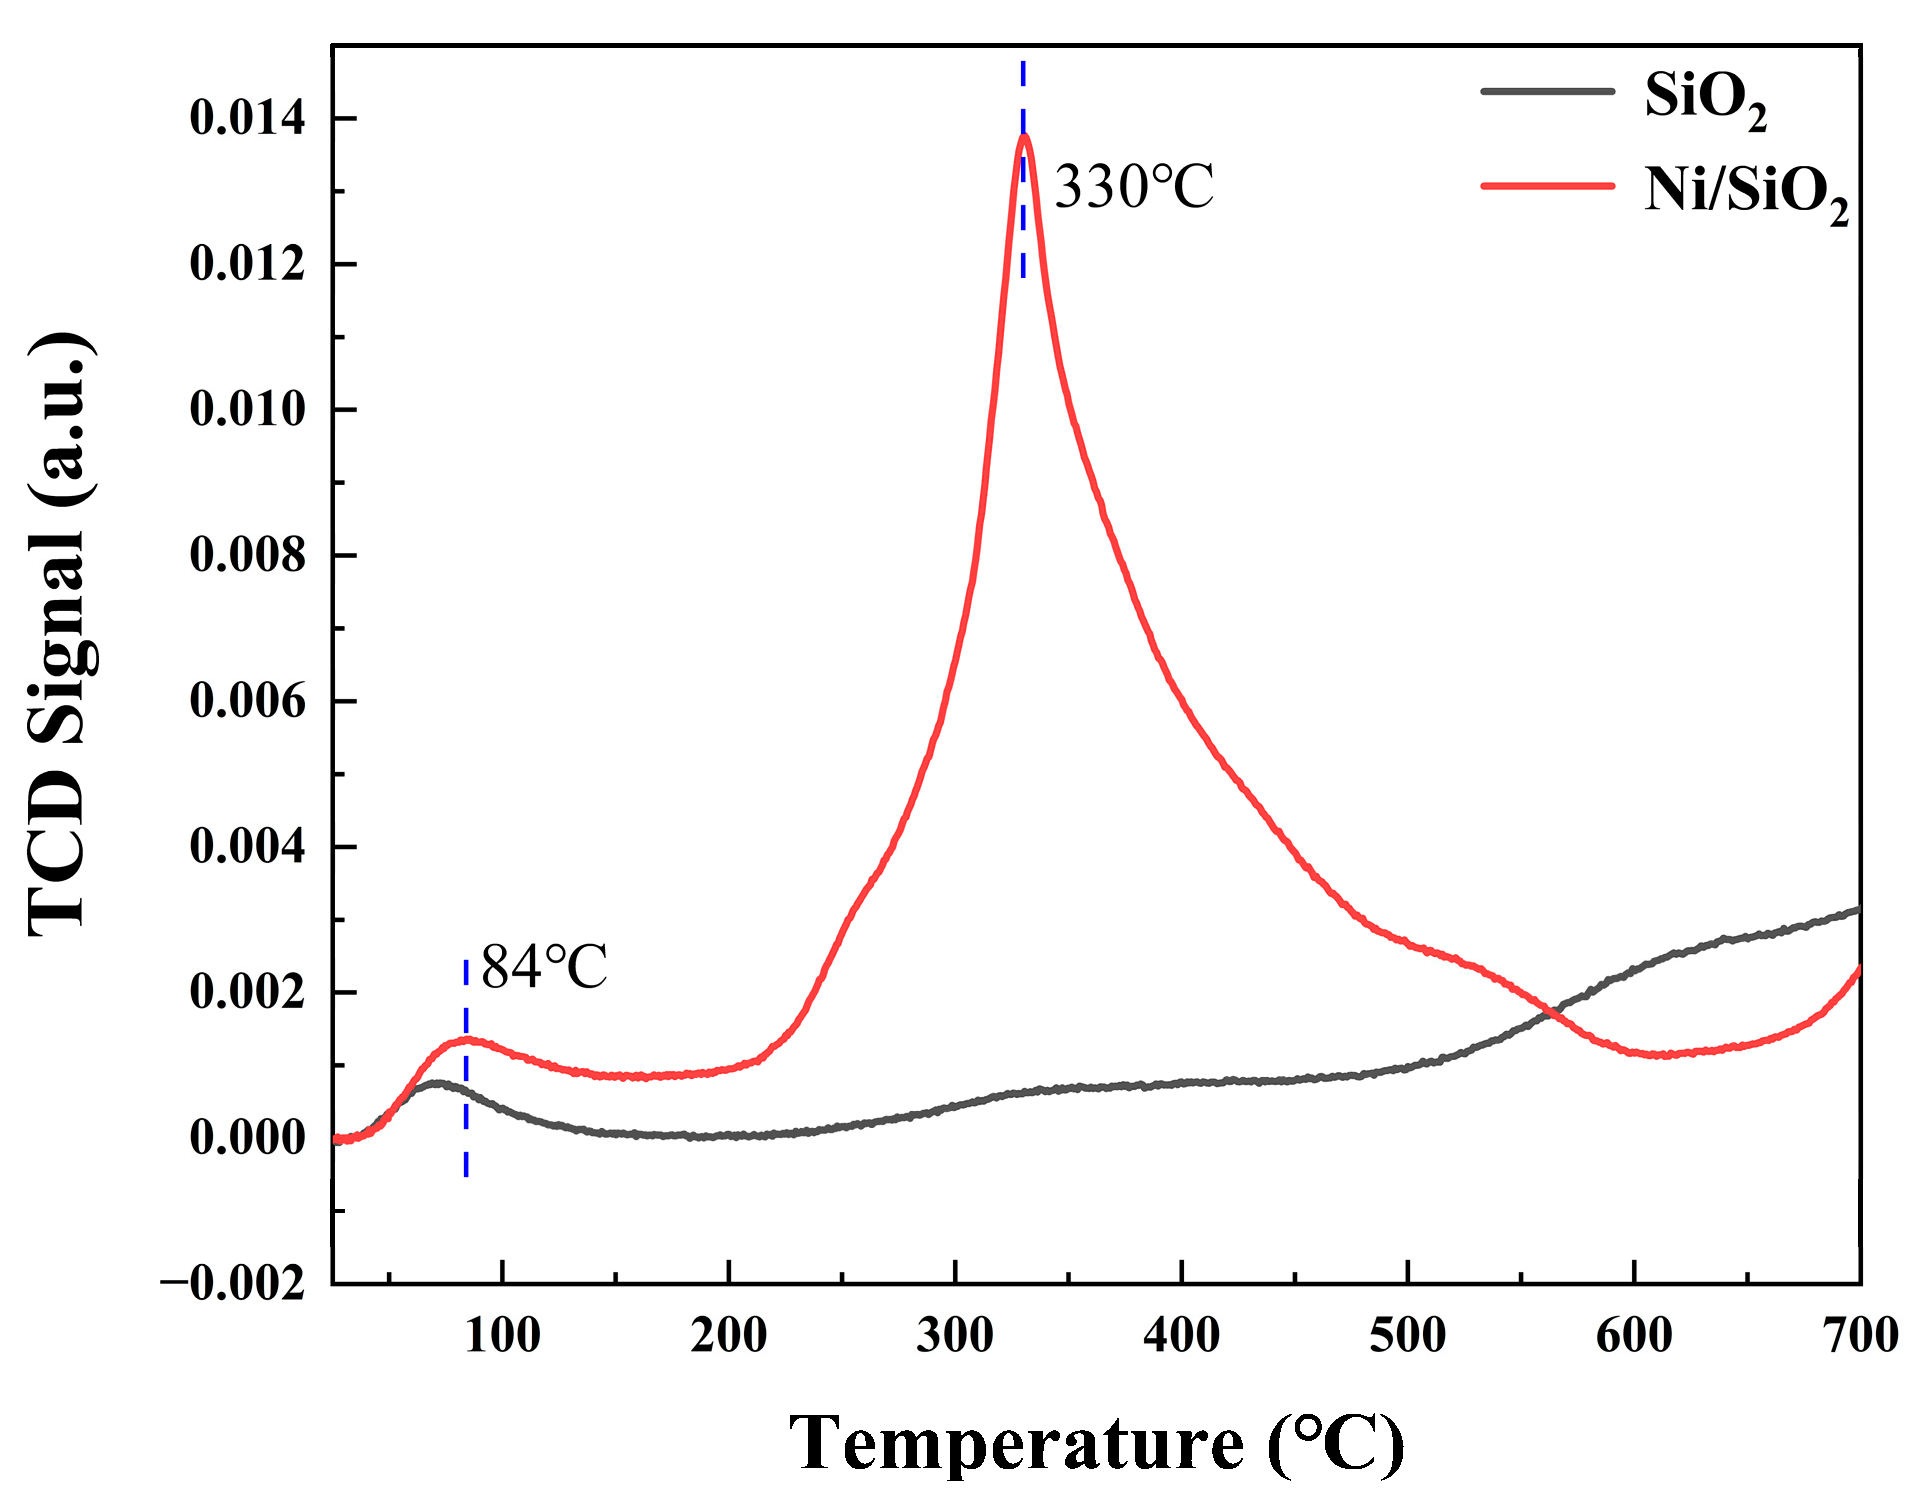
2.1. Characteristics of Solid Particles and Catalyst

The contact angle is an important index for measuring the hydrophilicity and lipophilicity of solid particles. Since this experimental material was a solid powder, the contact angle was measured by pressing the powder into a sheet (pressure of 20 kPa) and measuring it on the plane. Figure 1 shows the contact angles of the four solid particles; it can be seen that the contact angle of graphene oxide before modification was 40.4° and much less than 90°, which indicates that it is more hydrophilic, and the stability of the formed emulsion is relatively poor, and it should be hydrophobically modified to make its contact angle close to 90°. The contact angles of the hydrophobic nano-fumed silica, coconut shell coke, and CTAB-modified graphene oxide were all bigger than 90°, indicating their stronger lipophilicity. Additionally, the contact angles of the hydrophobic nano-fumed silica and CTAB-modified graphene oxide were close to 90°, indicating their better amphiphilicity and better stability of the formed emulsions. As is known from Section 3, the oil phase content in bio-oil is larger than the water phase content, so solid particles with a contact angle slightly bigger than 90° are preferred in the preparation of bio-oil Pickering emulsion.
Figure 2 shows the results of graphite powder, graphene oxide, CTAB-modified graphene oxide, and coconut shell coke surface functional groups obtained by Fourier-transform infrared absorption spectroscopy (FT-IR). It can be seen that the peaks shared by graphite powder, graphene oxide, and CTAB-modified graphene oxide included 3436 (free -OH), 2104 (carbon–carbon triple bond), 1385 (CH (in plane)), 1118 (carbon–carbon single bond), and 616 (CH (out of plane)). Compared to graphite powder, 1720 (carbon–oxygen double bond) appeared in the oxidized graphene, indicating the appearance of hydrophilic groups on the surface of the oxidized graphene. After CTAB modification, the graphene oxide surface showed 2922 (CH2 (methylene)), 2852 (CH2 (methylene)) relative to graphene oxide before modification, indicating that it was loaded with CTAB. The FT-IR spectral results of coconut shell coke were similar to those of graphene oxide, with the difference that 788 (CH (aromatic)) appeared, leading to its greater hydrophobicity relative to graphene oxide.
The NH3-TPD results are presented in Figure 3. Compared with the original carrier of SiO2, the Ni/SiO2 catalyst had a new absorption peak at 330 °C, indicating the presence of strong acid sites. Additionally, the intensity of weak acid site peaks increased at 84 °C, showing that some new weak acid sites had been created. According to Rekha’s research, there is a correlation between acidic sites and catalyst activity and selectivity [26]. A Ni catalyst was proven to promote the hydrodeoxygenation of phenols and other oxygenated compounds in bio-oil [27].
The H2-TPR results are presented in Table 1. The reduction peaks could be classified into two parts, one at low temperature (about 285 °C and 325 °C) and another at a relatively high temperature (about 500 °C). The reduction peaks at relatively low temperature might be ascribed to the reduction of superficial metal oxide that had no or very weak interaction with SiO2 support; and the reduction peak at the relatively high temperature can be ascribed to the reduction of metal oxide, which was highly dispersed with smaller size and strongly interacted with the support [28]. According to the temperature of the NH3 desorption peak, the acid sites could be divided into three kinds: weak acid (150–250 °C), medium acid (250–420 °C), and strong acid (420–750 °C) strength. As can be seen from Figure 3, the Ni/SiO2 catalyst exhibited a broad NH3 desorption peak at 330 °C, suggesting the presence of medium acid sites in the Ni/SiO2 catalyst. It was found that the proper intensity of weak acid sites was helpful for either the hydrogenation or hydrogenation-esterification reaction in an aqueous solution due to an improved conversion rate and product selectivity [29].

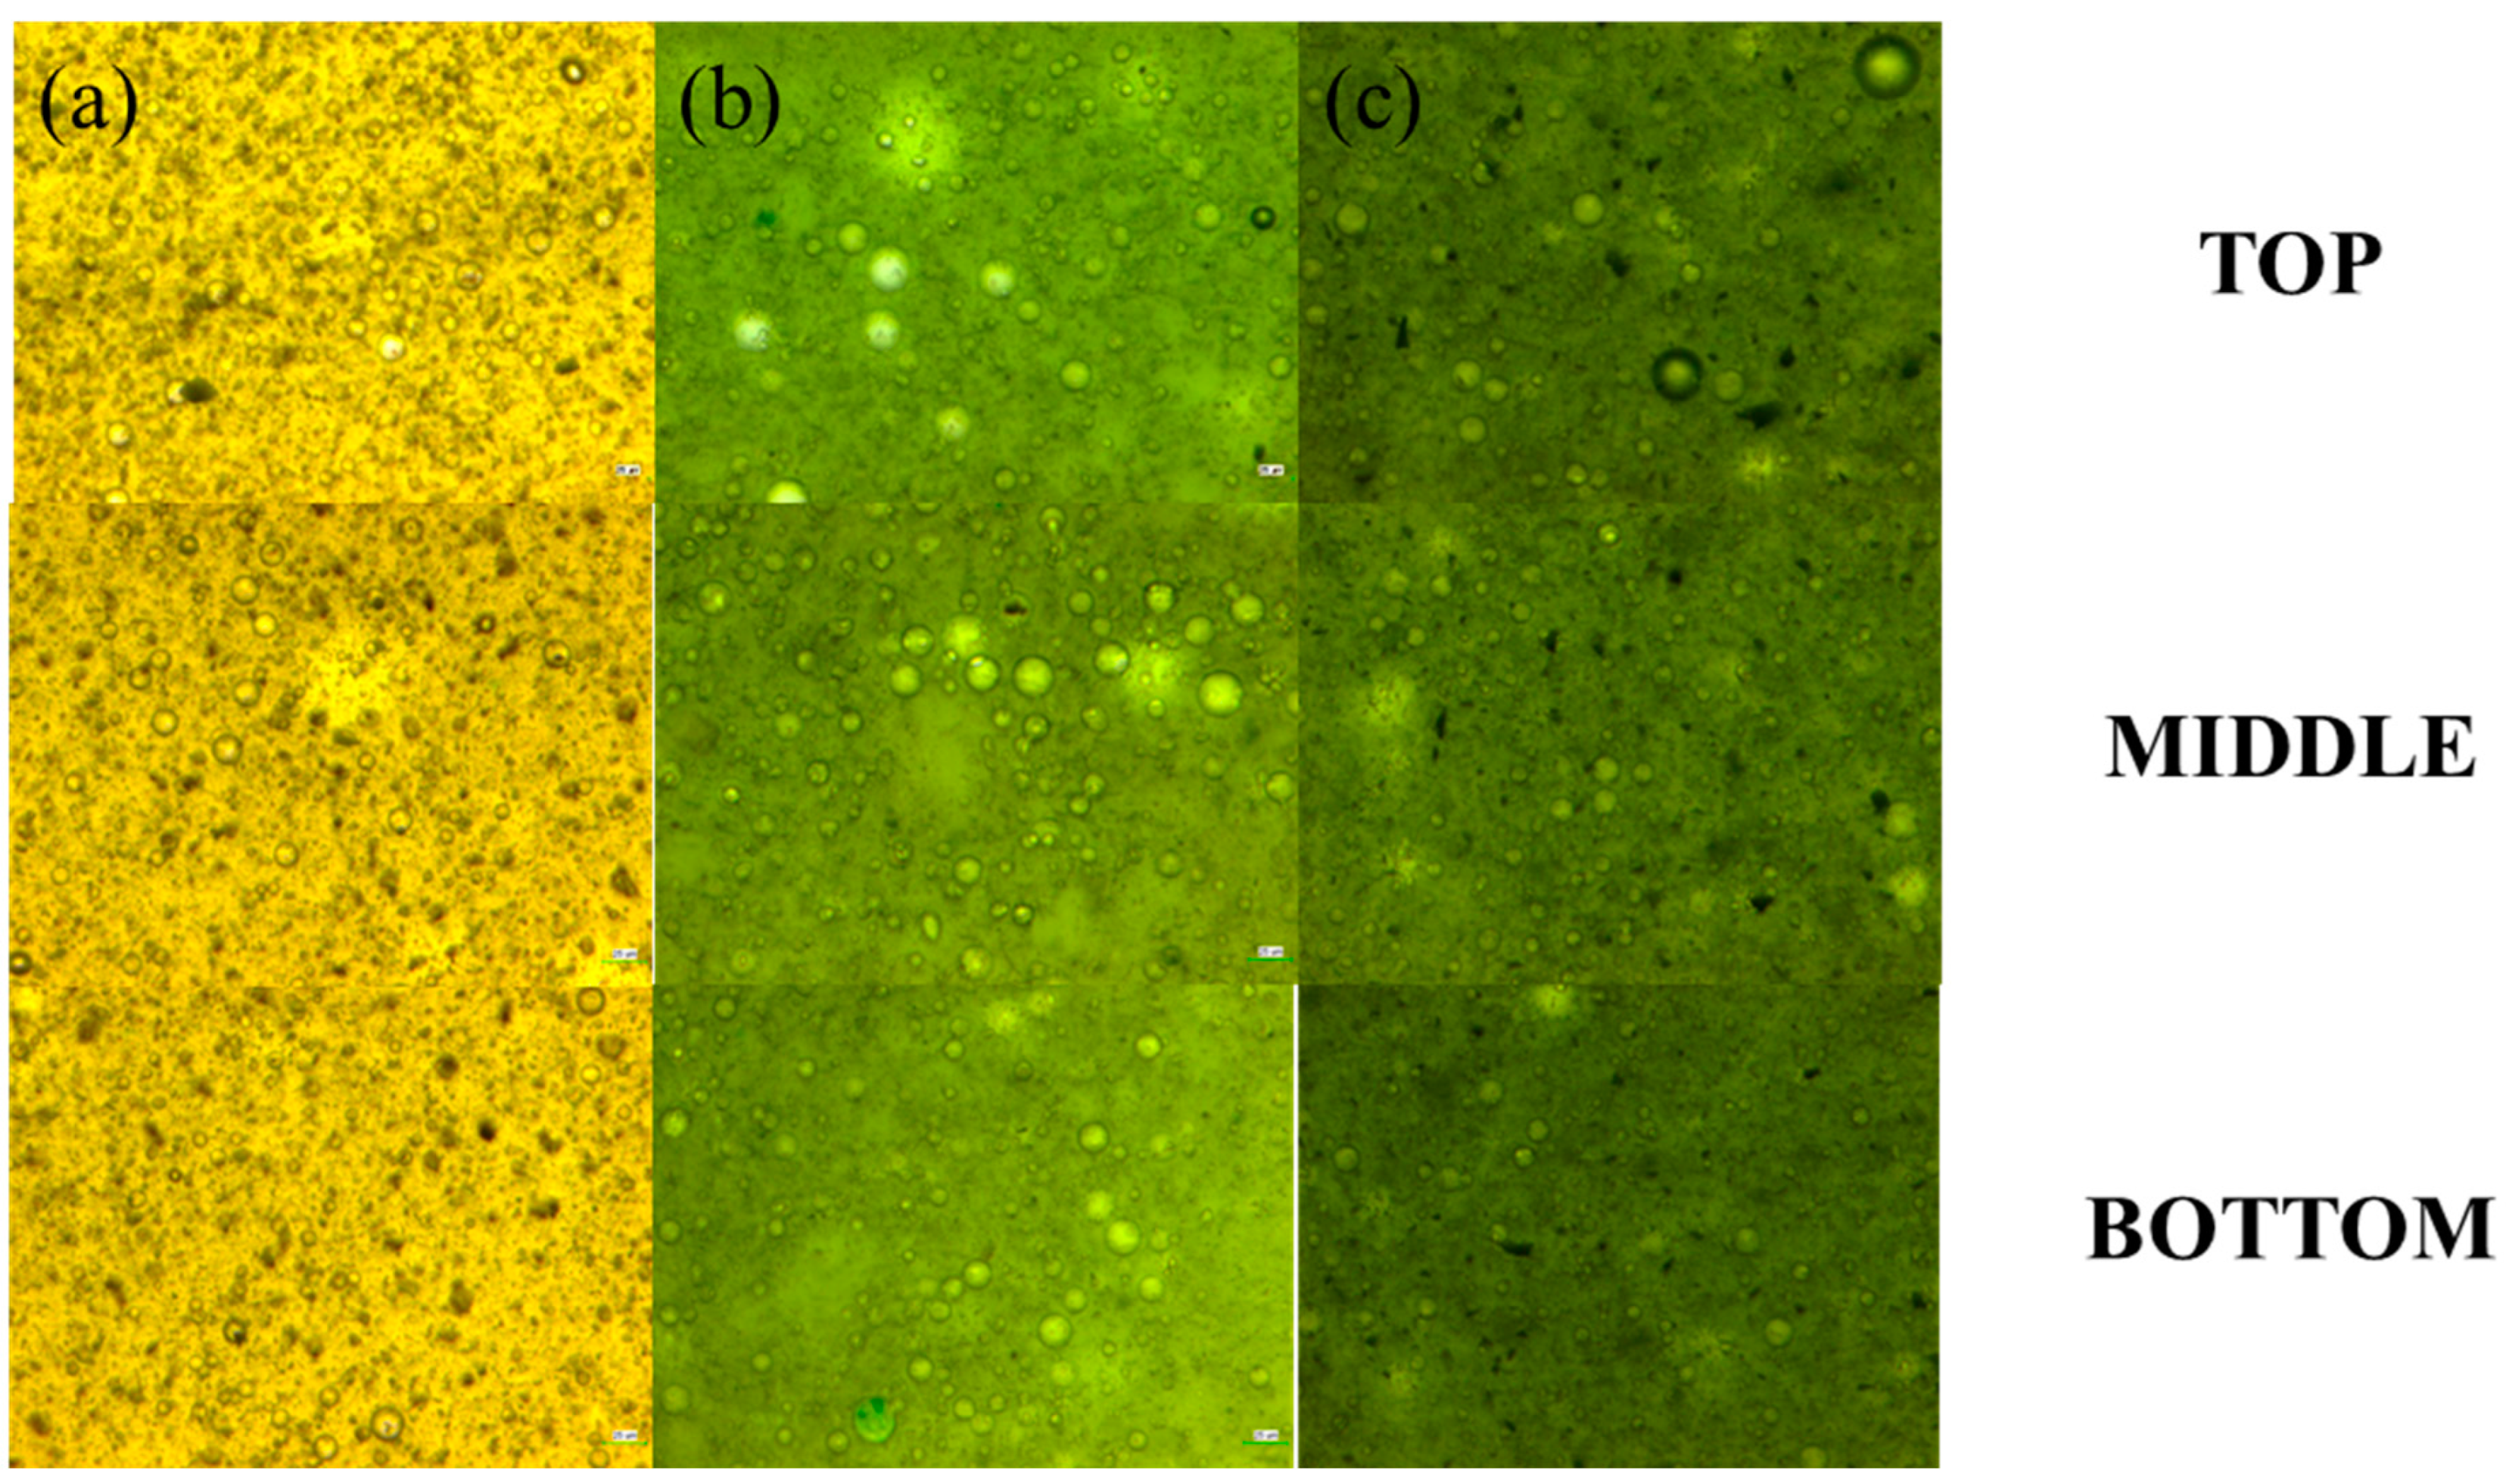
2.2. Stability of Bio-Oil Pickering Emulsion

To verify that the randomness and subjectivity of droplet sampling did not affect the experimental results, the drops from each of the top, middle, and bottom layers were randomly selected from the three bio-oil emulsions, and their emulsion droplet size distribution was observed. Figure 4 and Figure 5 show photographs of the Pickering emulsions stabilized by three solid particles by optical microscopy at 400× magnification and the results of particle size statistics. It can be seen that the droplet diameter distributions in the three drops of bio-oil differed relatively little, and it can be assumed that the random sampling is representative, and the statistical results of particle size distributions in the subsequent experiments were obtained by randomly sampling nine drops and observing them.
Figure 6 shows the droplet size distributions of three solid particle-stabilized bio-oil Pickering emulsions and blank bio-oil emulsions on the first, fifth, and twenty-first days of emulsification, respectively, where the blank bio-oil was the emulsified bio-oil without the addition of solid particles under the same sonication conditions. Figure 6 shows that the droplet size distribution of all four emulsions was more concentrated when they were emulsified, and the droplet size distribution of CTAB-GO- and coconut-coke-stabilized Pickering emulsion was more similar and smaller than the average droplet size of SiO2 and blank bio-oil emulsion. The average droplet size of all four emulsions showed a tendency to become larger as the resting time became longer. The droplet size variation of coconut-shell-coke- and SiO2-stabilized bio-oil Pickering emulsions was relatively small, indicating that these two solid particle-stabilized bio-oil Pickering emulsions were more stable than CTAB-GO-stabilized bio-oil Pickering emulsions. The average droplet size of three amphiphilic solid-particle emulsified bio-oil Pickering emulsion had a smaller change after 21 days, only within 20%, which was far lower than the 64.78% of raw bio-oil. This was due to the presence of both hydrophilic and lipophilic groups on the surface of these three solid particles. Additionally, the groups could wrap around the surface of the emulsified droplets, thus, preventing inter-droplet coagulation and maintaining the uniform dispersion of the emulsified droplets in the oil equivalent.

2.3. Hydrodeoxygenation of Bio-Oil

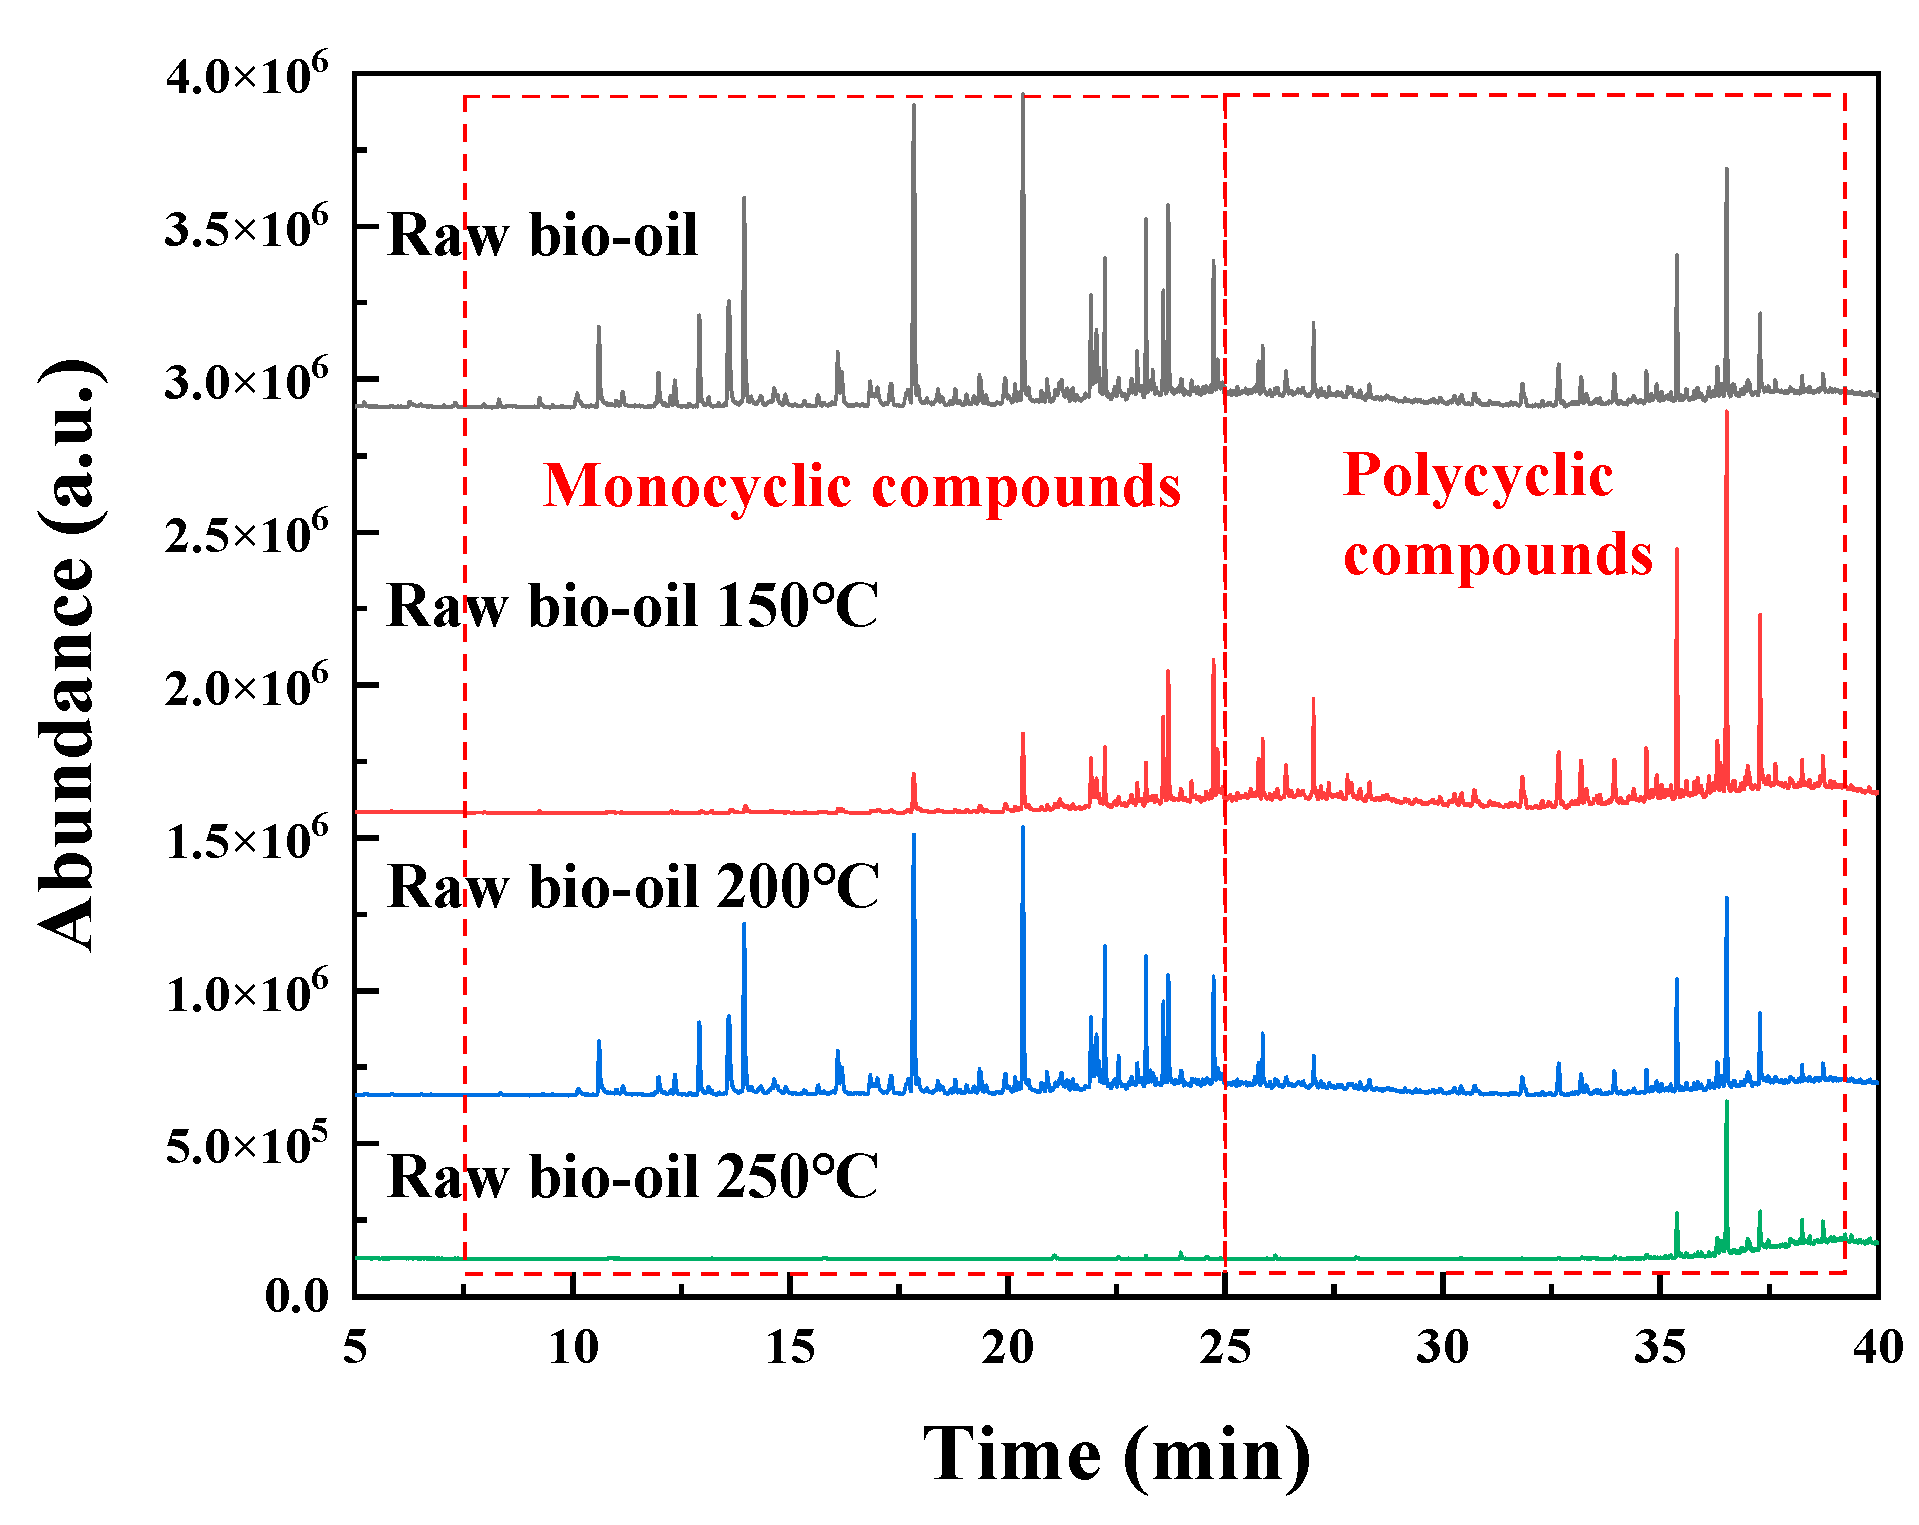
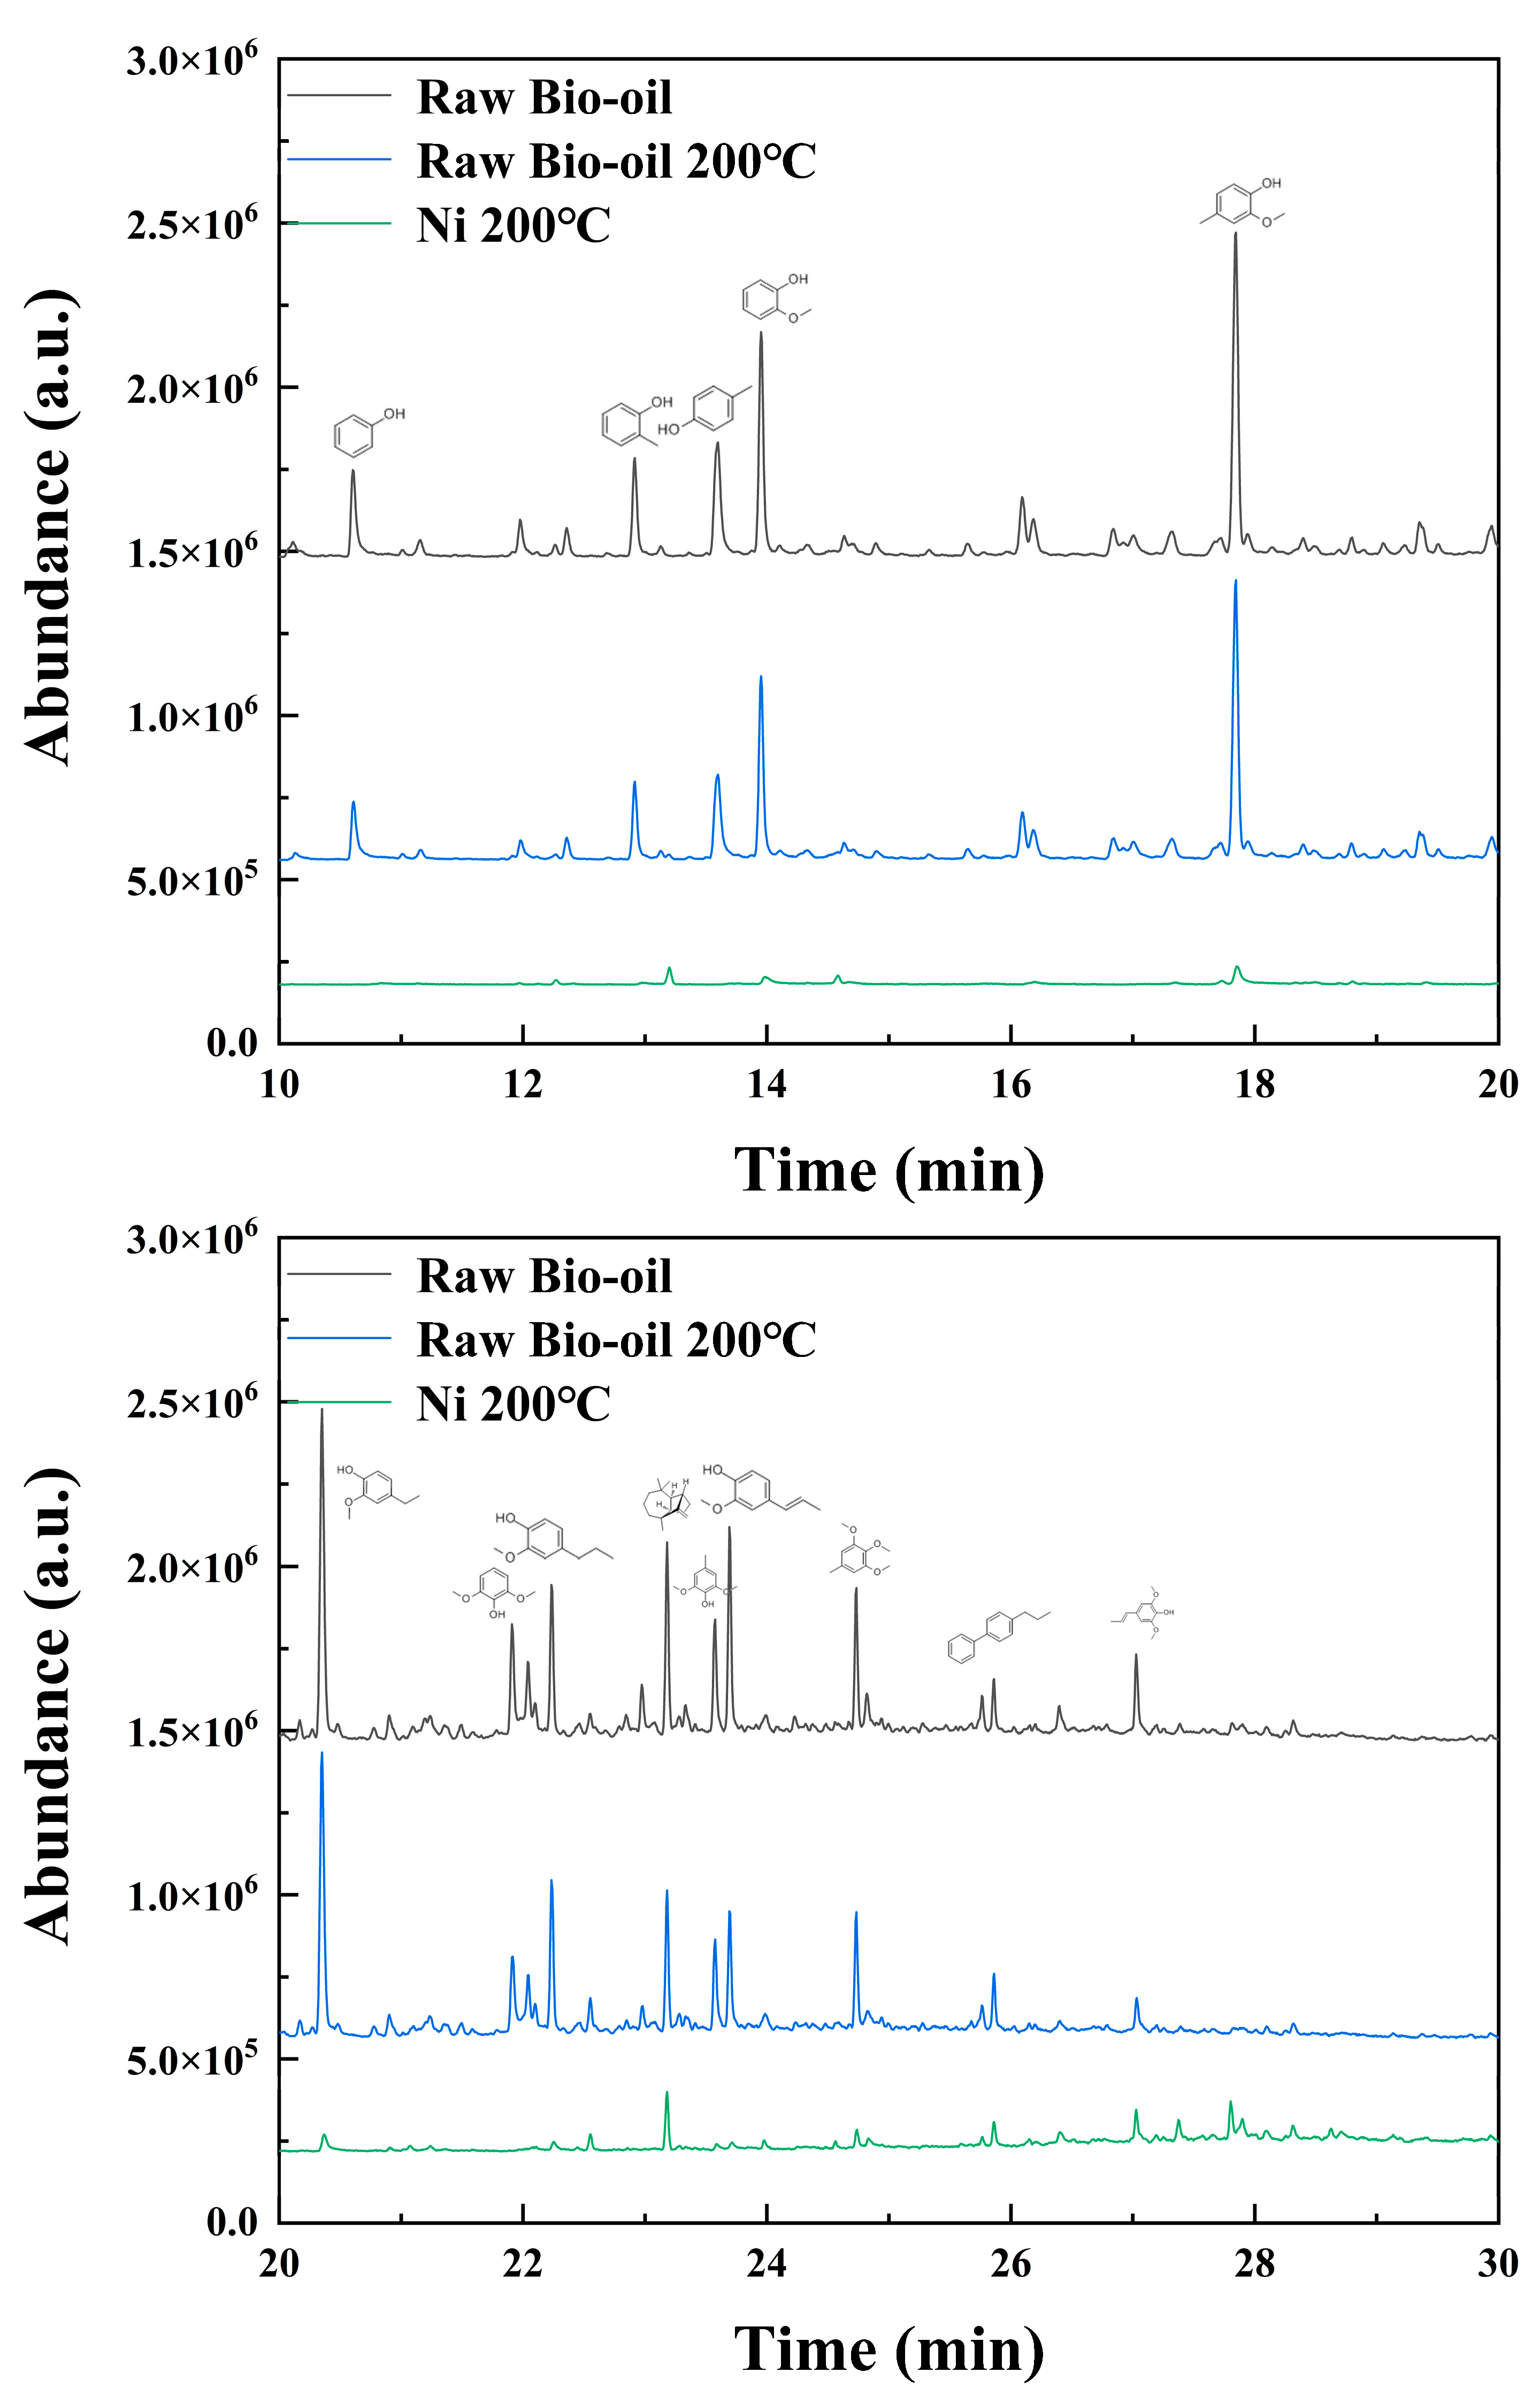
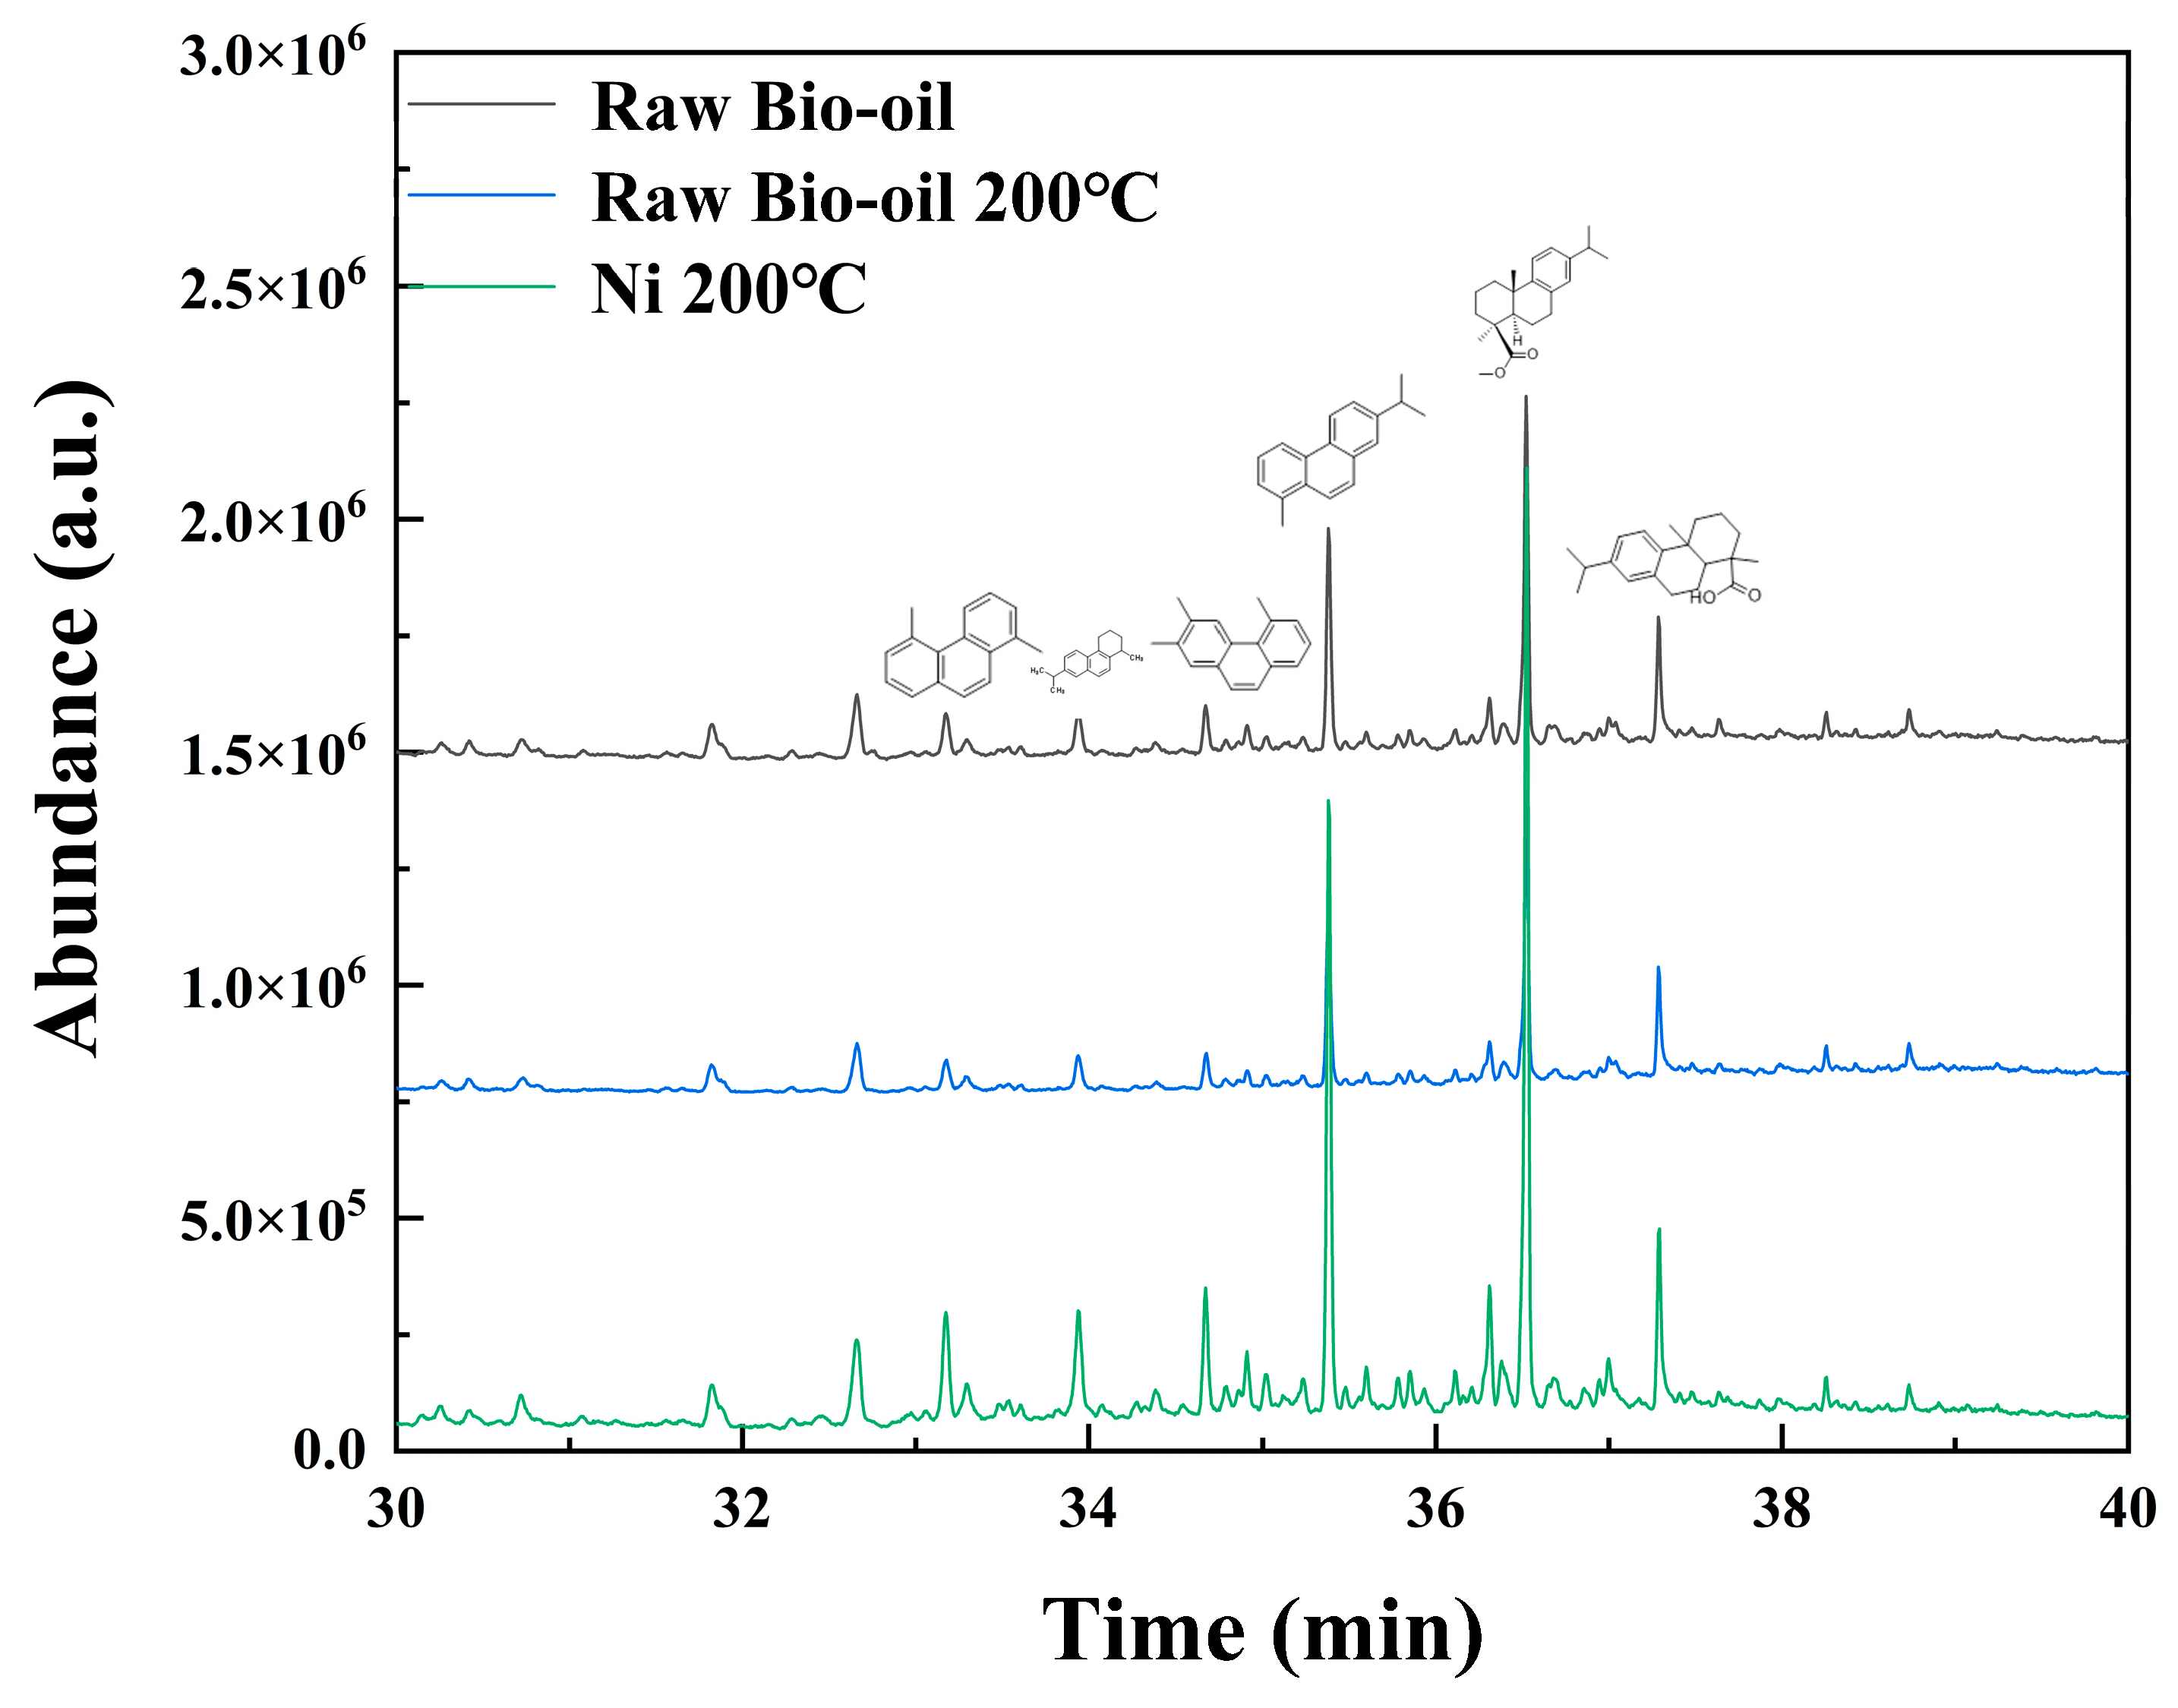
2.3.1. Hydrodeoxygenation of Raw Bio-Oil

The UV fluorescence spectra results of raw bio-oil hydrodeoxygenation products are shown in Figure 7. As can be seen from the figure, after hydrodeoxygenation of the bio-oil, the monocyclic aromatic hydrocarbon content decreased, and the polycyclic aromatic hydrocarbon content with two or more rings increased. During hydrodeoxygenation, the polymerization of monocyclic compounds occurred, resulting in the formation of two or more rings of polycyclic aromatic hydrocarbons. There was little effect of temperature increase on the polymerization reaction from 150 °C to 200 °C. The monocyclic aromatic hydrocarbon content and polycyclic aromatic hydrocarbon content remained relatively unchanged. As the temperature was increased to 250 °C, the content of monocyclic aromatic hydrocarbons decreased further, while the content of polycyclic aromatic hydrocarbons with multiple rings increased slightly. Accordingly, the increase in temperature in the process of bio-oil hydrodeoxygenation accelerated the polymerization reaction between 200 °C and 250 °C.
Gel permeation chromatography (GPC) was applied to obtain the cumulative molecular weight distributions of raw bio-oil derived from hydrodeoxygenation under different temperatures, as displayed in Figure 8. It can be seen that the molecular weight of bio-oil after hydrodeoxygenation increased. With the temperature increase, the molecular weight of bio-oil hydrodeoxygenation products increased. The corresponding average molecular weight was 587 g/mol (raw bio-oil), 776 g/mol (raw bio-oil, 150 °C), 911 g/mol (raw bio-oil, 200 °C), and 1554 g/mol (raw bio-oil, 250 °C), respectively. A molecular weight of nearly three times that of the raw bio-oil was apparent when the temperature rose to 250 °C. This result was similar to the UV fluorescence spectra result, which also suggests that rising temperature promotes the polymerization reaction between compounds in the process of bio-oil hydrodeoxygenation.
GC-MS is mainly used to detect the light components in bio-oil. (The light components refer to water-soluble components, including small molecular ketones, aldehydes, phenols, acids, etc. The heavy components refer to water-insoluble components, such as polycyclic aromatic compounds [30]. The GC-MS results of raw bio-oil hydrodeoxygenation products are shown in Figure 9. As the figure illustrates, monocyclic compounds in the light components of bio-oil hydrodeoxygenation products decreased at 150 °C and 200 °C and almost disappeared at 250 °C. Nevertheless, at 150 °C and 200 °C, polycyclic aromatic compounds had little change, while, at 250 °C, polycyclic aromatic compounds decreased, which suggests that the temperature rise during bio-oil hydrodeoxygenation leads to the polymerization of light components and heavy components. This polymerization reaction was especially evident when the temperature reached 250 °C.

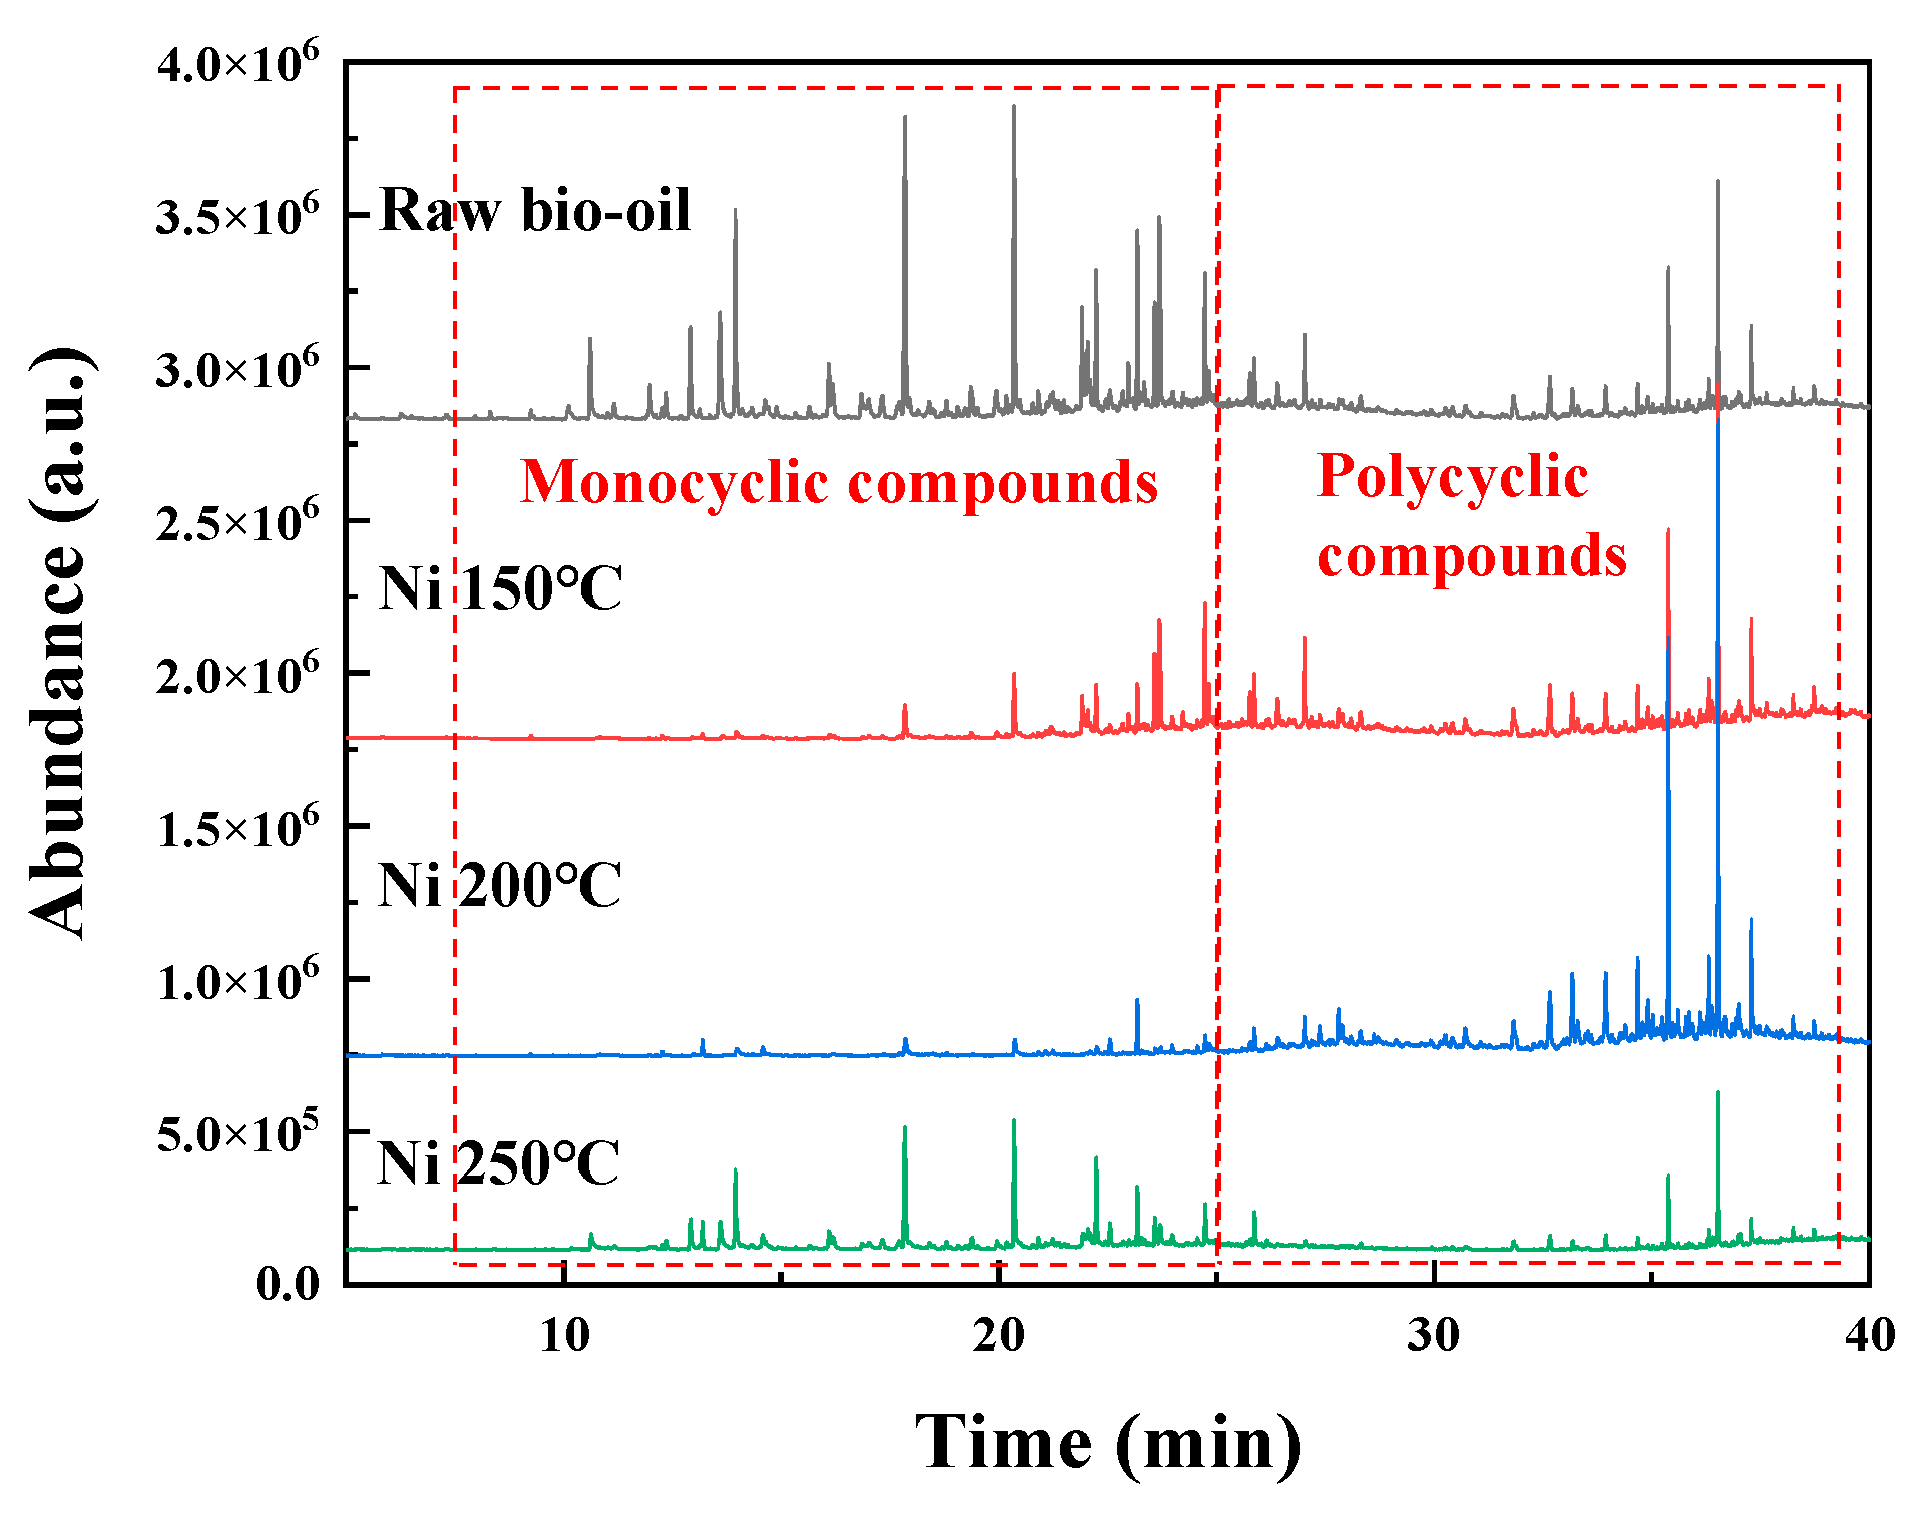
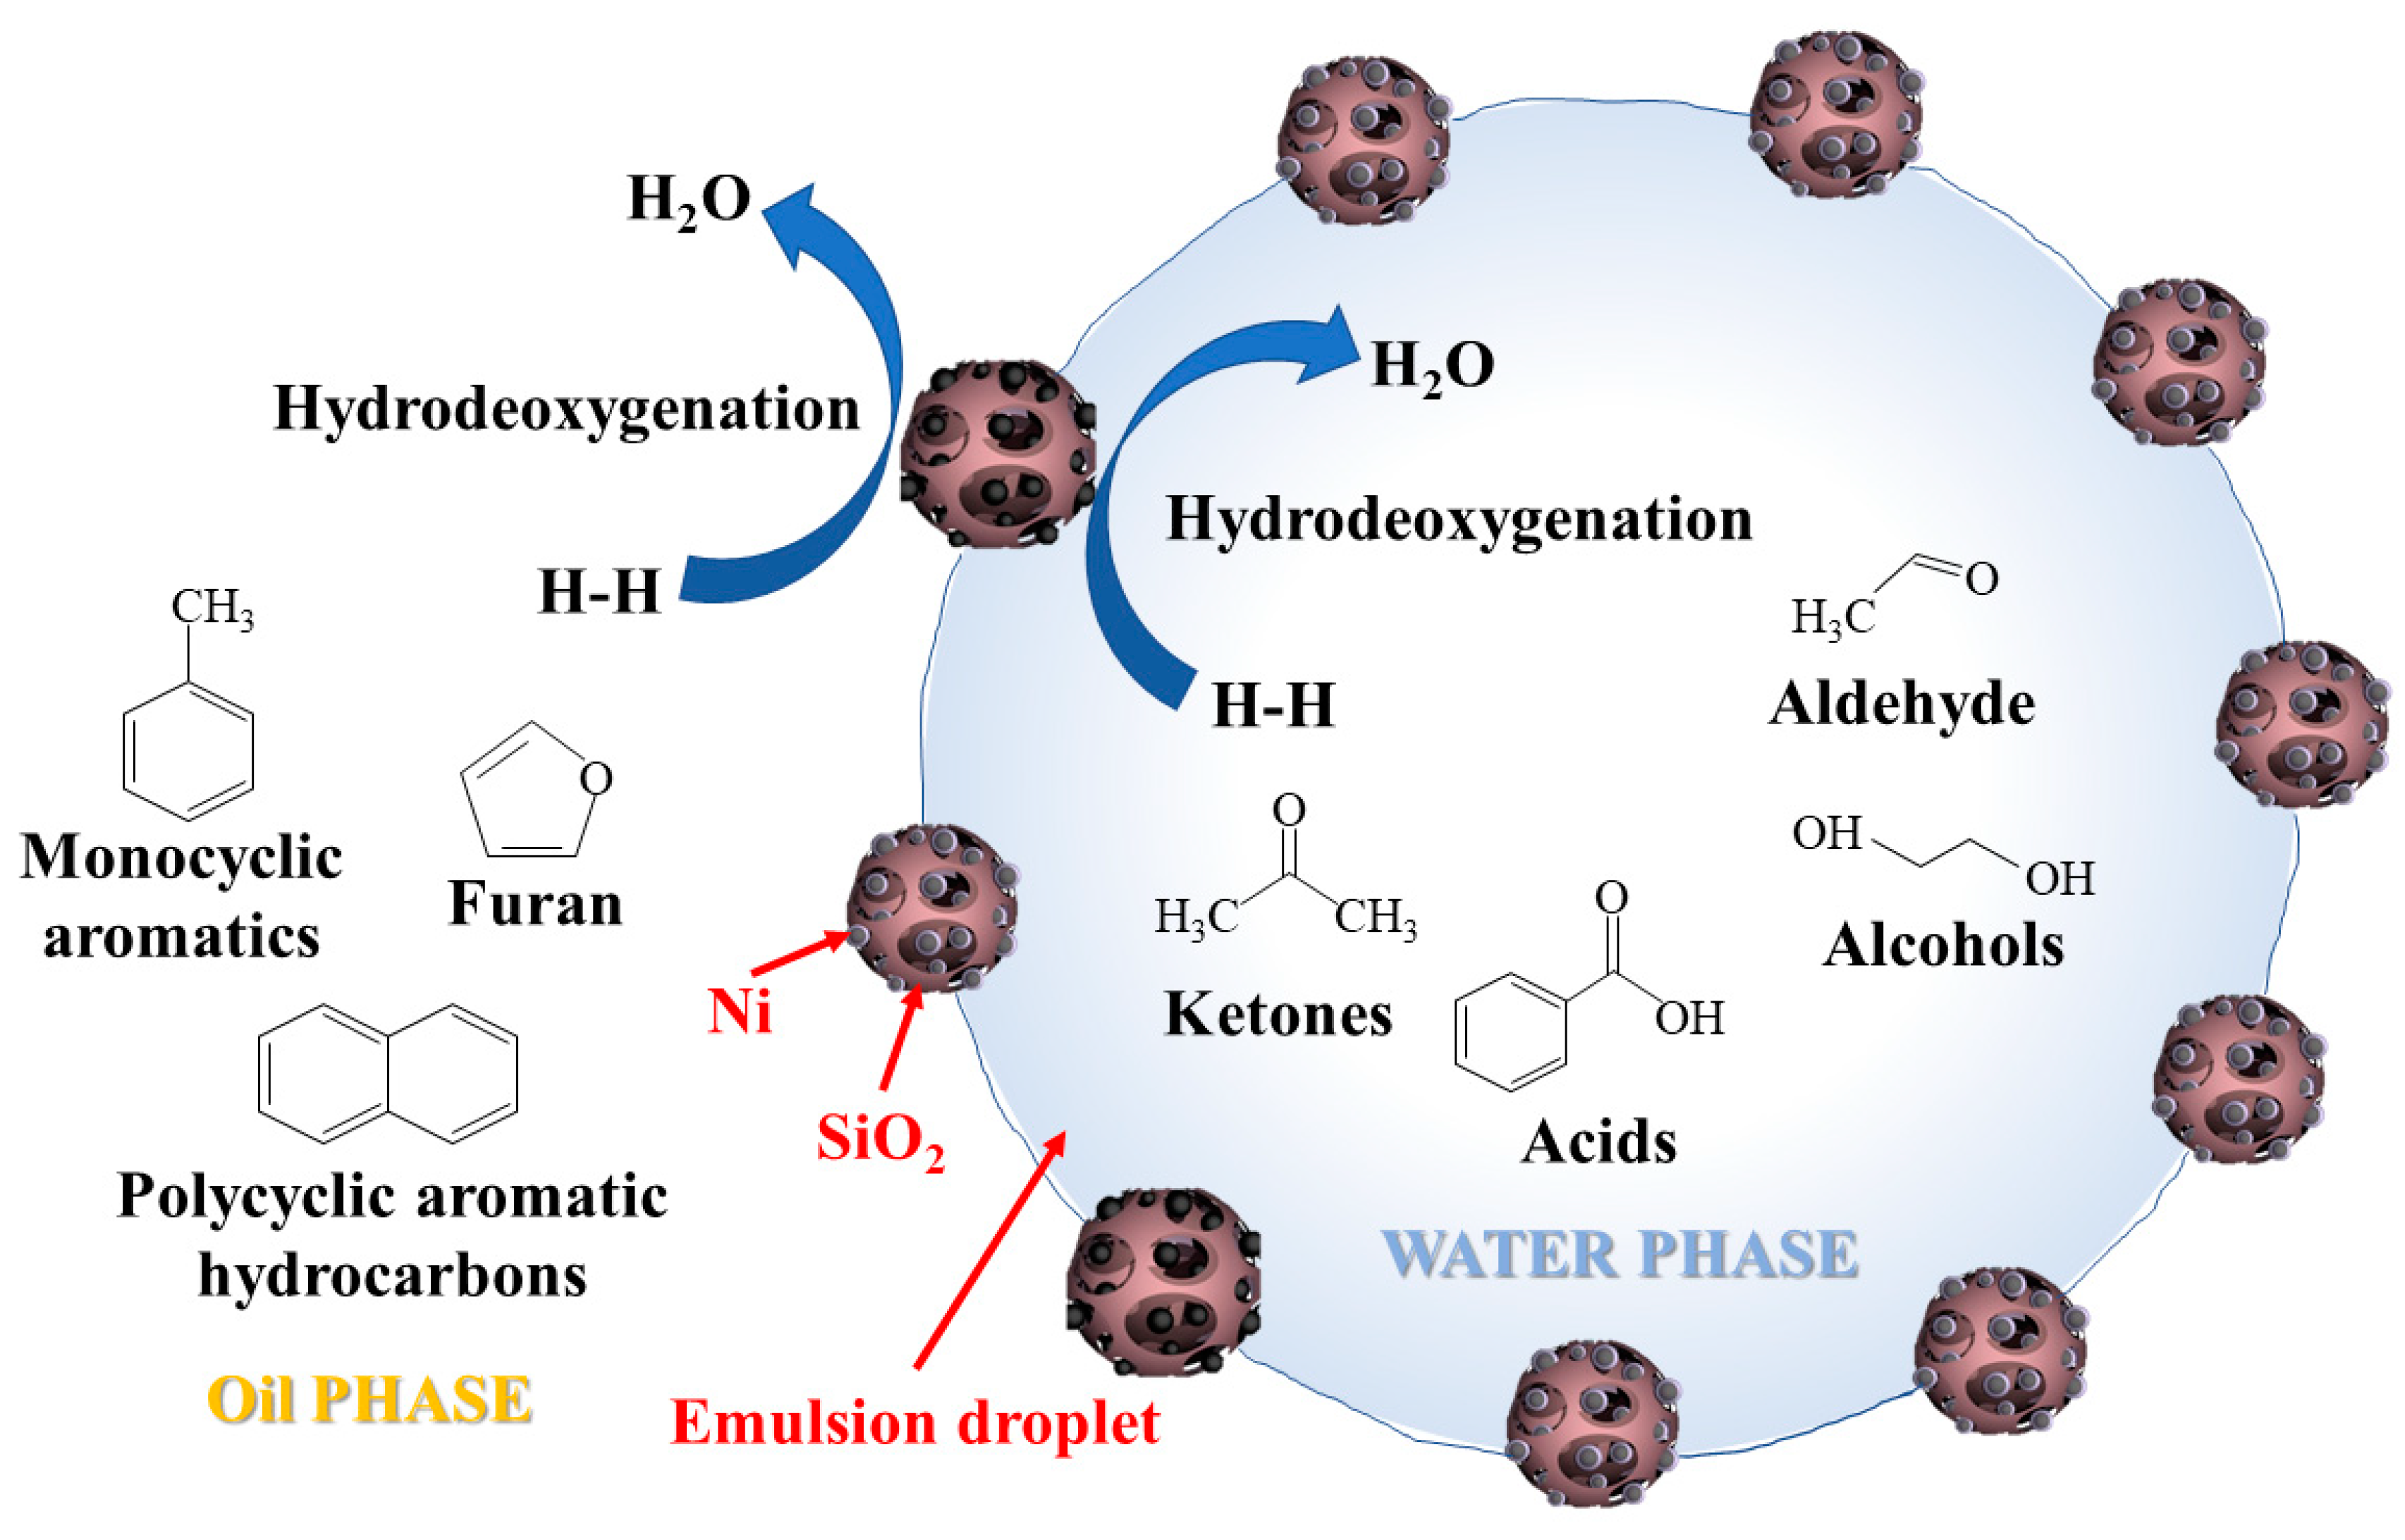
2.3.2. Hydrodeoxygenation of Bio-Oil under Pickering Emulsion System

The catalytic hydrodeoxygenation of the Pickering emulsion of bio-oil stabilized by SiO2 solid particles loaded with Ni-based catalyst was carried out to study the catalytic hydrodeoxygenation performance under the Pickering emulsion system.
Figure 10 shows the UV fluorescence spectra results for the products produced by the catalytic hydrodeoxygenation of bio-oil Pickering emulsions. Similar to raw bio-oil, bio-oil Pickering emulsion’s monocyclic aromatic hydrocarbon content decreased after hydrodeoxygenation. In contrast, the content of bicyclic and more than bicyclic polycyclic aromatic hydrocarbons increased. This indicates that a polymerization reaction takes place between monocyclic compounds during hydrodeoxygenation to produce bicyclic and polycyclic aromatic hydrocarbons. Increased temperature had little effect on the polymerization reaction from 150 °C to 200 °C, and the monocyclic aromatic hydrocarbon and polycyclic aromatic hydrocarbon content hardly changed. However, when the temperature was further raised to 250 °C, monocyclic aromatic hydrocarbons increased slightly, bicyclic aromatic hydrocarbons decreased, and the position of the second high-intensity peak shifted to the right, indicating that more polycyclic aromatic hydrocarbons were produced It is possible that the increase in temperature from 200 °C to 250 °C promoted the polymerization reaction between two or more aromatic compounds during the process of bio-oil hydrodeoxygenation, but not between monocyclic aromatic compounds.
In Figure 11, the GPC results of catalytic hydrodeoxygenation products of bio-oil Pickering emulsions are shown. A similar trend as with raw bio-oil hydrogenation can be seen in the figure; with the increase in temperature, the molecular weight of the bio-oil hydrodeoxygenation product increased. The corresponding average molecular was 587 g/mol for raw bio-oil, 716 g/mol for Ni 150 °C, 783 g/mol for Ni 200 °C, and 1177 g/mol for Ni 250 °C, respectively. Clearly, when the temperature rose to 250 °C, the molecular weight of the bio-oil was almost twice that at the beginning. Compared to 150 °C and 200 °C, the temperature rise had a far greater impact. As with the UV fluorescence spectra result, this result further confirms that rising temperature promotes polymerization reactions between compounds during bio-oil hydrodeoxygenation.
The GC-MS results of bio-oil Pickering emulsion hydrodeoxygenation products are shown in Figure 12. It can be seen that the content of monocyclic compounds and polycyclic aromatic compounds in the light components of the products decreased to varying degrees under three temperature conditions. With the temperature increase, the content of polycyclic aromatic compounds in the light components decreased. This indicates that raising the temperature in the process of bio-oil hydrodeoxygenation leads to polymerization between its light components and its heavy components. When the reaction temperature reached 250 °C, unlike for raw bio-oil catalytic hydrogenation, there was still a small number of monocyclic components and polycyclic aromatic components in the light products of bio-oil Pickering emulsion catalytic hydrogenation. This indicates that the confinement effect inhibits the combination of light components and heavy components in bio-oil [31].

2.3.3. Effect of Pickering Emulsion System on Bio-Oil Hydrodeoxygenation

Under the same reaction conditions, as shown in Figure 7 and Figure 10, the number of monocyclic aromatics, bicyclic aromatics, and more bicyclic polycyclic aromatics in the Pickering emulsion catalytic hydrodeoxygenation product was not significantly different than the number in the raw bio-oil hydrodeoxygenation product at 150 °C and 200 °C. Nevertheless, when the temperature reached 250 °C, the Pickering emulsion catalytic hydrodeoxygenation product significantly contained more monocyclic aromatics than that of raw bio-oil hydrodeoxygenation. A limitation effect may be present during the catalytic hydrodeoxygenation of bio-oil Pickering emulsion. Bio-oil consists of two phases, the oil and water phase. There is a large number of light components dissolved in the water phase. In accordance with the research of Xiong [32], the oxygenated compounds in light components react with the heavy components during the heating process and combine, resulting in coke formation at relatively low temperatures, which leads to the reduction in the number of monocyclic aromatic hydrocarbons at 250 °C. In advance of catalytic hydrogenation, amphiphilic solid nanoparticles are added to bio-oil, which are then emulsified into bio-oil Pickering emulsion by ultrasonic. As a result of amphiphilic solid particles wrapping the water-soluble light components in the liquid droplets, the light components in bio-oil undergo hydrogenation reactions, reducing the contact probability of oxygen-containing monocyclic aromatic compounds in both light and heavy components. As a result, monocyclic aromatic compounds are relatively less likely to be combined with small molecules containing oxygen and macromolecular compounds, resulting in a higher number of monocyclic aromatic compounds.
Since most of the light components that can be measured by GC-MS in raw bio-oil had polymerized with the heavy components at 250 °C, the GC-MS results of raw bio-oil hydrodeoxygenation products and bio-oil Pickering emulsion hydrodeoxygenation products at 200 °C were selected here for comparison. As is shown in Figure 13, the content of oxygen-containing compounds (mainly phenols and ethers) and olefins in raw bio-oil hydrodeoxygenation products decreased slightly compared with that before hydrogenation, while the content of oxygen-containing compounds (mainly phenols and ethers) and olefins in bio-oil Pickering emulsion catalytic hydrodeoxygenation products decreased significantly, by almost 100%. Additionally, the content of saturated hydrocarbons in the products increased. It indicates that the hydrogenation efficiency of the bio-oil after Pickering emulsification was improved to a greater extent compared with that of the conventional hydrogenation of bio-oil. This is attributed to the fact that emulsification makes the mixing of bio-oil and water phases more homogeneous. The amphiphilic solid nanoparticles, which act as both emulsifier and catalyst, are wrapped around the surface of the droplets, forming a “micro-reactor”. The “micro-reactor” greatly enhances the reaction efficiency of bio-oil hydrodeoxygenation, as presented in Figure 14.

3. Experimental Section

3.1. Materials

The bio-oil used in this work was produced by rapid pyrolysis of grain hulls in a fluidized bed reactor at 500 °C. Table 2 shows the results of their elemental analysis. The moisture content of bio-oil was measured by volumetric method using Karl Fischer titrator (Shanghai WoG, Shanghai, China, AKF-B) and was 20.26 wt.%.
In this work, the solid particles used as emulsifiers were hydrophobic nano-fumed silica (SiO2) (Aladdin, Shanghai, China), cetyltrimethylammonium-bromide-modified graphene oxide (CTAB-GO), and coconut shell coke (YK). GO was made by the means of the modified Hummers’ method as follows [33]: The beaker with 23 mL of concentrated sulfuric acid (Aladdin, Shanghai, China) was placed into the ice–water mixture. A 1 g amount of expanded graphite (Aladdin, Shanghai, China) with 0.5 g sodium nitrate (Aladdin, Shanghai, China) was added. After continuous stirring for 8 min, 3 g of potassium permanganate (Aladdin, Shanghai, China) was added slowly and stirred for 30 min. When the temperature raised to 35 °C and the reaction was continued for 60 min, 45 mL of distilled water was added slowly, and the temperature was raised to 90 °C and was stirred for 1 h for hydrolysis. Then, 8 mL of H2O2 (30 %) (Aladdin, Shanghai, China) and 167 mL of distilled water were added slowly in the stirring process, and the suspension was treated by ultrasound at 80 kHz for 1 h to obtain the GO mixture solution. CTAB-GO was made by the following steps [33]: 1 g CTAB (Aladdin, Shanghai, China) was slowly added to the above mixture solution; a reddish-brown precipitate formed and settled to the bottom of the flair. Separated precipitates were centrifuged at low speed (3000 rpm for 3 min) and then washed sequentially with distilled water and 1:1 aqueous hydrochloric acid 3 times until no precipitates were observed after the addition of silver nitrate. This indicated that the impurity ions had been removed. A brown CTAB-GO complex was obtained after freeze-drying under vacuum for 24 h. We prepared coconut shell char at different temperatures (500 °C, 600 °C, 700 °C, 800 °C) and found that the difference of contact angle was small. High temperatures result in a higher degree of graphitization, which makes char more grindable. However, higher temperatures result in lower char yields. Combining these two factors, we chose 700 °C as the pyrolysis temperature. Coconut shell coke was produced by slow pyrolysis of coconut shells in a fixed bed reactor at 700 °C for 30 min and was continuously ground in a ball mill at 300 r/min for 4 h. Table 3 shows the average particle size of the three particles measured by laser particle sizer.

3.2. Catalyst Preparation and Characterization

Ni-based catalysts were loaded on top of hydrophobic nano-fumed silica by impregnation method in the following steps [34]: 50.6 mg NiCl2·6H2O (Aladdin, Shanghai, China) was dissolved in 20 mL water with 125 mg solid particle carrier, and they were soaked for 12 h (Ni content was 10 wt.%). The rested liquid was dried in an oven at 110 °C for 12 h; dry solids were calcined under N2 for 1 h at 500 °C. Before the experiments, the solid particles loaded with catalyst were reduced under a mixed atmosphere (10 mol% H2/90 mol% N2) at 700 °C with a flow rate of 100 mL/min for 1 h.
H2-TPR (H2 temperature-programmed reduction) and NH3-TPD (NH3 temperature-programmed desorption) were carried out on a Micromeritics ChemiSorb 2720 chemical adsorption apparatus with a TCD (thermal conductivity detector). Samples for H2-TPR (0.1 g) were firstly flushed at 300 °C in He (99.999%) at the flow rate of 30 mL/min for 30 min and then cooled to 25 °C. After that, samples were heated up to 900 °C at a heating rate of 10 °C/min under the 10% H2 (30 mL/min per g precursor) flow mixed with He. The H2-TPR signals were identified via a thermal conductivity detector (TCD). Samples for NH3-TPD (0.1 g) were firstly degassed at 300 °C in He (99.999%) at the flow rate of 30 mL/min for 30 min, then cooled to 25 °C and saturated with ammonia (0.2% NH3/He) gas until saturated (30 min). After that, samples were purged in He flow for 60 min at 25 °C and then desorbed by heating to 900 °C at the heating rate of 10 °C/min in He flow at the flow rate of 30 mL/min. The NH3-TPD signals were identified via a thermal conductivity detector (TCD).

3.3. Emulsion Preparation and Stability Test

Since the bio-oil itself consists of water and oil phase (polar and non-polar phase), and the moisture was measured by the Karl Fischer meter as 20.26%, no additional water or oil phase was added to the emulsification process. The specific emulsification steps were as follows: 25 g of bio-oil sample was added to a double beaker, and 0.125 g of solid particles loaded with catalyst was added to bio-oil (0.5 wt.% solid particles). After stirring it well with a glass rod, the double-layer beaker was placed in an ultrasonic emulsifier and reacted at 360 W for 10 min, during which, every 3 s of sonication was performed at 6 s intervals. Due to the unstable nature of the bio-oil itself and the sonication process, which generates great heat, it was necessary to pass condensate in the outer layer of the double beaker to ensure that the sonication process temperature did not exceed 35 °C, and the circulating condensate temperature was set to 20 °C.
In this work, the stability of bio-oil emulsions was determined by observing the change of emulsion droplet size with time; the specific methods were as follows: the bio-oil Pickering emulsion was placed in a sample bottle, and three drops of each emulsion were taken from the top, middle, and bottom layers, spread on a slide, and photographed with an optical microscope (Nanjing Jiangnan Novel Optics Co, LTD, Nanjing, China NE620), after which, the resulting photos were processed with ImageJ, and the particle size distribution of all droplets on each photo was counted.

3.4. Hydrodeoxygenation Reactions

The hydrodeoxygenation of raw bio-oil and bio-oil Pickering emulsion was carried out in a 250 mL autoclave that was equipped with an electrical heating jacket with a maximum working temperature of 300 °C and a pressure of 20 MPa. For a typical run, the reaction was carried out with a 5 g sample (herein, raw bio-oil, bio-oil Pickering emulsion). First, inject 1 MPa N2 at room temperature and then release it. Three times should be sufficient to replace the air in the reactor. Secondly, inject 1 MPa H2 at room temperature and then release it. Three times should be sufficient to replace the N2 in the reactor. For the final step, add 1.5 MPa H2 at room temperature and heat the reactor to the required reaction temperatures (150 °C, 200 °C, and 250 °C) for an hour. After the reactor has cooled to room temperature, take out its inner tank and collect the bio-oil hydrodeoxygenation products with methanol and dichloromethane mixed solution (1:4).

3.5. Characterization of the Bio-Oil

The UV fluorescence spectra of the raw bio-oil and the hydrodeoxygenation product oils were recorded with an Agilent Cary Eclipse spectrometer. The oil solution was diluted to 4 ppm (wt.) with methanol (Uvasol for spectroscopy; purity (GC): ≥99.9%) before characterization with UV fluorescence spectroscopy. The constant energy difference was −2800 cm−1, and the light slit widths were 2.5 nm. Each synchronous spectrum was the average of 2 scans [17,35]. The “wavelength” shown for each spectrum referred to that of the excitation monochromator. The wavelength is a brief indication of the aromatic ring sizes (e.g., <290 nm for monocyclic compound, 290–320 nm for aromatic ring systems containing two fused benzene rings, etc.), although it is impossible to clearly delineate ring sizes and wavelength ranges [36].
The molecular weight distribution of the components in the bio-oils was determined using an Agilent 1260II GPC system equipped with a refractive index detector (RID) as well as an OligoPore 7.5 × 300 mm column. The column temperature was set at 40 °C. The mobile phase was tetrahydrofuran (HPLC grade) with a flow rate of 1 mL/min. Each sample was diluted to 0.05 wt.% using the mobile phase and filtered before analysis [37].
The chemical composition of bio-oil was analyzed with Agilent GC-MS (7890A GC and 5975C MS detector) with a DB-Wax capillary column (length, 30 m; internal diameter, 0.25 mm; film thickness, 0.25 mm). The helium (1 mL min−1, purity >99.99%) was used as the carrier gas. The oil solution was diluted to 0.5 wt.% with methanol (Uvasol for spectroscopy; purity (GC): ≥99.9%) before characterization with the GC-MS. A 1 μL amount of the sample was injected into the injection port. The injector temperature was set at 270 °C. The GC oven was initially maintained at 40 °C for 3 min and then increased to 250 °C at 5 °C/min. The compounds in the bio-oil samples were qualitatively identified in comparison to the mass spectral library from the National Institutes for Standards and Technology [30].

4. Conclusions

The purpose of this work was to investigate the stability of bio-oil Pickering emulsions formed by different solid particles and the effectiveness of bio-oil Pickering emulsion systems in the catalytic hydrodeoxygenation process. The results showed that the average droplet size of three amphiphilic solid-particle emulsified bio-oil Pickering emulsion had smaller changes after 21 days, only within 20%, which was far lower than the 64.78% of raw bio-oil. The compounds in bio-oil polymerize in the process of hydrodeoxygenation. Upon reaching a certain temperature (250 °C in this experiment), monocyclic compounds in the light components and polycyclic aromatic compounds are greatly reduced in bio-oil, and polymerization is enhanced greatly. The confinement effect of the Pickering emulsion system was verified by the presence of the monocyclic compounds after the higher reaction temperature at 250 °C. Compared to the raw bio-oil hydrodeoxygenation, the hydrodeoxygenation under the bio-oil Pickering emulsion system exhibited a near 100% conversion rate for most phenolic compounds in light components.

Author Contributions

Conceptualization, L.J. and K.D.; methodology, L.J. and K.D.; validation, J.X. (Jun Xu), Y.W. and S.S.; formal analysis, K.D.; investigation, K.D., B.Y. and Y.X.; resources, L.J., Y.W. and S.H.; data curation, K.D., B.Y. and Y.X.; writing—original draft preparation, K.D.; writing—review and editing, L.J.; visualization, K.D.; supervision, L.J. and J.X. (Jun Xiang); project administration, L.J. and J.X. (Jun Xiang); funding acquisition, L.J., Y.W. and S.H. All authors have read and agreed to the published version of the manuscript.

Funding

This work was supported by the National Key Research and Development Program of China (no. 2018YFE0127500) and the National Natural Science Foundation of China (NSFC) (no. 52276193 and 52122608). The authors would also acknowledge the Analytical and Testing Center of Huazhong University of Science and Technology for the help on the experiments.

Data Availability Statement

The data presented in this study are available on request from the corresponding author.

Conflicts of Interest

The authors declare no conflict of interest.

References

  1. Sebestyén, V. Renewable and Sustainable Energy Reviews: Environmental impact networks of renewable energy power plants. Renew. Sustain. Energy Rev. 2021, 151, 111626. [Google Scholar] [CrossRef]
  2. He, Q.; Cheng, C.; Raheem, A.; Lam, S.S. Effect of hydrothermal carbonization on woody biomass: From structure to reactivity. Fuel 2022, 330, 125586. [Google Scholar] [CrossRef]
  3. Cheng, S.; Wei, L.; Zhao, X.; Julson, J. Application, Deactivation, and Regeneration of Heterogeneous Catalysts in Bio-Oil Upgrading. Catalysts 2016, 6, 195. [Google Scholar] [CrossRef] [Green Version]
  4. Qu, T.; Niu, S.; Gong, Z.; Han, K.; Wang, Y.; Lu, C. Wollastonite decorated with calcium oxide as heterogeneous transesterification catalyst for biodiesel production: Optimized by response surface methodology. Renew. Energy 2020, 159, 873–884. [Google Scholar] [CrossRef]
  5. Yang, K.; Wu, K.; Zhang, H. Machine learning prediction of the yield and oxygen content of bio-oil via biomass characteristics and pyrolysis conditions. Energy 2022, 254, 124320. [Google Scholar] [CrossRef]
  6. Liu, R.; Rahman, M.M.; Sarker, M.; Chai, M.; Li, C.; Cai, J. A review on the catalytic pyrolysis of biomass for the bio-oil production with ZSM-5: Focus on structure. Fuel Process. Technol. 2020, 199, 106301. [Google Scholar]
  7. Hu, X.; Gholizadeh, M. Progress of the applications of bio-oil. Renew. Sustain. Energy Rev. 2020, 134, 110124. [Google Scholar] [CrossRef]
  8. Malek, N.H.; Alias, R.; Syed Hassan, S.S.A. Low-tar, highly burnable gas production from the gasification of pelletized palm empty fruit bunch. Can. J. Chem. Eng. 2023, 101, 1207–1218. [Google Scholar] [CrossRef]
  9. Ly, H.V.; Kim, J.; Hwang, H.T.; Choi, J.H.; Woo, H.C.; Kim, S.S. Catalytic Hydrodeoxygenation of Fast Pyrolysis Bio-Oil from Saccharina japonica Alga for Bio-Oil Upgrading. Catalysts 2019, 9, 1043. [Google Scholar] [CrossRef] [Green Version]
  10. Shu, R.; Xu, Y.; Ma, L.; Zhang, Q.; Chen, P.; Wang, T. Synergistic effects of highly active Ni and acid site on the hydrodeoxygenation of syringol. Catal. Commun. 2017, 91, 1–5. [Google Scholar] [CrossRef]
  11. Yan, N.; Yuan, Y.; Dykeman, R.; Kou, Y.; Dyson, P.J. Hydrodeoxygenation of Lignin-Derived Phenols into Alkanes by Using Nanoparticle Catalysts Combined with Brønsted Acidic Ionic Liquids. Angew. Chem. Int. Ed. 2010, 49, 5549–5553. [Google Scholar] [CrossRef]
  12. Elkasabi, Y.; Mullen, C.A.; Pighinelli, A.L.M.T.; Boateng, A.A. Hydrodeoxygenation of fast-pyrolysis bio-oils from various feedstocks using carbon-supported catalysts. Fuel Process. Technol. 2014, 123, 11–18. [Google Scholar] [CrossRef]
  13. Cordero-Lanzac, T.; Palos, R.; Arandes, J.M.; Castano, P.; Rodríguez-Mirasol, J.; Cordero, T.; Bilbao, J. Stability of an acid activated carbon based bifunctional catalyst for the raw bio-oil hydrodeoxygenation. Appl. Catal. B Environ. 2017, 203, 389–399. [Google Scholar] [CrossRef]
  14. Kim, J. Production, separation and applications of phenolic-rich bio-oil—A review. Bioresour. Technol. 2015, 178, 90–98. [Google Scholar] [CrossRef] [PubMed]
  15. Shu, R.; Lin, B.; Zhang, J.; Castano, P.; Rodríguez-Mirasol, J.; Cordero, T.; Bilbao, J. Efficient catalytic hydrodeoxygenation of phenolic compounds and bio-oil over highly dispersed Ru/TiO2. Fuel Process. Technol. 2019, 184, 12–18. [Google Scholar] [CrossRef]
  16. Saisu, M.; Sato, T.; Watanabe, M.; Adschiri, T.; Arai, K. Conversion of Lignin with Supercritical Water−Phenol Mixtures. Energy Fuels 2003, 17, 922–928. [Google Scholar] [CrossRef]
  17. Liu, Q.; Xiong, Z.; Syed-Hassan, S.S.A.; Deng, Z.; Zhao, X.; Su, S.; Hu, S. Effect of the pre-reforming by Fe/bio-char catalyst on a two-stage catalytic steam reforming of bio-oil. Fuel 2019, 239, 282–289. [Google Scholar] [CrossRef]
  18. Jia, L.; Cao, C.; Cheng, Z.; Wang, J.; Huang, J.; Yang, J.; Pan, Y.; Xu, M.; Wang, Y. Ex Situ Catalytic Pyrolysis of Algal Biomass in a Double Microfixed-Bed Reactor: Catalyst Deactivation and Its Coking Behavior. Energy Fuels 2020, 34, 1918–1928. [Google Scholar] [CrossRef]
  19. Yang, X.; Liang, Y.; Zhao, X.; Songa, Y.; Hu, L.; Wang, X.; Wanga, Z.; Qiu, J. Au/CNTs catalyst for highly selective hydrodeoxygenation of vanillin at the water/oil interface. RSC Adv. 2014, 4, 31932–31936. [Google Scholar] [CrossRef]
  20. Leng, L.; Li, H.; Yuan, X.; Zhou, W.; Huang, H. Bio-oil upgrading by emulsification/microemulsification: A review. Energy 2018, 161, 214–232. [Google Scholar] [CrossRef]
  21. Attia, M.; Farag, S.; Chaouki, J. Upgrading of Oils from Biomass and Waste: Catalytic Hydrodeoxygenation. Catalysts 2020, 10, 1381. [Google Scholar] [CrossRef]
  22. Wu, J.; Ma, G. Recent Studies of Pickering Emulsions: Particles Make the Difference. Small 2016, 12, 4633–4648. [Google Scholar] [CrossRef]
  23. Ni, L.; Yu, C.; Wei, Q.; Liu, D.; Qiu, J. Pickering Emulsion Catalysis: Interfacial Chemistry, Catalyst Design, Challenges, and Perspectives. Angew. Chem. 2022, 134, e202115885. [Google Scholar] [CrossRef]
  24. Zhu, Z.; Tan, H.; Wang, J.; Yu, S.; Zhou, K. Hydrodeoxygenation of vanillin as a bio-oil model over carbonaceous microspheres-supported Pd catalysts in the aqueous phase and Pickering emulsions. Green Chem. 2014, 16, 2636–2643. [Google Scholar] [CrossRef]
  25. Yang, S.; Chen, G.; Guan, Q.; Xu, H.; Wang, Z.; Liu, B.; Lin, L. An efficient Pd/carbon-silica-alumina catalyst for the hydrodeoxygenation of bio-oil model compound phenol. Mol. Catal. 2021, 510, 111681. [Google Scholar] [CrossRef]
  26. Rekha, M.; Manjunath, H.R.; Nagaraju, N. Mn/Al2O3 and Mn/ZrO2 as selective catalysts for the synthesis of bis(indolyl)methanes: The role of surface acidity and particle morphology. J. Ind. Eng. Chem. 2013, 19, 337–346. [Google Scholar] [CrossRef]
  27. Shafaghat, H.; Tsang, Y.F.; Jeon, J.; Kim, J.M.; Kim, Y.; Kim, S.; Park, Y.K. In-situ hydrogenation of bio-oil/bio-oil phenolic compounds with secondary alcohols over a synthesized mesoporous Ni/CeO2 catalyst. Chem. Eng. J. 2020, 382, 122912. [Google Scholar] [CrossRef]
  28. Zhou, M.; Liu, P.; Wang, K.; Xu, J.; Jiang, J. Catalytic hydrogenation and one step hydrogenation-esterification to remove acetic acid for bio-oil upgrading: Model reaction study. Catal. Sci. Technol. 2016, 6, 7783–7792. [Google Scholar] [CrossRef]
  29. Liu, Y.; Zhao, J.; He, Y.; Feng, J.; Wu, T.; Li, D. Highly efficient PdAg catalyst using a reducible Mg-Ti mixed oxide for selective hydrogenation of acetylene: Role of acidic and basic sites. J. Catal. 2017, 348, 135–145. [Google Scholar] [CrossRef]
  30. Deng, W.; Xu, K.; Xiong, Z.; Chaiwat, W.; Wang, X.; Su, S.; Xiang, J. Evolution of Aromatic Structures during the Low-Temperature Electrochemical Upgrading of Bio-oil. Energy Fuels 2019, 33, 11292–11301. [Google Scholar] [CrossRef]
  31. Zhang, M.; Ettelaie, R.; Dong, L.; Li, X.; Li, T.; Zhang, X.; Yang, H. Pickering emulsion droplet-based biomimetic microreactors for continuous flow cascade reactions. Nat. Commun. 2022, 13, 475. [Google Scholar] [CrossRef] [PubMed]
  32. Xiong, Z.; Syed-Hassan, S.S.A.; Xu, J.; Wang, Y.; Hu, S.; Su, S.; Xiang, J. Evolution of coke structures during the pyrolysis of bio-oil at various temperatures and heating rates. J. Anal. Appl. Pyrolysis 2018, 134, 336–342. [Google Scholar] [CrossRef]
  33. Yang, Y.J.; Li, W. CTAB functionalized graphene oxide/multiwalled carbon nanotube composite modified electrode for the simultaneous determination of ascorbic acid, dopamine, uric acid and nitrite. Biosens. Bioelectron. 2014, 56, 300–306. [Google Scholar] [CrossRef] [PubMed]
  34. Deng, Z.; Syed-Hassan, S.S.A.; Chen, Y.; Jiang, L.; Xu, J.; Hu, S.; Xiang, J. Effect of Ni/Al2O3 mixing on the coking behavior of bio-oil during its pyrolysis: Further understanding based on the interaction between its components. Fuel 2022, 315, 123136. [Google Scholar] [CrossRef]
  35. Xiong, Z.; Chen, Y.; Azis, M.M.; Hu, X.; Deng, W.; Han, H.; Xiang, J. Roles of furfural during the thermal treatment of bio-oil at low temperatures. J. Energy Chem. 2020, 50, 85–95. [Google Scholar] [CrossRef]
  36. Wang, Y.; Li, X.; Mourant, D.; Gunawan, R.; Zhang, S.; Li, C.Z. Formation of Aromatic Structures during the Pyrolysis of Bio-oil. Energy Fuels 2012, 26, 241–247. [Google Scholar] [CrossRef]
  37. Deng, W.; Syed-Hassan, S.S.A.; Lam, C.H.; Hu, X.; Wang, X.; Xiong, Z.; Xiang, J. Polymerization during low-temperature electrochemical upgrading of bio-oil: Multi-technique characterization of bio-oil evolution. Energy Convers. Manag. 2022, 253, 115165. [Google Scholar] [CrossRef]
Figure 1. Measurement results of solid particle contact angle. (a) Hydrophobic nano-fumed silica, (b) coconut shell coke, (c) GO, (d) CTAB-GO.
Catalysts 13 00573 g001
Figure 2. FT-IR of graphite powder, graphene oxide, CTAB-modified graphene oxide, and coconut shell coke.
Catalysts 13 00573 g002
Figure 3. TPD of the SiO2 support and prepared Ni/SiO2.
Catalysts 13 00573 g003
Figure 4. Photos of Pickering emulsion stabilized by three kinds of solid particles from each of the top, middle, and bottom layers under 400× optical microscope. (a) CTAB-GO, (b) SiO2, (c) coconut shell coke.
Catalysts 13 00573 g004
Figure 5. Statistical results of particle size of three drops of bio-oil Pickering emulsion randomly sampled. (a) CTAB-GO, (b) SiO2, (c) coconut shell coke.
Catalysts 13 00573 g005
Figure 6. Droplet size distribution of Pickering emulsion and blank emulsion of bio-oil stabilized by three kinds of solid particles. (a) Day 1, (b) Day 5, (c) Day 21.
Catalysts 13 00573 g006
Figure 7. UV fluorescence spectra of raw bio-oil hydrodeoxygenation at 150 °C, 200 °C, and 250 °C.
Catalysts 13 00573 g007
Figure 8. Cumulative molecular weight distribution of raw bio-oil hydrodeoxygenation at 150 °C, 200 °C, and 250 °C.
Catalysts 13 00573 g008
Figure 9. GC-MS results of raw bio-oil hydrodeoxygenation at 150 °C, 200 °C, and 250 °C.
Catalysts 13 00573 g009
Figure 10. UV fluorescence spectra of bio-oil Pickering emulsion hydrodeoxygenation at 150 °C, 200 °C, and 250 °C.
Catalysts 13 00573 g010
Figure 11. Cumulative molecular weight distribution of bio-oil Pickering emulsion hydrodeoxygenation at 150 °C, 200 °C, and 250 °C.
Catalysts 13 00573 g011
Figure 12. GC-MS results of bio-oil Pickering emulsion hydrodeoxygenation at 150 °C, 200 °C, and 250 °C.
Catalysts 13 00573 g012
Figure 13. GC-MS results of raw bio-oil and bio-oil Pickering emulsion hydrodeoxygenation products at 200 °C.
Catalysts 13 00573 g013aCatalysts 13 00573 g013b
Figure 14. Mechanism of Pickering emulsification hydrodeoxygenation reaction of bio-oil.
Catalysts 13 00573 g014
Table 1. Results of H2-TPR of the prepared Ni/SiO2.
SamplePeak Position (°C)
Relatively Low TemperatureRelatively High Temperature
Ni/SiO2285, 325500
Table 2. Element analysis and calorific value of bio-oil (wt.%).
Element Analysis (ar, %)Water Content (%)HHV (MJ/kg)
CHNSO *20.2620.14
53.185.020.10.7041.00
* by difference (ash content below 0.1 wt.%).
Table 3. Average particle size of three solid particles.
Solid ParticlesHydrophobic Nano-Fumed SilicaCTAB-GOYK
Average size (nm)197.27108.30639.97
Disclaimer/Publisher’s Note: The statements, opinions and data contained in all publications are solely those of the individual author(s) and contributor(s) and not of MDPI and/or the editor(s). MDPI and/or the editor(s) disclaim responsibility for any injury to people or property resulting from any ideas, methods, instructions or products referred to in the content.

