1. Introduction
Out of all forms of renewable energy and their respective production procedures, hydrogen produced by photoelectrochemical means employing water as the input (source of hydrogen) is regarded as the most cost-effective and sustainable [
1,
2,
3]. The world is transitioning toward a hydrogen economy, with it having a projected 12% market share in the energy sector by the year 2050 [
4]. The shift from fossil fuels to hydrogen is expedited by the undeniable urgency of the climate situation and the commitment of every country to achieve net-zero emissions, which are valued at USD 174 billion [
5]. Regardless of the understanding of its importance, industrial hydrogen production is dominated by methane reforming [
6,
7].
Electrochemical means of hydrogen production have achieved a good performance in alkaline medium [
8,
9,
10]. However, it has been noticed that catalysts encounter a higher ohmic resistance when performing the dual role of HER and OER at a single site [
11]. This leads to a higher polarization loss in addition to sluggish reaction kinetics [
7,
12,
13]. In the search for novel materials for commercial-scale electrolyzer systems, bifunctional catalysts with a low internal ohmic resistance and improved mass transport yielding high current densities are in high demand [
14,
15]. These catalysts can be created by introducing defect sites [
16,
17], focusing on a certain morphology [
18,
19], sticking to a certain crystal facet [
20], or using core-shell nanoparticles [
21]. However, the most viable method for an electrochemical system driven by photon energy is to create a heterojunction by incorporating two compatible metal/metal or metal/nonmetal materials to achieve a favorable band bending [
22,
23].
The overall water splitting process involves two half-reactions taking place at the boundary line of a triple-phase, namely, a solid-phase electrocatalyst; a liquid electrolyte; and the gaseous products formed during the progression of the reaction [
24]. Lately, several iridium (Ir) and nickel (Ni) based electrocatalysts of different modes, namely core-shell nanostructured [
21] and dislocation-strained Ir and Ni nanoparticles [
25], have been studied with regard to the hydrogen evolution reaction. IrO
2 has a strong light absorbance in the UV–visible region in addition to its intrinsic oxygen evolution activity [
26,
27]. NiO, on the other hand, has been studied in relation to the hydrogen evolution reaction for many years [
28,
29]. NiO is also a well-known visible-light catalyst used in degradation reactions [
30,
31].
In light of this, here, we report the facile synthesis of an IrNi oxide alloy with improved light absorption properties for visible light-driven electrochemical water splitting. The total metal weight was maintained at 3% of the total catalyst weight, and the support used was a cost-effective porous activated carbon. For comparison, 3% by weight (in feed) of individual mono metallic nickel supported on AC (3%Ni@AC) and 3% by weight (in feed) of iridium supported on AC (3%Ir@AC) were also prepared. Of the three different Ir to Ni weight compositions (1:4, 1:1, and 4:1) evaluated, the 4:1 Ir:Ni on AC matrix was found to deliver superior hydrogen and oxygen photocurrents in alkaline, acidic, and neutral media. We believe that the results of this study will contribute to new insights into photoelectrochemical water splitting by IrNi oxide alloy. The simultaneous redox capability shown here will encourage the experimental adoption of IrNi-based materials in explore other chemical reactions of industrial importance under visible light conditions.
2. Results and Discussion
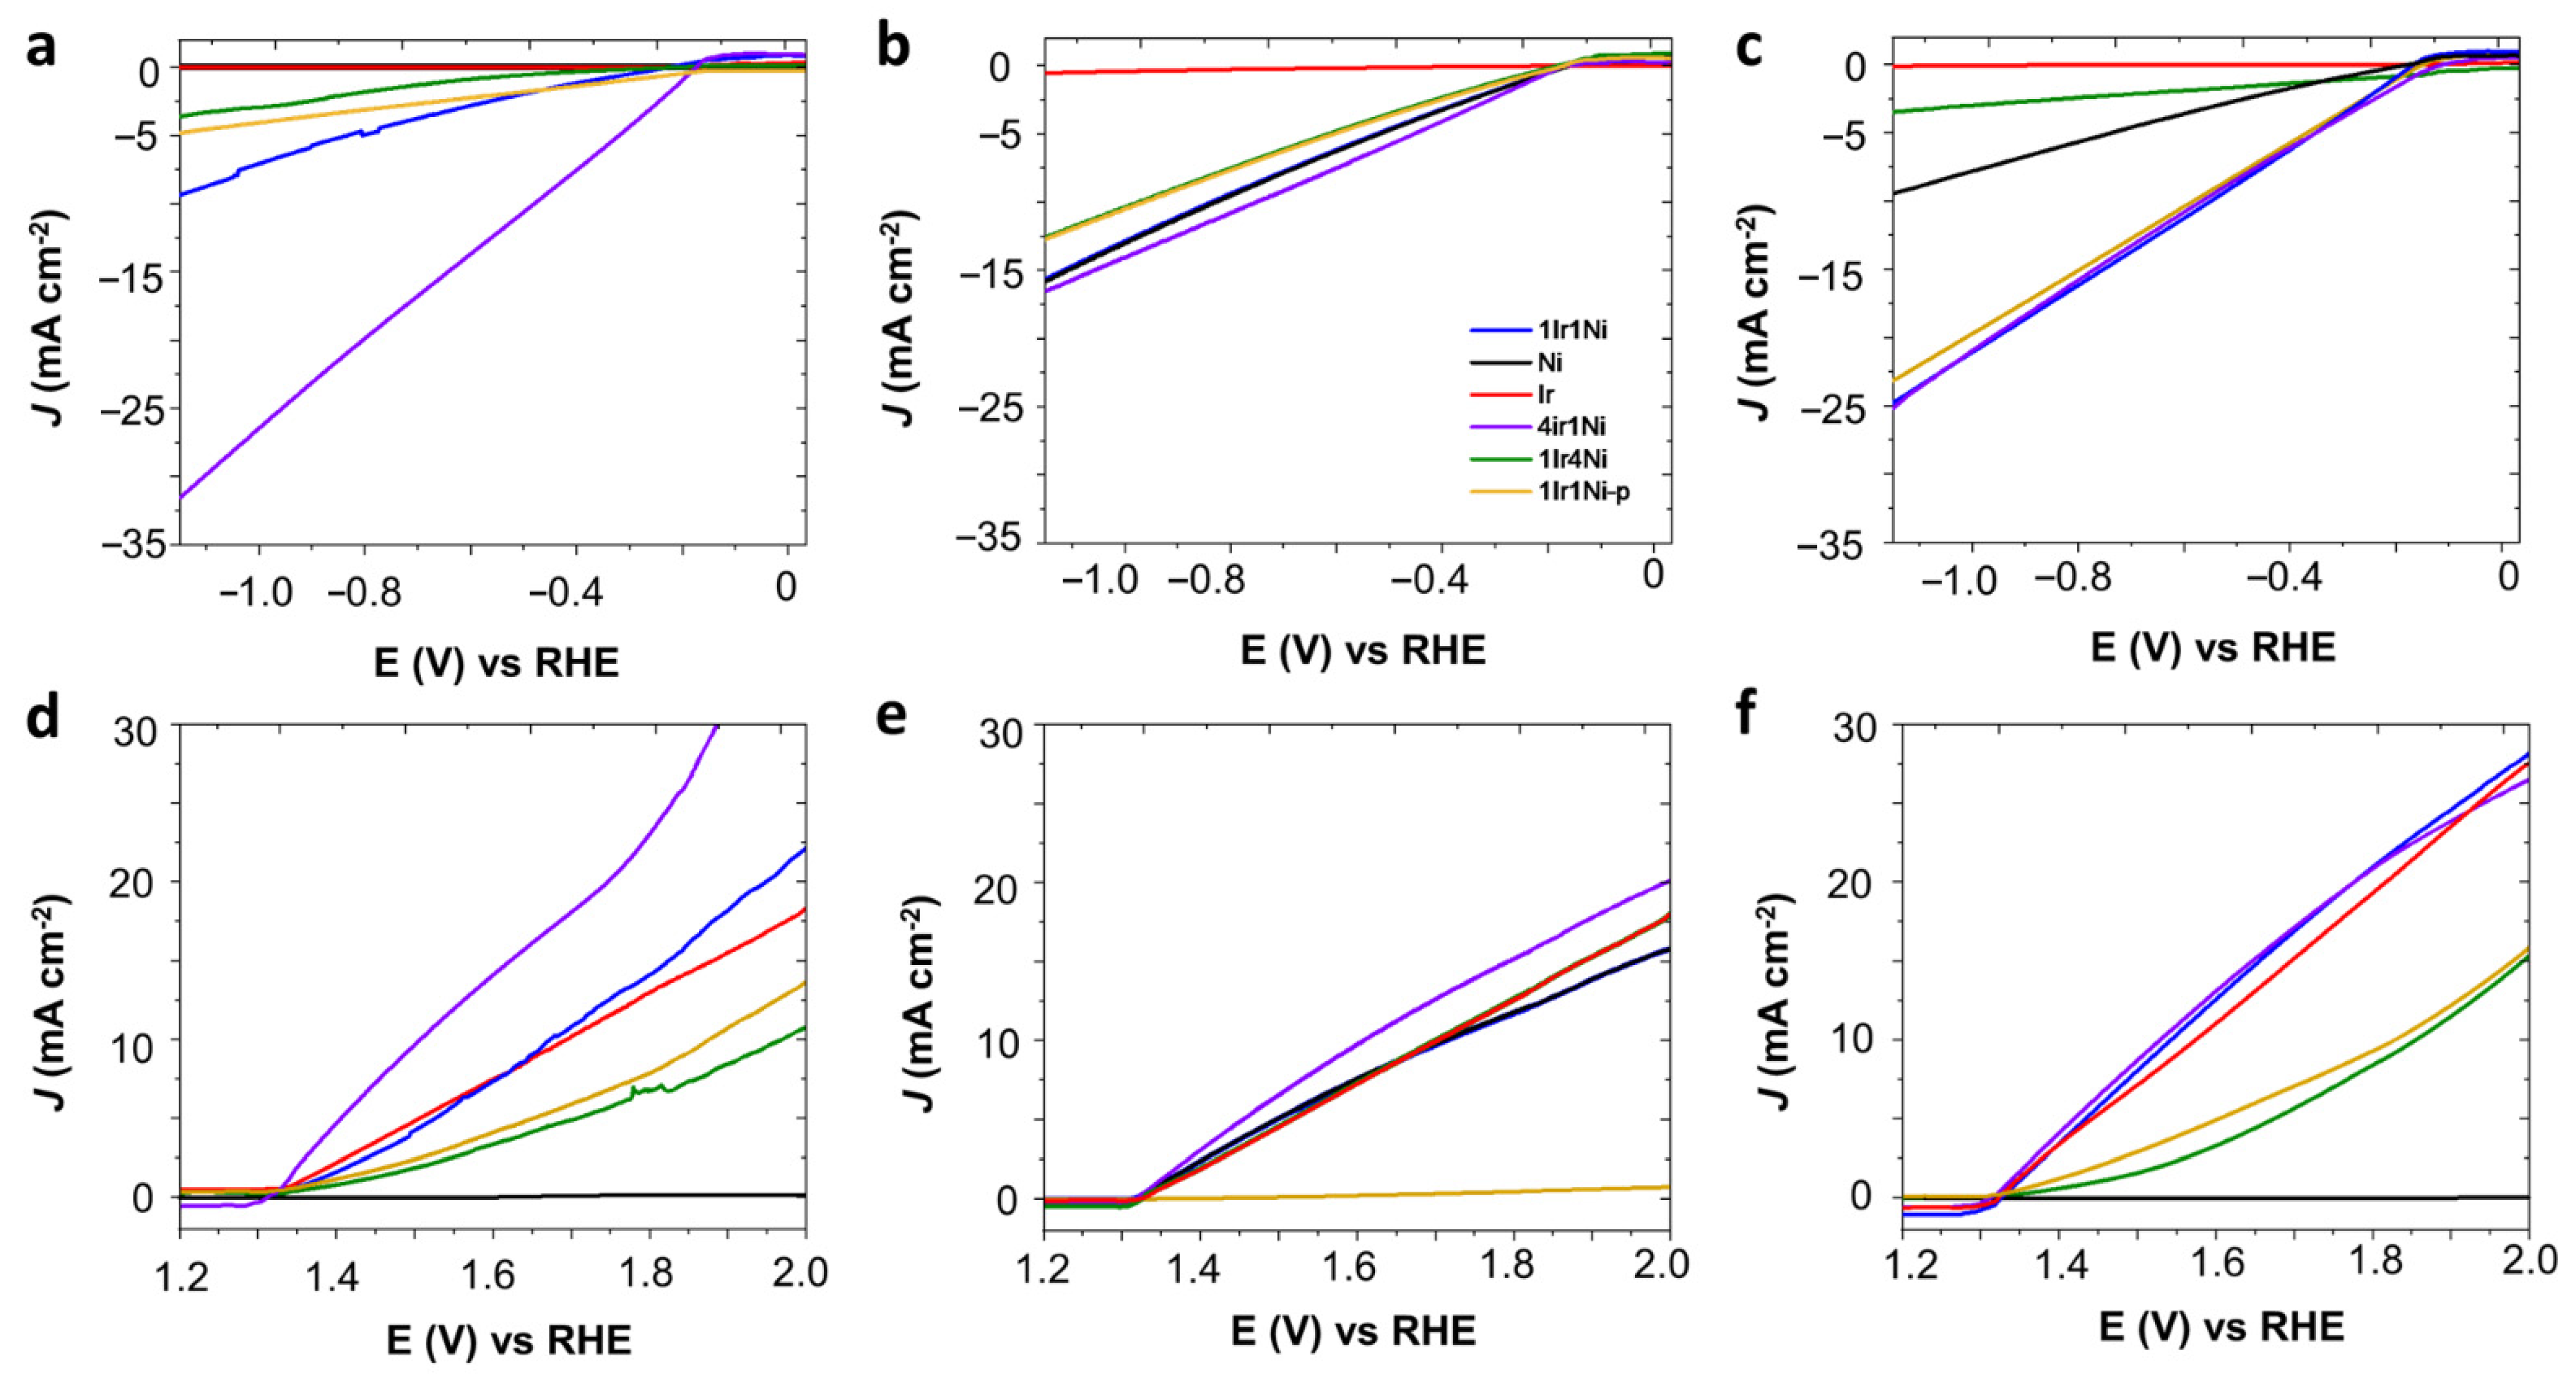
Metal and alloys of Ir and Ni on the AC prepared in this study were initially evaluated to determine their hydrogen (HER) and oxygen (OER) evolution reaction, as shown in
Figure 1. Working pH has more impact on electrocatalysis than other types of catalysis. Hence, activity was tested in alkaline, neutral, and acidic media under a light intensity of 100 mW cm
−2 (
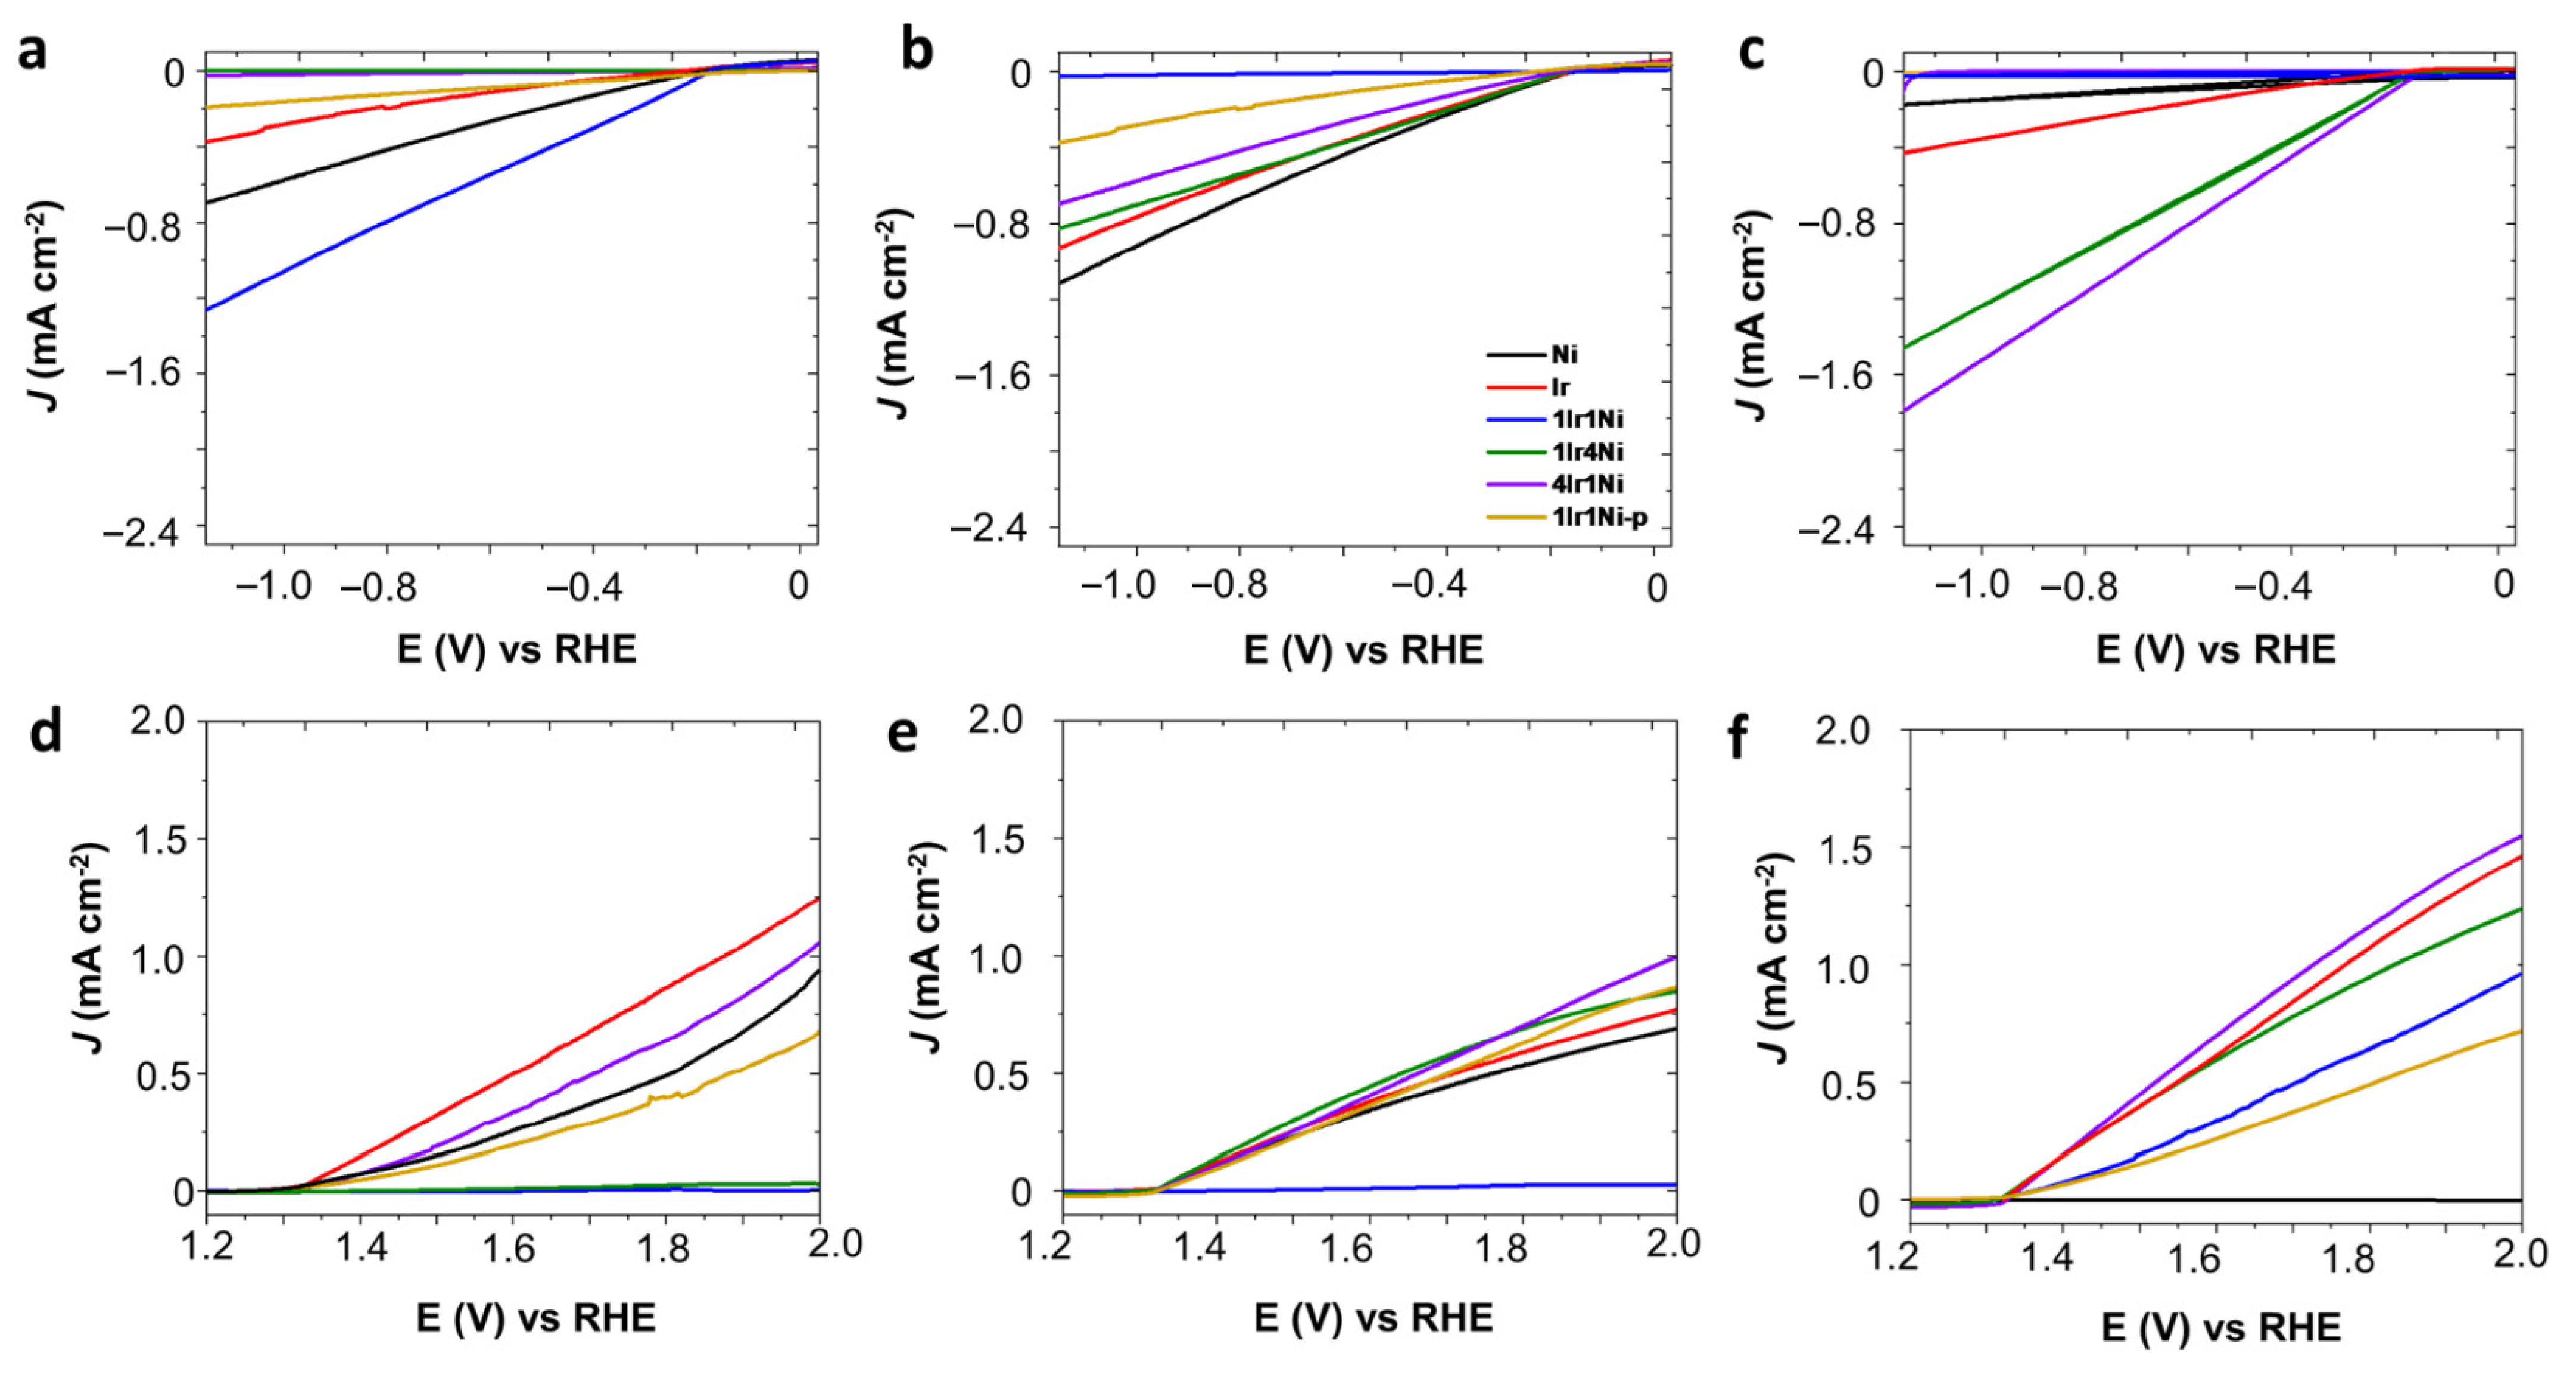
Figure 1a–f). The dark counterparts of the light-mediated electrolysis showed a far lower current density for each respective catalyst for any given potential value (
Figure 2a–f). Hence, to improve clarity and assist in easy interpretation, only the current density values of the light-assisted system are shown in
Figure 1a–f. It is evident from
Figure 1a–c that, regardless of the nature of the electrolyte, Ir@AC showed the least activity towards hydrogen evolution, with it not exceeding −1 mA cm
−2 at −1.16 V (vs. RHE). In the NaOH medium, the HER activity was significantly higher with the use of alloy combinations compared to that obtained with single metals (
Figure 1a). The highest values obtained among the studied materials were recorded with the 4Ir1Ni@AC catalyst with a current density of −32 mA cm
−2 at −1.16 V. This value was more than eight-fold higher than that obtained for the 1Ir4Ni@AC catalyst (−3.7 mA cm
−2 at −1.16 V). This observation is worth further exploration. Ni catalysts are known for their intrinsic activity in hydrogen evolution [
28]. Introducing a low percentage of Ir into Ni to form 1Ir4Ni (20% of Ir and 80% of Ni) improved the hydrogen evolution of Ni by 3%. Conversely, a low level of addition of Ni to the Ir led to a marginal increase in hydrogen reduction compared to that of Ir. Equal weight percentages of Ir and Ni in the AC matrix resulted in a cathodic current density of −9.5 mA cm
−2 at −1.16 V, which was higher than that of the 1Ir1Ni@AC mixture (1Ir1Ni@AC-p, −4.9 mA cm
−2 at −1.16 V) prepared by mixing equal amounts by mass of monometallic Ir@AC and Ni@AC. Alloying has been demonstrated to play an indispensable role in the rational regulation of the band structure of parent metal oxides by modifying the electron distribution in addition to modulating the surface and interface of the electrode and electrolyte, respectively [
32,
33]. The incorporation of Ni has recently been shown to reduce the hydrogen binding energy of Ir by up to 2.5 times the inherent activity of the metal [
33]. This is apparent in the present system in alkaline media, where the hydrogen reduction is visualized in terms of activity enhancement by alloying Ir with Ni. In line with this observation, in the present system, tremendously high improvements were achieved after alloying Ir with Ni, with Ir being the major phase of the oxide alloy. Alkaline electrolyzers are more sought after for hydrogen generation at large scales due to the high purity of the hydrogen gas produced and their impressive long-term stability [
34,
35,
36]. However, it is no secret that alkaline electrolyzers suffer from sluggish reaction kinetics, with electrolyzers’ activity in acid being 2–3-fold higher compared to that in alkaline environments.
Critically comparing the activity of catalysts in acidic media (0.1 M H
2SO
4,
Figure 1c) with that in alkaline (
Figure 1a), it is noted that, except for 4Ir1Ni, lowering the medium pH increased the hydrogen production. In acidic media, Ni metal shows a characteristic catalytic activity of −9.5 mA cm
−2 at −1.16 V, while an ultra-low current density was witnessed in the alkaline electrolyte. The 1Ir4Ni@AC catalyst had similar activity in both acidic (−3.7 mA cm
−2) and alkaline media (−3.6 mA cm
−2). In the acidic media, 1Ir1Ni@AC, 1Ir1Ni@AC-p, and 4Ir1Ni@AC (−23 to −25 mA cm
−2) yielded similar current densities, despite the difference of Ir and Ni in mass ratios and the distribution of the elements across the matrix. It is necessary to evaluate the HER performance of the catalysts on different electrolyte media in order to discover the descriptors that govern the HER activity [
37]. In the neutral electrolyte, Ni@AC and 1Ir4Ni@AC demonstrated higher HER current densities than those seen in acidic and alkaline media. In the case of 1Ir4Ni@AC, its activity was similar in acid and alkali environments, while it was four-fold higher in Na
2SO
4. For Ni, its current density at −1.16 V was improved from near-zero to −9.5 to −15.9 mA cm
−2 by switching the electrolyte from NaOH to H
2SO
4 to Na
2SO
4. Regardless of the electrolyte used, 4Ir1Ni@AC demonstrated the highest activity, as measured by the current density, among the metal and alloy combinations studied. Nevertheless, 4Ir1Ni@AC showed higher activity in alkaline media (−32 mA cm
−2) than in acidic (−24.8 mA cm
−2) or neutral (−16.7 mA cm
−2) media. Hence, 4Ir1Ni can be described as being active in a wide pH range for HER under the illumination of light. Irrespective of the recent observations made regarding the importance of surface-adsorbed hydroxyl during the water dissociation step, it has been proven that H
ads plays a key role [
38]. It is anticipated that different trends will be observed in different electrolytes. For example, in photoelectrocatalysis, the first step involves generating a photovoltage upon absorbing the light and electrocatalyst and then employing this voltage to drive the respective HER reaction. In addition to alloy molar ratio modulation and the corresponding electronic structure, the photovoltage generated in each scenario varies as the electrolyte is switched, contributing to the different electrolyte/electrode interface interaction effects.
In the broader context, oxygen evolution (OER) under light illumination takes place in a few steps. Initially, solar absorption by the metal (Ir or Ni) or alloy (IrNi) oxide center of the catalyst generates holes, which are transferred to the bulk electrolyte in the femto-second scale and dissociate water to form hydroxyl ions. Oxygen molecules are finally generated at the triple-phase (which is the boundary line between the solid electrode, liquid electrolyte, and gaseous product) as a result of a series of bond-making and breaking processes.
IrO
2 is known for its inherent OER activity, particularly in acidic media [
39]. In this study, we utilized the catalyst in a low loading with an AC matrix and driven by solar absorption under a light intensity of 1 sun. In line with the literature precedent, we achieved a result of 20.04 mA cm
−2 for Ir@AC in 0.1 M H
2SO
4 at 1.8 V (vs. RHE) (
Figure 1f), while the result was lower yet similar in NaOH (13.5 mA cm
−2) and Na
2SO
4 (13 mA cm
−2) electrolytes. In acidic electrolyte, the incorporation of Ni in Ir enhanced the intrinsic activity of Ir by 7.8% when Ir was a major phase. Conversely, the activity of Ir was reduced by 55.8% when the major component was Ni (8.84 mA cm
−2 with 1Ir4Ni@AC). Ir and Ni in equal weight ratios demonstrated a higher current density, similar to that obtained for 4Ir1Ni@AC (21.6 mA cm
−2 at 1.8 V), while in the case of a chemical mix, the well-combined physical mixture gave a much lower current density of 9.7 mA cm
−2 at 1.8 V. In the alkaline media (
Figure 1d), Ir@AC and 1Ir1Ni@AC demonstrated similar activity (~13.5 mA cm
−2), while 4Ir1Ni@AC yielded a superior activity of 24.38 mA cm
−2. It is noteworthy that in both acidic and alkaline media, Ni@AC exhibited the least performance of <1 mA cm
−2 at 1.8 V, while in neutral media, it was the physical mixture of 1Ir1Ni@AC that achieved the least activity. A detailed evaluation of the different metal and alloy combinations that can be used for HER and OER in different electrolyte media provided important information on the supreme photoelectrocatalytic activity of 4Ir1Ni@AC for overall water splitting. Thus, it is important to analyze the characteristics of 4Ir1Ni@AC compared to those of other metals and alloys. Observations showed evidence that the d band center of 4Ir1Ni was in a favorable position to drive the HER and OER at high rates.
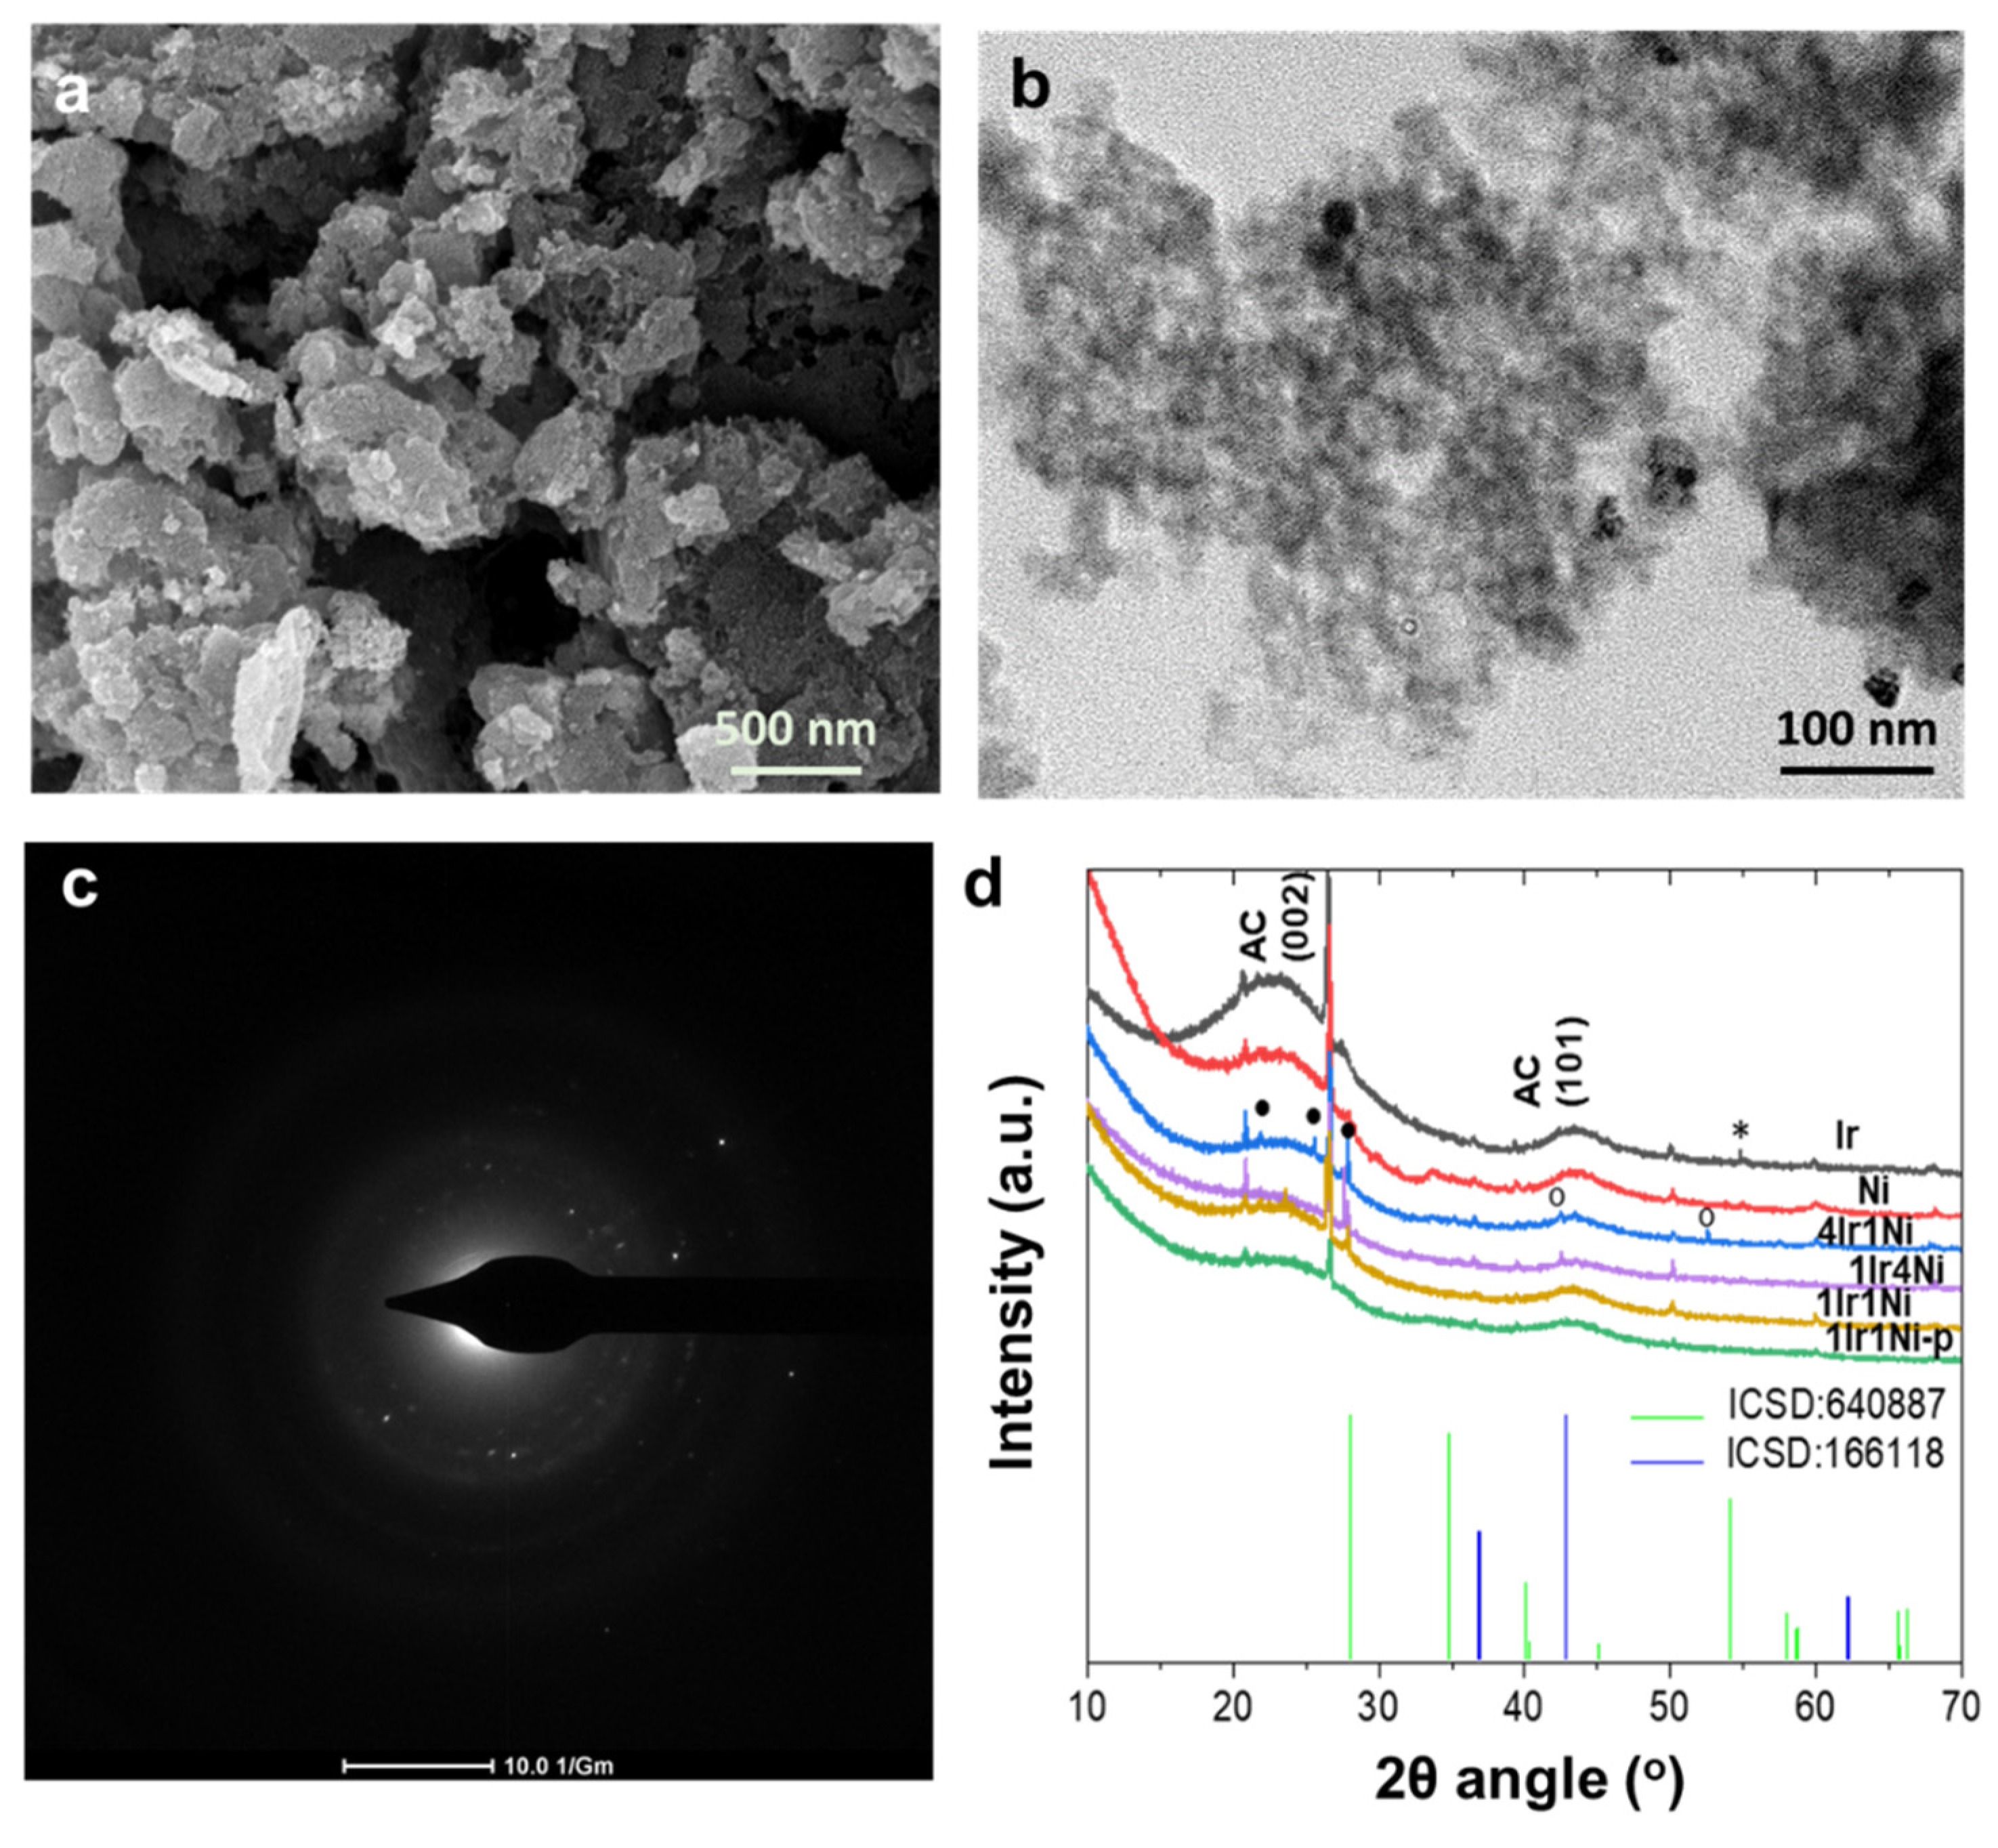
In order to understand the outstanding photoelectrocatalytic behavior of the 4Ir1Ni@AC catalyst, the characteristics of the materials were evaluated by several different means. Morphological analysis by SEM revealed a similar appearance of all samples under the same magnification, highlighting only the porous activated carbon matrix (
Figure 3a and
Figure S1). Activated carbon is known to be amorphous, with a large internal surface area and pore volume. Higher magnification under TEM, however, showed nanoparticles that were uniformly distributed across an AC matrix (
Figure 3b and
Figure S2). The selected area electron diffraction (SAED) patterns observed in the diffraction rings of TEM indicate the partial crystallinity of 4Ir1Ni (
Figure 3c). Apart from 4Ir1Ni@AC, Ni was shown to be crystalline (
Figure S3). The analysis of the elemental composition by EDX affirmed the relative weight ratios of Ir and Ni in the alloy combinations to be within reasonable limits of the feed mass ratios (
Table S1, Figure S4), whereas the Ir to Ni relative weight ratios were 1.2 ± 0.1:1 in 1Ir1Ni@AC, 1:3.5 ± 0.2 in 1Ir4Ni@AC, and 4.2 ± 0.1:1 in 4Ir1Ni@AC. Powder X-ray diffraction patterns of the Ir and Ni metal and alloy @AC samples showed the apparent camouflaging of the Ir- and Ni-related peaks by a broad peak spanning an angle range of approximately 40 to 47° 2θ related to the AC moiety (
Figure 3d). However, in the Ir-Ni alloys, there were three peaks in the 20–30° range, specifically at 21.79°, 25.70°, and 27.92°, which were attributed to diffractions arising from the IrNi alloy particles [
25,
33]. It is noteworthy that alloy diffractions were more pronounced in 4Ir1Ni@AC than in other combinations. In addition, with 4Ir1Ni@AC, two additional peaks located at an angle of 43.29° for the (200) plane of NiO and 51.86° for the (200) plane of Ni can be seen. The 1:1 mixture of Ir and Ni prepared with a well-combined physical mixture exhibited the weakest diffraction pattern. In the Ir@AC (211) plane, the diffraction of IrO
2 was visible at 54.77°. Hence, it is understood that 4Ir1Ni@AC possesses a higher level of crystallinity compared to other materials used in this study.
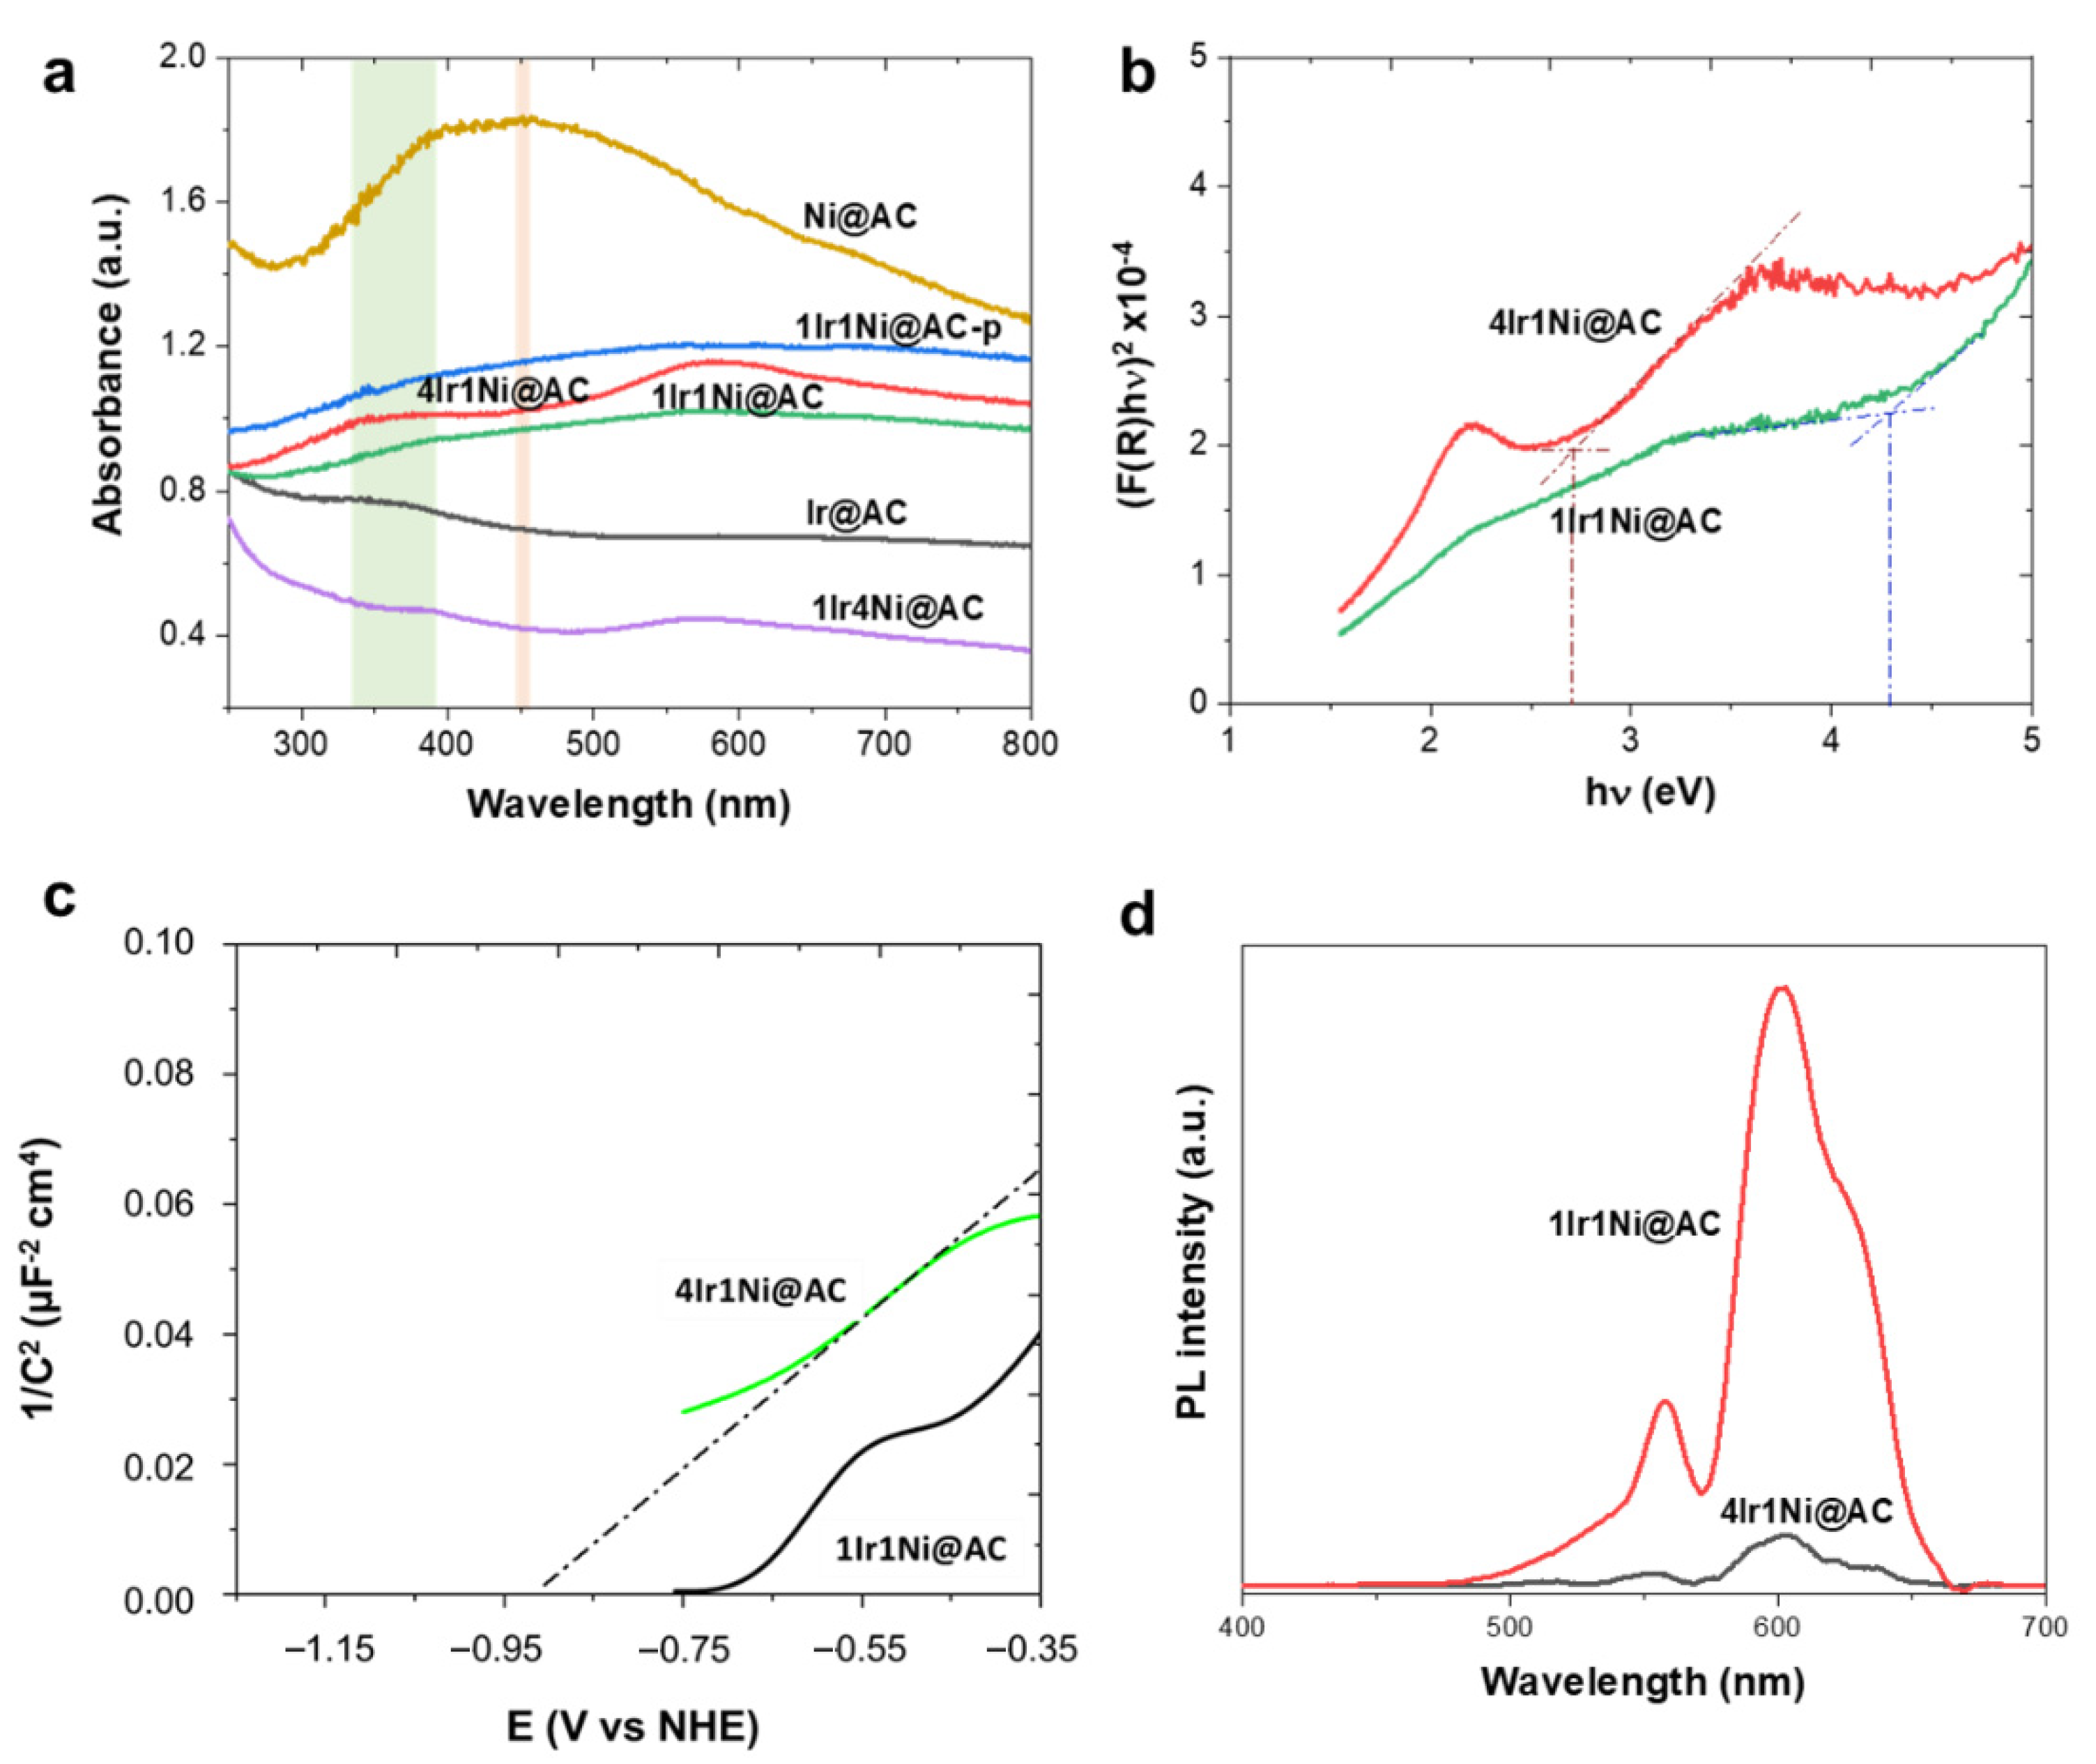
It is apparent from the outstanding edge observed with the 4Ir1Ni@AC catalyst that the light absorption and the resultant bandgap of the passive layer play definite roles in its superior activity. In this aspect,
Figure 4a demonstrates the diffuse reflectance light absorption spectra of each metal and alloy combination. The presence of oxygen vacancies is known to enhance the light absorbance in the visible region. This is expected in 4Ir1Ni@AC, whose convincing sub band excitation can be seen in the visible region of the UV–visible spectra. Two resolved peaks can be seen: one at the UV–visible boundary and the second being an intense peak in the visible region. The UV-visible spectrum of Ir@AC was broad with an ambiguous peak at 330–380 nm range, and Ni@AC showed a wide, well-defined curved peak at 455 nm [
40]. The enhanced light absorption in the visible region plays an undeniable role in photovoltage generation in the visible region upon irradiance with simulated solar light with a 100-mW cm
−2 intensity. Additionally, Raman tests was performed on the materials, and the intense Raman signals arising from the activated carbon support (
Figure S5a) limit the recognition of Raman signals of Ni center (460 cm
−1, 530 cm
−1 for Ni-O bond) and Ir center (360 cm
−1, Ir-O bend). However, the Raman signals of the 4Ir1Ni@AC material shift to a lower frequency region compared to the singular systems as shown in
Figure S5b, suggesting the existence of oxygen vacancies in the material. Since 4Ir1Ni@AC and 1Ir1Ni@AC demonstrated the best and second-best photoelectrochemical water splitting properties, respectively, these two materials were evaluated carefully to identify the origin of the activity. According to the Tauc plot of 4Ir1Ni@AC and 1Ir1Ni@AC given in
Figure 4b, the band gaps were calculated to be 2.70 and 4.19 eV, respectively. Bandgap narrowing was thus witnessed with 4Ir1Ni@AC compared to 1Ir1Ni@AC. A Mott–Schottky analysis was then performed to elucidate the electronic band potentials of the two (
Figure 4c). The resultant flat band potentials were found to be −0.92 V for 4Ir1Ni@AC and −0.70 V for 1Ir1Ni@AC (vs. NHE). Additionally, it is worth mentioning that both the 4Ir1Ni@AC and 1Ir1Ni@AC electrodes exhibited positive slopes indicative of n-type semiconductor behavior. The conduction band minimum is usually in 0~0.2 V, higher than that of the flat band potential for n-type semiconductor materials [
41,
42,
43] and, in this regard, it can be set to 0.1 V considering the effective mass (electron) and charge carrier concentration. The conduction band minimum was thereby calculated to be −1.02 V and −0.80 V for 4Ir1Ni@AC and 1Ir1Ni@AC, respectively. The conduction band edge of 1Ir1Ni@AC was relatively more downshifted than 4Ir1Ni@AC. However, the valance band maximums were found to be 1.7 V (4Ir1Ni@AC) and 3.5 V (1Ir1Ni@AC) in the assessment of the band gap values obtained from the Tauc plot (
Figure 4b), and the conduction band minimum values obtained from the Mott–Schottky plots (
Figure 4c). Therefore, it can be concluded that the valance band edge of 4Ir1Ni@AC is relatively rising compared to 1Ir1Ni@AC. Comparing the Mott–Schottky slopes, 1Ir1Ni@AC was slightly steeper than that of 4Ir1Ni@AC. This lower Mott–Schottky slope reveals a higher donor density in the 4Ir1Ni@AC material, which may be more ascribed to oxygen vacancies [
44,
45]. A higher donor density improves the charge carrier separation and transport, which directly causes an increase in charge collection efficiency and a drop in charge recombination. Light-induced photoelectrochemical activity analysis is not complete without identifying the influence of charge recombination, which plays a crucial role in the transient photocurrent response. Regardless of the higher absorbance of light by NiO@AC (
Figure 4a), it had a lower activity, indicative of a possible impact of charge recombination. Photoluminescence (PL) spectra were measured for metal and alloy materials upon excitation with 350 nm light at room temperature. From the general trend, the luminescent spectra had two emissions in the visible region, one centered at 557 nm and the other at 601 nm, at varying intensities (
Figure 4d). The first emission at 557 nm (equivalent to a 2.22 eV photon energy) can be attributed to the near band edge (NBE) emission caused by the room-temperature free excitations in the region [
46]. A higher luminescence intensity is indicative of a higher radiative charge recombination rate, which has a detrimental effect on the photo-induced reaction. The 4Ir1Ni@AC showed less intense PL peaks compared to the pattern of 1Ir1Ni@AC, which further confirms the enhanced interfacial interaction in the case of the 4:1 Ir to Ni ratio. The improvement in interfacial interaction at the heterojunction promoted the photogenerated charge carrier separation of electrons and holes and sequentially suppressed the charge recombination. The weak photoelectrochemical behavior of NiO was apparent, with significantly more intense PL emissions (
Figure S6).
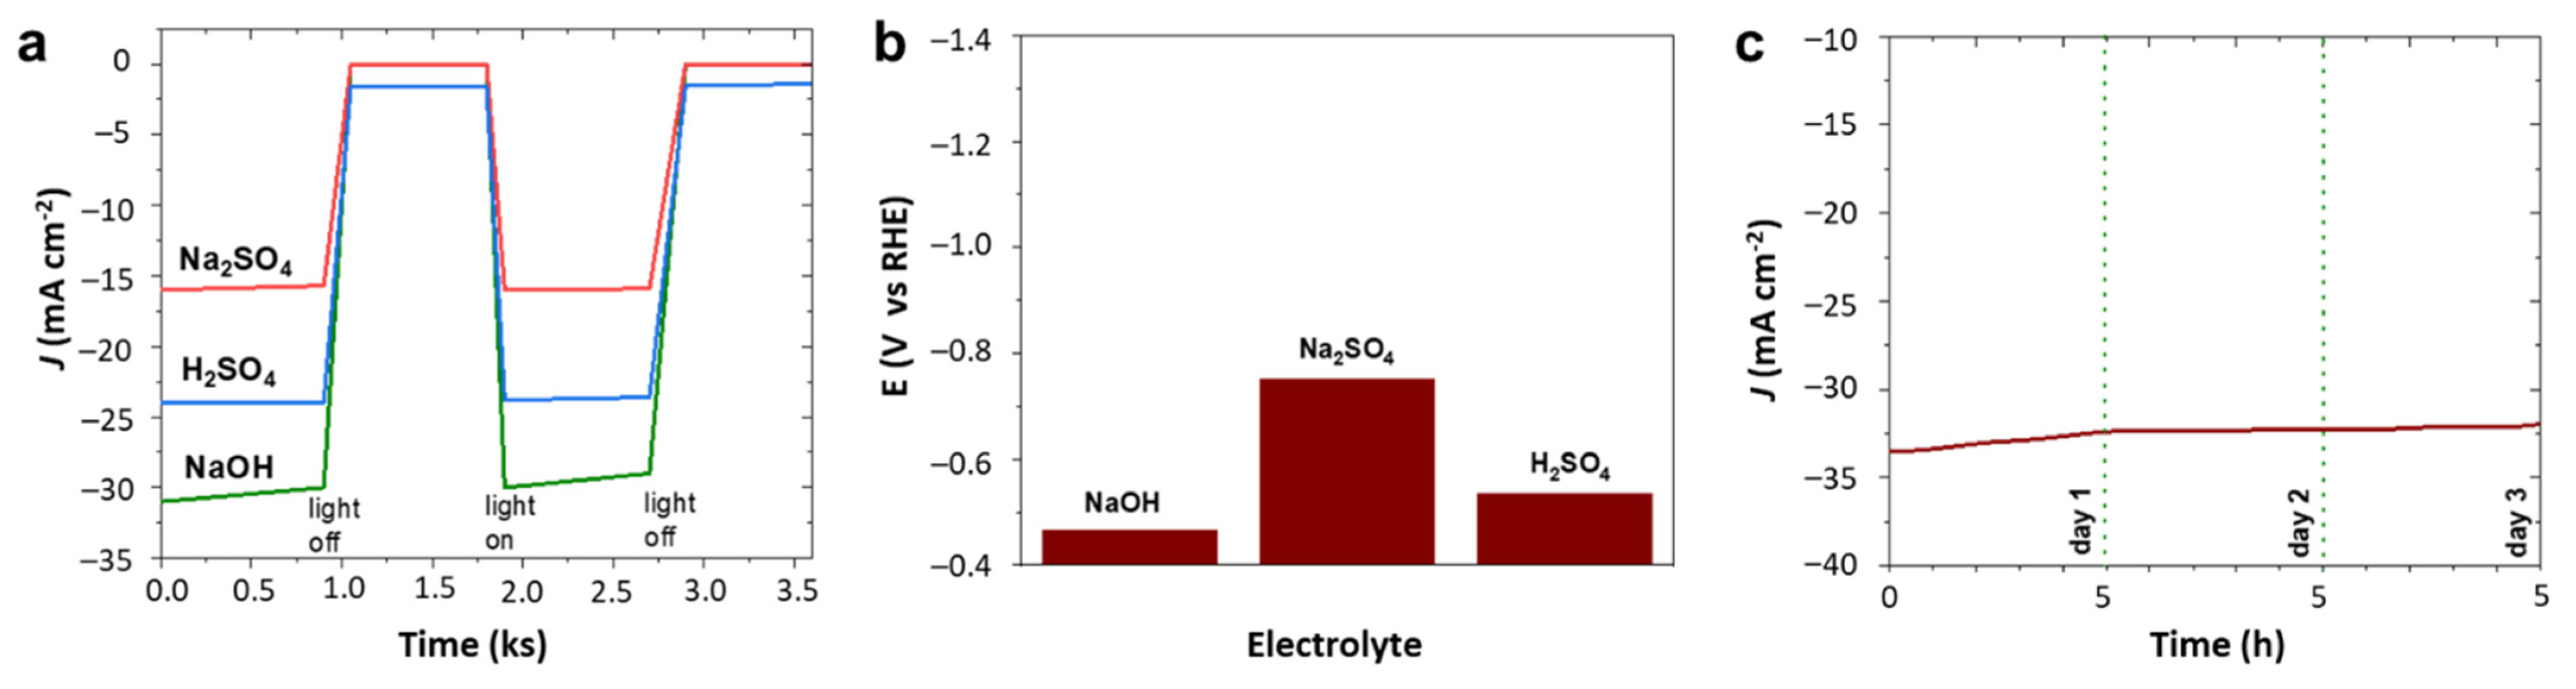
The hydrogen evolution activity of 4Ir1Ni@AC was compared between electrolytes with different pHs. As shown in
Figure 1a–c and the chronoamperometry tests in
Figure 5a, the photo-assisted electrochemical hydrogen evolution of 4Ir1Ni@AC was further confirmed by chronoamperometry in NaOH and H
2SO
4. Regardless of the extent, finding a light-absorbing electrocatalyst material that can perform HER over a wide pH range is very important with respect to water electrolysis. This variation in activity is evident in
Figure 5b, where the potential is displayed when the system delivers a current density of −10 mA cm
−2. The corresponding Tafel plot for 4Ir1Ni@AC, given in
Figure S7, shows a Tafel slope of 43.2 mV dec
−1 for NaOH, 45.4 mV dec
−1 for Na
2SO
4, and 49.7 mV dec
−1 for H
2SO
4, respectively. The values are higher than the 28.1 mV dec
−1 reported for MOF-supported IrNi in another study on HER in 0.5 M H
2SO
4 [
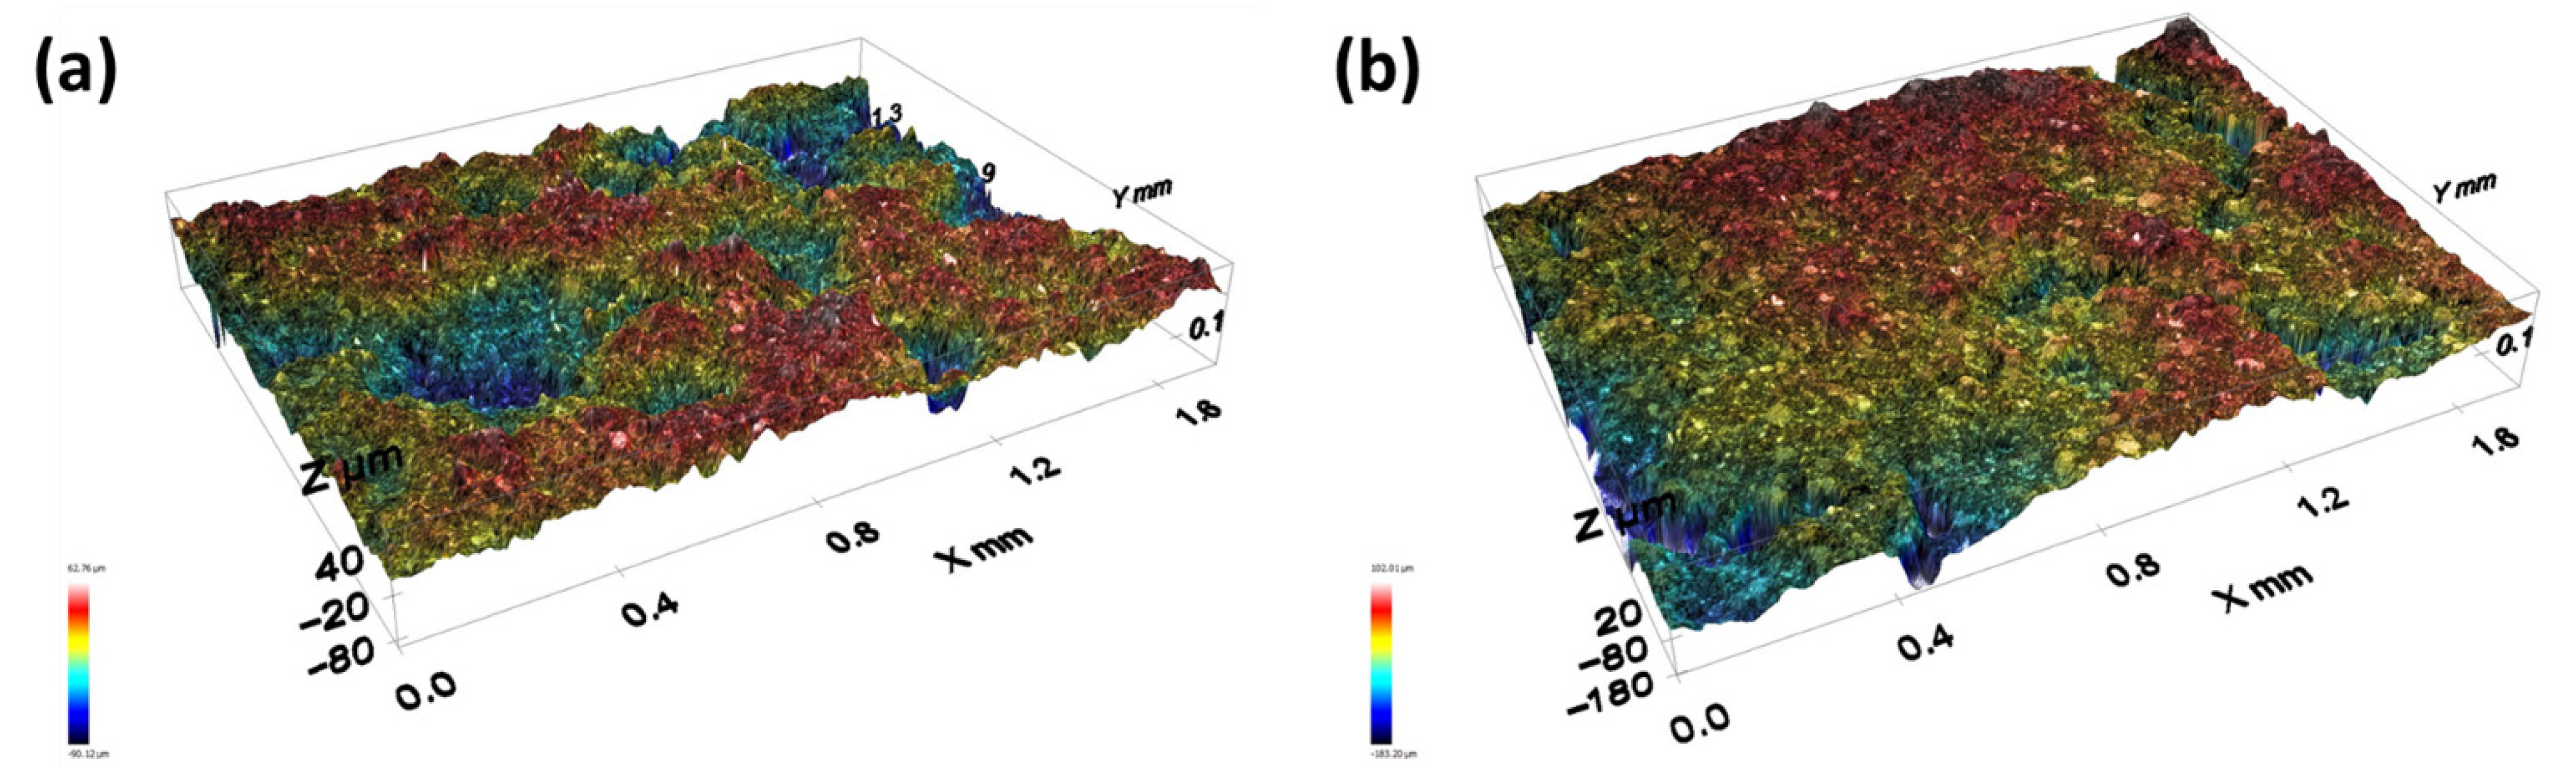
47]. Considering the industrial favor of alkaline electrolyzes, the long-term stability of the system was assessed in 0.1 M NaOH electrolyte for a duration of 5 h using chronoamperometry at −1.16 V over a 3-day period, accounting for 15 h of operation altogether. The cathodic current density did not decrease over the period of the test, indicating persistent hydrogen evolution activity over time as shown in
Figure 5c. A current density range of −34.5 mA cm
−2 to −33 mA cm
−2 was seen throughout the test. The profilometry assessment of the 4Ir1Ni@AC coating after the stability test revealed the good adhesion of the coating to the FTO substrate, with the roughness parameter changing from 22.31 µm for the fresh coating to 24.51 µm for the coating after 15 h of operation (
Figure 6). Between the test runs, the electrode was rinsed clean with running DI and dried in a vacuum oven at 40 °C.
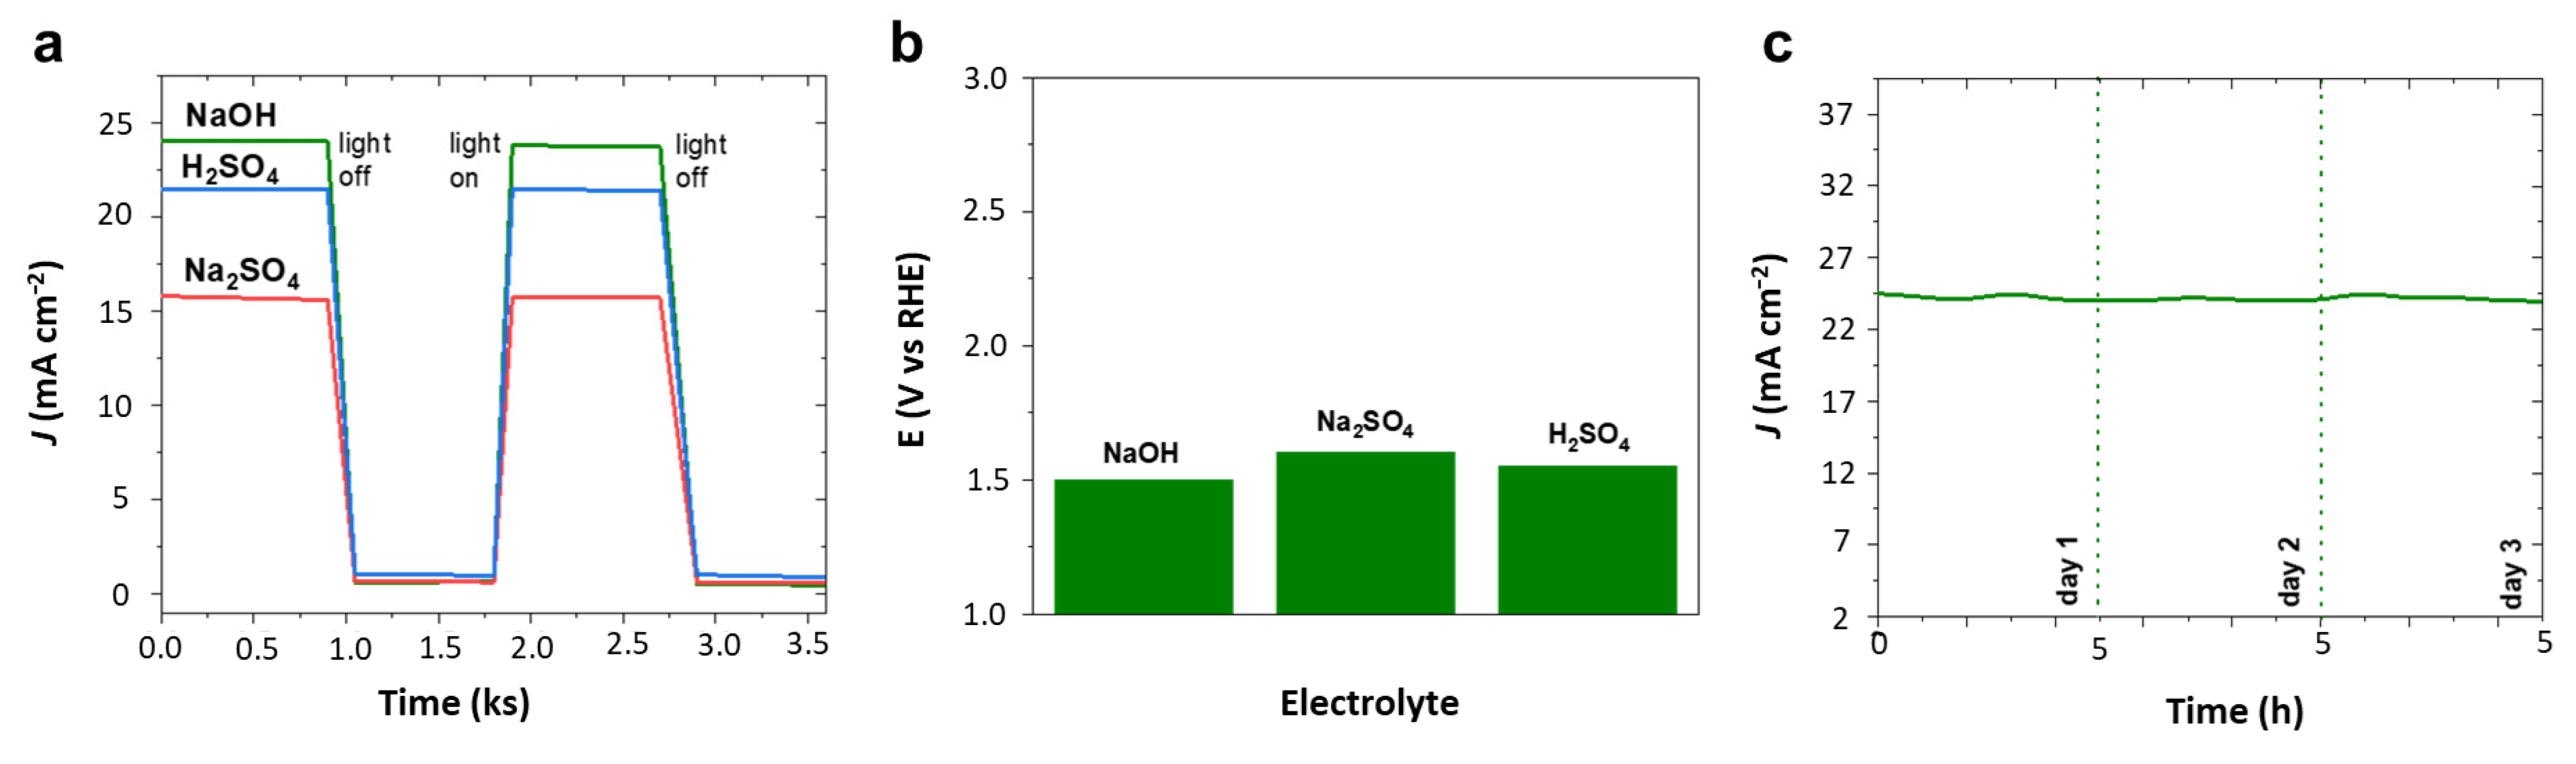
Similar to chronoamperometry in
Figure 5a for hydrogen evolution, oxygen evolution assessed with intermittent light exposure given in
Figure 7a clearly demonstrated the oxygen evolution potential of 4Ir1Ni@AC in alkaline and acidic media in particular with assured light-induced electrochemical activity. Electrochemical impedance (EIS) analysis showed a wider arc radius for the light-off reaction and a depressed semicircle for the light induced reaction in 0.1 M Na
2SO
4 solution. The lower arc radius shown in
Figure S8 for light on reaction is due to the efficient interfacial charge transfer facilitated by lower interfacial layer resistance resulting in improved reaction dynamics. However, the oxygen evolution potential measured at current density of 10 mA cm
−2 (
Figure 7b) for 4Ir1Ni@AC exhibited a pattern similar to that observed for HER. The 4Ir1Ni@AC required a higher potential to reach the same current density when it was in the Na
2SO
4 electrolyte, while the difference between NaOH and H
2SO
4 was negligible. Despite the slight variation, the overpotential of OER with 4Ir1Ni@AC catalyst seen in this study was visibly lower than that observed by Lv et al. [
33] with IrNi nano flowers in another study. The related Tafel slopes were found to be lower than those reported for IrNi nanocluster catalyst in KOH electrolyte media [
48]. As shown in the Tafel plot in
Figure S9, the 4Ir1Ni@AC exhibits an OER Tafel slope of 21.75 mV dec
−1 in NaOH, 32.75 mV dec
−1 in Na
2SO
4, and 25.04 mV dec
−1 in H
2SO
4, respectively. The chronoamperometric curve of 4Ir1Ni@AC was very stable in NaOH, with a drop in current density of only 2 mA cm
−2 seen after 15 h of durability evaluation carried out at 1.8 V by 5 h operations over three days (
Figure 7c).
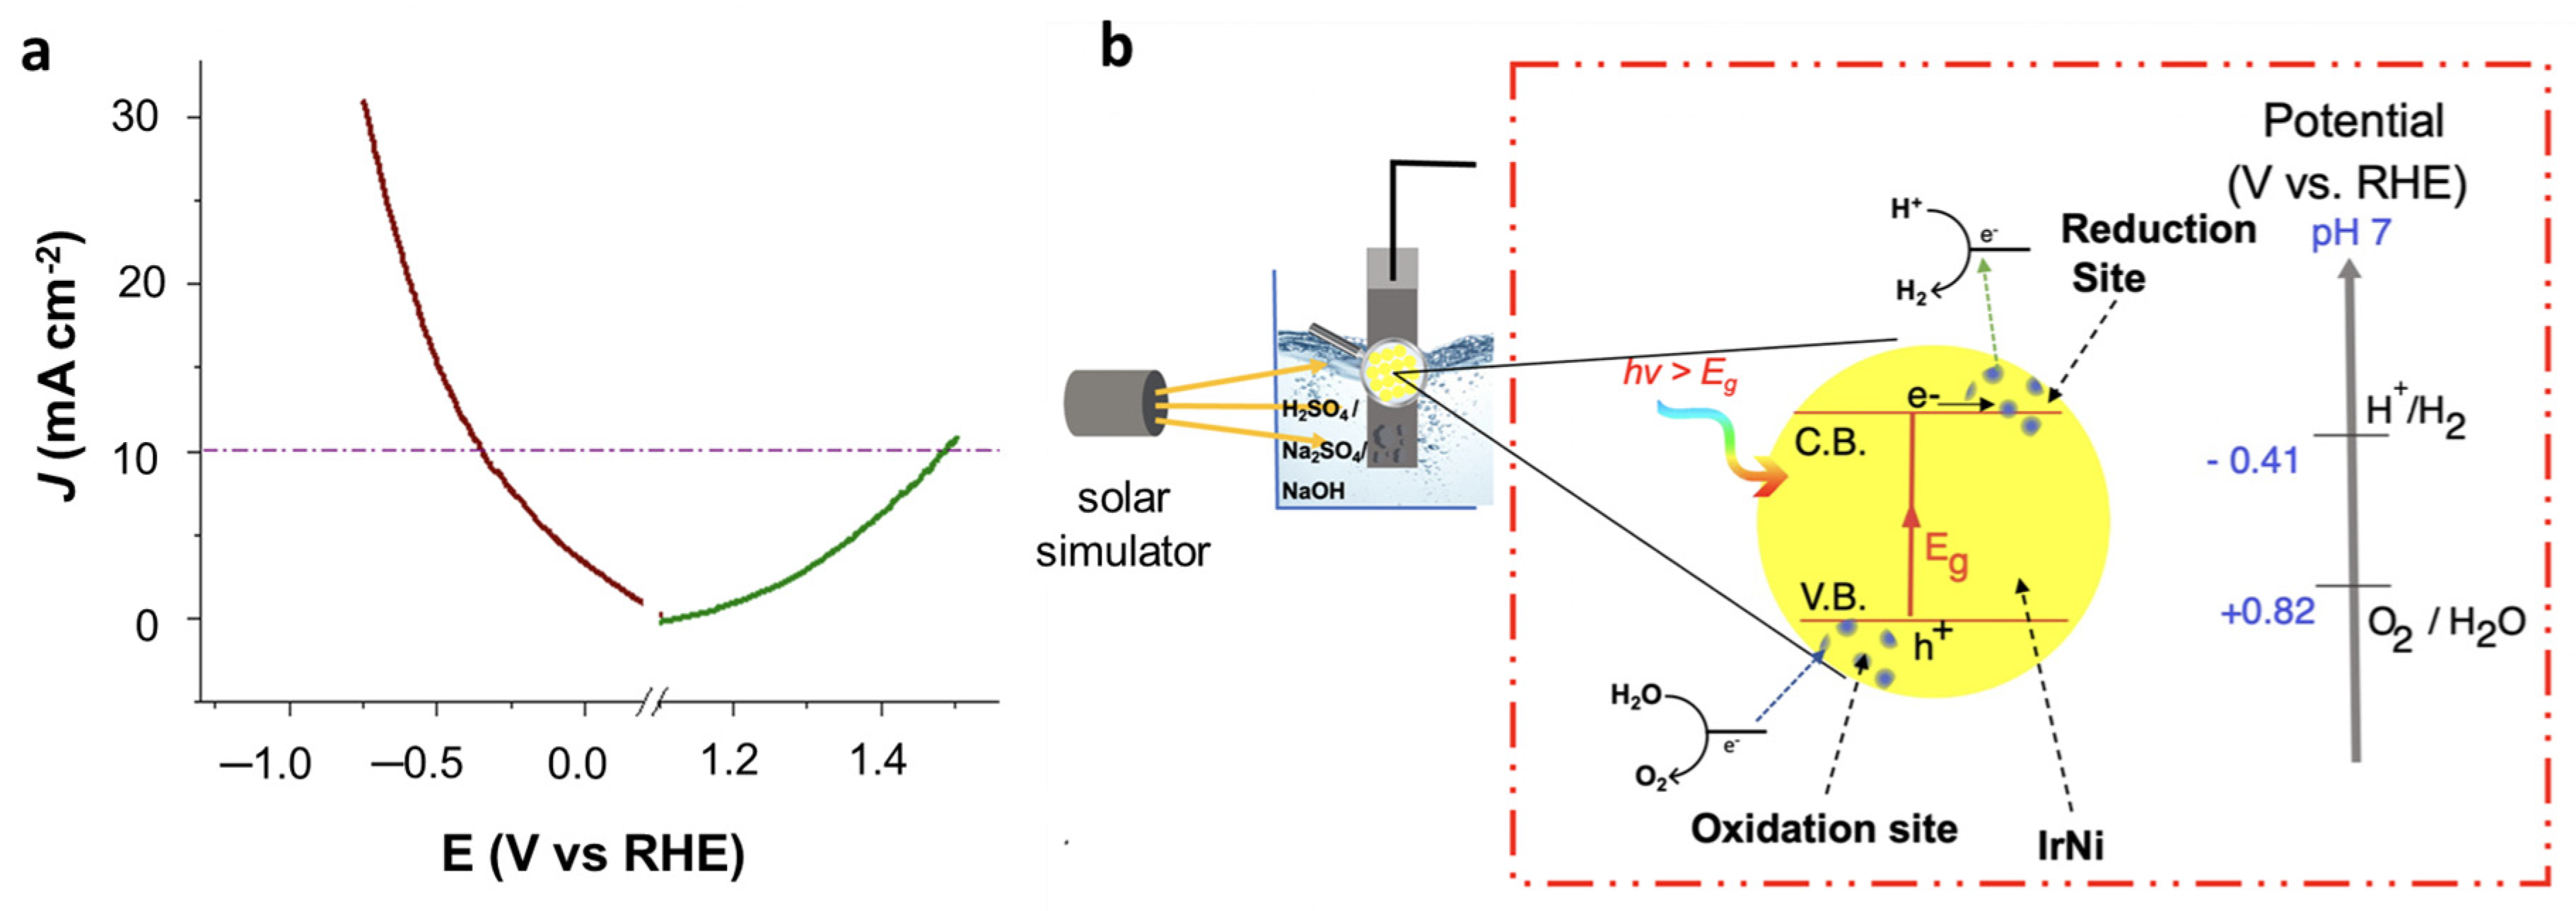
To assess the overall water splitting ability of the 4Ir1Ni@AC electrocatalyst under one sunlight irradiation of 100 mW cm
−2 intensity, a water-splitting experiment was carried out with two 4Ir1Ni@AC film electrodes as the cathode and anode materials, respectively.
Figure 8a represents the overall cell function measured by linear sweep voltammetry in positive and negative potential, with the mechanism (
Figure 8b). It is observed that at a current density of 10 mA cm
−2, hydrogen evolution overpotential was observed to be −0.43 V and oxygen evolution overpotential was 0.25 V, resulting in an overall cell voltage of 1.94 V. The HER overpotential is high compared to other Ir-based materials for overall water splitting, as given in
Table S2. However, the OER overpotential achieved by 4Ir1Ni@AC is much lower than the values reported for Ir-based electrocatalysts. The charge transfer processes occurring on IrNi nanoparticle is further illustrated in
Figure 8b with respect to oxidation and reduction sites upon solar illumination. The reported HER overpotential is as low as 23 mV at a current density of 10 mA cm
−2 using commercial 20% Pt/C and Ru/C catalysts [
49,
50], but considering the low mass loading of the active material (Ir and Ni) in the studied catalysts, the performance is promising. In fact, the overall cell voltage is comparable to the 1.56 V reported for non-precious metal-based CoNiO
2@rGO supported on Ni foam [
51]. Hence, the potential of using IrNi alloys in a cost-effective activated carbon support with an appropriate Ir-to- Ni ratio for use in an electrolyte (not primarily limited to alkaline media) was demonstrated.
3. Materials and Methods
3.1. Materials
Ni(NO3)2·6H2O (99.9%), IrCl3·xH2O (reagent grade), activated carbon (AC), poly(vinylidene fluoride) (PVDF, Mw ~534 k), NaBH4 (98%) and N-methyl-2-pyrrolidone (NMP, 99%), NaOH (98%), and Na2SO4 (99%, anhydrous) were purchased from Sigma-Aldrich and used in the experiments without additional purification. Acetylene carbon (MTI company, St. Richmond, CA, USA), H2SO4 (98%, BDH), ethanol (99%, ISOLAB), and acetone (ISOLAB) were used. For all experiments requiring water, deionized water (DI) from a Mill1 Q-type water purification system was utilized, and the resistivity of the deionized water was ≥18.2 MΩ cm.
3.2. Synthesis of Metal and Alloys Supported on Activated Carbon
Ni@AC: A total of 500 mg of AC powder was dispersed in 100 mL of DI water in a clean, dry 250 mL beaker. The solution was kept under stirring for 20 min. Then, the desired amount of Ni salt (e.g.: 74 mg for 3% of Ni@AC) was weighed according to the weight percentage of Ni expected in the finally prepared Ni@AC catalyst powder and introduced into the AC dispersion. Meanwhile, 20 mL of freshly prepared 0.01 M NaBH4 solution was introduced dropwise into the solution under vigorous stirring. Stirring was continued for another 30 min, and the mixture was aged at room temperature for 24 h. Catalyst powders were then separated and washed with DI 3 times and finally with ethanol under centrifugation. Catalyst samples were dried in a vacuum oven at 60 °C for 24 h, followed by annealing at 150 °C for 4 h in a muffle furnace.
Ir@AC: A total of 500 mg of AC powder was dispersed in 100 mL of DI in a dry clean 250 mL beaker. The solution was kept under stirring for 20 min. A total of 0.01 M of an aqueous solution of IrCl3·xH2O was prepared in a 250 mL volumetric flask. Then, the desired volume of Ir salt (7.5 mL IrCl3·xH2O solution for 3% of Ir@AC) solution was introduced according to the weight percentage of Ir expected in the finally prepared Ir@AC catalyst powder. Meanwhile, 20 mL of 0.1 M NaBH4 solution was freshly prepared and added dropwise into the solution under vigorous stirring. The stirring was continued for another 30 min, and the solution was aged at room temperature for 24 h. Aged catalyst powders were washed with DI 3 times and finally with ethanol. Catalyst samples were dried in a vacuum oven at 60 °C for 24 h, followed by annealing at 150 °C for 4 h in a muffle furnace.
IrNi@AC: The alloy catalysts of Ir and Ni were fabricated in three different elemental ratios, namely, 4:1, 1:1, and 1:4, respectively. The percentage was stated based on Ir and Ni centers in the feed composition. The synthesis procedure used was similar to that of mono metal@AC, except for the addition of desired amounts of both Ni(NO3)2 salt in powder form and Ir3+ solution at the same time before the introduction of NaBH4. The salt composition in the feed used to fabricate a 1:1 ratio of Ir:Ni was 12.5 mL of 0.01 M of IrCl3·xH2O (5 mL for 1:4 and 20 mL for 4:1) solution and 124 mg of Ni(NO3)2 (198.4 mg for 1:4 and 49.6 mg for 4:1). The total IrNi composition was maintained at 3% of the weight of the AC support at the beginning, with the relative ratio between Ir:Ni being 4:1 (4Ir1Ni@AC), 1:1 (1Ir1Ni@AC), and 1:4 (1Ir4Ni@AC).
Another 1:1 (1Ir1Ni@AC-p) physical mixture of Ir@AC and Ni@AC was prepared by blending annealed Ir@AC (50 mg) and annealed Ni@AC (50 mg) together in an agate mortar until they were well combined to obtain 100 mg of 1Ir1Ni@AC-p.
3.3. Electrode Preparation
Fluorine-doped tin oxide glass (FTO ~500 nm thick, 8 ohms/square, NSG Group, Ottawa, ON, Canada) was used as the substrate for the electrode. An electrode with dimensions of 3 × 1 cm2 with intended coating dimensions of 2 × 1 cm2 was used. The substrate was cleaned extensively prior to coating by sequential ultrasonic cleaning with acetone, ethanol, and DI for 5 min each, followed by drying under a stream of nitrogen gas.
Coating ink solution preparation: A finely ground mixture of catalyst powder, acetylene carbon, and PVDF powder at an 80:10:10 weight ratio was made into a casting ink of the desired consistency with the use of NMP solvent. The ink was ultrasonically mixed for 1 min to improve the homogeneity and stirred at 800 rpm for 2 h before casting it on FTO glass. The surface of the FTO glass was ensured to be conductive by testing the resistance of each side with a handheld multimeter.
Catalyst-coated FTO glass preparation: A portable vacuum-free spin-coating machine (Ossila, Sheffield, UK) was used to coat the ink on the FTO substrate. One short end of the FTO glass was taped and placed onto a dice with a fitting well size. Spin coating was performed in two steps: firstly, with rotation at 400 rpm for 1 min, followed by rotation at 1200 rpm for 2 min. The FTO electrode with a uniform coating was then dried in a vacuum oven for 3 h at 120 °C and employed in electrochemical experiments.
3.4. Characterization
Scanning electron microscopy with energy-dispersive X-ray spectroscopy (SEM/EDX, Nova NanoSEM 450 (FEI, Hillsboro, OR, USA) with a tungsten filament operating at 200 kV and a back-scattered electron detector was used for the visualization of the catalyst powders prepared at the micro- and nanometer scale. X-ray diffraction (XRD, Empyrean (Malvern Panalytical, Kassel, Germany)) with Cu Kα radiation at 60 kV was employed in the Bragg angle range from 5° to 40° in order to understand the crystallographic plane and the existence of each metal oxide/hydroxide phase along with the crystallinity. UV–visible spectra were recorded using a Cary 5000 instrument (Agilent, Santa Clara, CA, USA) in the 200–800 nm range, after background and blank correction in diffuse reflectance light absorption mode. Surface roughness evaluation of the photoelectroactive film was performed by surface topography imaging using a Leica DCMB instrument equipped with a 10× EPI objective lens over an area of 1.75 × 1.32 mm2. The luminescent behavior of the prepared catalyst powders was evaluated on the PL density spectrum of the catalyst in the 365 to 800 nm range after exciting the material at 330 nm with the Fluoromax 4 device from Horiba, Japan. Raman analysis was performed on a DXR3 Raman Microscope (Thermo Fisher Scientific, Waltham, MA, USA) with a wavelength of 532 nm, a 40× scan, and a laser power of 10 using 50× microscope objectives.
3.5. Photoelectrochemical Testing
Photoelectrochemical tests were performed in alkaline, acidic, and neutral media with 0.1 M NaOH, 0.1 M H2SO4, and 0.1 M Na2SO4 as the electrolyte solutions, respectively. The electrochemical test reactor consisted of a quartz window, and the tests were carried out in a three-electrode configuration. The potentiostat1010 (Gamry, Warminster, PA, USA) workstation was employed in all the electrochemical tests. The catalyst coated on the FTO glass substrate was the working electrode. A Pt wire was used as the counter electrode, and a saturated calomel electrode (SCE) was used as the reference electrode under a 1 sun AM 1.5 G intensity (100 mW cm−2). The light illumination was sourced from a Sunlight Solar Simulator (ABET Tech., Inc., Milford, CT, USA).
The cyclic voltammetry (CV) test was performed from +2.0 V to −1.2 V vs. RHE at a scan rate of 50 mV s−1 in the absence and presence of light in order to assess the HER and OER activity in this potential range. LSV tests were conducted from 0 to 2.0 V (OER) and 0 to −1.2 V (HER) vs. RHE. Furthermore, Mott–Schottky graphs were attained at a frequency of 10 kHz and an AC voltage of 10 mV rms while sweeping the potential in the −1.16 to 1.24 V (vs. RHE) range. Stability tests were carried out using chronoamperometry in the presence of light at 1.64 V (vs. RHE) for 15 h and at −1.16 V (vs. RHE) for 15 h. Electrochemical impedance spectroscopy (EIS) study was performed on 0.1 M Na2SO4 electrolyte using a 4Ir1Ni@AC electrode in a potential range from 10 mHz to 100 kHz frequency range and 5 mV AC amplitude.


