Article

Synthesis of Zinc-Titanium Oxide Nanocomposites by Plasma Jet and Its Application to Photocatalyst

1
Department of Chemistry, Sungkyunkwan University, Suwon 16419, Korea
2
Institute of Basic Science, Sungkyunkwan University, Suwon 16419, Korea
*
Author to whom correspondence should be addressed.
Catalysts 2022, 12(9), 1020; https://doi.org/10.3390/catal12091020
Submission received: 9 August 2022 / Revised: 29 August 2022 / Accepted: 1 September 2022 / Published: 8 September 2022
(This article belongs to the Special Issue State-of-the-Art Catalytical Technology in South Korea II)

Abstract

:
In order to synthesize the zinc-titanium (Zn-Ti) oxide nanocomposites using an atmospheric soft plasma jet, in this study mixtures of Zn and Ti precursors such as zinc nitrate and titanium butoxide were first prepared with different molar ratios; the mixed precursors then stirred at 700 rpm for two hours with atmospheric plasma, while maintaining a temperature of 25 °C. All the synthesized Zn-Ti oxide nanocomposites were post-heat-treated at 600 °C for six hours in an electrical furnace. The morphology, particle shape and size, crystal structure, oxidation state, and composition ratio were analyzed using FE-SEM, XRD, SEM-EDS, and Raman spectroscopy. BET was measured to calculate the specific surface area of the Zn-Ti oxide nanocomposites. Photocatalytic activity tests were performed for an application study, with 10 mL of 10 ppm methylene blue dye. UV-visible spectroscopy was performed on five different samples in order to analyze the changes of photocatalytic reactions. When the composition ratio of Zn/Ti was 2/1, maximum photocatalytic efficiency was obtained. We also carried out a theoretical kinetic study.

1. Introduction

Metal oxides are produced in various forms for applications across many industries. The metal oxide may be produced by several methods, such as thermal, liquid-phase, and physical milling methods. Photocatalytic experiments on the bleaching of Prussian blue by ZnO were first carried out in 1924. The observations inspired many researchers to use ZnO as a photocatalyst for other reactions, such as the reduction of Ag+ to Ag [1]. Subsequently, metal-oxide-based photocatalysts were reported several times, but they were not included in the list of light-sensitive photocatalysts, and many studies were not conducted due to limitations in practical application [2,3,4]. However, in the 1970s, the conception of photocatalysts began to change. Firstly, as we progress through the industrial age, research into alternative energy has become urgent due to the reckless use of fossil fuels. In addition, as environmental problems due to large-scale industrial operations and the acceleration of industry began to emerge, the need of eco-friendly treatment methods to reduce these problems grew [5,6]. Many innovative studies in the field of photocatalysis have been carried out. Among them was a groundbreaking study on metal-oxide-based photocatalysts, published by Fujishima and Honda in 1972,which proved that TiO2 and Pl electrodes contained in aqueous electrolytes can generate oxygen and hydrogen by photocatalytic activity (i.e., the Honda–Fujishima effect) [7]. Moreover, in 1977, photocatalytic water splitting was reported to generate H2 and O2 in a stoichiometric ratio of 2:1 through light irradiation alone, without the application of external energy, under an argon atmosphere [8]. Following these numerous studies, more extensive studies, such as those on the enhancement of photocatalytic efficiency, the discovery of new photocatalyst materials, and the utilization of light sources, were conducted in the 1980s. Moreover, regarding the development of new photocatalysts, many studies have been carried out on metal-oxide-based photocatalytic materials with higher activity than the existing TiO2 [9,10]. In the 21st century, research at the forefront of the next generation of renewable energy, such as the reduction of air pollutants, the decomposition of polluted water, and hydrogen generation, is being conducted in line with current trends [11,12,13].
Recently, a synthetic method for the production of metal oxides using plasma has been introduced as an inexpensive and rapid method [14,15].Low-temperature, non-equilibrium plasmas provide many advantages for synthesizing metal-oxide nanomaterials with specific size and shape, even at room temperature. Plasma-utilizing equipment also has many advantages, such as low energy consumption, easy and cheap installation, atmospheric pressure discharge, and potential use in various industrial fields. Types of plasma sources include plasma reactors such as the dielectric barrier discharge (DBD), corona discharge, micro discharge, and torch systems [16,17]. Plasmas are routinely used for ozone generation, gas reforming, biological sterilization, surface functionalization, and medical treatment in plasma discharge equipment. Operating parameters, designs, and configurations vary widely for each reactor, each with different pros and cons [18,19,20,21].
Various techniques for producing nanomaterials in the presence of atmospheric plasma have been reported in the literature. For example, gold nanoparticle synthesis using micro-plasma for silicon nanomaterials, plasma jet for carbon nanomaterials, and plasma reaction with solutions have been previously performed [22,23].
Since ZnTiO3 has various crystalline phases and is applied in various fields, in this study Zn-Ti oxide nanocomposites, including stoichiometric ZnTiO3, were synthesized using an atmospheric plasma jet method, and their applicability for photocatalysis was assessed.

2. Results and Discussion

A scanning electron microscope (SEM) was used to determine the particle morphology and average size of the Zi-Ti oxide nanocomposites synthesized by a soft plasma jet. As shown in Figure 1, the metal-oxide nanoparticles synthesized by soft plasma jet appeared to have an irregular shape. The size of the particles varied within the range of 50~100 nm, and increased as the amount of titanium butoxide was increased; while the particle size generally decreased, except that of Zn@Ti-D. Table 1 shows the atomic percentage of plasma-synthesized Zn-Ti oxide nanocomposites, which were obtained from the energy-dispersive spectroscopy (EDS) data. As shown in Figure 1f–j and Table 1, the synthesized Zn-Ti oxide nanocomposites showed an increment in the ratio of Ti to Zn as the amount of the titanium precursor was increased, but the ratio decreased in Zn@Ti-E. The ratio of oxygen increased similarly by the corresponding amount, and maximum oxygen content was achieved in the sample of Zn@Ti-C, with the Zn/Ti ratio of 2/1and a stoichiometry of Zn2.0Ti1.0O3+X.
As shown in Figure 2, the X-ray diffraction (XRD) patterns of the five different samples showed a ZnO hexagonal crystal phase (JPDS 36-1451). Nine diffraction peaks were observed at 31, 34, 36, 47, 56, 62, 66, 67, and 69 degrees, due to the diffractions of (100), (002), (101), (102), (110), (103), (200), (112), and (201) planes, respectively. In addition, the samples of Zn@Ti-C, Zn@Ti-D, and Zn@Ti-E exhibited the rhombohedral crystal phase of ZnTiO3 (JPDS 26-1500) with typical four diffracted peaks at 32, 35, 48, and 61 degrees, reflecting the diffractions of (104), (110), (024), and (214) planes, respectively. This means that the crystal structures of Zn@Ti-A and Zn@Ti-B differed from those of the samples of Zn@Ti-C, Zn@Ti-D, and Zn@Ti-E, suggesting that a different behavior of photocatalytic activity could be expected. This indicates that Zn@Ti-A and Zn@Ti-B had a single-crystalline (hexagonal crystal structure) nature, while Zn@Ti-C, Zn@Ti-D, and Zn@Ti-E had mixed phases with both hexagonal and rhombohedra crystal structures. The XRD data also show different crystallinity. Among five different samples, the Zn@Ti-A sample exhibited the best quality of crystallinity, while Zn@Ti-B exhibited the second-best quality. The Zn@Ti-C and Zn@Ti-D samples were of similar quality, while the sample of Zn@Ti-E showed a poor quality of crystallinity, considering both peak intensity and the FWHM values of the main diffracted peak.
Figure 3 shows the Brunauer–Emmett–Teller (BET) graphs of five different samples. Among them, the Zn@Ti-A sample shown in Figure 3a, made only of zinc nitrate precursor, was composed of ZnO nanoparticles and had a surface area of 30.556 m2/g. The samples of Zn@Ti-B (b) and Zn@Ti-C (c),which were synthesized using zinc nitrate and titanium butoxide precursors, had increased specific surface areas(both over 60 m2/g),corresponding to the increase of titanium butoxide. The Increase in the specific surface area of Zn@Ti-B (b) and Zn@Ti-C (c) was attributed to the formation of smaller metal-oxide nanoparticles, because the amorphous Zn-Ti metal-oxide complex interferes with the aggregation of zinc oxide particles. The surface areas of Zn@Ti-D (d) and Zn@Ti-E (e) were reduced because ZnTiO3, which was larger than the zinc oxide nanoparticles, was produced. ZnTiO3 was produced in a molar ratio of zinc nitrate to titanium butoxide gradually increasing to 1:1.Based on our XRD data, we calculated the grain sizes of the samples by utilizing the Scherrer equation. The obtained values of grain sizes were 21.8 nm (Zn@Ti-A), 92.1 nm (Zn@Ti-B), 100.7 nm (Zn@Ti-C), 55.9 nm (Zn@Ti-D), and 75.8 nm (Zn@Ti-E). This means that there was little relationship between the BET surface area and grain size. However, we found that, apart from the grain size of crystalline ZnTiO3 (i.e., the Zn@Ti-A sample), the obtained grain sizes were comparable with the sequences of the average particle sizes shown in the SEM images.
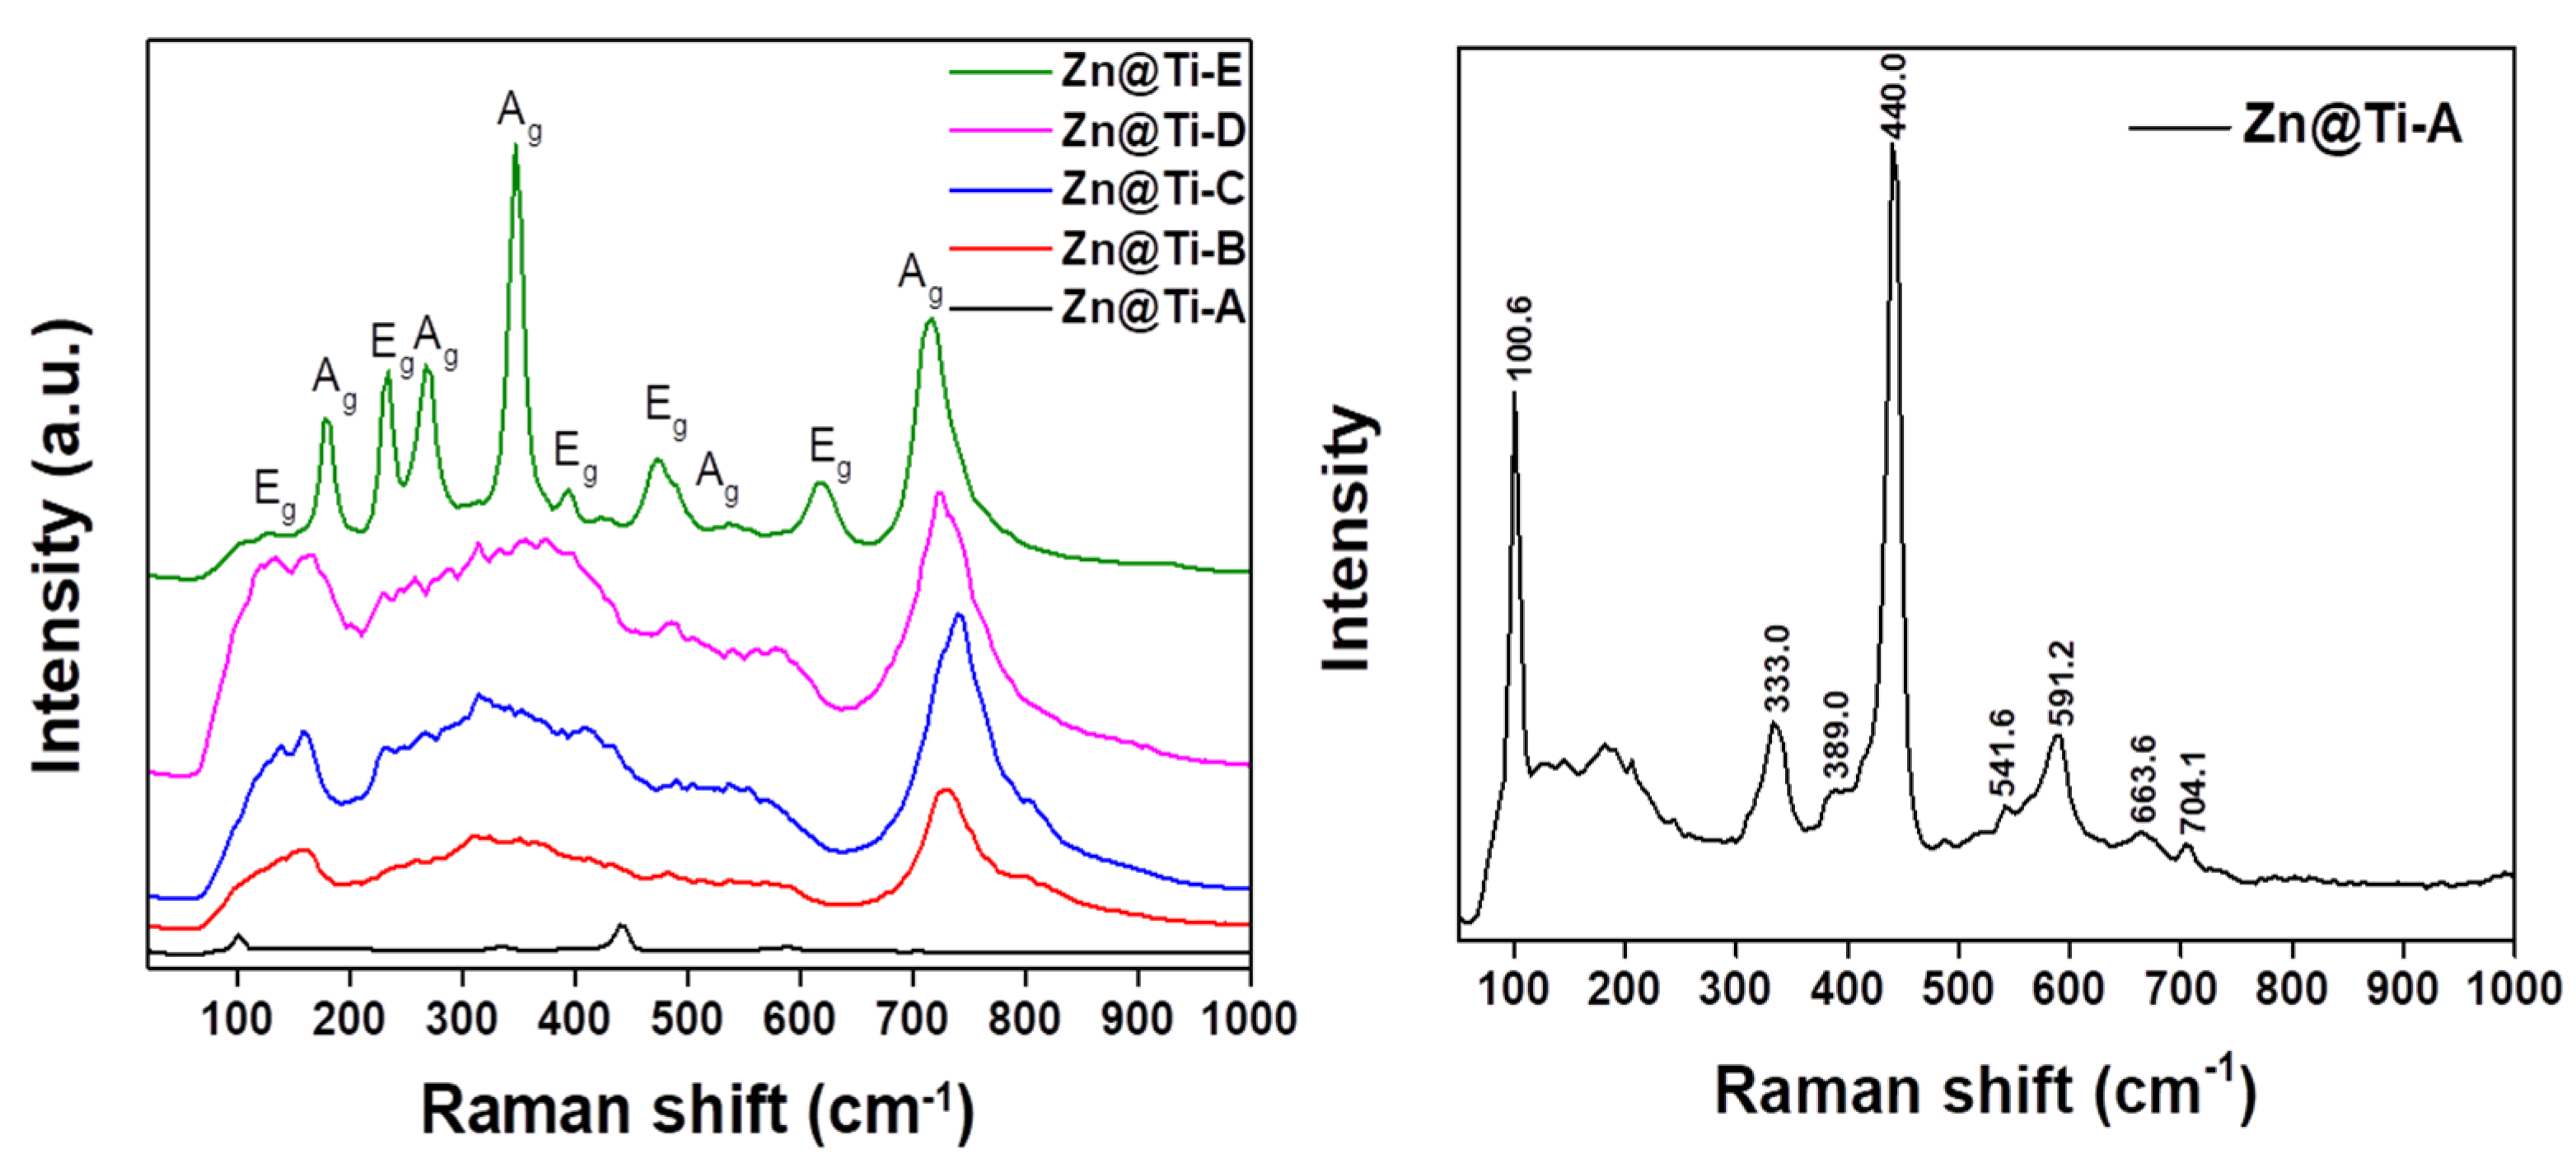
As shown in Figure 4 (the left-hand figure), ZnTiO3crystals(such as Zn@Ti-E) as in point group C3i in group theory had ten Raman active modes: 5Ag + 5Eg(Ag: 177, 267 347, 490, 717 cm−1and Eg: 129, 234, 393, 472, 618 cm−1). The Raman spectra of the ZnTiO3crystal were first reported by Baran and Botto in 1979, without mode assignment. The frequency of the mode obtained from the Raman spectra of Zn@Ti-E that we synthesized, corresponds exactly with the Raman spectra of the ZnTiO3crystal reported by Baran and Botto [24]. However, in the Raman spectra of Zn@Ti-A, shown in the right-hand figure of Figure 4, the hexagonal phase of ZnO was also identified from the characteristic sharp Raman peak at 440.0 cm−1, which is the E2 optical phonon mode. The E2H-E2L and A1T modes of the multi-phonon process were observed at 333.0 and 389.0 cm−1, respectively. The presence of structural defects in the form of oxygen defects in zinc epilepsy was evident from the E1L mode at 591.2 cm−1, which was weak compared to the strong Raman active peak at 440.0 cm−1 [24,25,26]. As the amount of titanium butoxide was increased, the Raman spectra of Zn@Ti-B, Zn@Ti-C, and Zn@Ti-D gradually changed to the mode of ZnTiO3 from the ZnO mode. An important distinction between the Raman and XRD data is that the XRD signal is the result of long-range structural ordering among crystalline lattice planes, whereas the Raman spectrum reflects local molecular bond vibrations, making the Raman highly sensitive even for detecting nanocrystallite formations in those materials with a high Raman cross section. In the case of the pristine TiO2 sample, for example, the Raman spectra showed the only phase determined is rutile, with peaks at 611 cm–1 (A1g), 447 cm–1(Eg), and 143 cm–1(B1g). A noticeable increment of the anatase phase weight percentage was observed for an Al-doped TiO2 sample with the Al-dopant concentration above 0.7 wt%, and was characterized by the apparent growth of the bands at 197 and 640 cm–1(Eg), 398 and 515 cm–1(B1g), and 515 cm–1(A1g). The energy band gaps of TiO2were 3.0 eV (rutile phase) and 3.2 eV (anatase phase), while the ZnO and ZnTiO3 crystals showed energy band gaps such as 3.29 eV (wurtzite hexagonal ZnO), 3.10 eV (blende cubic ZnO), and 3.06 eV (ZnTiO3) [27,28,29]. This means that in the case of Ti-Zn oxide nanocomposites, it is possible to control the energy band gaps between 3.0 and 3.3 eV.
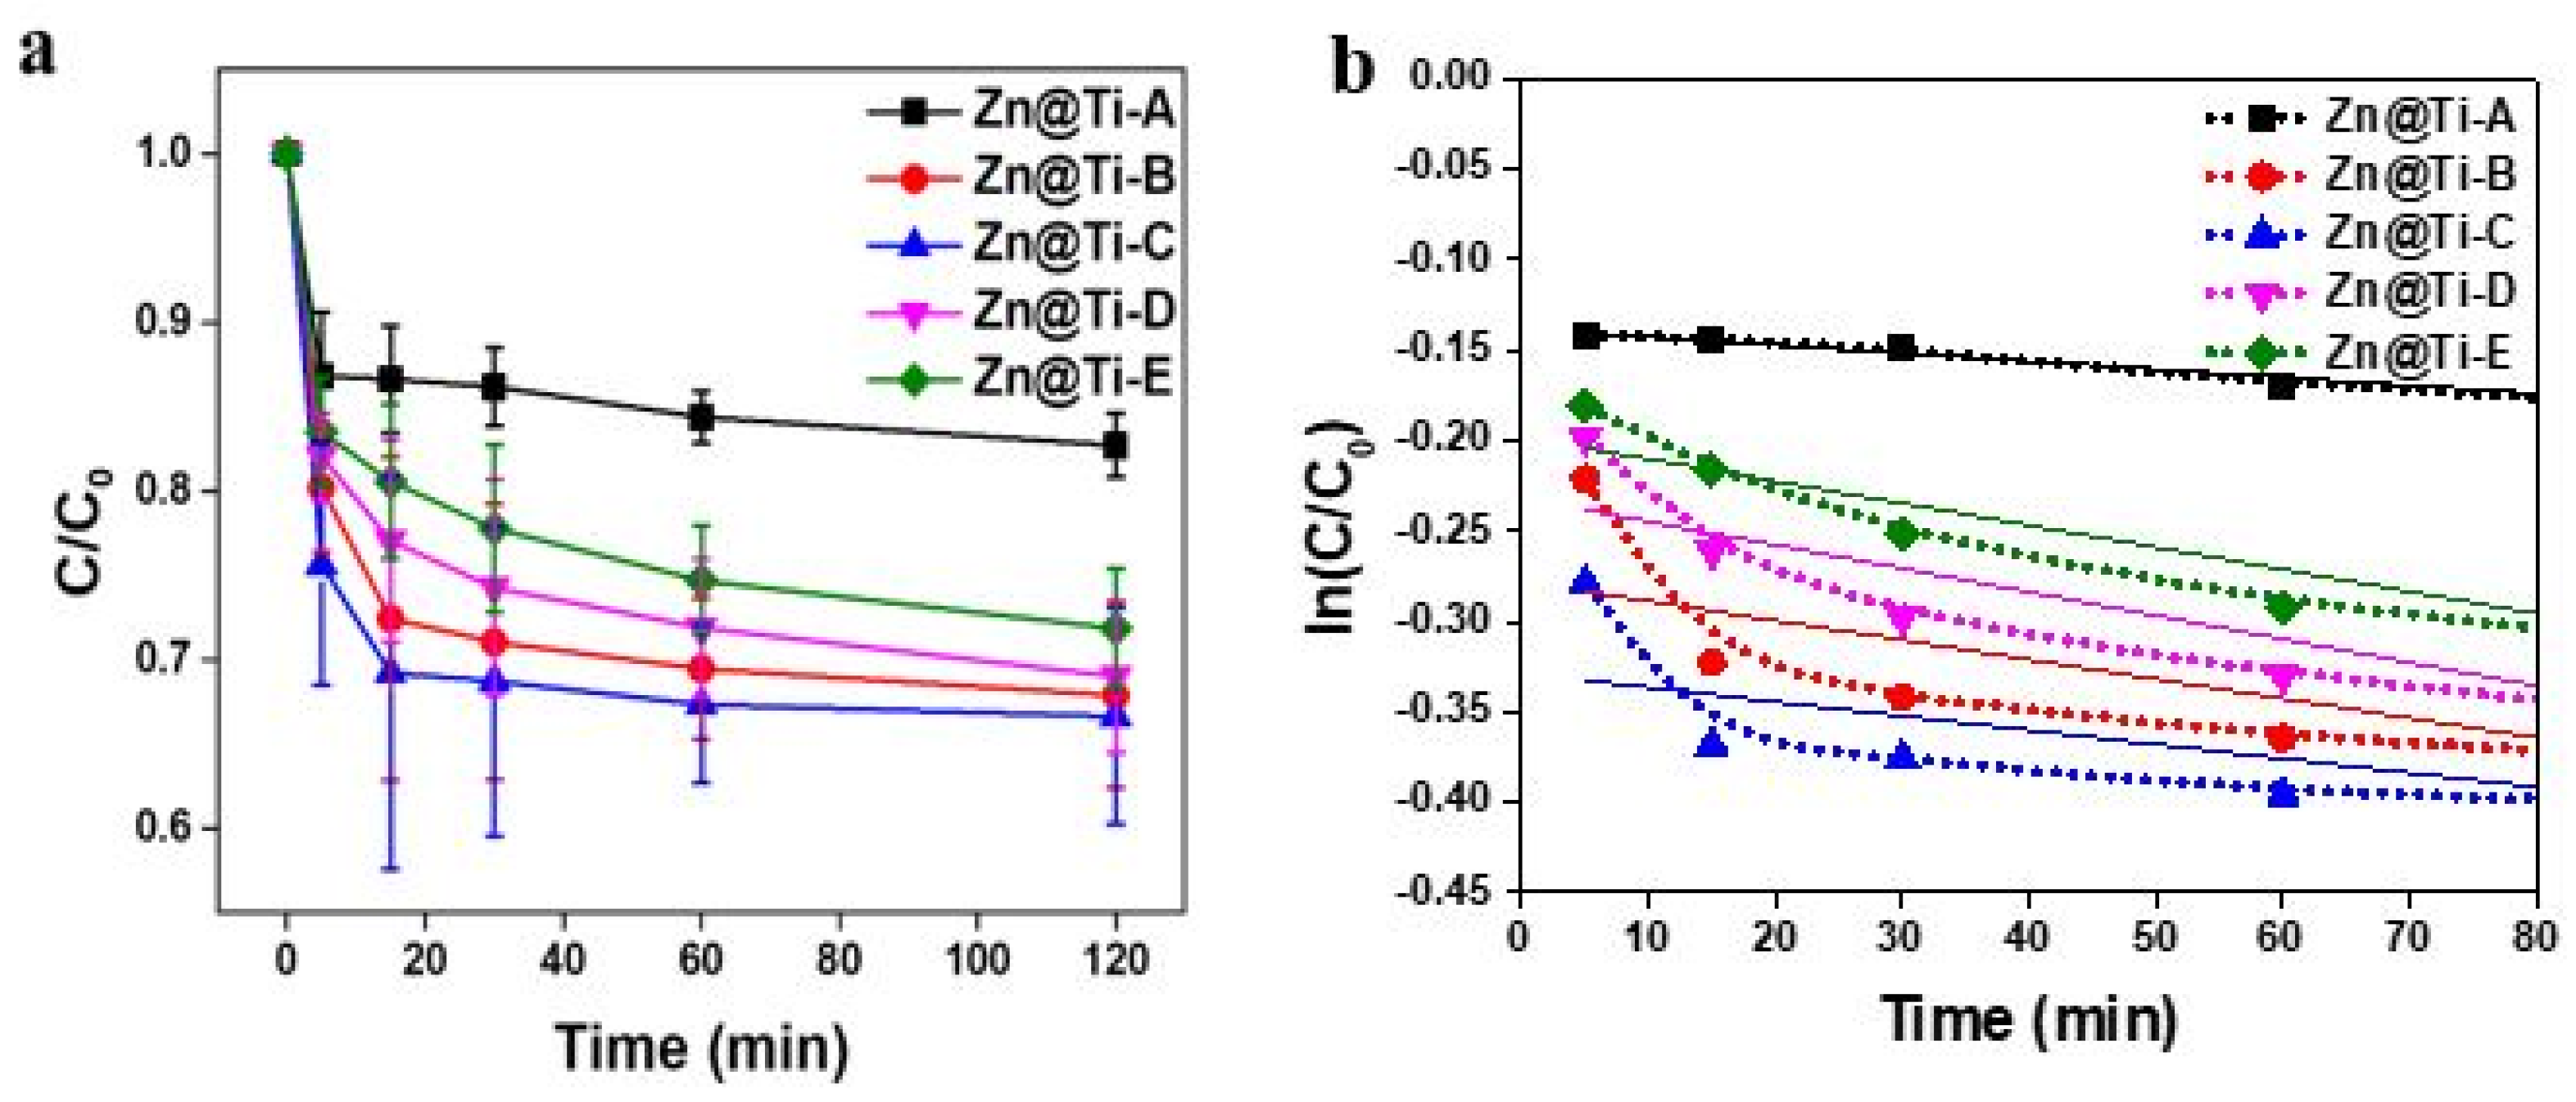
Studies on both the photocatalytic degradation of methylene blue (MB) dye and its kinetics were carried out using the five different photocatalysts (i.e., Zn-Ti oxide nanocomposites). The degradation experiment with MB dye solution was carried out to determine the possibility of removing hazardous substances with environmentally friendly industrial applications. Figure 5a shows the results of photocatalytic decomposition with 10 mL of 10 ppm MB dye for 2 h. During the degradation experiments with the MB dye, we measured the changes of dye concentrations with an UV-visible spectrophotometer every 5 min. The first results of relative concentration (C/Co) with the five different photocatalysts (Zn@Ti-A~E) obtained after UV light irradiation for 5 min were 0.868, 0.802, 0.756, 0.820, and 0.835, respectively. This means that the amount of MB dye decomposed under UV light for the initial 5 min was not significantly different among the samples. However, the degree of photo-degradation began to show greater differences between 5 and 15 min under UV light. The sample of Zn@Ti-C in particular showed a large dye decomposition tendency compared with the other samples. The photocatalytic efficiency of the nanocomposites was good in the decreasing order of Zn@Ti-C, Zn@Ti-B, Zn@Ti-D, Zn@Ti-E, and Zn@Ti-A. After 120 min of irradiation under UV light, the system containing the Zn@Ti-A composite retained approximately 85% of the MB dye, while the systems with Zn@Ti-C and Zn@Ti-E nanocomposites retained about 68% and 73% of the dye, respectively. This suggests that when photodegrading MB dye with UV light for 120 min, the photocatalytic efficiency of the Zn-Ti oxide nanocomposites could depend on several parameters, such as crystallinity (Zn@Ti-A), surface area (Zn@Ti-C), surface functionality (Zn@Ti-E), crystal size and shape, surface defects, etc. For example, based on the data in Figure 3, the surface areas of the Zn@Ti-B and Zn@Ti-C samples were double those of the Zn@Ti-A, Zn@Ti-D, and Zn@Ti-E samples. The crystallinities of both the Zn@Ti-A (based on XRD) and Zn@Ti-E (based on Raman) samples were relatively better than those of the other samples. Moreover, the Zn@Ti-E sample contained a Ti- and oxygen- rich constituent compared with other samples, signifying different surface functionality. However, in this study we obtained the best photocatalytic efficiency when we used the photocatalyst Zn@Ti-C, which contained the highest oxygen content among the five different samples with the Zn/Ti ratio of 2. We compared this result with the photocatalytic efficiency of a commercially available TiO2 photocatalyst (namely Degussa P-25, which contains a 70% anatase crystalline phase and a 30% rutile crystalline phase) that we had tested before [30].The Zn@Ti-C in this study showed a higher efficiency within the first 30 min (Table 2). However, the efficiency of crystalline ZnTiO3 (i.e., Zn@Ti-A) was very poor compared with that of both Degussa P-25 TiO2 and the oxygen-rich Zn2.0Ti1.0O3+x (i.e., Zn@Ti-C). This suggests that surface functionality, together with oxygen defects and surface area, are more important factors than crystallinity in influencing photocatalytic activity. For this reason, our inexpensively synthesized photocatalyst can be considered as a replacement for the alternative catalysts in various fields of application.
Using our experimentally obtained data, especially that shown in Figure 5a, we carried out a theoretical kinetic study. Since the first-order kinetics for the photocatalytic reaction were well-known, we measured the changes of UV-visible absorption (i.e., the п-п* transition), and then obtained the variation ratio of the MB dye concentration, as shown in Figure 5a. The MB dye has double bonds that would be broken on the catalyst surface by the absorption of UV light, resulting in degradation. In this work, therefore, we consider only that the type of reaction is A (MB dye) ↔P (degraded product), and the role of the catalyst is to allow a preferred adsorption site, and to lower the activation barrier and accelerate the reaction. The photocatalytic reaction constants of each sample were thus calculated using Equations (1) and (2) below, assuming first-order kinetics. We then plotted Figure 5b by utilizing Equation (2).
C = C 0 exp ( k t )
ln ( C / C 0 ) = k t
where C0 and C are the initial concentration and the concentration of the MB dye solution, respectively, t is the photocatalytic reaction time, and k is the reaction constant. Since equation (1) has the form of an exponential decay similar to Figure 5a, a common feature of all first-order reactions is that the concentration of the reactant (i.e., the MB dye) decays exponentially with time. However, there are different exponential decay curves, depending on k values, as shown in Figure 5a. The greater the rate constant, the more rapid the decay curve. Using Equation (1) or (2), we could extract the first-order rate constants (k1/min) from each decay curve. For example, in the case of sample Zn@Ti-A, we obtained the value of k1as 2.8 × 10⁻² min−1. However, in the other cases we obtained kobs values of 4.4 × 10⁻², 5.5 × 10⁻², 3.9 × 10⁻², and 3.6 × 10⁻² min−1 for Zn@Ti-B, Zn@Ti-C, Zn@Ti-D, and Zn@Ti-E, respectively. Figure 5b shows the kinetics curves (the plot of ln(C/C0) as a function of the photocatalytic reaction time (t)) of the reaction of 10 ppm MB dye solution degraded by the photocatalysts Zn@Ti-A, Zn@Ti-B, Zn@Ti-C, Zn@Ti-D, and Zn@Ti-E. The curves indicate that the degradation reaction could be expressed by the first-order reaction kinetics model only for the Zn@Ti-A sample; the curves of the Zn@Ti-B, Zn@Ti-C, Zn@Ti-D, and Zn@Ti-E samples did not operate with first-order reaction rate models. This means that the perfect linearity indicates first-order kinetics with the first-order rate constant (k1/min). However, the experimentally obtained data exhibit large deviations, suggesting a pseudo-first-order kinetics (i.e., not a perfect first-order reaction), with pseudo-first-order rate constants (kobs/min). Therefore, Figure 5 can provide us with some hints as to the effects of the initial MB concentration on the photocatalytic efficiency. Firstly, due to the large surface area, the Zn@Ti-C photocatalyst among the five samples could decompose the MB dye the most rapidly (5 times faster than the perfect crystalline sample). Secondly, the photocatalytic degradation of MB exhibited pseudo-first-order kinetics with different rate constants (kobs), except in the case of the crystalline Zn@Ti-A. This suggests that the kinetics of photocatalytic degradation of MB in non-crystalline and crystalline photocatalysts might be different [31]. For example, since the concentrations of radicals such as O2· (1D) and OH· are also closely related to the kinetics of dye degradation, it is not an exact fit with first-order kinetics. This means that a more detailed kinetic study, including the detection of key radicals such as O2· (1D) and OH· radicals, is highly desirable in order to clarify our important results. It is well-known that the average lifetime of OH· radical (τOH·) in ambient atmospheric conditions is around 0.01~1 s [32], which is affected by the concentration of reactive gas components such as ozone, VOCs, and NOx. In conclusion, it is very important to note that a photocatalytic reaction is not simple and cannot in general be inferred from the chemical equation for the reaction. For this reason, further study is needed to systematically clarify the detailed reaction mechanism.

3. Materials and Methods

3.1. Description of the Soft Jet Plasma Generator

The soft jet plasma generator was supplied by the Plasma Bioscience Research Center in Kwangwoon University, Korea. A high-voltage needle-type copper electrode was connected to an alternating current (AC) power source, and an outer electrode was connected to ground. The inner electrode was also covered with a dielectric thin glass tube. The distance between the high-voltage and ground electrodes was 2 mm (side-wise). The air flow was maintained at 2 L/min. The plasma generator was operated in pulse mode, which generates less heat at the electrodes and thus requires no cooling [15,21].

3.2. Preparation of Zn@Ti Precursors and Synthesis of Zn-Ti Oxide Nanocomposites

To prepare zinc and titanium (Zn-Ti) oxide composite nanoparticles, zinc nitrate and titanium butoxide were mixed in various molar ratios and synthesized using an atmospheric soft plasma jet. As shown in Table 3, the molar ratio of zinc nitrate and titanium butoxide was adjusted to prepare a precursor plate for atmospheric plasma synthesis. All solutions used isopropyl alcohol as the solvent. Sodium hydroxide forms zinc ion in solution and prevents the formation of titanium dioxide by lowering the pH of the precursor solution. The precursor mixture was stirred at 700 rpm for 2 hours while maintaining the temperature at 25 °C. The synthesized metal-oxide nanocomposites were denoted according to precursor molar ratio, as Zn@Ti-A, Zn@Ti-B, Zn@Ti-C, Zn@Ti-D, and Zn@Ti-E. All Zn-Ti oxide nanoparticle composites synthesized by plasma jet were post-heat-treated at 600 °C for 6 hours in a furnace in order to achieve the best crystallinity.

3.3. Characterization

The crystallinity of zinc and titanium oxide nanocomposites was analyzed using an X-ray diffractometer (D/Max ultima III, Rigaku corporation, Tokyo, Japan) fitted with monochromatic copper Ka radiation (k = 0.154 nm) operated at a current of 40 mA and 40 kV. A Raman spectrometer was used for optical qualitative analysis of the metal-oxide particles. Brunauer–Emmett–Teller (BET) was used to determine the specific surface area of the metal-oxide particles. A field-emission scanning electron microscope (FE-SEM, model: JEM 1200 EX II, JEOL Ltd.) with an energy-dispersive spectrometer (EDS) was used to analyze particle shape and surface morphology, as well as atomic composition. Raman spectra were measured to monitor crystallization changes of the synthesized zinc-titanium (Zn-Ti) oxide nanocomposites. A 10 ppm (parts per million) methylene blue dye (C16H18ClN3S, SIGMA-ALDRICH CAS Number: 122965-43-9) solution was initially prepared, and five different nanocomposite samples, Zn@Ti-A, Zn@Ti-B, Zn@Ti-C, Zn@Ti-D, and Zn@Ti-E, were dispersed in 10 mL of solution at a 10 ppm initial concentration for photocatalytic performance measurements. The solutions were exposed to a UV lamp at a wavelength of 254 nm in a black box for 5, 15, 30, 60, or 120 min, respectively. After irradiating the methylene blue (MB) dye and photocatalyst solution with UV light, the remaining Zn-Ti oxide nanocomposite was centrifuged at 4000 rpm for 5 min and filtered using a 0.45 μm syringe filter. Photocatalytic performance was measured using UV-visible absorption spectroscopy (UV-3600 Plus UV-VIS-NIR Spectrophotometer: SHIMADZU) to check the remaining concentrations of the MB dye. The detailed experimental process of photocatalytic performance has been published previously elsewhere [33].

4. Conclusions

In this study, zinc-titanium (Zn-Ti) oxide nanocomposites were synthesized using an atmospheric soft plasma jet and post-heat-treatment process, and ZnO and ZnTiO3crystals were also synthesized by controlling the concentration of the precursors. ZnTiO3 was most uniformly synthesized under a zinc nitrate-to-titanium butoxide precursor molar ratio of 1:1. As a result of photocatalyst application experiments using the synthesized metal-oxide nanoparticle composites, the highest photocatalytic efficiency was obtained using the Zn/Ti ratio of 2/1. We demonstrated that a large specific surface area and two or more photocatalysts were fragmented, suggesting different reaction kinetics as well as major and minor parameters of a governing rate-determining step. Since we did not measure either half-life (which is independent of reactant concentration for first-order kinetics) or time constant (life time - the longer the time constant of the first-order reaction, the slower the decay and the longer the reaction survives) using a Laser spectroscopic technique, further research is highly desirable for determining the exact reaction kinetics.

Author Contributions

Conceptualization, H.-J.S. and A.A.; methodology, H.-J.S.; software, J.-H.Y.; validation, H.-J.S., A.A. and J.-H.Y.; formal analysis, H.-J.S., R.-H.J.; investigation, H.-J.S., A.A.; resources, J.-H.Y.; data curation, H.-J.S., A.A.; writing—original draft preparation, H.-J.S.; writing—review and editing, R.-H.J., J.-H.B.; supervision, J.-H.B.; project administration, J.-H.B.; funding acquisition, A.A., J.-H.B. All authors have read and agreed to the published version of the manuscript.

Funding

This research was funded by National Research Foundation of Korea (2020R1A2C1011764 and 2018R1D1A1B07051012).

Acknowledgments

This work was supported by a National Research Foundation of Korea (NRF) grant, funded by the Korean Government (MSIT) (2020R1A2C1011764). Ananth would like to express thanks for the support of a Leading Foreign Research Institute Recruitment Program grant administered through the NRF of the Korean Government (NRF-2018R1D1A1B07051012).

Conflicts of Interest

The authors declare no conflict of interest.

References

  1. Baur, E.; Perret, A. On the action of light on dissolved silver salts in the presence of zinc oxide. Helv. Chim. Acta 1924, 7, 910–915. [Google Scholar] [CrossRef]
  2. Braslavsky, S.E.; Rubin, M.B. The history of ozone. Part VIII. Photochemical formation of ozone. Photochem. Photobiol. Sci. 2011, 10, 1515–1520. [Google Scholar] [CrossRef] [PubMed]
  3. Fujishima, A.; Zhang, X.; Tryk, D.A. TiO2 photocatalysis and related surface phenomena. Surf. Sci. Rep. 2008, 63, 515–582. [Google Scholar] [CrossRef]
  4. Doodeve, C.; Kitchener, J. Photosensitisation by titanium dioxide. Trans. Faraday Soc. 1938, 34, 570–579. [Google Scholar]
  5. Lotfabadi, P. Analyzing passive solar strategies in the case of high-rise building. Renew. Sust. Energ. Rev. 2015, 52, 1340–1353. [Google Scholar] [CrossRef]
  6. Ravelli, D.; Dondi, D.; Fagnoni, M.; Albini, A. Photocatalysis:Amulti-facetedconceptforgreenchemistry. Chem. Soc. Rev. 2009, 38, 1999–2011. [Google Scholar] [CrossRef]
  7. Fujishima, A.; Honda, K. Electrochemical photolysis of water at a semiconductor electrode. Nature 1972, 238, 37–38. [Google Scholar] [CrossRef]
  8. Schrauzer, G.; Guth, T. Photolysis of Water and Photoreduction of Nitrogen on Titanium Dioxide. J. Am. Chem. Soc. 1977, 99, 7189–7193. [Google Scholar] [CrossRef]
  9. Kudo, A.; Sayama, K.; Tanaka, A.; Asakura, K.; Domen, K.; Maruya, K.; Onishi, T. Nickel-loaded K4Nb6O17 photocatalyst in the decomposition of H2O into H2 and O2: Structure and reaction mechanism. J. Catal. 1989, 120, 337–352. [Google Scholar] [CrossRef]
  10. Kormann, C.; Bahnemann, D.W.; Hoffmann, M.R.; Kormann, C.; Bahnemann, D.W.; Hoffmann, M.R. Environmental photochemistry: Is iron oxide (hematite) an active photocatalyst? A comparative study: α-Fe2O3, ZnO, TiO2. J. Photochem. Photobiol. A Chem. 1989, 48, 161–169. [Google Scholar] [CrossRef]
  11. Talaiekhozani, A.; Rezania, S.; Kim, K.-H.; Sanaye, R.; Amani, A.M. Recent advances in photocatalytic removal of organic and inorganic pollutants in air. J. Clean. Prod. 2021, 278, 123895. [Google Scholar] [CrossRef]
  12. Papailias, I.; Todorova, N.; Giannakopoulou, T. Selective removal of organic and inorganic air pollutants by adjusting the g-C3N4/TiO2 ratio. Catal. Today 2021, 361, 37–42. [Google Scholar] [CrossRef]
  13. Ren, K.; Wang, S.; Luo, Y.; Chou, J.P. High-efficiency photocatalyst for water splitting: A Janus MoSSe/XN (X = Ga, Al) van der Waals heterostructure. J. Phys. D Appl. Phys. 2020, 53, 1855041. [Google Scholar] [CrossRef]
  14. Ananth, A.; Mok, Y.S. Dielectric barrier discharge plasma-mediated synthesis of several oxide, nanomaterials and its characterization. Powder Technol. 2015, 269, 259–266. [Google Scholar] [CrossRef]
  15. Ananth, A.; Dharaneedharan, S.; Seo, H.-J.; Heo, M.-S.; Boo, J.-H. Soft jet plasma-assisted synthesis of zinc oxide nanomaterials: Morphology controls and antibacterial activity of ZnO. Chem. Eng. J. 2017, 322, 742–751. [Google Scholar] [CrossRef]
  16. Mariotti, D.; Svrcekm, V.; Hamilton, J.W.H.; Schmidt, M.; Kondo, M. Silicon nanocrystals in liquid media: Optical properties and surface stabilization by microplasma-induced non-equilibrium liquid chemistry. Adv. Funct. Mater. 2012, 22, 954–964. [Google Scholar] [CrossRef]
  17. Kim, H.; Sakakita, H.; Ohsaki, H.; Katsurai, M. Microwave-excited atmospheric pressure plasma jet with wide aperture for the synthesis of carbon nanomaterials. Jap. J. Appl. Phys. 2015, 54, 01AA02. [Google Scholar] [CrossRef]
  18. Saito, G.; Akiyama, T. Nanomaterial synthesis using plasma generation in liquid. J. Nanomater. 2015, 2015, 123696. [Google Scholar] [CrossRef]
  19. Chen, Q.; Li, J.; Li, Y. A review of plasma-liquid interactions for nanomaterial synthesis. J. Phys. D Appl. Phys. 2015, 48, 424005. [Google Scholar] [CrossRef]
  20. Fierro, A.; Laity, G.; Neuber, A. Optical emission spectroscopy study in the VUV-VIS regimes of a developing low-temperature plasma in nitrogen gas. J. Phys. D Appl. Phys. 2012, 45, 495202. [Google Scholar] [CrossRef]
  21. Dowling, D.P.; O’Neill, F.T.; Milosavljevic, V.; Law, V.J. DC pulsed atmospheric pressure plasma jet image formation. IEEE Xplore IEEE Trans. Plasma Sci. 2011, 39, 2326–2327. [Google Scholar] [CrossRef] [Green Version]
  22. Hieda, J.; Saito, N.; Takai, O. Exotic shapes of gold nanoparticles synthesized using plasma in aqueous solution. J. Vac. Sci. Technol. A 2008, 26, 854–856. [Google Scholar] [CrossRef]
  23. Richmonds, C.; Sankaran, R.M. Plasma-liquid electrochemistry: Rapid synthesis of colloidal metal nanoparticles by microplasma reduction of aqueous cations. Appl. Phys. Lett. 2008, 93, 131501. [Google Scholar] [CrossRef]
  24. Baran, E.J.; Botto, I.L. Die Raman-Spektren von ZnTiO3 und CdTiO3. Z. Anorg. Chem. 1979, 448, 188–192. [Google Scholar] [CrossRef]
  25. Bernert, T.; Ruiz-Fuertes, J.; Bayarjargal, L.; Winkler, B. Synthesis and high (pressure, temperature) stability of ZnTiO3 polymorphs studied by Raman spectroscopy. Solid State Sci. 2015, 43, 53–58. [Google Scholar] [CrossRef]
  26. Fuertes, J.R.; Bernert, T.; He, M.; Winkler, B.; Vinograd, V.L.; Milman, V. Local structure of CuxZn2-xTiO4 inverse spinel. Appl. Phys. Lett. 2014, 105, 071911. [Google Scholar] [CrossRef]
  27. Maheu, C.; Cardenas, L.; Puzenat, E.; Afanasiev, P.; Geantet, C. UPS and UV spectroscopies combined to position the energy levels of TiO2 anatase and rutile nanopowders. Phys. Chem. Chem. Phys. 2018, 20, 25629–25637. [Google Scholar] [CrossRef]
  28. Conejeros, S.; Neil, L.; Allan, N.L.; Claeyssens, F.; Hart, J.N. Graphene and novel graphitic ZnO and ZnS nanofilms: The energy landscape, nonstoichiometry and water dissociation. Nanoscale Adv. 2019, 1, 1924–1935. [Google Scholar] [CrossRef]
  29. Lei, S.; Fan, H.; Ren, X.; Fang, J.; Ma, L.; Liua, Z. Novel sintering and band gap engineering of ZnTiO3 ceramics with excellent microwave dielectric properties. J. Mater. Chem. C 2017, 5, 4040–4047. [Google Scholar] [CrossRef]
  30. Seo, H.J.; Lee, J.W.; Na, Y.H.; Boo, J.H. Enhancement of Photocatalytic Activities with Nanosized Polystyrene Spheres Patterned Titanium Dioxide Films for Water Purification. Catalysts 2020, 10, 886. [Google Scholar] [CrossRef]
  31. Doong, R.-A.; Chang, S.-M.; Hung, Y.-C.; Kao, I.-L. Preparation of highly ordered titanium dioxide porous films: Characterization and photocatalytic activity. Sep. Purif. Technol. 2007, 58, 192–199. [Google Scholar] [CrossRef]
  32. Gligorovski, S.; Strekowski, R.; Barbati, S.; Vione, D. Environmental implications of hydroxyl radicals. Chem. Rev. 2015, 115, 13051–13092. [Google Scholar] [CrossRef]
  33. Lee, J.W.; Nam, S.-H.; Yu, J.-H.; Kim, D.I.; Jeong, R.H.; Boo, J.-H. Morphological modulation of urchin-like Zn2SnO4/SnO2 hollow spheres and their applications as photocatalysts and quartz crystal microbalance measurements. Appl. Surf. Sci. 2019, 474, 78–84. [Google Scholar] [CrossRef]
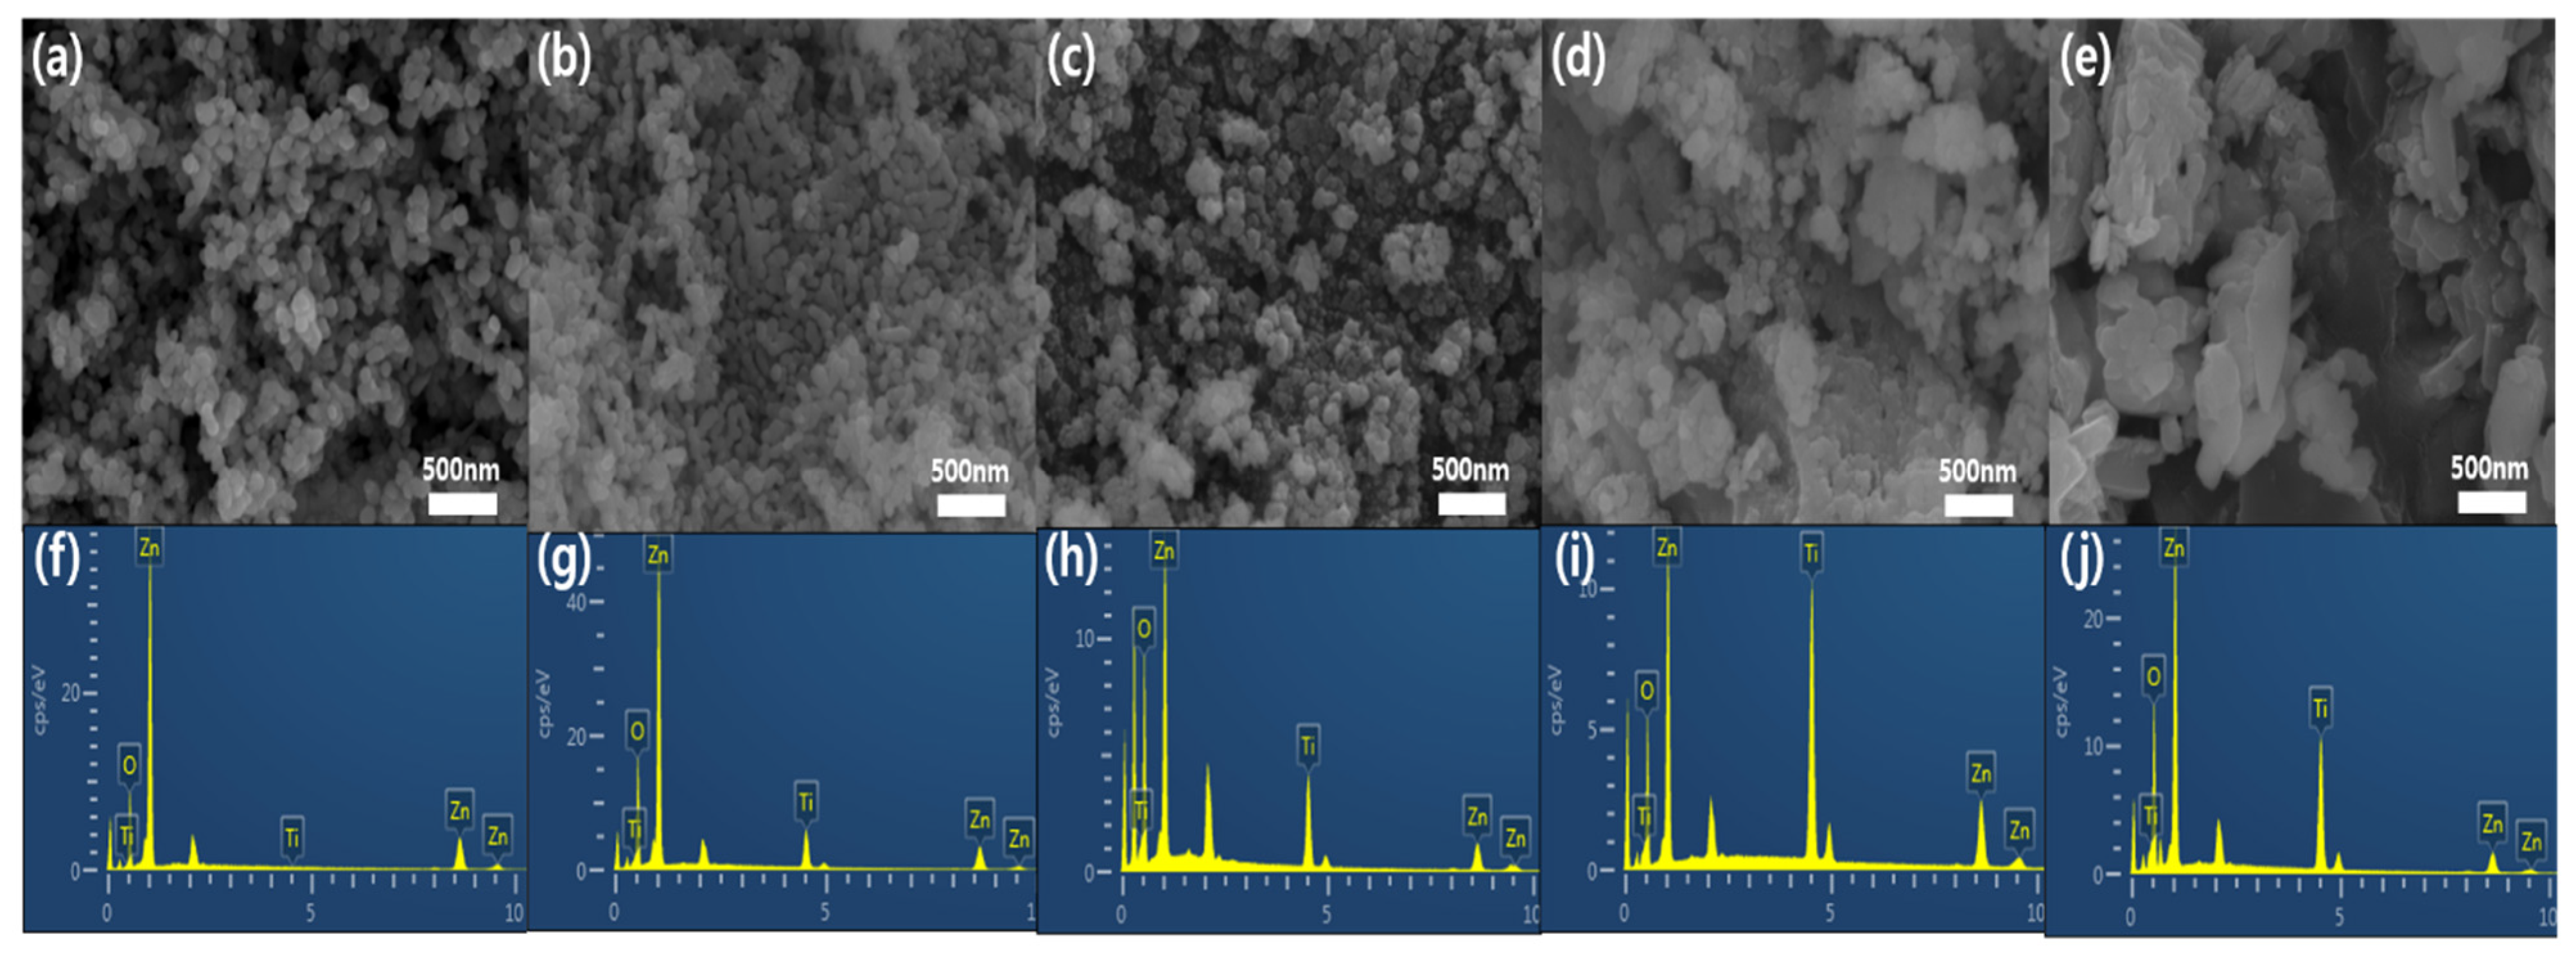
Figure 1. SEM images of plasma-synthesized composites of zinc and titanium oxide; the SEM images of (ae) are taken from the samples of Zn@Ti-A, Zn@Ti-B, Zn@Ti-C, Zn@Ti-D, and Zn@Ti-E, respectively. The graphs of (fj) are EDS of (ae), respectively.
Catalysts 12 01020 g001
Figure 2. XRD patterns of Zn@Ti-A, Zn@Ti-B, Zn@Ti-C, Zn@Ti-D, and Zn@Ti-E nanocomposites synthesized by an atmospheric soft plasma jet.
Catalysts 12 01020 g002
Figure 3. BET graphs of (a) Zn@TiA, (b) Zn@Ti-B, (c) Zn@Ti-C,(d) Zn@Ti-D, and (e) Zn@Ti-E.
Catalysts 12 01020 g003
Figure 4. Raman spectra of Zn@Ti-A, Zn@Ti-B, Zn@Ti-C, Zn@Ti-D, and Zn@Ti-E nanocomposites. The right-hand figure is an enlarged image of theRaman spectrum of sample Zn@Ti-A shown in the left -hand figure.
Catalysts 12 01020 g004
Figure 5. Photocatalytic degradation of methylene blue (a) and kinetics curves for photocatalytic degradation (b).
Catalysts 12 01020 g005
Table 1. Atomic percentage of plasma-synthesized oxide nanocomposites of zinc and titanium.
ElementZn@Ti-AZn@Ti-BZn@Ti-CZn@Ti-DZn@Ti-E
O52.7558.6768.4757.4064.38
Ti0.008.1610.7624.4115.16
Zn47.2533.1720.7718.1920.45
Total100.00100.00100.00100.00100.00
Table 2. Comparison of similar research with this work.
Reaction Time (min.)5153060
C/Co of TiO2
(Degussa P-25)
0.900.870.840.73[30]
C/Co of Zn@Ti-A
(ZnTiO3)
0.890.880.870.85This Work
C/Co of Zn@Ti-C
(Zn2.0Ti1.0O3+X)
0.750.700.690.68This Work
Table 3. Synthetic conditions of Zn-Ti oxide nanocomposites.
NameZinc NitrateTitanium ButoxideSodium Hydroxide
Zn@Ti-A0.1 mol0 mol0.1 mol
Zn@Ti-B0.0875 mol0.0125 mol0.1 mol
Zn@Ti-C0.075 mol0.025 mol0.1 mol
Zn@Ti-D0.0625 mol0.0375 mol0.1 mol
Zn@Ti-E0.05 mol0.05 mol0.1 mol
Publisher’s Note: MDPI stays neutral with regard to jurisdictional claims in published maps and institutional affiliations.