Article

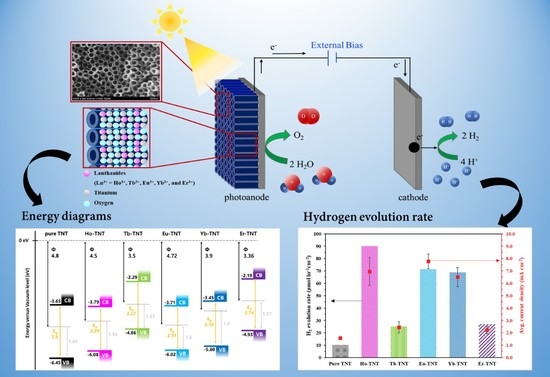
Enhanced Photoelectrochemical Activity of TiO2 Nanotubes Decorated with Lanthanide Ions for Hydrogen Production

1
Hydrogen Research Department, Korea Institute of Energy Research, 152 Gajeong-ro, Daejeon 34129, Korea
2
Department of Chemical and Biomolecular Engineering, Yonsei University, 50 Yonsei-ro, Seoul 03722, Korea
3
Department of Chemical and Biological Engineering, Korea University, 145 Anam-ro, Seoul 02841, Korea
4
Graduate School of Energy Science and Technology, Chungnam National University, 99 Daehak-ro, Daejeon 34134, Korea
*
Author to whom correspondence should be addressed.
Catalysts 2022, 12(8), 866; https://doi.org/10.3390/catal12080866
Submission received: 18 July 2022 / Revised: 3 August 2022 / Accepted: 4 August 2022 / Published: 5 August 2022
(This article belongs to the Special Issue State-of-the-Art Catalytical Technology in South Korea II)

Abstract

:
Highly ordered TiO2 nanotubes (TNTs) decorated with a series of lanthanide ions (Ln3+ = Ho3+, Tb3+, Eu3+, Yb3+, and Er3+) were prepared through an electrochemical process and anodization. The composition, structure, and chemical bond of the as-prepared photocatalysts were characterized through scanning electron microscopy, X-ray diffraction, X-ray photoelectron spectroscopy, ultraviolet photoelectron spectroscopy, and ultraviolet diffuse reflectance spectroscopy. Furthermore, the electrochemical characteristics of the catalysts were analyzed and photoelectrochemical properties were investigated through water splitting. All samples were prepared in the anatase phase without changing the crystal structure. The holmium-doped TNT photocatalyst exhibited the best performance with a hydrogen evolution rate of 90.13 μmol cm−2h−1 and photoconversion efficiency of 2.68% (0 V vs. RHE). Photocatalytic efficiency increased because of the expansion of the absorption wavelength range attributed to the appropriate positioning of the band structure and reduced electron/hole pair recombination resulting from the unhindered electron movement. This study demonstrated the preparation of high-potential solar-active photocatalysts through the synergetic effects of the work function, band edge, and bandgap changes caused by the series of lanthanide combinations with TNTs.

Graphical Abstract

1. Introduction

Overuse of fossil fuels is the primary reason for global warming and environmental pollution [1]. Researchers have emphasized that sustainable energy resources must be explored to overcome nonrenewable energy shortages and to address the issues of environmental pollution and the continuously rising energy demand [2]. Hydrogen is an energy carrier that can store and transport energy; therefore, it provides an alternative energy strategy for replacing other hydrocarbon fuels that do not emit pollutants upon reaction with oxygen [3,4]. Solar energy is an energy source that can generate green hydrogen. According to the World Energy Council, the total solar energy reaching the earth in a year is 3,400,000 EJ, which is between 7000 and 8000 times the annual global primary energy consumption [5]. Hydrogen production through photoelectrochemical (PEC) water splitting using solar energy is a promising approach for meeting large-scale global energy demand to realize a clean, environmentally friendly, and sustainable energy supply.
TiO2 is an n-type semiconductor photocatalyst that is inexpensive, non-toxic, chemically and thermally stable, and environmentally friendly; furthermore, it exhibits low photocorrosion characteristics. On the one hand, TiO2 is being extensively researched for environmental remediation and renewable energy industry because of its characteristics that support reaction, such as position of the TiO2 band edge, and long electron lifetime of anatase. On the other hand, TiO2 has a wide bandgap, which allows it to absorb only energy that corresponds to the ultraviolet (UV) region, which is 3–4% of the total solar energy reaching the ground. A large amount of bandgap energy causes a large driving force for the redox reactions of electrons and holes; it is difficult to efficiently utilize the solar energy because it requires high-energy photons. Bandgap engineering through doping can be attempted to overcome this limitation. Researchers have modified catalysts using non-metals [6,7], noble metals [8,9,10], transition metals [11,12], carbon materials [13], enzymes [14], and lanthanide [15,16] as dopants.
Among the various dopants, lanthanide metals can combine with TiO2 to promote the redox reaction through a synergetic effect, which makes it a promising approach. The effects of lanthanide doping reported thus far are as follows. First, the f-orbitals of lanthanide ions are coordinated by interaction with various Lewis bases such as amines, alcohols, aldehydes, and thiols. These interactions can enhance photoactivity by altering the surface adsorption properties of lanthanide-doped TiO2 and the complexation of organic contaminants. Second, modification with lanthanide ions enhances charge trapping and prevents the electron–hole recombination process. Lastly, it can reduce the bandgap of materials by creating electronic states of lanthanide between the energy states of TiO2 [16,17].
Avram et al. [18] prepared lanthanide (Eu, Sm, Nd, and Er)-doped TiO2 nanoparticles by using the sol-gel method and hydrolysis. In addition, they identified the new substitutional lanthanide centers of anatase TiO2 related to Eu, Sm, Nd, and Er, and described the characteristic emission spectra, decays, and excitation routes. Yu et al. [19] prepared YbF3-Ho@TiO2 by using the hydrothermal and screen printing methods and investigated its photocatalytic activity. Furthermore, they reported that as-prepared catalysts could be used as a photoanode to facilitate charge separation by suppressing electron/hole recombination at the photoanode/dye/electrolyte interface. Although various attempts have been made, the preparation of stable lanthanide-doped TiO2 continues to remain challenging [20]. To the best of our knowledge, no study has analyzed the changes in material properties by doping immobilized TiO2 nanotubes (TNTs) with lanthanide and attempted to produce hydrogen from water splitting. In this study, we first selected five affordable elements with optical properties from among the lanthanides comprising 17 elements in the periodic table based on immobilized TNTs. Then, a series of lanthanide ion (Ln3+ = Ho3+, Tb3+, Eu3+, Yb3+, and Er3+)-doped titanium dioxide nanotubes were synthesized [16]. Subsequently, the bandgap, work function, and surface characteristics of the synthesized catalysts were compared and analyzed using X-ray photoelectron spectroscopy (XPS), ultraviolet diffuse reflectance spectroscopy (UV-DRS), and ultraviolet photoelectron spectroscopy (UPS). Furthermore, the effects of each metal on the photochemical reactions and their optical properties were examined by comparing the properties and activities of catalysts through various electrochemical analyses. Lastly, the synthesized catalysts were used for hydrogen production from water splitting and the stability of the produced hydrogen was verified. The results of this study are expected to aid in the preparation of durable binary composites, which will help expand their limited applicability to include the energy field.

2. Results and Discussion

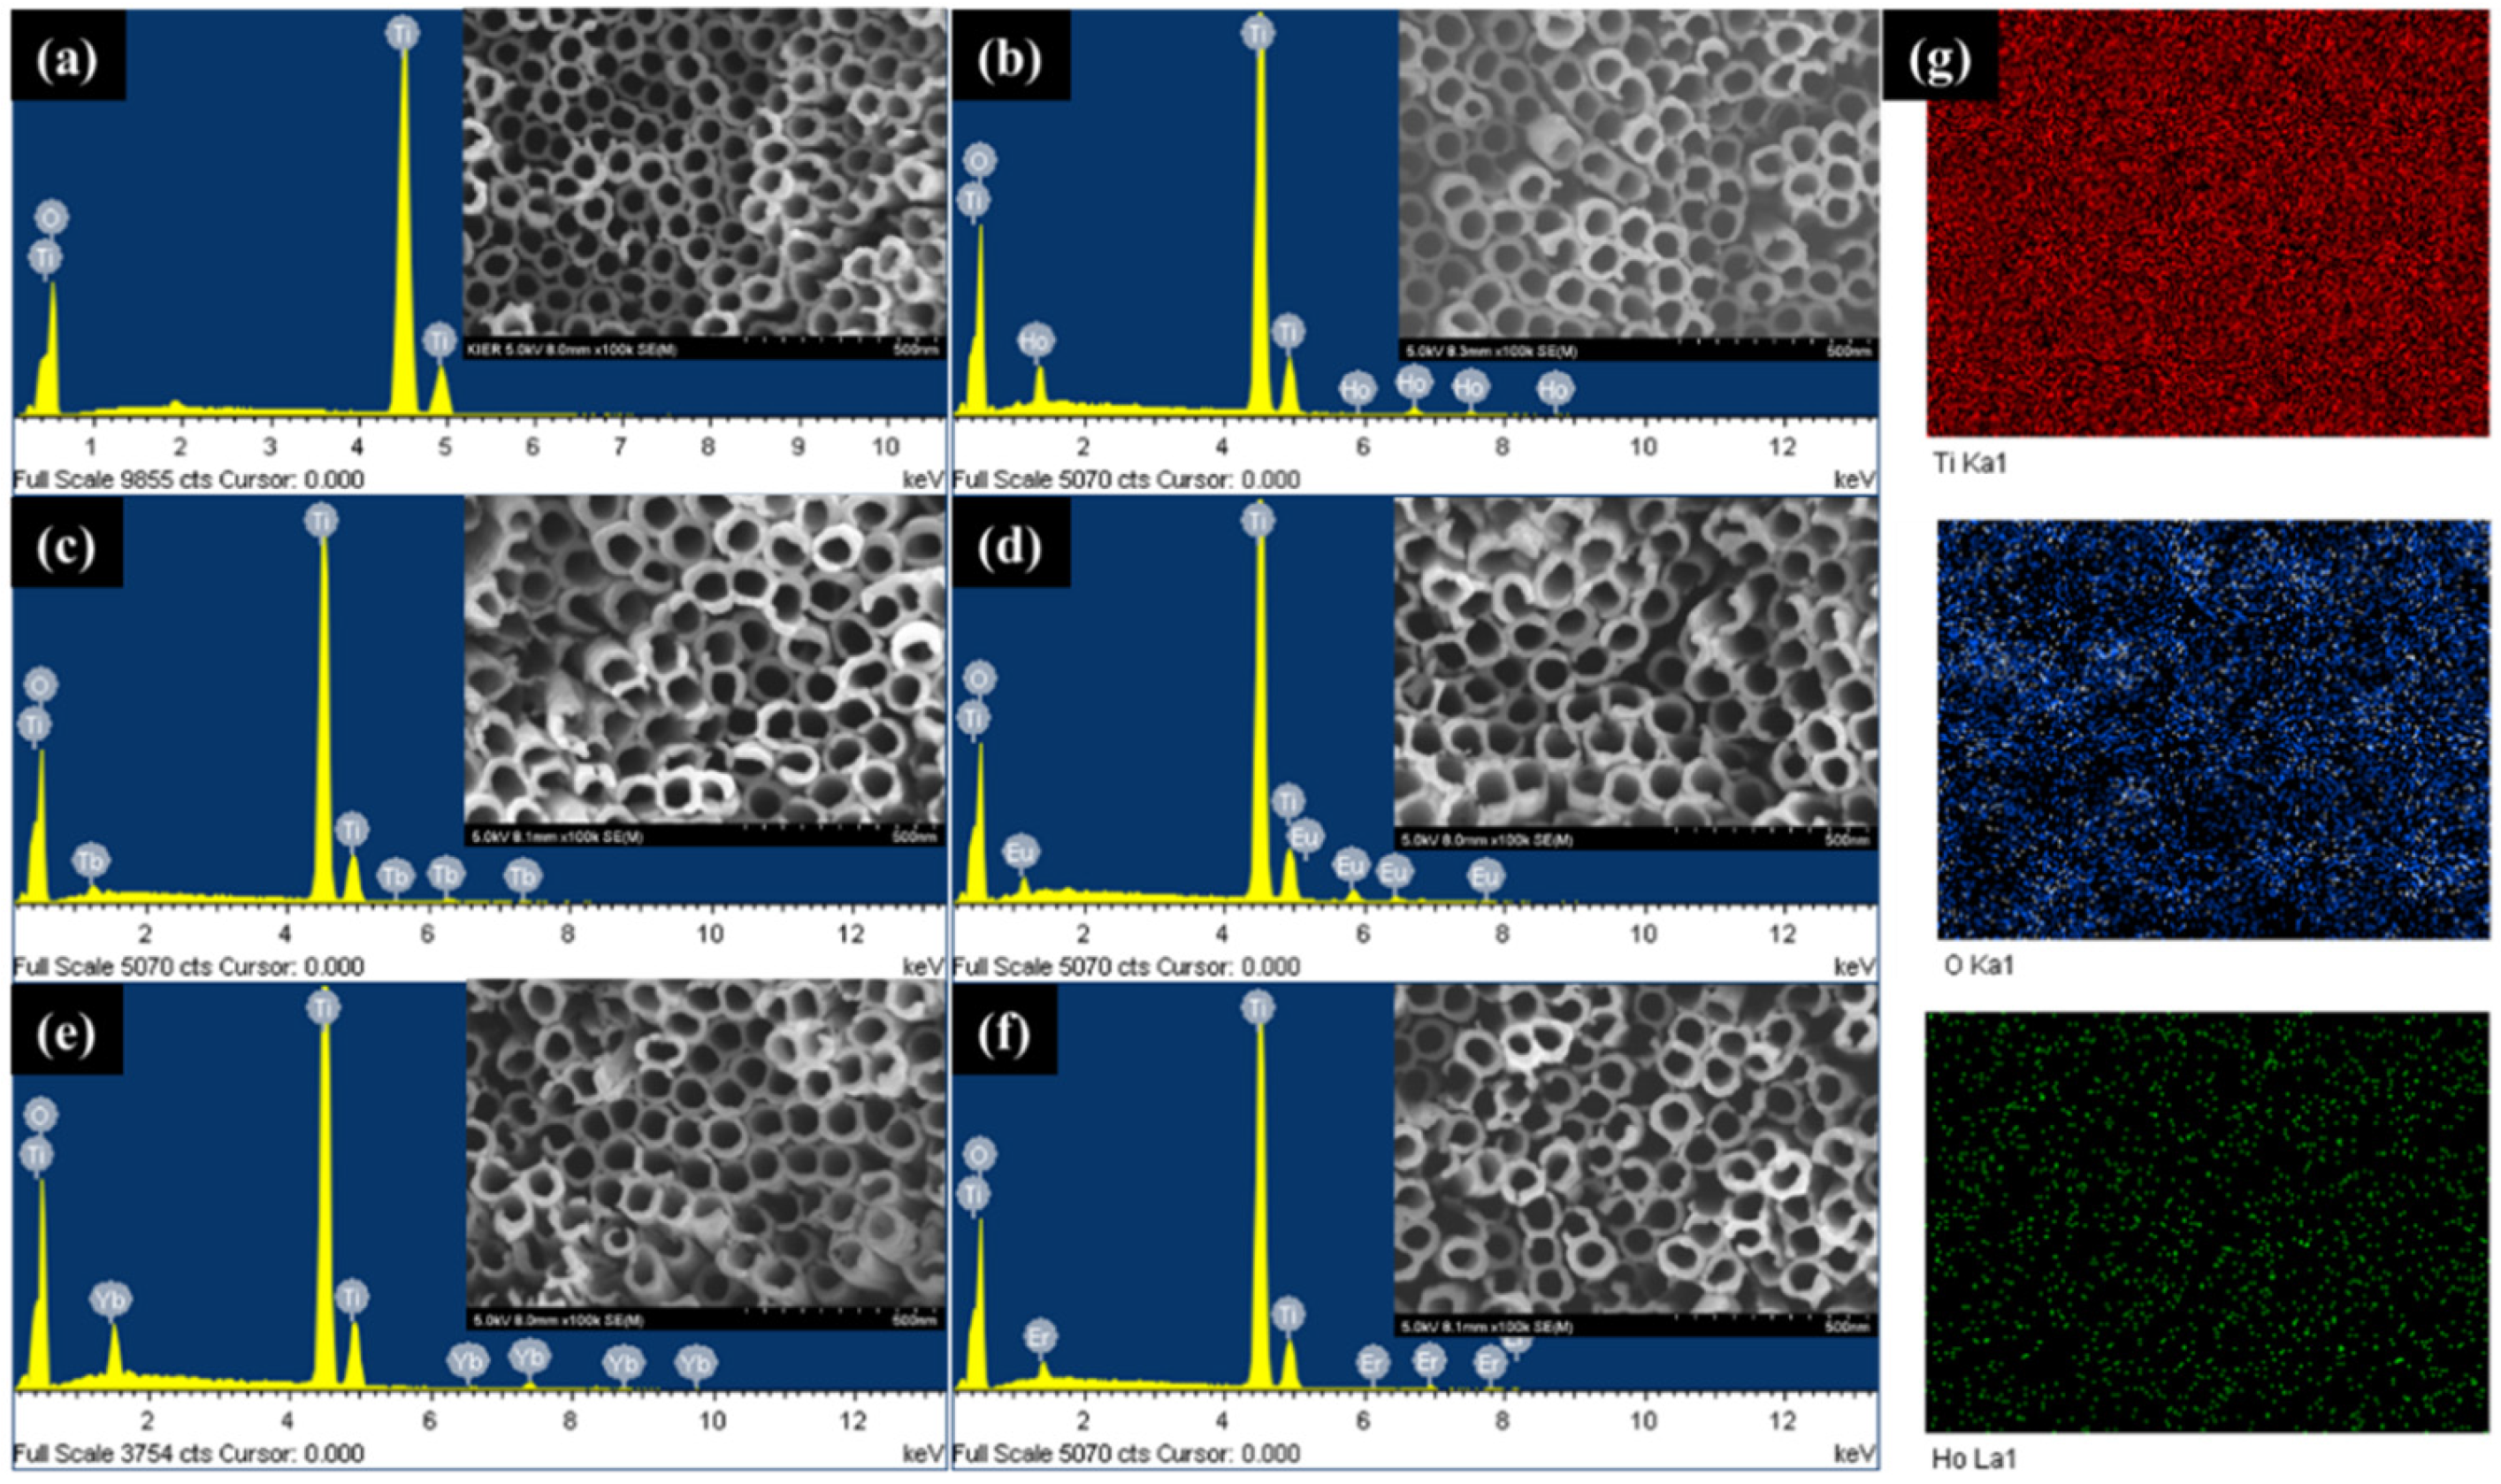
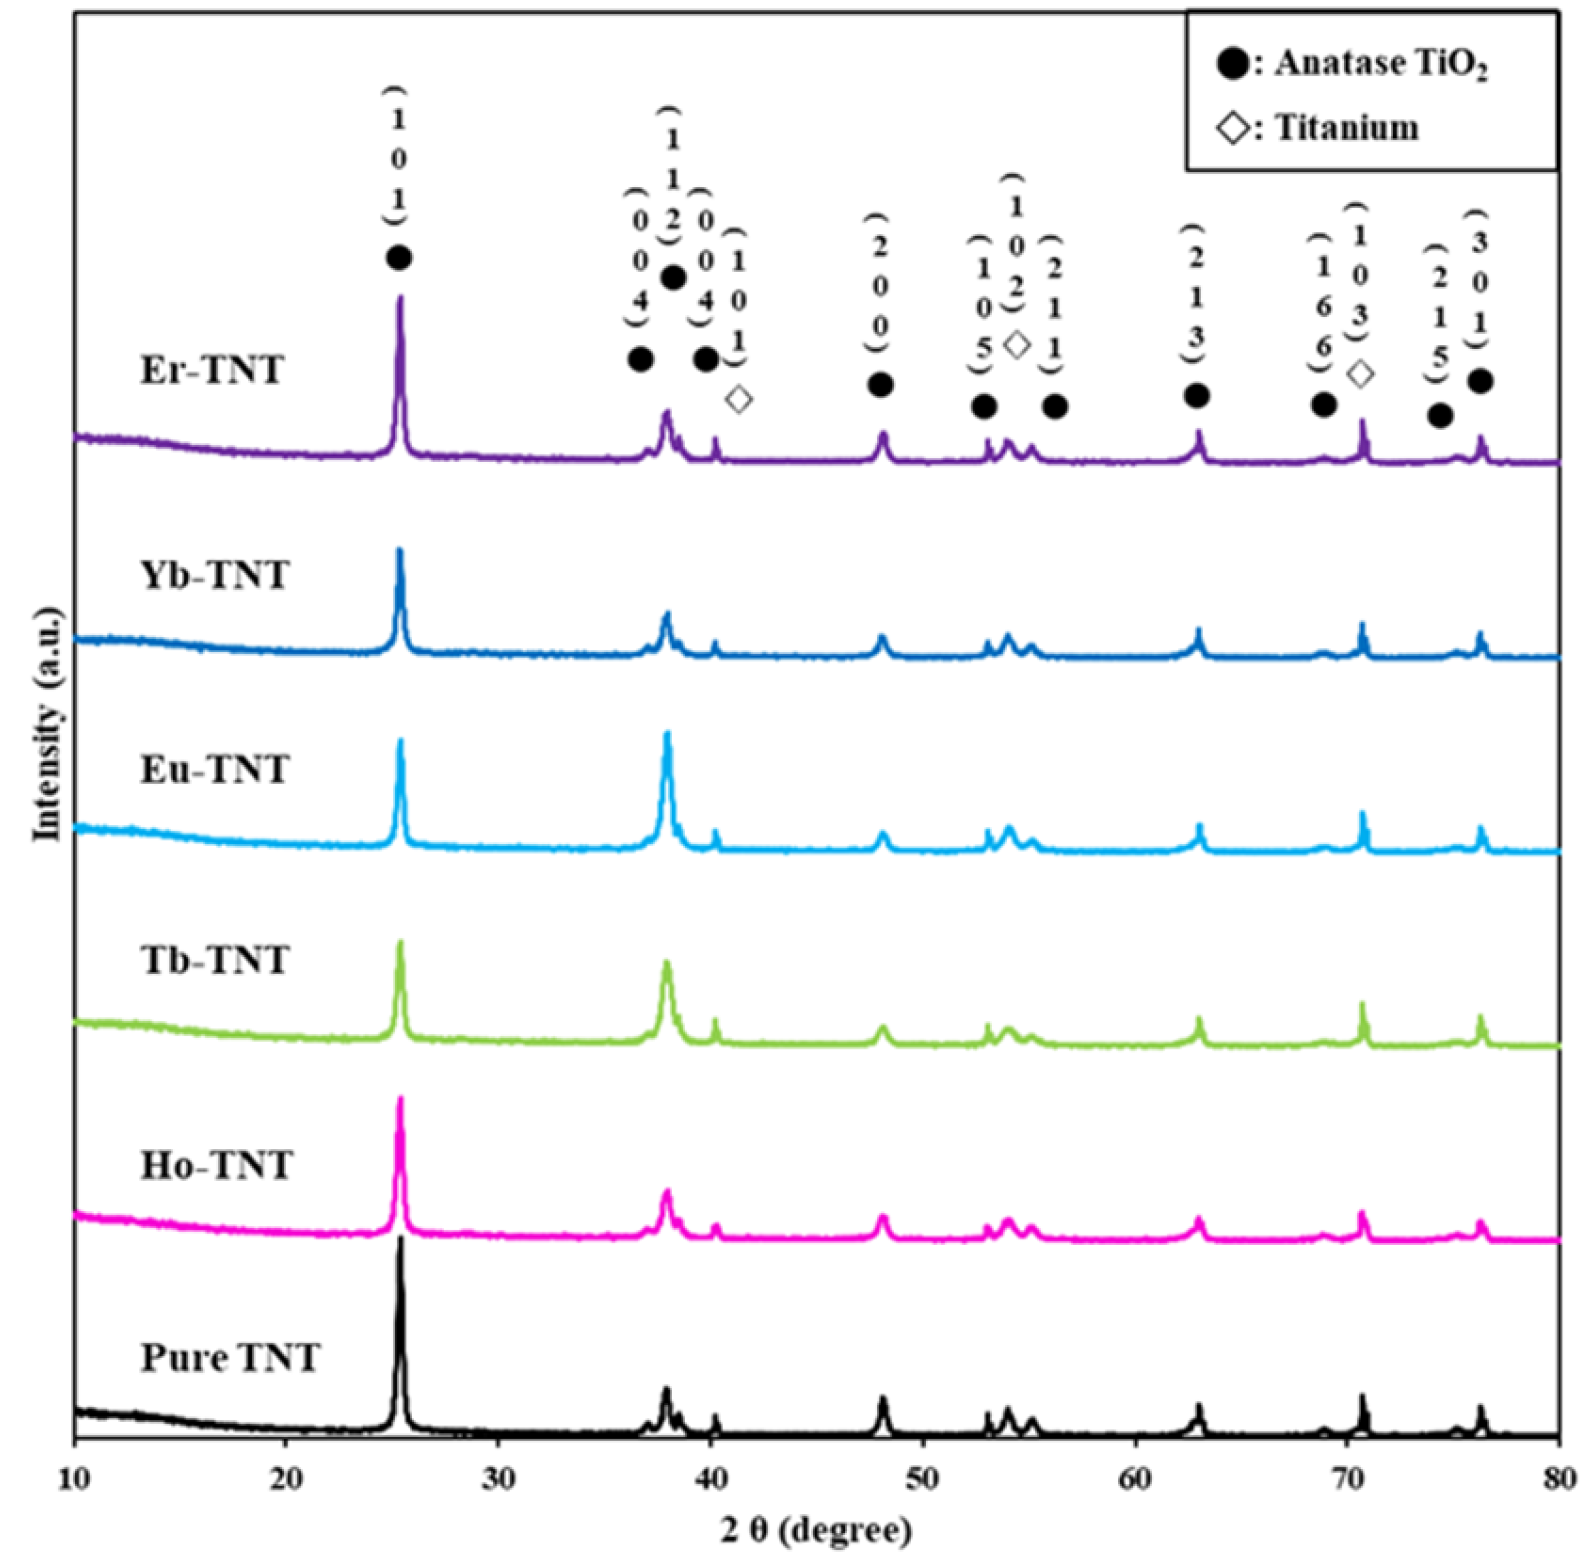
2.1. Morphology and Surface Characteristics of Lanthanide-Doped TiO2

The pure TNT and lanthanide (Ho, Tb, Eu, Yb, and Er)-doped TNT were analyzed through SEM and EDS to examine the surface morphologies and composition of each sample (Figure 1 and Table 1). The EDS pattern (Figure 1a–f and Table 1) indicated the presence of the lanthanide element in addition to the Ti and O elements from TiO2. The SEM results (insets of Figure 1a–f) indicated that all samples had a tubular structure of highly ordered nanotubes with vertically uniform morphology. The pore diameter was approximately 78 ± 5 nm, and the wall thickness was 19 ± 3 nm on average. The subsequent discussion of the PEC properties and performance shows that lanthanide doping through the electrochemical process influenced only the photocatalytic properties, and not the morphology of the TNTs. Figure 1g show the results for holmium-doped TNT (Ho-TNT), which represents the mapping analysis of all samples; Ti, O, and Ho elements of holmium-doped TNTs (Ho-TNT) were uniformly distributed over a large area.
The diffraction patterns of the as-synthesized samples obtained from the XRD analysis results are shown in Figure 2, and the crystallite size, refined lattice parameters, and cell volume are summarized in Table 1. Ti and TiO2 in the form of anatase were the commonly detected phases in the six types of prepared electrodes. They were tetragonal anatase structures of the (101), (103), (004), (112), (200), (105), (211), (213), (116), (215), and (301) crystal planes at the 2θ values of 25.28°, 36.94°, 37.8°, 38.57°, 48.04°, 53.89°, 55.06°, 62.68°, 68.76°, 75.02°, and 76.01°, respectively, according to JCPDS #00-021-1272. There was no crystalline phase transformation of TiO2 owing to the effect of lanthanide when the lanthanide (Ln)-doped TNTs were prepared using electrochemical doping. No diffraction peaks of a secondary phase such as pure Ln or Ln2O3 were detected because either the trace amount of the dopant was highly dispersed or the concentration of lanthanide ions was too low to be detected through XRD [21]. The average crystallite size of the (101) plane was calculated using the Scherrer equation. In our data, the average particle sizes (Table 1) were 351, 289, 279, 323, 337, and 341 Å for pure TNT, Ho-TNT, Tb-TNT, Eu-TNT, Yb-TNT, and Er-TNT, respectively. The crystallite size of every lanthanide (Ln)-TNT was smaller than that of the pure TNT because the formation of the Ln-O-Ti element bonds by TiO2 and the lanthanide metal restricted direct contact between the crystals, which inhibited the crystal growth of anatase [22]. An increase in the electrode surface area attributed to a reduction in the crystal size increased the photocatalytic reaction efficiency.

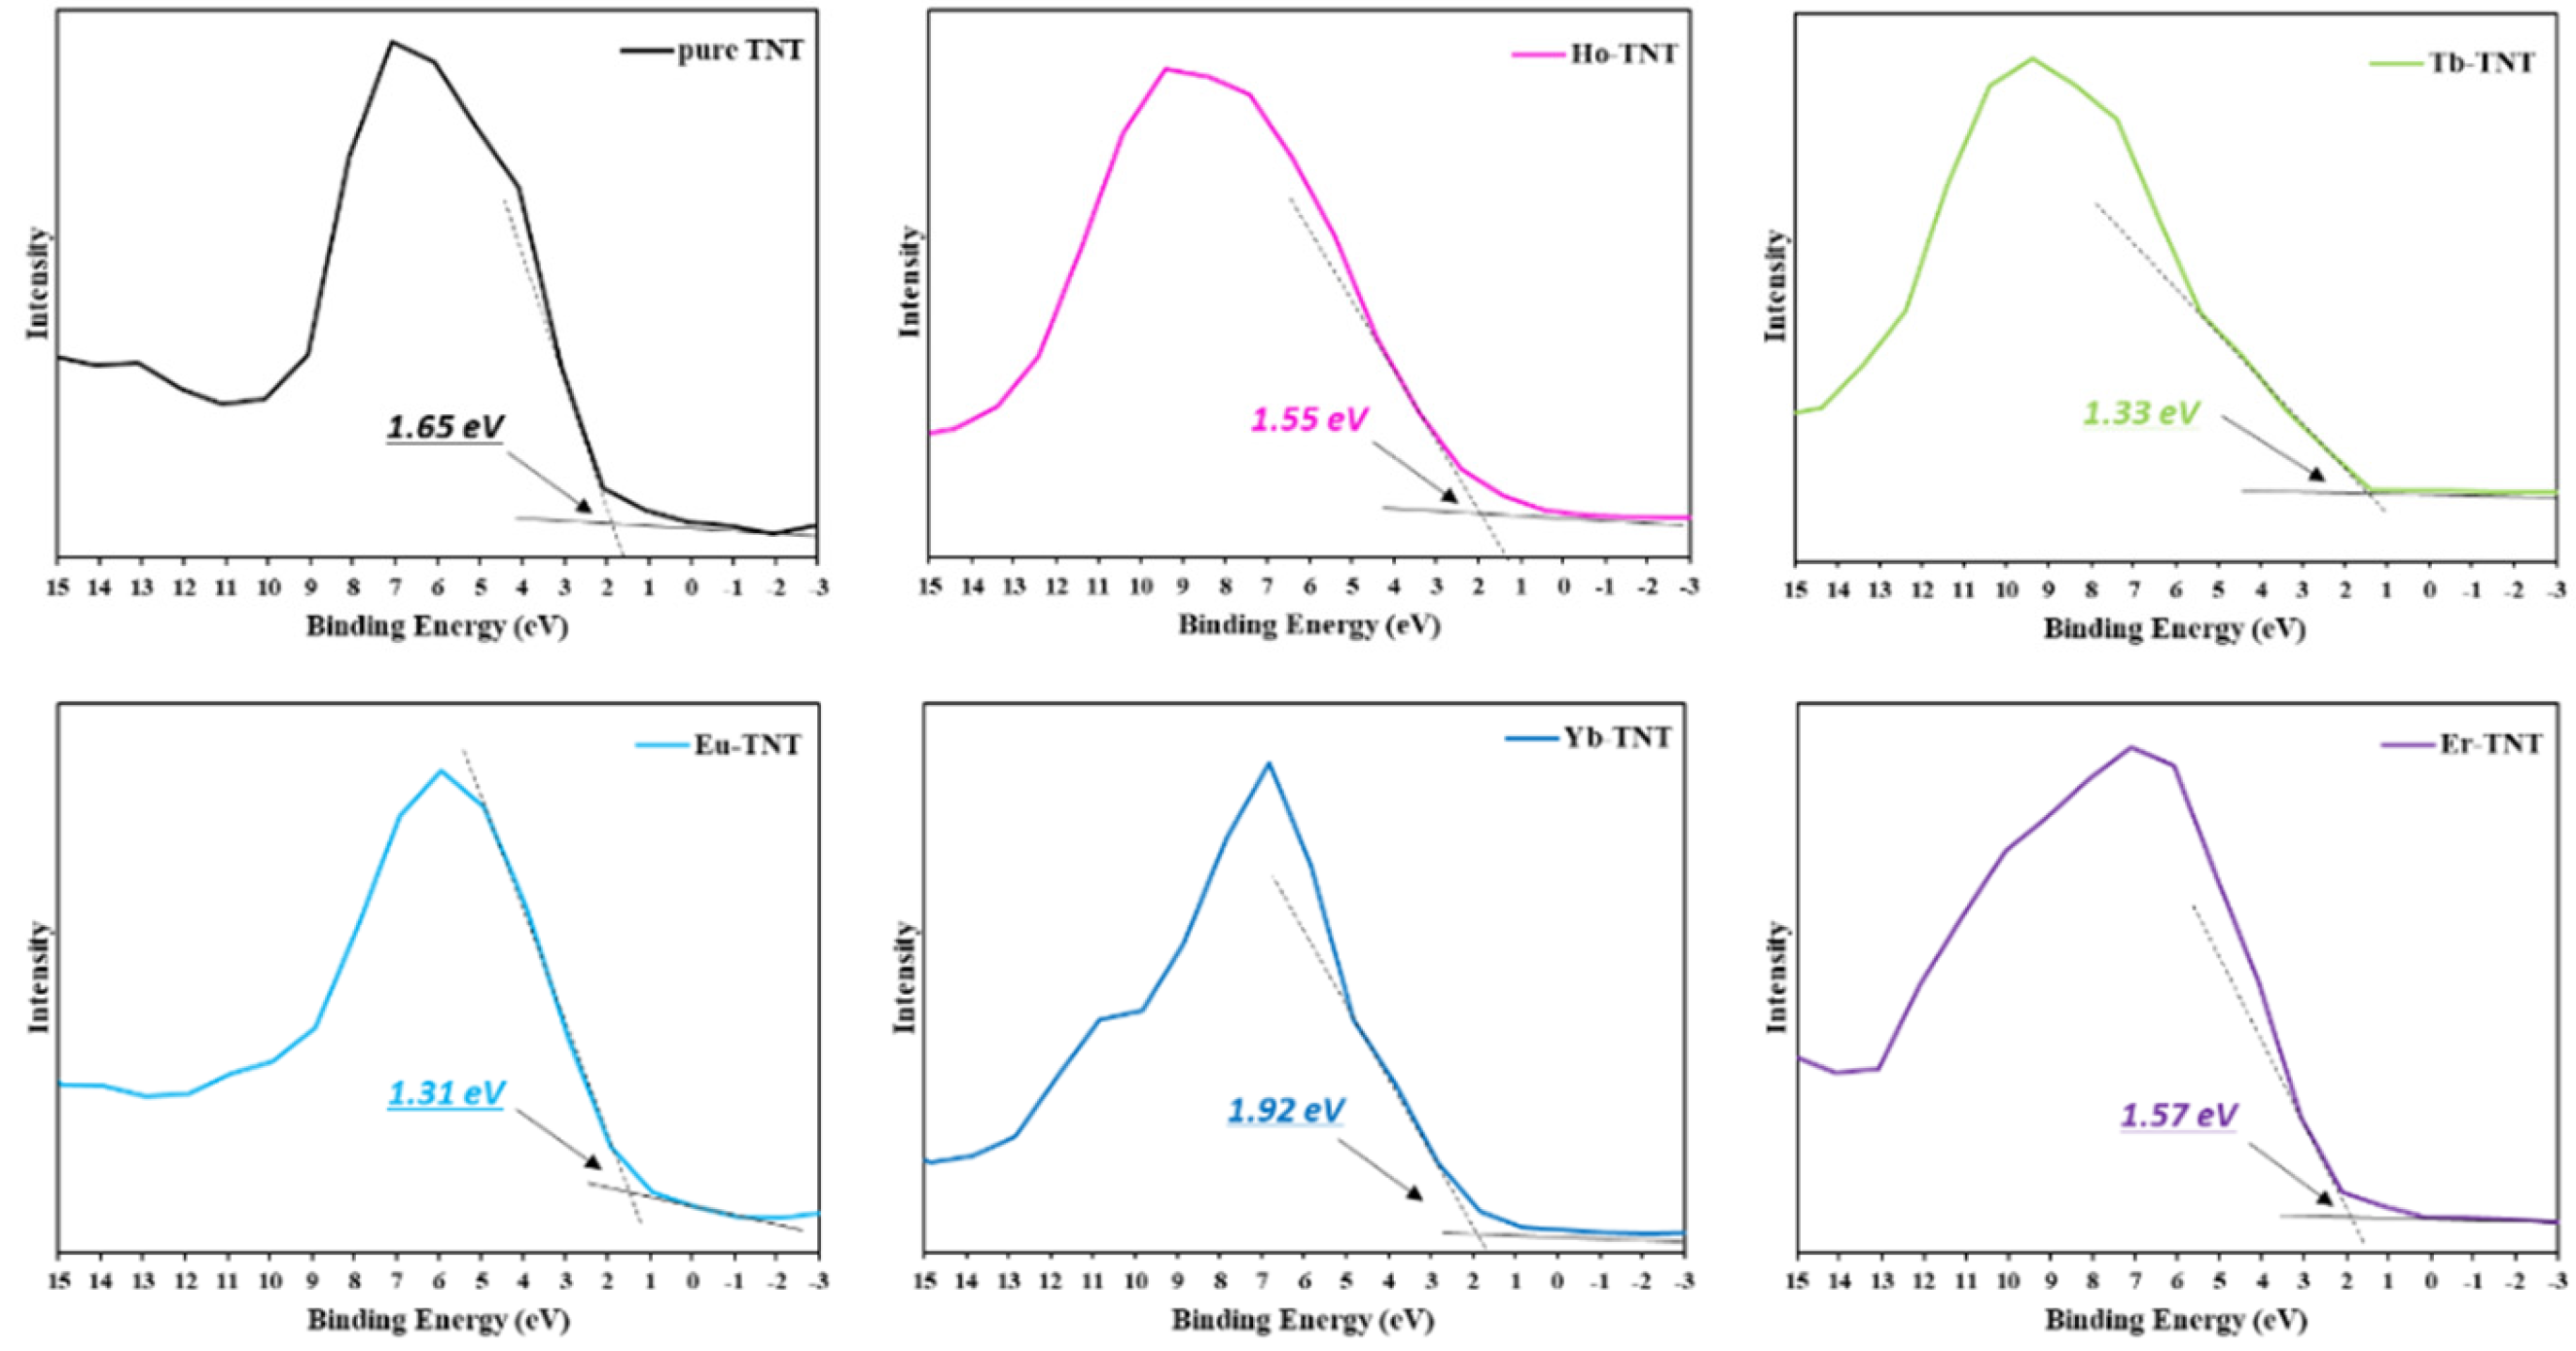
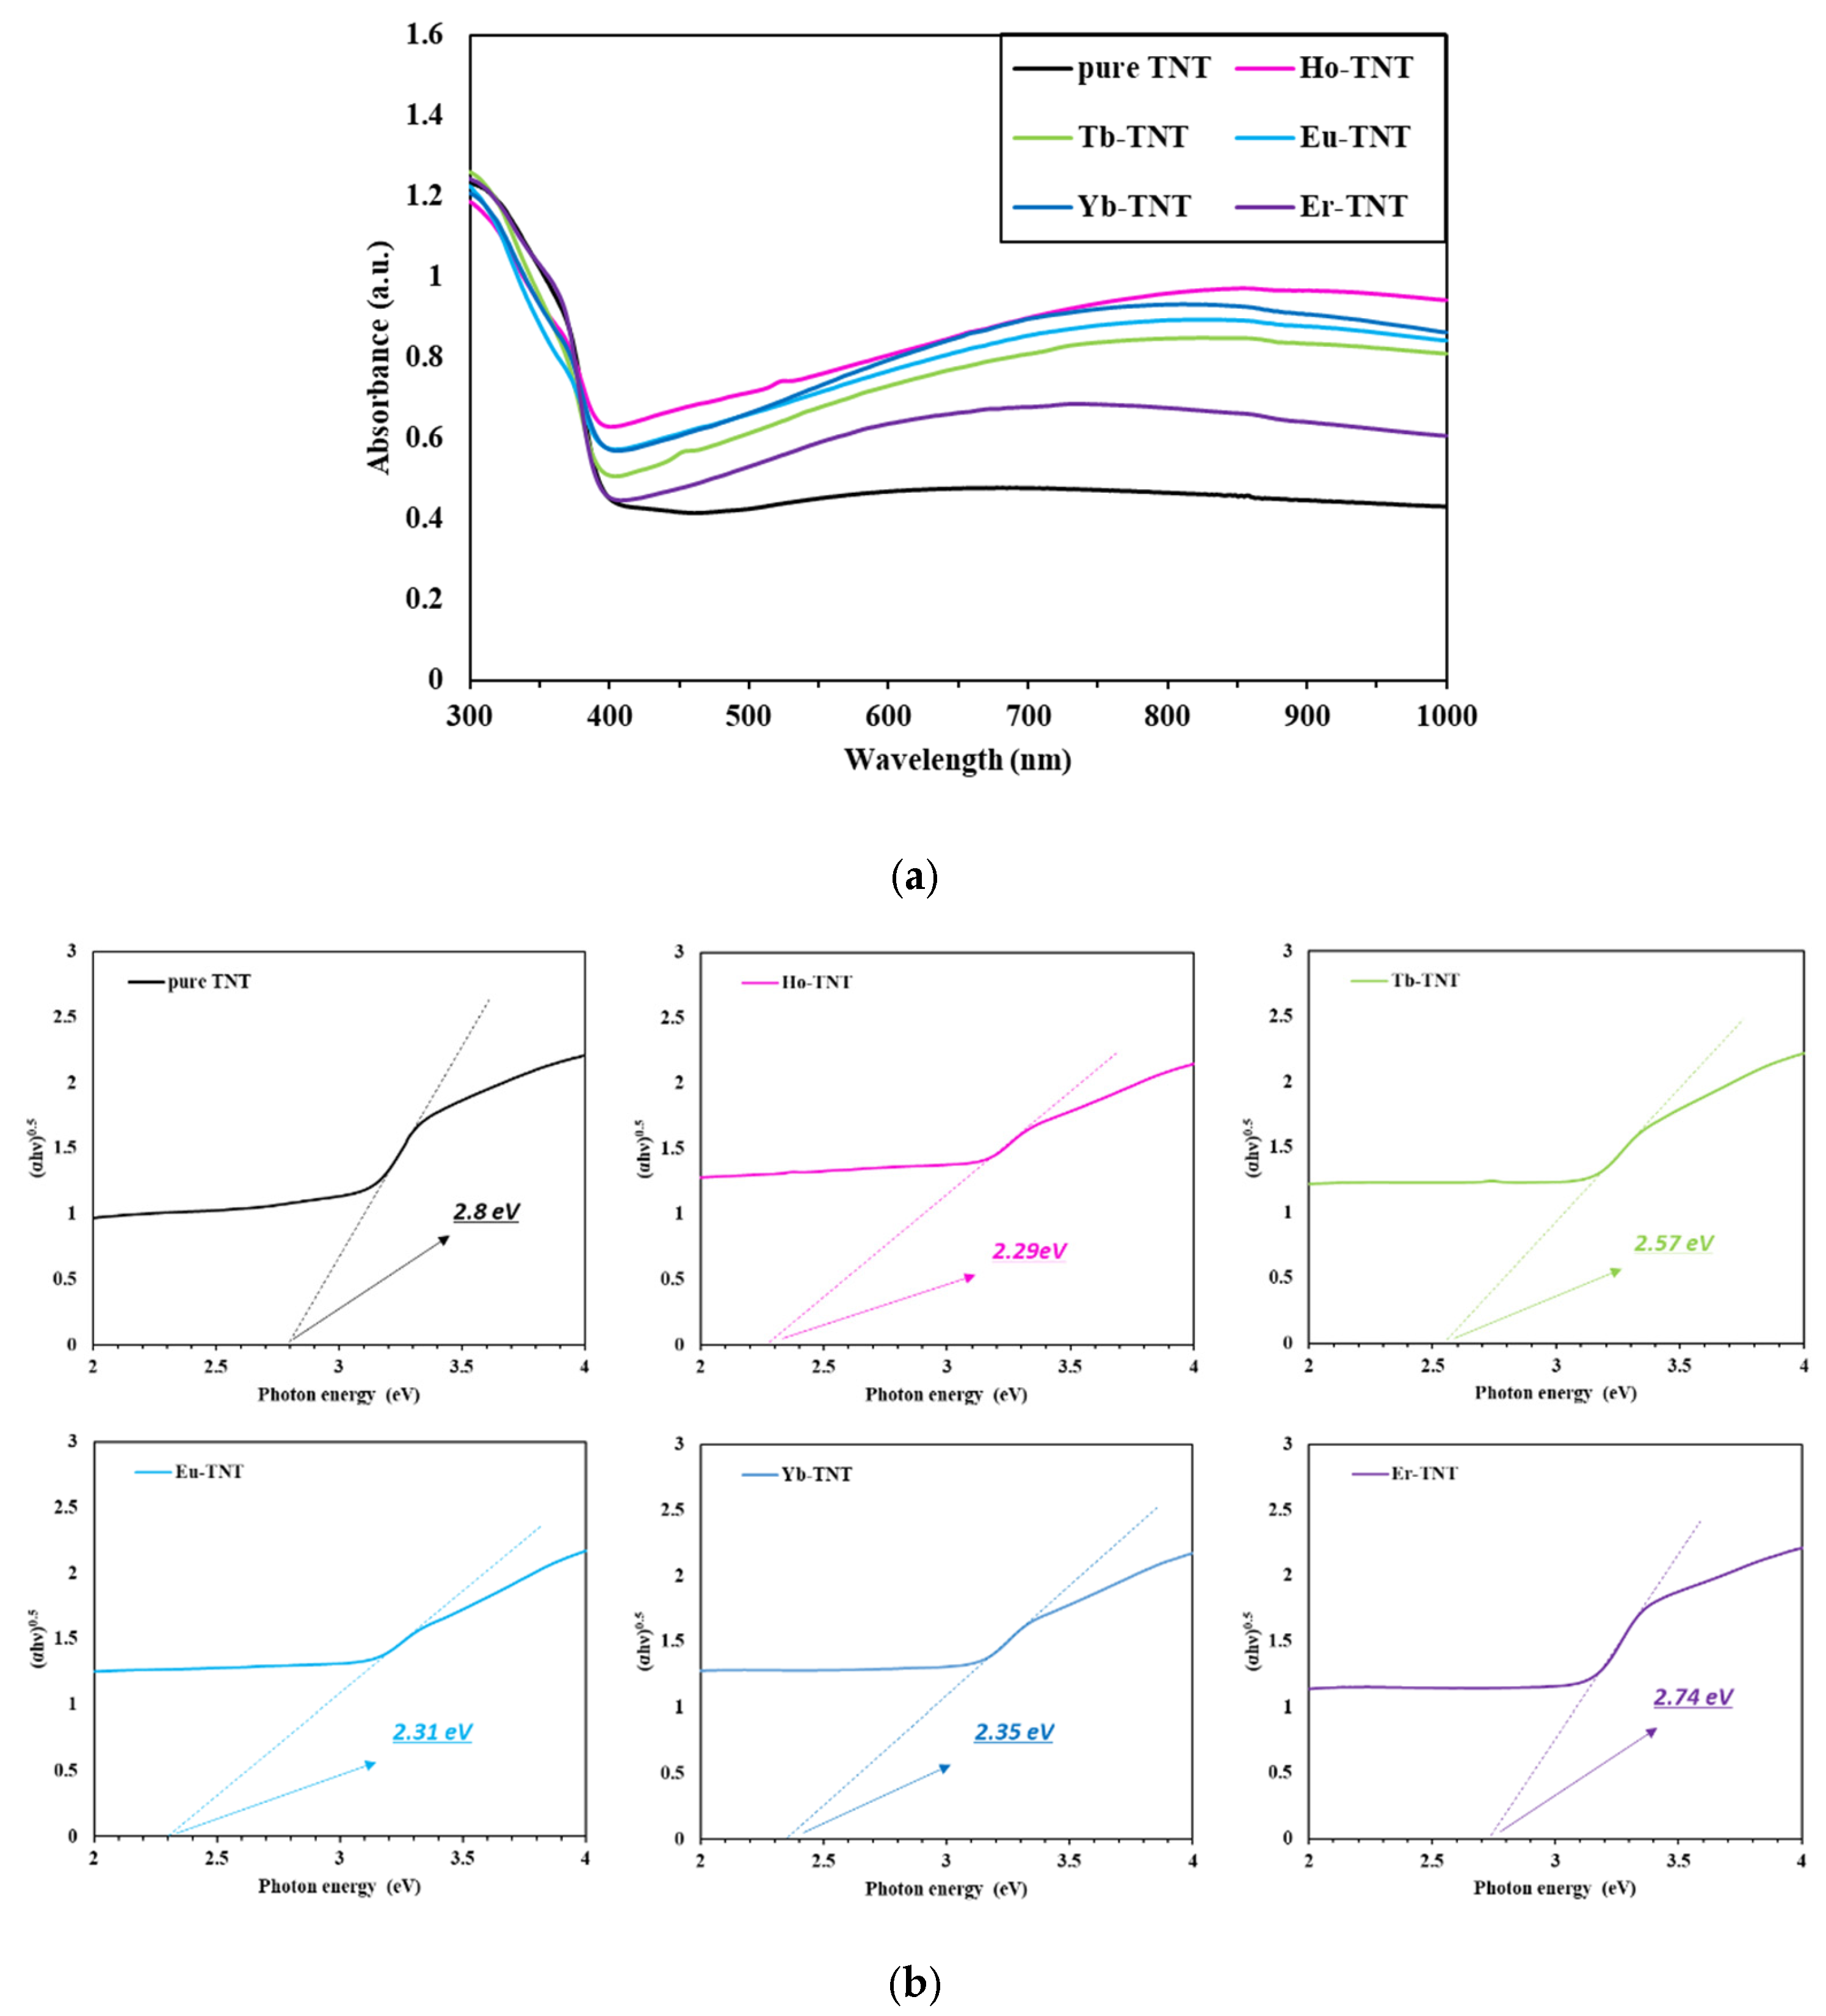
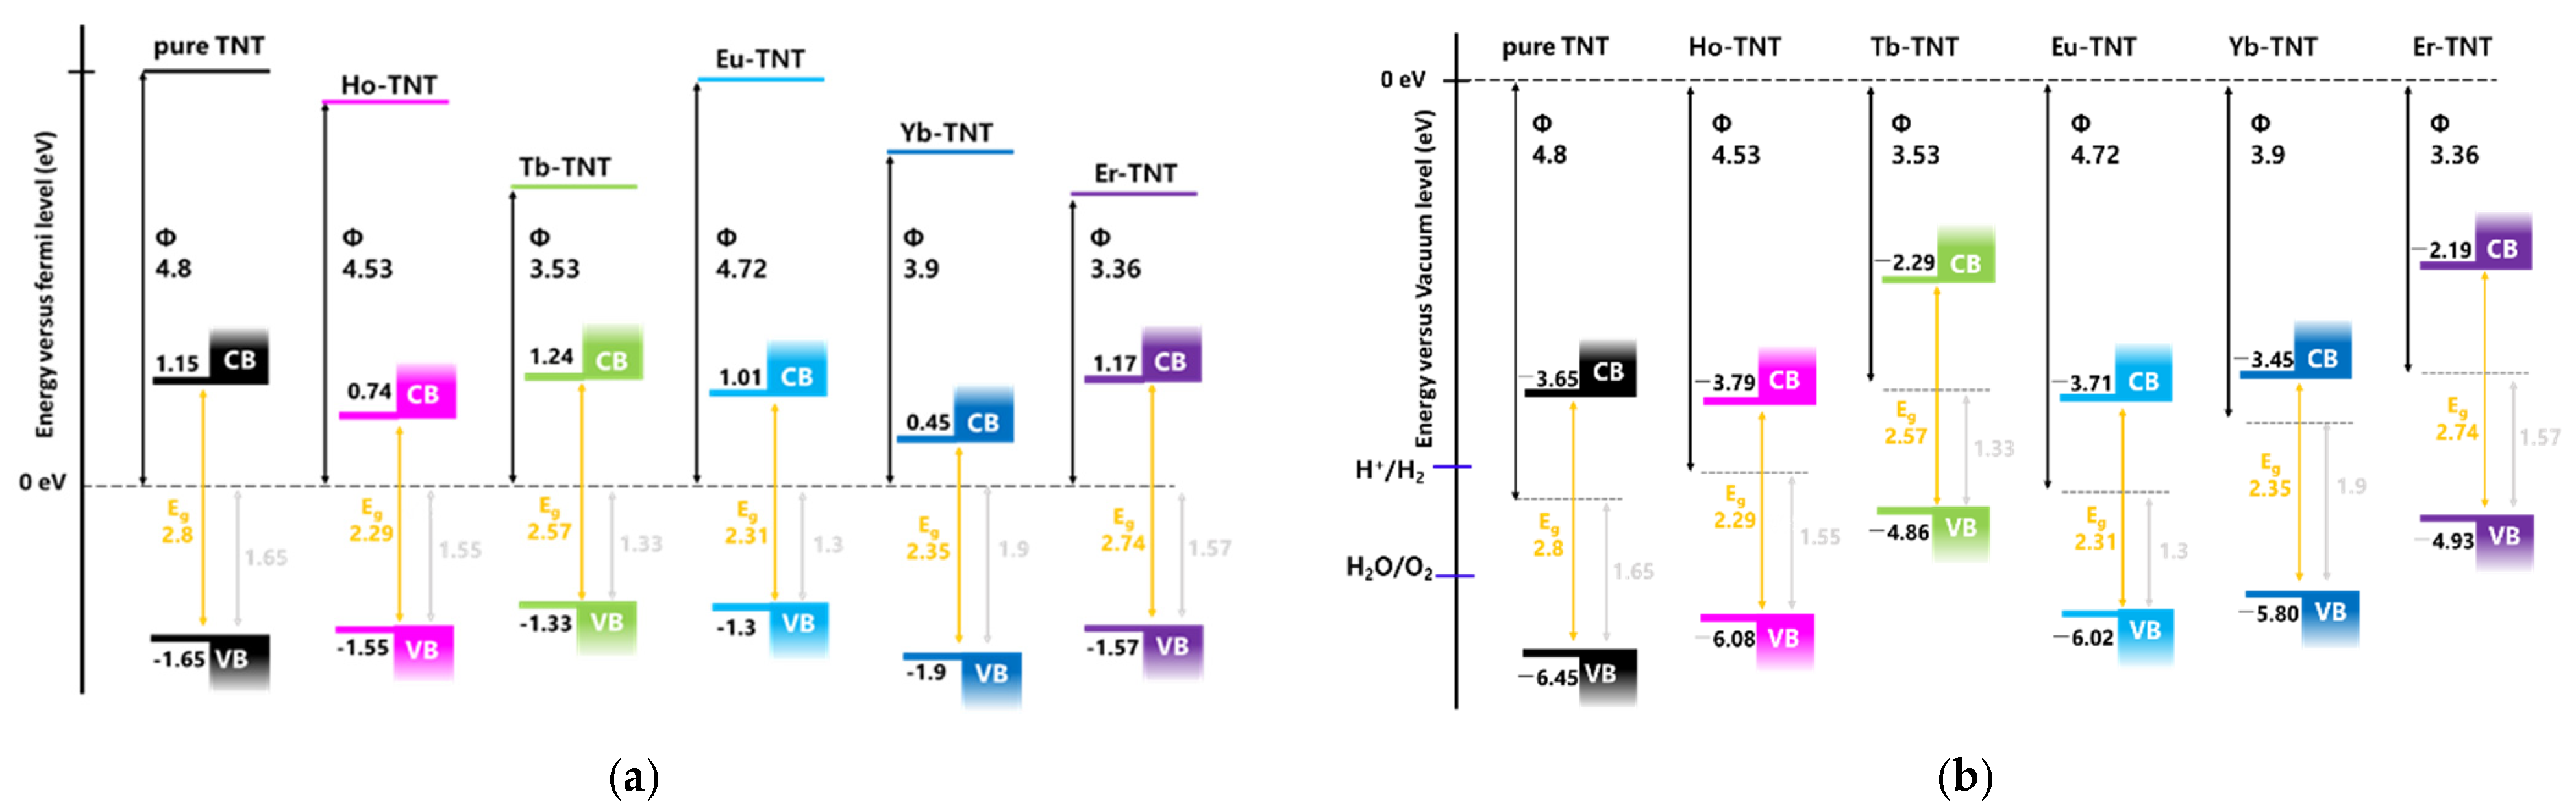
2.2. Electronic Structure and Optical Properties of Lanthanide-Doped TNTs

The effect of lanthanide doping on the energy level and band position of TiO2 was investigated by analyzing the as-prepared samples through UPS, XPS, and UV-DRS. The electronic work function is defined as the energy difference between the Fermi level and vacuum level; this function indicates the electromagnetic bonding strength of a catalyst—a material with low electronic work function facilitates electron transport [23]. Figure 3 shows the secondary electron cut-off area obtained through UPS analysis and the calculated work function. The electronic work function of a material can be obtained spectroscopically by subtracting the difference between the secondary electron cut-off and Fermi level from the incident photon energy; this can be expressed as [24]
φ = − (Ecut-offEf),
where φ, hν, Ecut-off, and Ef represent the work function (eV), excitation energy (here, 21.22 eV), secondary cut-off energy (eV), and Fermi level (eV), respectively. The calculated electronic work functions are summarized in Table 2. The work function of the pure TNT determined by secondary electron onset is 4.8 eV and it is shifted by 0.27, 1.27, 0.08, 0.9, and 1.44 eV after doping with holmium (Ho), terbium (Tb), europium (Eu), ytterbium (Yb), and erbium (Er), respectively (Figure 3 and Table 2). The work function of the lanthanide-doped TNT decreased when compared with that of pure TNT; this promoted electron transport and improved photoactivity.
The potential of the valence band maximum (VBM) positions was determined by linearly extrapolating the intersection of the background near the Fermi level and the leading edge [25]. Values obtained in Figure 4 are summarized in Table 2. The VBM of the pure TNT was −6.45 eV, and all doped TNTs up-shifted in the positive direction because of the creation of a new energy level within the bandgap by the lanthanide.
The bandgap is the minimum energy required for electrons to be excited from the valence band to the conduction band. It is critical for explaining the photocatalytic properties because it determines the wavelength range of light that can be absorbed. Therefore, the diffuse reflectance spectra were analyzed to examine the optical properties of the prepared samples and estimate the bandgap. Figure 5a shows the comparison of the variation in the absorbance according to the wavelength for the catalysts doped with lanthanide. All samples were photocatalysts based on TiO2 and commonly showed the maximum absorption wavelength in the UV range below 400 nm. The visible light range of the lanthanide-doped TNT increased noticeably when compared with that of pure TNT. The largest difference was observed in the case of the electrode doped with holmium. The introduction of lanthanide enables effective solar energy utilization by improving the light-harvesting properties in the visible light range [26]. Each prepared electrode was an indirect bandgap semiconductor, and the bandgap was determined based on the Tauc plot generated using [27]
(αhν)1/2 = A(hνEg),
where α, h, ν, A, and Eg represent the absorption coefficient, Planck’s constant (6.626 × 10⁻³⁴ J s), frequency of light (s−1), proportionality constant, and bandgap energy (eV), respectively.
The calculated bandgaps of the samples are depicted in Figure 5b and summarized in Table 2. The bandgap of Ho-TNT, which was the smallest among the samples, was 2.29 eV, i.e., smaller by approximately 0.5 eV than that of pure TNT; theoretically, it can absorb wavelengths of up to approximately 540 nm, which is consistent with the XRD results (Table 1), wherein the crystal size of Ho-TNT decreased by 17.66% when compared with that of pure TNT.
The valence and conduction bands of a semiconductor are fixed energy levels determined by the atomic arrangement structure, and they influence electronic properties of the material [28]. The energy difference (in electron volts) between the potentials at the VBM and conduction band minimum positions is referred to as the bandgap energy, which is an important factor that determines the photon energy of the photocatalyst. Therefore, energy diagrams are important for explaining the photocatalytic activity. In this study, the energy diagram is drawn based on the work function, valence band, and bandgap of the as-prepared samples obtained through the UPS, XPS, and UV-DRS analyses, as shown in Figure 6; the related band structure parameters are listed in Table 2.

2.3. Photoelectrochemical Characterization

The open-circuit potential (OCP) in photoelectrochemistry is the potential difference between the photoelectrode and counter electrode when the current is 0. Based on this definition, the OCP values obtained using |OCPlight − OCPdark| for a given PEC cell are listed in Table 3 [29]. Band bending that occurs in the photoanode during illumination, direction of movement of the photogenerated electrons, semiconductor type, and effect of lanthanide on the maximum potential difference generated spontaneously can be determined by measuring the OCP. The OCP results of pure TNT and lanthanide-doped TNT in Figure 7a can be divided into three steps from the perspective of electron transport. First, in the dark condition from 0 s to 60 s, upward bending occurred as the electrons of the photoanode moved until they attained electrochemical equilibrium with the Fermi level of the electrolyte [29,30]. Second, during the illumination of the photoelectrode from 60 s to 120 s, the photogenerated electrons accumulated on the photoanode simultaneously as the electrons of the photoanode were excited from the valence band to the conduction band because they were injected from the surface to the Ti substrate and the quasi-Fermi level shifted in the negative direction. This confirmed that all prepared electrodes were n-type semiconductors [31,32]. Lastly, the photogeneration of electrons did not occur when the light was blocked after 120 s; however, the electrons accumulated on the photoelectrode were recombined and the potential increased in the positive direction. Thus, the OCP of the photocatalysts reflects the photogenerated charge carrier density [33]. Figure 7a shows that doping with lanthanides results in higher OCP values than that of pure TNT, regardless of the type (Table 3). The OCP value of Ho-TNT was 0.63 V (vs. Hg/HgO), which is the largest among all electrodes. This result confirmed that the PEC reaction improved when the lanthanide ions were applied to the electrodes.
Figure 7b shows the photocurrent density measured for each catalyst when illuminated for intervals of 60 s at 1.5 V (vs. Hg/HgO). The photoreaction, reproducibility, and stability of the catalysts were examined during repeated on/off cycles of illumination via chronoamperometry analysis, and the values of the photocurrent density were compared with those in other electrochemical analysis results. The prepared electrodes showed fast photoreaction and stable reproducibility. In the case of Ho-TNT, the average photocurrent density under illumination (Jph) increased approximately 25 times compared with that of pure TNT. This trend is consistent with that of linear sweep voltammetry (LSV) and photoconversion efficiency.
Figure 7c shows the LSV analysis results of the prepared electrodes. The LSV analysis in photoelectrochemistry reflects the photoresponsive property of the electrode. The current value of an n-type semiconductor under the dark condition was not expressed in the graph because it is negligible [34]. This can be verified in the results for the dark condition in chronoamperometry. The order of the limiting current density of the photoelectrodes at 1.5 V (vs. Hg/HgO) was Ho-TNT (23.6 mA cm−2) > Eu-TNT (18.6 mA cm−2) > Yb-TNT (14.6 mA cm−2) > Tb-TNT (8.15 mA cm−2) > Er-TNT (7.21 mA cm−2) > pure TNT (1.03 mA cm−2). The holmium-doped TNT showed the highest photocurrent density, which is approximately 23 times higher than that of pure TNT. The photocurrent density can be used to comprehensively predict the efficiency of each reaction step in the PEC system because it indicates the light absorption by the photocatalysts and the generation, separation, and movement of electron/hole pairs. High light absorption and low resistance of the catalysts improve photoreaction efficiency. The following equation was used to represent this result as the photoconversion efficiency (PCE); the results are shown in Figure 7d [35]. η
η = t o t a l   p o w e r   o u t E l c t r i c a l   p o w e r   o u t p u t L i g h t   p o w e r   i n p u t × 100 % = j p     E r e v 0   E a p p   I 0 × 100 % ,
where η, j p , E r e v 0 , E a p p , and I 0 represent the PCE (%), photocurrent density (A cm−2), standard reversible potential (1.23 V vs. reversible hydrogen electrode (RHE)), electrode potential (vs. RHE) of the working electrode at which the photocurrent was measured under illumination, and power density of the incident light (W cm−2), respectively.
Table 3 shows that the order of the maximum photoconversion efficiency of the catalysts is Ho-TNT (2.68% (0 V vs. RHE)) > Eu-TNT (2.21% (0.08 V vs. RHE)) > Yb-TNT (2.19% (0 V vs. RHE)) > Er-TNT (1.59% (0 V vs. RHE)) > Tb-TNT (1.55% (0 V vs. RHE)) > pure TNT (0.29% (0.22 V vs. RHE)). The photoconversion efficiency per unit area of the catalyst decorated with Holmium was 9.24 times higher than that of pure TNT.

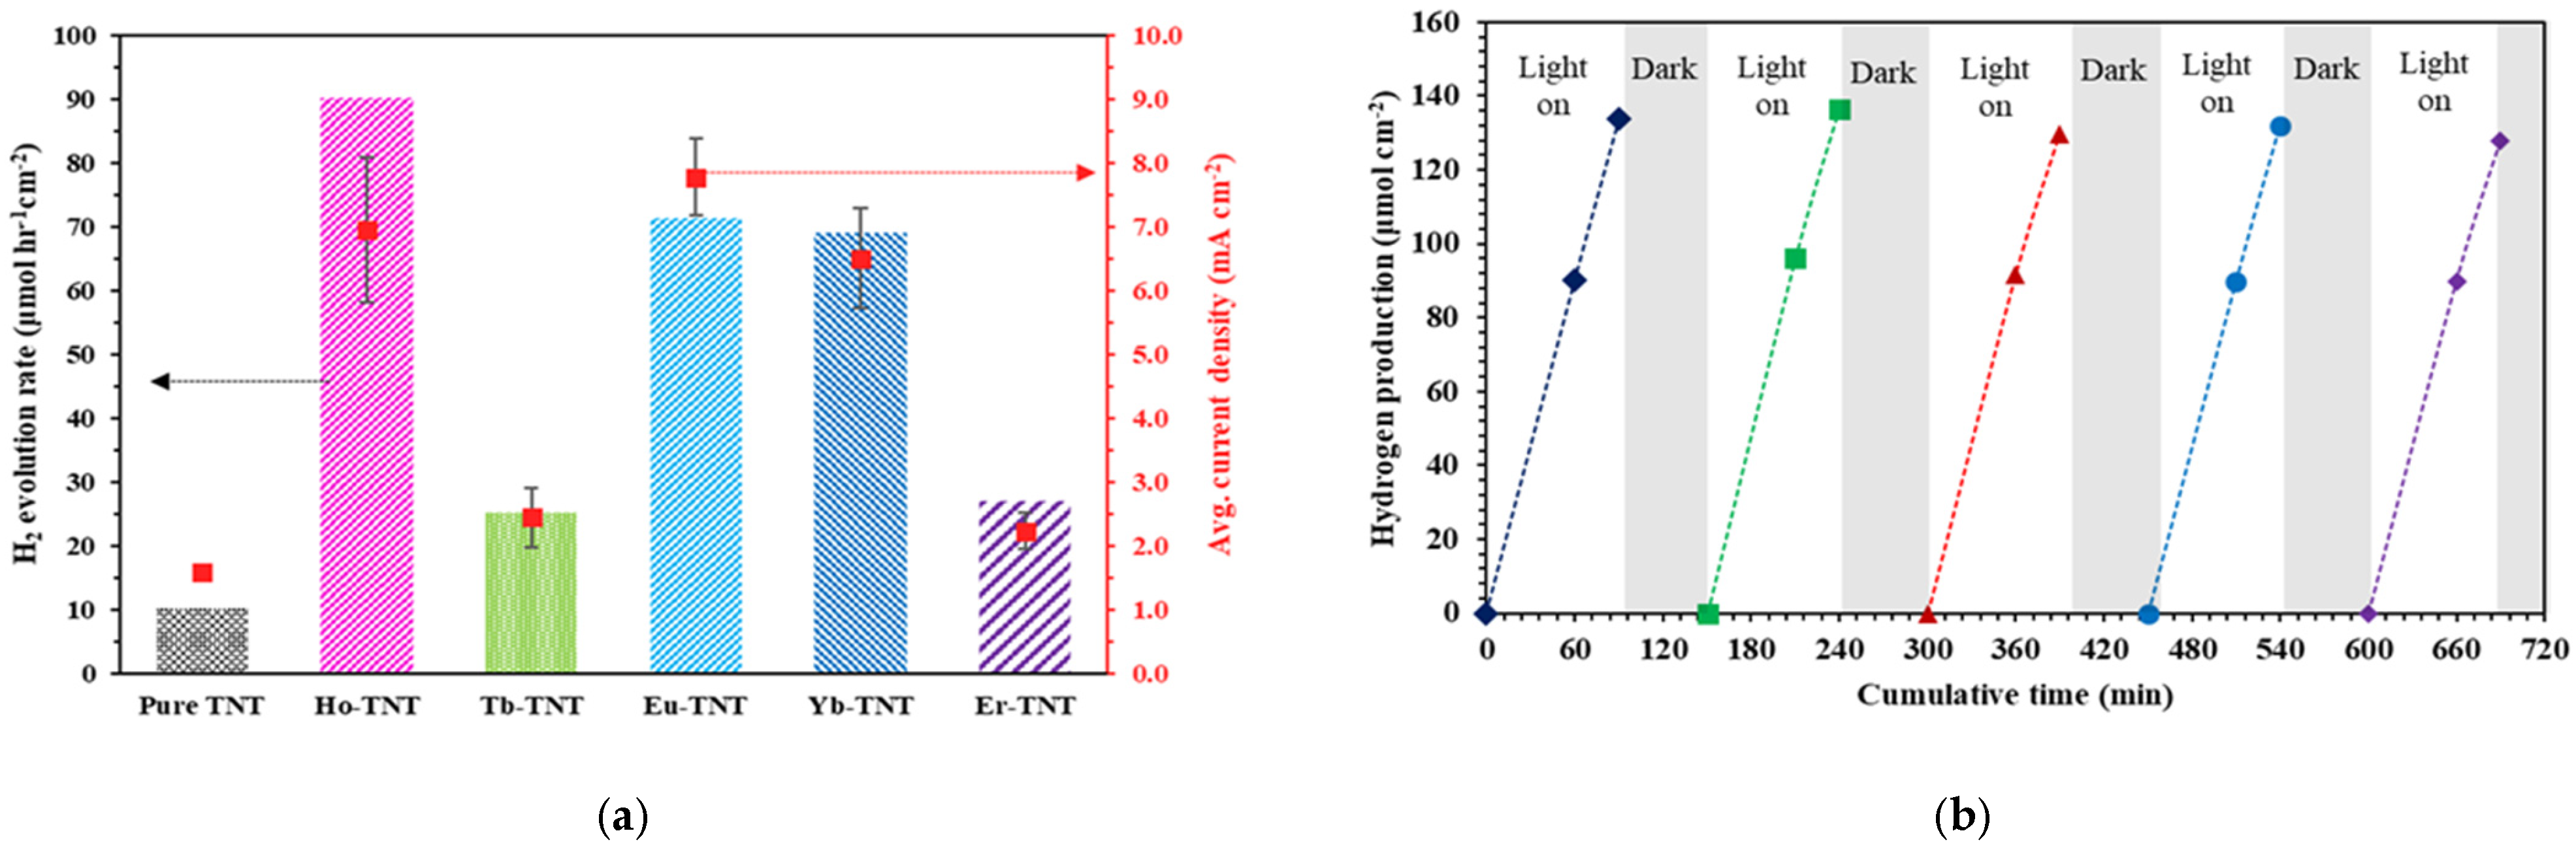
2.4. Photoelectrochemical Performance of Lanthanide-Doped TNT

Figure 8a shows the results of comparing the PEC activities of the modified photoelectrodes in terms of the hydrogen evolution from water splitting and average reaction current density. The order of the hydrogen evolution rates of the prepared catalysts was Ho-TNT (90.13 μmol cm−2h−1) > Eu-TNT (71.33 μmol cm−2h−1) > Yb-TNT (68.91 μmol cm−2h−1) > Er-TNT (26.95 μmol cm−2h−1) > Tb-TNT (25.18 μmol cm−2h−1) > pure TNT (10.28 μmol cm−2h−1). The hydrogen evolution rates of the modified photocatalysts increased by 2.4–8.7 times compared with pure TNT. The hydrogen evolution rate of Ho-TNT, which showed the highest activity, was approximately 1.2–3 times higher than those of the other lanthanide-doped TNTs. The PEC reaction current density, which is used as an indicator for the activities of the photoelectrode, also showed a similar trend. The hydrogen production rate of Ho-TNT can be converted into 45,065 μmol g−2h−1, customary units of photocatalyst powders (weight of 1 × 1 cm2 catalyst peeled off = ca. 2 mg). However, t is difficult to compare with photoelectrochemical activities of other studies because the experimental conditions are different.
The electronic work function indicates the ease of electron transport of materials. Hence, it was predicted that a lower work function suggests higher activity; however, Tb-TNT and Er-TNT exhibited PEC properties that were unfavorable to the hydrogen evolution rate, which was low even though the materials had relatively low work functions among the lanthanide-doped TNTs. Figure 6b compares the energy diagrams of the catalysts vs. the vacuum level; the valence band edge and conduction band edge of Tb-TNT and Er-TNT are beyond the oxygen evolution reaction potential (−5.67 eV vs. vacuum) [36]. The activities of Tb-TNT and Er-TNT were better than that of pure TNT, even though the oxygen evolution reaction was thermodynamically impossible because the conditions were favorable for the reaction of SO42−/SO32− (Eeq(V) = −0.107 V −0.0591 pH at 25 °C) in the electrolyte (Na2SO3) [37,38] and the electron/hole recombination decreased consequently.
Figure 8b shows the repeated experimental results of Ho-TNT, which showed the highest activity with regard to hydrogen evolution. Five repetitions of the experiment were conducted with the same catalyst. After checking the hydrogen generation rate under illumination for 90 min in one cycle, the electrolyte was replaced with a fresh sample under the dark condition, and oxygen was removed from inside the reactor by purging for 1 h. The photocatalytic activity remained constant without significant variations during the reaction cycles, which helped establish the potential of Ho-TNT for reuse and reproducibility. Ayon et al. [39] explained the reduction in the charge carrier recombination rate by introducing Ho3+ doping in ZnO nanoparticles, which helped control bandgap tuning by the holmium 4f states. Pan et al. [40] fabricated HoTixOy dielectric films and achieved satisfactory electrical characteristics such as high current and high mobility through electron trapping; thus, applying Holmium to photocatalysts can increase the photocatalytic activity because of various synergetic effects. Consequently, doping the crystal structures of TNTs with lanthanide ions can improve the PEC performance by enhancing light harvesting and facilitating electron transport. An important factor to be considered here is band structure engineering to ensure appropriate positioning.

3. Materials and Methods

3.1. Preparation of TiO2 Nanotubes

TNTs were prepared using the anodization process. TNTs on a titanium substrate decorated with erbium and reduced graphene oxide for hydrogen production was reported in our previous study [13]. In this study, we focused on a series of lanthanide ion-doped TNTs. First, titanium foil (0.25 mm thick, 99.6% pure, Goodfellow, Cambridge, UK) was cut into 2 cm × 5 cm pieces and sonicated for 20 min in ethanol (Duksan Chemicals Co., Ansan, Korea) and distilled water to remove the impurities from the surface. Then, it was etched with diluted hydrofluoric acid (Duksan Chemicals Co., Korea), thoroughly washed with deionized (DI) water, and dried at room temperature (approximately 25 °C) overnight. The anodization process was performed with a two-electrode system that comprised a pretreated Ti foil as the anode, Fe foil as the cathode, and 0.5 M ammonium fluoride (purity > 97%, Junsei Chemicals Co., Tokyo, Japan), 2 vol.% DI water, and ethylene glycol (purity > 99.5%, Ducksan Chemicals Co., Korea) as the electrolytes. The two electrodes were separated by 2 cm and connected to a power supply. After anodization under a constant current of 0.1 A for 150 min, the resulting amorphous TiO2 was rinsed with DI water several times and then dried at room temperature (approximately 25 °C) overnight. The amorphous TiO2 was annealed at 450 °C in an oxygen atmosphere (400 mL min−1) for 2 h to obtain TNTs in the anatase crystalline phase.

3.2. Preparation of Lanthanide-Doped TiO2 Nanotubes

The lanthanide-doped TNT was prepared using the electrochemical process in a two-electrode system [41]. Three cells were prepared with the following structure: amorphous TiO2 as the working electrode, Pt gauze (52 mesh, 99.9% trace metals basis, Sigma-Aldrich, Burlington, MA, USA) as the counter electrode, with a distance of 2 cm between the two electrodes, and 150 mL of 0.01 wt.% Ln2(NO3)3 aqueous solution (Ln3+ = Ho3+, Tb3+, Eu3+, Yb3+, and Er3+) as the electrolyte. Electrochemical doping was conducted with a constant current of −0.1 mA cm−2 for 200 s. The samples were then washed with distilled water, dried at room temperature (approximately 25 °C) overnight, and annealed in oxygen atmosphere (400 mL min−1) at 450 °C for 2 h.

3.3. Characterization

The morphologies and elemental composition of the as-prepared samples were studied using a field-emission scanning electron microscope (FE-SEM, HITACHI S-4800, Tokyo, Japan) equipped with an energy dispersive X-ray spectrometer (EDS). The crystalline phase was identified by analyzing the X-ray diffraction (XRD, Dmax-2500pc, Rigaku, Tokyo, Japan) with Cu Kα radiation (λ = 0.15418 nm) at 60 kV, 300 mA, and 2θ range of 20–80°. The work function of the prepared catalysts was measured using ultraviolet photoelectron spectroscopy (UPS, AXIS Supra, Kratos Analytical Ltd., Manchester, UK). A helium discharge lamp (He I, 21.22 eV) was used as the excitation source. X-ray photoelectron spectroscopy (XPS) was performed using a K-alpha (Thermo Scientific Co., Ltd., Waltham, MA, USA) spectrometer equipped with an Al K-alpha monochromator X-ray source to measure the elemental composition and chemical and electronic states of the elements within the materials. The binding energy scales of all recorded spectra were calibrated with reference to the C 1s peak at 284.5 eV. Ultraviolet–visible diffuse reflectance spectroscopy (UV–Vis DRS, SolidSpec-3700 spectrometer) of the samples was performed to measure the absorbance in the 300–1000 nm range.

3.4. Electrochemical Characteristics

All electrochemical analyses of the samples were conducted using a three-electrode cell system and an electrochemical analyzer (ZIVE, WonATech, Seoul, Korea). The prepared electrode was used as the working electrode, and a gasket made of Teflon was set on the edge of the electrode to irradiate an area of 1 cm × 1 cm. The counter electrode was made of a platinum wire (2.6 g, diameter 1.0 mm, 99.9% trace metals basis, Sigma-Aldrich, USA), and the reference electrode was made of Hg/HgO (1.0 M NaOH inner solution). A 1000 W Zenon lamp (Oriel, Stratford, CT, USA) was used as the light source. The light intensity irradiated on the electrode was adjusted to 44 mW cm−2 (at 360 nm) using a portable radiometer (UM320, Minolta Co., Tokyo, Japan). The light source and intensity conditions were identical to those applied in the PEC water splitting experiment.

3.5. Photoelectrochemical Water Splitting Experiment

The PEC water splitting experiment was performed with a two-electrode system (Figure S1). The prepared electrode was used as the photoanode, and a platinum wire (2.6 g, diameter of 1.0 mm, 99.9% trace metals basis, Sigma-Aldrich, USA) was used as the cathode; the electrolyte was composed of 25 mL of 0.1 M Na2SO3 (purity ≥ 98%, Sigma-Aldrich, USA). A gasket made of Teflon was attached to the photoanode to achieve an illumination area of 1 cm × 1 cm. Before the reaction experiment, the reactor was purged with Argon (purity 99.999%) for at least 30 min to remove oxygen from inside the reactor and electrolyte. The two electrodes were connected to an electrometer (2450 SourceMeter, Keithley, Tektronix Company, Beaverton, OR, USA) and the hydrogen production rate was analyzed by illuminating at 1.5 V for 90 min. The generated product was sampled in 300 μL units and analyzed through gas chromatography (7890A, Agilent Technologies, Santa Clara, CA, USA).

4. Conclusions

A series of lanthanide-doped TNTs were manufactured by introducing lanthanides based on highly ordered TNTs prepared through the anodization process to improve the efficiency of PEC water splitting. It was confirmed that lanthanide ions enhance the activity of catalysts without transforming the anatase crystal structure of the TNTs. The combination of holmium with TNTs strengthened the photocatalyst activity through high charge carrier separation and transportation, high catalytic activity, and stability attributed to an appropriate bandgap, band position, and electronic characteristics that are favorable for water splitting. This hybrid photocatalyst is expected to be applicable to a variety of scenarios such as CO2 conversion and environment treatment in addition to applications in the field of energy.

Supplementary Materials

The following supporting information can be downloaded at: https://www.mdpi.com/article/10.3390/catal12080866/s1, Figure S1: Schematic diagram of the photoelectrochemical cell.

Author Contributions

Conceptualization, J.Y. and H.C.; methodology, J.Y.; software, H.C.; validation, H.J. (Hyunku Joo), J.Y.; formal analysis, H.C., J.-E.K. and H.J. (Hyeonmin Jung); data curation, J.Y. and H.C.; writing—original draft preparation, H.C.; writing—review and editing, J.Y.; supervision, H.J. (Hyunku Joo), H.K., K.-S.K. and J.Y.; funding acquisition, K.-S.K. All authors have read and agreed to the published version of the manuscript.

Funding

This work was supported by a grant from the Korea Agency for Infrastructure Technology Advancement (KAIA) funded by the Ministry of Land, Infrastructure and Transport [grant number 22HSCT-C157908-03].

Data Availability Statement

The data presented in this study are available in article and Supplementary Materials.

Conflicts of Interest

The authors declare no conflict of interest.

References

  1. Khribich, A.; Kacem, R.H.; Dakhlaoui, A. Causality nexus of renewable energy consumption and social development: Evidence from high-income countries. Renew. Energy 2021, 169, 14–22. [Google Scholar] [CrossRef]
  2. Rivero, M.J.; Iglesias, O.; Ribao, P.; Ortiz, I. Kinetic performance of TiO2/Pt/reduced graphene oxide composites in the photocatalytic hydrogen production. Int. J. Hydrog. Energy 2019, 44, 101–109. [Google Scholar] [CrossRef]
  3. Zou, X.; Zhang, Y. Noble metal-free hydrogen evolution catalysts for water splitting. Chem. Soc. Rev. 2015, 44, 5148–5180. [Google Scholar] [CrossRef]
  4. Police, A.K.R.; Chennaiahgari, M.; Boddula, R.; Vattikuti, S.V.P.; Mandari, K.K.; Chan, B. Single-step hydrothermal synthesis of wrinkled graphene wrapped TiO2 nanotubes for photocatalytic hydrogen production and supercapacitor applications. Mater. Res. Bull. 2018, 98, 314–321. [Google Scholar] [CrossRef]
  5. Breeze, P. Solar power. In Power Generation Technologies; Elsevier: Amsterdam, The Netherlands, 2019; pp. 293–321. [Google Scholar] [CrossRef]
  6. Wang, Y.-Y.; Chen, Y.-X.; Barakat, T.; Zeng, Y.-J.; Liu, J.; Siffert, S.; Su, B.-L. Recent advances in non-metal doped titania for solar-driven photocatalytic/photoelectrochemical water-splitting. J. Energy Chem. 2022, 66, 529–559. [Google Scholar] [CrossRef]
  7. Hu, H.; Qian, D.; Lin, P.; Ding, Z.; Cui, C. Oxygen vacancies mediated in-situ growth of noble-metal (Ag. Au, Pt) nanoparticles on 3D TiO2 hierarchical spheres for efficient photocatalytic hydrogen evolution from water splitting. Int. J. Hydrog. Energy 2020, 45, 629–639. [Google Scholar] [CrossRef]
  8. Lu, Q.; Wei, Z.; Li, C.; Ma, J.; Li, L. Photocatalytic degradation of methyl orange by noble metal Ag modified semiconductor Zn2SnO4. Mater. Sci. Semicond. Process 2022, 138, 106290. [Google Scholar] [CrossRef]
  9. Kovalevskiy, N.; Selishchev, D.; Svintsitskiy, D.; Selishcheva, S.; Berezin, A.; Kozlov, D. Synergistic effect of polychromatic radiation on visible light activity of N-doped TiO2 photocatalyst. Catal. Commun. 2020, 134, 105841. [Google Scholar] [CrossRef]
  10. Zhang, Y.; Xiong, X.; Han, Y.; Yuan, H.; Deng, S.; Xiao, H.; Shen, F.; Wu, X. Application of titanium dioxide-loaded activated carbon fiber in a pulsed discharge reactor for degradation of methyl orange. Chem. Eng. J. 2010, 162, 1045–1049. [Google Scholar] [CrossRef]
  11. Bai, L.; Huang, H.; Yu, S.; Zhang, D.; Huang, H.; Zhang, Y. Role of transition metal oxides in g-C3N4-based heterojunctions for photocatalysis and supercapacitors. J. Energy Chem. 2022, 64, 214–235. [Google Scholar] [CrossRef]
  12. Barmeh, A.; Nilforoushan, M.R.; Otroj, S. Wetting and photocatalytic properties of Ni-doped TiO2 coating on glazed ceramic tiles under visible light. Thin Solid Film. 2018, 666, 137–142. [Google Scholar] [CrossRef]
  13. Cho, H.; Joo, H.; Kim, H.; Kim, J.E.; Kang, K.S.; Yoon, J. Enhanced photocatalytic activity of TiO2 nanotubes decorated with erbium and reduced graphene oxide. Appl. Surf. Sci. 2021, 565, 150459. [Google Scholar] [CrossRef]
  14. Yoon, J.; Bae, S.; Shim, E.; Joo, H. Pyrococcus furiosus-immobilized anodized tubular titania cathode in a hydrogen production system. J. Power Sources 2009, 189, 1296–1301. [Google Scholar] [CrossRef]
  15. Nie, J.; Mo, Y.; Zheng, B.; Yuan, H.; Xiao, D. Electrochemical fabrication of lanthanum-doped TiO2 nanotube array electrode and investigation of its photoelectrochemical capability. Electrochim. Acta 2013, 90, 589–596. [Google Scholar] [CrossRef]
  16. Mazierski, P.; Lisowski, W.; Grzyb, T.; Winiarski, M.J.; Klimczuk, T.; Mikołajczyk, A.; Flisikowski, J.; Hirsch, A.; Kołakowska, A.; Puzyn, T.; et al. Enhanced photocatalytic properties of lanthanide-TiO2 nanotubes: An experimental and theoretical study. Appl. Catal. B 2017, 205, 376–385. [Google Scholar] [CrossRef]
  17. Khoshnavazi, R.; Sohrabi, H.; Bahrami, L.; Amiri, M. Photocatalytic activity inhancement of TiO2 nanoparticles with lanthanide ions and sandwich-type polyoxometalates. J. Sol-Gel Sci. Technol. 2017, 83, 332–341. [Google Scholar] [CrossRef]
  18. Avram, D.; Patrascu, A.A.; Istrate, M.C.; Cojocaru, B.; Tiseanu, C. Lanthanide doped TiO2: Coexistence of discrete and continuous dopant distribution in anatase phase. J. Alloys Compd. 2021, 851, 156849. [Google Scholar] [CrossRef]
  19. Yu, J.; Yang, Y.; Zhang, C.; Fan, R.; Su, T. Preparation of YbF3-Ho@TiO2 core-shell sub-microcrystal spheres and their application to the electrode of dye-sensitized solar cells. New J. Chem. 2020, 44, 10545–10553. [Google Scholar] [CrossRef]
  20. Kumaravel, V.; Mathew, S.; Bartlett, J.; Pillai, S.C. Photocatalytic hydrogen production using metal doped TiO2: A review of recent advances. Appl. Catal. B 2019, 244, 1021–1064. [Google Scholar] [CrossRef]
  21. Lee, D.Y.; Kim, J.T.; Park, J.H.; Kim, Y.H.; Lee, I.K.; Lee, M.H.; Kim, B.Y. Effect of Er doping on optical band gap energy of TiO2 thin films prepared by spin coating. Curr. Appl. Phys. 2013, 13, 1301–1305. [Google Scholar] [CrossRef]
  22. Reszczyńska, J.; Grzyb, T.; Sobczak, J.W.; Lisowski, W.; Gazda, M.; Ohtani, B.; Zaleska, A. Lanthanide co-doped TiO2: The effect of metal type and amount on surface properties and photocatalytic activity. Appl. Surf. Sci. 2014, 307, 333–345. [Google Scholar] [CrossRef]
  23. Xu, R.; Li, Y.; Feng, S.; Wang, J.; Zhang, J.; Zhang, X.; Bian, C.; Fu, W.; Li, Z.; Yang, H. Enhanced performance of planar perovskite solar cells using Ce-doped TiO2 as electron transport layer. J. Mater. Sci. 2020, 55, 5681–5689. [Google Scholar] [CrossRef]
  24. Agresti, A.; Pazniak, A.; Pescetelli, S.; di Vito, A.; Rossi, D.; Pecchia, A.; Auf der Maur, M.; Liedl, A.; Larciprete, R.; Kuznetsov, D.V.; et al. Titanium-carbide MXenes for work function and interface engineering in perovskite solar cells. Nat. Mater. 2019, 18, 1228–1234. [Google Scholar] [CrossRef] [Green Version]
  25. Wang, T.; Wang, Y.; Sun, M.; Hanif, A.; Wu, H.; Gu, Q.; Ok, Y.S.; Tsang, D.C.W.; Li, J.; Yu, J.; et al. Thermally treated zeolitic imidazolate framework-8 (ZIF-8) for visible light photocatalytic degradation of gaseous formaldehyde. Chem. Sci. 2020, 11, 6670–6681. [Google Scholar] [CrossRef]
  26. Shi, L.; Xu, C.; Sun, X.; Zhang, H.; Liu, Z.; Qu, X.; Du, F. Facile fabrication of hierarchical BiVO4/TiO2 heterostructures for enhanced photocatalytic activities under visible-light irradiation. J. Mater. Sci. 2018, 53, 11329–11342. [Google Scholar] [CrossRef]
  27. Kalanur, S.S. Structural, optical, band edge and enhanced photoelectrochemical water splitting properties of Tin-doped WO3. Catalysts 2019, 9, 456. [Google Scholar] [CrossRef] [Green Version]
  28. Maheu, C.; Cardenas, L.; Puzenat, E.; Afanasiev, P.; Geantet, C. UPS and UV spectroscopies combined to position the energy levels of TiO2 anatase and rutile nanopowders. Phys. Chem. Chem. Phys. 2018, 20, 25629–25637. [Google Scholar] [CrossRef]
  29. Xu, G.; Xu, Z.; Shi, Z.; Pei, L.; Yan, S.; Gu, Z.; Zou, Z. Silicon photoanodes partially covered by Ni@Ni(OH)2 core–shell particles for photoelectrochemical water oxidation. ChemSusChem 2017, 10, 2897–2903. [Google Scholar] [CrossRef]
  30. Zhang, H.; Ebaid, M.; Min, J.W.; Ng, T.K.; Ooi, B.S. Enhanced photoelectrochemical performance of InGaN-based nanowire photoanodes by optimizing the ionized dopant concentration. J. Appl. Phys. 2018, 124, 083105. [Google Scholar] [CrossRef]
  31. Liu, C.; Wang, F.; Zhang, J.; Wang, K.; Qiu, Y.; Liang, Q.; Chen, Z. Efficient photoelectrochemical water splitting by g-C3N4/TiO2 nanotube array heterostructures. Nano-Micro Lett. 2018, 10, 37. [Google Scholar] [CrossRef] [Green Version]
  32. Liu, C.; Wang, F.; Zhu, S.; Xu, Y.; Liang, Q.; Chen, Z. Controlled charge-dynamics in cobalt-doped TiO2 nanowire photoanodes for enhanced photoelectrochemical water splitting. J. Colloid Interface Sci. 2018, 530, 403–411. [Google Scholar] [CrossRef] [PubMed]
  33. Marchesi, L.F.; Freitas, R.G.; Spada, E.R.; Paula, F.R.; Góes, M.S.; Garcia, J.R. Photoelectrochemical characterization of ITO/TiO2 electrodes obtained by cathodic electrodeposition from aqueous solution. J. Solid State Electrochem. 2015, 19, 2205–2211. [Google Scholar] [CrossRef] [Green Version]
  34. Raja, K.S.; Mahajan, V.K.; Misra, M. Determination of photo conversion efficiency of nanotubular titanium oxide photo-electrochemical cell for solar hydrogen generation. J. Power Sources 2006, 159, 1258–1265. [Google Scholar] [CrossRef]
  35. Samad, N.A.A.; Lai, C.W.; Lau, K.S.; Hamid, S.B.A. Efficient solar-induced photoelectrochemical response using coupling semiconductor TiO2-ZnO nanorod film. Materials 2016, 9, 937. [Google Scholar] [CrossRef] [PubMed] [Green Version]
  36. Zhou, Z.; Springer, M.A.; Geng, W.; Zhu, X.; Li, T.; Li, M.; Jing, Y.; Heine, T. Rational design of two-dimensional binary polymers from Heterotriangulenes for photocatalytic water splitting. J. Phys. Chem. Lett. 2021, 12, 8134–8140. [Google Scholar] [CrossRef] [PubMed]
  37. Altmaier, M.; Xavier, G.; David, F.; Gunnar, B. Intercomparison of Redox Determination Methods on Designed and Near-Natural Aqueous Systems. Volume 7572 of KIT Scientific Reports; KIT Scientific Publishing: Karlsruhe, Germany, 2011. [Google Scholar] [CrossRef]
  38. Mortazavi, B.; Javvaji, B.; Shojaei, F.; Rabczuk, T.; Shapeev, A.V.; Zhuang, X. Exceptional piezoelectricity, high thermal conductivity and stiffness and promising photocatalysis in two-dimensional MoSi2N4 family confirmed by first-principles. Nano Energy 2021, 82, 105716. [Google Scholar] [CrossRef]
  39. Ayon, S.A.; Billah, M.M.; Nishat, S.S.; Kabir, A. Enhanced photocatalytic activity of Ho3+ doped ZnO NPs synthesized by modified sol–gel method: An experimental and theoretical investigation. J. Alloys Compd. 2021, 856, 158217. [Google Scholar] [CrossRef]
  40. Pan, T.-M.; Chen, C.-H.; Liu, J.-H. Structural properties and electrical characteristics of Ho2O3 and HoTixOy gate dielectrics for a-InGaZnO thin-film transistors. RSC Adv. 2014, 4, 29300–29304. [Google Scholar] [CrossRef]
  41. Cho, H.; Joo, H.; Kim, H.; Kim, J.E.; Kang, K.S.; Yoon, J. Improved photoelectrochemical properties of TiO2 nanotubes doped with Er and effects on hydrogen production from water splitting. Chemosphere 2021, 267, 129289. [Google Scholar] [CrossRef]
Figure 1. EDS spectra of (a) pure TNT, (b) Ho-TNT, (c) Tb-TNT, (d) Eu-TNT, (e) Yb-TNT, (f) Er-TNT (insert: SEM image) and (g) representative scanning transmission electron microscopy elemental mapping (Ho-TNT).
Catalysts 12 00866 g001
Figure 2. XRD patterns of pure TNT, Ho-TNT, Tb-TNT, Eu-TNT, Yb-TNT and Er-TNT.
Catalysts 12 00866 g002
Figure 3. UPS spectra of the secondary electron with the onset highlighted in the graph to determine the work function. TNT and lanthanide-doped TNT.
Catalysts 12 00866 g003
Figure 4. Valence band XPS spectra of pure TNT and lanthanide-doped TNT.
Catalysts 12 00866 g004
Figure 5. (a) UV–Vis-diffused absorbance spectra; (b) Tauc plots.
Catalysts 12 00866 g005
Figure 6. Energy scheme for as-prepared samples with respect to the fermi level (a) and vacuum level (b).
Catalysts 12 00866 g006
Figure 7. Photoelectrochemical characterization of as-prepared samples. (a) Open-circuit voltage (OCP), (b) chronoamperometry, (c) linear sweep voltammetry (LSV), and (d) photo-conversion efficiency (PCE).
Catalysts 12 00866 g007
Figure 8. (a) Hydrogen evolution rate and average current density; (b) five repeated experiments with Ho-TNT.
Catalysts 12 00866 g008
Table 1. Elemental composition (in at. %) and structural properties of lanthanide-doped TiO2 nanotubes.
Sample LabelEDSXRD
Elemental Composition (Atomic %) Lattice Parameter
TiOHoTbEuYbErSize (Å)a (Å)b (Å)c (Å)Cell Volume (Å3)
pure TNT31.1368.87-----3513.783.789.49135.42
Ho-TNT28.4469.352.22----2893.783.789.48135.35
Tb-TNT29.5370.03-0.44---2793.783.789.50135.69
Eu-TNT30.5968.26--1.15--3233.783.789.48135.29
Yb-TNT29.269.59---1.2-3373.783.789.48135.29
Er-TNT27.9471.19----0.873413.783.789.48135.38
Table 2. Band structure parameters of doped TNTs.
Sample LabelWork Function
(eV)
Valence Band
(eV)
Conduction Band
(eV)
Band Gap
(eV)
pure TNT4.8−6.45−3.652.8
Ho-TNT4.53−6.08−3.792.29
Tb-TNT3.53−4.86−2.292.57
Eu-TNT4.72−6.02−3.712.31
Yb-TNT3.90−5.80−3.452.35
Er-TNT3.36−4.93−2.192.74
Table 3. Open-circuit voltage (OCP) measurement, maximum current density and photoconversion efficiency of the samples, obtained from electrochemical analysis.
Sample LabelLight Off (V vs. Hg/HgO)Light On (V vs. Hg/HgO)OCP(V vs. Hg/HgO)Maximum Current Density (mAcm−2)Photo-Conversion Efficiency (%)
pure TNT−0.16−0.610.461.030.29
Ho-TNT−0.25−0.870.6323.62.68
Tb-TNT−0.25−0.820.578.151.55
Eu-TNT−0.17−0.770.6118.62.21
Yb-TNT−0.17−0.830.6614.62.19
Er-TNT−0.14−0.710.577.211.59
Publisher’s Note: MDPI stays neutral with regard to jurisdictional claims in published maps and institutional affiliations.

