Article

Crystalline Violet Wastewater Treatment by Low-Temperature Plasma Combined with Industrial Solid Waste Red Mud

College of Urban Construction, Nanjing Tech University, Nanjing 211816, China
*
Authors to whom correspondence should be addressed.
Catalysts 2022, 12(8), 908; https://doi.org/10.3390/catal12080908
Submission received: 7 July 2022 / Revised: 6 August 2022 / Accepted: 15 August 2022 / Published: 17 August 2022

Abstract

:
Low-temperature plasma (LTP) technology has been successfully used to treat persistent organic pollutants in water. Efforts have been devoted to combine catalysts and LTP to improve the degradation efficiency of pollutants and energy utilization efficiency. Herein, industrial solid waste red mud as a novel catalyst was added to an LTP system to treat crystalline violet (CV) wastewater. The energy yield at 50% CV decomposition and TOC after a 30 min reaction by the plasma treatment, red mud adsorption, and red mud/plasma treatment were compared. The effects of the main operating parameters, such as red mud dosing amount, initial pH, discharge voltage, and initial concentration of CV, on the removal efficiency of CV were investigated. The best degradation of CV was achieved with a red mud dosage of 2 g, a neutral environment, and a discharge voltage of 22 kV. When the red mud was recycled three times, the removal efficiency decreased a little in the red mud/plasma system. Hydroxyl radical plays an important role in the treatment of CV. The red mud was characterized by BET, SEM, XRD, and FT-IR, and the structure of the red mud was not greatly affected after being used in the red mud/plasma system.

1. Introduction

Refractory organic dye wastewater causes serious pollution with large emissions [1]. According to a survey, more than 181.6 billion tons of industrial wastewater is discharged in China each year, of which dye wastewater accounts for about 20% [2]. Various organic dyes are toxic and potentially harmful to humans and other organisms, causing skin irritation and digestive tract irritation [3,4]. It is important to find cost-effective methods to treat the dye wastewater.
The common treatment methods include adsorption, biodegradation, membrane, and advanced oxidation processes (AOPs) [5,6,7,8,9,10,11]. However, the biological process is restricted by the water quality and water temperature. Adsorption requires a long treatment time and the membrane needs a complicated operation. AOPs, such as photocatalytic oxidation, ozonation, electrochemical oxidation, Fenton, and the low-temperature plasma (LTP) method, are chemical oxidation techniques that involve hydroxyl radicals in the reaction process. Due to the high oxidation efficiency and low secondary pollution, AOPs have received more and more attention in recent years.
LTP is a new kind of advanced oxidation technology that combines the effects of reactive radical oxidation, ozone oxidation, ultraviolet radiation, and shock waves. As a new kind of AOP, LTP has been successfully used to treat aqueous refractory organic pollutants [12,13,14]. To make full use of the energy consumed during the discharge process and improve the removal efficiency of pollutants, some wastewater treatment methods are used in combination with LTP [15,16]. Studies have shown that adding catalysts to the plasma system can significantly improve the degradation efficiency of pollutants [17,18,19]. Currently, there are many studies about the synergistic effects of persulfate, transition metal ions or particles, adsorbents (zeolite, activated carbon), and photocatalysts [20,21,22]. Yu [23] et al. used TiO2 and Fe-TiO2 in the degradation of reactive brilliant blue using media blocking discharge and showed that the addition of catalysts improved not only the removal rate of reactive brilliant blue but also the mineralization rate of the whole system. The catalysts can react with ozone, hydrogen peroxide, lights, and heat generated during the plasma discharge process; then, a series of chain reactions is triggered to promote the active radical’s production and the degradation of organic matter [24].
Red mud is an industrial solid residue produced during the alumina refining process, which itself is rich in iron, aluminum, silicon, calcium, titanium, and other metal substances [25,26,27]. Red mud needs to be properly treated to avoid causing pollution to the groundwater and soil. Because of its high dispersion, large specific surface area, and chemical reactivity, it has been used as an adsorbent and as a catalyst in ozonation and photocatalysis for the wastewater treatment [28,29,30,31]. However, as far as we know, few studies are about red mud as a plasma catalyst to treat dye wastewater.
In this study, industrial solid waste red mud was used as a novel catalyst in an LTP wastewater treatment system. The present study aims to not only make full use of the catalytic effect of metals in red mud to improve the removal efficiency of pollutants but also seek a way of solid waste reuse. The energy yield at 50% CV decomposition and TOC after a 30 min reaction by the plasma treatment, red mud adsorption, and red mud/plasma treatment were compared. The effects of the main operating parameters, such as red mud dosing amount, initial pH, discharge voltage, and initial concentration of CV, on the removal efficiency of CV were investigated. Radical quenching experiments were carried out to verify the role of •OH in CV degradation. The effectiveness of red mud reuse in the red mud/plasma system was assessed through three recycling experiments.

2. Results and Discussion

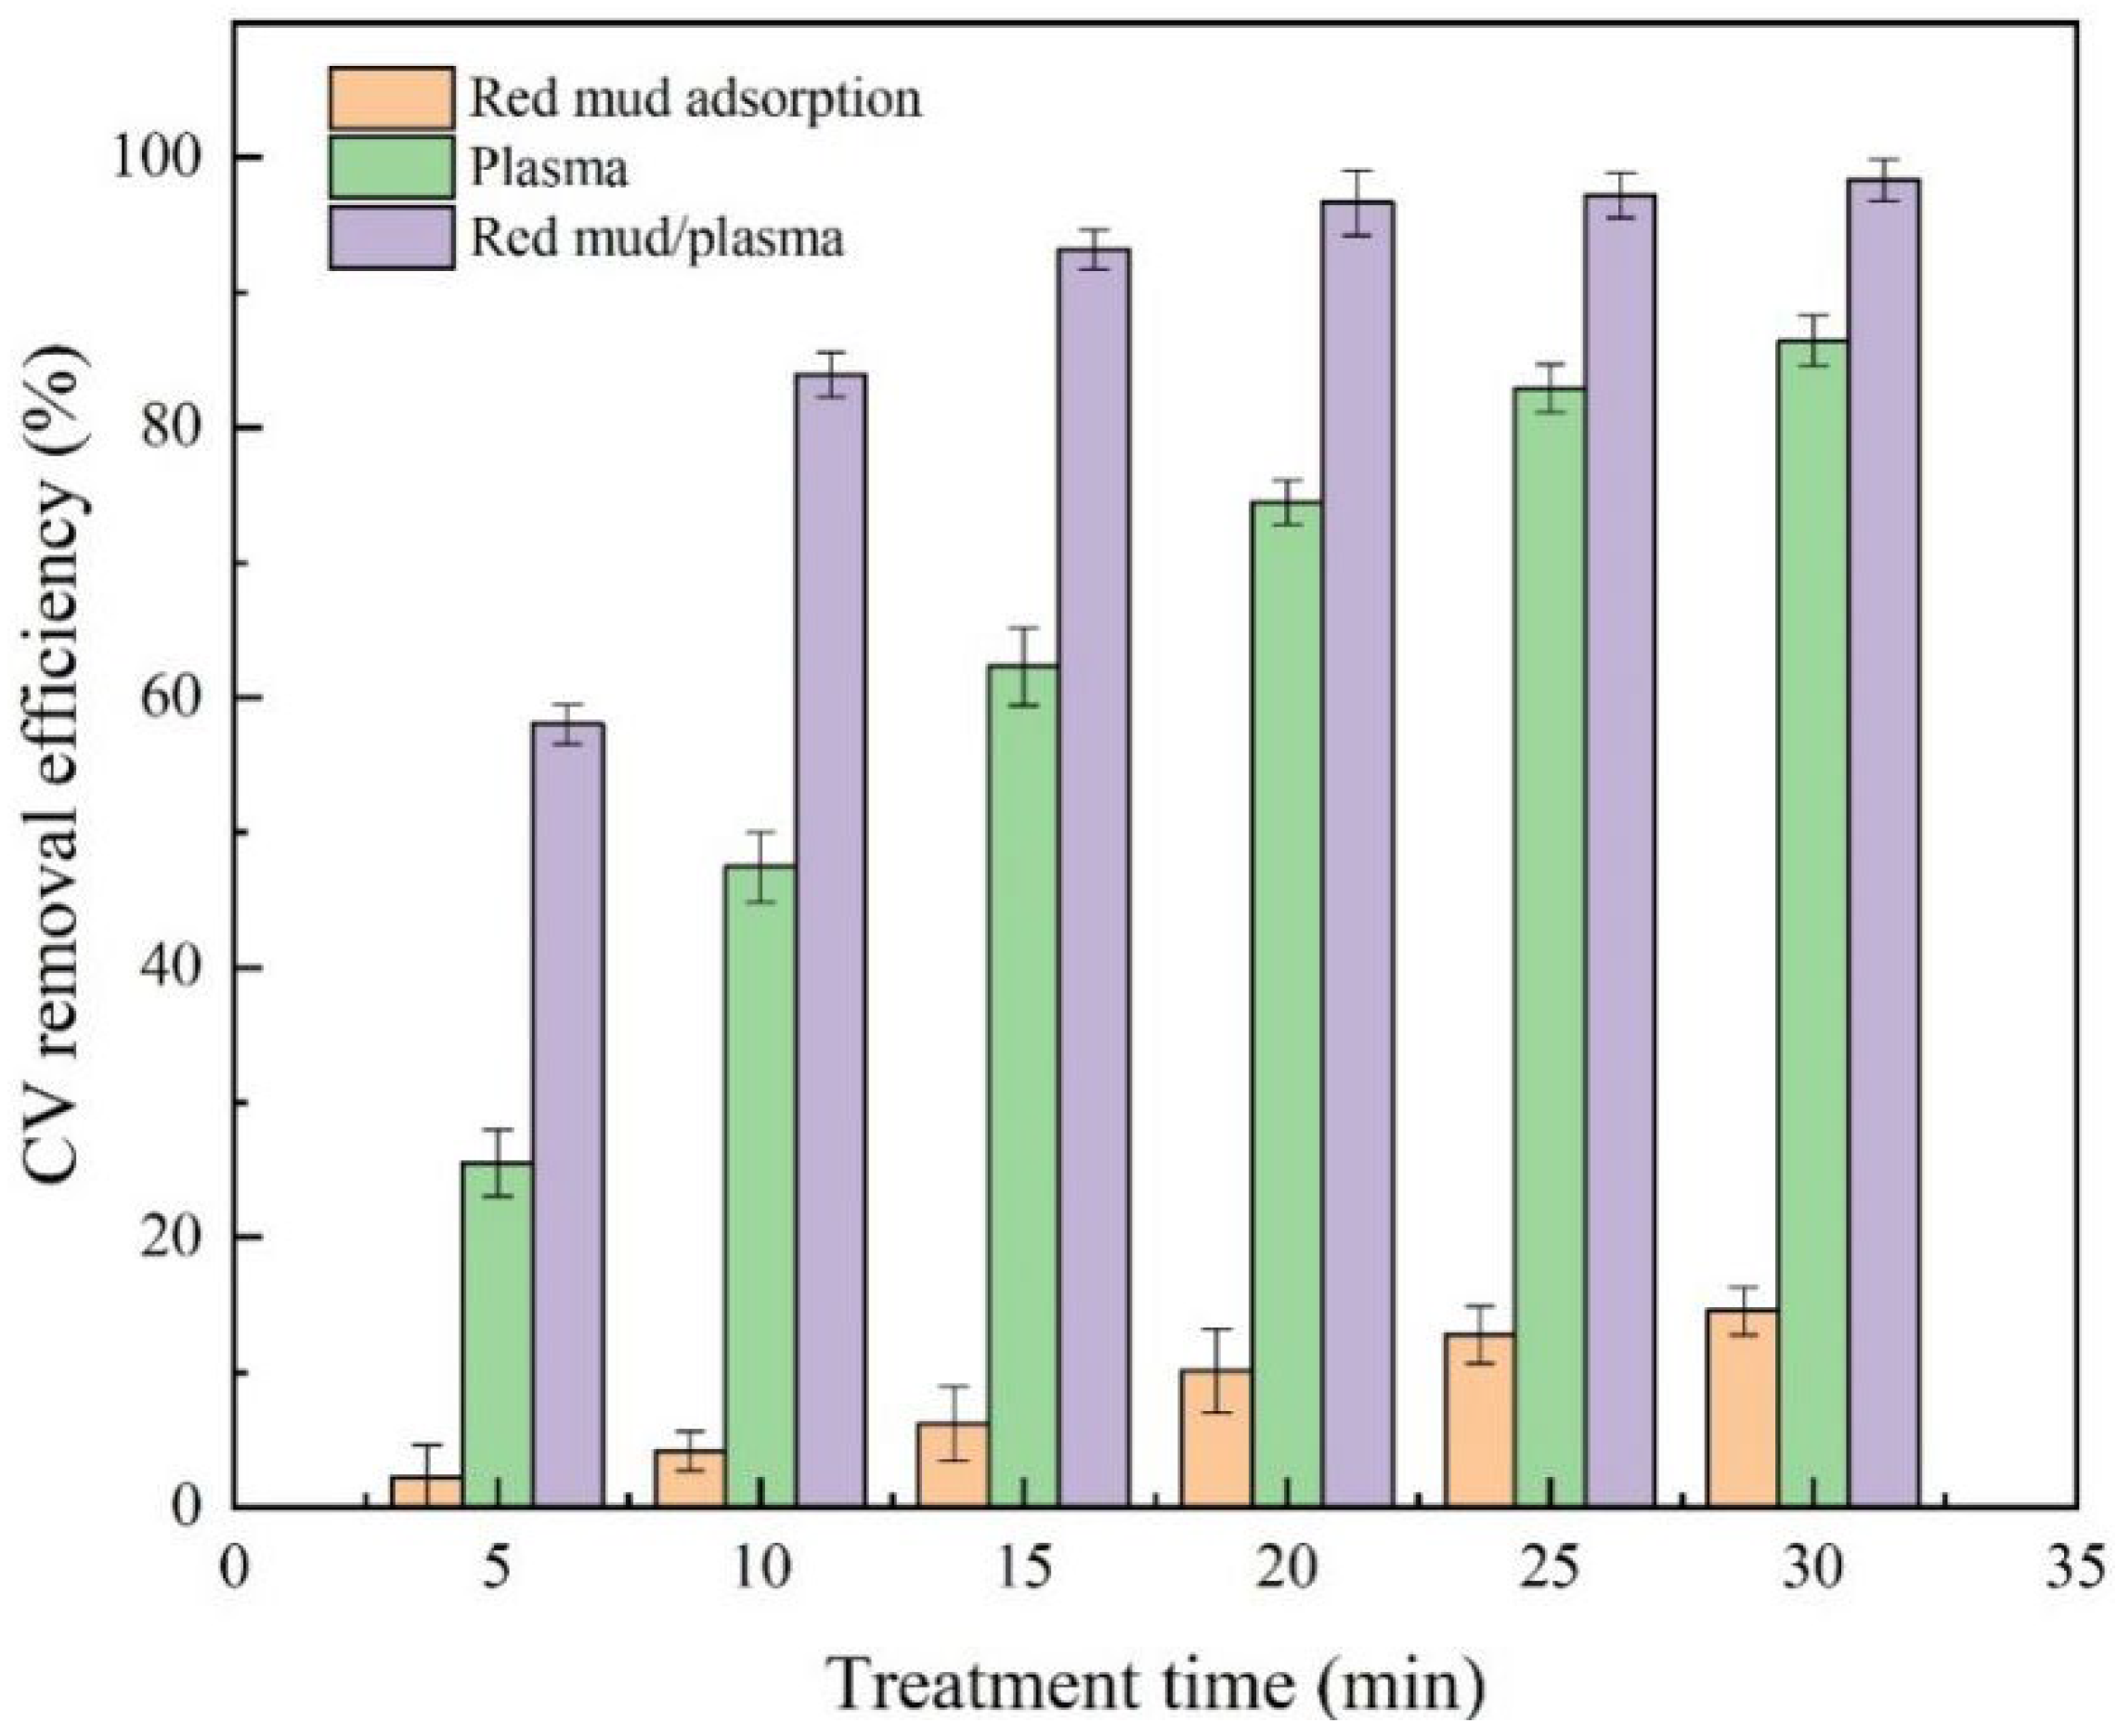
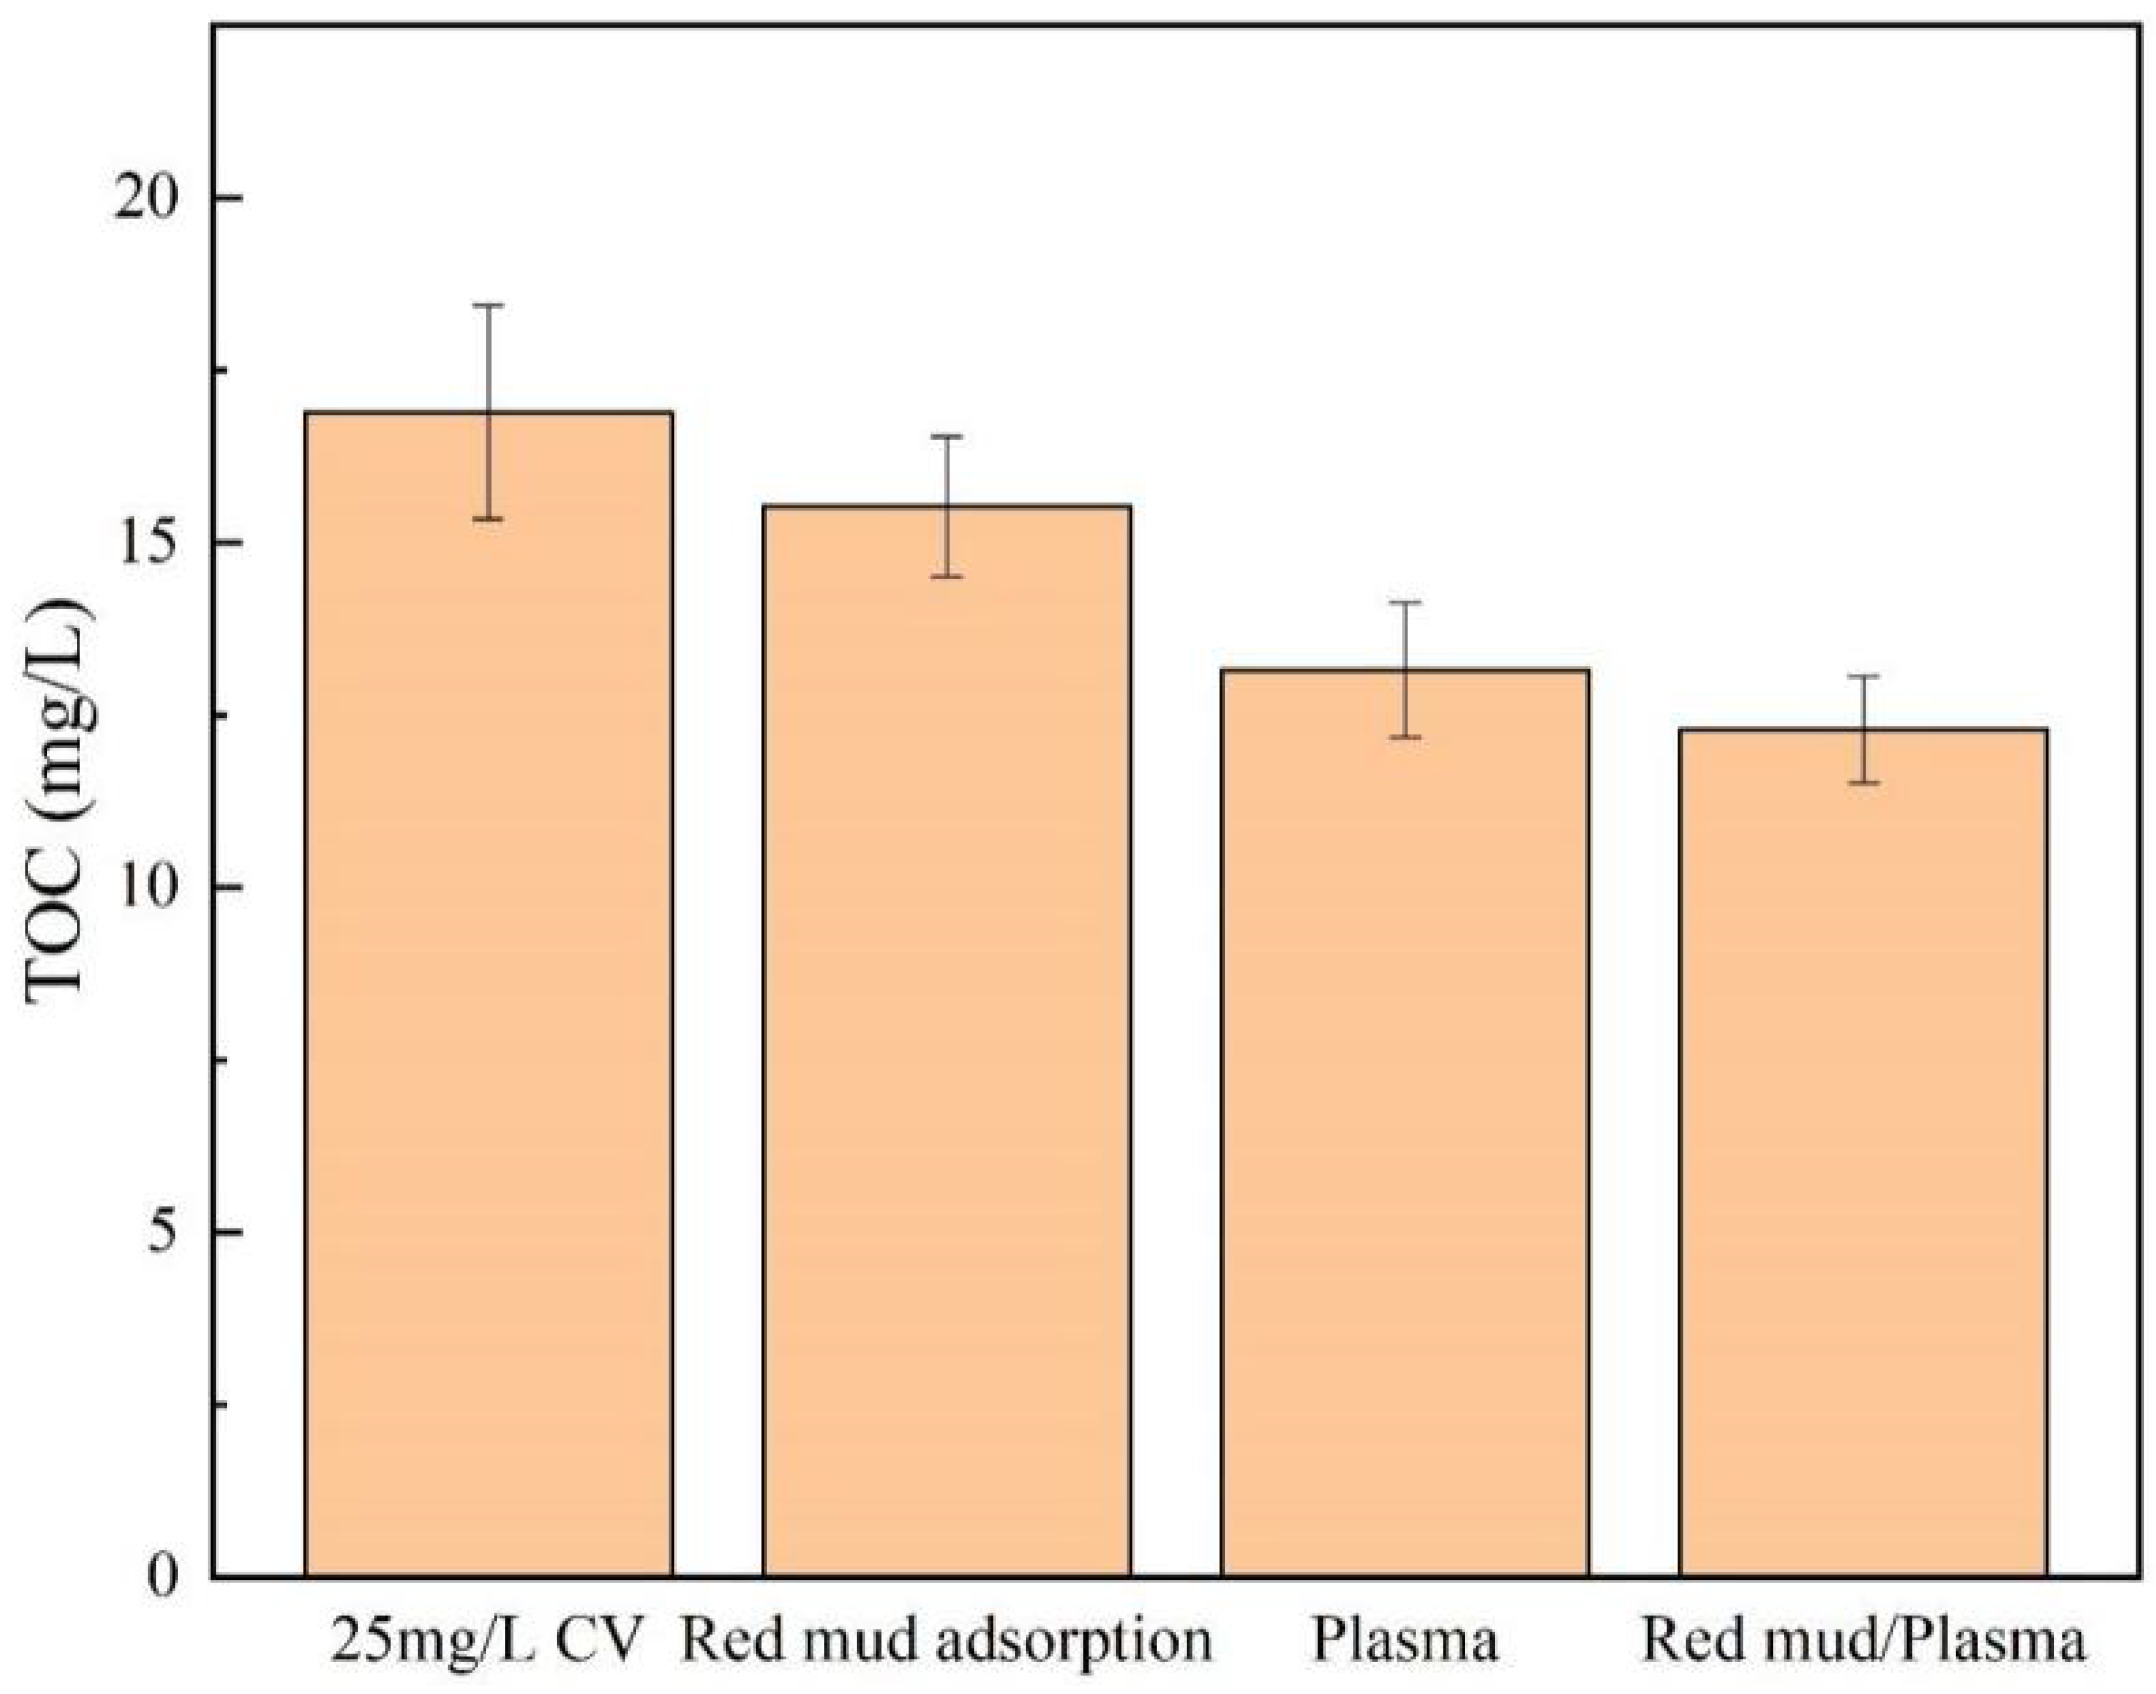
2.1. Synergistic Effect of Red Mud/Plasma Treatment System

Figure 1 shows the removal efficiency of CV with reaction time in the three processes. After a 5 min reaction, the removal efficiency of CV is 2.22% by the red mud adsorption, 25.55% by the plasma treatment, and 58.04% by the red mud/plasma treatment. The removal efficiency of CV by the combination of both systems is higher than by either one of them. After a 10 min reaction, the removal efficiency by the plasma is 47.43%, and the red mud/plasma system can shorten the reaction time by about 50% to achieve this removal efficiency. It can be seen that the red mud/plasma system achieves a higher removal rate in a shorter reaction time than a plasma system alone.
Figure 2 shows the energy yield at 50% CV decomposition (G50) calculated according to Equation (13). The red mud/plasma system decolorized CV with a high energy yield of 6.91 g/kWh at 50% CV decomposition, compared to 2.74 g/kWh with plasma alone. The red mud addition to the plasma system can increase the energy yield significantly and reduce the power consumption. The mineralization efficiency of each method was followed by TOC removal, as seen in Figure 3. After a 30 min reaction, the TOC values of CV decreased after all three treatment methods. The maximum TOC reduction is obtained for the red mud/plasma system.

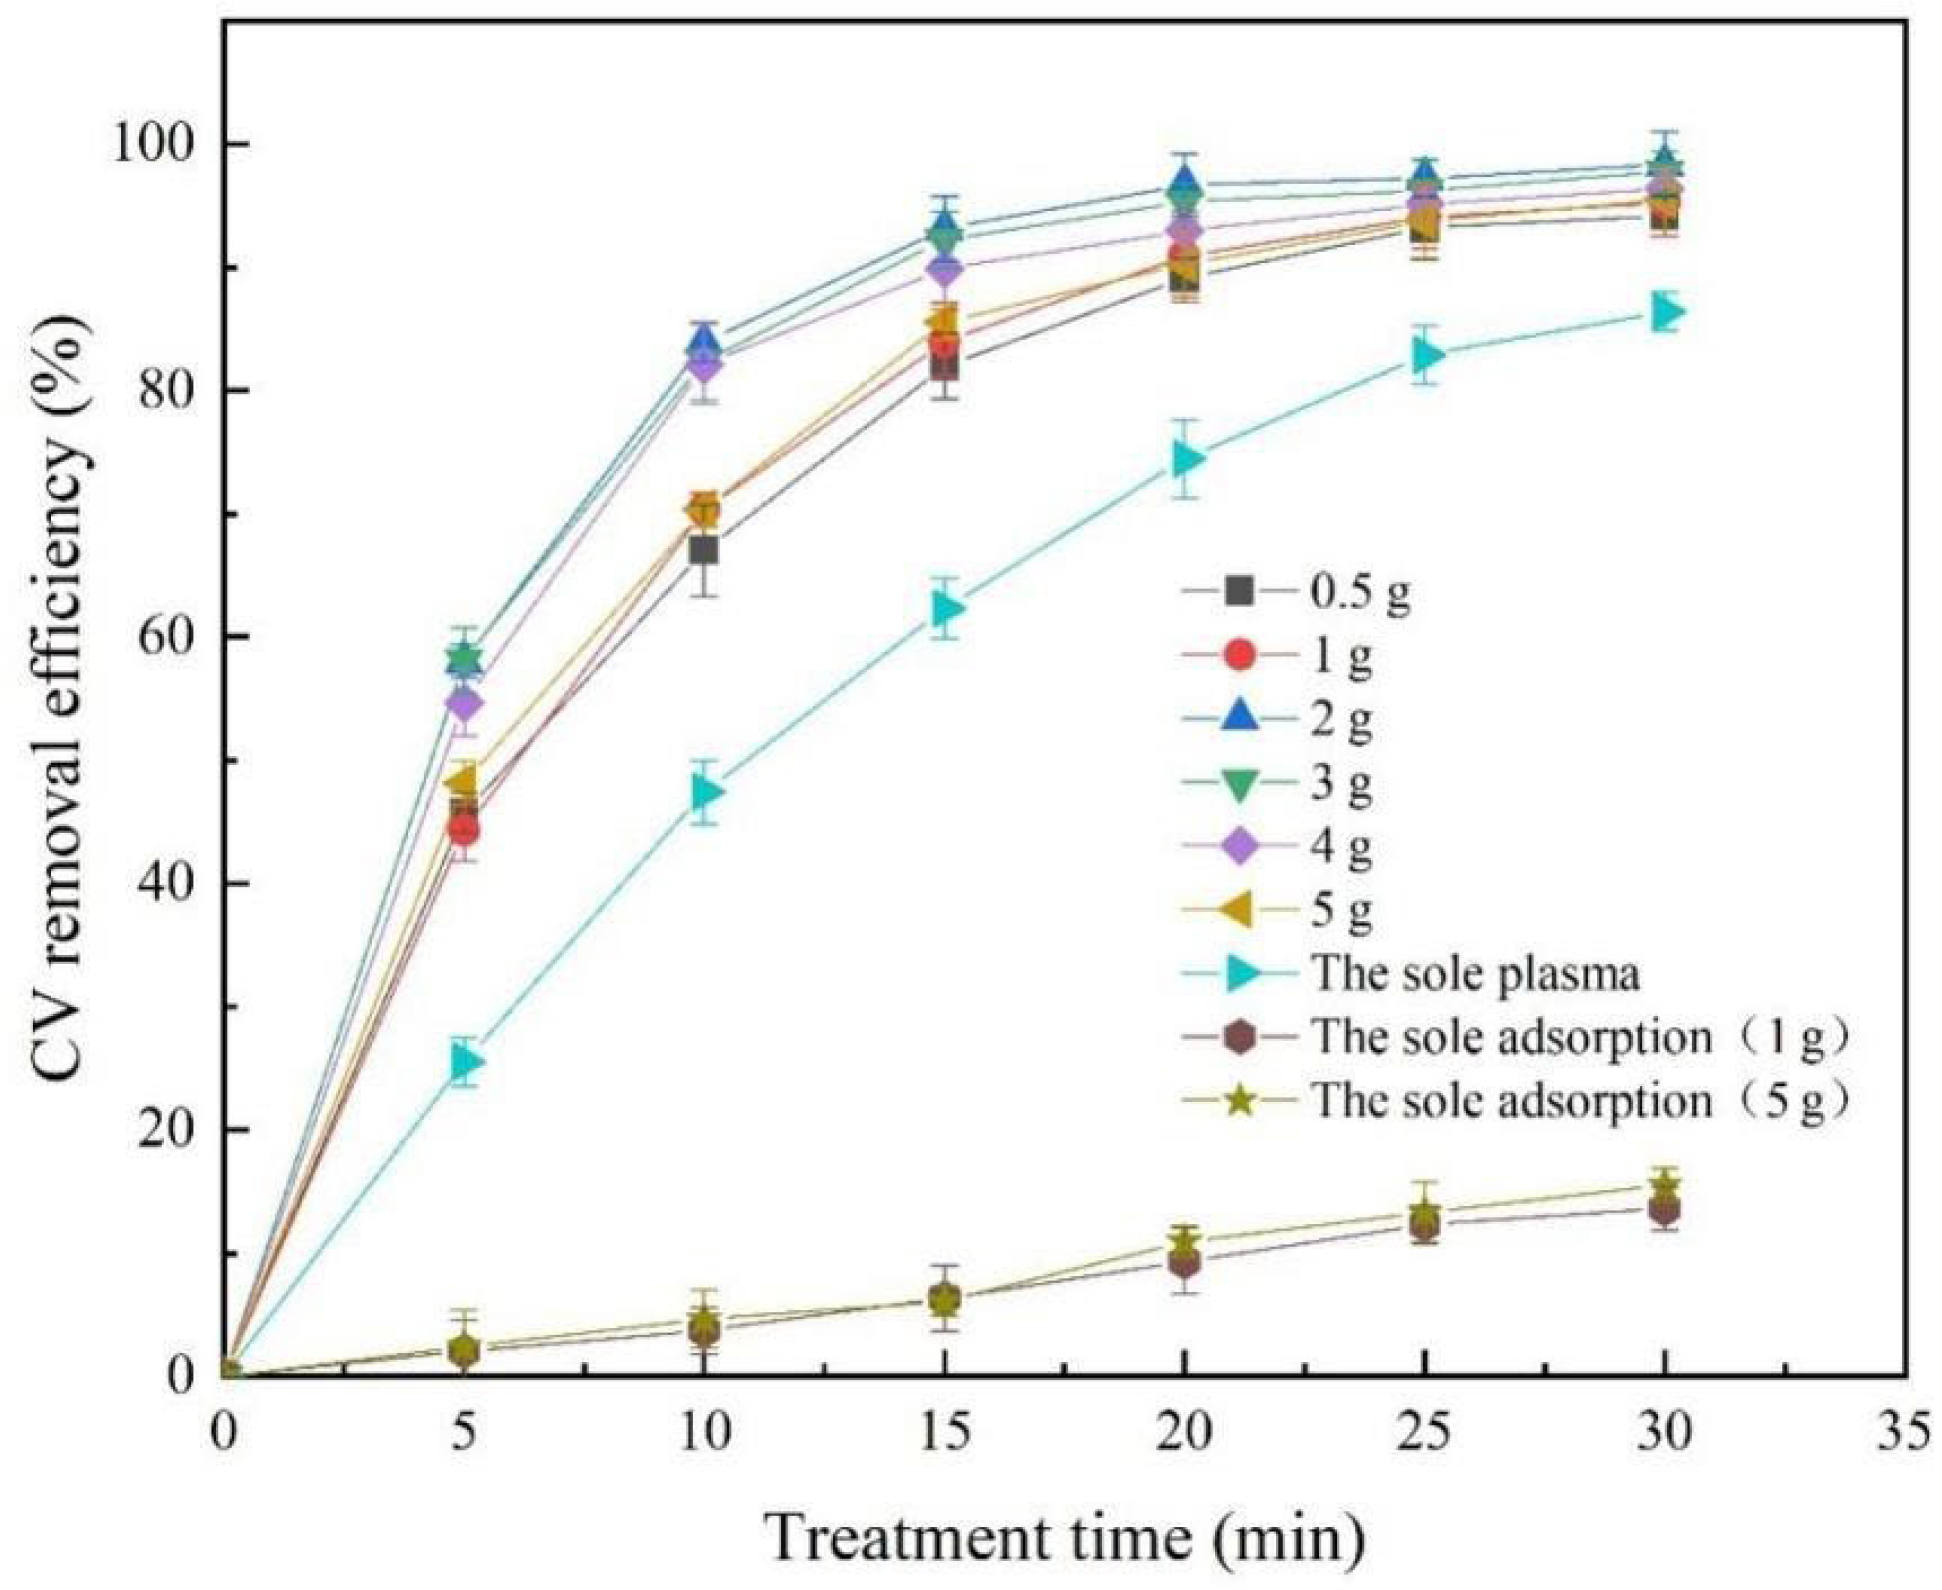
2.2. Effect of Red Mud Addition on the Removal Efficiency of CV

The effect of red mud addition on the removal efficiency of CV in the combined system is shown in Figure 4. It shows that the removal efficiency of CV with a 2 g red mud addition is higher than that of the other red mud additions. It can also be seen that the CV removal efficiency by the red mud/plasma treatment is about 32.5% higher than by the plasma treatment after a 5 min reaction. After a 20 min reaction, the improvement of removal caused by the red mud dosage decreases with the reaction time.
The discharge plasma not only produces chemicals such as •OH, H2O2,, and O3 but is also accompanied by some physical effects, such as UV light, shock waves, and pyrolysis. Initially, more red mud addition leads to an increased content of Fe2O3 and TiO2, which can promote more Fenton, Fenton-like, and photocatalytic reactions [15,32,33]. At the same time, the removal efficiency of CV is also enhanced by the red mud adsorption. When the catalyst loading was increased to 5 g, the CV removal decreased. It may be due to the increase of solution turbidity caused by the red mud addition increases, which hindered the penetration of UV light and prevented the photocatalytic reaction [34,35,36]. At the later stage of the reaction, the pollutant concentration decreases and the concentration of CV gradually decreases; hence, the removal efficiency of CV decreases with long reaction time [22].

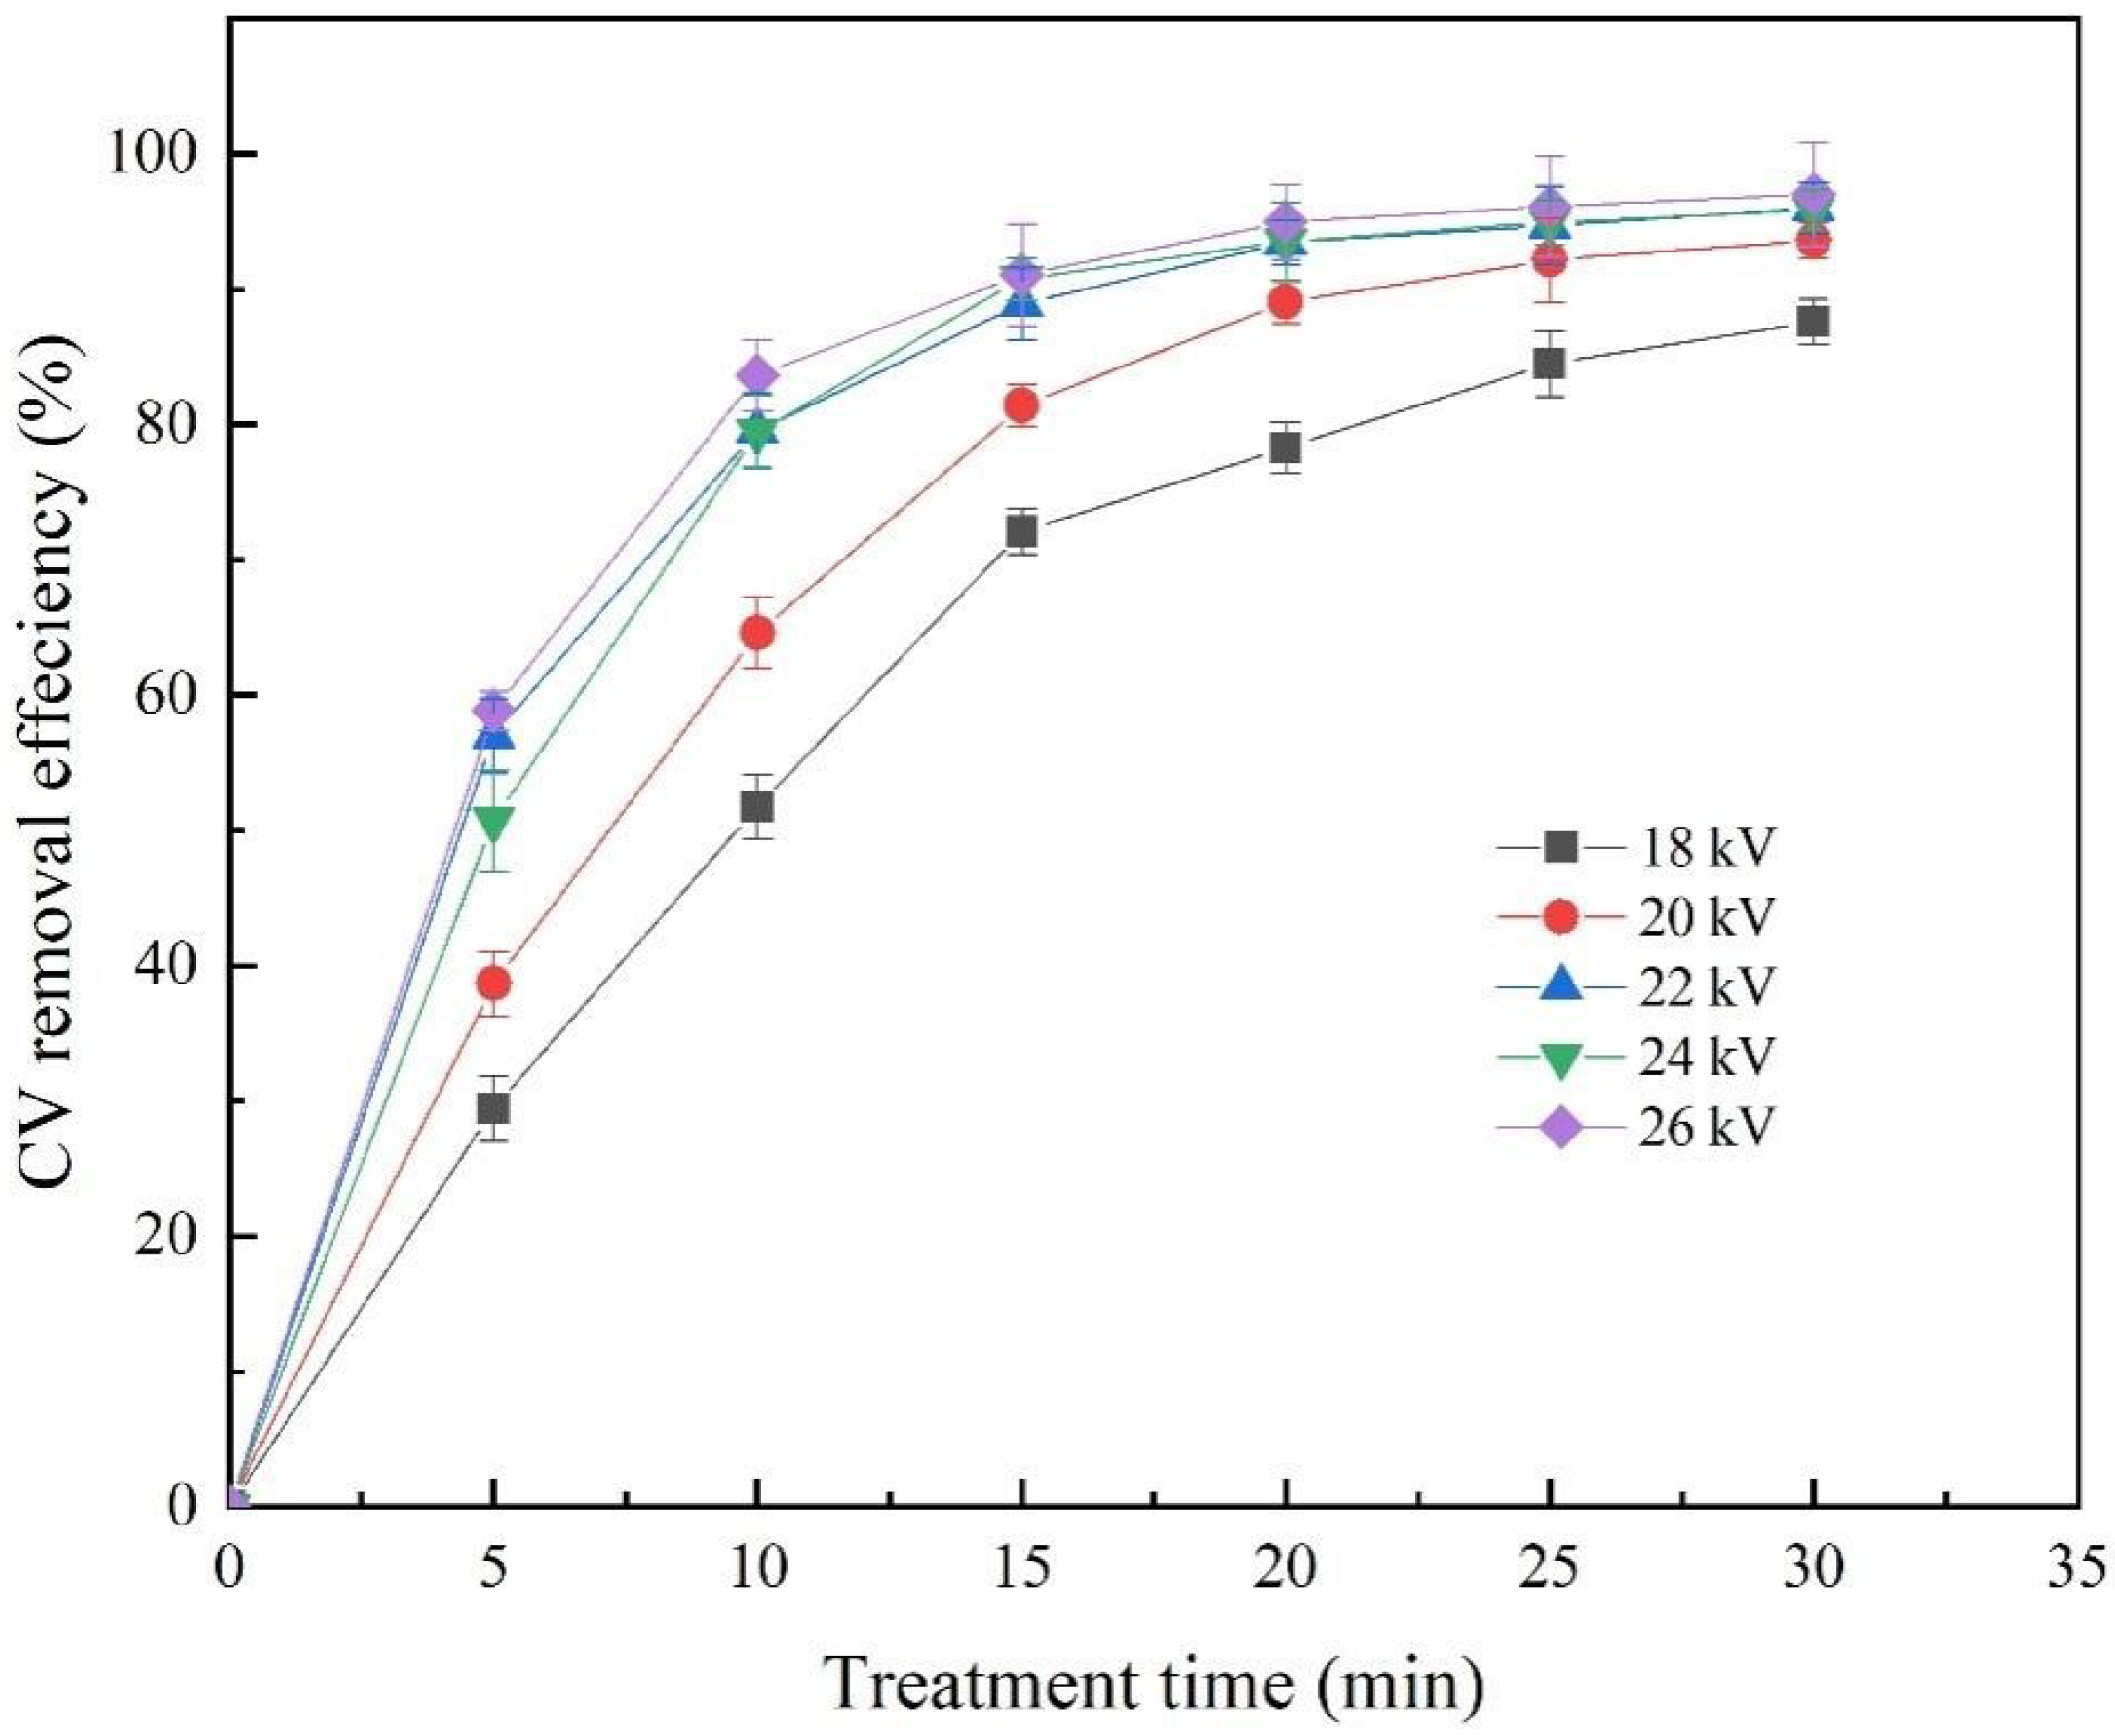
2.3. Effect of Discharge Voltage on the Removal Efficiency of CV

Discharge voltage is an important parameter for evaluating the application of LTP technology in environmental pollutants removal. When the discharge voltage increases, the intensity of the UV and shock increases and more active species are produced [37]. The CV wastewater was treated at discharge voltages of 18, 20, 22, 24, and 26 kV with a discharge frequency of 50 Hz (Figure 5). The removal efficiency was 29.46% at a discharge voltage of 18 kV and 57.01% at 20 kV after a 30 min treatment. The contaminants can be removed faster at higher voltages than lower voltages. Little difference was found in the removal efficiency among the discharge voltages of 22, 24, and 26 kV. Due to energy-saving considerations, the discharge voltage of 22 kV is preferred for the reaction.

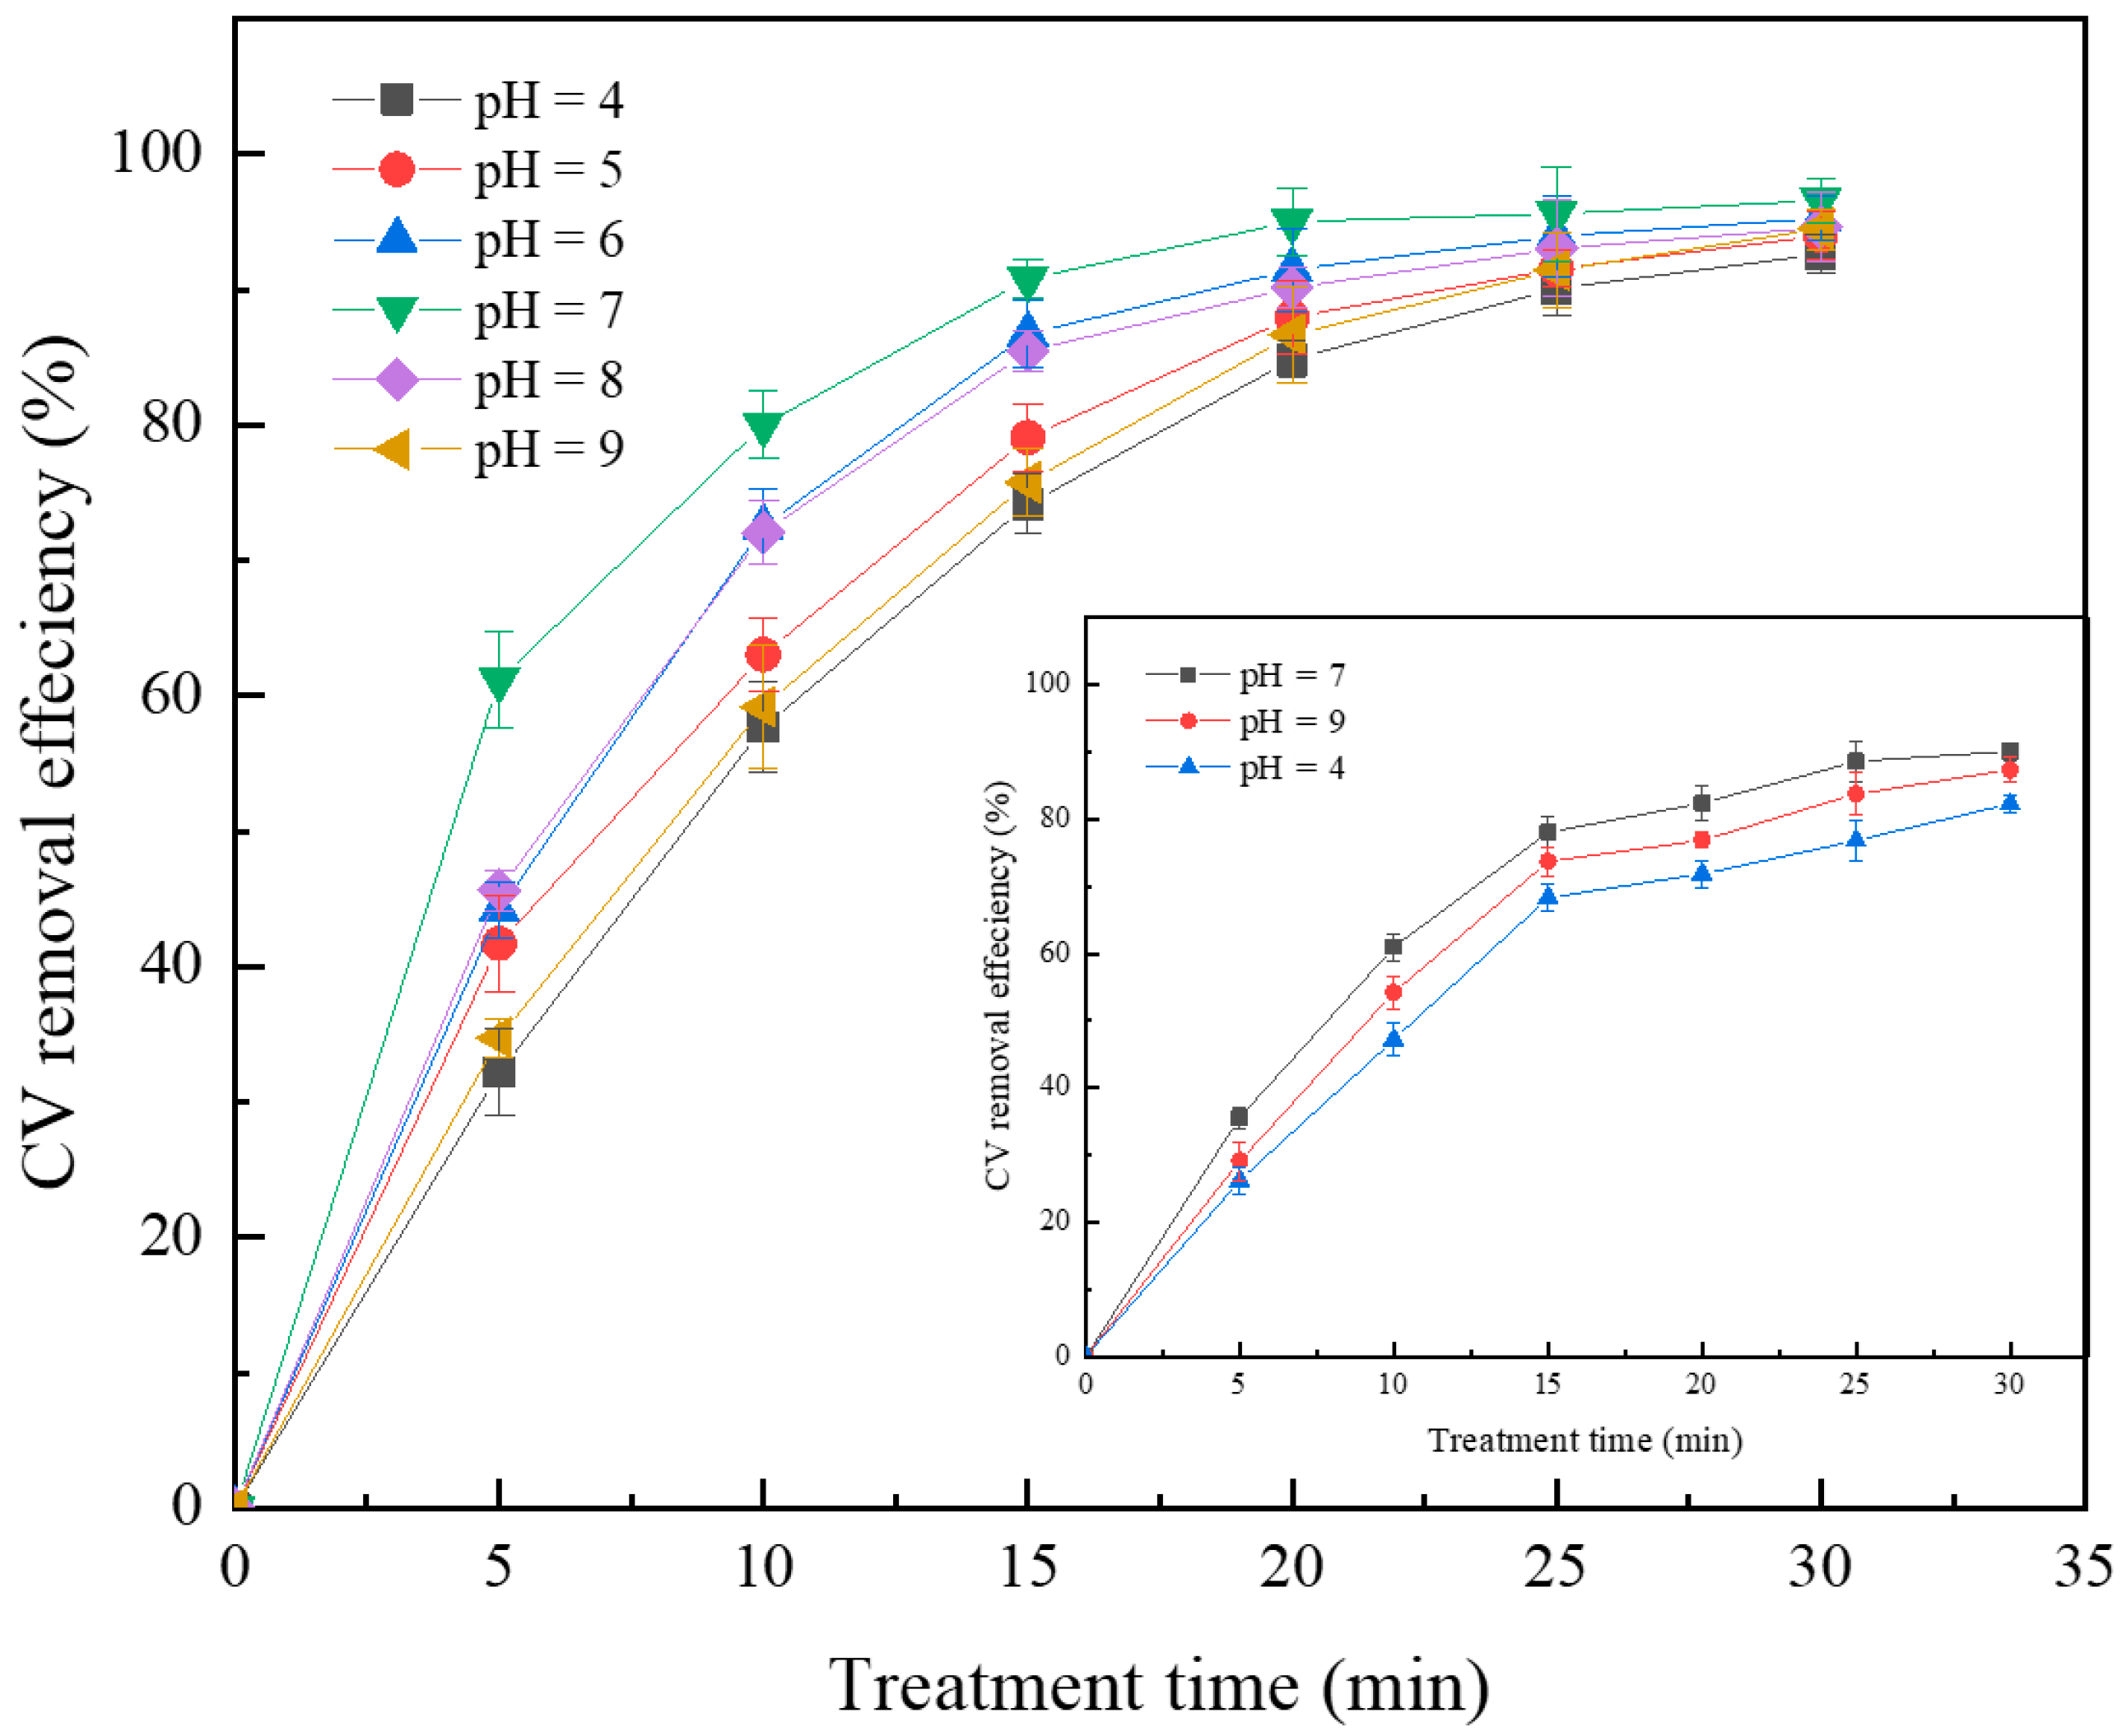
2.4. Effect of Initial pH on the Removal Efficiency of CV

The effects of initial pH on the CV degradation in the red mud/plasma system and in the plasma system alone are shown in Figure 6. The CV solution used in this part was adjusted to a uniform conductivity value after the pH adjusted. In the red mud/plasma system, the removal efficiency of CV is higher in the neutral solution than in the acid and alkaline solutions. Similarly, the maximum removal efficiency is achieved when the solution is neutral in the plasma system alone. During the plasma discharge, O3, •OH, and other oxidants are produced. The initial pH of a solution affects the state of these active substances and thus affects the removal efficiency of organic pollutants [38].
The optimum pH for the treatment of different contaminants using plasma technology varies widely [39,40,41]. While using adsorption or advanced oxidation technology, neutral or weakly alkaline condition is conducive to the removal of CV [42,43,44,45]. In the red mud/plasma system, the maximum removal efficiency was achieved when the solution was neutral. One reason is that CV is a cationic dye and the acidic conditions produced electrostatic repulsion between H+ and CV, resulting in low removal [44]. In addition, the Fenton-like reaction of Equations (1) and (2) occurs in the red mud/plasma system. As the solution is alkaline, the production of •OH is hindered and Fe(OH)3 precipitation occurs, which is not conducive to the removal of pollutants [46,47]. When the solution is acidic, Equation (1) shifts to the left, which hinders the conversion of Fe3+ to Fe2+ and thus the oxidative degradation of CV.
It can also be seen that as the reaction time increases, the effect of the initial pH value on the removal efficiency decreases gradually in the red mud/plasma system. Under the action of high-energy electrons, oxygen and nitrogen at the gas–liquid interface will be dissociated. Then, nitrogen oxides are formed, dissolving in the liquid (Equations (3)–(7)), and produce acidic substances, causing the final acidic solution [48,49]. Therefore, regardless of whether the initial pH of the CV solution is acidic or alkaline, the solution pH decreases after a period of discharge treatment and the effect of the initial pH on the removal efficiency gradually decreases.
Fe3+ + H2O2 → Fe2+ + •OH2 + H+
Fe2+ + H2O2 → Fe3+ + •OH + OH
O2 + e → 2O• + e
N2 + e → 2N• + e
N• + O• → NO
NO + O• → NO2
NO2 + NO2 → NO3 + H+

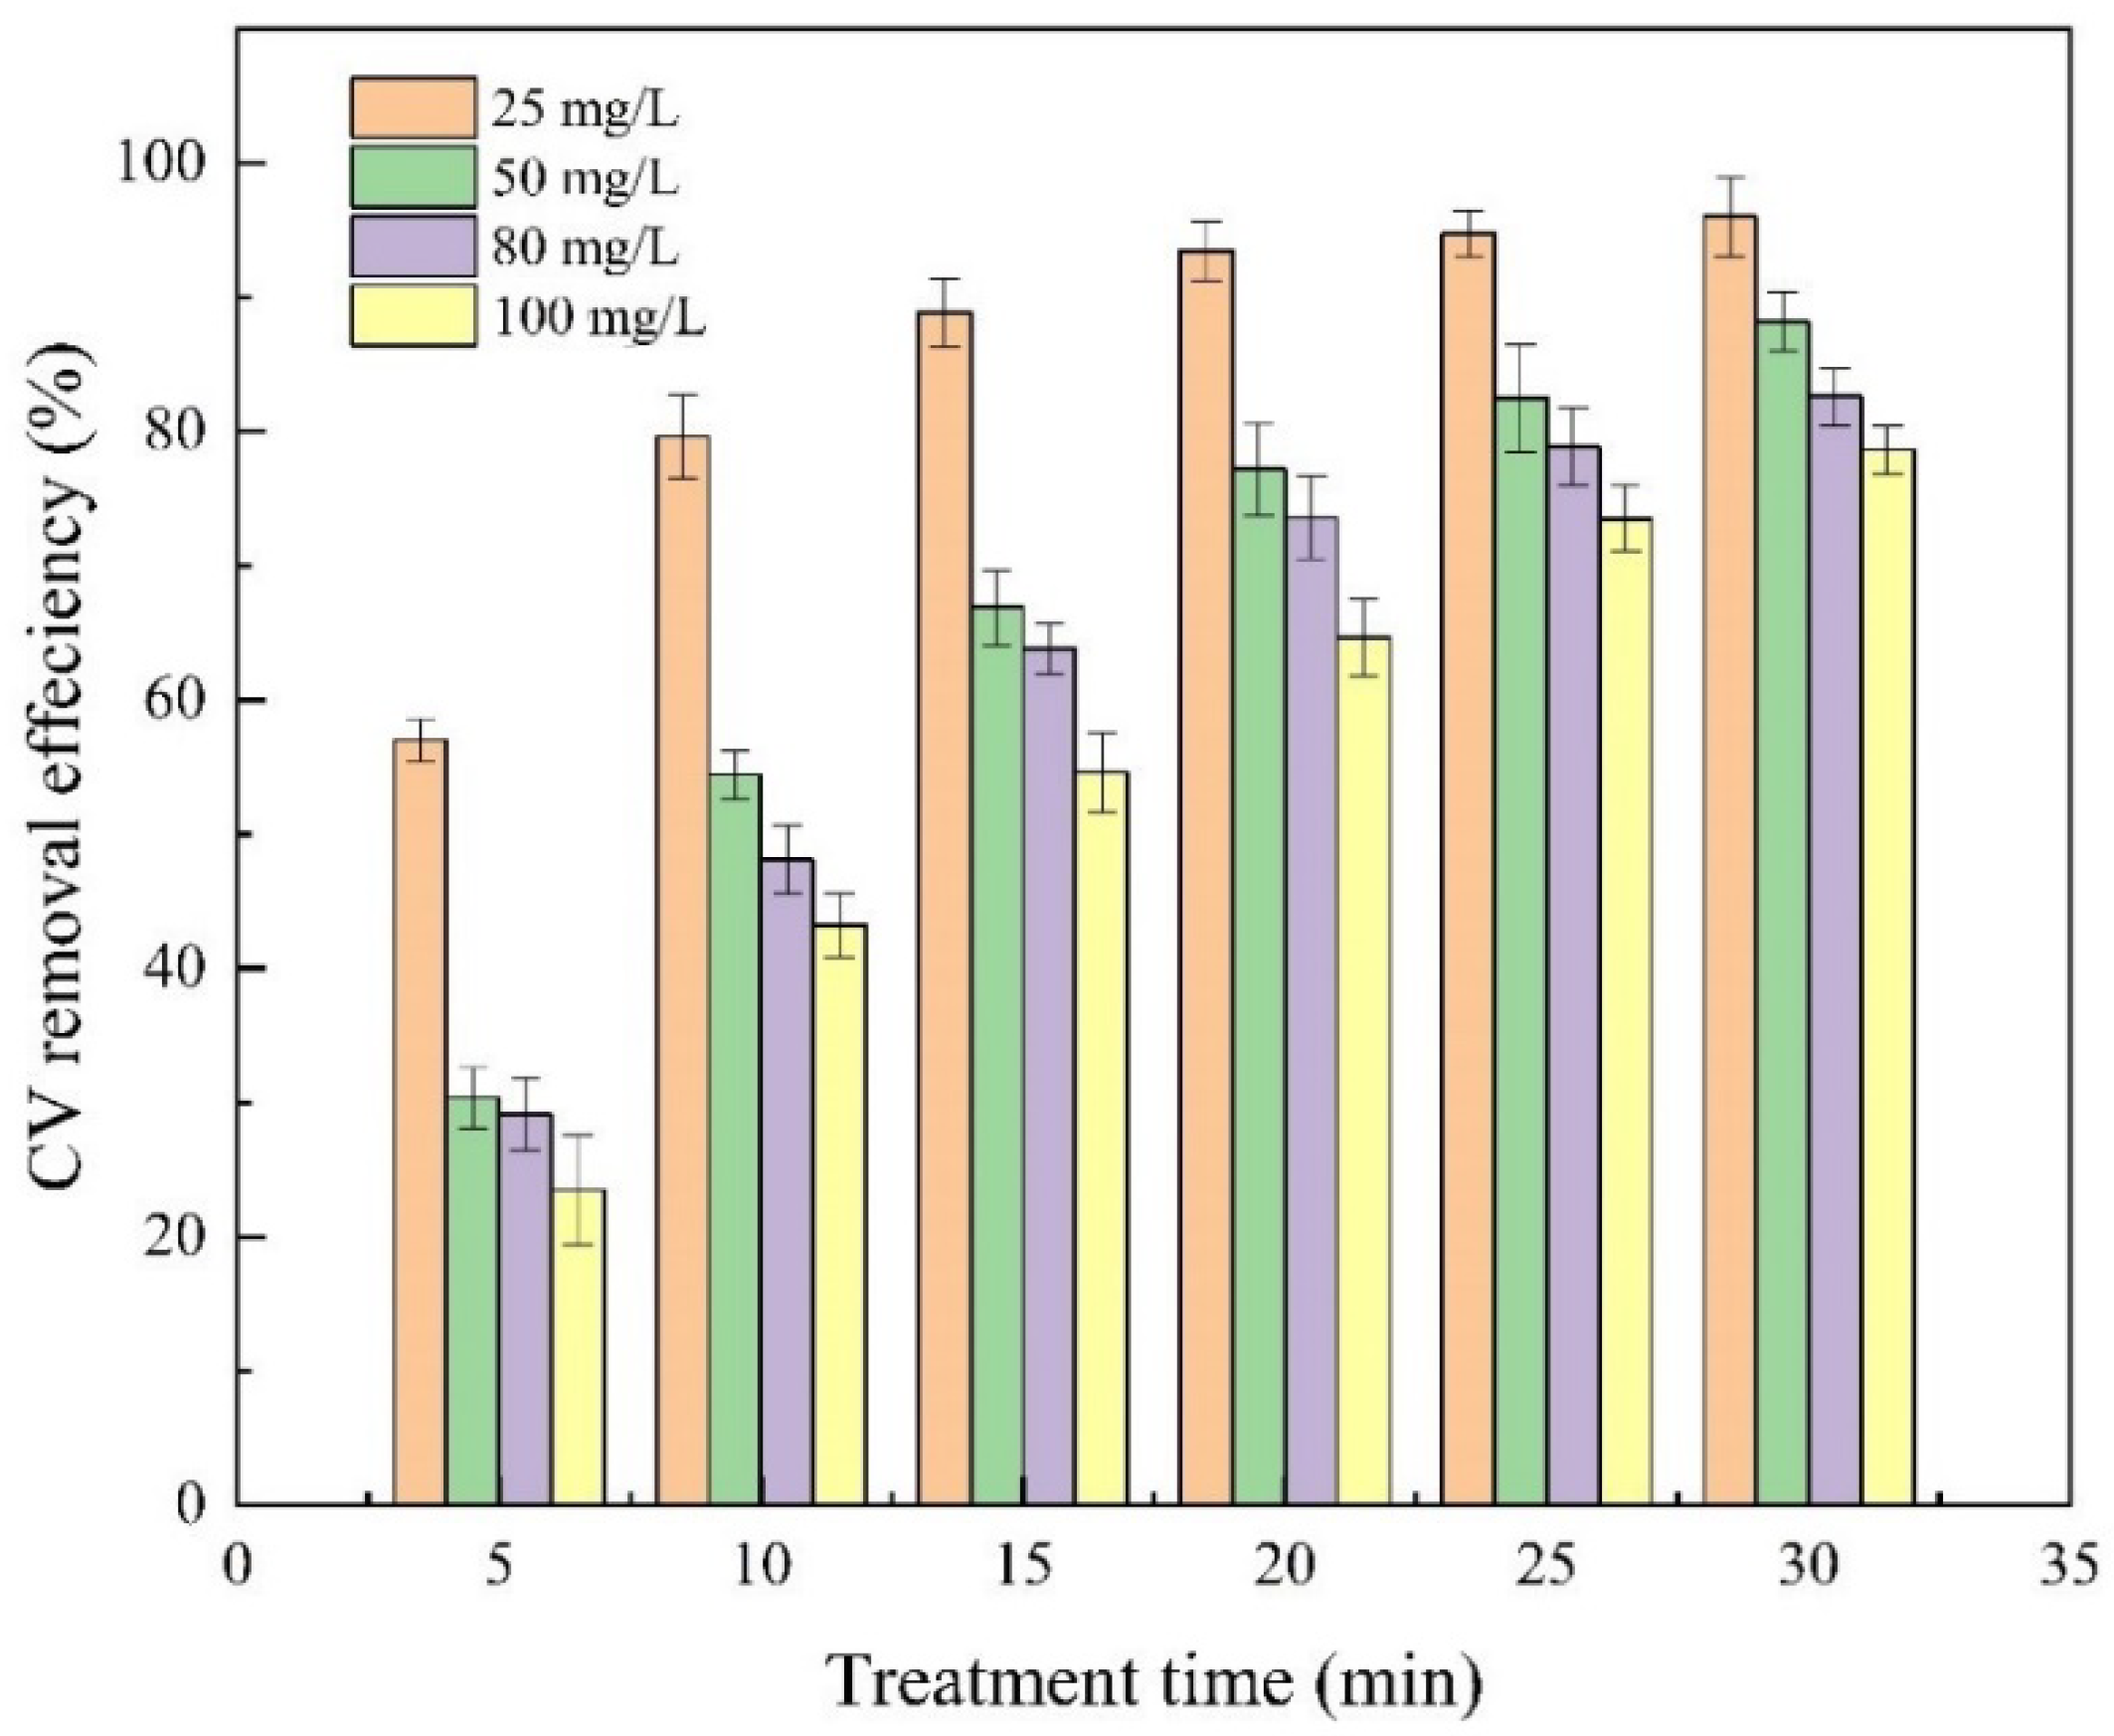
2.5. Effect of Initial Solution Concentration on the Removal Efficiency of CV

The effect of the initial concentration of CV on the degradation was investigated, as shown in Figure 7. After a 5 min reaction, the removal efficiency of CV with 25 mg/L, 50 mg/L, 80 mg/L, and 100 mg/L is 57%, 30%, 29%, and 23%, respectively. After a 30 min reaction, the removal efficiency is 96%, 88%, 82%, and 78%, accordingly. The CV degradation decreases as the initial concentration increases.

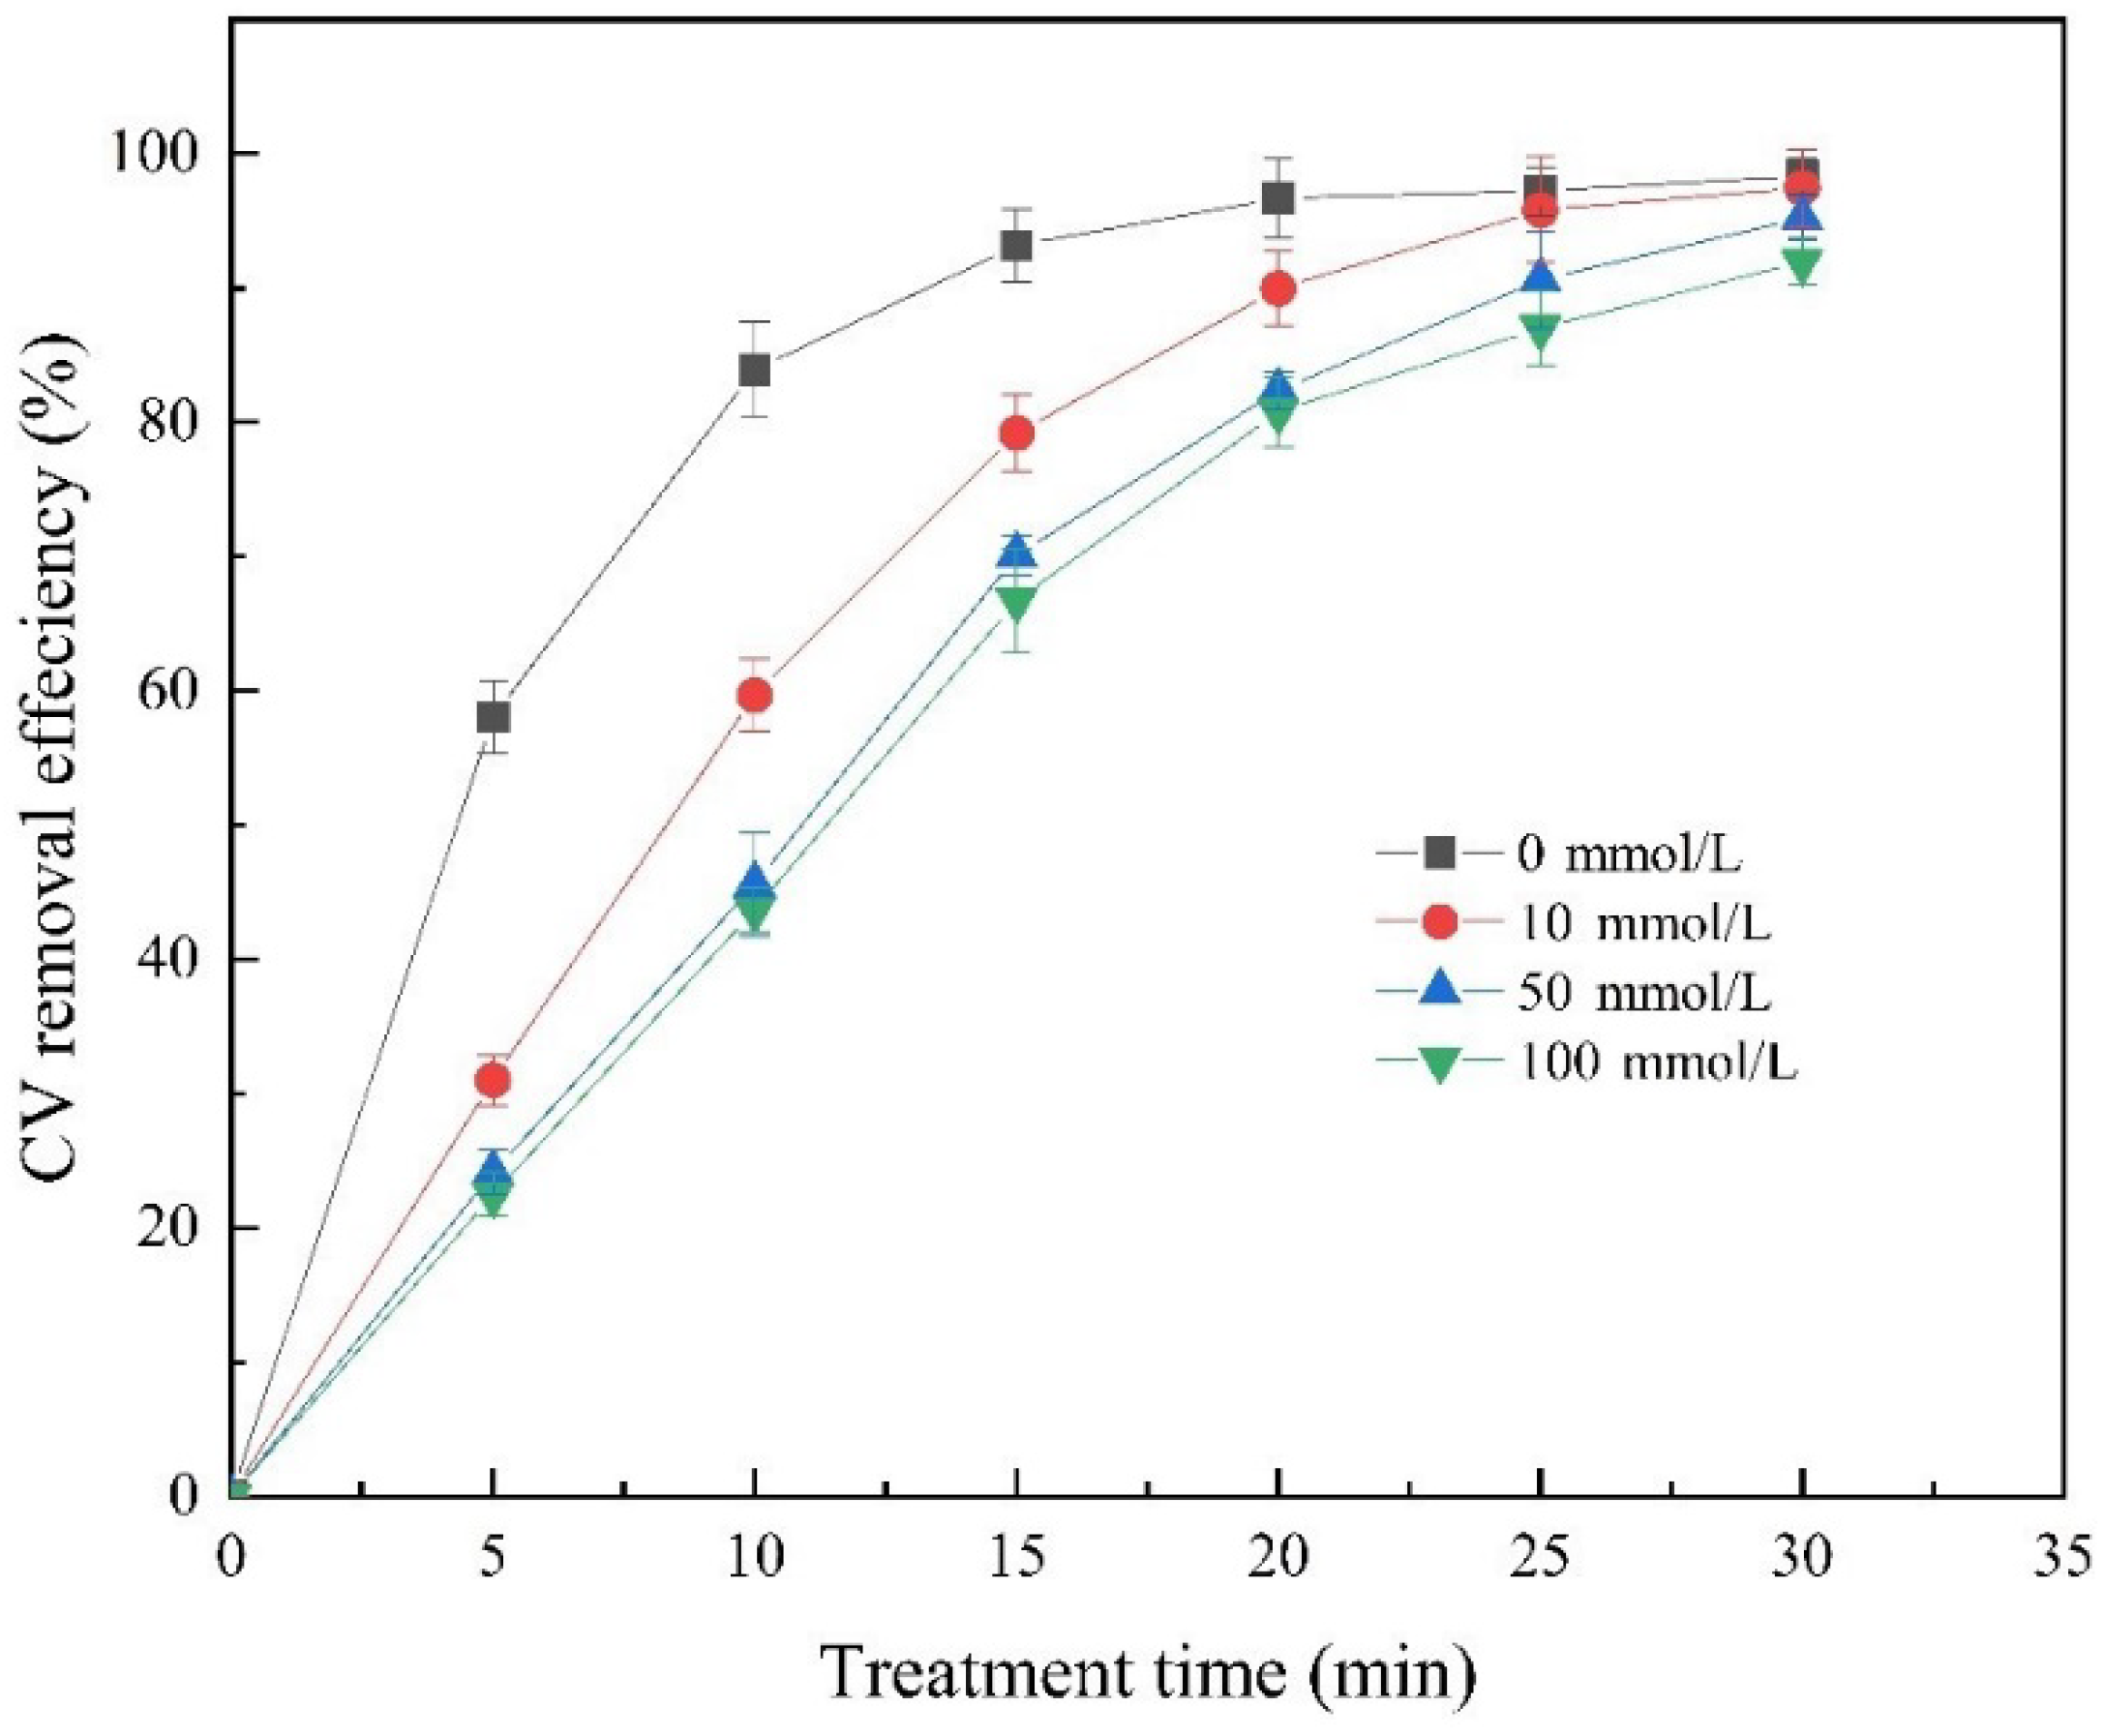
2.6. Radical Quenching Experiments

In general, the discharge process generates reactive free radicals such as •OH radicals, which degrade aqueous contaminants oxidatively [50,51]. To verify the free radical effect of CV degradation, quenching experiments were conducted using methanol, a commonly used •OH scavenger. As shown in Figure 8, the removal efficiency of CV without the methanol addition is 58% at a 5 min reaction, whereas it is 31%, 24%, and 22% with 10 mmol/L, 50 mmol/L, and l00 mmol/L methanol addition, respectively. It can be deduced that the effect of •OH on the CV degradation in the red mud/plasma system is important in the initial reaction stage.
It can also be seen that despite the addition of methanol, there is little difference of the CV removal with time increased, especially after a 20 min reaction. This is because •OH degrades CV efficiently in a short period without methanol. After the •OH quencher addition, the UV light generated during the discharge process reacts photocatalytically with TiO2 in the red mud to form electrons(e) and holes(h+), and the electrons react with O2 to form •O2, •OH2, etc. (Equations (8)–(10)) [52,53,54].
TiO2 + hν → TiO2 + e + h+
O2 + e → •O2
•O2 + H2O → •HO2 + OH

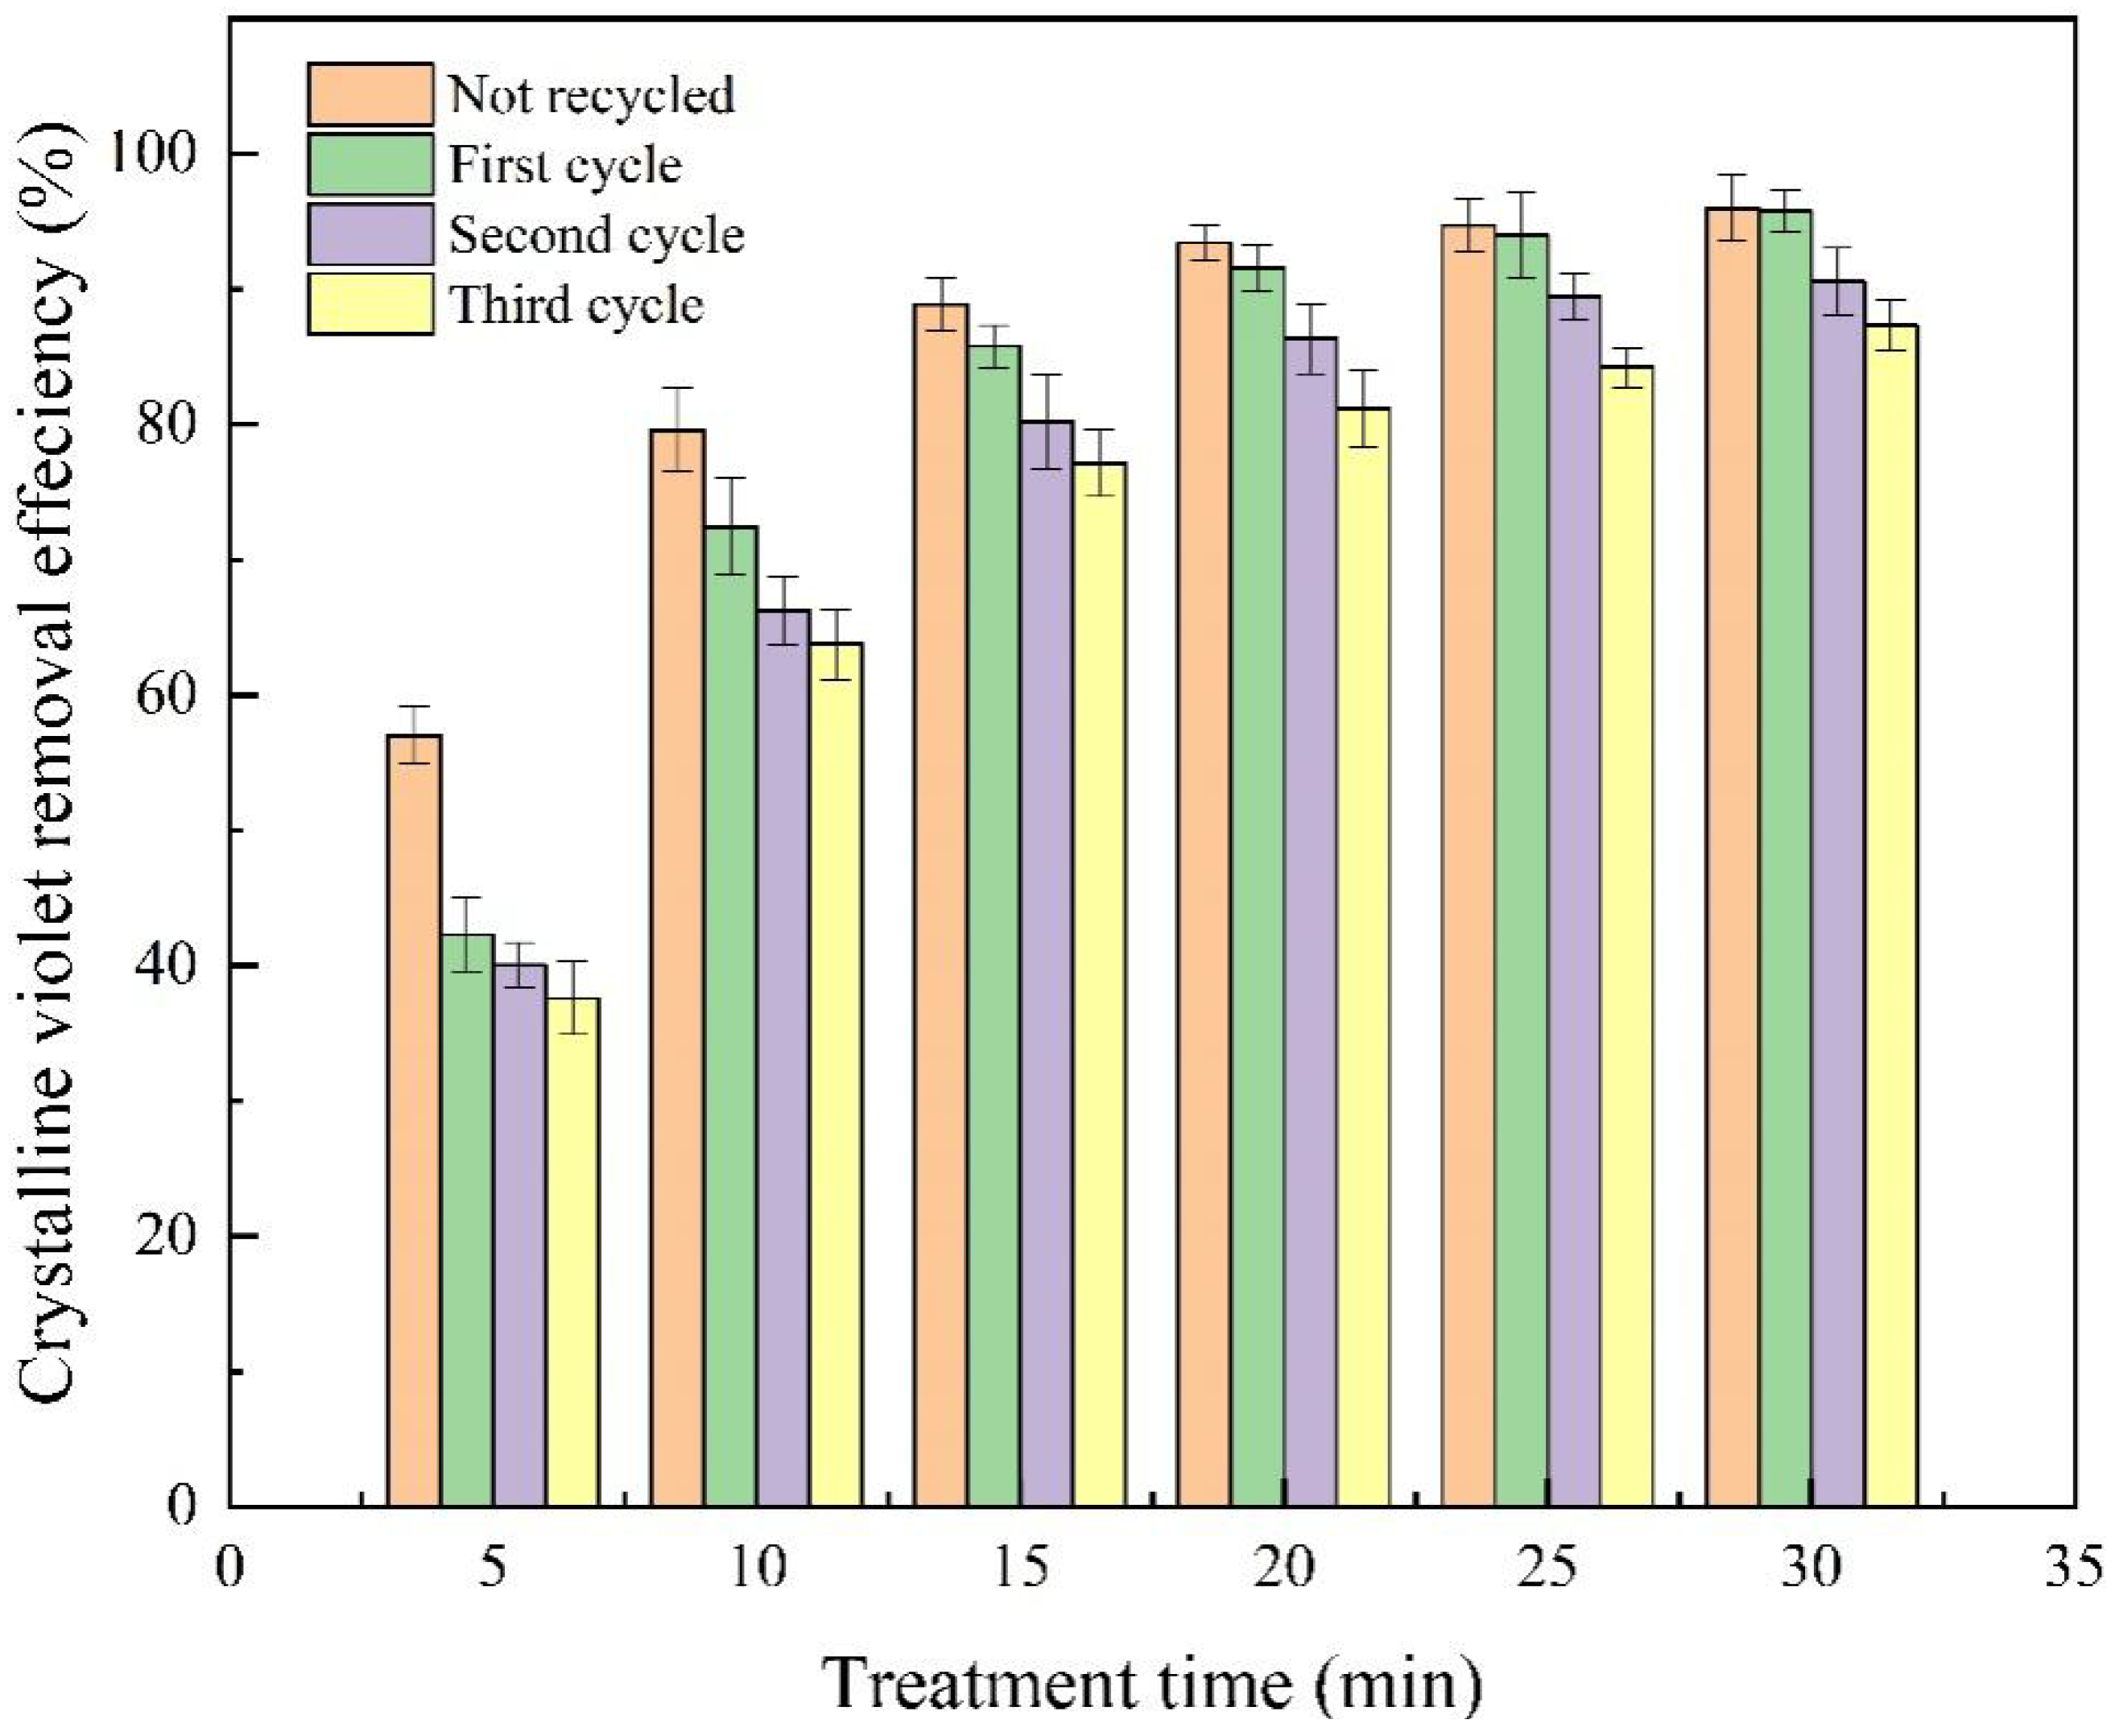
2.7. Red Mud Recycling Experiments

In the red mud/plasma system, the use of red mud catalyst is often accompanied by a decrease in its activity and stability. To investigate the activity and stability of the red mud after being used, three recycling experiments were conducted (Figure 9). As the recycle time increases, the concentration of Fe and Al in the solution gradually decreases (Table 1). Fe and Al precipitated a decrease in the red mud reused, which means the active components in the red mud are lost. In general, the catalytic performance of the red mud decreases as the number of cycles increases, but the removal efficiency of CV decreases only slightly. The red mud catalyst has good catalytic properties even though it loses some of its metal contents.

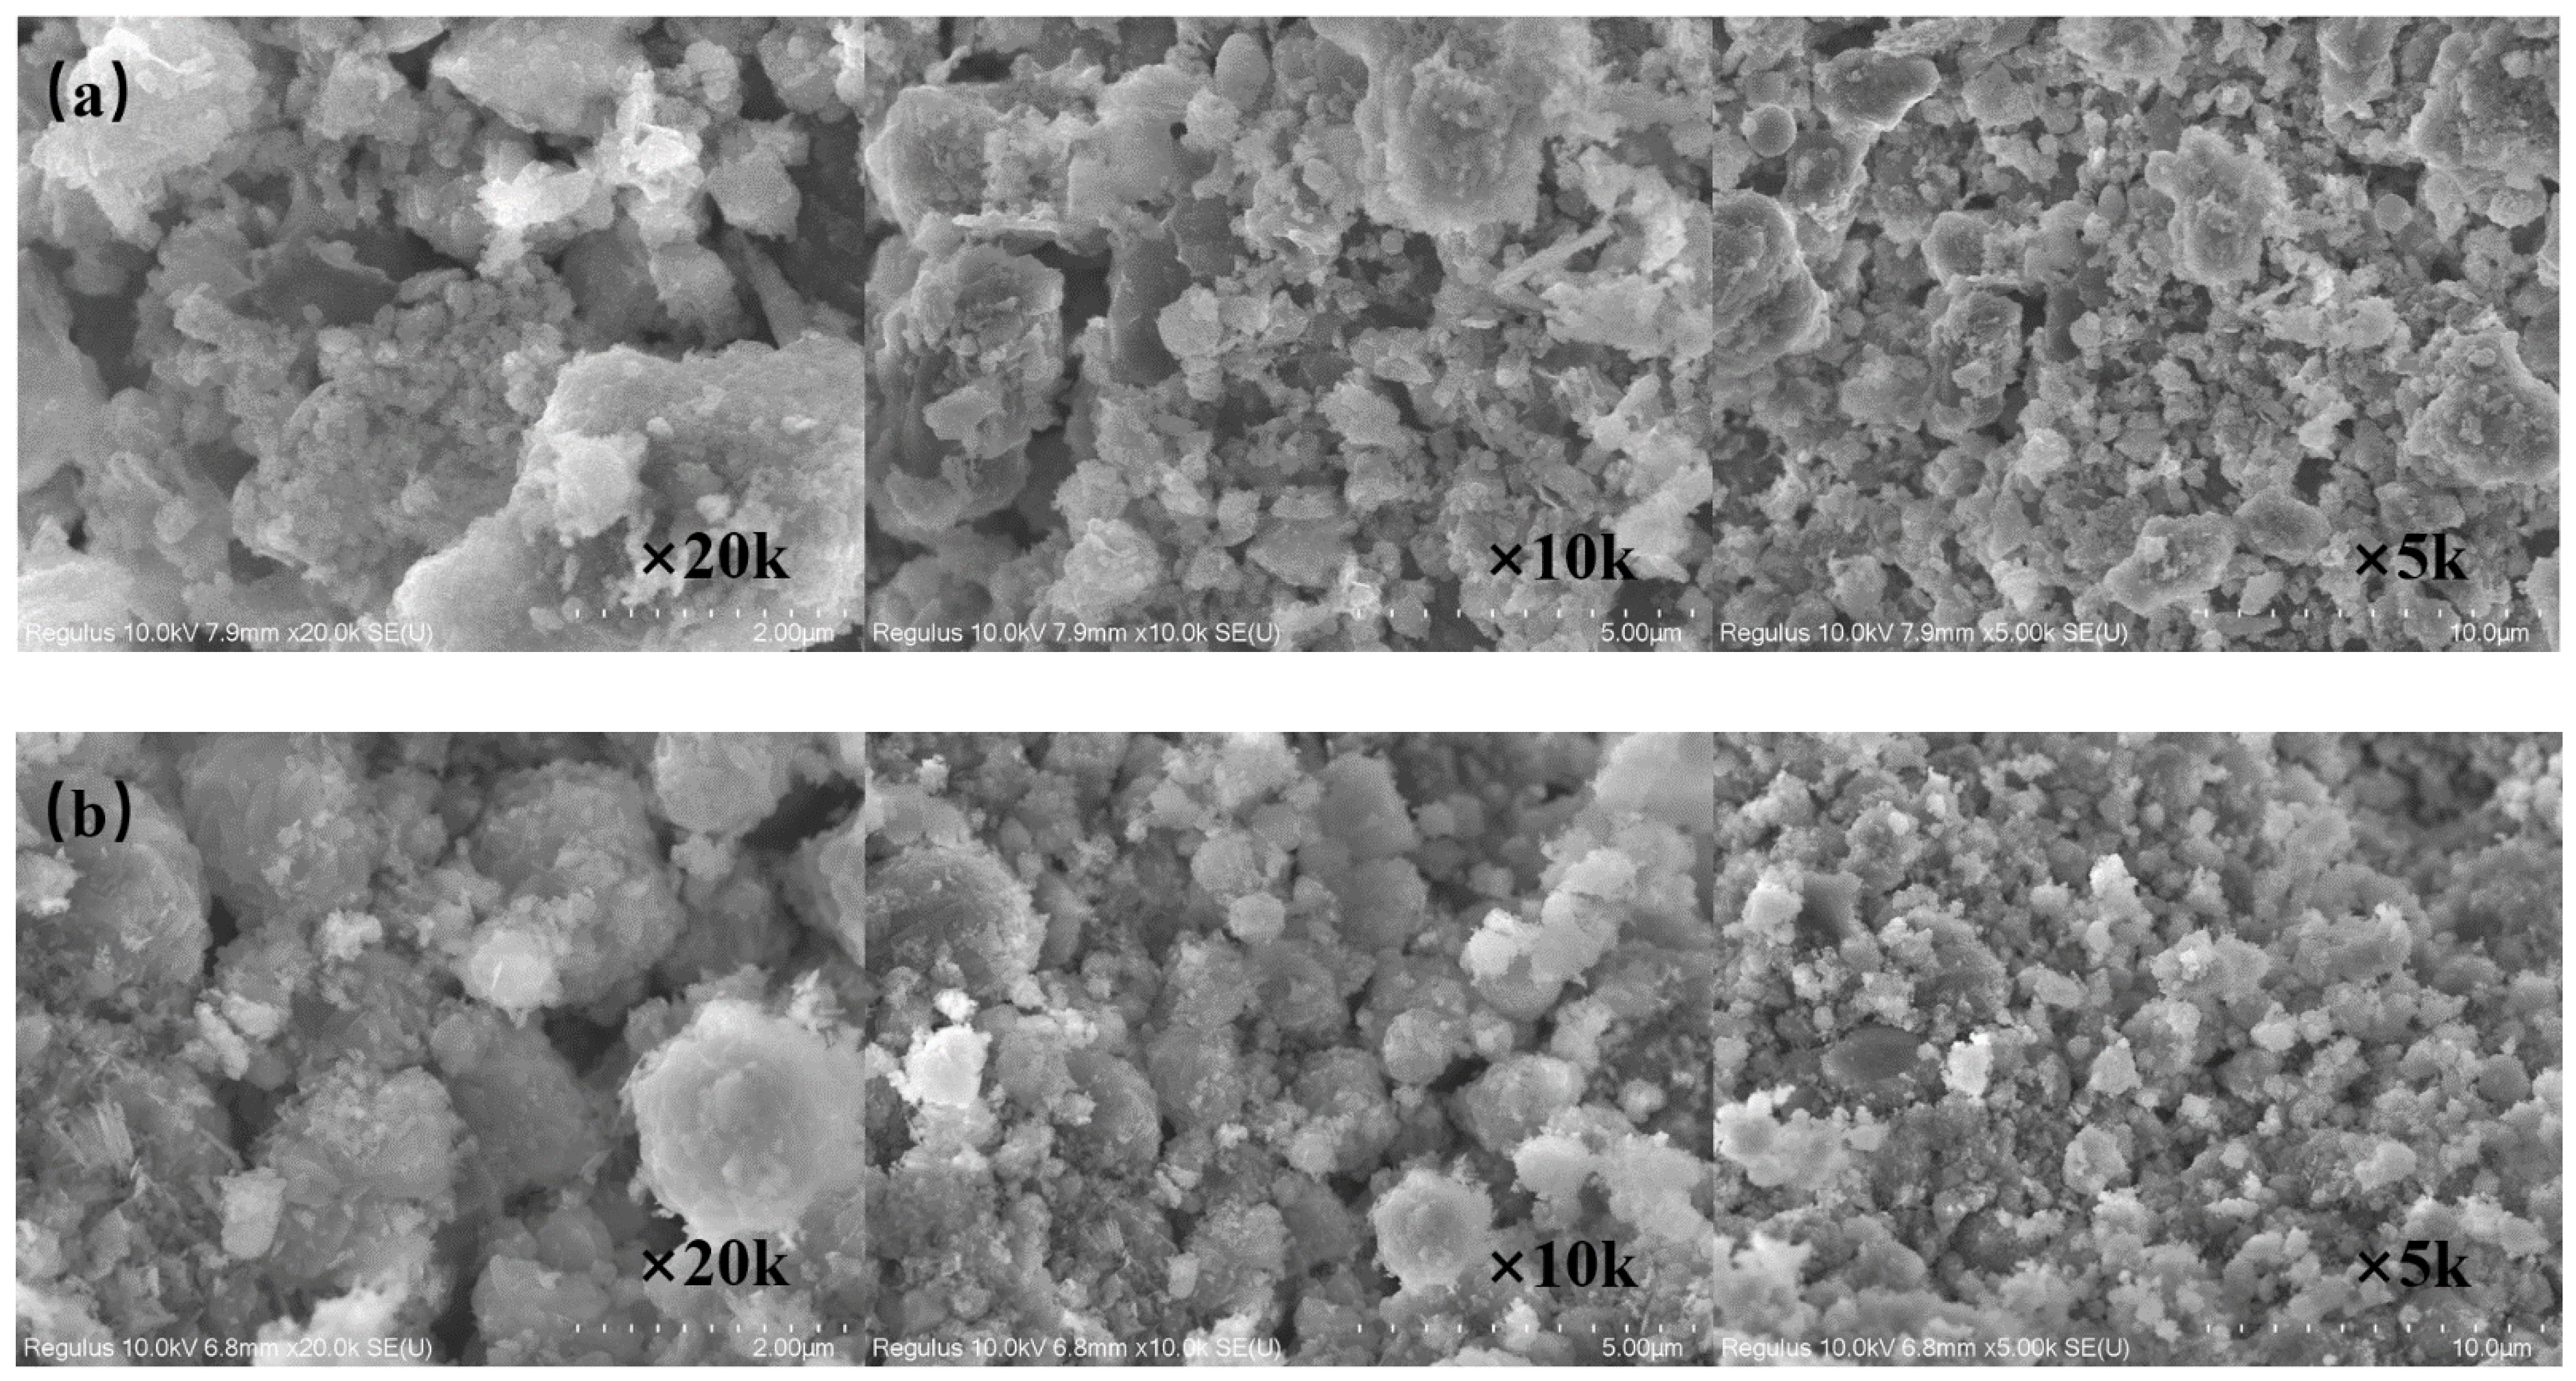
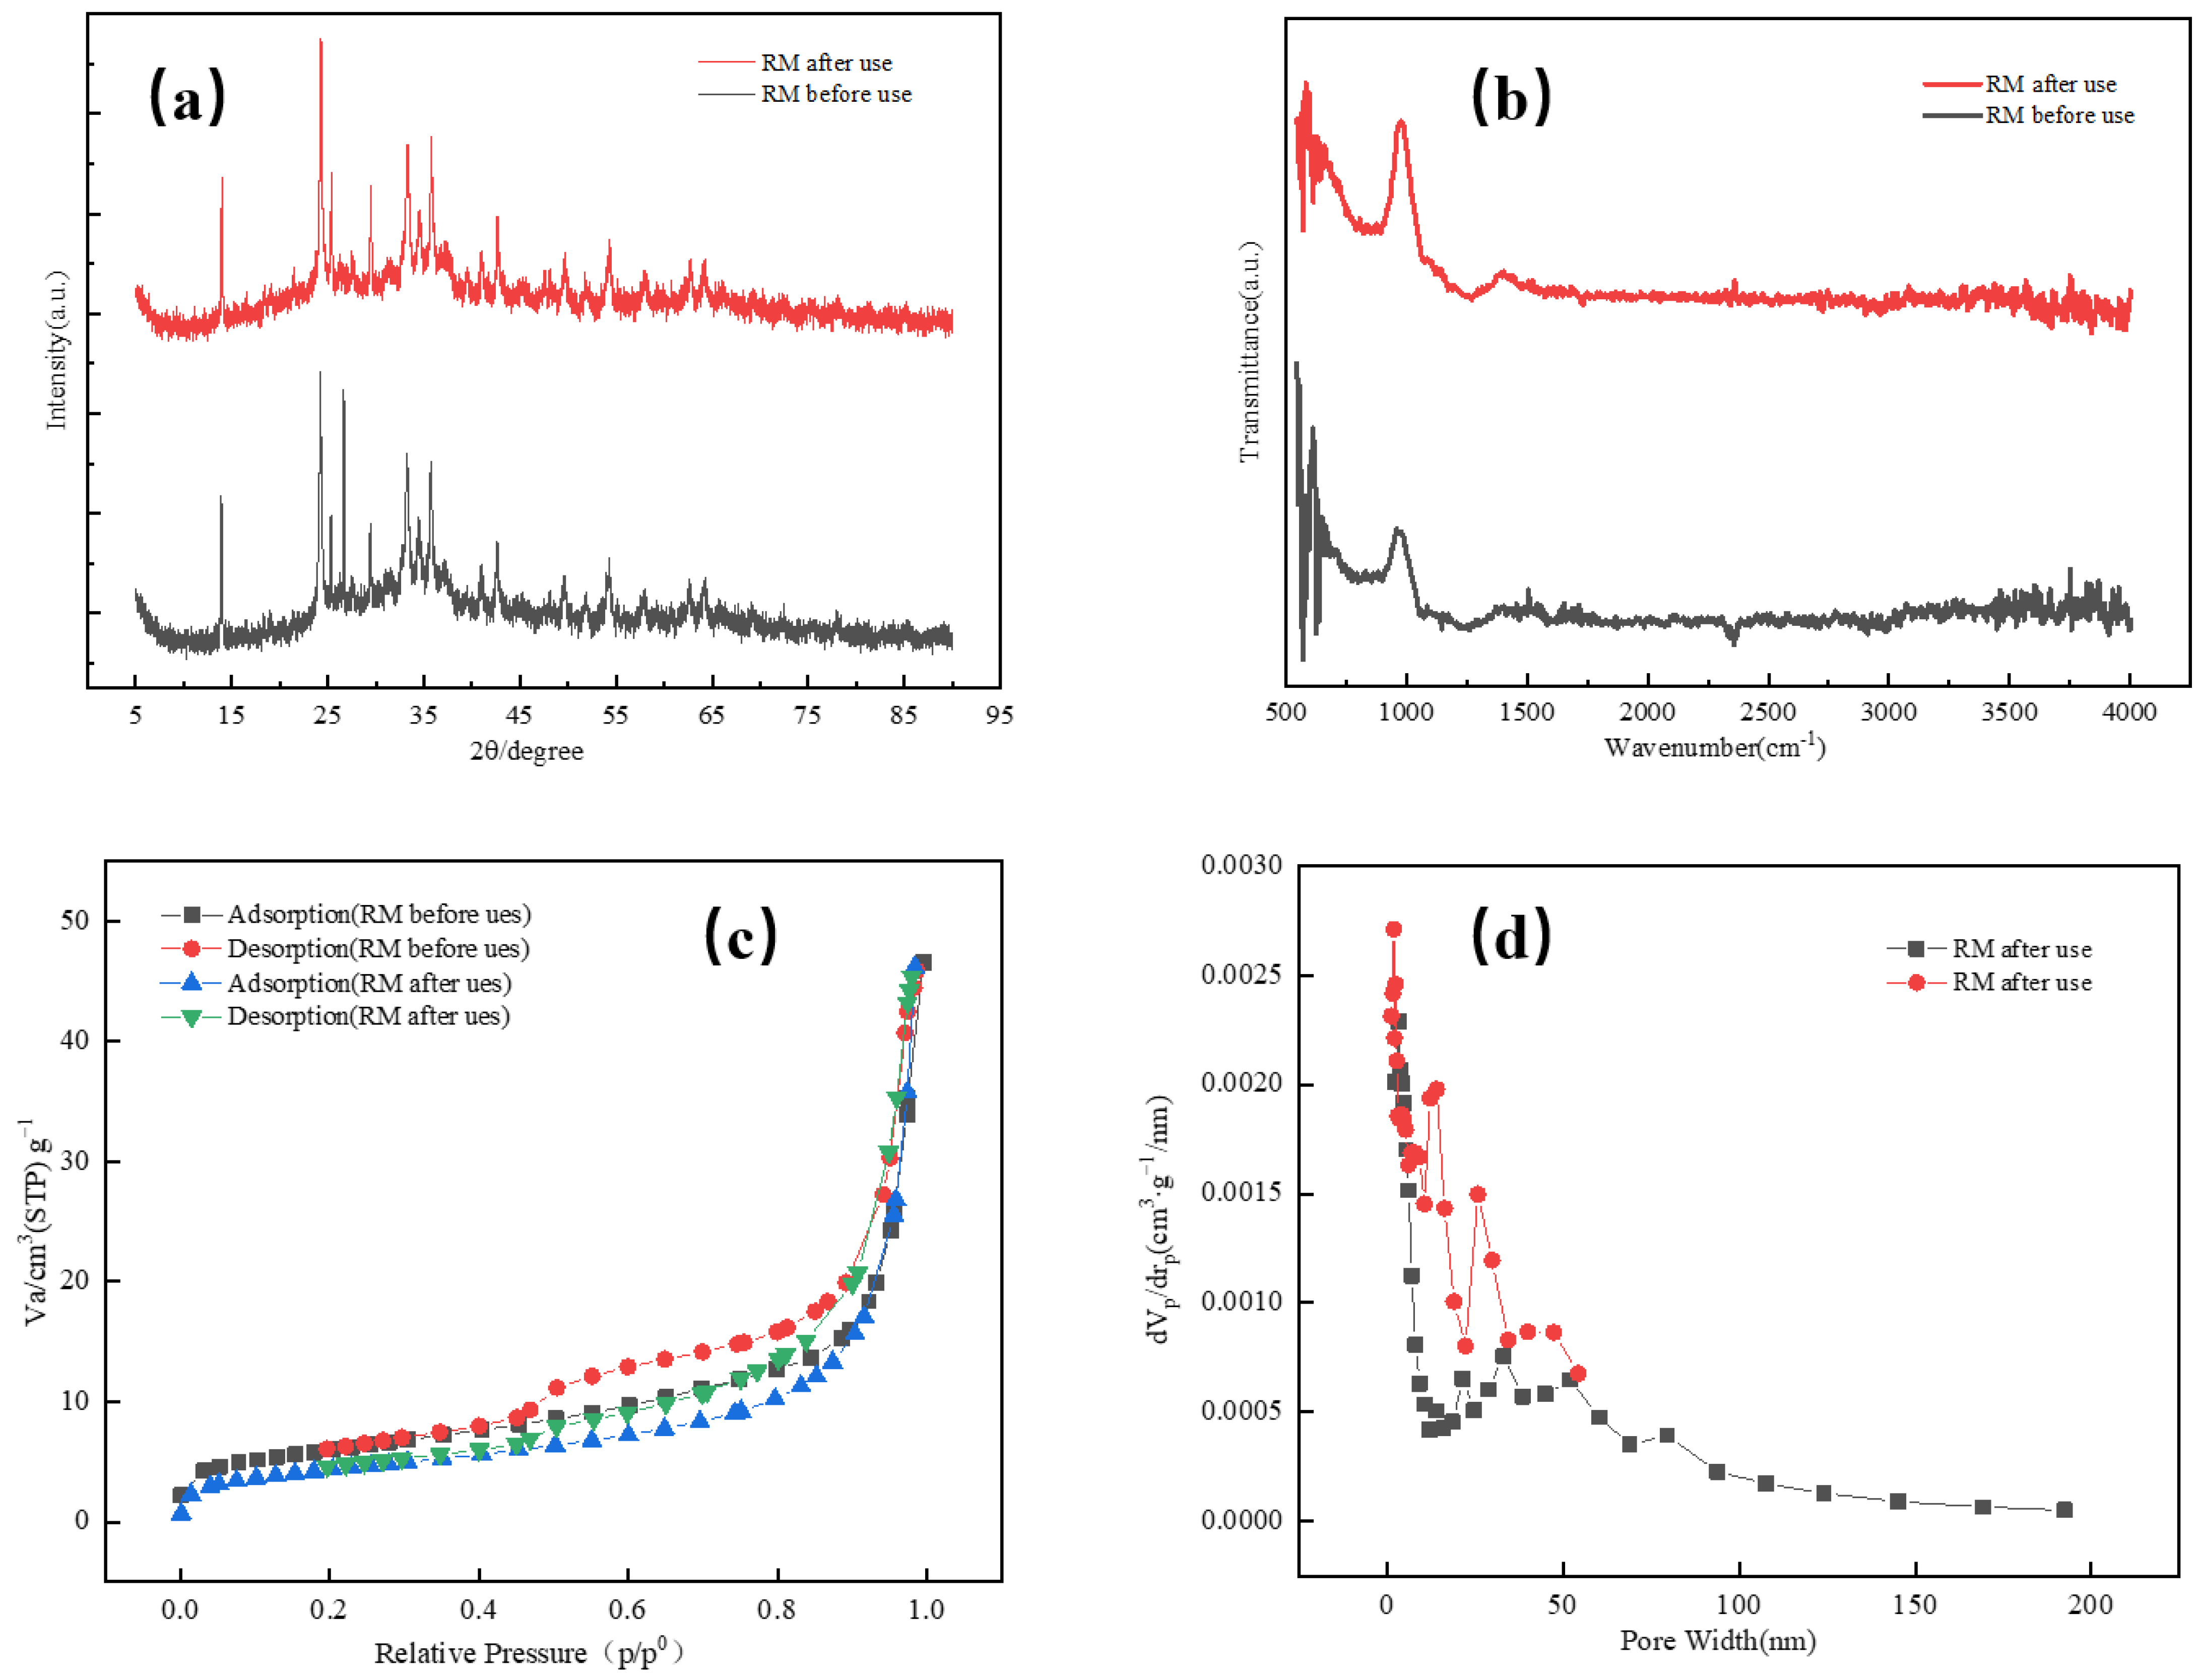
2.8. Characterisation of the Red Mud

The discharge may affect the morphology of the red mud. Figure 10a shows the SEM images of the red mud before and after the reaction, with magnifications of 5000×, 10,000×, and 20,000×. The morphology of the red mud is mainly granular and lumpy, with a relatively rough and uneven surface structure with irregular pores. As shown in Figure 10b, the pores of the red mud were more crowded after use than before use. One reason is that the contaminants clogged the pores; the other is that shock waves and heat from the discharge acted on the surface of the red mud, causing some of its large pores to collapse and create small ones [55,56]. The SEM images of the catalysts before and after the reaction were relatively similar, indicating that the stability of the red mud catalysts used in the experiments is good.
As shown in Figure 11a, the diffraction peaks of the red mud fluctuate considerably due to the complex composition of the red mud itself [57]. The characteristic peaks are obvious, indicating good crystalline properties of the red mud. The images show that the red mud contains Al2O3, Fe2O3, TiO2, SiO2, and other substances. By comparing the XRD images of the red mud before and after the reaction, it can be seen that the peak shapes are similar, indicating that the crystalline structure of the red mud was not affected greatly by the combination of plasma.
The specific surface area, pore distribution, and adsorption properties (BET) of the red mud were characterized and shown in Figure 11 and Table 2. It shows that the surface area, micropore area, and micropore volume of the red mud decreased after the reaction. The SEM characterization results are consistent with this, which may be due to the deposition of contaminants or collapse of pore channels during the treatment process. The nitrogen adsorption–desorption isotherms of the red mud are type IV isotherms, indicating the presence of mesoporous structures [58].
The FT-IR characterization of the red mud is shown in Figure 11b. There are more pronounced absorption peaks in the wave number range of 500–1500 cm−1. These absorption peaks are associated with Si-O, Si-O-Al, and Fe-OH bonds, and it is mainly controlled by metal-oxygen groups [59,60,61,62,63]. Observing the images of the red mud before and after its use, some of the absorption peaks of the red mud decreased in intensity after the reaction. However, there was no significant change in the spectral bands, indicating that the structure of the red mud did not change significantly after use.

3. Materials and Methods Experimental

3.1. Experimental Set-Up

The plasma system includes a nanosecond pulsed power supply (Institute of Electrostatic and Special Power Supplies, Dalian University of Technology, Dalian, China), plasma reactor, and gas delivery system (Figure 12). The power supply is with a pulse rise time < 20 ns, pulse width < 50 ns, and adjustable pulse frequency from 0 to 200 Hz. The plasma reactor consists of a plexiglass cylinder (diameter 100 mm, height 110 mm), four hollow stainless-steel needles (inner diameter 0.8 mm), and a stainless-steel plate (diameter 40 mm, thickness 2 mm). The needles are used as high-voltage electrodes and the plate as a grounded electrode. Oxygen is blown into the wastewater through the needles and bottom aeration chamber. The gas flow rate is controlled by a flow meter.

3.2. Red Mud Preparation

The raw material of red mud was taken from the industrial waste residue of an aluminum refinery plant. The red mud was dried in an oven at 80 °C for 4 h and then ground and sieved to a spherical particle with 0.12–0.15 mm diameter. A quantitative amount of Co(NO3)2•6H2O and nitrate solution was prepared separately as the active component precursor and placed in a beaker with a chosen loading of 3%. A total of 100 g of pre-treated red mud, 15 g of concave clay, and a quantitative amount of porogenic agent (10 g of fly ash drift beads were selected) were weighed, placed in a mortar, and mixed well. The catalyst was hand-rolled to a particle size of 4–6 mm and dried in a 60 °C oven for 24 h. The dried red mud for the red mud catalyst was placed in a crucible and roasted in a muffle furnace at a certain temperature for a certain period (initial single component screening roasting temperature of 500 and roasting time of 4 h) and removed at the end of roasting to produce the red mud catalyst [64,65].

3.3. Experimental Procedure

Red mud/plasma system experiments: The crystalline violet dye (C25H3ON3Cl, CV, Sinopharm) used in the experiments is analytically pure. In each experiment, 150 mL of CV simulated wastewater and a certain amount of red mud were added to the reactor. The oxygen flow rate was adjusted to 3 L/min. During the plasma treatment, the discharge frequency was fixed at 50 Hz and the discharge voltage was adjusted to 18–26 kV. Samples were taken at 5 min intervals and passed through a 0.45 μm filter membrane before analysis. The pH of the solution was adjusted with 0.01 mol/L dilute H2SO4 solution and NaOH solution. The conductivity of the solution was adjusted with 0.1 mol/L Na2SO4 solution [20,66,67].
Red mud adsorption experiments: 25 mg/L, 150 mL of CV solution was placed in a conical flask and a certain amount of red mud was added. The flask was put in a constant temperature shaker (SHA-C, Guohua Electric Co., Ltd.,Shenzhen, China) and shaken at 150 rad/min. The water sample was passed through a 0.45μm filter membrane before analysis [60].

3.4. Analytical Methods

The CV absorbance was measured by a UV spectrophotometer (T9 New Century, Analysis General Instrument Co., Ltd., Beijing, China) at the maximum absorption wavelength of 590 nm [68]. The pH of the solution was determined by a pH meter (PHB-4, Shanghai Precision Scientific Instruments Co., Ltd., Shanghai, China), and the conductivity was measured by a conductivity meter (DDSJ-318; Shanghai Magnetics Technology Co., Ltd., Shanghai, China). The discharge voltage and frequency were collected by a high voltage probe (P6015, Tektronix Technology Inc., Shanghai, China) and displayed by an oscilloscope (TBS-1202B, Tektronix Technology Inc., Shanghai, China). The total organic carbon (TOC) was measured with a TOC instrument (SSM-5000A, Shimadzu(Shanghai) Global Laboratory Consumables Co., Ltd., Shanghai, China). The Fe and Al contents of the solutions were determined using an inductively coupled plasma optical emission spectrometer (ICP-OES, Thermo Fisher Scientific, Waltham, USA); a specific surface area and pore volume distribution of the red mud was determined using a specific surface area and pore analyzer (Belsorb-maxⅡ, MicrotracBEL Japan, Inc., Shanghai, China); a scanning electron microscope (SU8100, Hitachi High-Tech Global, Shanghai, China) was used to examine the morphology of the red mud; and X-ray diffractometry (Rigaku Ultima IV, Rigaku Corporation, Tokyo, Japan) and Fourier transform infrared spectrophotometry (Nicolet 6700, Thermo Fisher Scientific, Waltham, USA) were used to determine changes in the structure and surface group characteristics of the red mud.
The removal efficiency of CV is calculated by the following equation [69]:
η = C 0 C t C 0 × 100 %
where: Ct is the concentration of CV at a given moment (mg/L); C0 is the initial concentration of CV (mg/L).
The discharge power P (kW) was calculated according to Equation (12).
P = 1 T 0 T U t ( I t I t ) d t
where T was the discharge time (min); Ut was the voltage (kV); It was the current (A); It’ was the displacement current (A).
The energy yields (G50) of MB decolorization at 50% conversion (g/kWh) were calculated by the following Equation (13) [70].
G 50 = 30 × C 0 × V P × t 50
where C0 represents the initial concentration of CV (mg/L), V is the volume of the treated solution (L), P is the power of input energy (W), and t50 is the time (min) required for 50% conversion of CV.

4. Conclusions

In this study, a red mud/plasma system was established for the treatment of CV wastewater. The results showed that the red mud addition significantly improved the removal efficiency of CV in a short time, reducing the energy consumption of the discharge. The energy yield at 50% CV decomposition (G50) shows that the addition of red mud increases the energy yield of the plasma system, which significantly reduces the energy consumption of the discharge. The TOC removal is higher in the red mud/plasma system than in the plasma system alone. The amount of the red mud addition, the initial pollutant’s concentration and pH of the solution, and the discharge voltage all affect the CV removal. High discharge voltage can improve the removal efficiency. The neutral solution is beneficial for CV removal. When the red mud was recycled three times, the removal efficiency decreased a little in the red mud/plasma system. Hydroxyl radical plays an important role in the treatment of CV. The specific surface area and pore space of the red mud decreased slightly after the treatment, but the structure of the red mud was not greatly affected. The study not only achieves waste reuse but also reduces the plasma reaction costs, and the use of this method for treating wastewater warrants further research.

Author Contributions

Conceptualization, W.Z. and Q.W.; methodology, J.B.; software, Q.W. and J.B.; data curation, M.F., J.J. and Z.S.; writing—original draft preparation, W.Z.; writing—review and editing, H.W. and Y.S.; funding acquisition, H.W. All authors have read and agreed to the published version of the manuscript.

Funding

This research was funded by the National Natural Science Foundation of China (No. 51707093) and the Postgraduate Research & Practice Innovation Program of Jiangsu Province (SJCX21_0474).

Conflicts of Interest

The authors declare no conflict of interest.

References

  1. Alzahrani, E. Zinc Oxide Nanopowders Prepared by the Sol-Gel Process for the Efficient Photodegradation of Methyl Orange. Curr. Anal. Chem. 2016, 12, 465–475. [Google Scholar] [CrossRef]
  2. Cai, H.; Mei, Y.D.; Chen, J.H.; Wu, Z.H.; Lan, L.; Zhu, D. An analysis of the relation between water pollution and economic growth in China by considering the contemporaneous correlation of water pollutants. J. Clean. Prod. 2020, 276, 122783. [Google Scholar] [CrossRef]
  3. Sarma, G.K.; Sen Gupta, S.; Bhattacharyya, K.G. Adsorption of Crystal violet on raw and acid-treated montmorillonite, K10, in aqueous suspension. J. Environ. Manag. 2016, 171, 1–10. [Google Scholar] [CrossRef]
  4. Shanmugam, S.; Ulaganathan, P.; Sivasubramanian, S.; Esakkimuthu, S.; Krishnaswamy, S.; Subramaniam, S. Trichoderma asperellum laccase mediated crystal violet degradation-Optimization of experimental conditions and characterization. J. Environ. Chem. Eng. 2017, 5, 222–231. [Google Scholar] [CrossRef]
  5. Shindhal, T.; Rakholiya, P.; Varjani, S.; Pandey, A.; Ngo, H.H.; Guo, W.S.; Ng, H.Y.; Taherzadeh, M.J. A critical review on advances in the practices and perspectives for the treatment of dye industry wastewater. Bioengineered 2021, 12, 70–87. [Google Scholar] [CrossRef] [PubMed]
  6. Zhao, C.; Ye, Y.H.; Chen, X.F.; Da, X.W.; Qiu, M.H.; Fan, Y.Q. Charged modified tight ceramic ultrafiltration membranes for treatment of cationic dye wastewater. Chin. J. Chem. Eng. 2022, 41, 267–277. [Google Scholar] [CrossRef]
  7. Gao, J.; Gu, P.D.; Yuan, L.; Zhong, F.C. Degradation of Dye Wastewater by ns-Pulse DBD Plasma. Plasma Sci. Technol. 2013, 15, 7. [Google Scholar] [CrossRef]
  8. Liu, Y.; Sun, D.Z.; Cheng, L.; Li, Y.P. Preparation and characterization of Fe2O3-CeO2-TiO2/gamma-Al2O3 catalyst for degradation dye wastewater. J. Environ. Sci.-China 2006, 18, 1189–1192. [Google Scholar] [CrossRef]
  9. Jiao, S.; Zhao, Y.M.; Li, C.S.; Wang, B.S.; Qu, Y. Recyclable adsorbent of BiFeO3/Carbon for purifying industrial dye wastewater via photocatalytic reproducible. Green Energy Environ. 2019, 4, 66–74. [Google Scholar] [CrossRef]
  10. Wang, F.; Li, L.; Iqbal, J.; Yang, Z.R.; Du, Y.P. Preparation of magnetic chitosan corn straw biochar and its application in adsorption of amaranth dye in aqueous solution. Int. J. Biol. Macromol. 2022, 199, 234–242. [Google Scholar] [CrossRef]
  11. Carvalho, J.R.S.; Amaral, F.M.; Florencio, L.; Kato, M.T.; Delforno, T.P.; Gavazza, S. Microaerated UASB reactor treating textile wastewater: The core microbiome and removal of azo dye Direct Black 22. Chemosphere 2020, 242, 125157. [Google Scholar] [CrossRef] [PubMed]
  12. Sohrabi, A.; Haghighat, G.; Shaibani, P.M.; Van Neste, C.W.; Naicker, S.; Sadrzadeh, M.; Thundat, T. Degradation of pharmaceutical contaminants in water by an advanced plasma treatment. Desalin. Water Treat. 2019, 139, 202–221. [Google Scholar] [CrossRef]
  13. Abd El-Gelil, G.M.; Mansour, M.S.; Ebrahiem, E.E.; EL-Shazly, A.H.; Abou-Gabal, H. Degradation of Eosin Y in Water by Corona Treatment with a Dielectric Barrier Discharge Plasma. Chem. Eng. Technol. 2020, 43, 2015–2022. [Google Scholar] [CrossRef]
  14. Hu, X.; Wang, B. Removal of pefloxacin from wastewater by dielectric barrier discharge plasma: Mechanism and degradation pathways. J. Environ. Chem. Eng. 2021, 9, 105720. [Google Scholar] [CrossRef]
  15. Duana, L.J.; Jiang, N.; Lu, N.; Shang, K.F.; Li, J.; Wu, Y. Synergetic effect of TiO2 and Fe3+ as co-catalysts for enhanced phenol degradation in pulsed discharge system. Appl. Catal. B-Environ. 2018, 221, 521–529. [Google Scholar] [CrossRef]
  16. Huang, J.; Puyang, C.; Wang, Y.; Zhang, J.; Guo, H. Hydroxylamine activated by discharge plasma for synergetic degradation of tetracycline in water: Insight into performance and mechanism. Sep. Purif. Technol. 2022, 300, 121913. [Google Scholar] [CrossRef]
  17. Guo, H.; Wang, H.; Wu, Q.; Zhou, G.; Yi, C. Kinetic analysis of acid orange 7 degradation by pulsed discharge plasma combined with activated carbon and the synergistic mechanism exploration. Chemosphere 2016, 159, 221–227. [Google Scholar] [CrossRef]
  18. Chen, W.G.; Wu, H.X.; Fan, J.W.; Fang, Z.; Lin, S.H. Activated persulfate by DBD plasma and activated carbon for the degradation of acid orange II. Plasma Sci. Technol. 2020, 22, 34009. [Google Scholar] [CrossRef]
  19. Zhang, Y.Z.; Xiong, X.Y.; Han, Y.; Yuan, H.; Deng, S.H.; Xiao, H.; Shen, F.; Wu, X.B. Application of titanium dioxide-loaded activated carbon fiber in a pulsed discharge reactor for degradation of methyl orange. Chem. Eng. J. 2010, 162, 1045–1049. [Google Scholar] [CrossRef]
  20. Fan, J.W.; Wu, H.X.; Liu, R.Y.; Meng, L.Y.; Sun, Y.J. Review on the treatment of organic wastewater by discharge plasma combined with oxidants and catalysts. Environ. Sci. Pollut. R 2021, 28, 2522–2548. [Google Scholar] [CrossRef]
  21. Jiang, B.; Zheng, J.T.; Qiu, S.; Wu, M.B.; Zhang, Q.H.; Yan, Z.F.; Xue, Q.Z. Review on electrical discharge plasma technology for wastewater remediation. Chem. Eng. J. 2014, 236, 348–368. [Google Scholar] [CrossRef]
  22. Shang, K.F.; Li, J.; Morent, R. Hybrid electric discharge plasma technologies for water decontamination: A short review. Plasma Sci. Technol. 2019, 21, 5–13. [Google Scholar] [CrossRef]
  23. Sun, Y.; Liu, Y.A.; Li, R.; Li, X.; Chen, H.; Xue, G.; Ognier, S. Reactive Blue Degradation in Aqueous Medium by Fe-Doping TiO2 Catalytic Nonthermal Plasma. IEEE Trans. Plasma Sci. 2015, 43, 3234–3241. [Google Scholar] [CrossRef]
  24. Zhou, R.S.; Zhou, R.W.; Zhang, X.H.; Tu, S.; Yin, Y.W.; Yang, S.Z.; Ye, L.Y. An efficient bio-adsorbent for the removal of dye: Adsorption studies and cold atmospheric plasma regeneration. J. Taiwan Inst. Chem. Eng. 2016, 68, 372–378. [Google Scholar] [CrossRef]
  25. Wang, L.; Sun, N.; Tang, H.H.; Sun, W. A Review on Comprehensive Utilization of Red Mud and Prospect Analysis. Minerals 2019, 9, 362. [Google Scholar] [CrossRef]
  26. Ye, J.; Cong, X.N.; Zhang, P.Y.; Hoffmann, E.; Zeng, G.M.; Liu, Y.; Fang, W.; Wu, Y.; Zhang, H.B. Interaction between phosphate and acid-activated neutralized red mud during adsorption process. Appl. Surf. Sci. 2015, 356, 128–134. [Google Scholar] [CrossRef]
  27. Xu, B.B.; Qi, F.; Zhang, J.Z.; Li, H.N.; Sun, D.Z.; Robert, D.; Chen, Z.L. Cobalt modified red mud catalytic ozonation for the degradation of bezafibrate in water: Catalyst surface properties characterization and reaction mechanism. Chem. Eng. J. 2016, 284, 942–952. [Google Scholar] [CrossRef]
  28. Bhatnagar, A.; Vilar, V.J.P.; Botelho, C.M.S.; Boaventura, R.A.R. A review of the use of red mud as adsorbent for the removal of toxic pollutants from water and wastewater. Environ. Technol. 2011, 32, 231–249. [Google Scholar] [CrossRef]
  29. Busto, R.V.; Goncalves, M.; Coelho, L.H.G. Assessment of the use of red mud as a catalyst for photodegradation of bisphenol A in wastewater treatment. Water Sci. Technol. 2016, 74, 1283–1295. [Google Scholar] [CrossRef]
  30. de Lima, B.A.; de Castro, P.P.R.; Franca, A.B.; Baston, E.P.; Lofrano, R.C.Z.; Samanamud, G.R.L.; Loures, C.C.A.; Naves, L.L.R.; Naves, F.L. Evaluation of the effectiveness of red mud-supported catalysts in combination with ozone and TiO2 in the treatment of solution containing benzene, toluene, and xylene. Environ. Monit. Assess. 2018, 190, 560. [Google Scholar] [CrossRef]
  31. Inamuddin; Asiri, A.M. Sustainable Green Chemical Processes and their Allied Applications; Springer: New York, NY, USA, 2020. [Google Scholar]
  32. Anpilov, A.M.; Barkhudarov, E.M.; Bark, Y.B.; Zadiraka, Y.V.; Christofi, M.; Kozlov, Y.N.; Kossyi, I.A.; Kop’ev, V.A.; Silakov, V.P.; Taktakishvili, M.I.; et al. Electric discharge in water as a source of UV radiation, ozone and hydrogen peroxide. J. Phys. D Appl. Phys. 2001, 34, 993–999. [Google Scholar] [CrossRef]
  33. Cheng, M.M.; Song, W.J.; Ma, W.H.; Chen, C.C.; Zhao, J.C.; Lin, J.; Zhu, H.Y. Catalytic activity of iron species in layered clays for photodegradation of organic dyes under visible irradiation. Appl. Catal. Environ. 2008, 77, 355–363. [Google Scholar] [CrossRef]
  34. Sum, O.S.N.; Feng, J.Y.; Hu, X.J.; Yue, P.L. Photo-assisted fenton mineralization of an azo-dye acid black 1 using a modified laponite clay-based Fe nanocomposite as a heterogeneous catalyst. Top. Catal. 2005, 33, 233–242. [Google Scholar] [CrossRef]
  35. Tarkwa, J.B.; Acayanka, E.; Jiang, B.; Oturan, N.; Kamgang, G.Y.; Laminsi, S.; Oturan, M.A. Highly efficient degradation of azo dye Orange G using laterite soil as catalyst under irradiation of non-thermal plasma. Appl. Catal. Environ. 2019, 246, 211–220. [Google Scholar] [CrossRef]
  36. Reddy, D.R.; Dinesh, G.K.; Anandan, S.; Sivasankar, T. Sonophotocatalytic treatment of Naphthol Blue Black dye and real textile wastewater using synthesized Fe doped TiO2. Chem. Eng. Process. 2016, 99, 10–18. [Google Scholar] [CrossRef]
  37. Wang, Z.J.; Jiang, S.; Liu, K.F. Treatment of Wastewater with High Conductivity by Pulsed Discharge Plasma. Plasma Sci. Technol. 2014, 16, 688–694. [Google Scholar] [CrossRef]
  38. Liu, X.H.; Cheng, C.; Xu, Z.M.; Hu, S.H.; Shen, J.; Lan, Y.; Chu, P.K. Degradation of tetracycline in water by gas-liquid plasma in conjunction with rGO-TiO2 nanocomposite. Plasma Sci. Technol. 2021, 23, 11. [Google Scholar] [CrossRef]
  39. Li, J.; Sato, M.; Ohshima, T. Degradation of phenol in water using a gas-liquid phase pulsed discharge plasma reactor. Thin Solid Films 2007, 515, 4283–4288. [Google Scholar] [CrossRef]
  40. Liu, Y.; Yang, L.; Yang, G.; Zhang, Y.Z.; Zhang, X.H.; Deng, S.H. Degradation of Dye Wastewater by Pulsed High-Voltage Discharge Combined with Spent Tea Leaves. Plasma Sci. Technol. 2014, 16, 1135–1140. [Google Scholar] [CrossRef]
  41. Guo, H.; Jiang, N.; Li, J.; Wu, Y. Synergistic degradation of bisphenol A by pulsed discharge plasma with granular activated carbon: Effect of operating parameters, synergistic mechanism and possible degradation pathway. Vacuum 2018, 156, 402–410. [Google Scholar] [CrossRef]
  42. Kulkarni, M.R.; Revanth, T.; Acharya, A.; Bhat, P. Removal of Crystal Violet dye from aqueous solution using water hyacinth: Equilibrium, kinetics and thermodynamics study. Resour. Effic. Technol. 2017, 3, 71–77. [Google Scholar] [CrossRef]
  43. Huang, Y.R.; Kong, Y.; Li, H.Z.; Wei, X.M. Removal of crystal violet by ultraviolet/persulfate: Effects, kinetics and degradation pathways. Environ. Technol. Innov. 2020, 18, 100780. [Google Scholar] [CrossRef]
  44. Saini, B.; Dey, A. Synthesis and characterization of copolymer adsorbent for crystal violet dye removal from water. Mater. Today Proc. 2022, 61, 342–350. [Google Scholar] [CrossRef]
  45. Oloo, C.M.; Onyari, J.M.; Wanyonyi, W.C.; Wabomba, J.N.; Muinde, V.M. Adsorptive removal of hazardous crystal violet dye form aqueous solution using Rhizophora mucronata stem-barks: Equilibrium and kinetics studies. Environ. Toxicol. Chem. 2020, 2, 64–72. [Google Scholar] [CrossRef]
  46. Zhang, G.Y.; Sun, Y.B.; Zhang, C.X.; Yu, Z.Q. Decomposition of acetaminophen in water by a gas phase dielectric barrier discharge plasma combined with TiO2-rGO nanocomposite: Mechanism and degradation pathway. J. Hazard. Mater. 2017, 323, 719–729. [Google Scholar] [CrossRef] [PubMed]
  47. Wang, T.C.; Qu, G.Z.; Ren, J.Y.; Yan, Q.H.; Sun, Q.H.; Liang, D.L.; Hu, S.B. Evaluation of the potentials of humic acid removal in water by gas phase surface discharge plasma. Water Res. 2016, 89, 28–38. [Google Scholar] [CrossRef] [PubMed]
  48. Huang, F.M.; Chen, L.; Wang, H.L.; Yan, Z.C. Analysis of the degradation mechanism of methylene blue by atmospheric pressure dielectric barrier discharge plasma. Chem. Eng. J. 2010, 162, 250–256. [Google Scholar] [CrossRef]
  49. Reddy, P.M.K.; Raju, B.R.; Karuppiah, J.; Reddy, E.L.; Subrahmanyam, C. Degradation and mineralization of methylene blue by dielectric barrier discharge non-thermal plasma reactor. Chem. Eng. J. 2013, 217, 41–47. [Google Scholar] [CrossRef]
  50. Locke, B.R.; Sato, M.; Sunka, P.; Hoffmann, M.R.; Chang, J.S. Electrohydraulic discharge and nonthermal plasma for water treatment. Ind. Eng. Chem. Res. 2006, 45, 882–905. [Google Scholar] [CrossRef]
  51. Joshi, A.A.; Locke, B.R.; Arce, P.; Finney, W.C. Formation of Hydroxyl Radicals, Hydrogen-Peroxide and Aqueous Electrons by Pulsed Streamer Corona Discharge in Aqueous-Solution. J. Hazard. Mater. 1995, 41, 3–30. [Google Scholar] [CrossRef]
  52. Tavakoli-Azar, T.; Mahjoub, A.; Sadjadi, M.S.; Ghaznavi-Ghoushchi, M.B. Enhanced photocatalytic activity of ZrO2-CdZrO3-s nanocomposites for degradation of Crystal Violet dye under sunlight. J. Photochem. Photobiol. A 2022, 426, 113746. [Google Scholar] [CrossRef]
  53. Fahoul, Y.; Tanji, K.; Zouheir, M.; El Mrabet, I.; Naciri, Y.; Hsini, A.; Nahali, L.; Kherbeche, A. Novel River Sediment@ZnO-Co nanocomposite for photocatalytic degradation and COD reduction of crystal violet under visible light. J. Mol. Struct. 2022, 1253, 132298. [Google Scholar] [CrossRef]
  54. Berardinelli, A.; Hamrouni, A.; Dirè, S.; Ceccato, R.; Camera-Roda, G.; Ragni, L.; Palmisano, L.; Parrino, F. Features and application of coupled cold plasma and photocatalysis processes for decontamination of water. Chemosphere 2021, 262, 128336. [Google Scholar] [CrossRef] [PubMed]
  55. Ju, S.H.; Lu, S.D.; Peng, J.H.; Zhang, L.B.; Srinivasakannan, C.; Guo, S.H.; Li, W. Removal of cadmium from aqueous solutions using red mud granulated with cement. T. Nonferr. Metal. Soc. 2012, 22, 3140–3146. [Google Scholar] [CrossRef]
  56. Wang, H.J.; Guo, H.; Liu, Y.J.; Yi, C.W. Regeneration of Acid Orange 7 Exhausted Granular Activated Carbon Using Pulsed Discharge Plasmas. Plasma Sci. Technol. 2015, 17, 881–886. [Google Scholar] [CrossRef]
  57. Guo, T.F.; Yang, H.Q.; Liu, Q.Y.; Gu, H.N.; Wang, N.; Yu, W.B.; Dai, Y. Adsorptive removal of phosphate from aqueous solutions using different types of red mud. Water Sci. Technol. 2018, 2017, 570–577. [Google Scholar] [CrossRef]
  58. Romero-Ibarra, I.C.; Ortiz-Landeros, J.; Pfeiffer, H. Microstructural and CO2 chemisorption analyses of Li4SiO4: Effect of surface modification by the ball milling process. Thermochim. Acta 2013, 567, 118–124. [Google Scholar] [CrossRef]
  59. Tsamo, C.; Djonga, P.N.D.; Dikdim, J.M.D.; Kamga, R. Kinetic and Equilibrium Studies of Cr(VI), Cu(II) and Pb(II) Removal from Aqueous Solution Using Red Mud, a Low-Cost Adsorbent. Arab. J. Sci. Eng. 2018, 43, 2353–2368. [Google Scholar] [CrossRef]
  60. Li, X.; Ji, M.; Nghiem, L.D.; Zhao, Y.; Liu, D.; Yang, Y.; Wang, Q.; Trinh, Q.T.; Vo, D.V.N.; Pham, V.Q.; et al. A novel red mud adsorbent for phosphorus and diclofenac removal from wastewater. J. Mol. Liq. 2020, 303, 112286. [Google Scholar] [CrossRef]
  61. Sahu, R.C.; Patel, R.; Ray, B.C. Utilization of activated CO2-neutralized red mud for removal of arsenate from aqueous solutions. J. Hazard. Mater. 2010, 179, 1007–1013. [Google Scholar] [CrossRef]
  62. Castaldi, P.; Silvetti, M.; Santona, L.; Enzo, S.; Melis, P. XRD, FTIR, and thermal analysis of bauxite ore-processing waste (red mud) exchanged with heavy metals. Clays Clay Miner. 2008, 56, 461–469. [Google Scholar] [CrossRef]
  63. Kazak, O.; Eker, Y.R.; Akin, I.; Bingol, H.; Tor, A. Green preparation of a novel red mud@carbon composite and its application for adsorption of 2,4-dichlorophenoxyacetic acid from aqueous solution. Environ. Sci. Pollut. Res. 2017, 24, 23057–23068. [Google Scholar] [CrossRef] [PubMed]
  64. Qi, F.; Li, H.N.; Xu, B.B.; Sun, D.Z. Heating Activated Red Mud Catalytic Ozonation for Degradation Nitrobenzene from Aqueous Solution: Performance and Influence of Preparation Factors. J. Nanosci. Nanotechnol. 2014, 14, 6984–6990. [Google Scholar] [CrossRef] [PubMed]
  65. Xu, B.B.; Qi, F.; Sun, D.Z.; Chen, Z.L.; Robert, D. Cerium doped red mud catalytic ozonation for bezafibrate degradation in wastewater: Efficiency, intermediates, and toxicity. Chemosphere 2016, 146, 22–31. [Google Scholar] [CrossRef]
  66. Fan, J.W.; Wu, H.X.; Liu, R.Y.; Meng, L.Y.; Fang, Z.; Liu, F.; Xu, Y.H. Non-thermal plasma combined with zeolites to remove ammonia nitrogen from wastewater. J. Hazard. Mater. 2020, 401, 123627. [Google Scholar] [CrossRef]
  67. Wu, H.X.; Fan, J.W.; Sun, Y.J.; Liu, R.Y.; Jin, J.C.; Li, P.C. Removal of ammonia nitrogen and phenol by pulsed discharge plasma combined with modified zeolite catalyst. J. Environ. Manag. 2021, 299, 113590. [Google Scholar] [CrossRef]
  68. Sarwar, Z.; Tichonovas, M.; Krugly, E.; Masione, G.; Abromaitis, V.; Martuzevicius, D. Graphene oxide loaded fibrous matrixes of polyether block amide (PEBA) elastomer as an adsorbent for removal of cationic dye from wastewater. J. Environ. Manag. 2021, 298, 113466. [Google Scholar] [CrossRef]
  69. Ahmad, R.; Mirza, A. Synthesis of Guar gum/bentonite a novel bionanocomposite: Isotherms, kinetics and thermodynamic studies for the removal of Pb (II) and crystal violet dye. J. Mol. Liq. 2018, 249, 805–814. [Google Scholar] [CrossRef]
  70. Aziz, K.H.H.; Miessner, H.; Mueller, S.; Kalass, D.; Moeller, D.; Khorshid, I.; Rashid, M.A.M. Degradation of pharmaceutical diclofenac and ibuprofen in aqueous solution, a direct comparison of ozonation, photocatalysis, and non-thermal plasma. Chem. Eng. J. 2017, 313, 1033–1041. [Google Scholar] [CrossRef]
Figure 1. The removal efficiency of CV with treatment time in the three processes. (Initial CV concentration = 25 mg/L, discharge voltage = 22 kV, frequency = 50 Hz, aeration O2 = 3.0 L/min, red mud dosage = 2.0 g, conductivity = 26 μs/cm).
Catalysts 12 00908 g001
Figure 2. Energy Yields G50 of plasma in the degradation of CV. (Initial CV concentration = 25 mg/L, discharge voltage = 22 kV, frequency = 50 Hz, aeration O2 = 3.0 L/min, red mud dosage = 2.0 g, conductivity = 26 μs/cm).
Catalysts 12 00908 g002
Figure 3. Changes in TOC after 30 min of CV treated by three methods. (Initial CV concentration = 25 mg/L, discharge voltage = 22 kV, frequency = 50 Hz, aeration O2 = 3.0 L/min, red mud dosage = 2.0 g, conductivity = 26 μs/cm).
Catalysts 12 00908 g003
Figure 4. Effect of red mud dosage on CV removal. (Initial CV concentration = 25 mg/L, discharge voltage = 22 kV, frequency = 50 Hz, aeration O2 = 3.0 L/min, conductivity = 26 μs/cm).
Catalysts 12 00908 g004
Figure 5. Effect of discharge voltage on the CV removal. (Initial CV concentration = 25 mg/L, frequency = 50 Hz, aeration O2 = 3.0 L/min, red mud dosage = 2.0 g, conductivity = 26 μs/cm).
Catalysts 12 00908 g005
Figure 6. Effect of initial pH on the CV removal. The insert of Figure 4 displays the CV removal by plasma alone (initial CV concentration = 25 mg/L, discharge voltage = 22 kV, frequency = 50 Hz, aeration O2 = 3.0 L/min, red mud dosage = 2.0 g, conductivity = 70 μs/cm).
Catalysts 12 00908 g006
Figure 7. Effect of initial CV solution concentration on the degradation of CV. (Discharge voltage = 22 kV, frequency = 50 Hz, aeration O2 = 3.0 L/min, red mud dosage = 2.0 g, conductivity = 26 μs/cm).
Catalysts 12 00908 g007
Figure 8. Free radical quenching experiments. (Initial CV concentration = 25 mg/L, discharge voltage = 22 kV, frequency = 50 Hz, aeration O2 = 3.0 L/min, red mud dosage = 2.0 g, conductivity = 26 μs/cm).
Catalysts 12 00908 g008
Figure 9. Red mud recycling. (Initial CV concentration = 25 mg/L, discharge voltage = 22 kV, frequency = 50 Hz, aeration O2 = 3.0 L/min, red mud dosage = 2.0 g, conductivity = 26 μs/cm).
Catalysts 12 00908 g009
Figure 10. SEM images of the red mud: (a) Not used, (b) Used once in a combined system. (Initial CV concentration = 25 mg/L, discharge voltage = 22 kV, frequency = 50 Hz, aeration O2 = 3.0 L/min, red mud dosage = 2.0 g, conductivity = 26 μs/cm).
Catalysts 12 00908 g010
Figure 11. Red mud characterization: (a) XRD, (b) FT-IR, (c) N2 adsorption/desorption isotherms, (d) pore size distributions.
Catalysts 12 00908 g011
Figure 12. Schematic diagram of the experimental setup.
Catalysts 12 00908 g012
Table 1. Fe and Al content in the solution at the end of the reaction.
Red Mud SampleFe Concentration in Solution C1 (mg/L)Al Concentration in Solution C2 (mg/L)
not recycled3.3235.272
first cycle3.1173.172
second cycle2.7401.886
third cycle1.3361.651
Table 2. BET data of the red mud before and after use in the combined system.
SampleBET Surface Area (m2/g)Hole Wall Area (m2/g)Pore Volume (cm3/g)
Red mud before use20.93616.6210.066827
Red mud after use15.37214.1010.06397
Publisher’s Note: MDPI stays neutral with regard to jurisdictional claims in published maps and institutional affiliations.

