
Influence of the Thermal Processing and Doping on LaMnO3 and La0.8A0.2MnO3 (A = Ca, Sr, Ba) Perovskites Prepared by Auto-Combustion for Removal of VOCs

 , , ,
, , ,  ,
,  and
and
Abstract
1. Introduction
2. Results
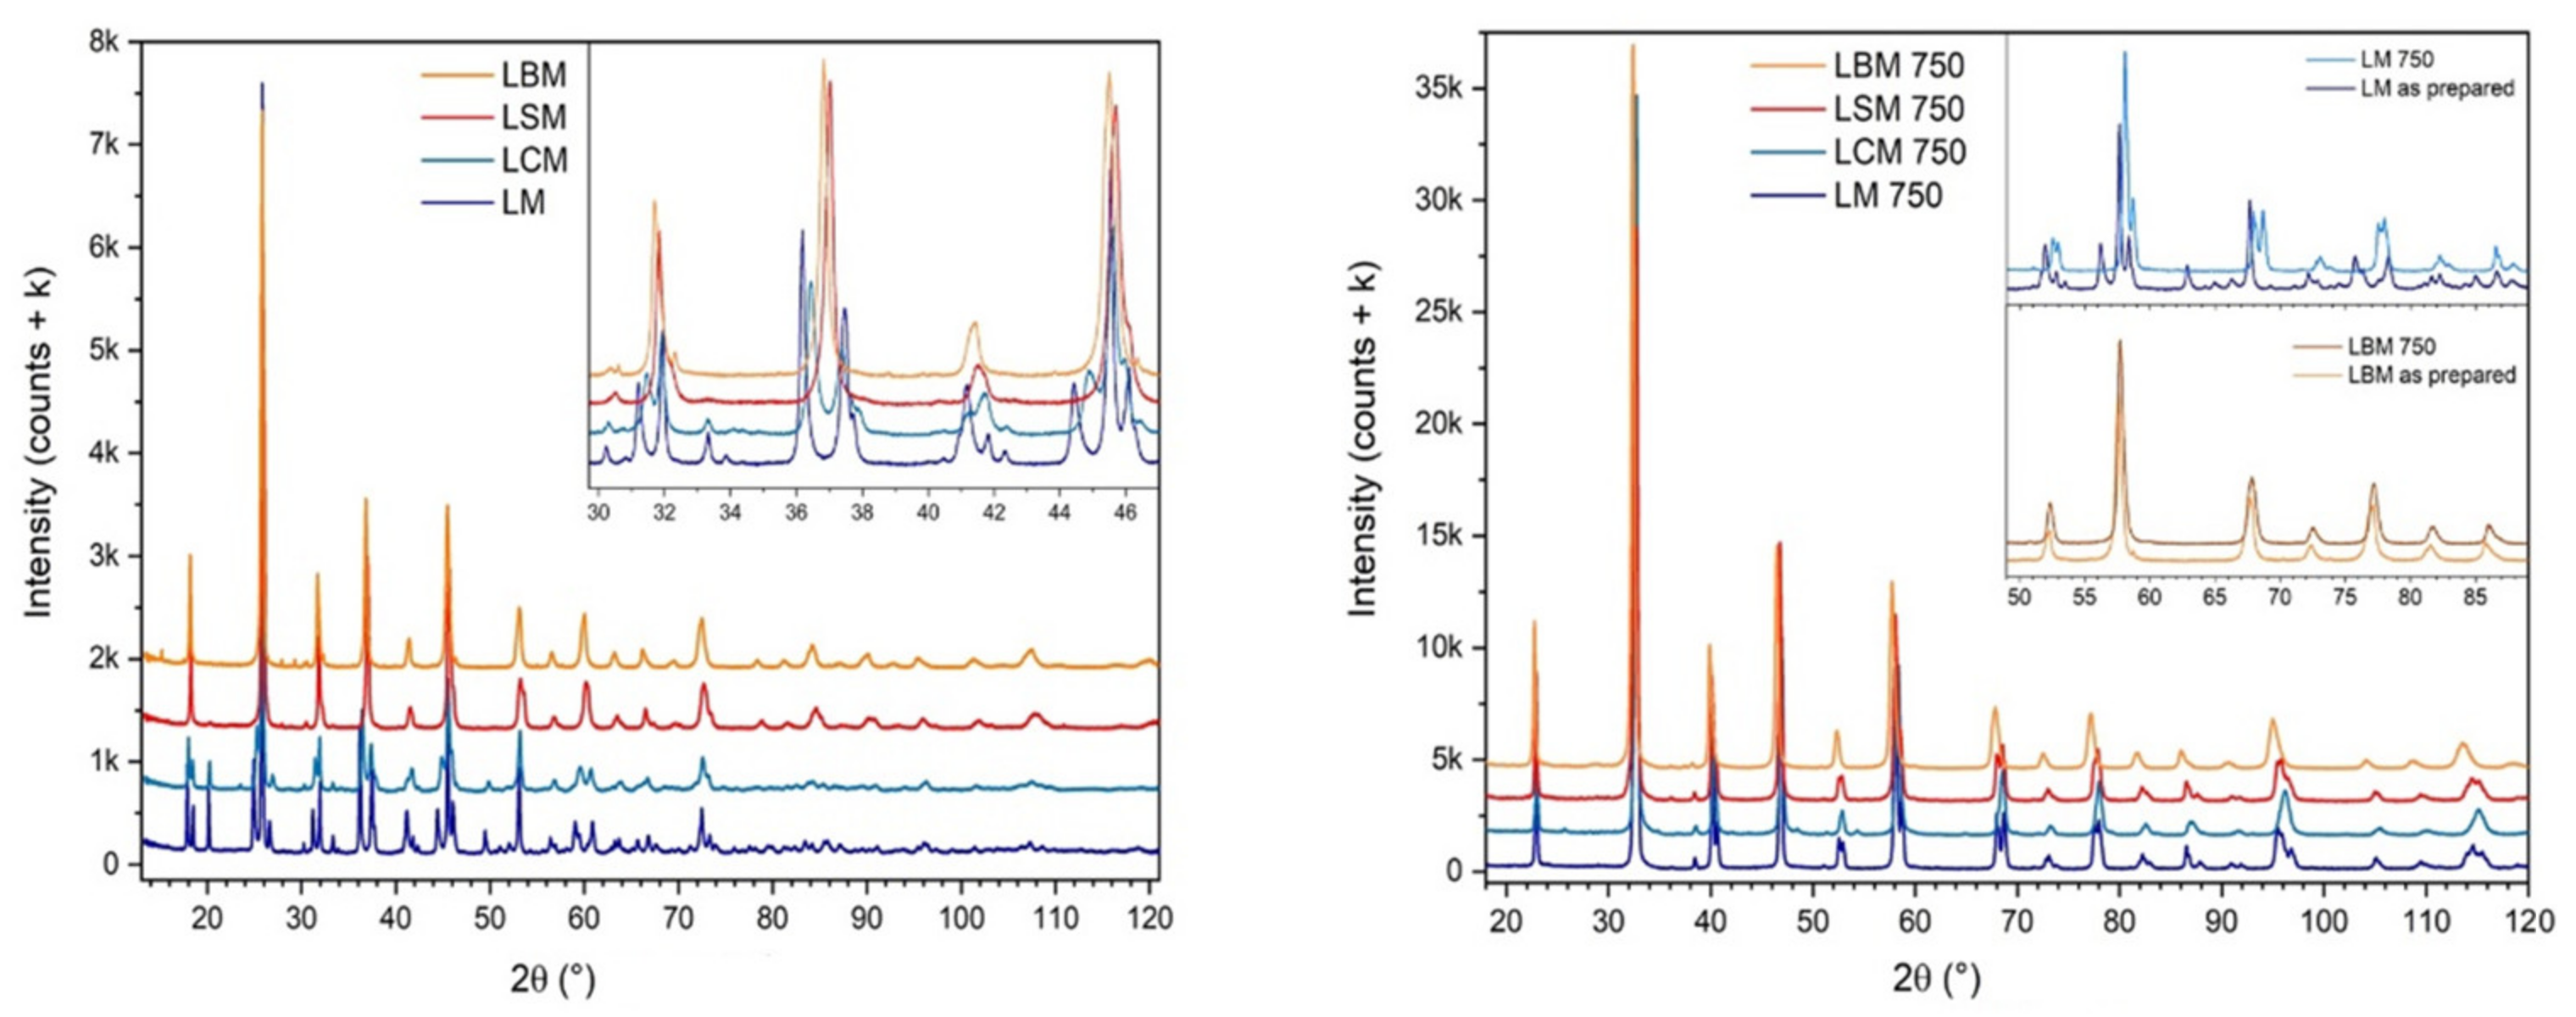
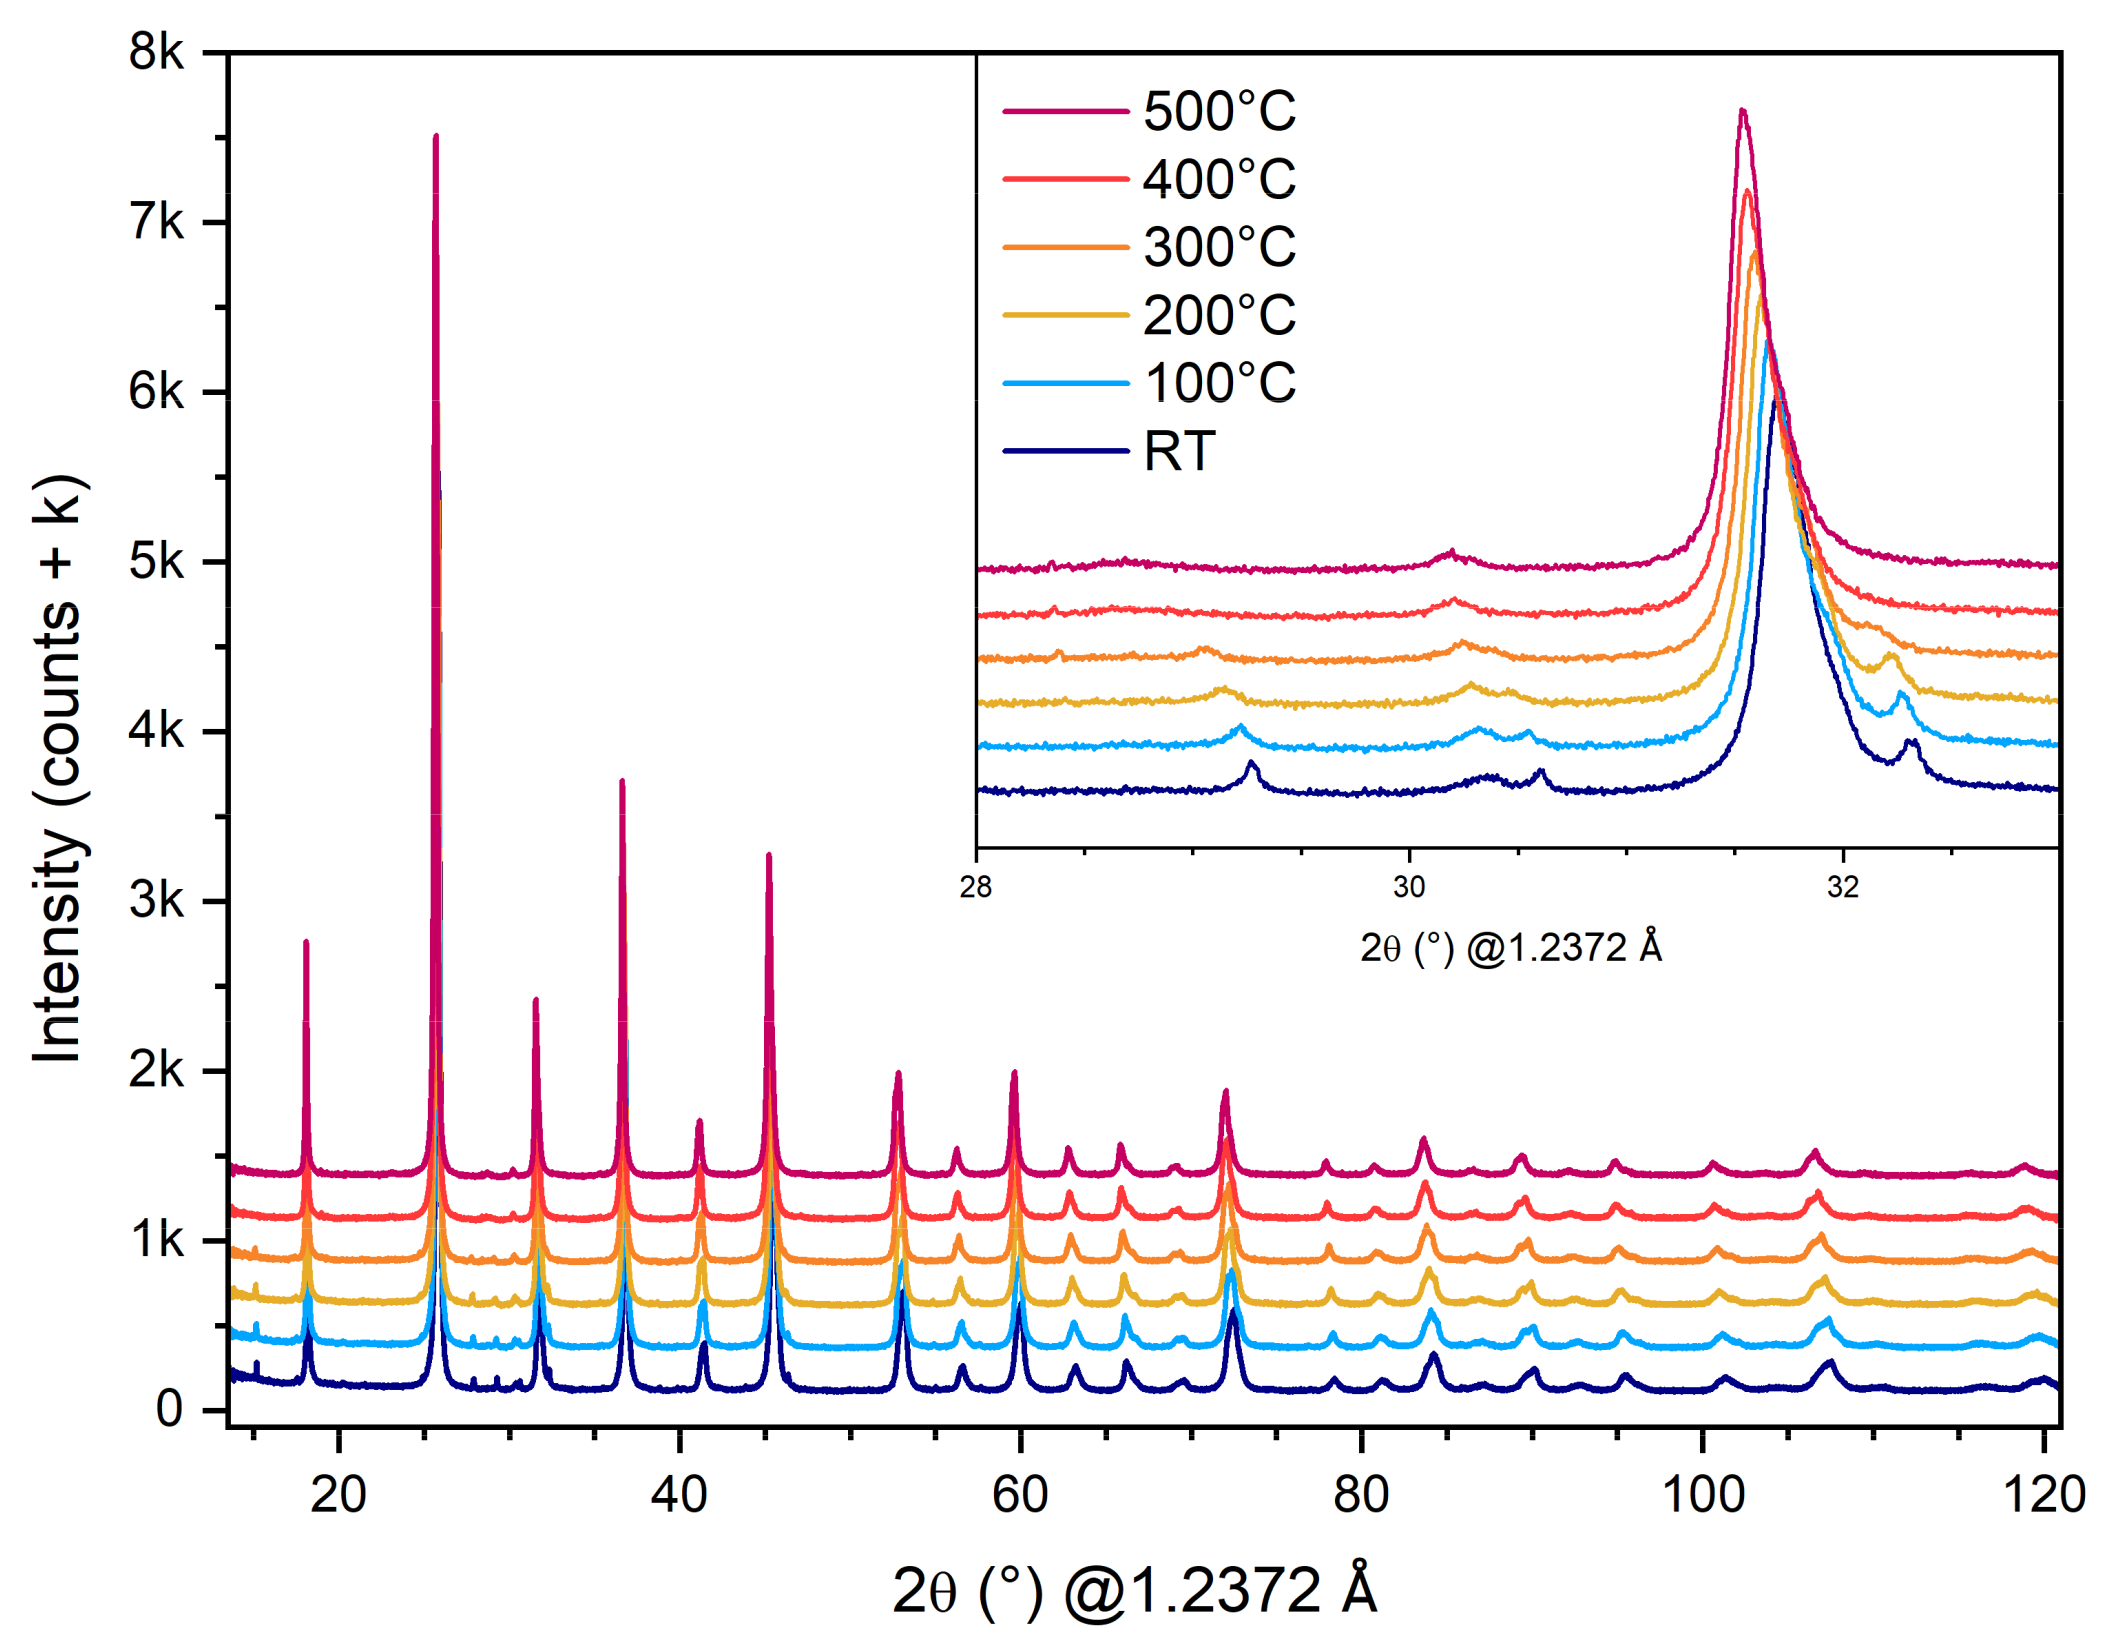
2.1. Structural Characterization
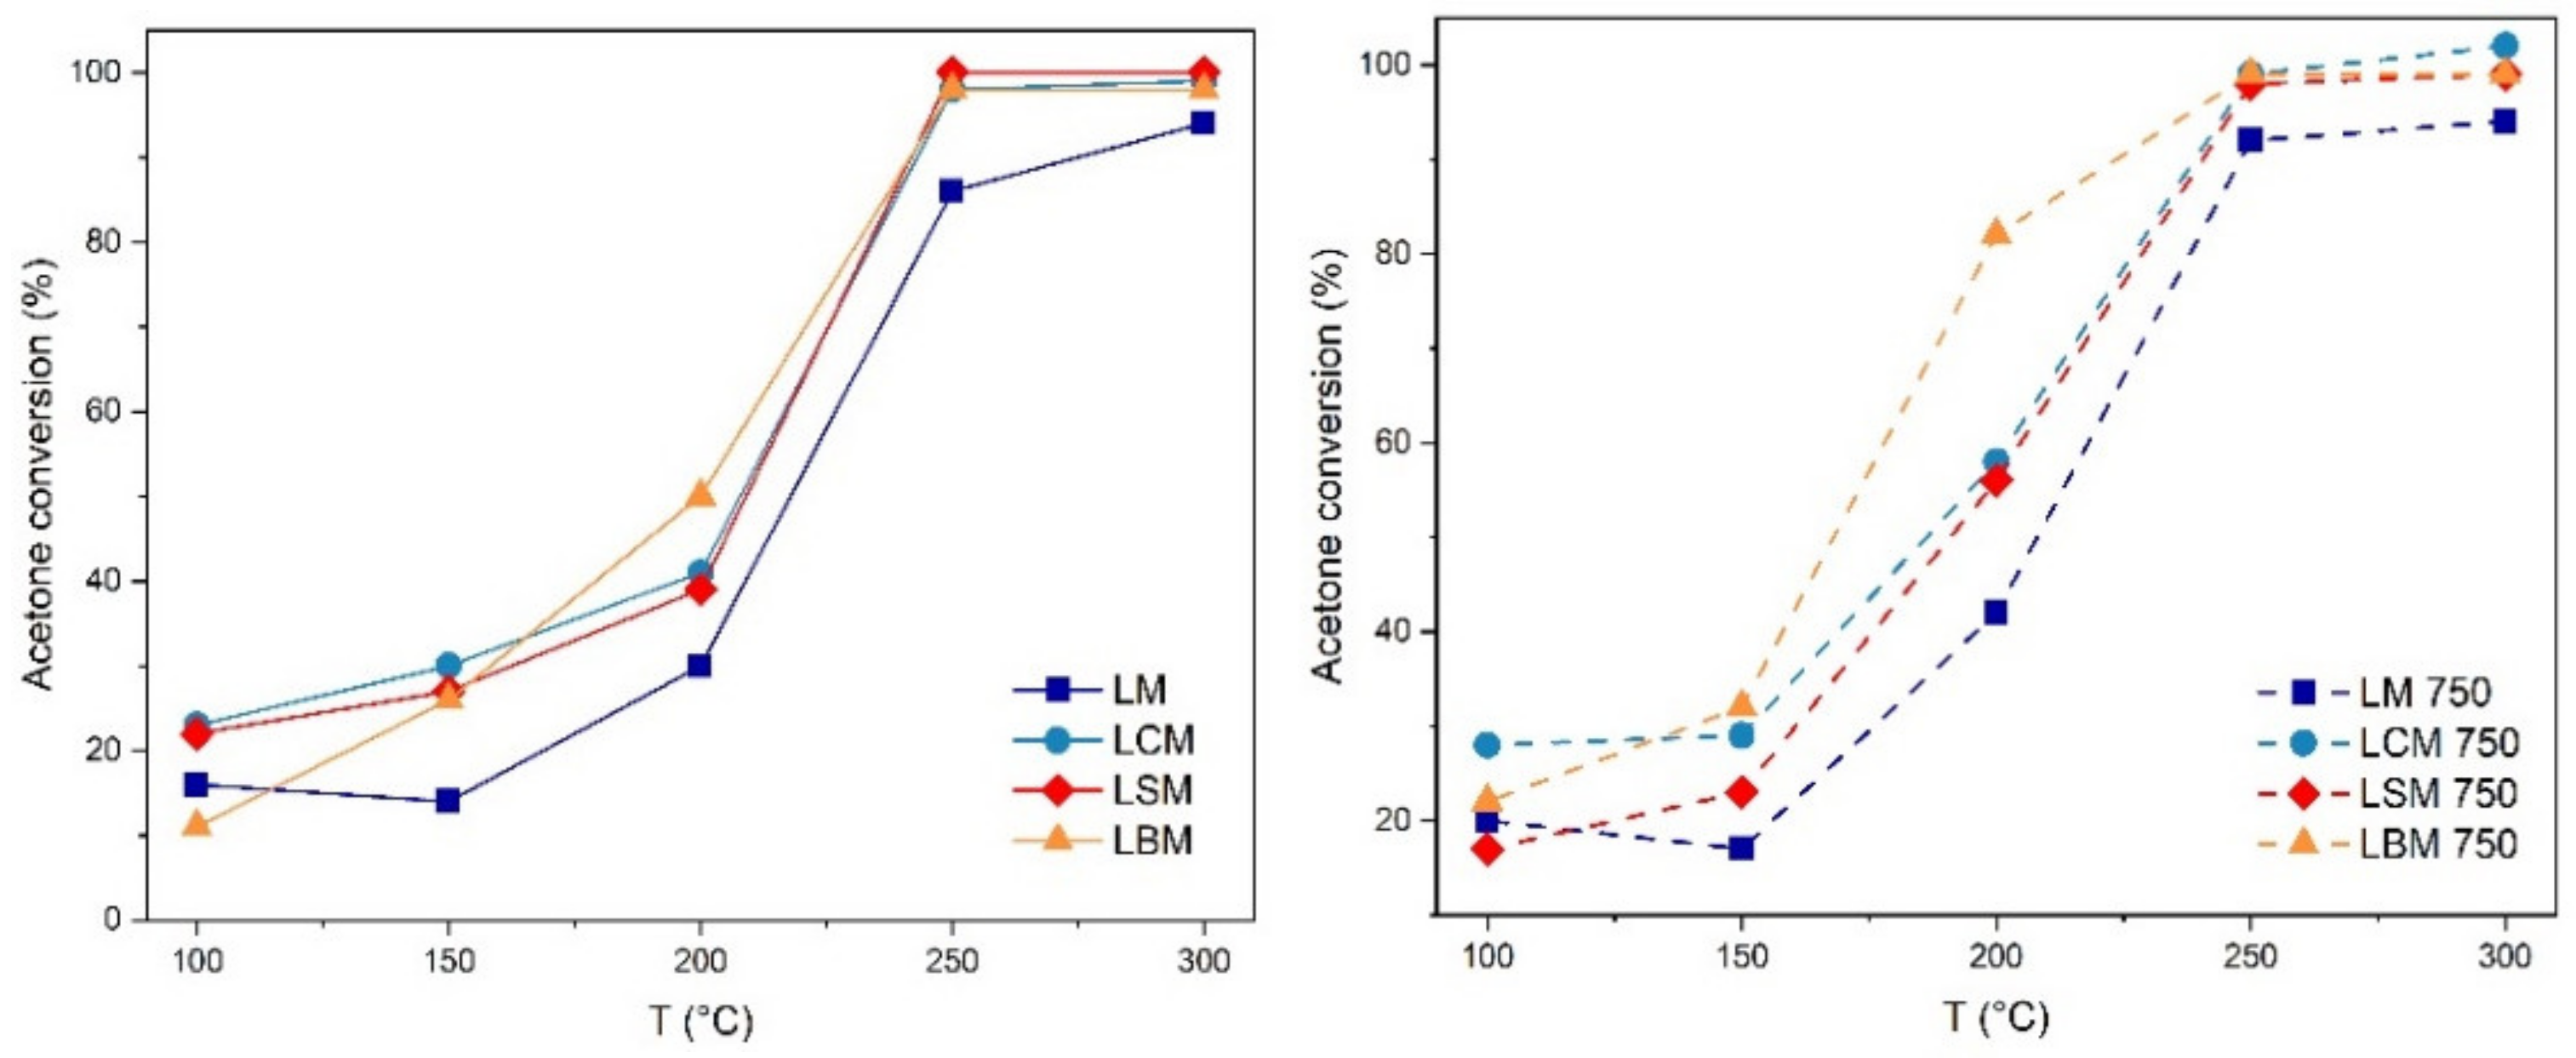
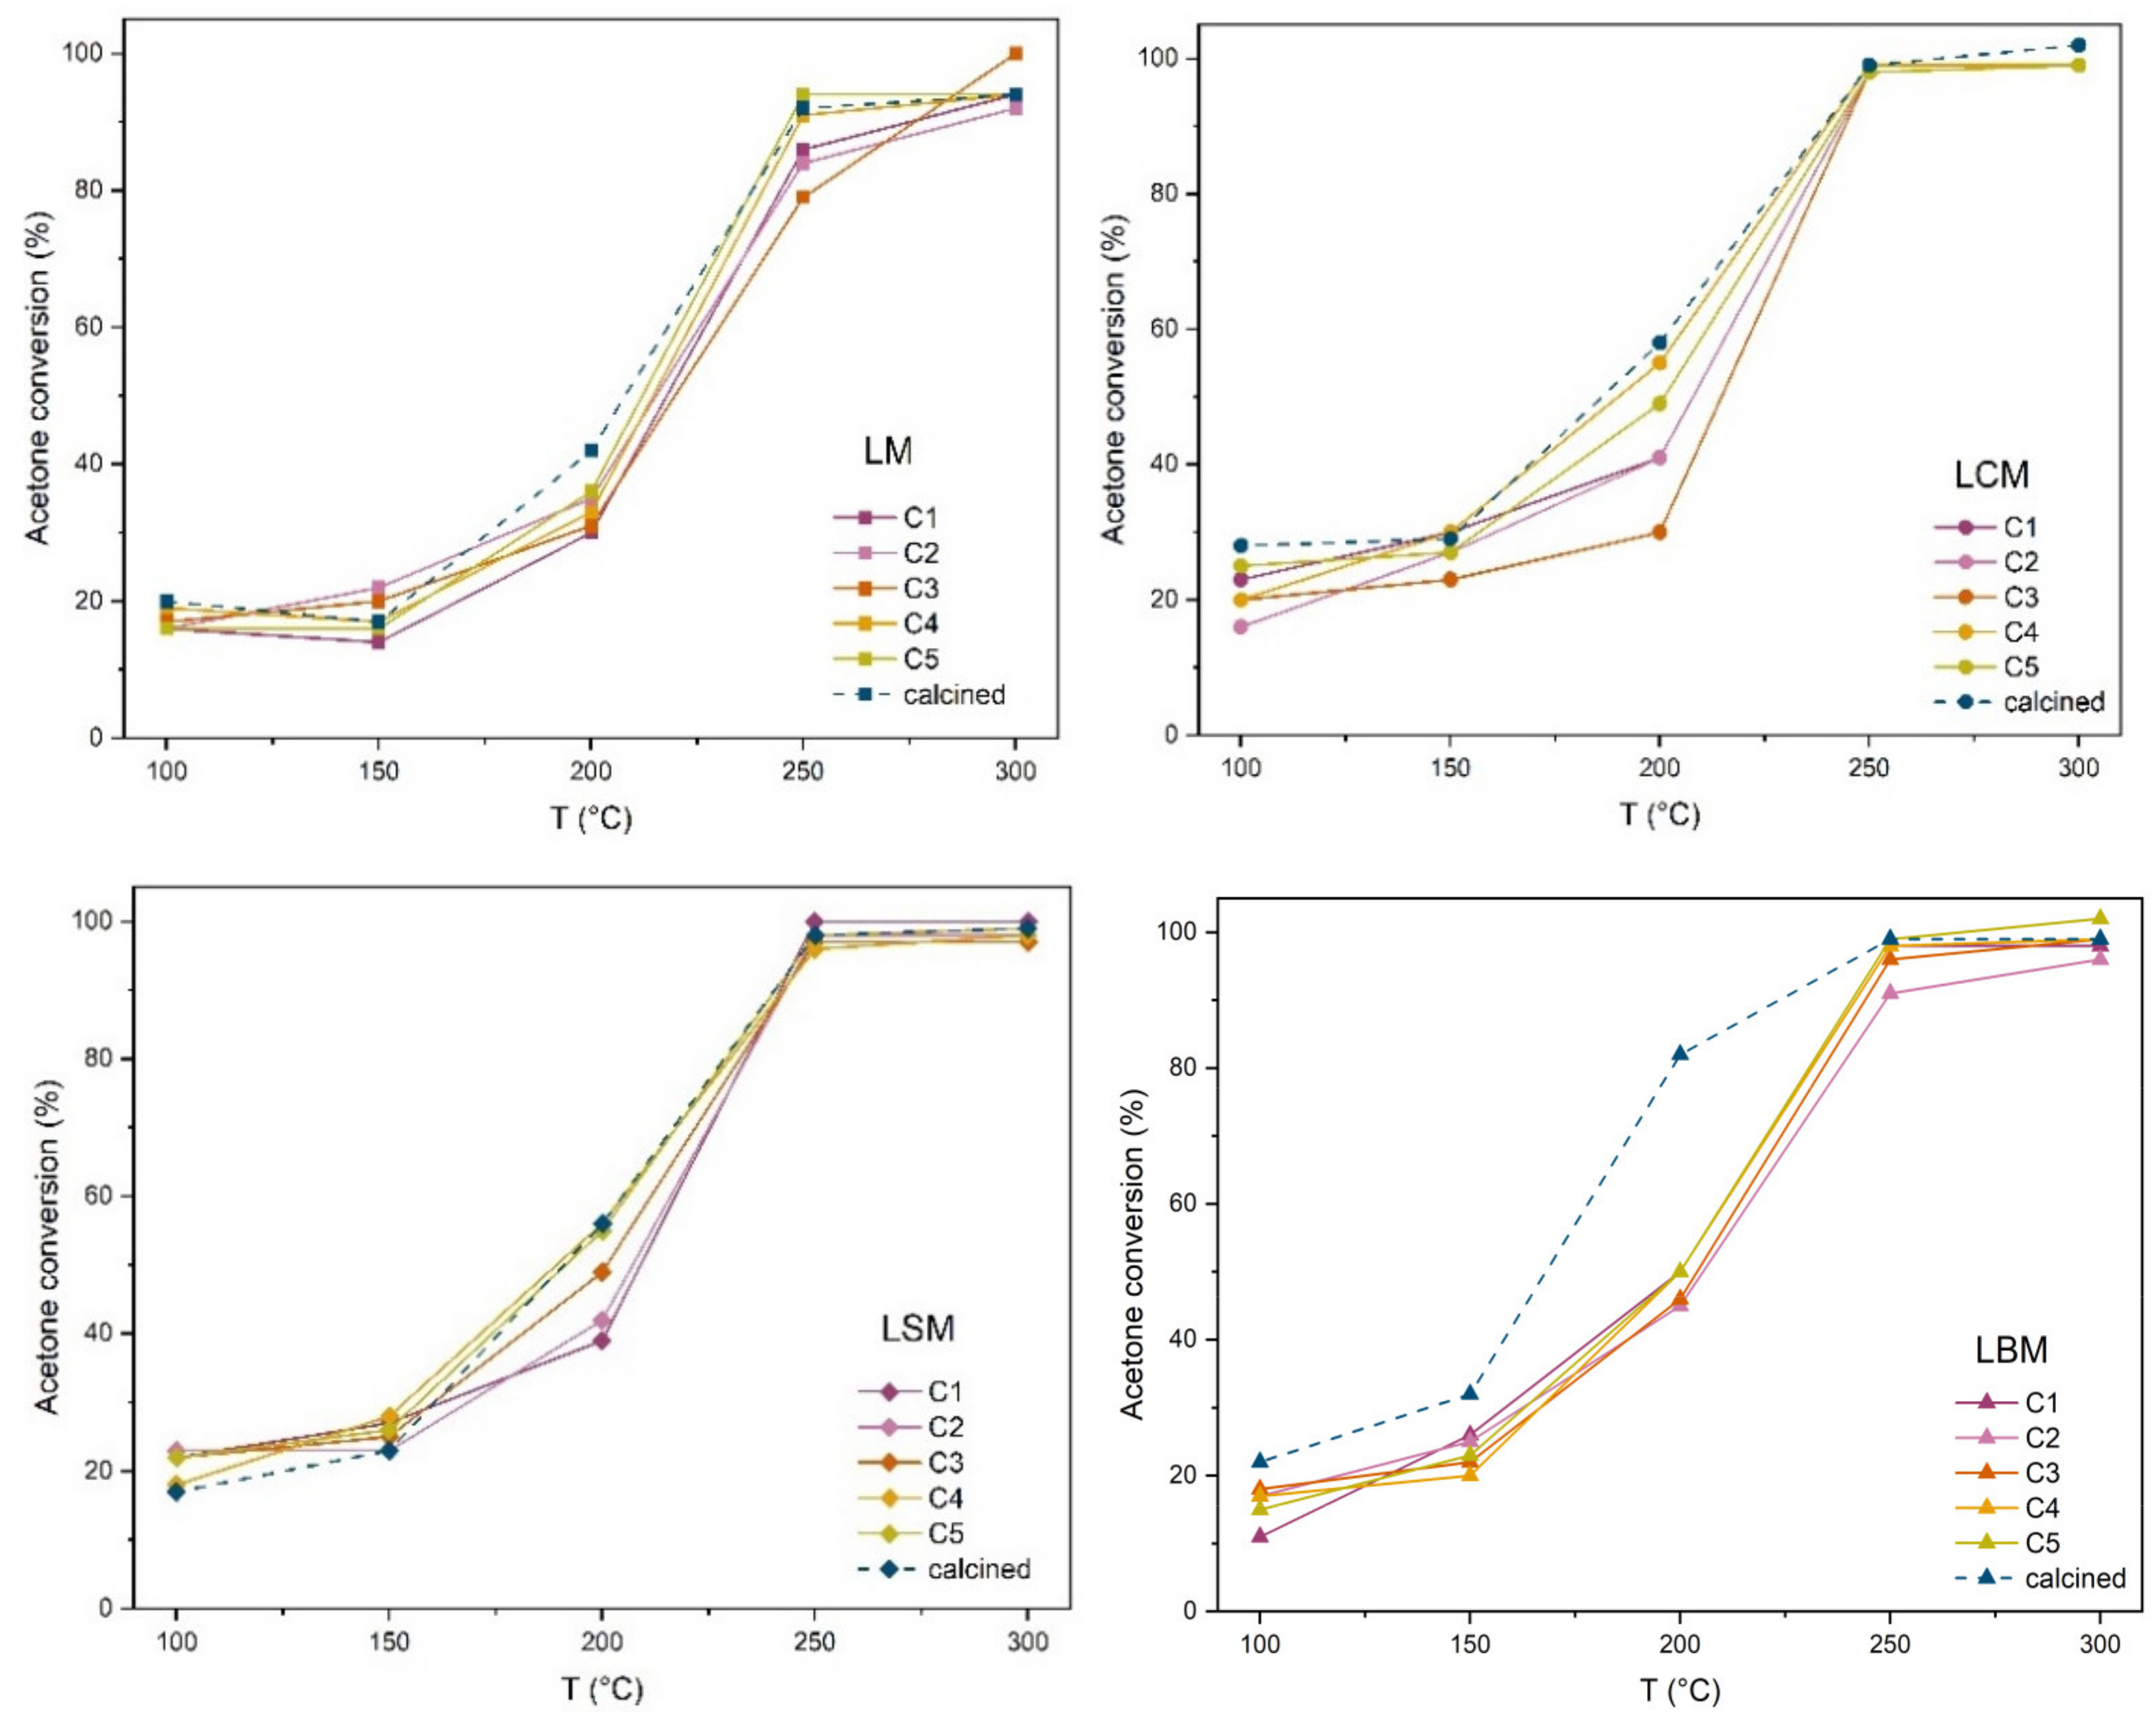
2.2. Catalytic Performance
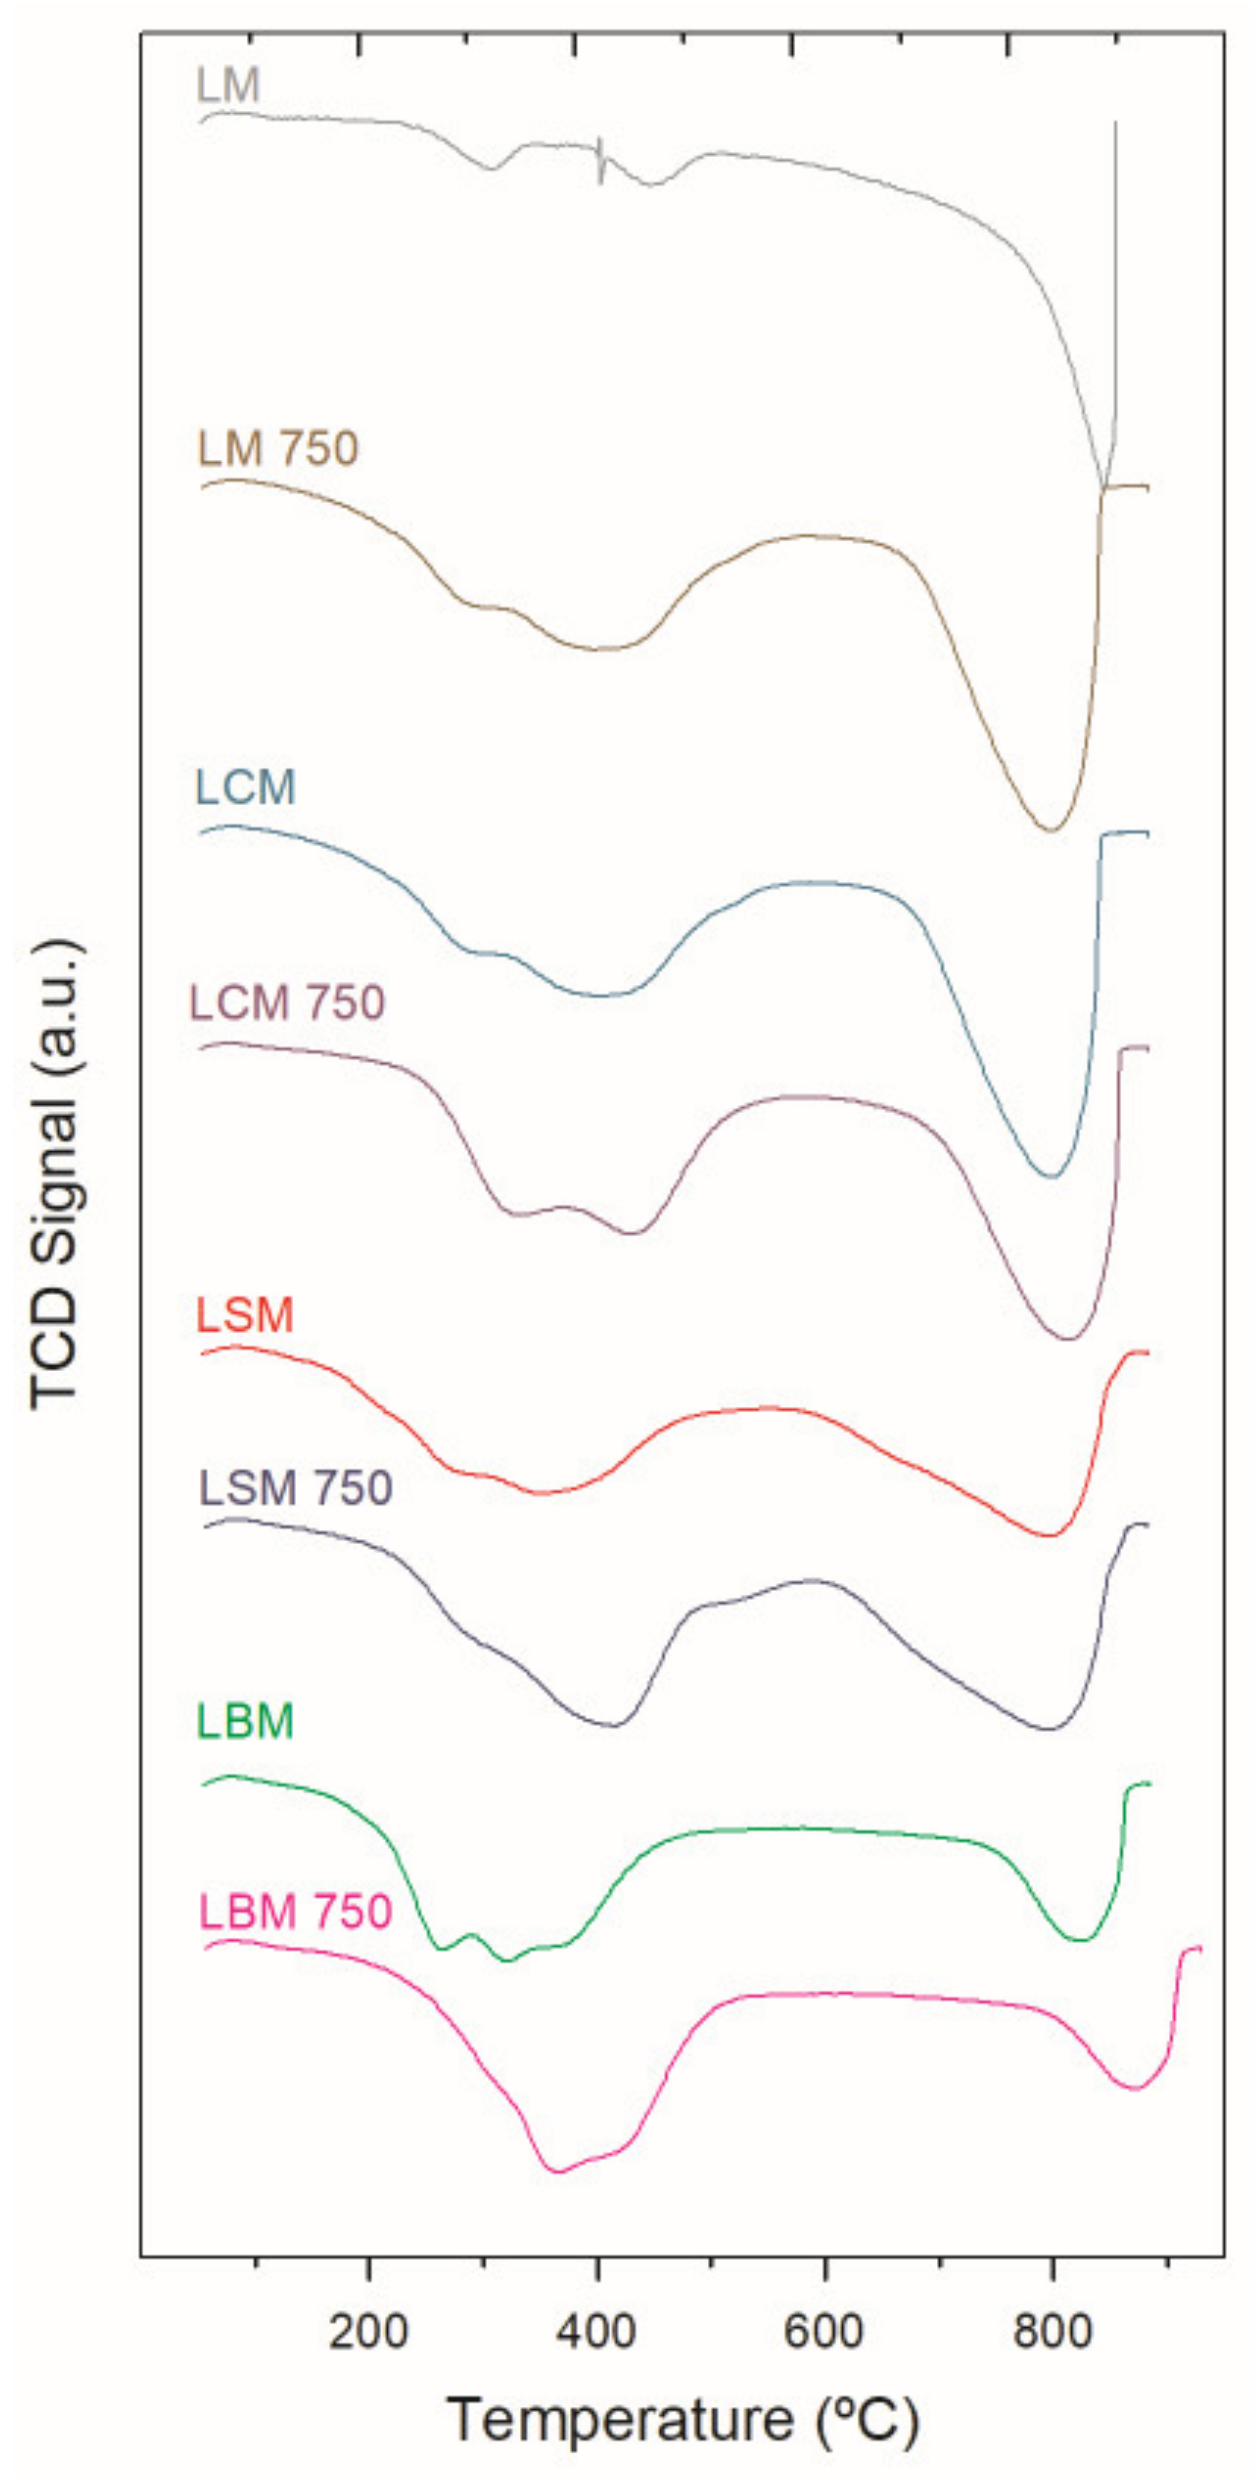
2.3. TPR
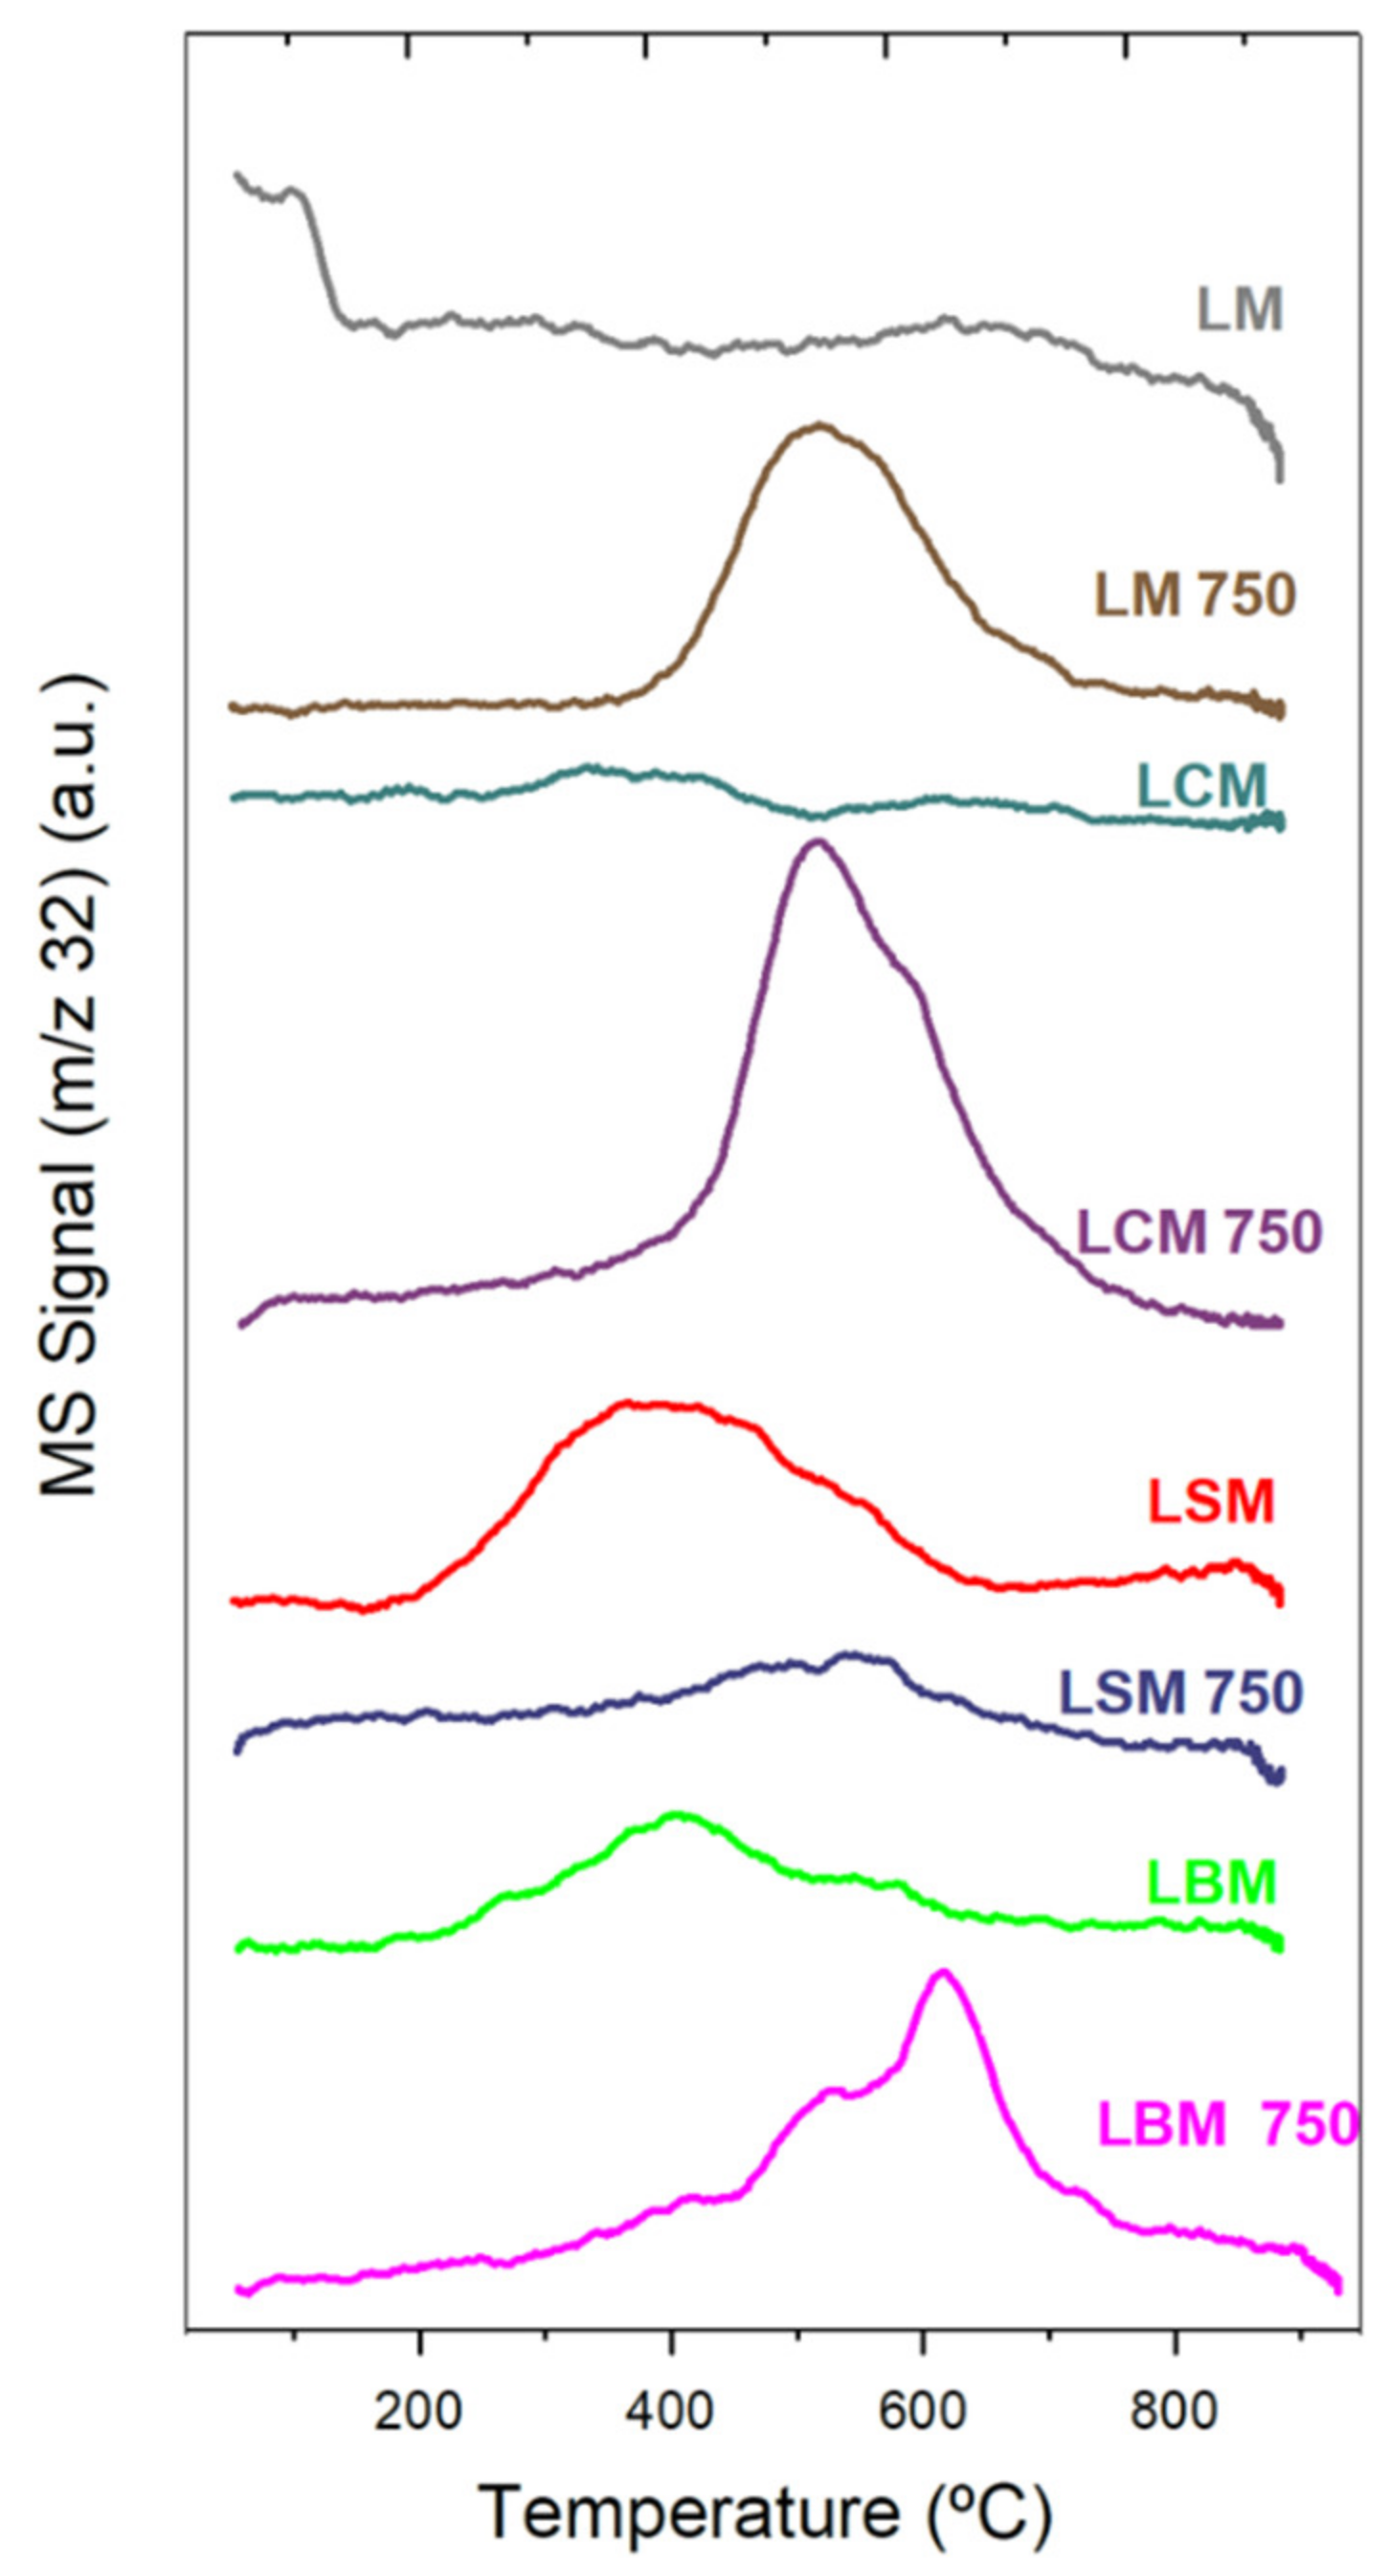
2.4. O2-TPD
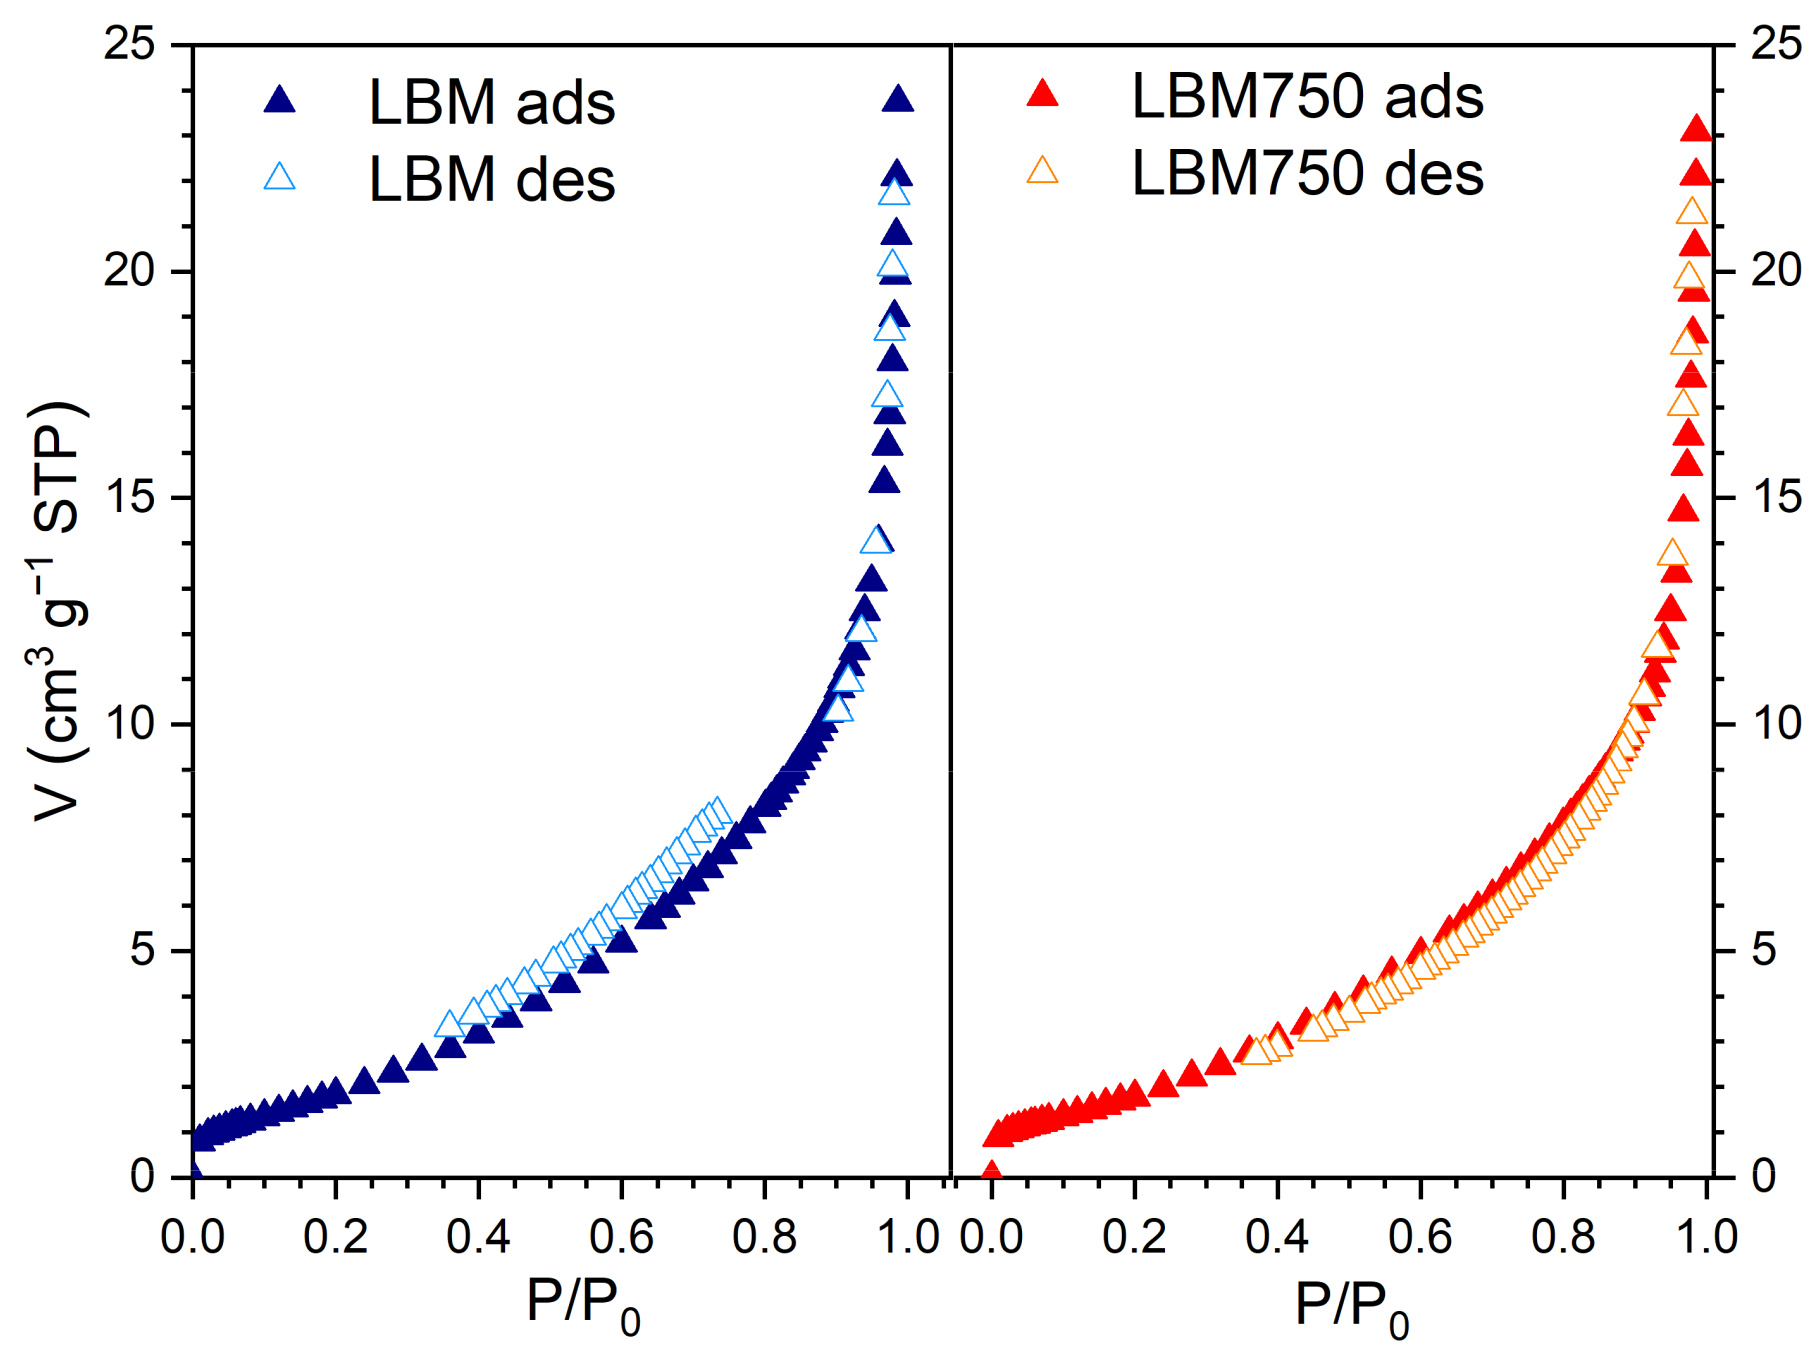
2.5. Textural Properties by Means of N2 Physisorption
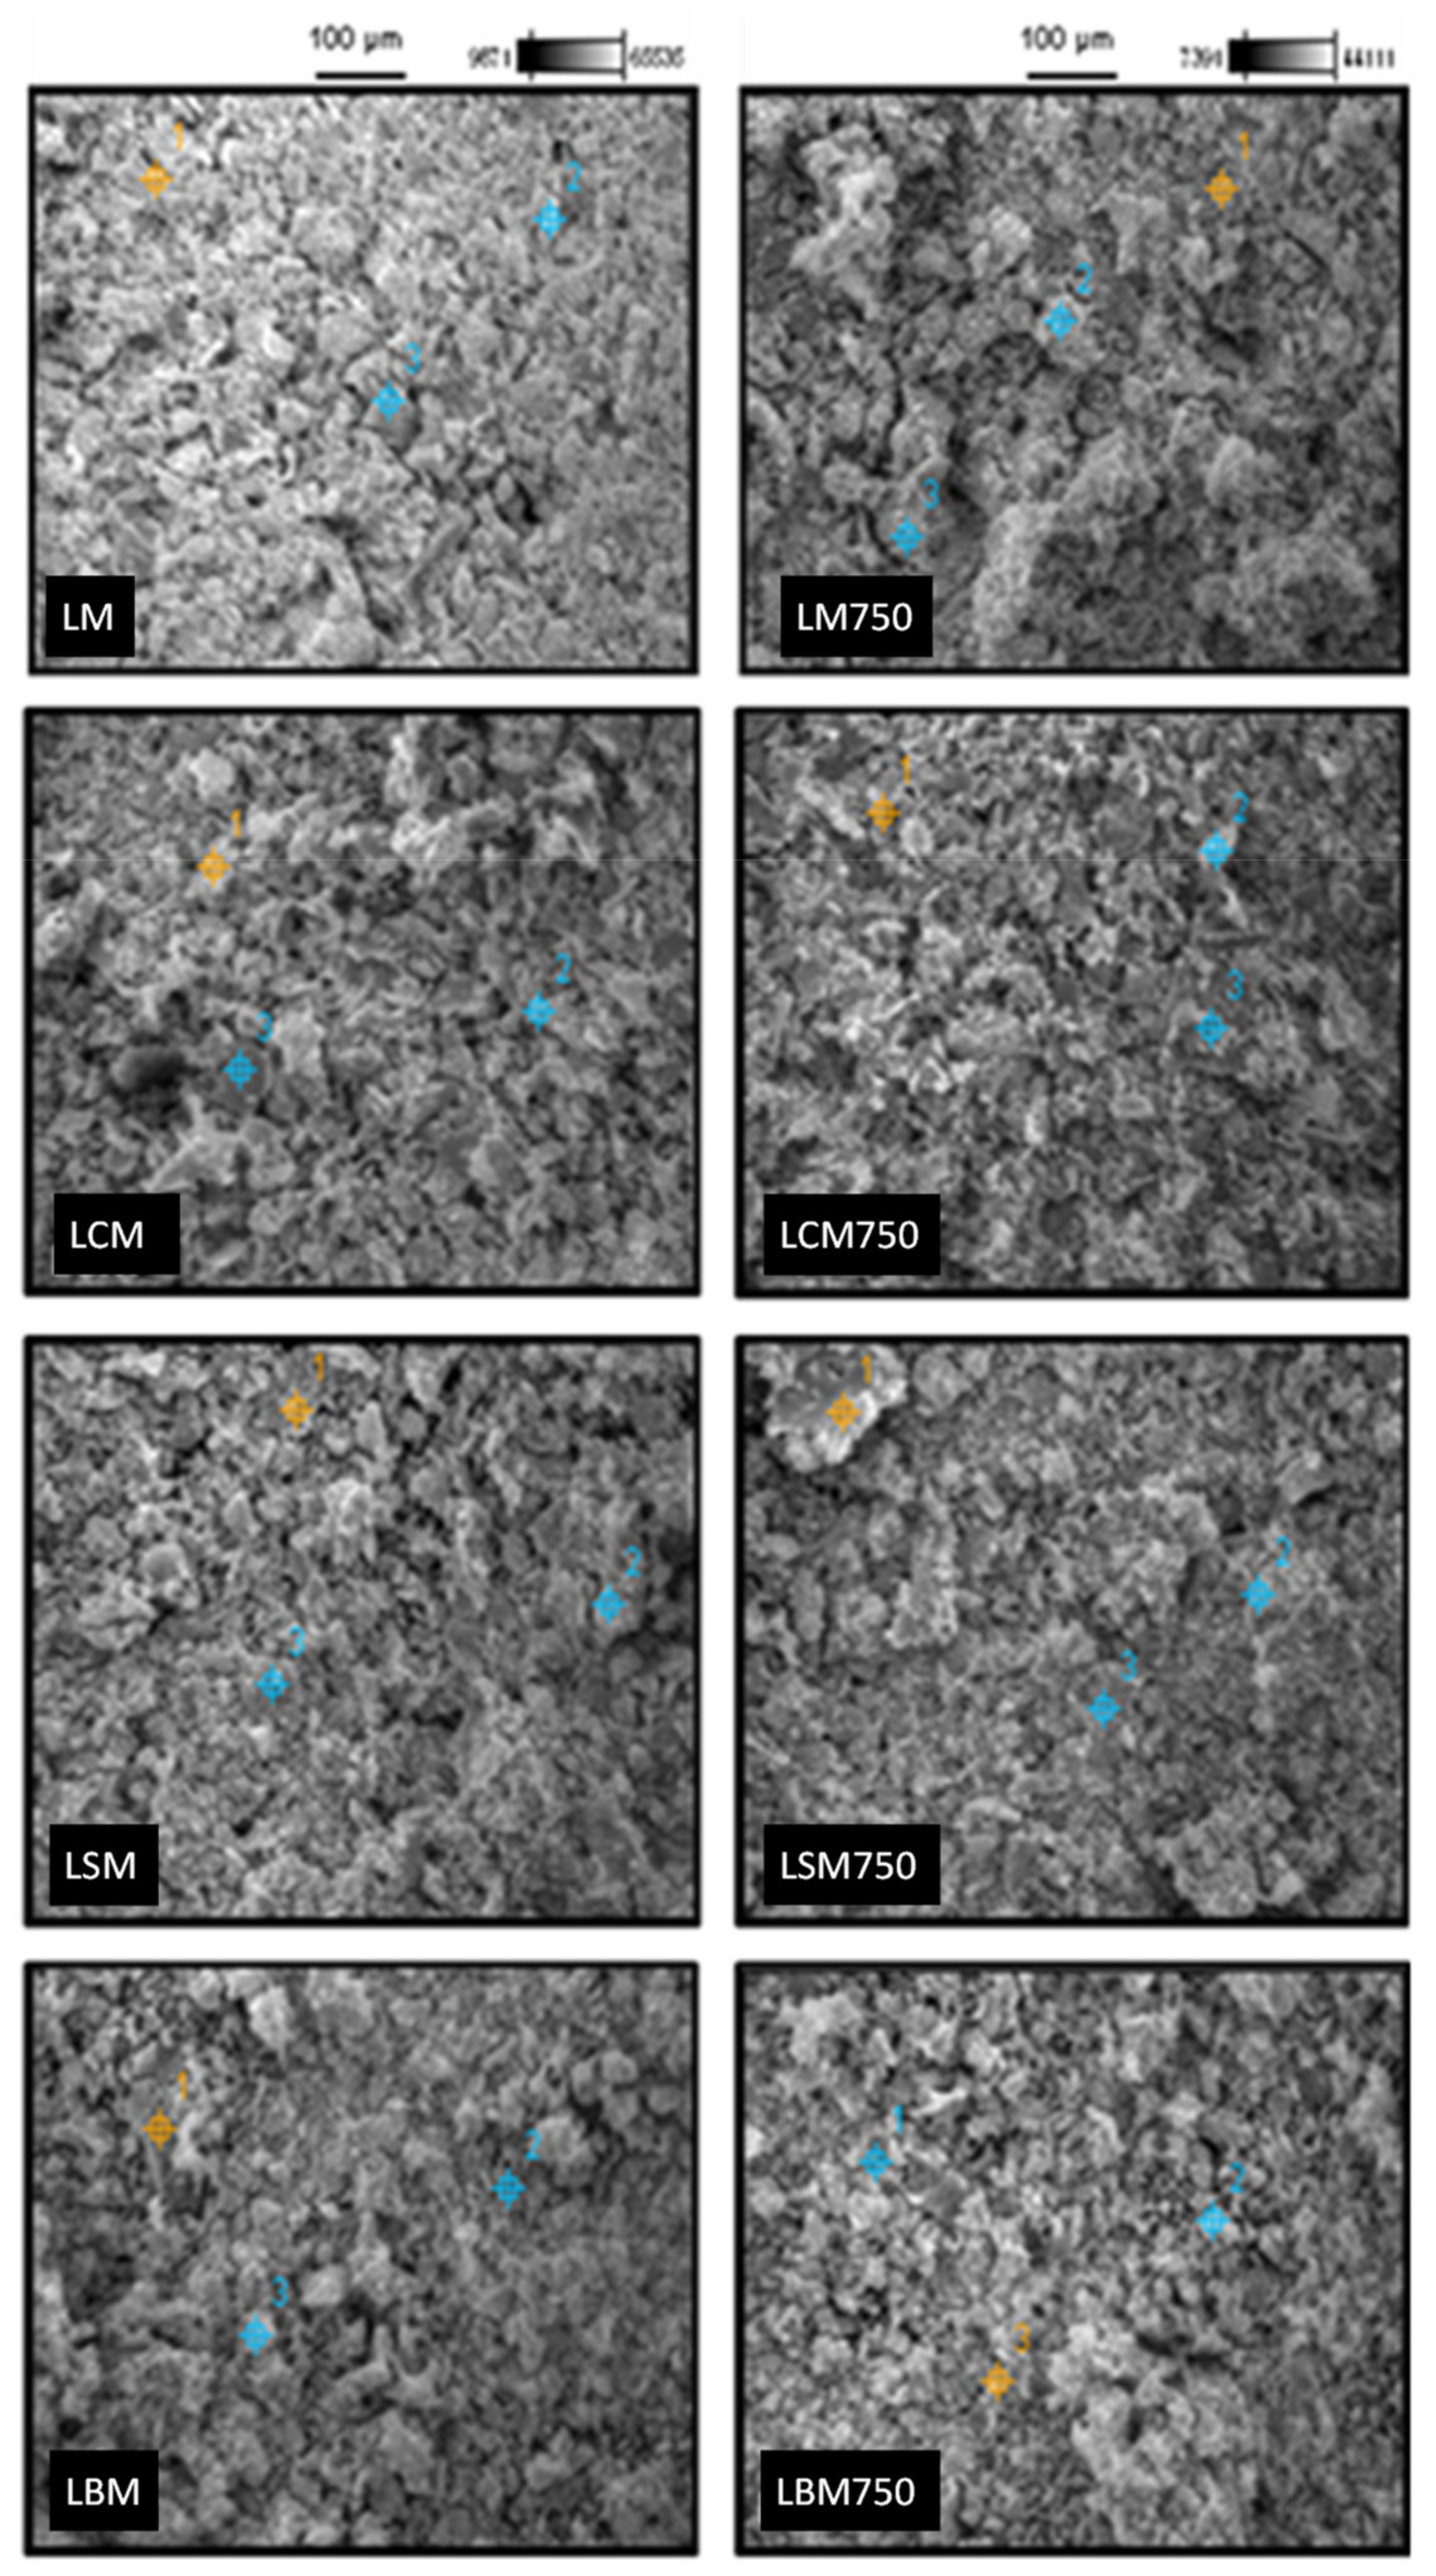
2.6. SEM-EDS Characterization
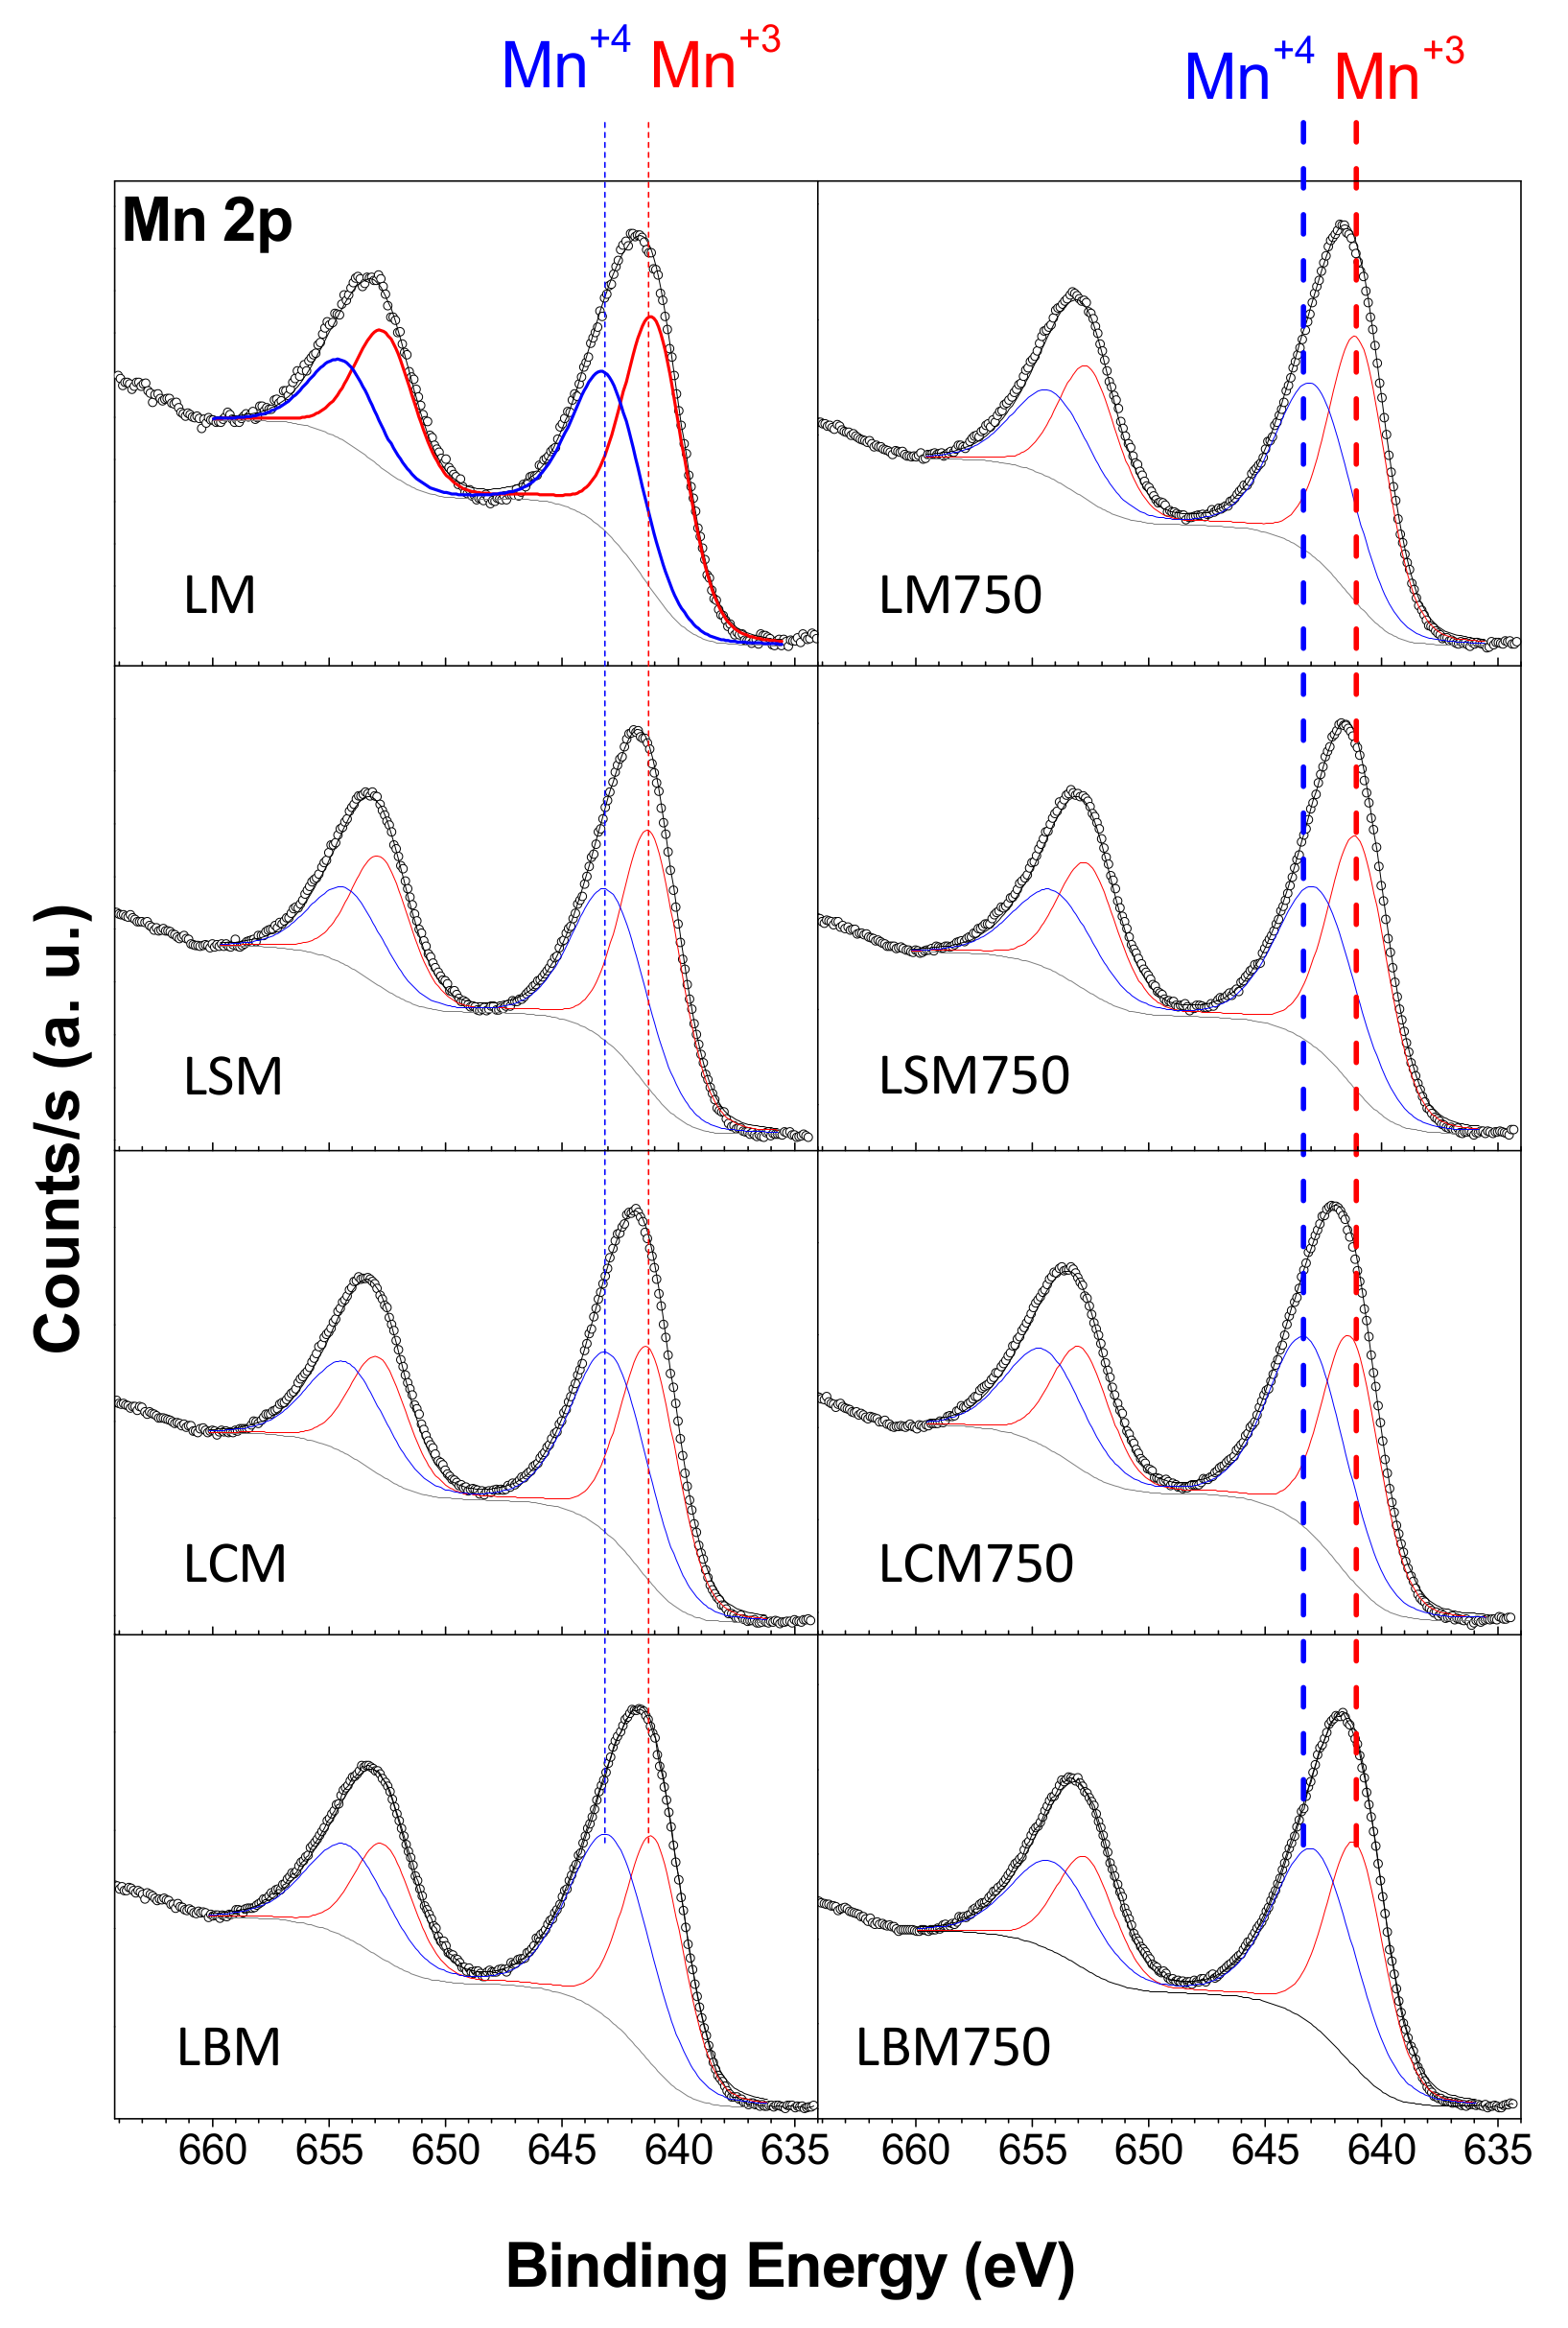
2.7. XPS Characterization
3. Discussion
4. Materials and Methods
4.1. Catalysts Preparation
4.2. Catalysts Characterization
4.2.1. Inductively Coupled Plasma Atomic Emission Spectroscopy
4.2.2. X-ray Powder Diffraction
4.2.3. Temperature-Programmed Reduction
4.2.4. Temperature-Programmed Desorption
4.2.5. Nitrogen Physisorption
4.2.6. Scanning Electron Microscopy
4.2.7. X-ray Photoelectron Spectroscopy
4.3. Catalytic Evaluation
5. Conclusions
Supplementary Materials
Author Contributions
Funding
Data Availability Statement
Acknowledgments
Conflicts of Interest
References
- Kim, H.-S.; Kim, H.-J.; Kim, J.-H.; Kim, J.-H.; Kang, S.-H.; Ryu, J.-H.; Park, N.-K.; Yun, D.-S.; Bae, J.-W. Noble-metal-based catalytic oxidation technology trends for volatile organic compound (VOC) removal. Catalysts 2022, 12, 63. [Google Scholar] [CrossRef]
- Hou, Z.; Pei, W.; Zhang, X.; Zhang, K.; Liu, Y.; Deng, J.; Jing, L.; Dai, H. Rare earth oxides and their supported noble metals in application of environmental catalysis. J. Rare Earths 2020, 38, 819–839. [Google Scholar] [CrossRef]
- Lee, J.E.; Ok, Y.S.; Tsang, D.C.W.; Song, J.H.; Jung, S.C.; Park, Y.K. Recent advances in volatile organic compounds abatement by catalysis and catalytic hybrid processes: A critical review. Sci. Total Environ. 2020, 719, 137405. [Google Scholar] [CrossRef] [PubMed]
- Kamal, M.S.; Razzak, S.A.; Hossain, M.M. Catalytic oxidation of volatile organic compounds (VOCs)—A review. Atmos. Environ. 2016, 140, 117–134. [Google Scholar] [CrossRef]
- Zang, M.; Zhao, C.; Wang, Y.; Chen, S. A review of recent advances in catalytic combustion of VOCs on perovskite-type catalysts. J. Saudi Chem. Soc. 2019, 23, 645–654. [Google Scholar] [CrossRef]
- Li, W.B.; Wang, J.X.; Gong, H. Catalytic combustion of VOCs on non-noble metal catalysts. Catal. Today 2010, 148, 81–87. [Google Scholar] [CrossRef]
- Ojala, S.; Koivikko, N.; Laitinen, T.; Mouammine, A.; Seelam, P.K.; Laassiri, S.; Ainassaari, K.; Rachid Brahmi, R.; Keiski, R.L. Utilization of volatile organic compounds as an alternative for destructive abatement. Catalysts 2015, 5, 1092–1151. [Google Scholar] [CrossRef]
- Spinicci, R.; Faticanti, M.; Marini, P.; De Rossi, S.; Porta, P. Catalytic activity of LaMnO3 and LaCoO3 perovskites towards VOCs combustion. J. Mol. Catal. A Chem. 2003, 197, 147–155. [Google Scholar] [CrossRef]
- Kim, S.C.; Shim, W.G. Catalytic combustion of VOCs over a series of manganese oxide catalysts. Appl. Catal. B Environ. 2010, 98, 180–185. [Google Scholar] [CrossRef]
- Rezlescu, N.; Rezlescu, E.; Popa, P.D.; Doroftei, C.; Ignat, M. Partial substitution of manganese with cerium in SrMnO3 nano-perovskite catalyst. Effect of the modification on the catalytic combustion of dilute acetone. Mater. Chem. Phys. 2016, 182, 332–337. [Google Scholar] [CrossRef]
- Yang, J.; Li, L.; Yang, X.; Song, S.; Li, J.; Jing, F.; Chu, W. Enhanced catalytic performances of in situ-assembled LaMnO3/δ-MnO2 hetero-structures for toluene combustion. Catal. Today 2019, 327, 19–27. [Google Scholar] [CrossRef]
- Doroftei, C.; Popa, P.D.; Rezlescu, E.; Rezlescu, N. Nanocrystalline SrMnO3 powder as catalyst for hydrocarbon combustion. J. Alloys Compd. 2014, 584, 195–198. [Google Scholar] [CrossRef]
- Hammami, R.; Ben Aissa, S.; Batis, H. Effects of thermal treatment on physico-chemical and catalytic properties of lanthanum manganite LaMnO3+y. Appl. Catal. A Gen. 2009, 353, 145–153. [Google Scholar] [CrossRef]
- Peña, M.A.; Fierro, J.L.G. Chemical structures and performance of perovskite oxides. Chem. Rev. 2017, 101, 1981–2017. [Google Scholar] [CrossRef] [PubMed]
- Santos, V.P.G.; Santos, M.S.; Resini, C.; Brandão, S.T. Síntese e caracterização de perovskitas LaMnO3 e γ-alumina como catalisadores para a reação de combustão do metano. Matéria 2017, 22, e-11913. [Google Scholar] [CrossRef][Green Version]
- Zhu, H.; Zhang, P.; Dai, S. Recent advances of lanthanum-based perovskite oxides for catalysis. ACS Catal. 2015, 5, 6370–6385. [Google Scholar] [CrossRef]
- Marti, P.E.; Baiker, A. Influence of the A-site cation in AMnO3+x and AFeO3+x (A=La, Pr, Nd and Gd) perovskite-type oxides on the catalytic activity for methane combustion. Catal. Lett. 1994, 26, 71–84. [Google Scholar] [CrossRef]
- Liu, Y.; Dai, H.; Du, Y.; Deng, J.; Zhang, L.; Zhao, Z.; Au, C.T. Controlled preparation and high catalytic performance of three-dimensionally ordered macroporous LaMnO3 with nanovoid skeletons for the combustion of toluene. J. Catal. 2012, 287, 149–160. [Google Scholar] [CrossRef]
- Liu, Y.; Dai, H.; Deng, J.; Du, Y.; Li, X.; Zhao, Z.; Wang, Y.; Gao, B.; Yang, H.; Guo, G. In situ poly(methyl methacrylate)-templating generation and excellent catalytic performance of MnOx/3DOM LaMnO3 for the combustion of toluene and methanol. Appl. Catal. B Environ. 2013, 140–141, 493–505. [Google Scholar] [CrossRef]
- Zhang, C.; Guo, Y.; Guo, Y.; Lu, G.; Boreave, A.; Retailleau, L.; Baylet, A.; Giroir-Fendler, A. Environmental LaMnO3 perovskite oxides prepared by different methods for catalytic oxidation of toluene. Appl. Catal. B Environ. 2014, 148–149, 490–498. [Google Scholar] [CrossRef]
- Einaga, H.; Hyodo, S.; Teraoka, Y. Complete oxidation of benzene over perovskite-type oxide catalysts. Top. Catal. 2010, 53, 629–634. [Google Scholar] [CrossRef]
- Miniajluk, N.; Trawczyński, J.; Zawadzki, M. Properties and catalytic performance for propane combustion of LaMnO3 prepared under microwave-assisted glycothermal conditions: Effect of solvent diols. Appl. Catal. A Gen. 2017, 531, 119–128. [Google Scholar] [CrossRef]
- Ding, Y.; Wang, S.; Zhang, L.; Chen, Z.; Wang, M.; Wang, S. A facile method to promote LaMnO3 perovskite catalyst for combustion of methane. Catal. Commun. 2017, 97, 88–92. [Google Scholar] [CrossRef]
- Padilla, O.; Munera, J.; Gallego, J.; Santamaria, A. Approach to the characterization of monolithic catalysts based on la perovskite-like oxides and their application for VOC oxidation under simulated indoor environment conditions. Catalysts 2022, 12, 168. [Google Scholar] [CrossRef]
- Zhang, C.; Wang, C.; Zhan, W.; Guo, Y.; Guo, Y.; Lu, G.; Baylet, A.; Giroir-Fendler, A. Catalytic oxidation of vinyl chloride emission over LaMnO3 and LaB0.2Mn0.8O3 (B=Co, Ni, Fe) catalysts. Appl. Catal. B Environ. 2013, 129, 509–516. [Google Scholar] [CrossRef]
- Zhang, C.; Cao, H.; Wang, C.; He, M.; Zhan, W.; Guo, Y. Catalytic mechanism and pathways of 1, 2-dichloropropane oxidation over LaMnO3 perovskite: An experimental and DFT study. J. Hazard. Mater. 2021, 402, 123473. [Google Scholar] [CrossRef]
- Yang, L.; Li, Y.; Sun, Y.; Wang, W.; Shao, Z. Perovskite oxides in catalytic combustion of volatile organic compounds: Recent advances and future prospects. Energy Environ. Mater. 2021, 1–26. [Google Scholar] [CrossRef]
- Wold, A.; Arnott, R.J. Preparation and crystallographic properties of the systems LaMnl-xMnxO3+λ and LaMn1-xNixO3+λ JA-1106. J. Phys. Chem. Solids 1959, 9, 176–180. [Google Scholar] [CrossRef]
- Alonso, J.A.; Martínez-Lope, M.J.; Casáis, M.T.; Muñoz, A. Magnetic structures of LaMnO3+δ perovskites (δ = 0.11, 0.15, 0.26). Solid State Commun. 1997, 102, 7–12. [Google Scholar] [CrossRef]
- Topfer, J.; Goodenough, J.B. LaMnO3+δ revisited. J. Solid State Chem. 1997, 130, 117–128. [Google Scholar] [CrossRef]
- Mitchell, J.F.; Argyriou, D.N.; Potter, C.D.; Hinks, D.G.; Jorgensen, J.D.; Bader, S.D. Structural phase diagram of La1-xSrxMnO3+δ: Relationship to magnetic and transport properties. Phys. Rev. B 1996, 54, 6172–6183. [Google Scholar] [CrossRef] [PubMed]
- Pan, K.L.; Pan, G.T.; Chong, S.; Chang, M.B. Removal of VOCs from gas streams with double perovskite-type catalysts. J. Environ. Sci. 2018, 69, 205–216. [Google Scholar] [CrossRef] [PubMed]
- Stege, W.P.; Cadús, L.E.; Barbero, B.P. La1−xCaxMnO3 perovskites as catalysts for total oxidation of volatile organic compounds. Catal. Today 2011, 172, 53–57. [Google Scholar] [CrossRef]
- Wang, L.; Wang, C.; Xie, H.; Zhan, W.; Guo, Y.; Guo, Y. Catalytic combustion of vinyl chloride over Sr doped LaMnO3. Catal. Today 2019, 327, 190–195. [Google Scholar] [CrossRef]
- Mitchell, R.H. Perovskites: Modern and Ancient; Almaz Press Inc.: Thunder Bay, ON, Canada, 2002. [Google Scholar]
- Yang, C.; Grimaud, A. Factors controlling the redox activity of oxygen in perovskites: From theory to application for catalytic reactions. Catalysts 2017, 7, 149. [Google Scholar] [CrossRef]
- Vázquez, S.; Basbus, J.; Soldati, A.L.; Napolitano, F.; Serquis, A.; Suescun, L. Effect of the symmetric cell preparation temperature on the activity of Ba0.5Sr0.5Fe0.8Cu0.2O3-δ as cathode for intermediate temperature solid oxide fuel cells. J. Power Sources 2015, 274, 318–323. [Google Scholar] [CrossRef]
- Cui, W.; Chen, H.; Liu, Q.; Cui, M.; Chen, X.; Fei, Z. Mn/Co redox cycle promoted catalytic performance of mesoporous SiO2-confined highly dispersed LaMnxCo1-xO3 perovskite oxides in n-butylamine combustion. Chem. Sel. 2020, 5, 8504–8511. [Google Scholar]
- Esmaeilnejad-Ahranjani, P.; Khodadadi, A.A.; Mortazavi, Y. Self-regenerative function of Cu in LaMnCu0.1O3 catalyst: Towards noble metal-free intelligent perovskites for automotive exhaust gas treatment. Appl. Catal. A Gen. 2020, 602, 117702. [Google Scholar] [CrossRef]
- Zhang, C.; Zeng, K.; Wang, C.; Liu, X.; Wu, G.; Wang, Z.; Wang, D. LaMnO3 perovskites via a facile nickel substitution strategy for boosting propane combustion performance. Ceram. Int. 2020, 46, 6652–6662. [Google Scholar] [CrossRef]
- Gu, H.; Yang, G.; Hu, Y.; Liang, M.; Chen, S.; Ran, R.; Xu, M.; Wang, W.; Zhou, W.; Shao, Z. Enhancing the oxygen reduction activity of PrBaCo2O5+δ double perovskite cathode by tailoring the calcination temperatures. Int. J. Hydrog. Energy 2020, 45, 25996–26004. [Google Scholar] [CrossRef]
- Moulder, J.F.; Stickle, W.F.; Sohol, P.E.; Bomben, K.D. Handbook of X-ray Photoelectron Spectroscopy; Perkin-Elmer Corporation, Physical Electronics Inc.: Eden Prairie, MN, USA, 1992. [Google Scholar]
- Østergaard, M.B.; Strunck, A.B.; Boffa, V.; Jørgensen, M.K. Kinetics of strontium carbonate formation on a Ce-doped SrFeO3 perovskite. Catalysts 2022, 12, 265. [Google Scholar] [CrossRef]
- Feldhoff, A.; Martynczuk, J.; Wang, H. Advanced Ba0.5Sr0.5Zn0.2Fe0.8O3−δ perovskite-type ceramics as oxygen selective membranes: Evaluation of the synthetic process. Prog. Solid State Chem. 2007, 35, 339–353. [Google Scholar] [CrossRef]
- Chattaraj, B.D.; Dutta, S.N.; Iyengar, M.S. Studies on the thermal decomposition of calcium carbonate in the presence of alkali salts (Na2CO3, K2CO3 and NaCl). J. Therm. Anal. 1973, 5, 43–49. [Google Scholar] [CrossRef]
- Foger, K.; Hoang, M.; Turney, T.W. Formation and thermal decomposition of rare-earth carbonates. J. Mater. Sci. 1992, 27, 77–82. [Google Scholar] [CrossRef]
- Alvero, R.; Odriozola, J.A.; Trillo, J.M. Lanthanide oxides: Preparation and ageing. J. Chem. Soc. Dalton Trans. 1984, 2, 87–91. [Google Scholar] [CrossRef]
- Arai, H.; Yamada, T.; Eguchi, K.; Seiyama, T. Catalytic combustion of methane over various perovskite-type oxides. Appl. Catal. 1986, 26, 265–276. [Google Scholar] [CrossRef]
- Alami, D. Environmental applications of rare-earth manganites as catalysts: A comparative study. Environ. Eng. Res. 2013, 4, 211–219. [Google Scholar] [CrossRef]
- Bellakki, M.B.; Shivakumara, C.; Vasanthacharya, N.Y.; Prakash, A.S. Rapid synthesis of room temperature ferromagnetic ag-doped LaMnO3 perovskite phases by the solution combustion method. Mater. Res. Bull. 2010, 45, 1685–1691. [Google Scholar] [CrossRef]
- Vázquez, S.; Davyt, S.; Basbus, J.F.; Soldati, A.L.; Amaya, A.; Serquis, A.; Faccio, R.; Suescun, L. Synthesis and characterization of La0.6Sr0.4Fe0.8Cu0.2O3-δ oxide as cathode for intermediate temperature solid oxide fuel cells. J. Solid State Chem. 2015, 228, 208–213. [Google Scholar] [CrossRef]
- Grassi, J.; Macias, M.A.; Castiglioni, J.; Basbus, J.F.; Gauthier, G.H.; Serquis, A.; Suescun, L. Synthesis, characterization of high temperature properties and evaluation of YBa2Cu3O6+δ as cathode for Intermediate Temperature Solid Oxide Fuel Cells. J. Mater. Sci. Technol. Res. 2021, 8, 81–92. [Google Scholar] [CrossRef]
- Toby, B.H.; Von Dreele, R.B. GSAS-II: The genesis of a modern open-source all purpose crystallography software package. Appl. Crystallogr. 2013, 46, 544–549. [Google Scholar] [CrossRef]
- Shirley, D.A. High-resolution X-ray photoemission spectrum of the valence bands of gold. Phys. Rev. B 1972, 5, 4709–4714. [Google Scholar] [CrossRef]
- Sunding, M.F.; Hadidi, K.; Diplas, S.; Lovvik, O.M.; Norby, T.E.; Gunnaes, A.E. XPS characterization of in situ treated lanthanum oxide and hydroxide using tailored charge referencing and peak fitting procedures. J. Electron Spectrosc. Related Phenom. 2011, 184, 399–409. [Google Scholar]
- Li, J.P.H.; Zhou, X.; Pang, Y.; Zhu, L.; Vovk, E.I.; Cong, L.; van Bavel, A.P.; Li, S.; Yang, Y. Understanding of binding energy calibration in XPS of lanthanum oxide by in situ treatment. Phys. Chem. Chem. Phys. 2019, 21, 22351. [Google Scholar]


| Catalyst | T50 [°C] | T80 [°C] |
|---|---|---|
| LM | 218 | 244 |
| LM 750 | 208 | 238 |
| LCM | 208 | 235 |
| LCM 750 | 190 | 227 |
| LSM | 209 | 234 |
| LSM 750 | 193 | 228 |
| LBM | 200 | 231 |
| LBM 750 | 168 | 198 |
| Catalyst | H2 Uptake (mol H2 mol−1 cat.) | ||
|---|---|---|---|
| T ≤ 600 °C | T > 600 °C | Total | |
| LM | 0.04 | 0.35 | 0.39 |
| LM 750 | 0.23 | 0.42 | 0.65 |
| LCM | 0.18 | 0.34 | 0.52 |
| LCM 750 | 0.25 | 0.32 | 0.57 |
| LSM | 0.25 | 0.28 | 0.53 |
| LSM 750 | 0.29 | 0.28 | 0.57 |
| LBM | 0.30 | 0.24 | 0.54 |
| LBM 750 | 0.32 | 0.25 | 0.57 |
| Catalyst | SBET [m2g−1] | Vtotal [m3g−1] |
|---|---|---|
| LM | 5.7 | 0.025 |
| LM750 | 4.7 | 0.015 |
| LCM | 5.0 | 0.030 |
| LCM750 | 6.9 | 0.030 |
| LSM | 7.0 | 0.030 |
| LSM750 | 5.5 | 0.030 |
| LBM | 7.1 | 0.030 |
| LBM750 | 6.7 | 0.030 |
| Sample | Atom % | Sample | Atom % | ||||
|---|---|---|---|---|---|---|---|
| O | Mn | La | O | Mn | La | ||
| LM | 60.4 | 18.4 | 20.1 | LM750 | 61.5 | 17.1 | 19.3 |
| 44.3 | 23.6 | 30.4 | 37.9 | 25.0 | 36.7 | ||
| 63.2 | 17.0 | 18.1 | 58.3 | 18.4 | 21.3 | ||
| LCM | 69.2 | 14.0 | 12.5 | LCM750 | 57.5 | 19.2 | 18.2 |
| 60.0 | 19.3 | 15.7 | 62.0 | 17.4 | 14.1 | ||
| 48.6 | 24.4 | 19.8 | 61.5 | 18.3 | 14.7 | ||
| LSM | 62.6 | 18.0 | 13.6 | LSM750 | 71.2 | 12.7 | 11.8 |
| 66.9 | 14.6 | 12.9 | 67.8 | 14.8 | 11.4 | ||
| 59.9 | 20.0 | 14.0 | 65.3 | 14.9 | 13.9 | ||
| LBM | 58.7 | 18.2 | 16.2 | LBM750 | 67.6 | 14.2 | 13.4 |
| 66.0 | 15.2 | 12.0 | 61.9 | 16.6 | 14.7 | ||
| 66.1 | 15.6 | 12.7 | 69.4 | 14.3 | 11.0 | ||
| Sample | A | Element (Atom %) | ||||
|---|---|---|---|---|---|---|
| O | Mn (Mn4+/Mn3+ Ratio) | La | C | A | ||
| LM | - | 48.9 | 6.9 (0.6) | 4.4 | 39.8 | - |
| LM750 | - | 46.3 | 8.1 (0.8) | 5.1 | 40.5 | - |
| LCM | Ca | 49.7 | 8.5 (1.0) | 4.4 | 32.7 | 4.7 |
| LCM750 | Ca | 49.4 | 10.2 (1.1) | 5.7 | 31.2 | 3.5 |
| LSM | Sr | 50.0 | 8.6 (0.7) | 4.2 | 35.5 | 1.7 |
| LSM750 | Sr | 47.8 | 8.9 (0.8) | 4.2 | 37.6 | 1.5 |
| LBM | Ba | 45.9 | 7.4 (1.1) | 3.8 | 41.2 | 1.7 |
| LBM750 | Ba | 47.6 | 9.3 (1.1) | 4.4 | 36.0 | 2.7 |
Publisher’s Note: MDPI stays neutral with regard to jurisdictional claims in published maps and institutional affiliations. |
© 2022 by the authors. Licensee MDPI, Basel, Switzerland. This article is an open access article distributed under the terms and conditions of the Creative Commons Attribution (CC BY) license (https://creativecommons.org/licenses/by/4.0/).
Share and Cite
Di Benedetto, N.; De los Santos, C.; Del Pilar Yeste, M.; Morais, J.; Do Carmo Martins Alves, M.; Amaya, A.; Suescun, L.; Gatica, J.M.; Vidal, H.; Castiglioni, J. Influence of the Thermal Processing and Doping on LaMnO3 and La0.8A0.2MnO3 (A = Ca, Sr, Ba) Perovskites Prepared by Auto-Combustion for Removal of VOCs. Catalysts 2022, 12, 865. https://doi.org/10.3390/catal12080865
Di Benedetto N, De los Santos C, Del Pilar Yeste M, Morais J, Do Carmo Martins Alves M, Amaya A, Suescun L, Gatica JM, Vidal H, Castiglioni J. Influence of the Thermal Processing and Doping on LaMnO3 and La0.8A0.2MnO3 (A = Ca, Sr, Ba) Perovskites Prepared by Auto-Combustion for Removal of VOCs. Catalysts. 2022; 12(8):865. https://doi.org/10.3390/catal12080865
Chicago/Turabian StyleDi Benedetto, Natasha, Carolina De los Santos, María Del Pilar Yeste, Jonder Morais, Maria Do Carmo Martins Alves, Alejandro Amaya, Leopoldo Suescun, José Manuel Gatica, Hilario Vidal, and Jorge Castiglioni. 2022. "Influence of the Thermal Processing and Doping on LaMnO3 and La0.8A0.2MnO3 (A = Ca, Sr, Ba) Perovskites Prepared by Auto-Combustion for Removal of VOCs" Catalysts 12, no. 8: 865. https://doi.org/10.3390/catal12080865
APA StyleDi Benedetto, N., De los Santos, C., Del Pilar Yeste, M., Morais, J., Do Carmo Martins Alves, M., Amaya, A., Suescun, L., Gatica, J. M., Vidal, H., & Castiglioni, J. (2022). Influence of the Thermal Processing and Doping on LaMnO3 and La0.8A0.2MnO3 (A = Ca, Sr, Ba) Perovskites Prepared by Auto-Combustion for Removal of VOCs. Catalysts, 12(8), 865. https://doi.org/10.3390/catal12080865