Article

Detailed Kinetic Modeling of CO2-Based Fischer–Tropsch Synthesis

Institute for Micro Process Engineering (IMVT), Karlsruhe Institute of Technology (KIT), Hermann-von-Helmholtz-Platz 1, 76344 Eggenstein-Leopoldshafen, Germany
*
Author to whom correspondence should be addressed.
Catalysts 2022, 12(6), 630; https://doi.org/10.3390/catal12060630
Submission received: 29 April 2022 / Revised: 2 June 2022 / Accepted: 6 June 2022 / Published: 9 June 2022
(This article belongs to the Special Issue Catalytic Hydrogenation of CO2)

Abstract

:
The direct hydrogenation of CO 2 to long-chain hydrocarbons, so called CO 2 -based Fischer–Tropsch synthesis (FTS), is a viable future production route for various hydrocarbons used in the chemical industry or fuel applications. The detailed modeling of the reactant consumption and product distribution is very important for further process improvements but has gained only limited attention so far. We adapted proven modeling approaches from the traditional FTS and developed a detailed kinetic model for the CO 2 -FTS based on experiments with an Fe based catalyst in a lab-scale tubular reactor. The model is based on a direct CO 2 dissociation mechanism for the reverse water gas shift and the alkyl mechanism with an H-assisted CO dissociation step for the FTS. The model is able to predict the reactant consumption, as well as the hydrocarbon distribution, reliably within the experimental range studied (10 bar, 280–320 °C, 900–120,000 mLN h−1 g−1 and H 2 / CO 2 molar inlet ratios of 2–4) and demonstrates the applicability of traditional FTS models for the CO 2 -based synthesis. Peculiarities of the fractions of individual hydrocarbon classes (1-alkenes, n-alkanes, and iso-alkenes) are accounted for with chain-length-dependent kinetic parameters for branching and dissociative desorption. However, the reliable modeling of class fractions for high carbon number products (> C 12 ) remains a challenge not only from a modeling perspective but also from product collection and analysis.

1. Introduction

The Fischer–Tropsch synthesis (FTS) is an established industrial process for the production of a broad range of hydrocarbons. Its main application is currently the conversion of synthesis gas ( H 2 and CO), derived from coal or natural gas, to high-value transportation fuels [1]. Due to extensive international efforts to substitute energy carriers derived from fossil resources, FTS gained a lot of attention for the production of sustainable hydrocarbons as CO 2 may also be used as a carbon source for the required synthesis gas [2,3,4,5]. When using CO 2 , one might follow a traditional two-step approach by first generating the synthesis gas, e.g., via reverse water gas shift (RWGS), with a subsequent CO-FTS. However, by using Fe based catalysts, CO 2 also can be directly hydrogenated to long-chain hydrocarbons in one reactor as they catalyze both the RWGS and FTS [2,3,4,5,6]. In this configuration, CO is formed in situ in the FTS reactor via the RWGS reaction. This will be referred to as CO 2 -FTS and is the focus of this work.
There are numerous studies dealing with the modeling of kinetics and product distribution of traditional FTS with a greatly varying degree of detail [7,8]. For CO 2 -FTS, however, only a very limited number of studies has been conducted so far. Several macrokinetic models have been reported [9,10,11,12,13], including the model we developed for a supported iron catalyst [14]. Very recently, Panzone et al. published the first detailed kinetic model [15]. They derived explicit Langmuir–Hinshelwood–Hougen–Watson (LHHW) type kinetic expressions based on a redox mechanism for the RWGS, an alkyl-mechanism for the formation of hydrocarbons, and a CO insertion mechanism for the formation of oxygenates. To the best of our knowledge, additional detailed models have not been reported so far.
It appears reasonable to adapt proven modeling approaches from traditional FTS for the CO 2 -based pathway. However, care has to be applied regarding the mechanistic implications of the used catalyst. The product spectrum of Co based catalysts is strongly determined by secondary reactions, while, for alkalized Fe based catalysts at elevated temperatures, it is mainly determined by primary reactions [16]. Modeling approaches for Co based catalysts might thus be misleading and we will only discuss studies dealing with Fe based catalysts here.
In general, FTS can be considered as a polymerization reaction with three main steps: chain initiation, chain growth and chain termination. When assuming a constant chain growth probability α for all growing species one ends up with Equation (1) for the mole fraction of hydrocarbons with n carbon atoms. This is the well known Anderson–Schulz–Flory (ASF) distribution, which yields a straight line when plotting the logarithmic mole fraction vs. the carbon number. In reality, however, deviations from this ideal model are usually observed, i.e., a higher methane selectivity, lower C 2 selectivity, and an overprediction of long-chain hydrocarbons [17,18]:
x n = ( 1 α ) α n 1
Despite almost 100 years of research, the mechanism of chain growth is still under debate and several mechanisms haven been proposed throughout the decades [1,17,18,19]. Presumably, the alkyl mechanism (based on the carbide theory originally proposed by Fischer and Tropsch [20,21]) and the CO insertion mechanism are currently the most favored pathways [1,17,18]. Within these mechanisms, CO dissociation is considered to be a key step and may proceed unassisted or H-assisted. Density functional theory (DFT) calculations of different Fe phases seem to support the fact that H-assisted and unassisted CO dissociation proceed in parallel with varying ratios depending on the surface configuration [22,23,24,25].
Detailed FTS kinetic models seek to achieve the correct modeling of reactant consumption, as well as product distribution, by the mathematical adaption of the theoretically derived mechanisms. Such models have been reported by several authors [26,27,28,29,30]. Special emphasis is usually focused towards the experimentally observed deviations from an ideal ASF distribution. Some authors solely focused on the product distribution [31,32,33,34]. These are sometimes referred to as “hydrocarbon selectivity” models.
Besides the assumed CO dissociation and chain growth mechanisms, the reported models differ in the approaches to account for the deviations from an ideal ASF distribution. The deviation of methane and C 2 -species is usually accounted for with separate kinetic constants [28,29,31,33,34]. For the deviations of long-chain hydrocarbons, the studies differ significantly. Four approaches may be distinguished:
(1)
Secondary growth of readsorbed 1-alkenes [28,31,32,34];
(2)
Presence of two types of FTS sites/growth mechanisms [33,34] (basically an adaption of the 2- α approach [35,36,37]);
(3)
Chain-length-dependent kinetic parameters [38];
(4)
Fundamental/microkinetic modeling [29,30].
Secondary growth of 1-alkenes may be an important reaction path for Co based catalysts. For alkalized Fe based catalysts, however, secondary reactions of 1-alkenes are reported to be mainly hydrogenation and isomerization to 2-alkenes ([39,40,41]). The consideration of two different FTS sites or growth mechanisms may be a well working modeling approach. Currently, it does appear to be a rather empirical approach though. A completely fundamental approach would be physically most correct but is far beyond this semi-empirical study. Hence, we applied the remaining chain-length-dependent parameter approach proposed by Botes [38]. It is reported to resemble the chemically intrinsic dependence of kinetic parameters on chain length to at least some degree [30].
Summing up, we propose a detailed kinetic model for the CO 2 -based FTS on a supported Fe catalyst which is based on a direct CO 2 dissociation mechanism for the RWGS and the alkyl mechanism with chain-length dependent parameters and H-assisted CO dissociation for FTS. The model allows a reliable prediction of the reactant consumption, the overall hydrocarbon distribution, and the fractions of hydrocarbon groups (1-alkenes, n-alkanes, and iso-alkanes) up to C 12 . Oxygenates are not considered due to experimental hurdles to determine them.

2. Modeling

2.1. Kinetic Model

The kinetic model was developed from elementary reaction steps adapted from recent DFT studies of the RWGS and FTS under the conditions of CO 2 -FTS [42,43,44]. To reduce the complexity of the model, we did not assume RWGS and FTS to proceed on separate catalytic sites. Otherwise, this would have led to a significant increase of the model parameters. It has to be pointed out that modeling the RWGS and FTS sites separately is not synonymous with a 2- α approach, which would assume two separate FTS sites/growth mechanisms.
The adsorption of the two reactants, H 2 and CO 2 , was assumed to be in equilibrium (steps 1 and 2, Table 1). This assumption was not possible for CO and H 2 O . They are not present in the feed gas and one can thus not solve for the initial surface coverage with an equilibrium constant. Therefore, two rate expressions were assigned for the adsorption and desorption, respectively (step 3 and 4). H 2 and H 2 O adsorb dissociatively while CO 2 and CO adsorb associatively.
For the RWGS reaction, we adopted a direct CO 2 dissociation mechanism that was proposed in several DFT studies [42,43,44] to be the dominant pathway for the reaction conditions examined in this work. The corresponding elementary steps are given in Table 2. Due to the model design, it is not reasonable to calculate the surface coverage of multiple oxygen species. They would be completely correlated and thereby meaningless. Thus, we considered only one kind of oxygen containing species (here: OH*), which is basically a pseudocomponent for all oxygen containing species that might be present on the catalyst surface. Thus, step 5b was assumed to be in quasi-equilibrium to express ΘO in terms of ΘOH. This led to the overall expressions for step 5 as given in Table 1 and Table 2. In our previously published macrokinetic model, we ended up with an H-assisted CO2 dissociation pathway leading to the overall best result [14]. However, it was pointed out that the model results were hardly affected by the assumed RWGS mechanism within the experimental range studied.
For the FTS, we applied the alkyl mechanism with H-assisted CO dissociation. H-assisted CO dissociation is reported by Nie et al. [44] to be dominant under CO 2 -FTS conditions. The elementary steps as proposed by Ojeda et al. [22] for traditional FTS are given in Table 3. In agreement with the literature, we considered step 6b as the rate-determining step (RDS) and 6a to be in quasi-equilibrium. This yields the overall expression for step 6 as given in Table 1 and Table 3.
The alkyl mechanism was extended by the possibility of chain branching as proposed by Schulz et al. [45]. A schematic of the mechanism is given in Figure 1. Adsorbed alkyl-species ( R n ) can either grow via the addition of a methylene unit (step 8), terminate to an n-alkane ( P n , n-paraffin) via associative desorption (step 9), terminate to an 1-alkene ( Ol n , α -olefin) via dissociative desorption ( β -hydride elimination, step 10), or undergo branching to an iso-alkyl species (step 11, IR n ). It is assumed that branched and unbranched species grow with the same rate. The branching reaction is reported by Schulz et al. [45] to be highly dependent on chain length due to spacious restrictions. In line with their results, we assumed an exponentially decaying rate for chain branching and assigned an extra value for the C 3 -species. Additionally, compliant with the chain-length-dependent desorption model of Botes [38], we assumed an exponentially decaying rate of dissociative desorption with increasing chain length. It was necessary to include an empirical damping factor for all termination steps ( Θ Θ O H 1 ), which will be discussed in Section 4.
The temperature dependency of the rate constants was implemented with a reparameterized Arrhenius equation (Equation (2)). For dissociative desorption and branching, it was extended by a chain-length-dependence parameter Γ. It turned out that considering every reaction as temperature dependent did not improve the model and was therefore discarded. It was sufficient to describe the temperature dependency of the reactant consumption with the activation energy of the water adsorption and desorption steps. The product distribution did not display a strong temperature dependency and we only considered an activation energy for the 1-alkene termination. It is important to note that, in this case, the obtained values for the activation energies are not related to intrinsic values and have very limited physical meaning since they are lumps of several reactions:
k j , n = k j , T ref exp Γ j n R T E A , j R 1 T 1 T ref
In total, the model consisted of 23 adaptable parameters. Secondary reactions of 1-alkenes were not considered. The possible influence is discussed in Section 3.1.

2.2. Reactor Model

The lab-scale tubular reactor was modeled as an isothermal, isobaric and pseudo-homogeneous plug flow reactor (PFR) at steady state. The change of molar flow rate n ˙ i of each considered component i for an incremental mass of catalyst m c a t is given by the sum of the reactions r j , multiplied by its respective stoichiometric coefficient ν i , j . Hydrocarbons with up to 40 carbon atoms are considered here. This leads to 120 ordinary differential equations according to Equation (3). For the calculations, Equation (3) was scaled with the inlet volumetric flow rate at normal conditions to make the calculation independent from absolute flow rates. At steady state, the catalyst surface coverage is constant at each position in the reactor over time. Thus, for all adsorbed species k, 82 algebraic equations according to Equation (4) have to be fulfilled. As the closing condition, the catalytic site balance (Equation (5)) has to be satisfied:
d n ˙ i d m c a t = j ν i , j r j
d Θ k d t = j ν k , j r j = 0
1 = Θ + Θ C O 2 + Θ C O + Θ H + Θ O H + Θ C H 2 + n Θ R n + n Θ IR n
The resulting semi-explicit differential-algebraic system of equations was solved with ode15s in MATLAB. Consistent initial conditions for the catalyst surface coverage were computed with ode15s as well. The modeling approach was adapted from Visconti et al. [46].

2.3. Parameter Regression

The parameters of the kinetic model were regressed with a global optimization approach using weighted least-squares. The objective function was the sum of squared relative deviations of the molar flow rates of defined components i for all experiments l (see Equation (6)). The relative deviations were weighted with empirical factors ω i to ensure that certain properties of the model that are of special interest (e.g., the reactant consumption) are given a higher priority. In practice, this meant a stronger weighting of the reactant flow rates to ensure a good reproduction of the conversions. In the regression process, we considered the flow rates of H 2 , CO 2 , CO , n-alkanes, 1-alkenes and iso-alkenes individually up to C 15 , and the sum of hydrocarbon flow rates from C 16 to C 30 :
F = l i n ˙ i , sim n ˙ i , exp ω i n ˙ i , exp 2
For the global optimization, quasirandom parameters were generated in a predefined space using sobolset in MATLAB and used as the initial guesses for a local optimization solver (lsqnonlin).

3. Results and Discussion

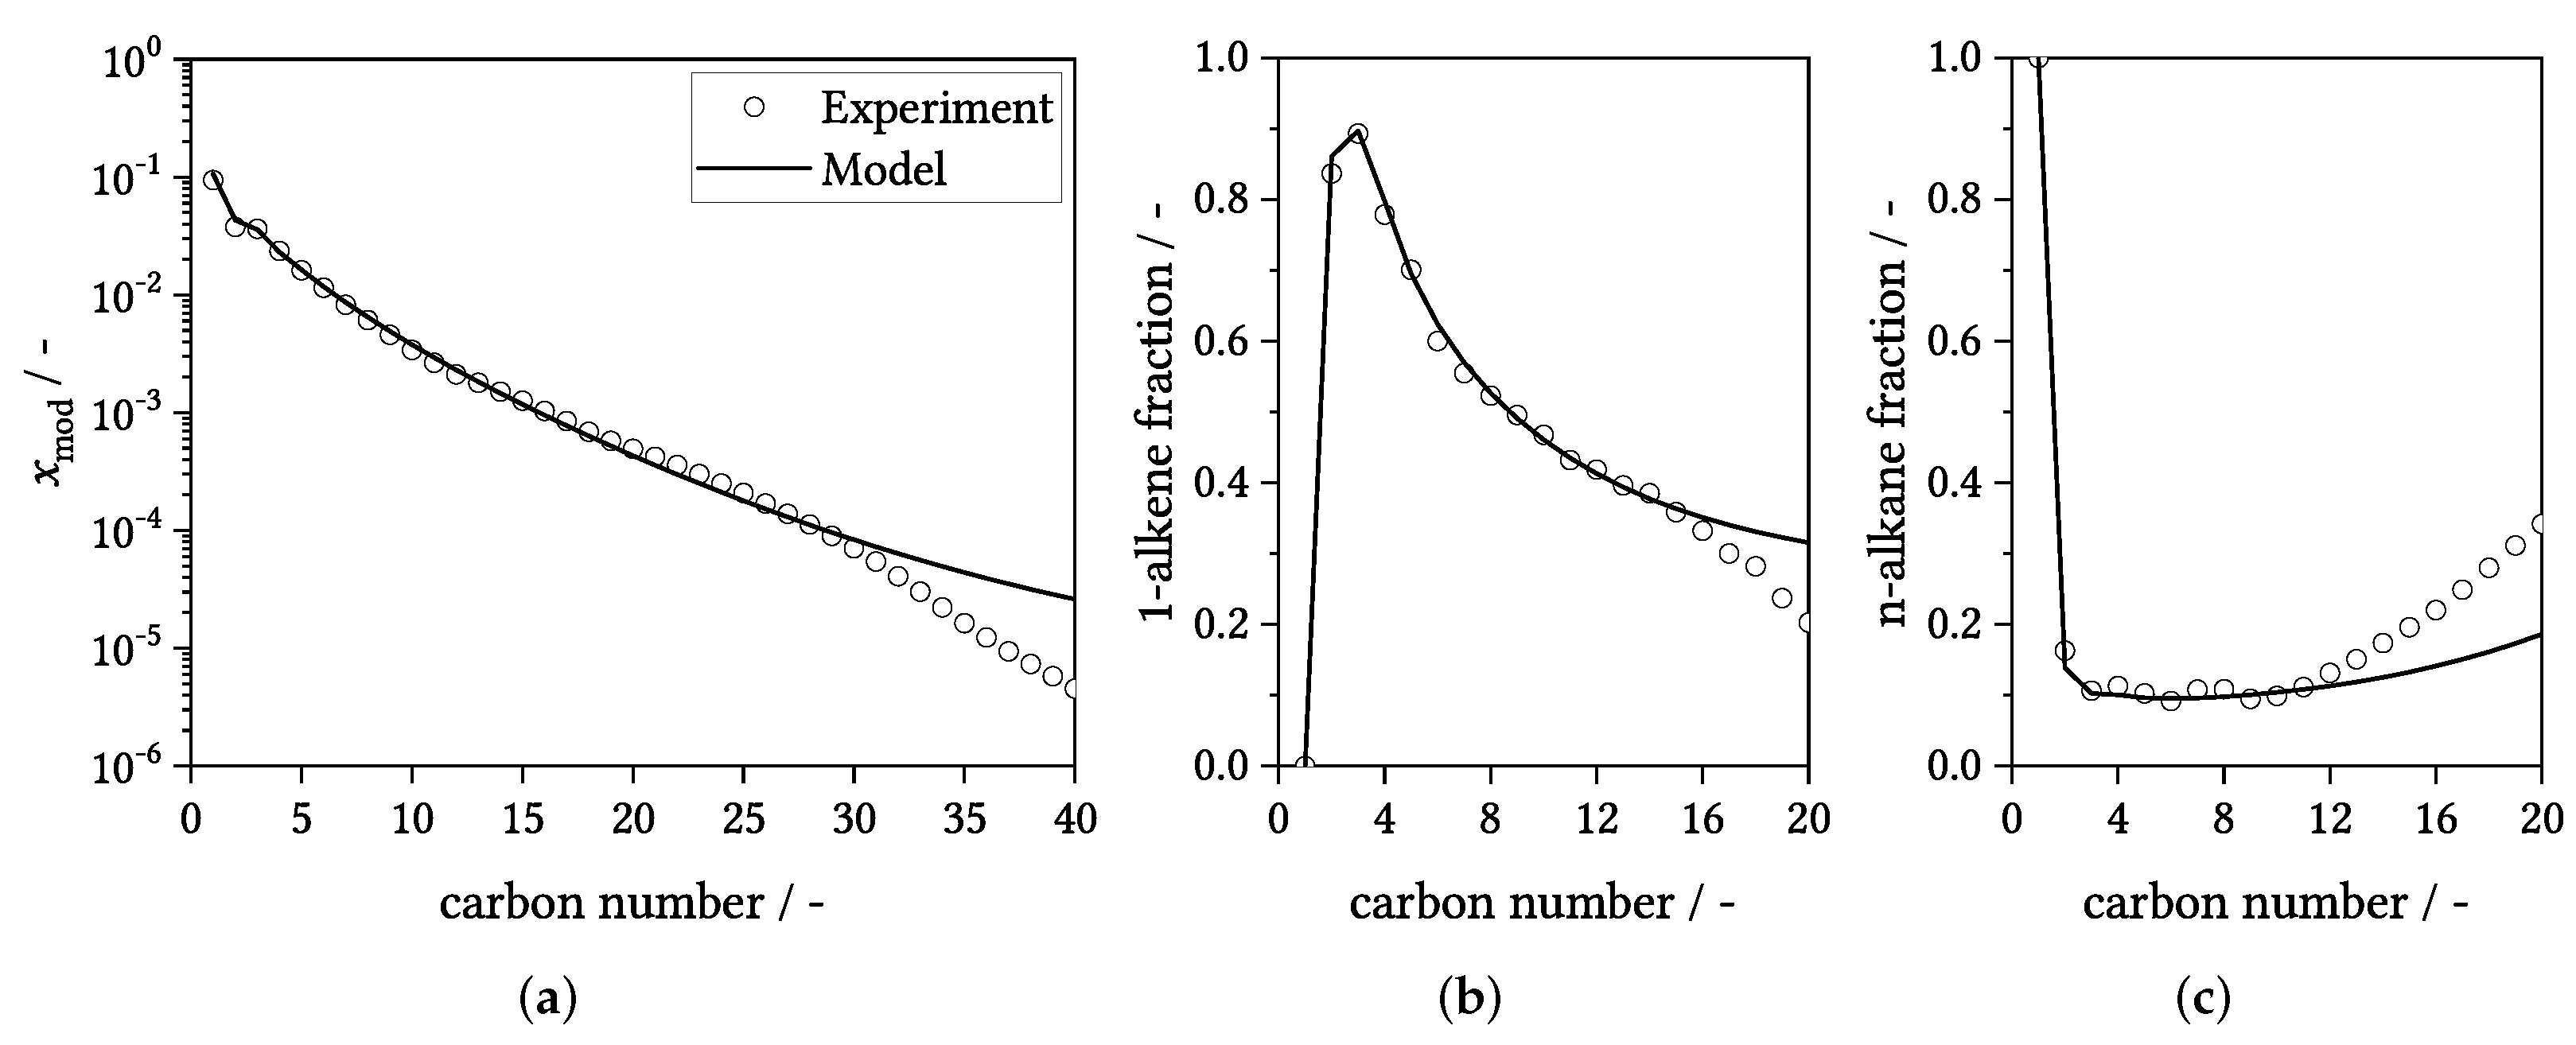
3.1. General Results and Model Details

Results of the presented kinetic model in comparison with experimental data are shown in Figure 2. The product spectrum of the applied Fe/K@ γ - A l 2 O 3 catalyst (see Section 4) is similar to a high temperature FTS process with short-chain 1-alkenes as the main product. More general information regarding the product distribution is provided in our previous publication [14]. The hydrocarbon distribution (a) displays the typically experimentally observed deviations from an ideal ASF distribution: a higher methane selectivity, a lower C 2 selectivity, and a larger fraction of long-chain hydrocarbons (> C 10 ). These features can be well reproduced by our model up to ≈ C 30 for all experiments. Additionally, we observed a rapid decline for > C 30 in the experiments that is not accounted for by the model. This is likely due to problems in obtaining a reliable wax sample from the experiments. The fraction of hydrocarbons with more than 30 carbon atoms is extremely small (<3% on weight basis), and we also observed some accumulation of wax at edges in front of the hot trap in our setup. It is likely that the drained samples were therefore biased.
Figure 2b,c show the fractions of 1-alkenes and n-alkanes within one carbon number. The 1-alkene fraction exhibits a maximum for propene and declines rapidly after that with an inflection point around C 12 . The n-alkane fraction is almost constant up to C 1 0 and starts to increase for longer chains. These experimental results can be well reproduced by the model up to C 12 . The initial rapid decline of the 1-alkene fraction in the model is caused by chain-length-dependent branching while the following decrease is due to the chain-length-dependence of the termination step. When analyzing the absolute flow rates of 1-alkenes and n-alkanes (not shown), it becomes clear that the deviations for > C 12 are caused by the insufficient description of the n-alkane formation rates. We have to note that the chromatographic resolution decreased significantly in this carbon number range, which introduces additional uncertainty for the interpretation. However, we suspect that secondary hydrogenation is the main reason for this trend, which is not accounted for in the model.
We tried implementing a secondary hydrogenation reaction while also accounting for a possible vapor–liquid–equilibrium (VLE), which would cause the predominant hydrogenation of long chains because they have an increased residence time in the reactor. Upon inclusion, a slight improvement for long-chain hydrocarbons could be achieved. However, the inclusion of a sufficiently reliable VLE model (here: Predictive Soave–Redlich–Kwong) increased the computational demand drastically. From our perspective, the additional computational demand in relation to the slight improvement did not justify the extension. The main body of the product spectrum consists of hydrocarbons with up to 10 carbon atoms that can be well described and appear to be mainly controlled by primary formation mechanisms. Additionally, the integral character of the applied tubular reactor makes the analysis very challenging. The experimental results may be the product of several superimposed effects that cannot be easily deconvolved. It appears more reasonable to us to apply a CSTR-type reactor (e.g., a spinning basket reactor) for detailed mechanistic investigations.
Figure 2. Typical results of the detailed kinetic model; (a) modified mole fraction ( x i , mod ) vs. carbon number (ASF plot); (b) 1-alkene fraction vs. carbon number; (c) n-alkan fraction vs. carbon number; data points correspond to experimental values and lines to simulation results; conditions: T = 300 °C, p = 10 bar, ( H 2 / CO 2 ) in = 3, GHSV = 1800 mLN h−1 g−1, catalyst: Fe/K@ γ - A l 2 O 3 .
Catalysts 12 00630 g002
The simulated coverage of the catalyst surface with increasing CO 2 conversion is shown in Figure 3. In our model, the catalyst surface is mainly covered with H 2 , CO 2 , hydroxyl groups, and the chain growth monomer C H 2 . The overall reaction rate is primarily controlled by the hydroxyl surface coverage, which is reflected by the fact that we only had to consider the activation energies for the water adsorption/desorption steps to reproduce the temperature effects on reactant consumption. The surface coverage of adsorbed alkyl species is <0.0001 and was thus omitted in the graph.
In Section 3, we mentioned the necessity to include an empirical damping factor ( Θ Θ O H 1 ) for all termination reactions. The reason for this may be inferred from Figure 3. The monomer surface coverage (CH2*) decreases significantly at high conversions. This leads to a decreasing chain growth rate and would, without the damping factor, subsequently lead to a significantly shorter product. However, this effect was less pronounced in the experiments at high conversions. Such an empirical modification is highly undesirable and may not be necessary when the surface coverage of the FTS sites is separately modeled from the RWGS sites.

3.2. Parameter Estimates
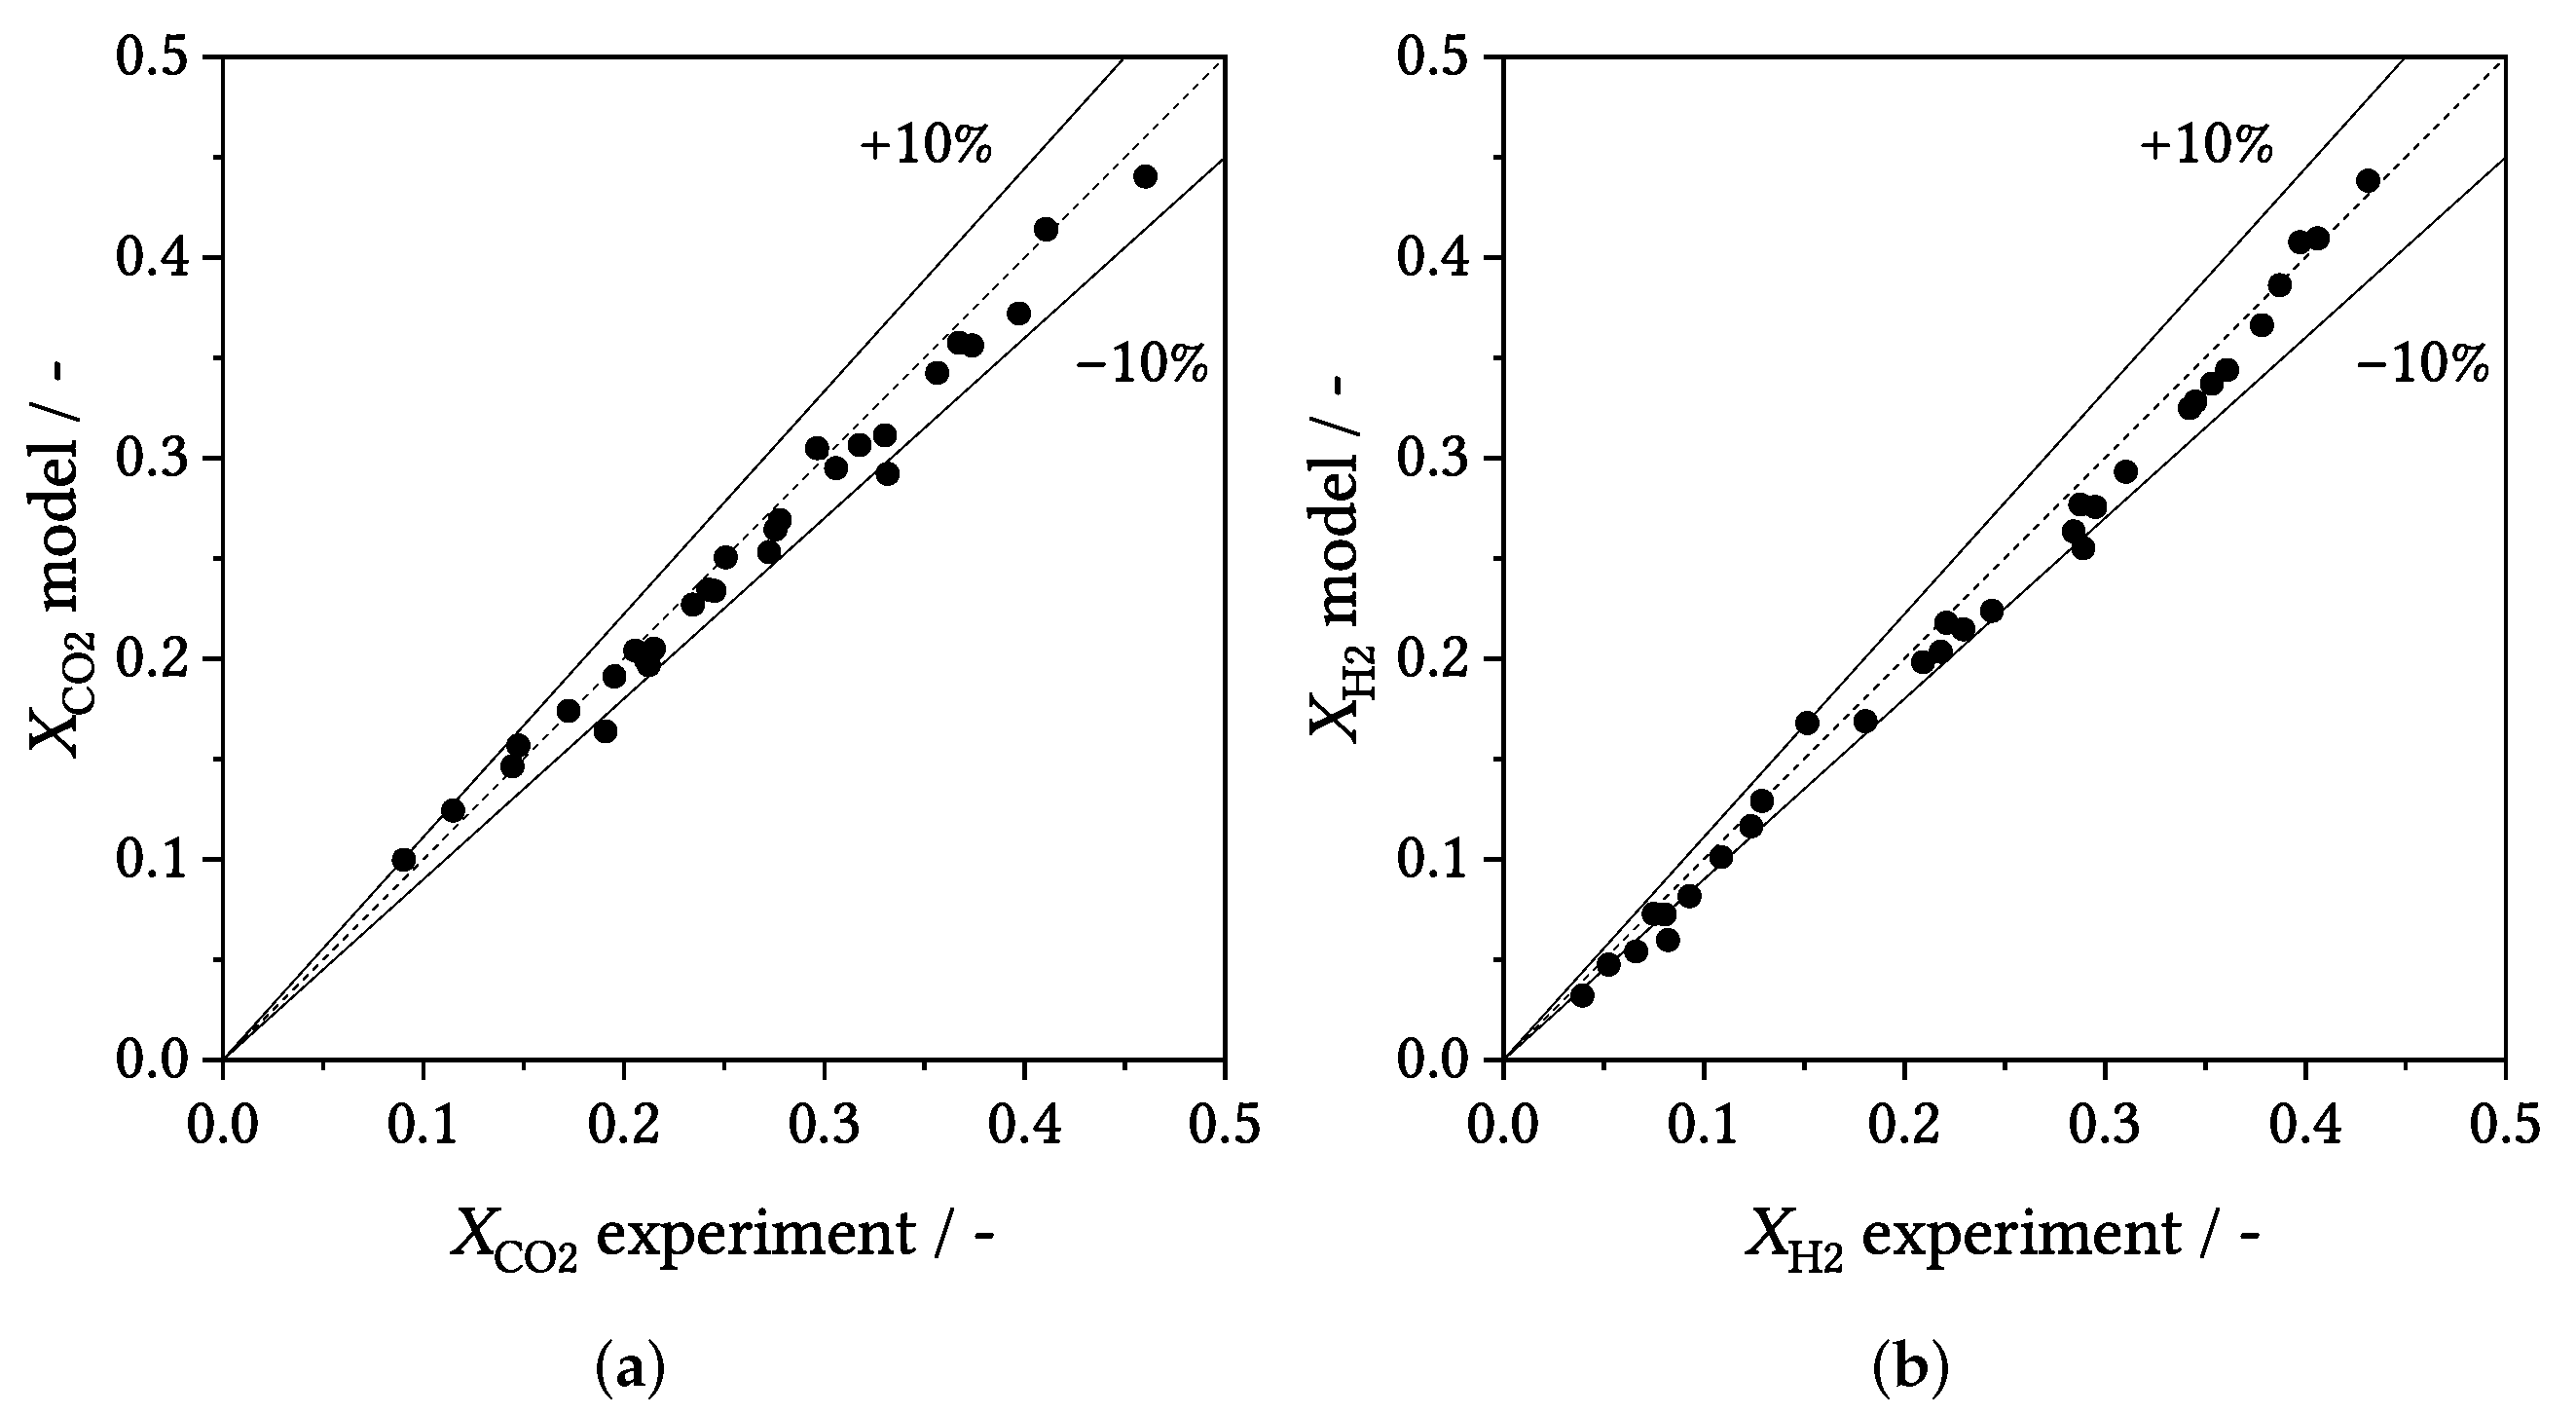
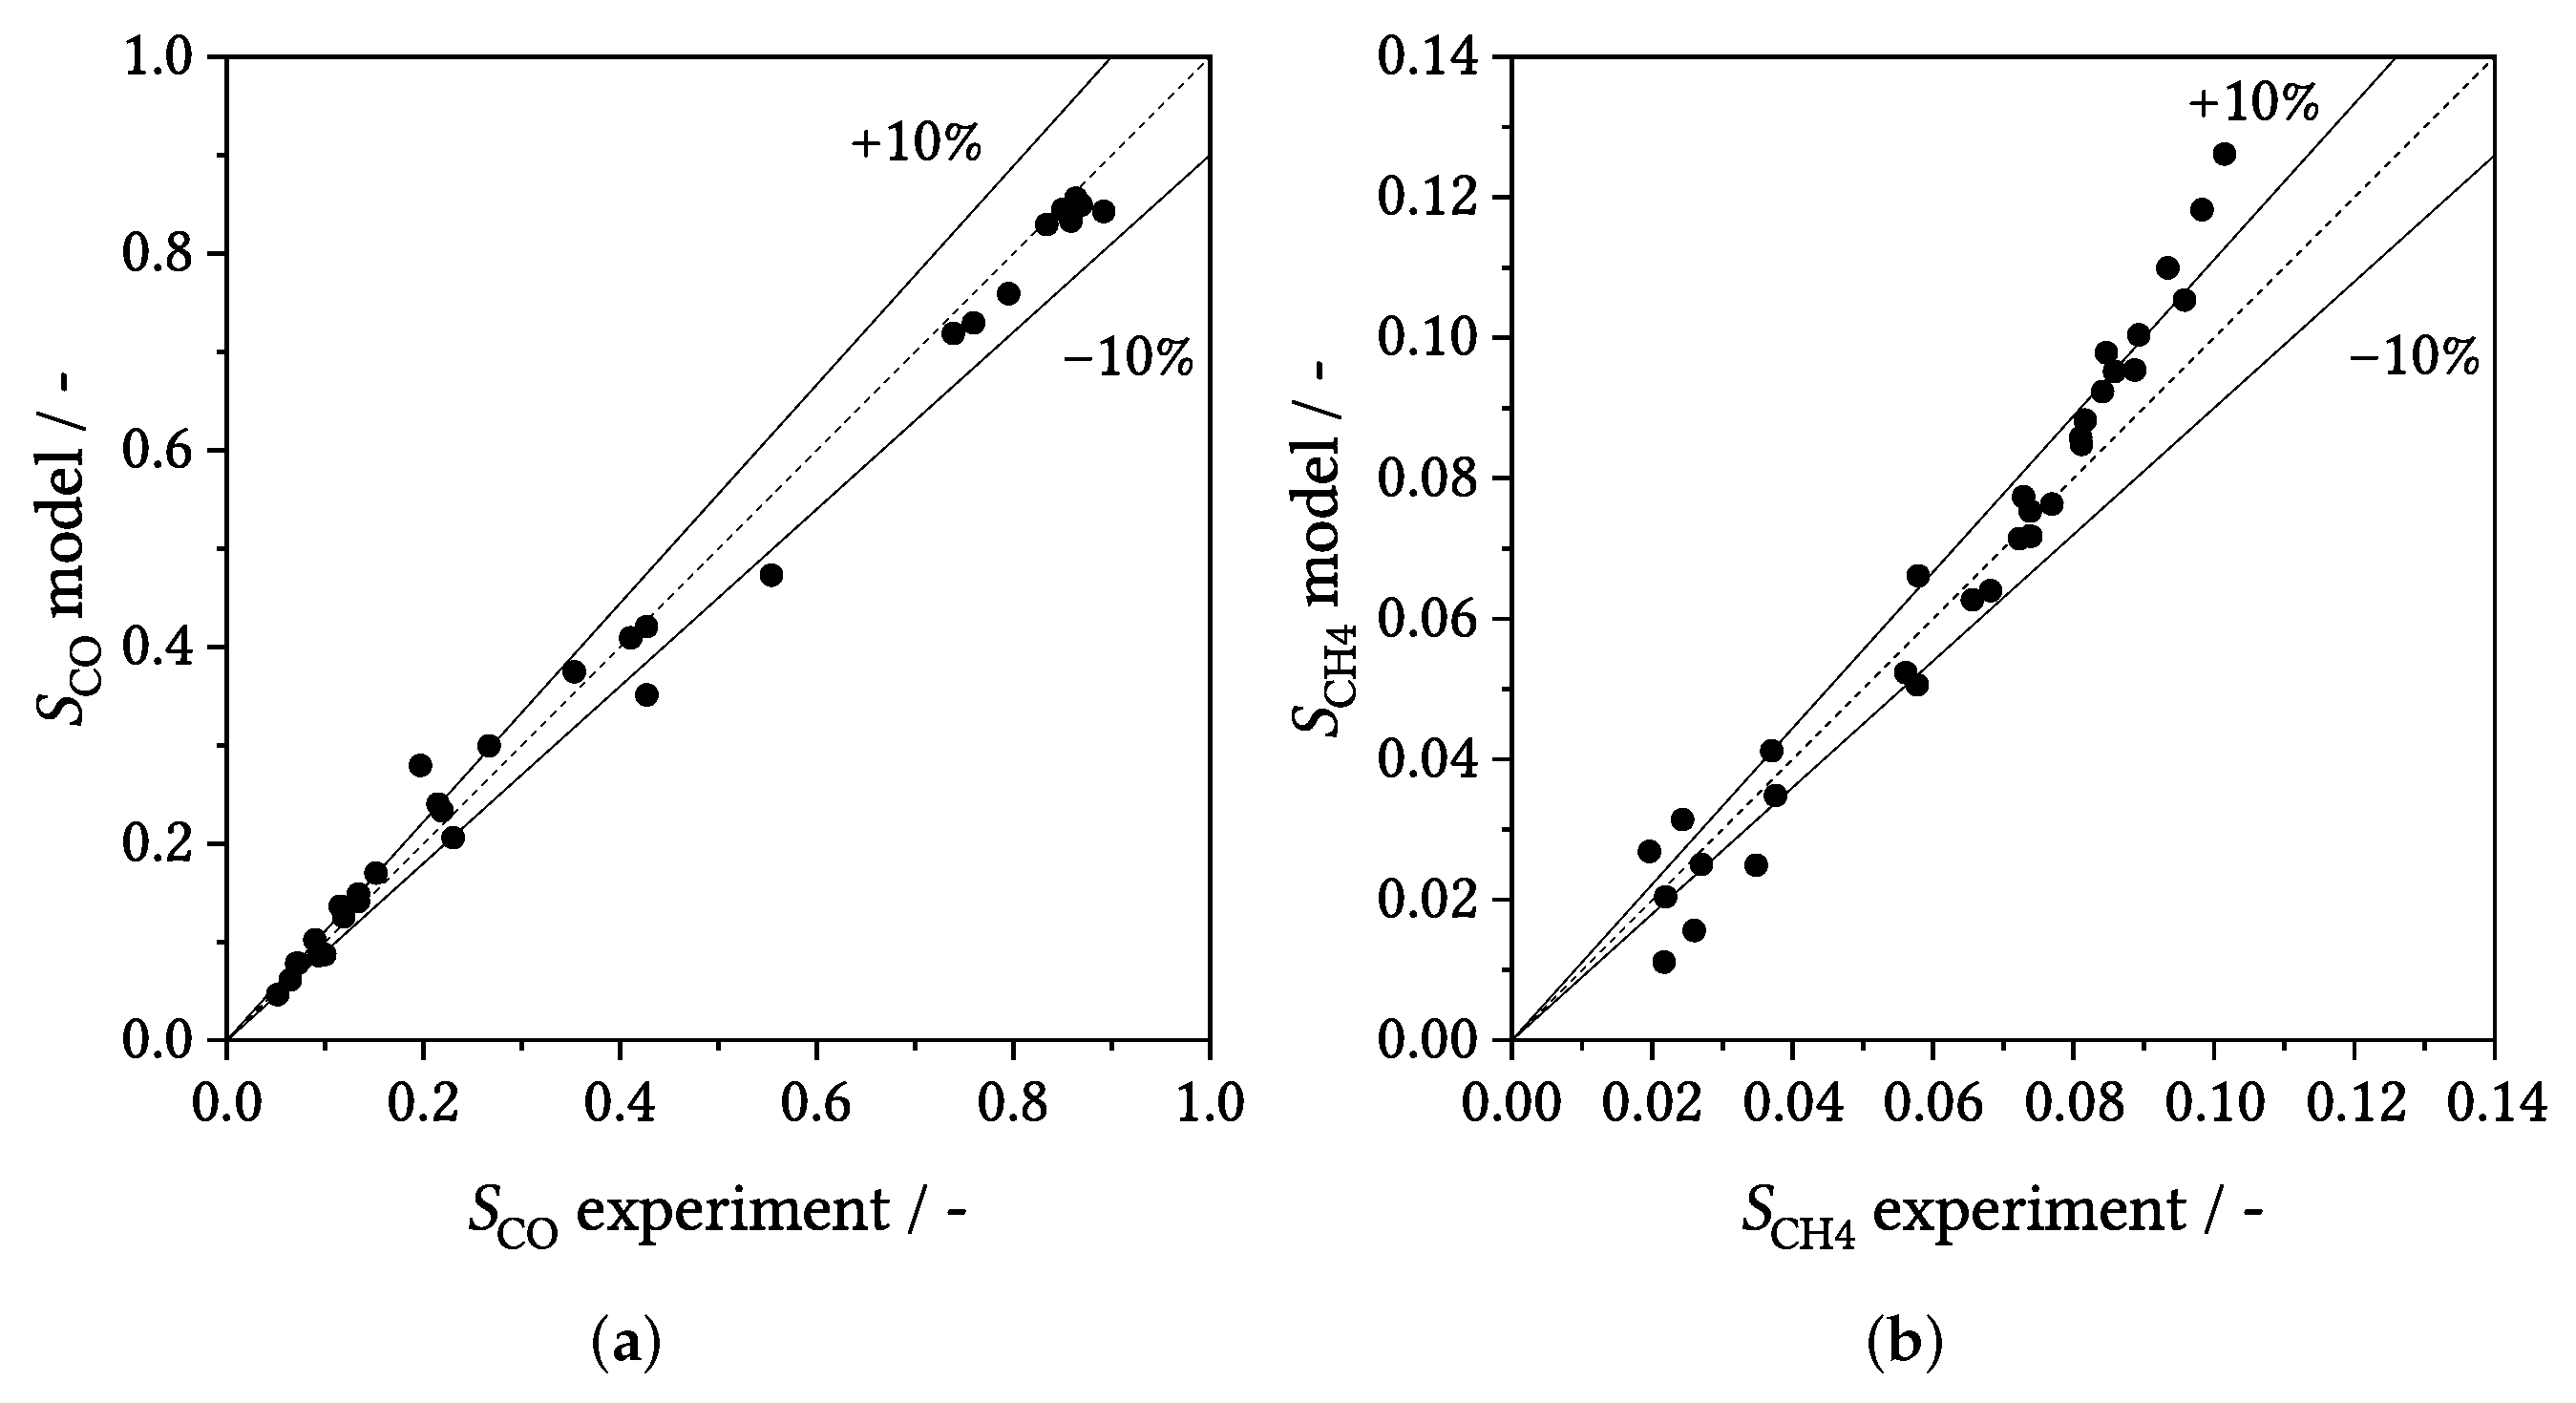
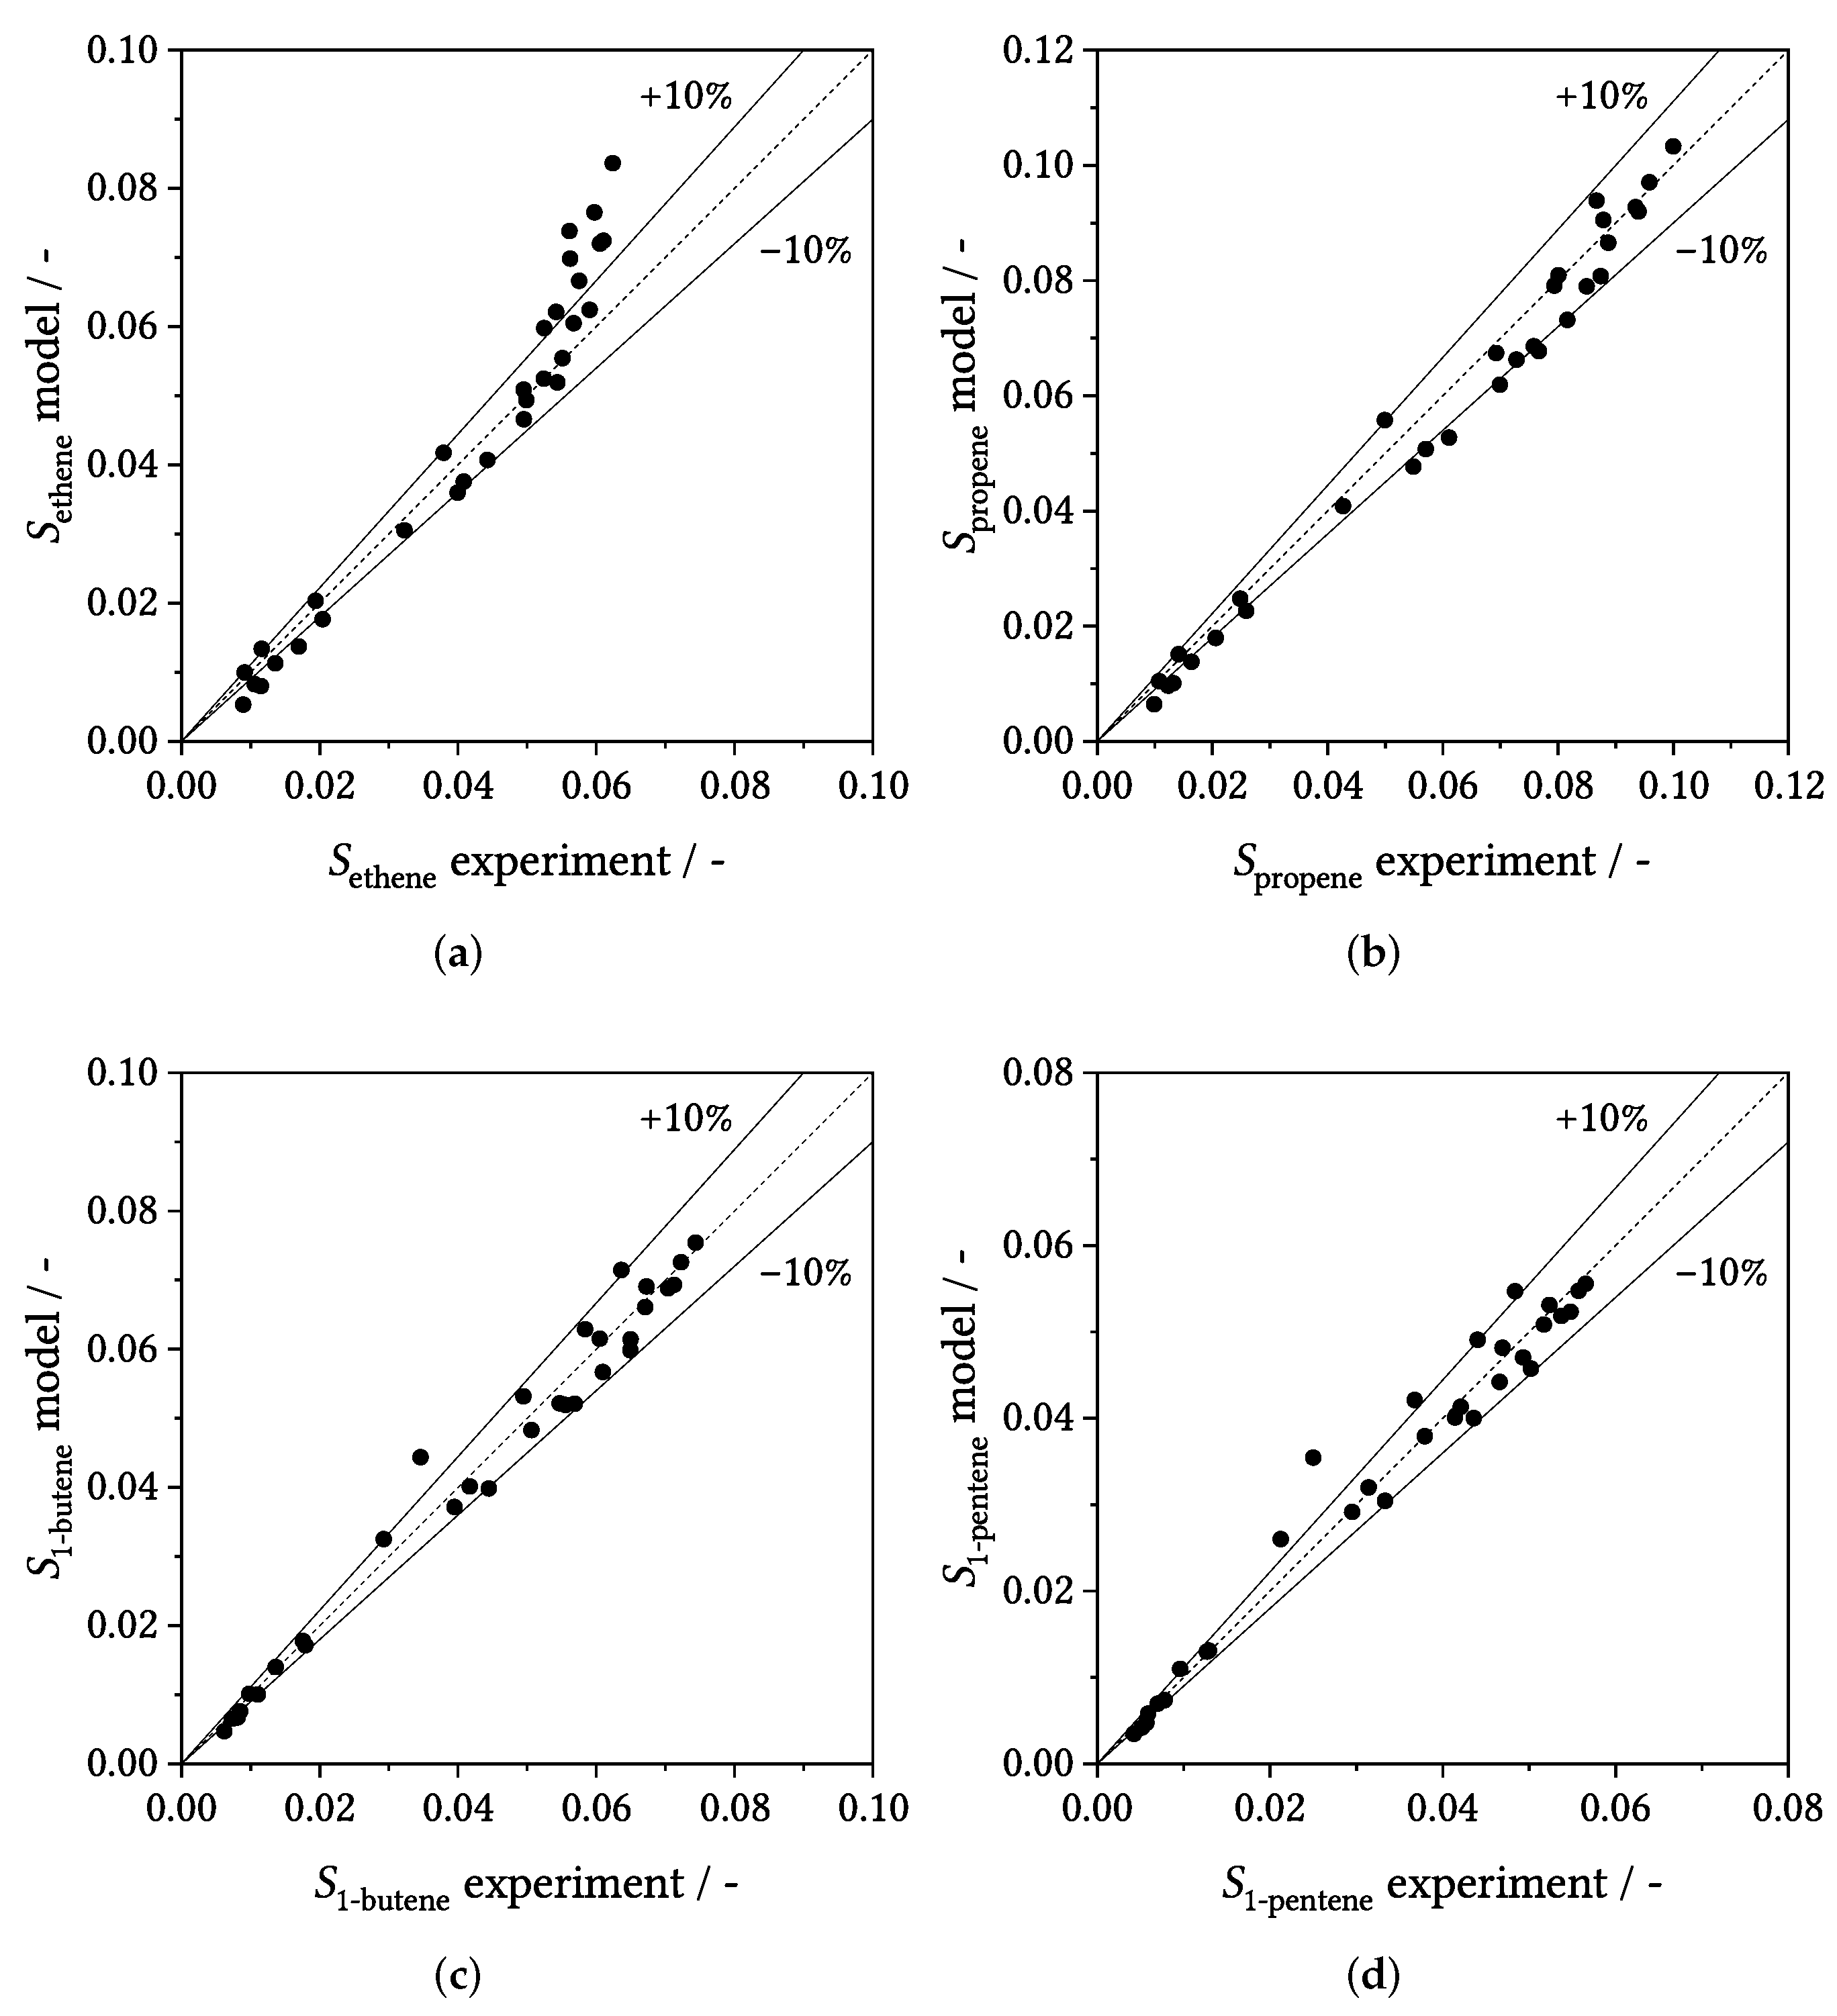
The parameter estimates that were obtained from the applied regression approach are given in Table 4. We have to point out that we cannot provide a meaningful statistical analysis of the parameter uncertainty here as several necessary assumptions are not fulfilled [47] (e.g., uncorrelated responses or random and normally distributed residuals). Thus, we do not report individual confidence intervals for the parameters here (as they would be meaningless).

3.3. Parity Plots

The parity plots for C O 2 and H 2 conversion are given in Figure 4. Overall, a good agreement could be achieved between the experiments and simulation results. The average relative error of the conversions were 5% and 7% for CO 2 and H 2 , respectively. This is a good result compared to other detailed FTS models [27,28,48]. In our previously published macrokinetic model [14] (which was developed upon the same experimental data), however, we could achieve a maximum relative deviation of 5% for the CO 2 conversion. Thus, when a precise reproduction of the reactant consumption is necessary, a simple macrokinetic model may be preferred.
The parity plots for CO and CH 4 selectivity are given in Figure 5. The model can reproduce the CO selectivity with a relative error of 9% and CH 4 with a relative error of 14%. For CH 4 , there seems to be a systematic error in the model for high values. This error might be caused by an insufficient description of the methane formation reaction. From our point of view, though, it is more likely that this problem is caused by the assumption of identical catalyst sites for all reactions, which also urged us to implement the damping factor.
The parity plots for the selectivities to ethene, propene, 1-butene and 1-pentene are given in Figure 6. Short-chain 1-alkenes are the main products of the reaction and need to be well reproduced by the model. The average relative deviations were 14%, 9%, 7% and 8% for ethene, propene, 1-butene and 1-pentene, respectively. For ethene, there seems to be a similar problem as for CH 4 , which indicates a systematic problem within the model for high values. The experimental data suggest some secondary hydrogenation of ethene which is not implemented in the model. This may explain the deviation partly. For propene, 1-butene and 1-pentene, no systematic error can be observed from the parity plots and most data points are within the 10% parity lines.
It is noteworthy that the model does not predict a CO selectivity of 1 for X CO 2 0 . Riedel et al. [9] also observed this in their experiments. To account for this, they introduced a direct formation pathway for hydrocarbons from CO 2 in their kinetic model. In the detailed model, however, the catalyst surface is already covered with alkyl-species at the reactor entrance at steady state. Thus, hydrocarbons can be directly formed for X CO 2 0 . Additionally, the model does not contain any information of the RWGS equilibrium, which strongly influences the reaction [14]. The detailed model implicitly contains this information through the ratios of the equilibrium/kinetic parameters of the adsorption steps of H 2 , CO 2 , CO and H 2 O .
Figure 4. Parity plots for (a) CO 2 conversion ( X C O 2 ) and (b) H 2 conversion ( X H 2 ) with 10% relative deviation lines.
Catalysts 12 00630 g004
Figure 5. Parity plots for (a) CO selectivity ( S C O ) and (b) C H 4 selectivity ( S C H 4 ) with 10% relative deviation lines.
Catalysts 12 00630 g005
Figure 6. Parity plots for (a) ethene selectivity ( S ethene ), (b) propene selectivity ( S propene ), (c) 1-butene selectivity ( S 1 - butene ) and (d) 1-pentene selectivity ( S 1 - pentene ) with 10% relative deviation lines.
Catalysts 12 00630 g006

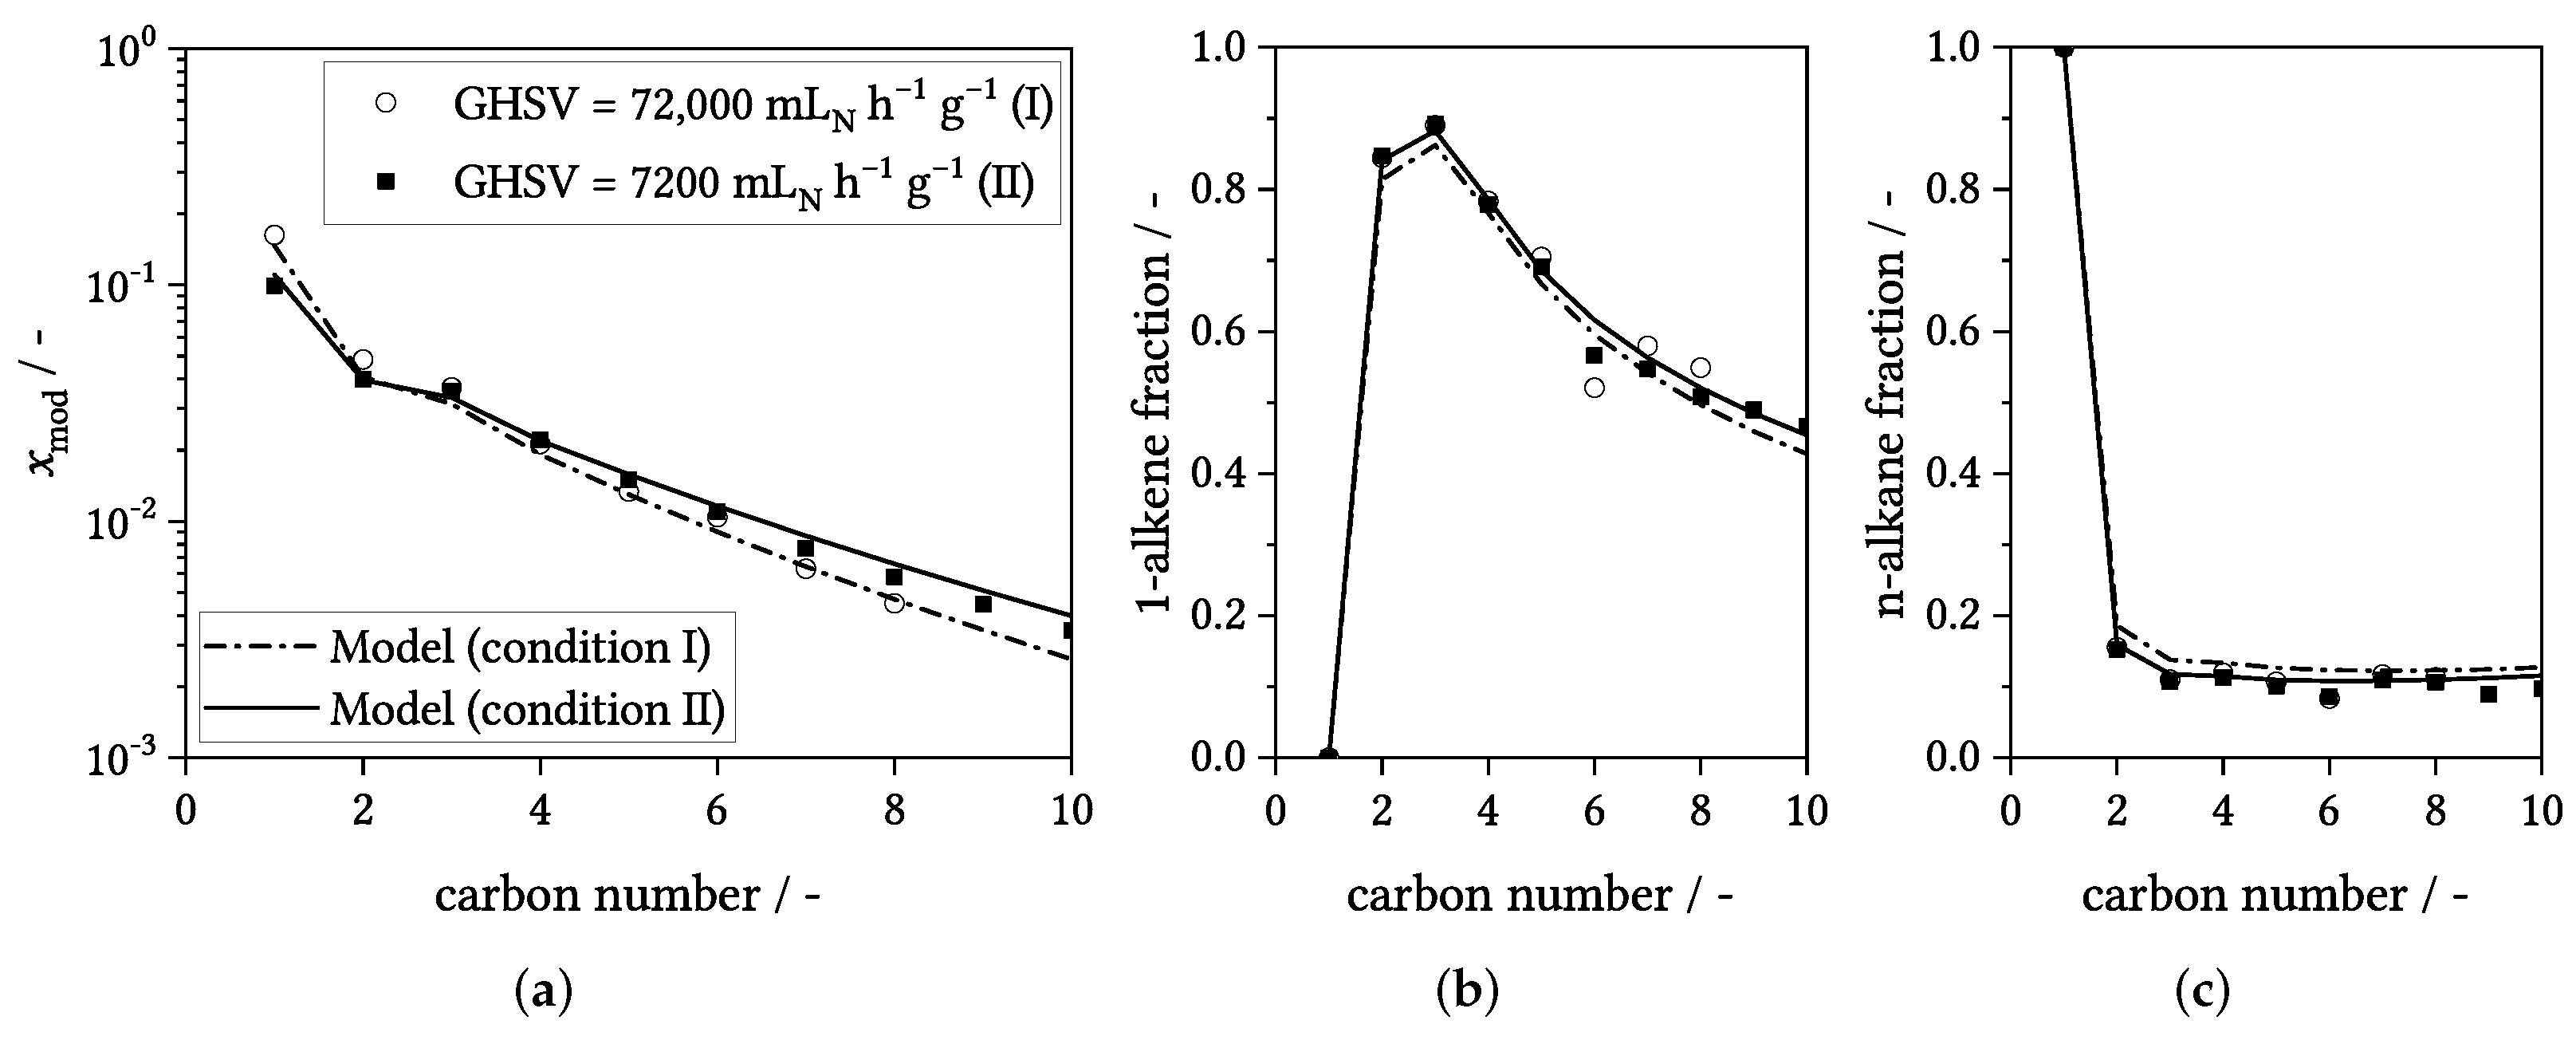
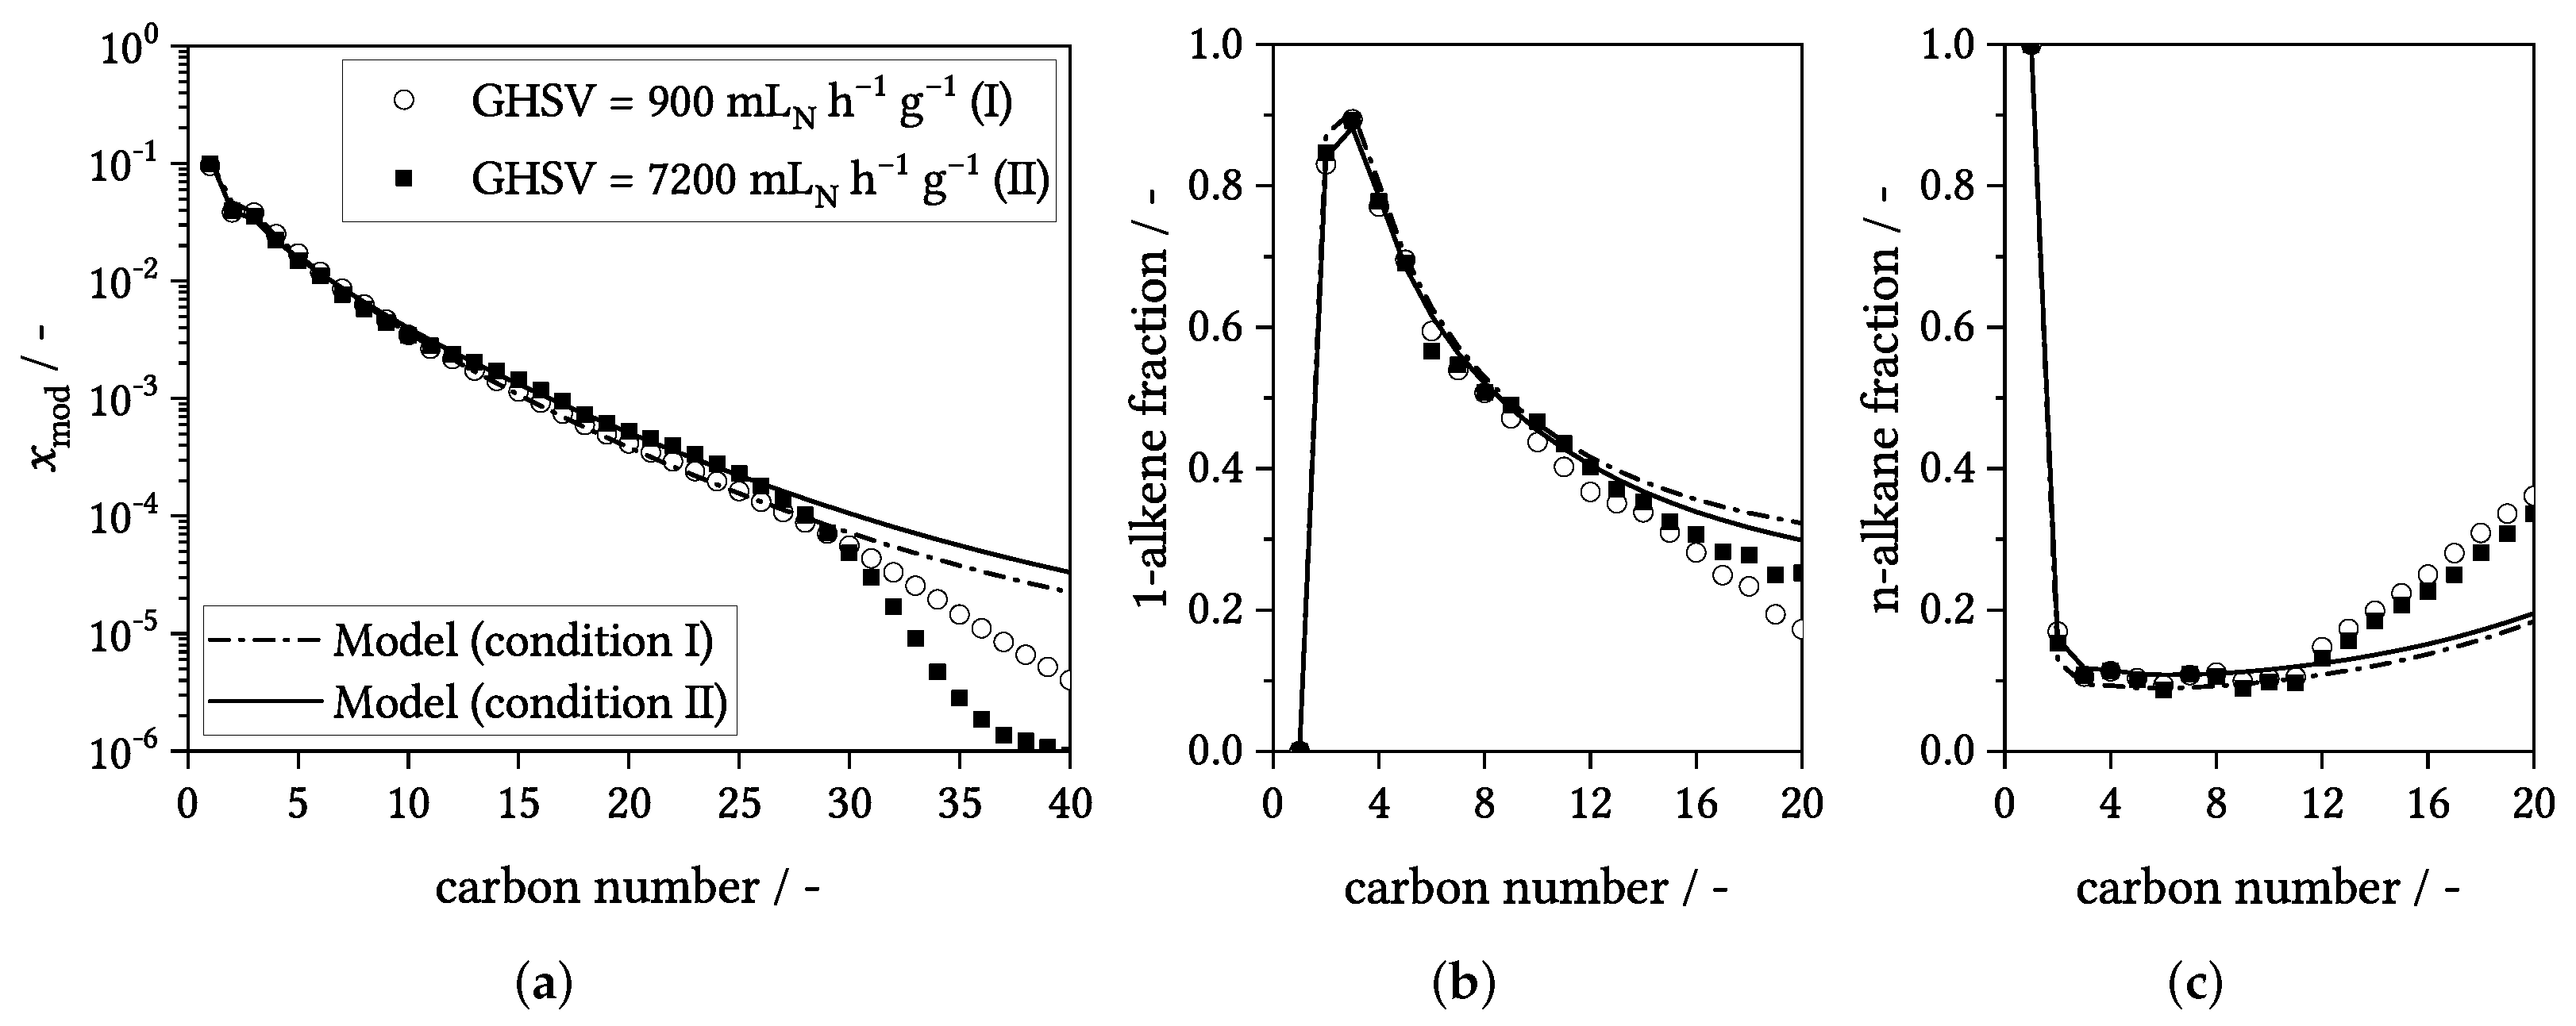
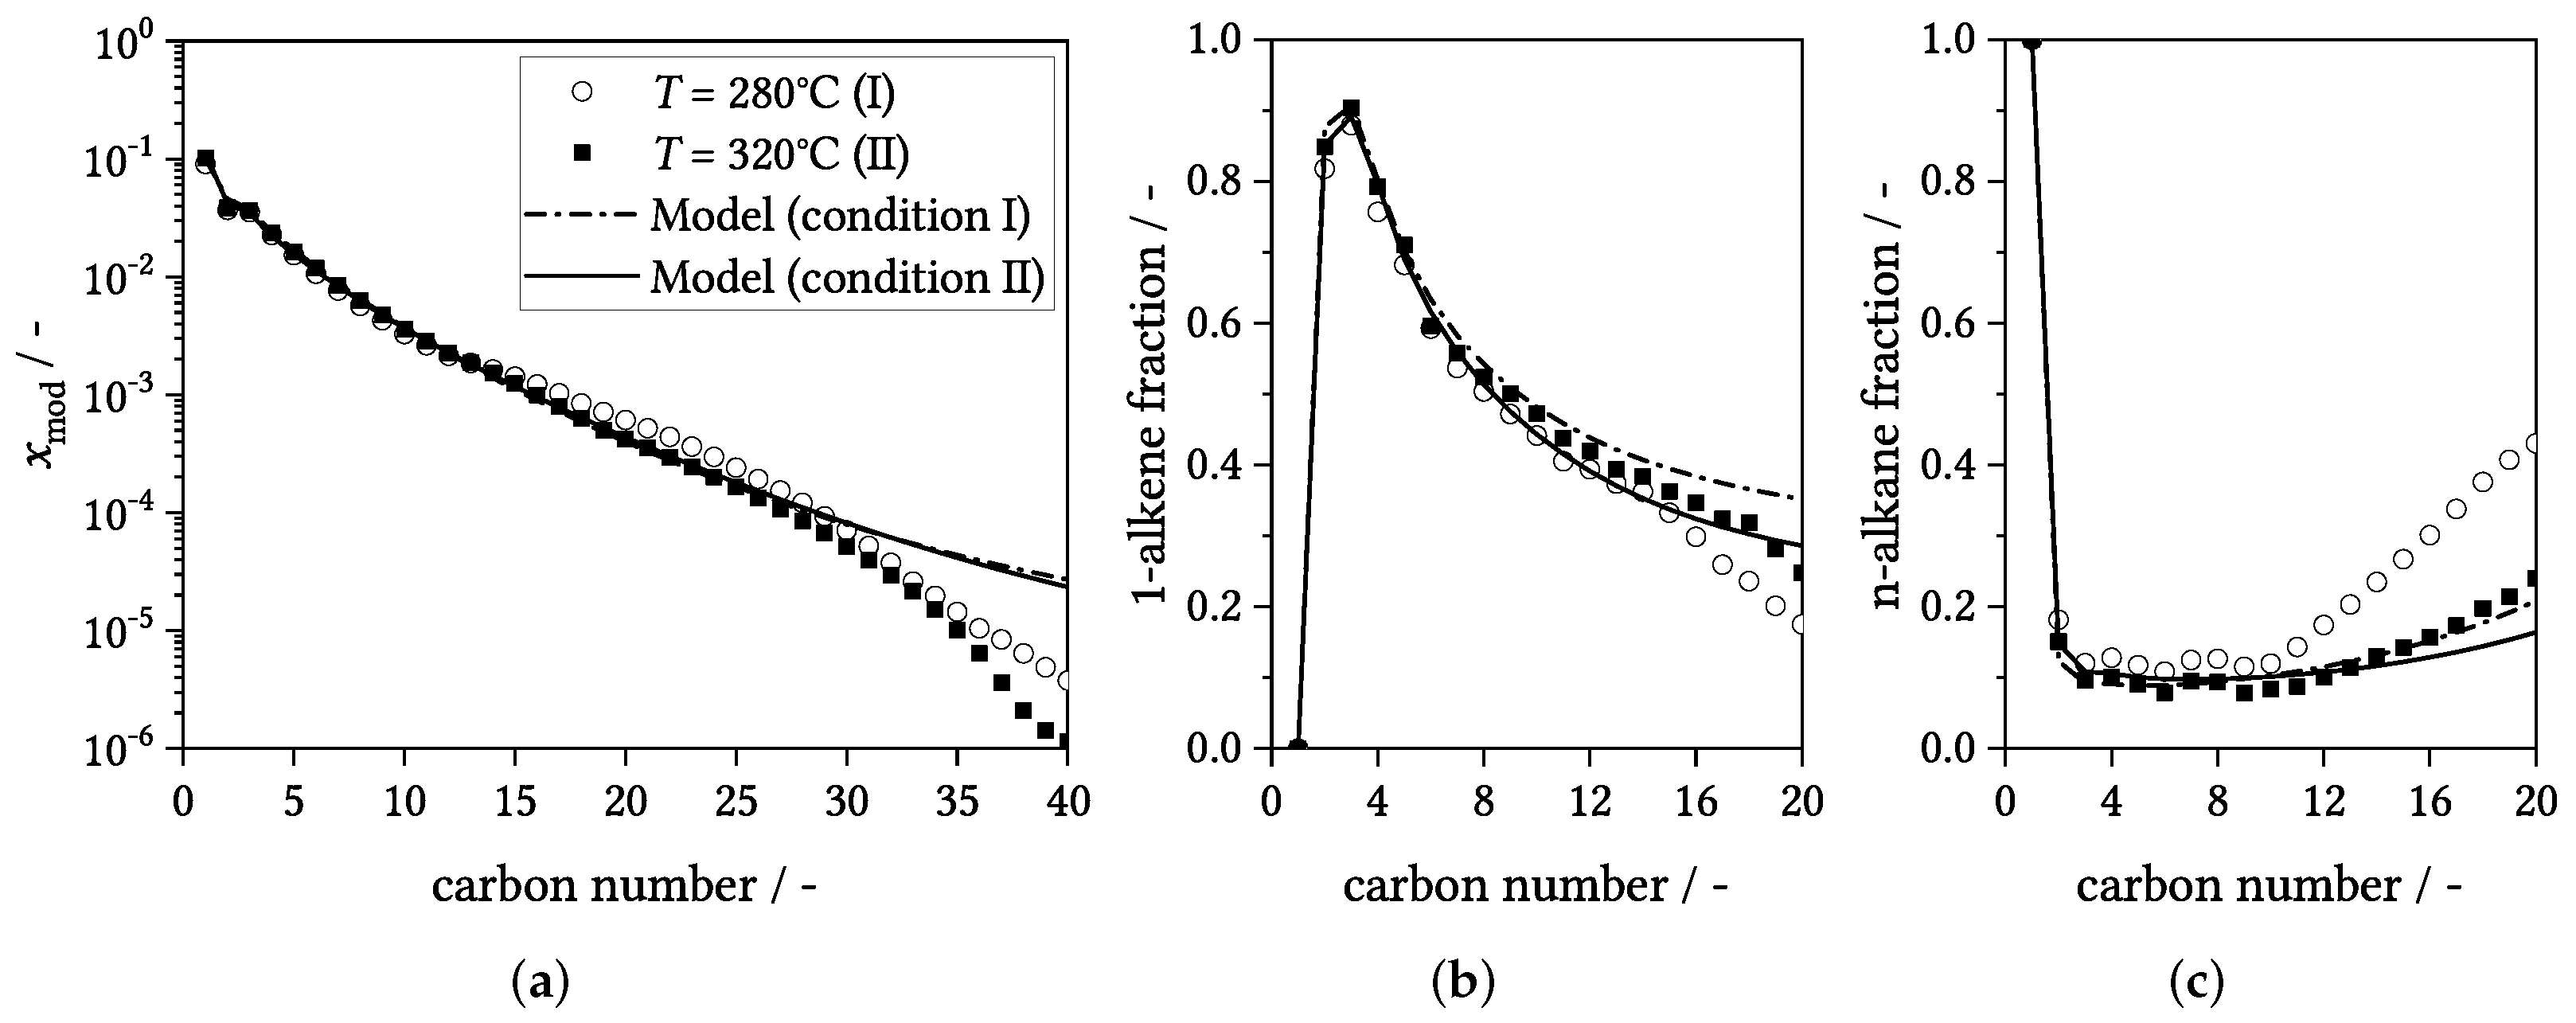
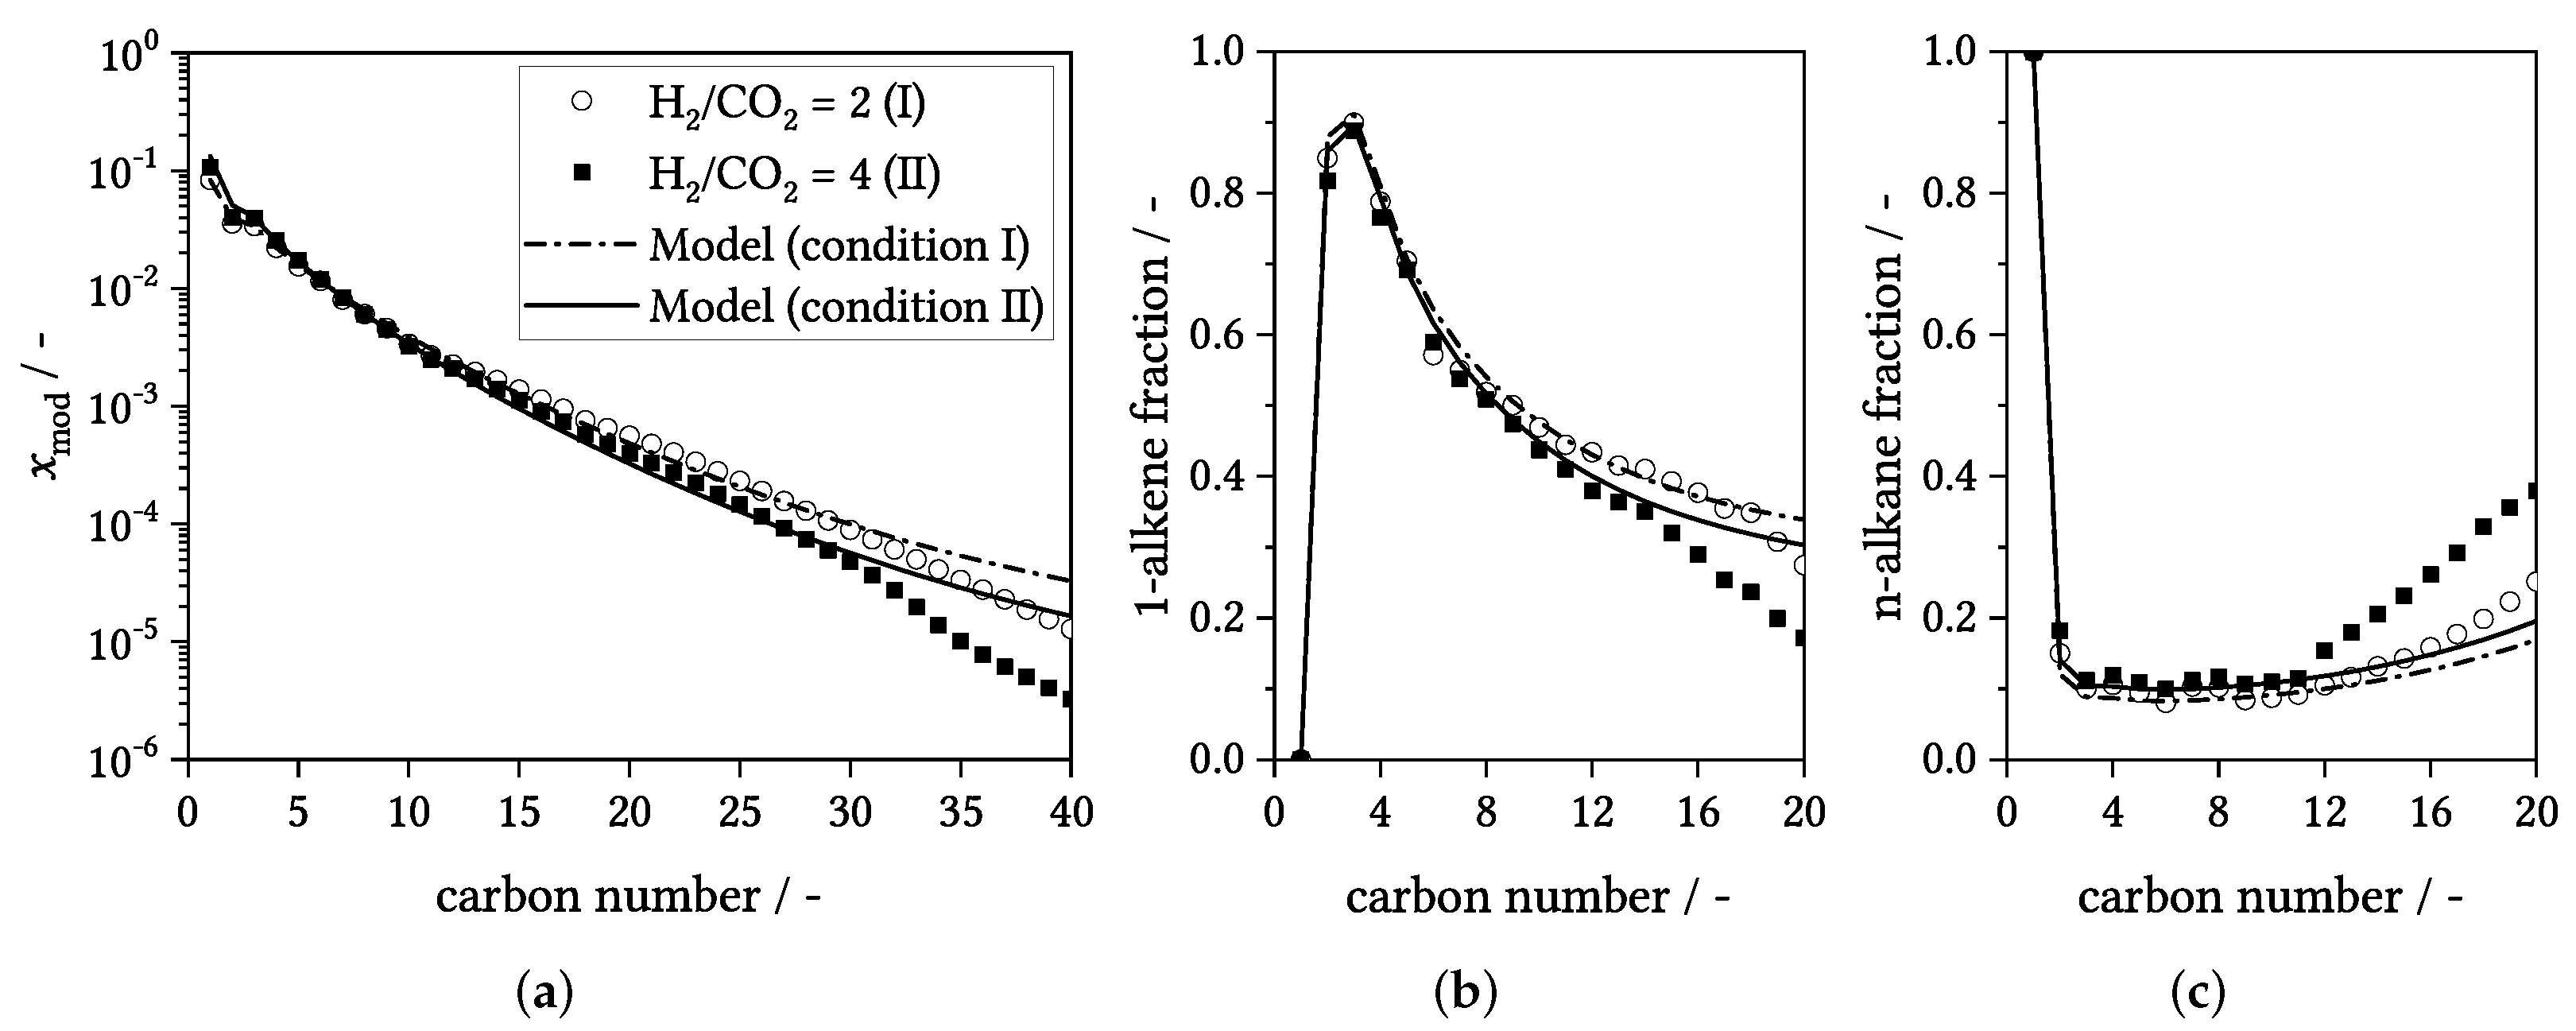
3.4. Influence of Process Conditions on Product Distribution

The influence of process conditions (GHSV, T, H 2 / CO 2 ) on the experimental product distribution in comparison to simulation results is shown in Figure 7, Figure 8, Figure 9 and Figure 10.
The space velocity (or rather conversion) has a contradictory effect. At high space velocities, the average chain length increases with an increasing residence time (see Figure 7, note that we could not experimentally extract a wax sample for high space velocities). At low space velocities, though, the average chain length decreases with an increasing residence time (see Figure 8). This effect is likely the result of strongly varying CO partial pressures (and thus chain growth monomer concentrations, see Figure 3). CO 2 -FTS is a consecutive reaction of RWGS and FTS. At high space velocities, the CO partial pressure is low as the formation is kinetically limited by the RWGS. The CO partial pressure exhibits a maximum and decreases afterwards due to equilibrium constraints of the RWGS [14]. This also leads to a maximum for the average chain length. However, for relevant conversion levels ( X CO 2 > 25%), the effect is not very pronounced. For a tubular reactor, the output is always an integral composition of the whole length, which smooths local differences. In a CSTR type reactor, this effect could be likely larger. The 1-alkene and n-alkane fractions seem to be unaffected by the space velocity. Both observations can be well reproduced by the model.
For the temperature and inlet reactant ratio, slight trends could be observed. To avoid a bias due to residence time (or rather conversion) effects, the influence of these parameters are compared at similar conversion levels of the experiments. The temperature influence is exemplary shown at a CO 2 conversion of ≈36% and for the inlet reactant ratio it is shown at a H 2 conversion level of ≈38% (the CO 2 conversion differs significantly upon varying the H 2 / CO 2 ratio).
Figure 7. Comparison of model results with experimental data for different space velocities: (a) modified mole fraction ( x i , mod ) vs. carbon number (ASF plot); (b) 1-alkene fraction vs. carbon number; (c) n-alkane fraction vs. carbon number; data points correspond to experimental values and lines to simulation results; conditions: T = 300 °C, p = 10 bar, ( H 2 / CO 2 ) in = 3, (I) GHSV = 72,000 mLN h−1 g−1 ( X C O 2 = 17%), (II) GHSV = 7200 mLN h−1 g−1 ( X C O 2 = 27%), catalyst: Fe/K@ γ - A l 2 O 3 .
Catalysts 12 00630 g007
Figure 8. Comparison of model results with experimental data for different space velocities: (a) modified mole fraction ( x i , mod ) vs. carbon number (ASF plot); (b) 1-alkene fraction vs. carbon number; (c) n-alkane fraction vs. carbon number; data points correspond to experimental values and lines to simulation results; conditions: T = 300 °C, p = 10 bar, ( H 2 / CO 2 ) in = 3, (I) GHSV = 900 mLN h−1 g−1 ( X C O 2 = 41%), (II) GHSV = 7200 mLN h−1 g−1 ( X C O 2 = 27%), catalyst: Fe/K@ γ - A l 2 O 3 .
Catalysts 12 00630 g008
A lower temperature led to a slightly lower 1-alkene fraction and a slight increase of the average carbon number (see Figure 9). The model is not able to reproduce these effects properly. It has to be emphasized, though, that the temperature influence is little more than a slight trend. Within the experimental range studied, the model will still provide a reasonable prediction of the product distribution. However, we are aware of the unfavorable numeric structure of the applied Arrhenius expression (Equation (2)) and the awkward coupling of the termination reactions with the hydroxyl surface coverage, which is highly temperature dependent (see Section 3.1). Future model developments explicitly need to address these points.
For a higher H 2 / CO 2 inlet ratio, a lighter product and a lower 1-alkene fraction were observed (see Figure 10). A higher H 2 partial pressure leads to a more hydrogenated and shorter product as chain termination via hydrogenation is favored. In this case, the model correctly reproduces the experimental trends. However, considering the relatively drastic increase of H 2 / CO 2 from 2 to 4, the changes in the product distribution were rather marginal.
In general, the product distribution was only moderately affected within the range of conditions studied and the model can provide a reasonable estimate of the distribution within this range. The deviations for > C 12 of the individual hydrocarbon classes as well as the implementation of the temperature dependencies leave room for further improvements. The observed trends are in agreement with literature for the classic CO-based FTS [49,50]. It is known that the product spectrum of Fe based FTS catalysts is only moderately sensitive to changes in process conditions [49,51]. It is thus not surprising that the same is also observed for the conditions of CO 2 -FTS. Analogue results have been reported by Panzone et al. [13] for a similar catalyst.
Figure 9. Comparison of model results with experimental data for different temperatures at X CO 2 36%: (a) modified mole fraction ( x i , mod ) vs. carbon number (ASF plot); (b) 1-alkene fraction vs. carbon number; (c) n-alkane fraction vs. carbon number; data points correspond to experimental values and lines to simulation results; conditions: p = 10 bar, ( H 2 / CO 2 ) in = 3, (I) T = 280 °C, GHSV = 900 mLN h−1 g−1 (II) T = 320 °C, GHSV = 3600 mLN h−1 g−1, catalyst: Fe/K@ γ - A l 2 O 3 .
Catalysts 12 00630 g009
Figure 10. Comparison of model results with experimental data for different H 2 / CO 2 inlet ratios at X H 2 38%: (a) modified mole fraction ( x i , mod ) vs. carbon number (ASF plot); (b) 1-alkene fraction vs. carbon number; (c) n-alkane fraction vs. carbon number; data points correspond to experimental values and lines to simulation results; conditions: T = 300 °C, p = 10 bar, (I) ( H 2 / CO 2 ) in = 2, GHSV = 1800 mLN h−1 g−1, (II) ( H 2 / CO 2 ) in = 4, GHSV = 900 mLN h−1 g−1, catalyst: Fe/K@ γ - A l 2 O 3 .
Catalysts 12 00630 g010

4. Experimental

4.1. Kinetic Experiments and Product Analysis

Detailed descriptions of the kinetic experiments, the catalyst preparation, and the product analysis are provided in the Supporting Information and have also been published in a previous work [14]. Here, only a short summary of the applied procedures is provided.
Kinetic experiments were conducted in a lab-scale tubular reactor with 0.5   g or 2 g of an in-house prepared potassium doped alumina supported iron catalyst (Fe/K@ γ - A l 2 O 3 , mass ratio: 15/5.25/100), diluted with silicon carbide. Fe/K@ γ - A l 2 O 3 was first proposed by Choi et al. [52] and was chosen as a model catalyst because of its proven applicability for CO 2 -FTS. The catalyst was activated in-situ with a combined reduction/carburization method, adapted from Landau et al. [53]. In total, 31 different experimental conditions were investigated in the following ranges: p = 10 bar, T = 280–320 °C, GHSV = 900–120,000 mLN h−1 g−1 and H 2 / CO 2 molar inlet ratios of 2–4 (see Table S3). The product distribution was determined via GC-FID analysis of the obtained gas and wax phases. For experiments with a GHSV ≥ 12,000 mLN h−1 g−1 (12 out of 31), we did not obtain a wax sample and only considered the gas analysis up to C 8 . Due to the complexity of the obtained product spectrum with several hundred different species, we only allocated 1-alkenes and n-alkanes. All other hydrocarbons with the same carbon number were lumped into the group other, which mainly consisted of iso-alkenes (additionally linear alkenes with internal double bond, iso-alkanes, aromatic components, cyclo-alkanes and oxygenates). These species were modeled as single methyl-branched iso-alkenes. It has to be pronounced that short-chain oxygenates could not be measured and are thus not included in the product spectrum.

4.2. Data Analysis and Definitions

Space velocities are given with respect to catalyst mass m cat as the gas hourly space velocity (GHSV) of the inlet volumetric flow rate V ˙ in , N at normal conditions ( 0 °C and 1 atm).
GHSV = V ˙ in , N m cat
The conversion X of species i is given as the relative amount of converted reactants, where n ˙ i denotes the molar flow rate of reactant i:
X i = n ˙ i , in n ˙ i , out n ˙ i , in
The selectivitiy S of species i is given on a carbon basis (molar flow rate of species multiplied with its carbon number n i ) with respect to the converted amount of carbon dioxide:
S i = n ˙ i , out n i n ˙ CO 2 , in n ˙ CO 2 , out
For the ASF plots (usually logarithmic mole fraction vs. carbon number), we adopted a modified calculation approach. To facilitate the comparison of different experiments, as well as experimental and simulation results, we normalized the molar hydrocarbon flow rates with the amount of carbon that has been converted to hydrocarbons instead of the sum of all hydrocarbons. This measure is referred to as the modified mole fraction x i , mod and is calculated as follows:
x i , mod = n ˙ i , out n ˙ CO 2 , in n ˙ CO 2 , out n ˙ CO , out

5. Conclusions and Outlook

A detailed kinetic model for CO 2 -FTS on a supported iron catalyst was developed. It is based on a direct CO 2 dissociation mechanism for the RWGS step and the alkyl mechanism with H-assisted CO dissociation and chain-length-dependent kinetic parameters for the FTS step. The model allows a reliable prediction of the reactant consumption, the overall hydrocarbon distribution, and the fractions of hydrocarbons groups (1-alkenes, n-alkanes, and iso-alkenes) up to C 12 within the experimental range studied. However, the model suffers from the assumption of identical catalyst sites for the RWGS and FTS. This led to the inclusion of an empirical damping factor, which should be avoided in further development steps.
Further model improvements may be the inclusion of oxygenates and secondary hydrogenation reactions. Our currently available experimental data does not allow this though. The application of a PFR type reactor for the kinetic experiments may not have been an optimal choice. The integral character leads to the superposition of different reaction conditions that can hardly be deconvolved for mechanistic conclusions. It is desirable to conduct more detailed mechanistic investigations in a CSTR-type reactor (e.g., a spinning basket reactor), especially regarding the secondary hydrogenation of 1-alkenes.
The complexity of the model makes it probably difficult to implement it into a commercial flowsheet simulation software. To simplify the usage, it might be possible to omit the modeling of the catalyst surface coverage and convert our implicit model into an explicit LHHW-type model. Considering other detailed kinetic models [26,30], this should be possible with a few assumptions.
Nevertheless, we are convinced that it is important to model the reactant consumption and product distribution simultaneously for a realistic reactor under recycle conditions. Recycle operation would be necessary in a technical application to achieve sufficiently high conversions. It might additionally affect the product distribution as large fractions of short-chain hydrocarbons would also be recycled into the reactor. We are currently assessing these issues in a bench scale system and will report on the results in a future publication.

Supplementary Materials

Supplementary Materials are available online at https://www.mdpi.com/article/10.3390/catal12060630/s1 providing detailed information about the applied catalyst (preparation and characterization) and kinetic experiments (setup, procedures, product analysis, and results). Table S1: Detailed preparation procedure for Fe/K@ γ - A l 2 O 3 . Table S2: Key properties of the investigated catalyst determined via N 2 -physisorption and inductively coupled plasma optical emission spectrometry. Table S3: Conditions and key results of the experiments used in the kinetic study. Figure S1: Electron probe microanalysis map of Fe/K@ γ - A l 2 O 3 with K and Fe distribution for an exemplary particle. Figure S2: (a) Simplified flow scheme of the lab-scale setup (reprinted with permission from Brübach et al. Copyright 2022 American Chemical Society); PI: pressure indicator, TI: temperature indicator, TIC: temperature indicator controller, BPR: back pressure regulator; (b) Photograph of the lab-scale setup (date: 18 October 2021).

Author Contributions

Conceptualization, L.B. (Lucas Brübach) and P.P.; methodology, L.B. (Lucas Brübach), D.H. and L.B. (Linus Biffar); software, L.B. (Lucas Brübach), D.H. and L.B. (Linus Biffar); validation, L.B. (Lucas Brübach) and D.H.; formal analysis, L.B. (Lucas Brübach) and D.H.; investigation, L.B. (Lucas Brübach) and D.H.; resources, P.P.; data curation, L.B. (Lucas Brübach) and D.H.; writing—original draft preparation, L.B. (Lucas Brübach); writing—review and editing, L.B. (Lucas Brübach), D.H., L.B. (Linus Biffar) and P.P.; visualization, L.B. (Lucas Brübach) and D.H.; supervision, P.P.; project administration, P.P.; funding acquisition, P.P. All authors have read and agreed to the published version of the manuscript.

Funding

This work was funded by the German Federal Ministry for Economic Affairs and Climate Action under the project acronym PowerFuel, Grant No. 03EIV071B.

Institutional Review Board Statement

Not applicable.

Informed Consent Statement

Not applicable.

Data Availability Statement

Not applicable.

Acknowledgments

The authors acknowledge support by the KIT-Publication Fund of the Karlsruhe Institute of Technology. The authors thank Uta Gerhards (KIT-IMVT) for the EPMA, Malina Burcea (KIT-CVT) for the N 2 -physisorption, and Thomas Bergfeldt (KIT-IAM) for the ICP-OES analysis.

Conflicts of Interest

The authors declare no conflict of interest.

Abbreviations

ASFAnderson–Schulz–Flory
CSTRcontinuously stirred tank reactor
DFTdensity functional theory
EPMAelectron probe microanalysis
FIDflame ionization detector
FTFischer–Tropsch
FTSFischer–Tropsch synthesis
GCgas chromatograph
GHSVgas hourly space velocity
ICP-OESinductively coupled plasma optical emission spectrometry
LHHWLangmuir–Hinshelwood–Hougen–Watson
PFRplug flow reactor
RDSrate-determining step
RWGSreverse water gas shift
VLEvapor–liquid–equilibrium
Symbols
α chain growth probability
E A activation energy (kJ mol−1)
Fobjective value of minimization function (Equation (6))
Γ chain-length dependence parameter (kJ mol−1)
Θ fraction of free surface sites
Θ i surface coverage fraction
I iso-alkene
IRadsorbed iso-alkyl species
Kequilibrium constant ( bar 1 )
kreaction rate constant (mol g−1 h−1/mol g−1 h−1 bar−1)
mmass (kg)
nnumber of carbon atoms
n ˙ molar flow rate (mol h−1)
ν stoichiometric coefficient
Ol 1-alkene ( α -olefin)
P n-alkane (n-paraffin)
ppressure (bar)
p i partial pressure (bar)
Runiversal gas constant (8.314 J mol−1 K−1)
Radsorbed alkyl species
rreaction rate (mol h−1 g−1)
Scarbon based selectivity
Ttemperature (°C/K)
V ˙ volumetric flow rate (mL min−1)
x mod modified mole fraction
Xconversion
free surface site
Subscripts and Superscripts
a,bsubreaction index
catcatalyst
expexperimental value
eqequilibrium
ispecies/component index
jreaction index
ksurface species index
lexperiment index
inreactor inlet
nnumber of carbon atoms
Nnormal conditions (0 °C and 1 atm)
outreactor outlet
refreference temperature (here: 300 °C)
sim          simulated value
+forward reaction
backward reaction
*adsorbed species

References

  1. Martinelli, M.; Gnanamani, M.K.; LeViness, S.; Jacobs, G.; Shafer, W.D. An overview of Fischer–Tropsch Synthesis: XtL processes, catalysts and reactors. Appl. Catal. A Gen. 2020, 608, 117740. [Google Scholar] [CrossRef]
  2. Panzone, C.; Philippe, R.; Chappaz, A.; Fongarland, P.; Bengaouer, A. Power-to-Liquid catalytic CO2 valorization into fuels and chemicals: Focus on the Fischer–Tropsch route. J. CO2 Util. 2020, 38, 314–347. [Google Scholar] [CrossRef]
  3. Ye, R.P.; Ding, J.; Gong, W.; Argyle, M.D.; Zhong, Q.; Wang, Y.; Russell, C.K.; Xu, Z.; Russell, A.G.; Li, Q.; et al. CO2 hydrogenation to high-value products via heterogeneous catalysis. Nat. Commun. 2019, 10, 5698. [Google Scholar] [CrossRef] [Green Version]
  4. Ra, E.C.; Kim, K.Y.; Kim, E.H.; Lee, H.; An, K.; Lee, J.S. Recycling Carbon Dioxide through Catalytic Hydrogenation: Recent Key Developments and Perspectives. ACS Catal. 2020, 10, 11318–11345. [Google Scholar] [CrossRef]
  5. Atsbha, T.A.; Yoon, T.; Seongho, P.; Lee, C.J. A review on the catalytic conversion of CO2 using H2 for synthesis of CO, methanol, and hydrocarbons. J. CO2 Util. 2021, 44, 101413. [Google Scholar] [CrossRef]
  6. Sai Prasad, P.S.; Bae, J.W.; Jun, K.W.; Lee, K.W. Fischer–Tropsch Synthesis by Carbon Dioxide Hydrogenation on Fe-Based Catalysts. Catal. Surv. Asia 2008, 12, 170–183. [Google Scholar] [CrossRef]
  7. Van Der Laan, G.P.; Beenackers, A.A.C.M. Kinetics and Selectivity of the Fischer–Tropsch Synthesis: A Literature Review. Catal. Rev. Sci. Eng. 1999, 41, 255–318. [Google Scholar] [CrossRef]
  8. Basha, O.M.; Sehabiague, L.; Abdel-Wahab, A.; Morsi, B.I. Fischer–Tropsch Synthesis in Slurry Bubble Column Reactors: Experimental Investigations and Modeling—A Review. Int. J. Chem. React. Eng. 2015, 13, 201–288. [Google Scholar] [CrossRef]
  9. Riedel, T.; Schaub, G.; Jun, K.W.; Lee, K.W. Kinetics of CO2 Hydrogenation on a K-Promoted Fe Catalyst. Ind. Eng. Chem. Res. 2001, 40, 1355–1363. [Google Scholar] [CrossRef]
  10. Meiri, N.; Dinburg, Y.; Amoyal, M.; Koukouliev, V.; Nehemya, R.V.; Landau, M.V.; Herskowitz, M. Novel process and catalytic materials for converting CO2 and H2 containing mixtures to liquid fuels and chemicals. Faraday Discuss. 2015, 183, 197–215. [Google Scholar] [CrossRef]
  11. Meiri, N.; Radus, R.; Herskowitz, M. Simulation of novel process of CO2 conversion to liquid fuels. J. CO2 Util. 2017, 17, 284–289. [Google Scholar] [CrossRef]
  12. Pour, A.N.; Housaindokht, M.R. A new kinetic model for direct CO2 hydrogenation to higher hydrocarbons on a precipitated iron catalyst: Effect of catalyst particle size. J. Energy Chem. 2017, 26, 359–367. [Google Scholar] [CrossRef] [Green Version]
  13. Panzone, C.; Philippe, R.; Nikitine, C.; Vanoye, L.; Bengaouer, A.; Chappaz, A.; Fongarland, P. Catalytic and Kinetic Study of the CO2 Hydrogenation Reaction over a Fe-K/Al2O3 Catalyst toward Liquid and Gaseous Hydrocarbon Production. Ind. Eng. Chem. Res. 2021, 60, 16635–16652. [Google Scholar] [CrossRef]
  14. Brübach, L.; Hodonj, D.; Pfeifer, P. Kinetic Analysis of CO2 Hydrogenation to Long-Chain Hydrocarbons on a Supported Iron Catalyst. Ind. Eng. Chem. Res. 2022, 61, 1644–1654. [Google Scholar] [CrossRef]
  15. Panzone, C.; Philippe, R.; Nikitine, C.; Bengaouer, A.; Chappaz, A.; Fongarland, P. Development and Validation of a Detailed Microkinetic Model for the CO2 Hydrogenation Reaction toward Hydrocarbons over an Fe-K/Al2O3 Catalyst. Ind. Eng. Chem. Res. 2022, 61, 4514–4533. [Google Scholar] [CrossRef]
  16. Schulz, H. Principles of Fischer–Tropsch synthesis—Constraints on essential reactions ruling FT-selectivity. Catal. Today 2013, 214, 140–151. [Google Scholar] [CrossRef]
  17. Claeys, M.; van Steen, E. Chapter 8—Basic studies. In Fischer–Tropsch Technology; Studies in Surface Science and Catalysis; Steynberg, A., Dry, M., Eds.; Elsevier: Amsterdam, The Netherlands, 2004; Volume 152, pp. 601–680. [Google Scholar] [CrossRef]
  18. Chakrabarti, D.; Prasad, V.; Klerk, A.D. Mechanism of the Fischer–Tropsch Process. In Fischer–Tropsch Synthesis, Catalysts, and Catalysis; Chemical Industries; Davis, B.H., Occelli, M.L., Eds.; CRC Press: Bosa Roca, FL, USA, 2016; Volume 118, pp. 183–222. [Google Scholar] [CrossRef]
  19. Davis, B.H. Fischer–Tropsch Synthesis: Reaction mechanisms for iron catalysts. Catal. Today 2009, 141, 25–33. [Google Scholar] [CrossRef]
  20. Fischer, F.; Tropsch, H. Über die Herstellung synthetischer Ölgemische (Synthol) durch Aufbau aus Kohlenoxyd und Wasserstoff. Brennst.-Chem. 1923, 4, 276–285. [Google Scholar]
  21. Fischer, F.; Tropsch, H. Über die direkte Synthese von Erdöl–Kohlenwasserstoffen bei gewöhnlichem Druck. Ber. Dtsch. Chem. Ges. A/B 1926, 59, 832–836. [Google Scholar] [CrossRef]
  22. Ojeda, M.; Nabar, R.; Nilekar, A.U.; Ishikawa, A.; Mavrikakis, M.; Iglesia, E. CO activation pathways and the mechanism of Fischer–Tropsch synthesis. J. Catal. 2010, 272, 287–297. [Google Scholar] [CrossRef]
  23. Ozbek, M.O.; Niemantsverdriet, J.W. Elementary reactions of CO and H2 on C-terminated chi-Fe5C2(001) surfaces. J. Catal. 2014, 317, 158–166. [Google Scholar] [CrossRef]
  24. Pham, T.H.; Duan, X.; Qian, G.; Zhou, X.; Chen, D. CO Activation Pathways of Fischer–Tropsch Synthesis on chi-Fe5C2 (510): Direct versus Hydrogen-Assisted CO Dissociation. J. Phys. Chem. C 2014, 118, 10170–10176. [Google Scholar] [CrossRef]
  25. Petersen, M.A.; van Rensburg, W.J. CO Dissociation at Vacancy Sites on Hägg Iron Carbide: Direct Versus Hydrogen-Assisted Routes Investigated with DFT. Top. Catal. 2015, 58, 665–674. [Google Scholar] [CrossRef]
  26. Lox, E.S.; Froment, G.F. Kinetics of the Fischer–Tropsch reaction on a precipitated promoted iron catalyst. 2. Kinetic modeling. Ind. Eng. Chem. Res. 1993, 32, 71–82. [Google Scholar] [CrossRef]
  27. Yang, J.; Liu, Y.; Chang, J.; Wang, Y.N.; Bai, L.; Xu, Y.Y.; Xiang, H.W.; Li, Y.W.; Zhong, B. Detailed Kinetics of Fischer–Tropsch Synthesis on an Industrial Fe-Mn Catalyst. Ind. Eng. Chem. Res. 2003, 42, 5066–5090. [Google Scholar] [CrossRef]
  28. Teng, B.T.; Chang, J.; Zhang, C.H.; Cao, D.B.; Yang, J.; Liu, Y.; Guo, X.H.; Xiang, H.W.; Li, Y.W. A comprehensive kinetics model of Fischer–Tropsch synthesis over an industrial Fe–Mn catalyst. Appl. Catal. A 2006, 301, 39–50. [Google Scholar] [CrossRef]
  29. Lozano-Blanco, G.; Thybaut, J.W.; Surla, K.; Galtier, P.; Marin, G.B. Single-Event Microkinetic Model for Fischer–Tropsch Synthesis on Iron-Based Catalysts. Ind. Eng. Chem. Res. 2008, 47, 5879–5891. [Google Scholar] [CrossRef]
  30. Zhou, L.; Froment, G.F.; Yang, Y.; Li, Y. Advanced fundamental modeling of the kinetics of Fischer–Tropsch synthesis. AIChE J. 2016, 62, 1668–1682. [Google Scholar] [CrossRef]
  31. van der Laan, G.P.; Beenackers, A.A.C.M. Hydrocarbon Selectivity Model for the Gas–Solid Fischer–Tropsch Synthesis on Precipitated Iron Catalysts. Ind. Eng. Chem. Res. 1999, 38, 1277–1290. [Google Scholar] [CrossRef]
  32. Schulz, H.; Claeys, M. Kinetic modelling of Fischer–Tropsch product distributions. Appl. Catal. A Gen. 1999, 186, 91–107. [Google Scholar] [CrossRef]
  33. Nowicki, L.; Ledakowicz, S.; Bukur, D.B. Hydrocarbon selectivity model for the slurry phase Fischer–Tropsch synthesis on precipitated iron catalysts. Chem. Eng. Sci. 2001, 56, 1175–1180. [Google Scholar] [CrossRef]
  34. Olewski, T.; Todic, B.; Nowicki, L.; Nikacevic, N.; Bukur, D.B. Hydrocarbon selectivity models for iron-based Fischer–Tropsch catalyst. Chem. Eng. Res. Des. 2015, 95, 1–11. [Google Scholar] [CrossRef] [Green Version]
  35. Huff, G.A.; Satterfield, C.N. Evidence for two chain growth probabilities on iron catalysts in the Fischer–Tropsch synthesis. J. Catal. 1984, 85, 370–379. [Google Scholar] [CrossRef]
  36. König, L.; Gaube, J. Fischer–Tropsch-Synthese. Neuere Untersuchungen und Entwicklungen. Chem. Ing. Tech. 1983, 55, 14–22. [Google Scholar] [CrossRef]
  37. Gaube, J.; Klein, H.F. Studies on the reaction mechanism of the Fischer–Tropsch synthesis on iron and cobalt. J. Mol. Catal. 2008, 283, 60–68. [Google Scholar] [CrossRef]
  38. Botes, F.G. Proposal of a New Product Characterization Model for the Iron-Based Low-Temperature Fischer–Tropsch Synthesis. Energy Fuels 2007, 21, 1379–1389. [Google Scholar] [CrossRef]
  39. Hanlon, R.T.; Satterfield, C.N. Reactions of selected 1-olefins and ethanol added during the Fischer–Tropsch synthesis. Energy Fuels 1988, 2, 196–204. [Google Scholar] [CrossRef]
  40. Tau, L.M.; Dabbagh, H.A.; Davis, B.H. Fischer–Tropsch synthesis: Carbon-14 tracer study of alkene incorporation. Energy Fuels 1990, 4, 94–99. [Google Scholar] [CrossRef]
  41. Botes, F.G.; Govender, N.S. Secondary Reactions of Ethylene As Studied in a Laboratory-Scale Recycle Slurry Reactor. Energy Fuels 2007, 21, 3095–3101. [Google Scholar] [CrossRef]
  42. Han, S.J.; Hwang, S.M.; Park, H.G.; Zhang, C.; Jun, K.W.; Kim, S.K. Identification of active sites for CO2 hydrogenation in Fe catalysts by first-principles microkinetic modelling. J. Mater. Chem. A 2020, 8, 13014–13023. [Google Scholar] [CrossRef]
  43. Nie, X.; Wang, H.; Janik, M.J.; Guo, X.; Song, C. Computational Investigation of Fe-Cu Bimetallic Catalysts for CO2 Hydrogenation. J. Phys. Chem. C 2016, 120, 9364–9373. [Google Scholar] [CrossRef]
  44. Nie, X.; Wang, H.; Janik, M.J.; Chen, Y.; Guo, X.; Song, C. Mechanistic Insight into C-C Coupling over Fe-Cu Bimetallic Catalysts in CO2 Hydrogenation. J. Phys. Chem. C 2017, 121, 13164–13174. [Google Scholar] [CrossRef]
  45. Schulz, H.; Erich, E.; Gorre, H.; van Steen, E. Regularities of selectivity as a key for discriminating FT-surface reactions and formation of the dynamic system. Catal. Lett. 1990, 7, 157–167. [Google Scholar] [CrossRef]
  46. Visconti, C.G.; Tronconi, E.; Lietti, L.; Zennaro, R.; Forzatti, P. Development of a complete kinetic model for the Fischer–Tropsch synthesis over Co/Al2O3 catalysts. Chem. Eng. Sci. 2007, 62, 5338–5343. [Google Scholar] [CrossRef]
  47. Bates, D.M.; Watts, D.G. Nonlinear Regression Analysis and Its Applications; Wiley: New York, NY, USA, 1988. [Google Scholar] [CrossRef] [Green Version]
  48. Visconti, C.G.; Tronconi, E.; Lietti, L.; Forzatti, P.; Rossini, S.; Zennaro, R. Detailed Kinetics of the Fischer–Tropsch Synthesis on Cobalt Catalysts Based on H-Assisted CO Activation. Top. Catal. 2011, 54, 786–800. [Google Scholar] [CrossRef]
  49. Donnelly, T.J.; Satterfield, C.N. Product distributions of the Fischer–Tropsch synthesis on precipitated iron catalysts. Appl. Catal. 1989, 52, 93–114. [Google Scholar] [CrossRef]
  50. Pour, A.N.; Zamani, Y.; Tavasoli, A.; Kamali Shahri, S.M.; Taheri, S.A. Study on products distribution of iron and iron–zeolite catalysts in Fischer–Tropsch synthesis. Fuel 2008, 87, 2004–2012. [Google Scholar] [CrossRef]
  51. Botes, F.G.; Niemantsverdriet, J.W.; van de Loosdrecht, J. A comparison of cobalt and iron based slurry phase Fischer–Tropsch synthesis. Catal. Today 2013, 215, 112–120. [Google Scholar] [CrossRef]
  52. Choi, P.H.; Jun, K.W.; Lee, S.J.; Choi, M.J.; Lee, K.W. Hydrogenation of carbon dioxide over alumina supported Fe-K catalysts. Catal. Lett. 1996, 40, 115–118. [Google Scholar] [CrossRef]
  53. Landau, M.V.; Meiri, N.; Utsis, N.; Vidruk Nehemya, R.; Herskowitz, M. Conversion of CO2, CO, and H2 in CO2 Hydrogenation to Fungible Liquid Fuels on Fe-Based Catalysts. Ind. Eng. Chem. Res. 2017, 56, 13334–13355. [Google Scholar] [CrossRef]
Figure 1. Schematic of the assumed chain growth mechanism with the possibility of branching, adapted from Schulz et al. [45]; R: adsorbed alkyl species, IR: adsorbed iso-alkyl species, P: n-alkane (n-paraffin), Ol: 1-alkene ( α -olefin), I: iso-alkene, n: number of carbon atoms.
Catalysts 12 00630 g001
Figure 3. Simulated coverage of catalyst surface at different CO 2 conversions ( X C O 2 ). ‘*’ denotes the fraction of free surface sites. Simulation conditions: T = 300 °C, p = 10 bar, ( H 2 / CO 2 ) in = 3.
Catalysts 12 00630 g003
Table 1. Equilibrium/kinetic expressions of the detailed kinetic model for the hydrogenation of CO 2 to long-chain hydrocarbons; ∗: free surface site, R * : adsorbed alkyl species, IR * : adsorbed iso-alkyl species, P: n-alkane (n-paraffin), Ol: 1-alkene ( α -olefin), I: iso-alkane, n: number of carbon atoms.
No.DescriptionReaction StepEquilibrium/Kinetic ExpressionNotes
1 H 2 adsorption/desorption H 2 + 2 2H* K 1 = Θ H 2 p H 2 1 Θ 2
2 CO 2 adsorption/desorption CO 2 + * CO 2 * K 2 = Θ CO 2 p CO 2 1 Θ 1
3 CO adsorption/desorptionCO + CO* r 3 = k 3 + p CO Θ k 3 Θ CO
4 H 2 O adsorption/desorption H 2 O + 2∗ OH * + H* r 4 = k 4 + p H 2 O Θ 2 k 4 Θ O H Θ H
1 CO 2 dissociation CO 2 * + H* C O * + O H * r 5 = k 5 + Θ C O 2 Θ k 5 Θ CO Θ O H Θ H 1 Θ
2Monomer formation C O * + 3H* C H 2 * + O H * + 2∗ r 6 = k 6 Θ CO Θ H 2 Θ 1
7Chain initiationCH2* + H* R1* + ∗ r 7 = k 7 Θ C H 2 Θ H
8Chain growth R n * + C H 2 * R n + 1 * + r 8 = k 8 Θ R n Θ C H 2 n 1
9aMethane formation R 1 * + H* P 1 + 2∗ r 9 a = k 9 a Θ R 1 Θ H Θ Θ O H 1
9bn-Alkane formation R n * + H * P n + 2 r 9 b = k 9 b Θ R n Θ H Θ Θ O H 1 n 2
10aEthene formation R 2 * O l 2 + H* r 10 a = k 10 a Θ R 2 Θ Θ O H 1
10b1-Alkene fomation R n * O l n + H* r 10 b = k 10 b Θ R n Θ Θ O H 1 n 3
11aPropyl branching R 3 * + C H 2 * I R 4 * + ∗ r 11 a = k 11 a Θ R 3 Θ C H 2
11bChain branching R n * + C H 2 * I R n + 1 * + ∗ r 11 b = k 11 b Θ R n Θ C H 2 n 4
12Branched chain growth I R n * + C H 2 * I R n + 1 * + ∗ r 12 = k 8 Θ I R n Θ C H 2 n 4
13iso-Alkene termination I R n * I R n + H* r 13 = k 13 Θ I R n Θ Θ O H 1 n 4
1 Direct CO2 dissociation mechanism, see Table 2; 2 H-assisted CO dissociation mechanism, see Table 3.
Table 2. Elementary reaction steps and assigned equilibrium/kinetic expressions for the direct CO 2 dissociation mechanism as proposed by Han et al. [42].
No.Elementary StepEquilibrium/Kinetic Expression
5a CO 2 * + ∗ C O * + O* r 5 a = k 5 a + Θ C O 2 Θ k 5 a Θ O Θ CO
5bO* + H* OH* + ∗ K 5 b = Θ O H Θ Θ O 1 Θ H 1
5 CO 2 * + H* C O * + O H * r 5 = k 5 + Θ C O 2 Θ k 5 Θ CO Θ O H Θ H 1 Θ
Table 3. Elementary reaction steps and assigned equilibrium/kinetic expressions for the H-assisted CO dissociation mechanism as proposed by Ojeda et al. [22].
No.Elementary StepEquilibrium/Kinetic ExpressionNotes
6aCO* + H* H C O * + ∗ K 6 a = Θ HCO Θ Θ CO 1 Θ H 1
6bHCO* + H* HCOH*+ ∗ r 6 b = k 6 b Θ HCO Θ H RDS
6cHCOH* + ∗ CH * + OH * r 6 c r 6 b
6dCH* + H* C H 2 * + ∗ r 6 d r 6 c
6CO* + 3H* C H 2 * + OH* + 2∗ r 6 = k 6 Θ CO Θ H 2 Θ 1
Table 4. Parameter estimates of the proposed kinetic model determined via weighted least squares optimization.
ParameterValueUnitParameterValueUnit
K 1 5.82 × 10⁻¹ bar 1 k 9 b 1.97 × 10³ mol   g 1   h 1
K 2 1.37 bar 1 k 10 a , T ref 9.57 × 10² mol   g 1   h 1
k 3 + 1.43 × 10³ mol   g 1   h 1   bar 1 k 10 b , T ref 1.79 × 10³ mol   g 1   h 1
k 3 9.21 × 10³ mol   g 1   h 1 k 11 a 2.18 × 10² mol   g 1   h 1
k 4 , T ref + 3.49 × 10² mol   g 1   h 1   bar 1 k 11 b 2.49 × 10³ mol   g 1   h 1
k 4 , T ref 1.45 × 101 mol   g 1   h 1 k 13 7.67 × 10² mol   g 1   h 1
k 5 + 2.21 × 101 mol   g 1   h 1 Γ 10 4.52 × 10⁻¹ kJ   mol 1
k 5 2.35 × 10² mol   g 1   h 1 Γ 11 b 2.89 kJ   mol 1
k 6 4.10 × 101 mol   g 1   h 1 E A , 4 + 1.51 × 10² kJ   mol 1
k 7 1.64× 10⁻¹ mol   g 1   h 1 E A , 4 1.99 × 10² kJ   mol 1
k 8 1.37 × 10³ mol   g 1   h 1 E A , 10 5.97 kJ   mol 1
k 9 a 2.59× 10⁴ mol   g 1   h 1
Publisher’s Note: MDPI stays neutral with regard to jurisdictional claims in published maps and institutional affiliations.

