Article

The Effect of pH, Metal Ions, and Insoluble Solids on the Production of Fumarate and Malate by Rhizopus delemar in the Presence of CaCO3

Department of Chemical Engineering, University of Pretoria, Lynnwood Road, Hatfield, Pretoria 0002, South Africa
*
Author to whom correspondence should be addressed.
Catalysts 2022, 12(3), 263; https://doi.org/10.3390/catal12030263
Submission received: 30 January 2022 / Revised: 22 February 2022 / Accepted: 23 February 2022 / Published: 25 February 2022
(This article belongs to the Special Issue Biotransformation Catalyzed by Immobilized Enzyme)

Abstract

:
Calcium carbonate has been extensively used as a neutralising agent in acid-forming microbial processes. The effect of increasing calcium carbonate concentrations on Rhizopus delemar has not been previously investigated. In this study, an evaluation of fumaric acid (FA) and malic acid (MA) production was conducted at three CaCO3 concentrations in shake flask cultivations. Increased CaCO3 concentrations resulted in the co-production of FA and MA in the first 55 h of the fermentation (regime 1), and the subsequent depletion of FA thereafter (regime 2). Three factors were highlighted as likely causes of this response: insoluble solids, metal ion concentrations, and pH. Further shake flask cultivations as well as a continuous fermentation with immobilised R. delemar were used to explore the effect of the three factors on regime 1 and 2. Insoluble solids were found to have no effect on the response in either regime 1 or 2. Increasing the aqueous calcium ion concentrations to 10 g L−1 resulted in a three-fold increase in MA titres (regime 1). Moreover, an increase in pH above 7 was associated with a drop in FA concentrations in regime 2. Further tests established that this was due to the hydration of FA to MA, influenced by high pH conditions (7 or higher), nitrogen starvation, and glucose depletion. Anaerobic conditions were also found to significantly improve the hydration process. This study presents the first investigation in which the production of FA followed by in situ hydration of FA to MA with R. delemar has been achieved.

1. Introduction

The rate at which fossil resources are depleting, coupled with the resultant deterioration of the global environment, has been a major source of concern in the past few decades [1,2,3]. As a result, many research efforts have been focused on the development of alternative sources of feedstock to replace fossil resources. Wind, nuclear, solar, and geothermal energy are only a few of the energy generation alternatives currently available. However, biomass-derived products are the only practicable alternatives for the generation of transportation fuels and platform chemicals [1,4]. In 2004, the Department of Energy (DOE) identified 12 chemical building blocks obtainable from biomass as potential platform chemicals [5].
Fermentative methods with the aid of microorganisms to produce organic acids were partially developed in the 1940s but were quickly abandoned due to the more lucrative chemical methods developed after World War II [6,7,8,9]. However recent renewed interest has led many researchers to focus on the development and optimisation of these fermentative methods [10,11]. The microorganisms used in the bioproduction of organic acids must exhibit high yields, productivities, and titres in order to compete with processes based on petrochemical methods. Other prerequisites for their economic feasibility include the ability to use many different carbon sources, ability to grow in the absence of complex growth factors, and resistance to fermentation inhibitors [1,11].
Rhizopus oryzae is a prominent zygomycetes fungus, well known for its ability to sustainably produce platform chemicals such as lactic acid (Type I strain) and fumaric and malic acids (Type II strain). The latter is correctly referred to as Rhizopus delemar, although the name has not been commonly adopted in the literature [4,12]. R. delemar will be used henceforth in this research for clarity purposes. Compared against the metric above, R. delemar is the most successful fumaric acid producer, with the highest yield reported as 0.93 g g−1 in homofumarate production using immobilised fungus [13]. Additionally, significantly high productivities have been reported from immobilised R. delemar with a rotary biofilm contactor and an adsorption column [14]. R. delemar has also been flagged for its ability to grow on a wide range of carbon sources, including glycerol, ethanol, lactic acid, glucose, mannose, sucrose, and other fermentable sugars [1,4,15]. Moreover, its well-demonstrated growth ability in a wide array of unspecific and inexpensive culture media, along with its ability to survive in a wide temperature and pH range (up to 40 °C and 4–9, respectively), positions R. delemar-mediated fermentations well as a worthy and competitive alternative to petrochemical methods [1,16].
However, since many Rhizopus species spend at least a portion of their life cycle as free living organisms, they are extremely sensitive to changes in their environment [17]. Such sensing and integration of signals from multiple sources (abiotic and biotic) result in the main challenge faced in R. delemar-mediated fermentations, pH sensitivity, resulting in a need for continuous neutralisation [18]. Consequentially, research efforts have focused on exploring the effect of different neutralising agents on fumaric acid yields and titres, determining the optimum pH conditions, and developing low-pH fermentation strategies to bypass the need to use neutralising agents [18,19,20,21,22].
Among the neutralising agents commonly used, especially in applications without online pH monitoring and control, is CaCO3, a naturally occurring chemical compound favoured due to its abundance, poor solubility, and relatively low cost [23]. In fact, nearly all previous investigators of fumaric and malic acid production by Rhizopus species that have used the base calcium carbonate have indicated significantly higher yields, titres, and productivities in comparison to other neutralising agents such as calcium hydroxide, sodium carbonate, sodium bicarbonate, and sodium hydroxide [18,19]. This begets the question of why calcium carbonate is so effective relative to its counterparts. Three reasons have been put forward to explain this: (i) due to its insolubility, calcium carbonate offers the advantage of ‘all at once’ addition, thus eliminating the need for a control system for base addition; (ii) the presence of calcium carbonate means increased concentrations of bicarbonate (and thereby CO2), a substrate for pyruvate carboxylase in the carboxylation of pyruvate to oxaloacetate [24], and (iii) CaCO3 reacts with the acids present in the broth immediately upon secretion to form insoluble calcium salts of the acids, thus allowing for the production of higher acid concentrations [3,25]. Moreover, some recent studies on Aspergillus oryzae have indicated a strong positive correlation between increased CaCO3 concentrations (much higher than what is required for neutralisation) and malic acid titres and yields [3,26]. These results cannot be fully explained by the ability of CaCO3 to offer continuous neutralisation, the increase in bicarbonate concentration, or by the formation of insoluble calcium salts of the acids.
Despite the fact that fumaric acid production by Rhizopus species has been extensively studied in CaCO3-buffered shake flask cultures, to the best of our knowledge, the effect of increasing CaCO3 concentrations on the relative production of fumaric and malic acids has not been studied before in R. delemar. Preliminary unpublished tests using R. delemar showed that increased CaCO3 concentrations in excess of that required for neutralisation affect the metabolite distribution of R. delemar. Based on the work on A. oryzae [3,26], three factors were likely responsible for the observed response. These were insoluble solids, metal ions, and pH [13,24,27].
Increased CaCO3 concentrations consequentially mean the increased presence of insoluble solids in the fermentation broth. R. delemar (zygomecetes fungi) thrives in soils and dead organic matter, and it is therefore likely that increased concentrations of insoluble solids may replicate its natural environment, causing changes in its response, compared with when they are submerged in artificial liquid media [28]. Calcium has been linked to changes in pyruvate carboxylase activity, effects on fumR activity, as well as cellular signalling pathways [24,29,30]. pH control is closely linked to successful acid production in microbial processes. As the pH drops in R. delemar-mediated fermentation as a consequence of acid production, the rate of fumaric acid production slows down and eventually ceases, necessitating the addition of neutralising agents to prevent this self-inhibition. Production of fumaric acid by R. delemar is usually performed at neutral pH values. CaCO3 maintains the pH at around 6.5 in acid-forming microbial processes [23]. Increasing CaCO3 concentrations beyond the amounts required for neutralisation means that the pH would be maintained throughout the duration of the fermentation [18]. In a recent study, Swart et al. [13] found that higher pH conditions (pH 6) were unfavourable for fumaric acid production with R. delemar. The findings clearly indicated that the three-fold increase in osmotic and ionic stresses, compared to the pH 4 condition, resulted in the production of unwanted byproducts, including malic acid. Investigation at even higher pH conditions (pH 7) was necessary to further establish these findings.
The aim of this study was to investigate the fumaric and malic acid production capability of R. delemar in the presence of CaCO3. Shake flask cultivations were utilised to explore the effect of insoluble solids, metal ions, and pH on the relative production of FA and MA in a bid to gain insight into the role of CaCO3 in fermentations mediated by R. delemar. The subsequent experiments were conducted in an immobilised reactor operated continuously with precise pH control to further test the effect of pH and provide a proof of concept on the key findings on a bench scale.

2. Results and Discussion
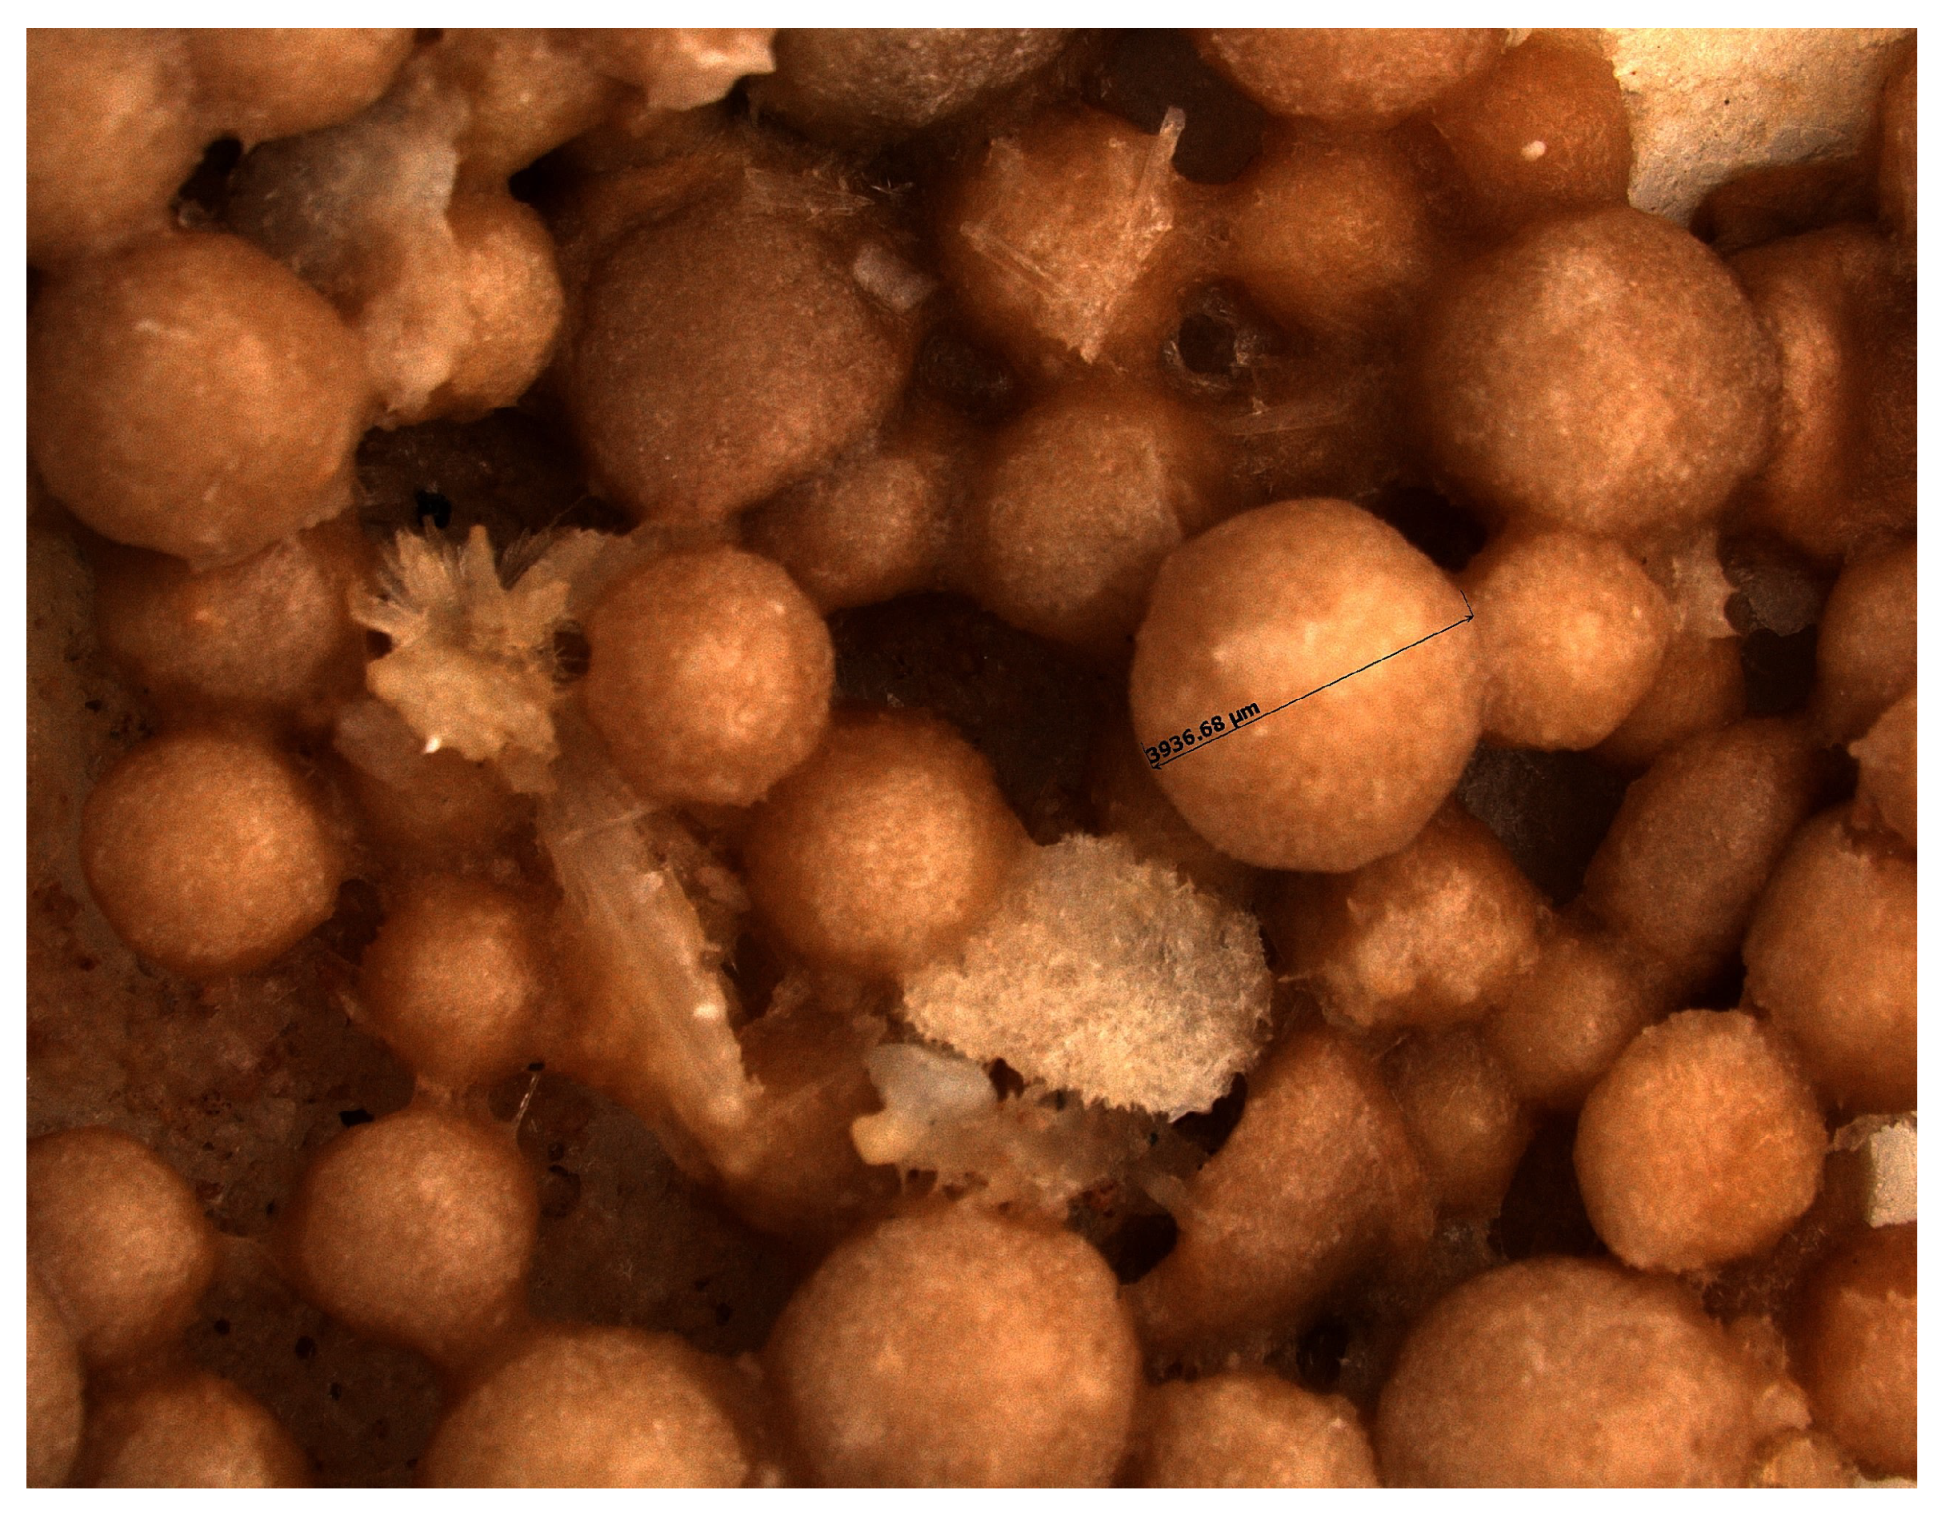
2.1. Biomass

Cell morphology plays a critical role in both free-cell and immobilised fermentations in achieving significant organic acid titres and low medium viscosity [31]. For shake flask fermentations, small pellets (≈1 mm or less) have been found to be ideal. Therefore, controlling the fungal morphology was considered an important first step, with temperature, pH, agitation speed, and growth duration highlighted as key variables. After multiple iterations, nearly perfectly spherical pellets of diameter 0.9 mm were achieved with temperature, pH, agitation speed, and growth duration as follows: 34 °C, pH 5, 200 RPM, and 24 h (Figure 1a). These pellets were used for all the subsequent shake flask fermentations.
In the immobilised reactor, growth media consisting of high glucose and urea concentrations were used during the growth phase, which typically lasted around 24 h. The growth phase for all runs was conducted at pH 5. Immobilisation of the biomass was achieved through the use of a polypropylene tube. Morphology control was achieved through adjusting parameters such as initial glucose and spore concentrations, as described by Naude [32]. The biofilm that resulted had a thickness of ∼1 mm (Figure 1b).

2.2. Effect of CaCO3 Addition

To investigate the effect of the addition of CaCO3 on the relative production of FA and MA, three different CaCO3 concentrations were studied in 250 mL unbaffled Erlenmeyer flasks. The baseline amount of CaCO3 was selected as 20 g L−1 and the fermentation conducted in triplicate. All fermentations had an initial substrate (glucose) concentration of around 100 g L−1. Studies have shown that R. delemar has the ability to withstand high product and d-Glucose concentrations in excess of 100 g L−1 [1]. After 192 h, approximately 93.4% of the glucose was consumed, with the main products being fumarate and ethanol, as shown in Figure 2a. These results confirm the findings of Swart et al. [20], indicating that R. delemar is indeed a Crabtree-positive organism, where the respiratory capacity reaches a maximum under excess glucose supply, resulting in the formation of ethanol under aerobic conditions as a metabolic overflow product.
The concentration of fumaric acid steadily increased throughout the fermentation period, reaching a value of 28.27 ± 1.45 g L−1, which corresponds to a yield of 0.28 g g−1 on glucose. Malic acid was first observed in HPLC sample analysis after 50 h of cultivation, and the concentration (3.94 ± 0.23 g L−1) remained fairly constant thereafter (Figure 2a). Though one order of magnitude less than fumaric acid titres, the amount of MA produced was still significantly higher than the rest of the minor components.
During the last 30 h of the fermentation, a sharp decrease in ethanol concentration was observed. This is in tandem with the lowest glucose concentrations in the flasks, indicating the possibility that ethanol is being consumed as a substrate. R. delemar has the ability to grow under a wide range of carbon sources, including ethanol, as earlier established [1]. Therefore, ethanol can be broken down in the TCA cycle to produce more ATP (energy). The pH measured at the end of the fermentation was 4.17 ± 0.21, a large drop from the initial pH recorded at the start of the fermentation (6.5 ± 0.1).
It was also observed that the fermentation broth became clear towards the end of the cultivation period, signalling a depletion of the CaCO3. This was an indication that more acid was formed than could be neutralised by the 20 g L−1 CaCO3 in the fermentation broth. To determine the amount of CaCO3 that was required to fully neutralise the total acids produced, a calculation was done based on the neutralisation reactions, with the highest HPLC-determined concentrations of acids produced during the fermentation (fumarate, malate, pyruvate, and succinate). The amount of CaCO3 required was determined to be 30.17 g L−1.
It is also critical to highlight that a variation in the amount of H+ would result in differences in the amounts of alkali required to control the pH. This is because the acids present may either be as fully dissociated, aqueous undissociated, or solid undissociated acid forms [13]. The stoichiometry of organic acid production and accompanying H+ production as a function of pH at standard ambient temperature was previously presented by Taymaz et al. [33]. The implication here is that the amount of alkali required to neutralise the acids produced towards the end of the fermentation would have been significantly less due to the drop in pH. The calculated amount of theoretical CaCO3 required was based on the assumption of fully dissociated forms of all acids produced (pH 7 and higher). This means that, due to the gradual pH drop, the calculated amount of CaCO3 required (30.17 g L−1) was likely an overestimation of the actual amount.
A three-fold increase in the amount of CaCO3 added was tested to ensure sufficient pH control for the duration of the fermentation, and to further elucidate the effect of increased amounts of CaCO3 beyond the required amounts for neutralisation of the acids produced. The utilisation of 60 g L−1 CaCO3 resulted in the first evidence of the co-production of FA and MA in almost equivalent amounts. This occurred within the first 55 h of the fermentation, with the highest FA and MA titres recorded as 19.77 g L−1 at 55 h and 19.91 g L−1 at 75 h, respectively. Thereafter, a significant drop in FA concentration was observed, resulting in a final fumarate concentration of 1.29 g L−1 by the end of the fermentation, as can be observed in Figure 2b. Given that R. delemar is predominantly a fumaric acid producer, the co-production of FA and MA, followed by the drop in FA concentration, were highlighted as key findings that would require further investigation. Interestingly, the MA and ethanol concentrations dropped towards the end of the fermentation once glucose was depleted, indicating the reassimilation of these as alternative substrates. The pH recorded at the end of the fermentation was 7.4, a slight increase from the initial pH recorded at the start of the fermentation. This is attributed to the sufficient presence of CaCO3 in the fermentation broth.
The concentration profiles in the fermentations mediated with 100 g L−1 CaCO3 (Figure 2c) were very similar to the 60 g L−1 CaCO3 fermentation (Figure 2b). An initial rapid increase in fumarate concentration was observed, reaching a maximum of 14.79 ± 1.83 g L−1, and thereafter dropping to 0.93 ± 0.33 g L−1 by the end of the fermentation. The highest MA concentration was also recorded 80 h into the fermentation (18.47 ± 0.81 g L−1), corresponding to a yield of 0.21 g g−1. The slight drop in malate and ethanol after the glucose was depleted was also akin to the previous CaCO3 concentration tested. The increase in CaCO3 concentration to 100 g L−1 did not translate into any significant variations in the metabolites produced or the glucose consumption rate, an indication that the fermentation conditions that resulted in the co-production of FA and MA, and the subsequent FA depletion, were maintained. In this case, again, the reassimilation of ethanol and MA was observed towards the end of the fermentation. The pH measured at the end of the fermentation was 7.37 ± 0.06. The similarity in the final pH recorded in 60 and 100 g L−1 CaCO3 fermentations provided a basis for further investigation of the effect of pH. It was observed from the carbon distribution shown in Figures S1–S3, that there was a steady increase in the CO2 across all fermentation conditions, an indication of increasing energy requirements towards the end of the fermentations. The increased energy demands was attributed to cell maintenance (an energy intensive procedure), and increased transport costs from the cell into the medium as the fermentation progressed.
Besides increased CO2 availability, the addition of CaCO3 beyond the 20 g L−1 baseline amount effectively implies the following changes in the fermentation broth that could influence the metabolites that R. delemar produces: increased presence of insoluble solids, increased Ca2+ concentrations, and increased pH. These factors were used as the departure point for the experimental design to determine the cause of the two phenomena: co-production of FA and MA, and the subsequent drop in fumaric acid concentrations.

2.3. Effect of Insoluble Solids: Comparison with MgCO3

A similar experimental procedure was followed as outlined in the previous section, with the only variable being the alkali added. The MgCO3 mass concentrations tested were also similar (20, 60, and 100 g L−1) for ease of comparison of the resultant data. Magnesium carbonate offers many of the aforementioned benefits accrued from the use of calcium carbonate: (i) ‘all at once’ addition due to its insolubility [18]; (ii) increased concentrations of CO2 [24], and (iii) the formation of insoluble magnesium precipitates [3].
However, the pH values recorded at the end of the MgCO3 fermentations were always slightly higher than their CaCO3 counterparts, as indicated in Table 1. This can be attributed to the higher amount of carbonate (mole basis) present with the addition of similar mass-based amounts of MgCO3 compared to CaCO3. Moreover, while eliminating the presence of calcium ions, the addition of magnesium carbonate consequentially results in increased Mg2+ (Table 1), which would likely play a role in the metabolite distribution that results [29]. The main point of comparison in these experiments is the similar mass-based amounts of alkali added, therefore providing a basis to establish a preliminary test to investigate the influence of insoluble solids on the relative production of FA and MA.
With all experimental conditions kept constant, 20 g L−1 MgCO3 was first tested as the baseline amount of alkali in the shake flask cultivation of R. delemar. Two different regimes are mapped out in Figure 3, showing the co-production regime 1, and the fumarate depletion regime 2. The MgCO3-mediated fermentations are plotted alongside their CaCO3 counterparts for ease of comparison of the two alkali. In the fermentation with 20 g L−1 MgCO3, all of the glucose was consumed in less than 100 h, much faster than in the fermentation with CaCO3. In contrast, for the fermentation with 60 g L−1 MgCO3, approximately 87% of the substrate was consumed in the same duration ( 100 h) and approximately 97% during the entire fermentation. The decrease in the glucose consumption rate was further exacerbated with the addition of more MgCO3, with only 84.2% of glucose being consumed by the end of the fermentation in the flask with 100 g L−1 MgCO3 (Figure 3). This is the reverse of the response that was observed in the fermentations with CaCO3, an indication of the likely effect of increased magnesium ion concentrations and pH (Table 1).
Fairly similar profiles were achieved for FA and MA in fermentations with 20 g L−1 CaCO3 and MgCO3. The only notable differences observed were the relatively high amount of MA that was initially produced in the MgCO3 fermentation (12.69 g L−1), and the slight tapering of FA concentrations toward the end of the fermentation. pH measurements taken at the end of the fermentation showed that there was a drop in pH to 4.6, also an indication of the insufficiency of the 20 g L−1 MgCO3 in meeting the pH control requirements in the fermentation (Table 1).
In the fermentations with 60 g L−1 alkali, the MA concentration profiles followed remarkably similar trends, a clear indicator that the co-production conditions highlighted in regime 1 were maintained across the fermentations with the two alkali. Fumarate concentrations in the fermentations with MgCO3 were slightly lower than with CaCO3. This is attributed to the increased presence of magnesium ions in the fermentation broth. In a study on the expression and characterisation of fumR from R. delemar, Song et al. [29] found the slight inhibition of fumR activity with Mg2+, and a small stimulatory effect with Ca2+ (further details in the next section). However, despite the lower concentration profile, the drop in fumarate concentrations in regime 2 was clearly visible for fermentations with both alkali. The pH recorded at the end of the fermentation in the 60 g L−1 MgCO3 fermentation was 8, slightly higher than the final pH measured in its CaCO3 counterpart. These findings were further corroborated in the fermentation with 100 g L−1 MgCO3, where a maximum MA concentration of 33.29 g L−1 was achieved, corresponding to a yield of 0.58 g g−1 and productivity of 0.35g L−1 h−1. This was the highest MA concentration recorded in all the runs. A final pH of 8.1 was measured at the end of the run.
The similarity in the profiles observed in the CaCO3 and MgCO3 fermentations (Figure 3) indicates a correlation between malic acid production and the increased presence of insoluble solids in the broth. However, there seems to be an underlying pH effect as the pH trends were fairly similar across the two runs. Moreover, there was an effect associated with the different metal ions present. To further elucidate the role of insoluble solids, the next test was conducted with plaster sand (PS) to simulate the presence of insoluble solids while eliminating the pH and metal ion effect, as discussed in the next section.

2.4. Effect of Insoluble Solids: Plaster Sand

The choice of plaster sand to simulate the conditions in the fermentation broth with CaCO3 and MgCO3 buffered cultures was based on the presumption that it contained no significant amounts of metal ions (Ca2+ and Mg2+). The advantage of using PS was that not only would it provide a particle size similar to the CaCO3 and MgCO3 used in the previous section, but that it would also prevent the effects associated with metal ions and pH variations, thus allowing us to neatly test the effects of insoluble solids separately.
A sieve analysis was conducted to compare the particle size distribution of plaster sand and CaCO3. The results indicated that the plaster sand used was well graded, with a relatively even distribution of particles, as ∼ 80% of particles lay within the range between 0.15 and 1.4 mm. CaCO3, on the other hand, displayed a slightly smaller particle size distribution, with over 90% of the particles falling within the range of 0.3 to 1.4 mm. However, the distributions were considered fairly comparable and thus plaster sand was used as an inert alternative to CaCO3 and MgCO3. ICP measurements of the fermentation broth confirmed that increased amounts of plaster sand did not result in the increased presence of metal ions, an indication that the leaching of metal ions did not occur (Table 1).
Given the need for pH control, a baseline amount of 20 g L−1 CaCO3 was initially added to all PS runs. Final pH measurements recorded were quite similar (∼pH 3.9), an indication of comparable pH conditions throughout the different PS fermentations. The fermentation broth with PS became progressively thicker with increasing concentrations of insoluble solids. In the flasks with 120 g L−1 plaster sand, the pellets were suspended in the high-viscosity media, with minimal movement even under gyratory motion.
At the end of the run, the pellets were observed using a stereo microscope and the plaster sand-covered pellets appeared much larger in size (approximately 3.9 mm in diameter), as shown in Figure 4. This shows that the increase in PS concentrations, at least on a physical level, might have caused significant changes to the fermentation broth, which would result in a physiological response—specifically, the co-production of fumaric and malic acids (regime 1) or the depletion of fumaric acid (regime 2). As aforementioned, R. delemar is a zygomycetes fungi that thrives in soils and dead organic matter. The main question thus was whether the high-viscosity broth significantly simulated its natural environment, triggering the response in regime 1 or 2.
The hypothesis is based on the thermodynamics research work by Goldberg et al. [34], where they found that the Δ G 0 of the conversion of l-malic acid to fumaric acid is 3.6 kJ mol−1, indicating that, at equilibrium, the l-malic acid concentration is higher than the fumaric acid concentration. The question of why R. delemar accumulates fumaric acid instead of malic acid can be attributed to a dicarboxylic acid transporter with a high selectivity for the former rather than the latter [1]. In principle, the addition of plaster sand at such high concentrations could result in a change in the selectivity bias of the transporter, based on the significant change in the environment in the broth. In its natural environment, R. delemar has been known to secrete acids in order to dissolve some of the solids in its immediate environment, and therefore malate selectivity by the transporter could be the way to achieve this. The chelating properties of malic acid in conjunction with the solubility of most metal compounds at low pH would thus be advantageous to the fungi in the poorly soluble fermentation broth conditions.
An increase in PS concentrations, however, appeared to have no effect on glucose consumption, with complete depletion occurring 125 h into the production phase, as shown in Figure 5a. Fumarate concentrations also remained quite similar across all PS concentrations, and the characteristic drop in fumarate concentrations in regime 2 was absent (Figure 5b). Additionally, co-production of fumaric and malic acid did not occur in regime 1, as the MA concentrations remained fairly constant throughout the fermentation (∼4 g L−1), the observed similarity notwithstanding a three-fold increase in PS concentrations and a visible change in broth viscosity, as well as pellet size. This nullifies the hypothesis that insoluble solids had an effect on the response earlier observed (either regime 1 or regime 2).
In the results from fermentations with PS (Figure 5), all four conditions resulted in the production of FA as the main organic acid (∼30 g L−1), and similar concentration profiles of all side products (Figure S4). With each condition conducted in triplicate, these results confirmed the repeatability of the experiments. The implication from these results is that the response from the CaCO3 and MgCO3 fermentations (regime 1 and 2) was likely to have been influenced by metal ions or pH, and not by insoluble solids. Given that no leaching of metal ions occurred in the runs with PS (see Table 1), the next set of experiments were conducted to extract the influence of Ca2+ on the two regimes.

2.5. Effect of Calcium Ions
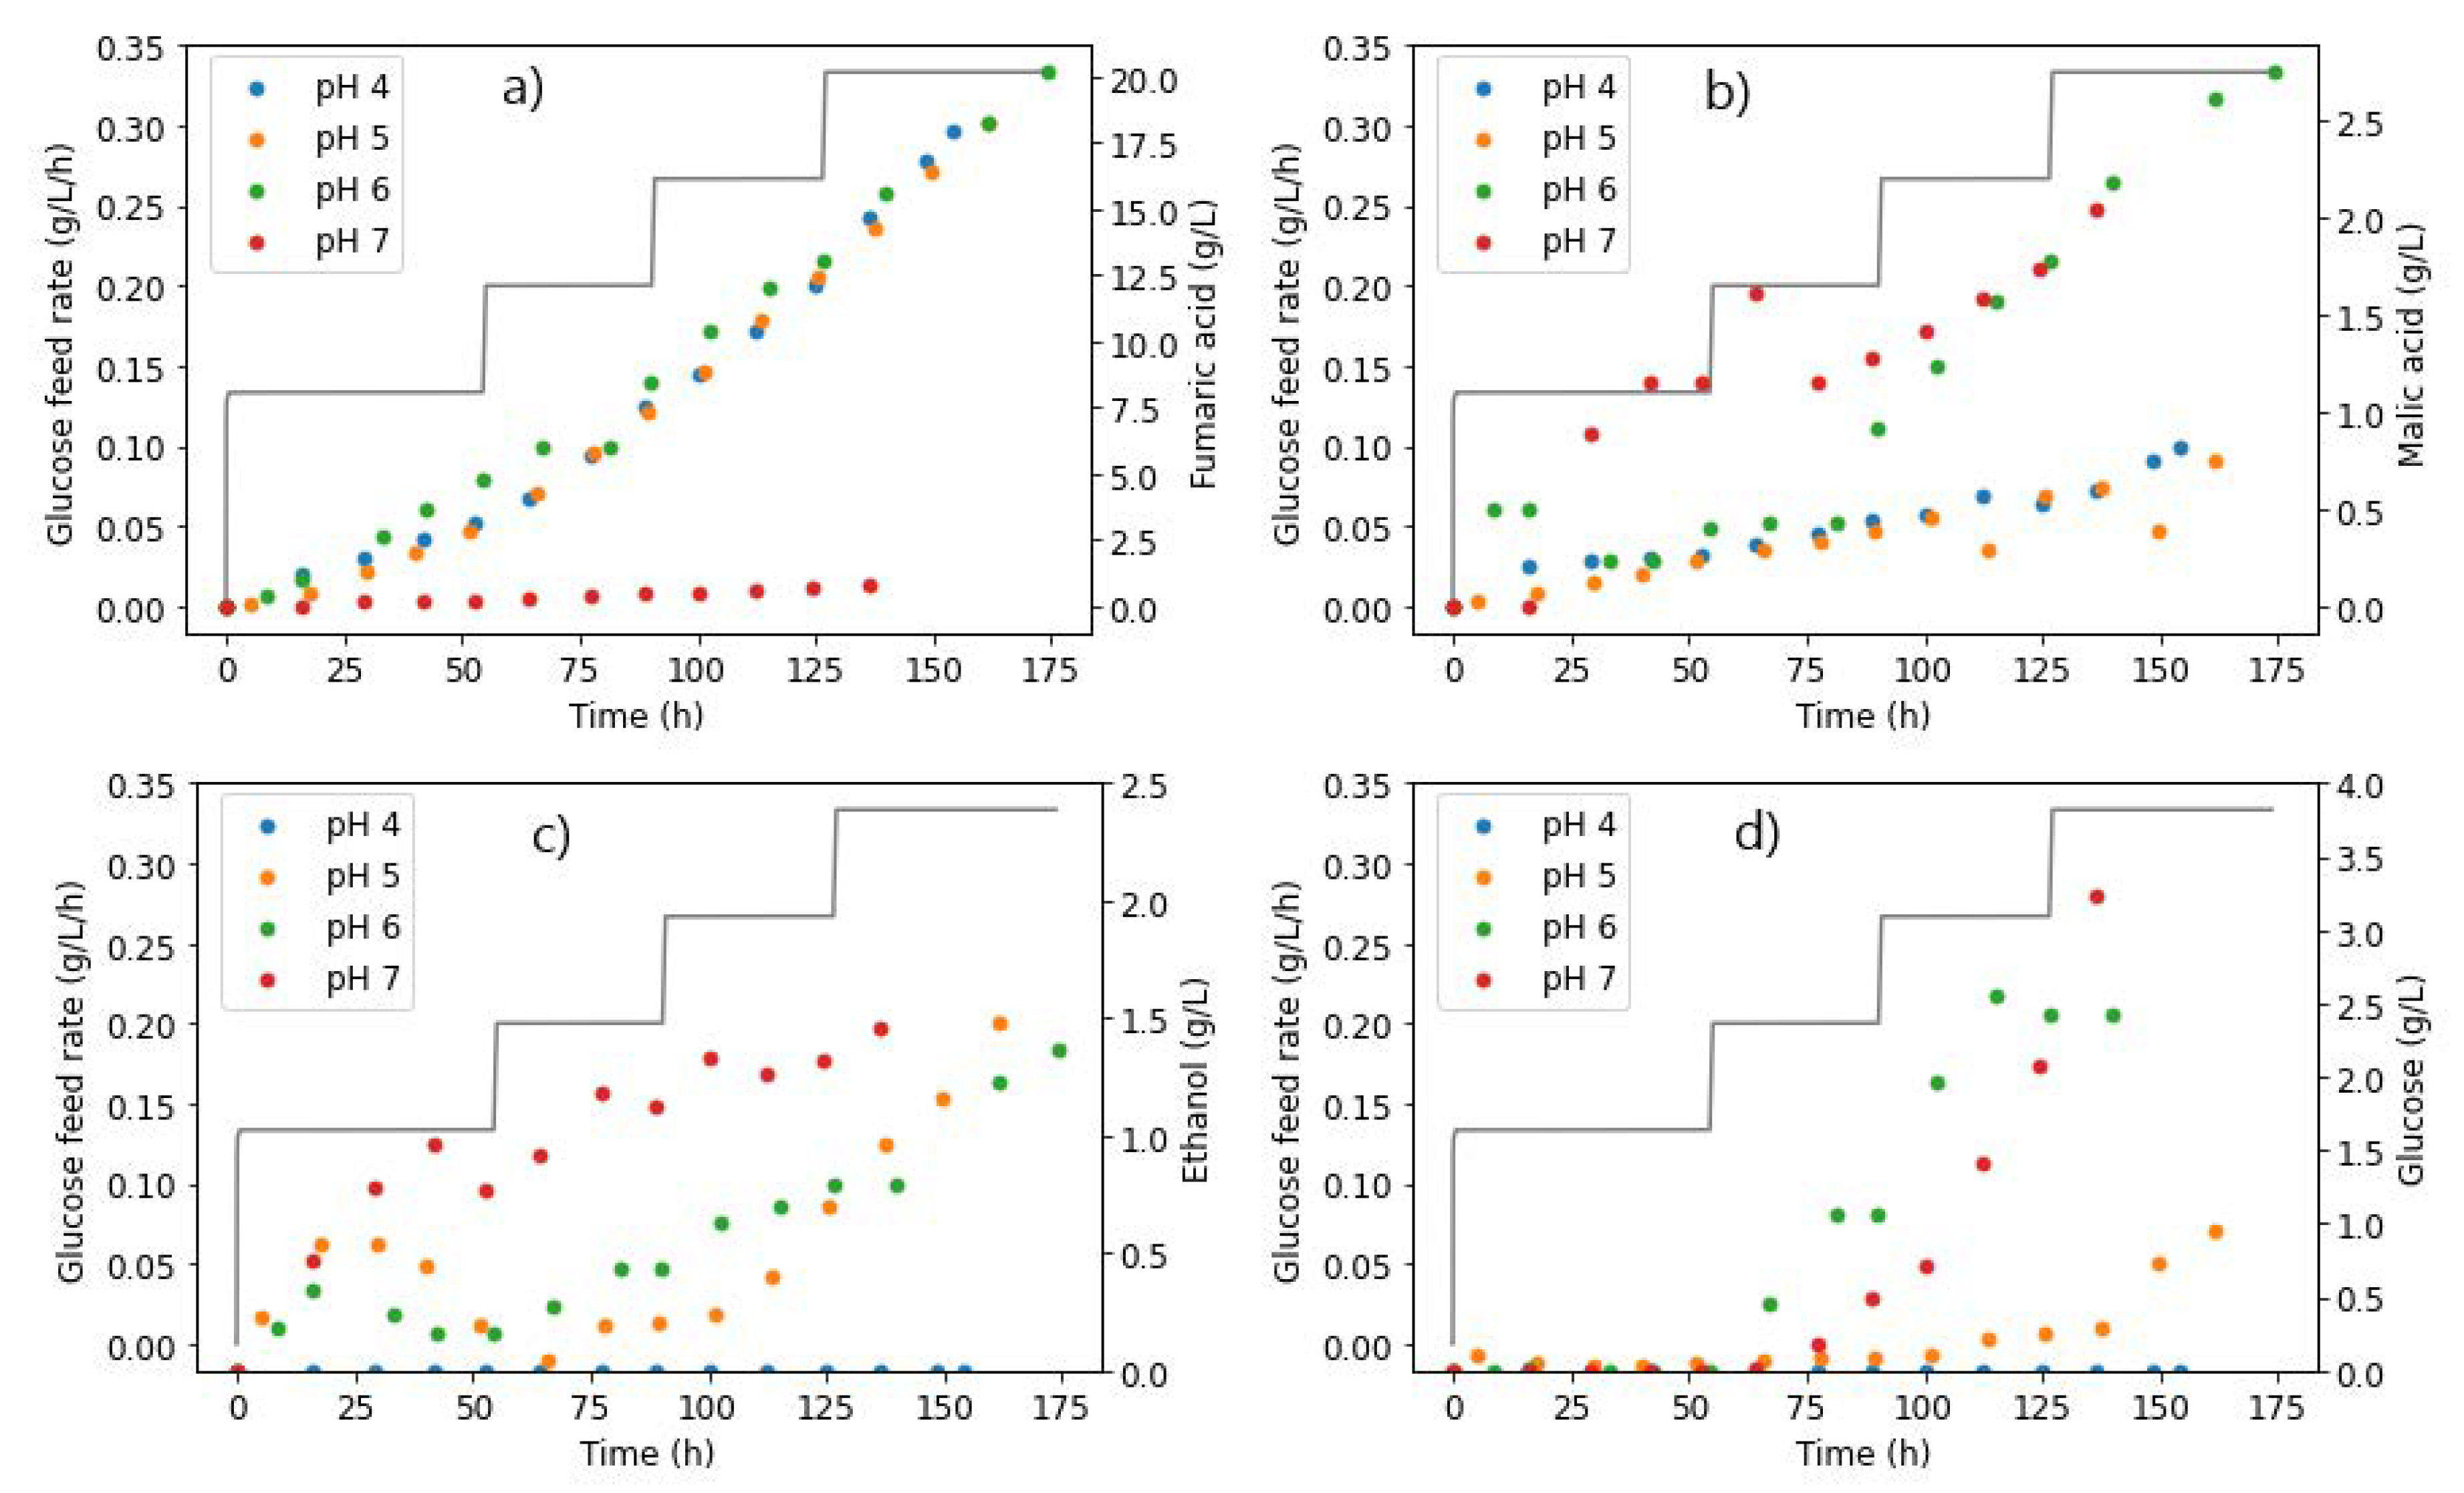
As previously established, the use of CaCO3 results in higher Ca2+ concentrations [24]. Comparison between CaCO3 and MgCO3 indicated some similarities in the responses. Given that the presence of insoluble solids has been ruled out as a potential cause, the next set of experiments were conducted to extract the effect of Ca2+ on the two regimes. Experiments were conducted in a similar structure as the previous run, with 20 g L−1 CaCO3 as the baseline amount (for pH control), to which additional calcium ion concentrations were added (in the form of CaCl2).
It is well established that malate dehydrogenase (MDH), an enzyme located in the cytoplasm, converts oxaloacetate to l-malic acid, which is hydrated (reversibly) to fumaric acid by the enzyme fumarase (FUM) [1]. Friedberg et al. [35] postulated that the reason behind the accumulation of fumaric acid by R. delemar is that a unique FUM induced under acid production conditions would produce fumaric acid, and the reverse reaction would be inhibited by increased amounts of fumaric acid (above 2 mmol L−1). FUM is believed to be encoded by a single gene fumR, and it catalyses the reversible dehydration of l-malic acid to fumaric acid. Zhang et al. [36] attempted to increase fumaric acid production by overexpressing fumR. However, their findings showed that overexpressing fumR increased FUM activities in both reaction directions, resulting in unusually high malic acid yields. Song et al. [29], in a study on the expression and characterisation of fumR from R. delemar, found a slight stimulatory effect of fumR activity with Ca2+.
For the calcium ion tests, additional amounts of 5, 10, and 20 g L−1 Ca2+ were added to the baseline of 20 g L−1 CaCO3 (Figure 6). Glucose consumption showed no significant variations in the lower calcium ion concentrations. However, for the experiments with the additional 20 g L−1 calcium ions, a significant drop in the glucose consumption rate was observed, as shown in Figure 6a. Similarly, fumarate production was hampered at the highest calcium concentration tested, while similar amounts were produced at lower concentrations. Moreover, a lag in MA production resulted, with a significant increase in malate concentrations only recorded over 100 h into the fermentation. This indicated that excessive calcium concentrations had the reverse effect on fumR activity. A proportional increase in glycerol concentrations with increasing calcium ion concentration conditions was also observed, an indication that calcium ions are involved in signalling pathways and stress responses, thus resulting in the formation of unwanted byproducts [24,33].
In Figure 6c, the MA profiles show an interesting trend, with the additional 5 and 10 g L−1 calcium ion concentrations resulting in double the MA titres of the baseline. This corroborates the fact that the response in regime 1 (co-production of FA and MA) likely occurs as a consequence of the increased calcium ion concentrations. This is in tandem with the findings by Song et al. on the slight stimulatory effect of calcium ions on fumR, thus resulting in increased fumarase activity in both directions and, as a consequence, increased malate concentrations [29].

2.6. Effect of pH

2.6.1. Glucose Steps
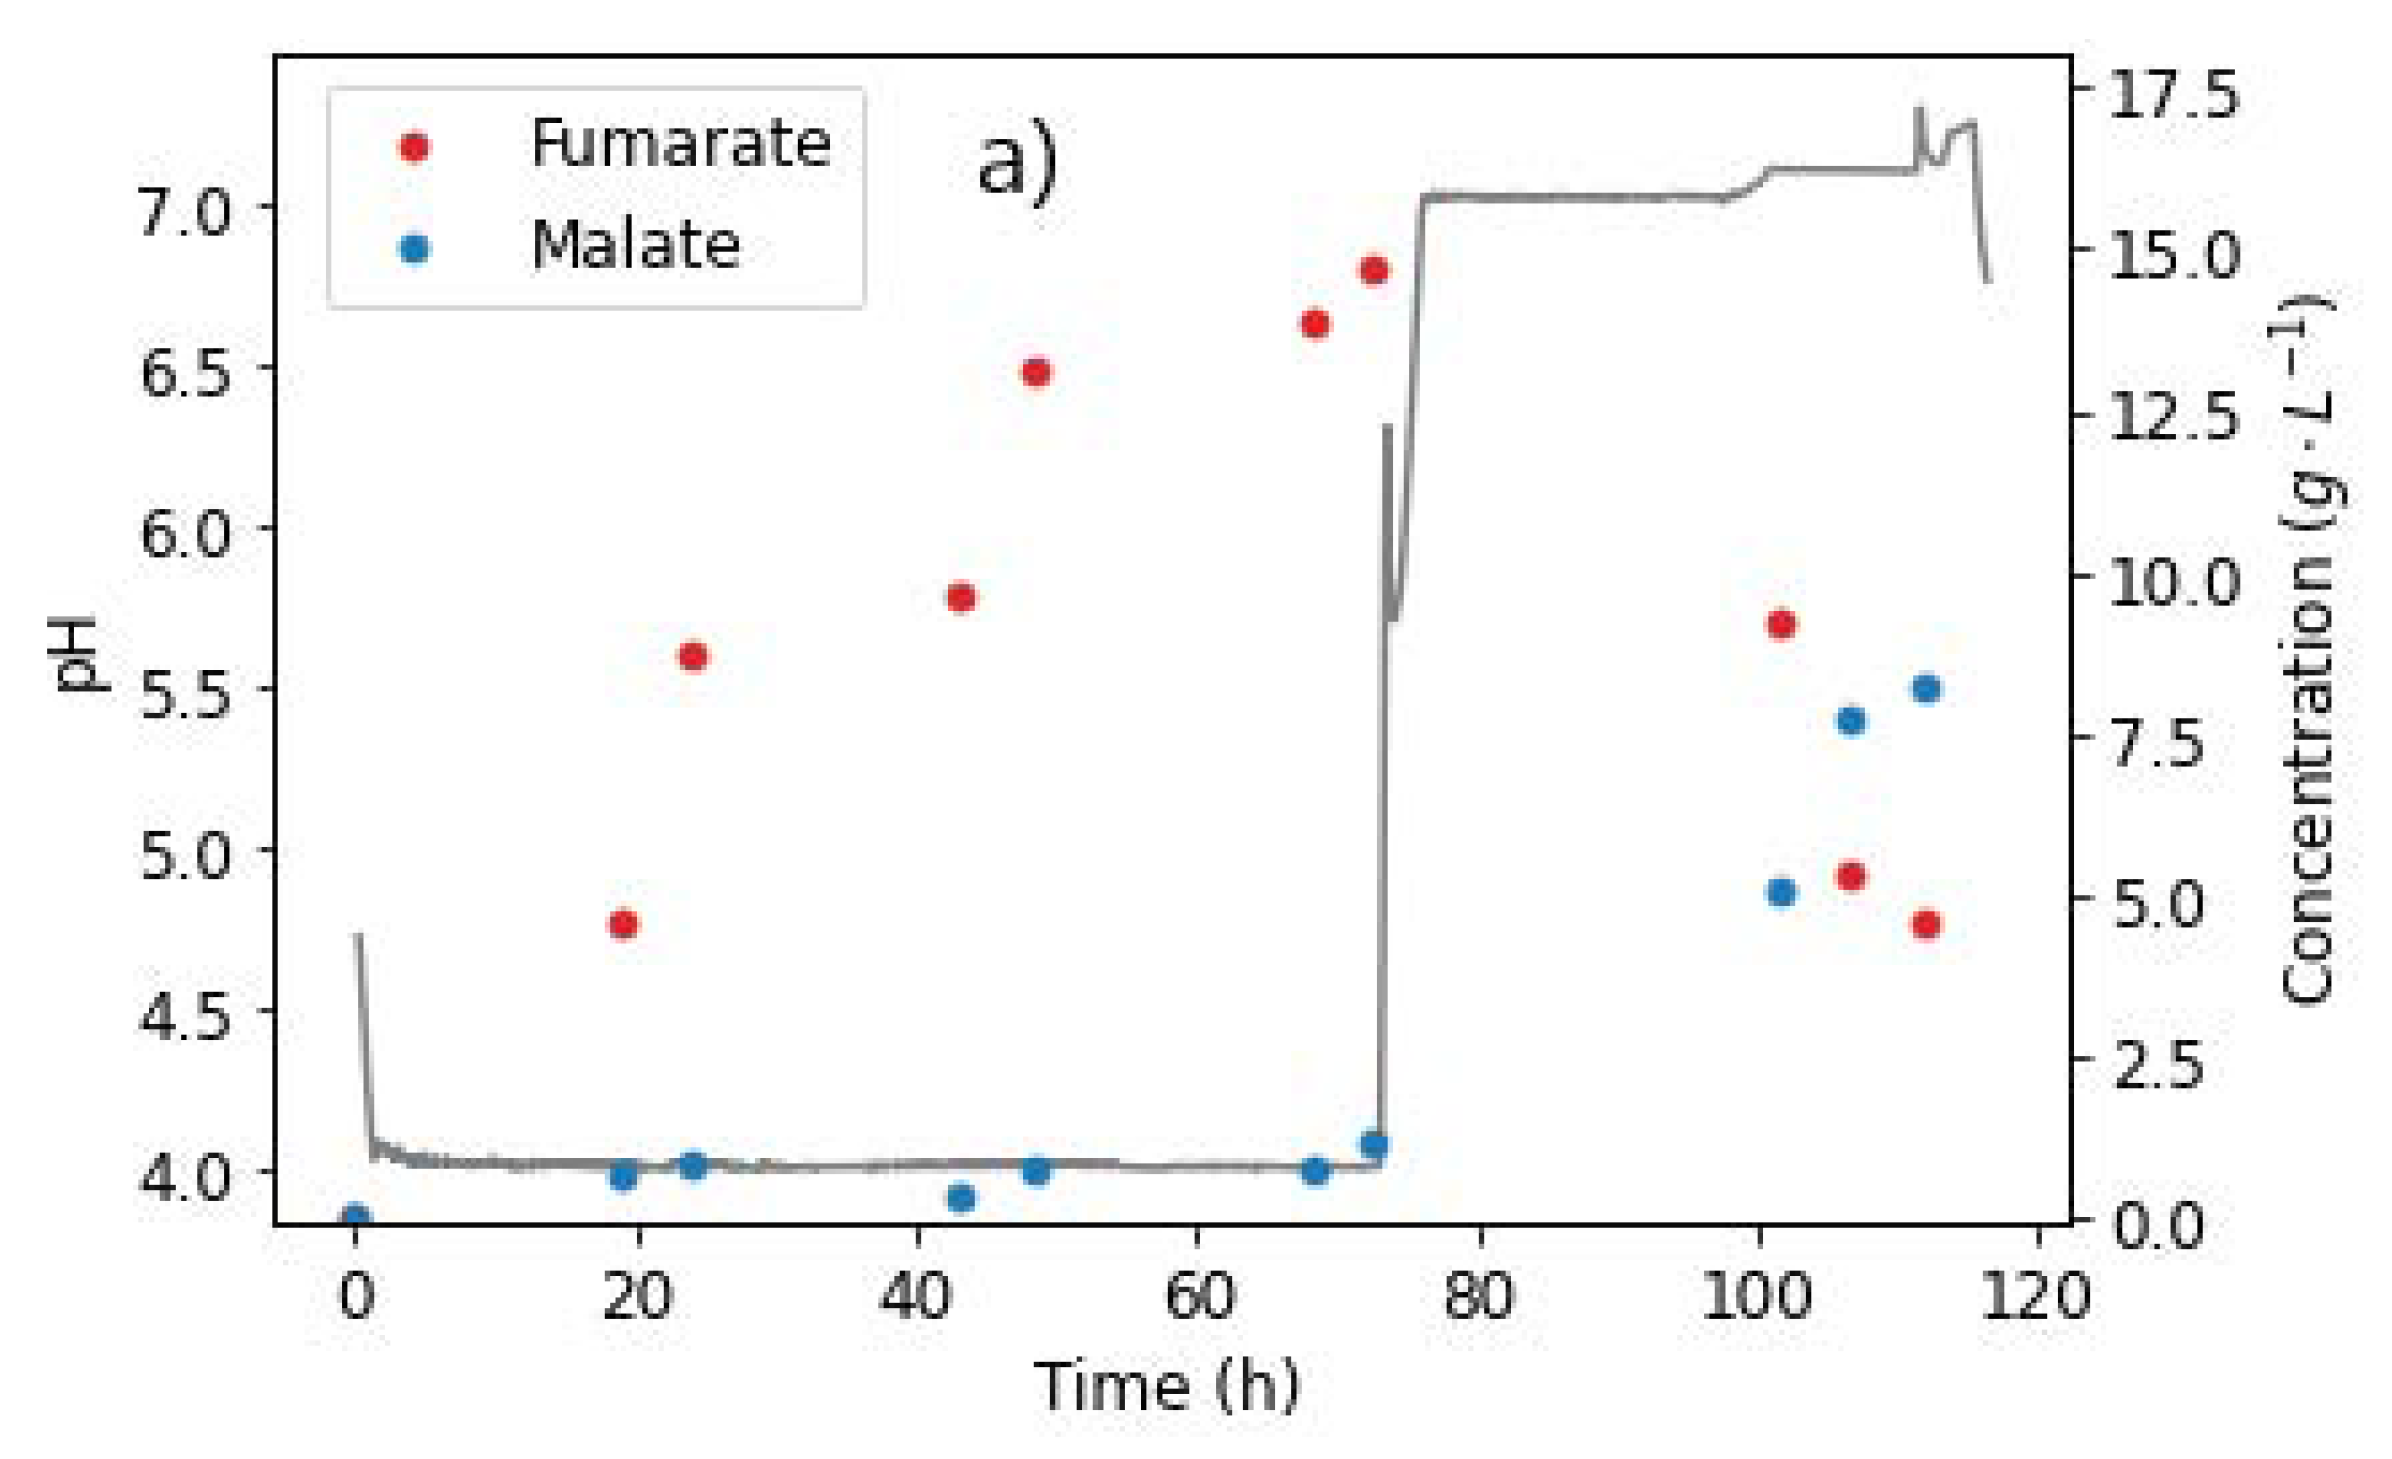
Production of fumaric acid by R. delemar is typically performed at neutral pH values. CaCO3 maintains the pH at around 6.5 in acid-forming microbial processes [23]. The use of neutralising agents not only contributes to a large portion of the production costs, but also leads to environmental waste [20,21]. Studies have shown that R. delemar is able to grow well at a wide temperature range (up to 40 °C) and pH range (4–9), an indication of its robust behaviour and wide application potential [1]. There are some clear benefits in low-pH fermentation, including the formation of the undissociated form of fumaric acid, thus eliminating the need for neutralising agents, leading to simplified downstream processes and significantly lower costs [21]. However, given the increased production of malic acid with R. delemar in fermentations with CaCO3, investigating the role of pH in this response was considered critical.
The first set of experiments involved varying glucose feed rates between 0.131 and 0.329 g L−1 h−1 to investigate the effect of throttling glucose feed rates across four different pH conditions (4–7). Following a similar experimental procedure, Swart et al. determined that R. delemar is a Crabtree-positive organism. This was then useful in discarding ethanol byproduct formation at a glucose feed rate of 0.197 g L−1 h−1 and at pH 5 [20]. Further studies into the role of pH and urea addition on FA production compared three pH conditions (4, 5, and 6). The study found an optimum region for FA production at pH 4, a urea feed rate of 0.625 mg L−1 h−1, and a glucose feed rate of 0.329 g L−1 h−1. Moreover, pH 6 was found to be the least favourable condition with regard to FA production [13]. This section of the research study was therefore considered additive, comparing the previously unstudied pH 7 condition to the other three (4, 5, and 6) [13], with a special focus on investigating the conditions that result in MA production.
The results in Figure 7a confirm the finding that higher-pH conditions were unfavourable for FA production with R. delemar. It can be seen that, compared to pH 4, 5, and 6, negligible amounts of FA were produced at pH 7. However, glucose accumulation did not occur until after around 80 h, an indication of the complete consumption of all glucose fed in this period (Figure 7d). The glucose consumed was mainly directed to MA and ethanol formation, both of which appeared early in the fermentation. Approximately 2.5 times more MA was formed than FA in the pH 7 fermentation, an indication of the drastic change in the response of the organism at pH 7 compared to pH 6.
However, it can be observed in Figure 7b that while relatively high amounts of MA were formed earlier in the fermentation in the pH 7 fermentation, MA production did not drastically increase further with an increase in glucose feed rates, but was instead similar to pH 6. This indicates that carbon was not channelled to MA production in replacement of FA production, therefore implying that a pH increment in conjunction with increased glucose feed rates has a moderate effect on MA production and a significant impact on FA production. Ethanol overflow, on the other hand, occurred right from the start of the fermentation, as seen in Figure 7c. This is in line with the trend of the ethanol overflow point occurring earlier, with increasing pH and glucose feed rates. This can be attributed to the relatively high osmotic and ionic stresses associated with the high pH, resulting in unwanted byproducts [33].
Glucose accumulation was only observed after the second glucose feed step (0.197 g L−1 h−1), similar to the profile observed at pH 6, further establishing the finding that, at a higher pH, less glucose can be consumed [13]. This is clearly illustrated in contrast to the trends observed at lower pH values. In the pH 4 fermentation, there was complete consumption of all glucose at all glucose feed rates, whereas glucose accumulation only occurred at the highest glucose feed rate for the pH 5 fermentation. The implication here is that the inhibition of glucose consumption at higher-pH conditions would hinder the yields of metabolites that could be achieved, in comparison to the lower-pH conditions.

2.6.2. pH Steps

With the ability to control the pH precisely in the reactor, the pH was varied within the same run, from pH 4, with increments of 0.5 until pH 7. The starting pH of 4 was selected as it had been previously determined to be the optimum pH for FA production [13]. Increasing the pH slowly up to 7 ensured a transition from optimal FA production conditions to more suboptimal conditions in the higher-pH conditions, simulating the slight pH increase in the shake flask cultivations owing to increased ethanol concentrations.
A constant glucose feed rate of 0.262 g L−1 h−1 and nitrogen feed rate of 0.625 mg L−1 h−1 were selected for this experiment. This would therefore allow for the investigation into the effect of gradual pH increase on the relative production of FA and MA. The production phase was much longer (477 h) as a test for how long the cells could remain viable. After reaching pH 7, the NaOH dosing was switched off and the pH allowed to naturally drop back to 4. This was to investigate whether the pH effects observed could be reversed with a subsequent drop in pH.
As shown in Figure 8a, fumarate was produced in relatively high amounts, with the final titre recorded as 65.89 g L−1 at the end of the run, corresponding to a yield of 0.527 g g−1. This yield was significantly lower than that previously reported in the homofumarate production of FA at pH 4 (0.93 g g−1), as a result of the inefficiency caused by the consistent pH increase throughout the run [13]. Towards the end of the run, the FA production rate was observed to taper off but was not completely inhibited, as observed in the previous pH 7 only run; see Figure 8. This could be attributed to the slow increase in pH. Moreover, the tapering off of FA corresponds to the slight increase in MA production, with the latter reaching a final concentration of 6.28 g L−1 (Figure 8b). Glucose accumulation starts to occur also at this point. This provides an indication that the FA tapering off could be a result of the conversion of FA to MA. This has only been previously tested with R. delemar at specific conditions and with externally added FA (to be discussed in the next section) [37].
However, the occurrence of similar amounts of other side products, such as glycerol and ethanol, as well as glucose accumulation, indicates that this could be a result of the inefficiencies of high-pH conditions, as observed in the previous glucose step tests. The duration of the run also played a role, given that fewer cells were likely viable towards the end of the run, resulting in inefficient glucose uptake. The results in this section, however, do not explain the characteristic drop in fumarate (observed earlier in regime 2). The next experiment was therefore carefully designed to investigate the in-situ hydration of FA to MA as a likely cause of the response in regime 2.

2.6.3. Hydration of FA to MA

Naude et al. [37], determined that three conditions were critical for the whole-cell hydration of FA to MA by R. delemar: (1) pH 7 or higher, (2) nitrogen starvation, and (3) complete glucose depletion. This neatly corresponds to the conditions in regime 2 that resulted in the characteristic drop in fumarate concentrations. In runs with both calcium carbonate and magnesium carbonate, all final pH conditions were measured as 7 or higher. Given that the runs were batch experiments, the limited amount of nitrogen present was likely completely depleted as the run progressed. Lastly, glucose starvation conditions were clearly present in regime 2, as most of the glucose had already been converted to fumarate and ethanol. Moreover, a significant amount of carbon was also channelled to respiration, based on a mass balance determination.
It was then postulated that the characteristic drop in fumarate concentrations was a result of whole-cell hydration to MA. This was considered a likely explanation as the drop in FA always corresponded to a further increase in MA concentrations. In the experiments with additional calcium ions, it was established that the co-production of FA and MA (regime 1) was a result of increased calcium concentrations. However, as could be observed from the MA profiles (Figure 6c), there was an initial rise in MA concentration, which was then followed by a fairly constant MA profile for the rest of the cultivation period. The continued increase in MA concentration in regime 2 is then postulated to be not a result of increased calcium ion concentrations but, rather, the hydration of FA, resulting in the profiles observed.
In their study, Naude et al. [37] determined the optimum conditions for the hydration of FA to MA, finding that, under aerobic conditions, a significant decrease in production half-life occurred. Moreover, the mass balance closure was only 95%, an indication that some of the FA had been channelled to respiration, decreasing the MA yield. In contrast, the study found that anaerobic conditions resulted not only in faster conversion, but also higher yields. However, their study utilised repeat batch experiments and externally added fumarate in the form of disodium fumarate. Therefore, to the best of our knowledge, the production of FA with R. delemar, followed by the in-situ hydration of FA to MA, has not been previously achieved. An experiment was then designed to attempt this, in order to prove the postulate that the depletion of FA in regime 2 was a result of the hydration of FA to MA.
To test this, pH 4 and pH 7 conditions were selected. In the first 72 h of production, the run was conducted at pH 4, a constant glucose feed rate of 0.329 g L−1 h−1, and a nitrogen feed rate of 0.625 mg L−1 h−1. The above condition was selected as it has been previously established to be the optimum for homofumarate production, corresponding to the highest FA yield reported in the literature with R. delemar [13]. Moreover, this condition also provided an opportunity to exclusively and productively form FA, which was subsequently used for the next phase. Lastly, the fact that no glucose accumulation occurred at this condition was an advantage, as the glucose fed into the reactor could immediately be switched off, quickly ushering in glucose starvation conditions, a critical requirement for the hydration of FA to occur.
After 72 h, approximately 14.71 g L−1 FA and negligible amounts of MA had been produced (Figure 9a). The pH was then increased to 7, and the glucose feed switched to zero. The nitrogen fed was decreased to 0.625 mg L−1 h−1, corresponding to one tenth of the nitrogen previously fed into the reactor. Anaerobic conditions were induced by switching off the gas mixture used previously, consisting of 8% CO2, with 18.4% O2, and purging only CO2 into the reactor. Figure 9 shows the metabolite profiles achieved.
The characteristic drop in fumarate concentrations was observed, while MA titres rapidly increased, as shown in Figure 9a. After 101 h, the FA concentration had dropped to 9.19 g L−1, and MA had increased to 5.09 g L−1. Given the glucose starvation conditions in the reactor, the sudden increase in MA concentrations and the corresponding depletion of FA could only be attributed to the hydration of FA to MA. The run was stopped after 112 h, with the final FA and MA concentrations recorded as 4.61 g L−1 and 8.20 g L−1, respectively. A slight increase in ethanol concentrations was observed after the switch to anaerobic conditions. This was an indication that some of the FA was being used to meet the energy requirements, albeit inefficiently due to the anaerobic conditions, thus resulting in the formation of ethanol.
It can be seen from a comparison of the FA and MA concentrations achieved in this study, in contrast to the titres and productivities previously reported in the literature and shown in Table 2, that fumaric acid production with R. delemar has been well developed and optimised. However, it is clear that there is significant potential for malic acid production with R. delemar, drawing on the insights from the effect of calcium ions and the hydration of FA.
This experiment provided a clear proof of concept—an indication that the drop in fumarate concentrations in regime 2 was a result of the hydration of FA. Moreover, this finding completes the picture of the response in regime 2, explaining the further increase in MA concentrations as well as the depletion of FA. The implication, therefore, is that the responses from the two regimes were a consequence of the following: increased calcium ions initiated the co-production of FA and MA (regime 1). The high initial glucose concentrations in the shake flask cultivations resulted in the maximum respiratory capacity of R. delemar being exceeded and, as a consequence, the production of ethanol in significant quantities. As the fermentation progressed, a slight increase in pH occurred due to increased carbonate concentrations in the fermentation broth. With the onset of glucose and nitrogen starvation conditions, all the requirements for the hydration of FA to MA were attained (regime 2).

3. Materials and Methods

3.1. Microorganism and Culture Conditions

The organism used for this study was R. delemar (ATCC 20344), obtained from the Spanish collection of cultures (Colección Espanola de Cultivos Tipo, Valencia, Spain). All chemicals used were obtained from Merck (Modderfontein, South Africa).

3.1.1. Inoculum Preparation

The spore solution was prepared using the following procedure. Potato dextrose agar (PDA) plates were first prepared and dried aseptically as higher spore concentrations resulted when moisture was removed from the plates before inoculation. The dried PDA plates were then inoculated with a 50% solution of glycerol and water previously stored at −40 °C. The plates were then sealed shut and incubated at 30 °C. After 120 h, the spores were suspended in distilled sterile water, and rehydrated at 25 °C for a period of at least 18 h before inoculation into the pre-culture. This rehydration step was critical in the growth rate and size of pellets that resulted. The spore inoculum used for the pre-culture for biomass growth had a spore concentration of 8 × 10⁶ mL−1.

3.1.2. Shake Flask Cultivations

Pre-Culture for Biomass Formation

A two-stage fermentation method was implemented, consisting of a pre-culture for biomass production and a main culture for acid production [3,22]. The main difference between the two media was the concentrations of the nitrogen source, with the former having a high nitrogen supply to favour cell growth. The pre-culture medium consisted of (in units of g L−1) 30 glucose, 2 urea, 0.6 KH2PO4, and 0.5 MgSO4·7H2O [31]. Components were autoclaved separately at 121 °C for 1 h and thereafter were mixed aseptically. Unless otherwise indicated, all pre-cultures were prepared in cotton-covered 250 mL unbaffled Erlenmeyer flasks, each containing 50 mL pre-culture media and inoculated with the rehydrated spore suspension (2 mL each). The pre-cultures were carried out in a gyratory incubator shaker at 200 RPM and 34 °C for 1 h. The cells from each flask in the pre-culture were used for different fermentations in the main culture, i.e., no mixing of cells occurred between the two fermentation stages.

Main Culture for Acid Production

Batch fermentations were studied in the same 50 mL unbaffled Erlenmeyer flasks. Unless otherwise noted, the switch to production followed this procedure: 30 mL of the pre-culture media (inclusive of the cells) was transferred into 90 mL of the fermentation media for each flask, resulting in a final composition (in units of g L−1) of 100 glucose, 0.8 KH2PO4, and 0.6 MgSO4·7H2O [31].
For the initial CaCO3 experiments, CaCO3 concentrations were varied within 20–100 g L−1, and all experimental conditions performed in triplicate. All components were sterilised separately by autoclaving at 121 °C for 1 h. The main cultures were carried out in a gyratory incubator shaker at 200 RPM and 34 °C for around 200 h. The pH was measured and recorded at the end of the cultivation period.
In all subsequent experiments, pre-culture conditions were kept exactly the same. Further experiments conducted to compare CaCO3 to MgCO3 involved similar mass-based amounts of alkali for ease of comparison of the resultant data. Three different CaCO3 and MgCO3 concentrations were tested, 20, 60, and 100 g L−1, with all conditions performed in triplicate. All fermentations had an initial substrate (glucose) concentration of around 100 g L−1.
Plaster sand (PS) was used to simulate the conditions in the fermentation broth with CaCO3 and MgCO3 buffered cultures. A sieve analysis was conducted to compare the particle size distribution of plaster sand and CaCO3, by determining the amount of particles retained on a nest of sieves with differently sized apertures, ranging from 0.075 to 2 mm. As the sieves vibrated, the sample was segregated onto the differently sized sieves, and the weight of sample retained and then used to determine the particle size distribution. Given the need for pH control, a baseline amount of 20 g L−1 was used for all conditions tested. In addition to the baseline CaCO3, three different concentrations of PS were tested: 40, 80, and 120 g L−1.
Tests on the effect of calcium ions were conducted using a similar procedure with 20 g L−1 used as the baseline amount (for pH control) and additional amounts of 5, 10, and 20 g L−1 calcium ions added to the baseline in the form of CaCl2. All other fermentation conditions were maintained as described earlier.

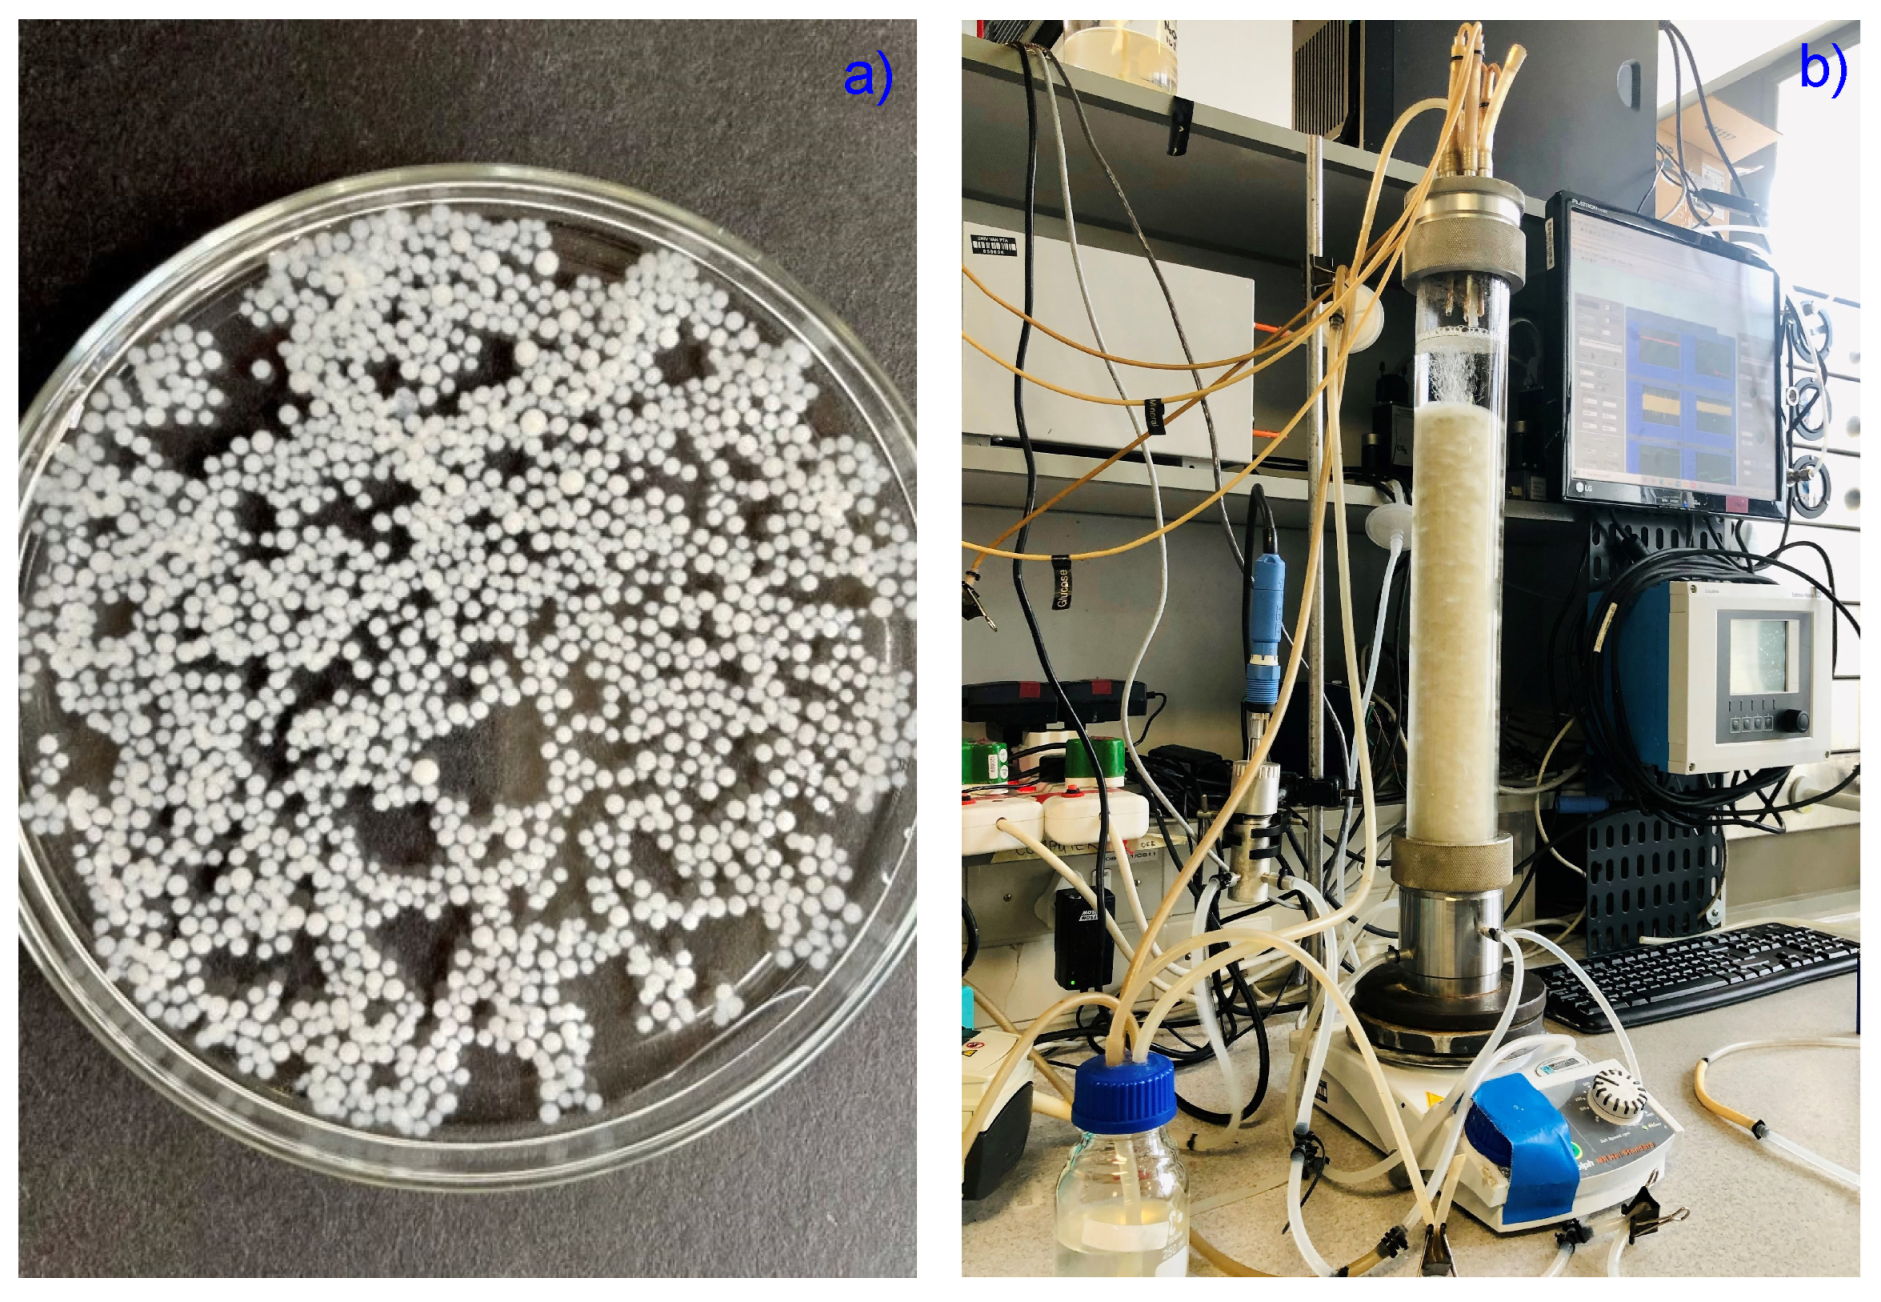
3.1.3. Immobilised Reactor Cultivations

Medium

A 10 M NaOH solution was used as pH control to minimise dilution [20,32]. Biomass was grown under batch conditions with 3.1 g L−1 glucose and 2.0 g L−1 urea [20]. The minimal medium for continuous production contained (in units of g L−1) 0.6 KH2PO4, 0.507 MgSO4·7H2O, 0.0176 ZnSO4·7H2O, and 0.0005 FeSO4·7H2O [42]. Glucose and urea were absent in the minimal media as they were fed continuously into the reactor during the course of the production run. High glucose and urea concentrations (340 g L−1 and 16 g L−1, respectively) were utilised to achieve low dilution rates during the production phase. All solutions were autoclaved at 121 °C for 60 min [20].

Reactor Operation and Experimental Design

An immobilised reactor was used with a liquid volume of 1.08 L and a gas volume of 0.380 L. The reactor design was adapted from previous research work on fumarate production by immobilised R. delemar [20,32]. All growth phases were controlled at a pH of 5. Urea was fed at a constant rate of 0.625 mg L−1 h−1 for all the experiments. Further information on the reactor operation can be found in the previous research studies [13,20,32,43].
All fermentations were performed in two separate stages: the aerobic growth of the fungus, followed by an aerobic non-growth production stage induced by nitrogen limitation. Medium replacements were done between the growth phase and the production phase. Experiments on the effect of glucose feed rates and pH were conducted by throttling glucose feed rates between 0.131 g L−1 h−1 and 0.329 g L−1 h−1. The glucose feed rate was increased from 0.131 g L−1 h−1 to 0.329 g L−1 h−1, with the duration of around 36 h between each increment. The production phase was conducted for around 200 h. The glucose feed rates were tested across cultures maintained at four different pH conditions: 4, 5, 6, and 7. This was well within the pH range in which R. delemar is able to withstand [1].
The next set of experiments (pH steps) involved varying pH conditions within the same run. A constant glucose feed rate of 0.262 g L−1 h−1 was selected and pH varied from pH 4, with increments of 0.5 until pH 7. The starting pH of 4 was selected as it had been previously determined to be the optimum pH for FA production [13]. The production phase was conducted for around 477 h, as a test for how long the cells could remain viable. After reaching pH 7, the NaOH dosing line was switched off and the pH allowed to naturally drop back to 4. The slow variations in pH were intended to simulate the pH conditions in the shake flask experiments.
For the last test on the hydration of FA to MA, pH 4 and pH 7 conditions were selected. In the first 72 h of production, the run was conducted at pH 4 and at a constant glucose feed rate of 0.329 g L−1 h−1. The nitrogen feed rate was 0.625 mg L−1 h−1. The above conditions were selected as they had been previously established to be the optimum for homofumarate production, corresponding to the highest FA yield reported in the literature with R. delemar [13]. After 72 h, the pH was then increased to 7, and the glucose feed switched to zero. The nitrogen fed was decreased to 0.0625 mg L−1 h−1, corresponding to one tenth of the nitrogen previously fed into the reactor. Anaerobic conditions were induced by switching off the gas mixture used previously, consisting of 8% CO2, with 18.4% O2, and purging only CO2 into the reactor.

3.2. Sample Preparation

The use of calcium carbonate as a neutralising agent presents a number of problems, including high broth viscosity (which is detrimental to equipment) and increased downstream costs. This is not only because calcium carbonate is insoluble, but also the use of calcium carbonate results in the formation of calcium malate and calcium fumarate, which have relatively low solubility. The following sample preparation procedure was used to dissolve the precipitated organic acids: 1 mL of a well-mixed culture broth was mixed with 1 mL of 1 M HCl and 18 mL of distilled water. The mixture was incubated at 80 °C for 20 min and vortexed several times during the incubation time. An aliquot was transferred to a 1.5 mL test tube and centrifuged for 5 min at 20,000 × g in a desktop centrifuge. The clear supernatant was directly used for HPLC analysis.

3.3. Analytical Methods

Liquid samples (1 mL) were collected every 1 h using a single-channel pipette with replaceable pipette tips that were autoclaved at 121 °C for 20 min to avoid any contaminations in the cultivation media. pH measurements in the shake flask cultivations were not possible mid-run, and were only recorded after the end of the cultivation period. HPLC was used to quantify the liquid fermentation metabolite concentrations: glucose, ethanol, fumarate, malate pyruvate, and glycerol. The analyses were performed using an Agilent 1260 Infinity HPLC (Agilent Technologies, Santa Clara, CA, USA) equipped with a refractive index (RI) exchange column (Bio-Rad Laboratories, Hercules, CA, USA). The mobile phase detector (55 °C) and a 300 mm × 7.8 mm Aminex HPX-87H ion (0.3 mL L−1 H2SO4) were used. The flow rate was 0.6 mL min−1 with a column temperature of 60 °C. Outlet gas composition (CO2 and O2) was measured using a tandem gas analyser (Magellan Biotech, Borehamwood, UK). The AMETEK Spectro Arcos ICP-OES analyzer (Berwyn, PA, USA) was used to determine the concentrations of metal ions in the fermentation cultures. A sieve analysis was carried out using a nest of Labotec test sieves arranged in decreasing size from top to bottom (size ranging from 0.075 to 2 mm) (Midrand, South Africa). This was used to determine the particle size distribution of the insoluble solids. Cell morphology was examined using a Zeiss stereo discovery microscope (Zeiss, Oberkochen, Germany).

4. Conclusions

pH plays a critical role in microbial cultures as it directly affects the homeostasis of the microbe due to changes in acid dissociation, enzyme activities, equilibrium conditions, the diffusion of nutrients into and out of the microbes, and the efficiency of energy-producing mechanisms. Calcium carbonate has been used extensively in shake flask fermentations due to its ability to offer continuous neutralisation, a consequence of its poor solubility. By varying calcium carbonate concentrations in shaker flask experiments of R. delemar, two clear regimes were observed: the co-production of FA and MA, and subsequently, the depletion of FA. The co-production of FA and MA was conclusively linked to increased calcium ion concentrations, a factor of the increased presence of CaCO3. However, the sustained increase in MA concentrations in regime 2, as FA concentrations dropped, could not be attributed to calcium ions. It was determined that increased concentrations of insoluble solids neither had an effect on glucose consumption nor the relative production of FA and MA. An underlying pH trend was observed in the shake flask fermentations. By carefully increasing the pH in a continuous flow reactor of R. delemar, the reason for the drop in FA concentrations was uncovered as the hydration of FA to MA, which occurs at pH 7 (or higher), and at glucose and nitrogen starvation conditions.
These observations were validated in a continuous flow system in which 10.1 g L−1 of in-situ-produced FA (at pH 4) was hydrated to 7.41 g L−1 MA (at pH 7). This study provides the first known evidence for the in-situ whole-cell generation of FA and subsequent hydration of FA to MA by R. delemar in a single reactor system. Constituently, the findings presented in this study provide a relatively simple approach for the sustainable production of malic acid from R. delemar.

Supplementary Materials

The following are available online at https://www.mdpi.com/article/10.3390/catal12030263/s1, Figure S1. Metabolite distribution of Rhizopus delemar with the minor components including biomass, succinic acid and pyruvic acid. Cultures were incubated at 34 °C, 200 rpm in the presence of 20 g/L CaCO3. Figure S2. Metabolite distribution of Rhizopus delemar with the minor components including biomass, succinic acid and pyruvic acid. Cultures were incubated at 34 °C, 200 rpm in the presence of 60 g/L CaCO3. Figure S3. Metabolite distribution of Rhizopus delemar with the minor components including biomass, succinic acid and pyruvic acid. Cultures were incubated at 34 °C, 200 rpm in the presence of 60 g/L CaCO3. Figure S4. Extracellular concentrations of glycerol during shake ask cultivation of R. delemar with diferent plaster sand concentrations. Results are the mean of triplicate experiments and error bars indicate the standard deviation. Figure S5. Extracellular concentrations of glycerol during shake ask cultivation of R. delemar with different calcium ion concentrations. 20 g L−1 CaCO3 was used for pH control as a baseline amount in these experiments and additional 5, 10 and 20 g L−1 calcium ions were added onto the baseline in the form of CaCl3.

Author Contributions

Conceptualisation, D.K.R. and H.B.; methodology, D.K.R. and R.M.S.; software, D.K.R. and R.M.S.; validation, D.K.R. and R.M.S.; formal analysis, D.K.R.; investigation, D.K.R. and R.M.S.; resources, H.B.; data curation, D.K.R.; writing—original draft preparation, D.K.R.; writing—review and editing, D.K.R., R.M.S., H.B. and W.N.; visualisation, D.K.R. and R.M.S.; supervision, W.N. and H.B.; project administration, D.K.R.; funding acquisition, D.K.R. All authors have read and agreed to the published version of the manuscript.

Funding

This research received no external funding.

Data Availability Statement

The data presented in this study are openly available in the University of Pretoria Research Data Repository at DOI: 10.25403/UPresearchdata.19229979.

Conflicts of Interest

The authors declare no conflict of interest.

Abbreviations

The following abbreviations are used in this manuscript:
MAMalic acid
FAFumaric acid
DOEDepartment of Energy
ICPInductively coupled plasma
ATCCAmerican Type Culture Collection
OESOptical emission spectrometry
ATPAdenosine triphosphate
RPMRevolutions per minute
CxConcentration of components (g L−1)
PSPlaster sand
Δ G 0 Gibbs free energy (kJ mol−1)
FUMFumarase
TCATricarboxylic acid
MDHMalate dehydrogenase

References

  1. Meussen, B.J.; de Graaff, L.H.; Sanders, J.P.M.; Weusthuis, R.A. Metabolic engineering of Rhizopus oryzae for the production of platform chemicals. Appl. Microbiol. Biotechnol. 2012, 94, 875–886. [Google Scholar] [CrossRef] [Green Version]
  2. Martin-Dominguez, V.; Bouzas-Santiso, L.; Martinez-Peinado, N.; Santos, V.E.; Ladero, M. Kinetic modelling of the coproduction process of fumaric and malic acids by Rhizopus arrhizus NRRL 1526. Processes 2020, 8, 188. [Google Scholar] [CrossRef] [Green Version]
  3. Kövilein, A.; Umpfenbach, J.; Ochsenreither, K. Biotechnology for Biofuels Acetate as substrate for L-malic acid production with Aspergillus oryzae DSM 1863. Biotechnol. Biofuels 2021, 48, 14. [Google Scholar] [CrossRef]
  4. Sebastian, J.; Hegde, K.; Kumar, P.; Rouissi, T.; Brar, S.K. Bioproduction of fumaric acid: An insight into microbial strain improvement strategies. Crit. Rev. Biotechnol. 2019, 39, 817–834. [Google Scholar] [CrossRef] [PubMed]
  5. Werpy, T.; Petersen, G. Top Value Added Chemicals from Biomass Volume I; National Renewable Energy Laboratory: Golden, CO, USA, 2004; 76p. [Google Scholar] [CrossRef] [Green Version]
  6. Xu, G.; Chen, X.; Liu, L.; Jiang, L. Fumaric acid production in Saccharomyces cerevisiae by simultaneous use of oxidative and reductive routes. Bioresour. Technol. 2013, 148, 91–96. [Google Scholar] [CrossRef] [PubMed]
  7. Goldberg, I.; Rokem, J.S.; Pines, O. Organic acids: Old metabolites, new themes. J. Chem. Technol. Biotechnol. 2006, 81, 1601–1611. [Google Scholar] [CrossRef]
  8. Zhou, Z.; Du, G.; Hua, Z.; Zhou, J.; Chen, J. Optimization of fumaric acid production by Rhizopus delemar based on the morphology formation. Bioresour. Technol. 2011, 102, 9345–9349. [Google Scholar] [CrossRef]
  9. Li, X.; Gu, X.; Lai, C.; Ouyang, J.; Yong, Q. Production of Fumaric Acid by Rhizopus oryzae in Simultaneous Saccharification and Fermentation using Xylo-Oligosaccharides Manufacturing Waste Residue. BioResources 2016, 11, 8831–8843. [Google Scholar] [CrossRef] [Green Version]
  10. Huang, L.; Wei, P.; Zang, R.; Xu, Z.; Cen, P. High-throughput screening of high-yield colonies of Rhizopus oryzae for enhanced production of fumaric acid. Ann. Microbiol. 2010, 60, 287–292. [Google Scholar] [CrossRef]
  11. Roa Engel, C.A.; Straathof, A.J.; Zijlmans, T.W.; Van Gulik, W.M.; Van Der Wielen, L.A. Fumaric acid production by fermentation. Appl. Microbiol. Biotechnol. 2008, 78, 379–389. [Google Scholar] [CrossRef] [PubMed] [Green Version]
  12. Abe, A.; Oda, Y.; Asano, K.; Sone, T. Rhizopus delemar is the proper name for Rhizopus oryzae fumaric-malic acid producers. Mycologia 2007, 99, 714–722. [Google Scholar] [CrossRef] [PubMed]
  13. Swart, R.M.; Ronoh, D.K.; Brink, H.; Nicol, W. Continuous Production of Fumaric Acid with Immobilised Rhizopus oryzae: The Role of pH and Urea Addition. Catalysts 2022, 12, 82. [Google Scholar] [CrossRef]
  14. Cao, N.; Du, J.; Gong, C.S.; Tsao, G.T. Simultaneous Production and Recovery of Fumaric Acid from Immobilized Rhizopus oryzae with a Rotary Biofilm Contactor and an Adsorption Column. Appl. Environ. Microbiol. 1996, 62, 2926–2931. [Google Scholar] [CrossRef] [PubMed] [Green Version]
  15. Skory, C.D. Lactic acid production by Rhizopus oryzae transformants with modified lactate dehydrogenase activity. Appl. Microbiol. Biotechnol. 2004, 64, 237–242. [Google Scholar] [CrossRef] [PubMed]
  16. Ferreira, J.A.; Lennartsson, P.R.; Edebo, L.; Taherzadeh, M.J. Zygomycetes-based biorefinery: Present status and future prospects. Bioresour. Technol. 2013, 135, 523–532. [Google Scholar] [CrossRef] [Green Version]
  17. Braaksma, M.; van den Berg, R.A.; van der Werf, M.J.; Punt, P.J. A Top-Down Systems Biology Approach for the Identification of Targets for Fungal Strain and Process Development. In Cellular and Molecular Biology of Filamentous Fungi; John Wiley & Sons, Ltd.: Hoboken, NJ, USA, 2010; Chapter 3; pp. 25–35. [Google Scholar] [CrossRef]
  18. Gangl, I.C.; Weigand, W.A.; Keller, F.A. Economic comparison of calcium fumarate and sodium fumarate production byRhizopus arrhizus. Appl. Biochem. Biotechnol. Part A 1990, 24–25, 663–677. [Google Scholar] [CrossRef]
  19. Zhou, Y.; Du, J.; Tsao, G.T. Comparison of fumaric acid production by Rhizopus oryzae using different neutralizing agents. Bioprocess Biosyst. Eng. 2002, 25, 179–181. [Google Scholar] [CrossRef] [PubMed]
  20. Swart, R.M.; Le Roux, F.; Naude, A.; De Jongh, N.W.; Nicol, W. Fumarate production with Rhizopus oryzae: Utilising the Crabtree effect to minimise ethanol by-product formation. Biotechnol. Biofuels 2020, 13, 22. [Google Scholar] [CrossRef] [PubMed]
  21. Liu, Y.; Lv, C.; Xu, Q.; Li, S.; Huang, H.; Ouyang, P. Enhanced acid tolerance of Rhizopus oryzae during fumaric acid production. Bioprocess Biosyst. Eng. 2015, 38, 323–328. [Google Scholar] [CrossRef]
  22. Roa Engel, C.A.; Van Gulik, W.M.; Marang, L.; Van der Wielen, L.A.; Straathof, A.J. Development of a low pH fermentation strategy for fumaric acid production by Rhizopus oryzae. Enzym. Microb. Technol. 2011, 48, 39–47. [Google Scholar] [CrossRef]
  23. Salek, S.S.; van Turnhout, A.G.; Kleerebezem, R.; van Loosdrecht, M.C. pH control in biological systems using calcium carbonate. Biotechnol. Bioeng. 2015, 112, 905–913. [Google Scholar] [CrossRef] [PubMed]
  24. Zelle, R.M.; De Hulster, E.; Kloezen, W.; Pronk, J.T.; Van Maris, A.J. Key process conditions for production of C4 dicarboxylic acids in bioreactor Batch cultures of an engineered saccharomyces cerevisiae strain. Appl. Environ. Microbiol. 2010, 76, 744–750. [Google Scholar] [CrossRef] [PubMed] [Green Version]
  25. Chi, Z.; Wang, Z.P.; Wang, G.Y.; Khan, I.; Chi, Z.M. Microbial biosynthesis and secretion of L-malic acid and its applications. Crit. Rev. Biotechnol. 2016, 8551, 99–107. [Google Scholar] [CrossRef] [PubMed]
  26. Geyer, M.; Onyancha, F.M.; Nicol, W.; Brink, H.G. Malic Acid Production by Aspergillus Oryzae: The Role of CaCO3. Chem. Eng. Trans. 2018, 70, 1801. [Google Scholar] [CrossRef]
  27. Karaffa, L.; Fekete, E.; Kubicek, C.P. The role of metal ions in fungal organic acid accumulation. Microorganisms 2021, 9, 1267. [Google Scholar] [CrossRef] [PubMed]
  28. Vassilev, N. Organic acid production by immobilized filamentous fungi. Top. Catal. 1991, 5, 188–190. [Google Scholar] [CrossRef]
  29. Song, P.; Li, S.; Ding, Y.; Xu, Q.; Huang, H. Expression and characterization of fumarase (FUMR) from Rhizopus oryzae. Fungal Biol. 2011, 115, 49–53. [Google Scholar] [CrossRef] [PubMed]
  30. Zhou, Y. Fumaric acid Fermentation by Rhizopus oryzae in Submerged Systems. Ph.D. Thesis, Purdue University, Ann Arbor, MI, USA, 1999. [Google Scholar]
  31. Zhang, K.; Yu, C.; Yang, S.T. Effects of soybean meal hydrolysate as the nitrogen source on seed culture morphology and fumaric acid production by Rhizopus oryzae. Process Biochem. 2015, 50, 173–179. [Google Scholar] [CrossRef]
  32. Naude, A.; Nicol, W. Fumaric acid fermentation with immobilised Rhizopus oryzae: Quantifying time-dependent variations in catabolic flux. Process Biochem. 2017, 56, 8–20. [Google Scholar] [CrossRef]
  33. Taymaz-Nikerel, H.; Jamalzadeh, E.; Borujeni, A.E.; Verheijen, P.J.; Van Gulik, W.M.; Heijnen, S.J. A thermodynamic analysis of dicarboxylic acid production in microorganisms. Biothermodynamics 2013, 2013, 547–579. [Google Scholar]
  34. Goldberg, R.N.; Gajewski, E.; Steckler, D.K.; Tewari, Y.B. Thermodynamics of the conversion of aqueous L-Aspartic acid to fumaric acid and ammonia. Biophys. Chem. 1986, 24, 13–23. [Google Scholar] [CrossRef]
  35. Friedberg, D.; Peleg, Y.; Monsonego, A.; Maissi, S.; Battat, E.; Rokem, J.S.; Goldberg, I. The fumR gene encoding fumarase in the filamentous fungus Rhizopus oryzae: Cloning, structure and expression. Gene 1995, 163, 139–144. [Google Scholar] [CrossRef]
  36. Zhang, K.; Yang, S.T.; Chalmers, J.J.; Wood, D. Fumaric Acid Fermentation by Rhizopus oryzae with Integrated Separation Technologies; The Ohio State University: Columbus, OH, USA, 2012; pp. 1–210. [Google Scholar]
  37. Naude, A.; Nicol, W. Malic acid production through the whole-cell hydration of fumaric acid with immobilised Rhizopus oryzae. Biochem. Eng. J. 2018, 137, 152–161. [Google Scholar] [CrossRef]
  38. Gu, C.; Zhou, Y.; Liu, L.; Tan, T.; Deng, L. Production of fumaric acid by immobilized Rhizopus arrhizus on net. Bioresour. Technol. 2013, 131, 303–307. [Google Scholar] [CrossRef] [PubMed]
  39. Fu, Y.Q.; Li, S.; Chen, Y.; Xu, Q.; Huang, H.; Sheng, X.Y. Enhancement of fumaric acid production by Rhizopus oryzae using a two-stage dissolved oxygen control strategy. Appl. Biochem. Biotechnol. 2010, 162, 1031–1038. [Google Scholar] [CrossRef] [PubMed]
  40. Xu, Q.; Li, S.; Huang, H.; Wen, J. Key technologies for the industrial production of fumaric acid by fermentation. Biotechnol. Adv. 2012, 30, 1685–1696. [Google Scholar] [CrossRef] [PubMed]
  41. Liu, H.; Hu, H.; Jin, Y.; Yue, X.; Deng, L.; Wang, F.; Tan, T. Co-fermentation of a mixture of glucose and xylose to fumaric acid by Rhizopus arrhizus RH 7-13-9#. Bioresour. Technol. 2017, 233, 30–33. [Google Scholar] [CrossRef] [PubMed]
  42. Zhou, Y.; Du, J.; Tsao, G.T. Mycelial pellet formation by Rhizopus oryzae ATCC 20344. Appl. Biochem. Biotechnol.—Part A Enzym. Eng. Biotechnol. 2000, 84–86, 779–789. [Google Scholar] [CrossRef]
  43. Jongh, N.W.D.; Swart, R.M.; Nicol, W.; Engineering, B. Fed-batch growth of Rhizopus oryzae: Eliminating ethanol formation by controlling glucose addition. Biochem. Eng. J. 2021, 169, 107961. [Google Scholar] [CrossRef]
Figure 1. Cell morphology of R. delemar at the end of growth phase in (a) shake flask cultivations and (b) immobilised reactor cultivations. Pellets in shake flask seed cultures were incubated at 34 °C, pH 5, 200 RPM, and 24 h growth duration, resulting in pellets with 0.9 mm diameter. The growth phase in the immobilised reactor was conducted at pH 5 and 35 °C. The biofilm that resulted had a thickness of ∼1 mm.
Catalysts 12 00263 g001
Figure 2. Extracellular concentrations of glucose and metabolites during shake flask cultivation of R. delemar on 100 g L−1 glucose, in the presence of (a) 20 g L−1 CaCO3, (b) 60 g L−1 CaCO3, and (c) 100 g L−1 CaCO3. Cultures were incubated at 34 °C and 200 RPM. Results are the mean of triplicate experiments and error bars indicate the standard deviation.
Catalysts 12 00263 g002
Figure 3. Comparison between the glucose, FA, and MA profiles in shake flask cultivations with CaCO3 and MgCO3 concentrations varied between 20 and 100 g L−1. Regimes 1 and 2 indicate the co-production and fumarate depletion phases, respectively.
Catalysts 12 00263 g003
Figure 4. R. delemar pellets at the end of the plaster sand run. The pellets were collected from the flask that contained 20 g L−1 CaCO3 for pH control and 120 g L−1 plaster sand.
Catalysts 12 00263 g004
Figure 5. Extracellular concentrations of (a) glucose, (b) fumaric acid, and (c) malic acid during shake flask cultivation of R. delemar with different PS concentrations. Results are the mean of triplicate experiments and error bars indicate the standard deviation.
Catalysts 12 00263 g005aCatalysts 12 00263 g005b
Figure 6. Extracellular concentrations of (a) glucose, (b) fumaric acid, and (c) malic acid during shake flask cultivation of R. delemar with different calcium ion concentrations. Here, 20 g L−1 CaCO3 was used for pH control as a baseline amount in the experiments and additional amounts of 5, 10, and 20 g L−1 calcium ions were added to the baseline in the form of CaCl2.
Catalysts 12 00263 g006
Figure 7. Glucose feed rates and extracellular concentrations of (a) fumaric acid, (b) malic acid, (c) ethanol, and (d) glucose, taken from the reactor during fermentation with R. delemar at different pH conditions.
Catalysts 12 00263 g007
Figure 8. pH steps and extracellular concentrations of (a) fumarate and (b) malate and ethanol, taken from the reactor during fermentation with R. delemar at constant glucose feed rate of 0.262 g L−1 h−1.
Catalysts 12 00263 g008
Figure 9. pH steps and extracellular concentrations of (a) fumarate, malate, and (b) side products, taken from the reactor during fermentation with R. delemar at constant glucose feed rate of 0.329 g L−1 h−1. After 72 h, the glucose feed was switched to zero, pH increased to 7, and nitrogen feed decreased to 0.0625 mg L−1 h−1. Anaerobic conditions were also induced in this phase.
Catalysts 12 00263 g009aCatalysts 12 00263 g009b
Table 1. Inductively coupled plasma (ICP) measurements of Ca2+ and Mg2+ at the end of each production phase (198 h), in comparison to the baseline amount.
RunCx (g L−1)Ca2+ (g L−1)Mg2+ (g L−1)pH
CaCO304.79 ± 0.070.29 ± 0.014.17 ± 0.21
605.63 ± 0.110.28 ± 0.017.45 ± 0.07
1005.69 ± 0.710.29 ± 0.027.37 ± 0.06
MgCO300.74 ± 0.023.21 ± 0.054.6
600.78 ± 0.026.54 ± 0.238.0
1000.78 ± 0.018.05 ± 0.168.1
Plaster sand404.70 ± 0.070.31 ± 0.033.73 ± 0.06
804.69 ± 0.710.29 ± 0.023.63 ± 0.06
1204.51 ± 0.600.29 ± 0.013.87 ± 0.12
Table 2. Comparison of fumaric acid and malic acid production using R. delemar.
Fumaric AcidMalic Acid
ProcessTitre (g L−1)Productivity (g L−1 h−1)Titre (g L−1)Productivity (g L−1 h−1)
Immobilised reactor *65.890.1388.200.205
Immobilised reactor (Swart et al. [13])-0.305--
Immobilised reactor (Gu et al. [38])32.031.33--
Immobilised reactor (Naude et al. [32])40.130.322.60.022
Stirred tank (YQ Fu et al. [39])56.20.7--
Stirred tank (Xu et al. [40])41.10.37--
Shake flask †34.840.17633.290.168
Shake flask (Dominguez et al. [2])30-25-
Shake flask (Liu et al. [41])46.7---
Shake flask (K. Zhang et al. [31])50.20.342.10.015
* Immobilised reactor used in current study; † Shake flask fermentations in current study. The species names are dissimilar in some of the published reports, but all of the strains are classified as R. oryzae according to the American Type Culture Collection (ATCC) catalogue.
Publisher’s Note: MDPI stays neutral with regard to jurisdictional claims in published maps and institutional affiliations.

