Author Contributions
Conceptualization, investigation, writing, editing, reviewing final version of the original manuscript and supervision, H.d.L.; technical methodology, editing, reviewing final version of the original manuscript and co-supervision, S.E.; investigation, experimental methodology, reaction mechanism, kinetic model, formal analysis and writing original draft and final article, B.R. All authors have read and agreed to the published version of the manuscript.
Appendix A. Kinetic Modeling
Reaction rates for the formed oxidation by-products can be modeled as a function of the ethanol adsorbed species as follows:
For oxidation steps
- (e)
Hydroxyl Radical (OH
•) Consumption—Formation
By applying the steady state
and the quasi-constant ethanol concentration approximations, this results in the following equation:
Given that, from the OH
• radicals formed, only a fraction of them is consumed at any given irradiation time, at a steady state, the hydroxyl radical concentration can be considered close to constant (
) and can be expressed as:
with
k′
i =
ki Q
OH•.
Consider as the reaction rate order for each by-product.
- 2.
For reduction steps
Reaction rates for the formed reduction steps can be modeled as a function of the H• and ethanol adsorbed species as follows:
Considering that
, then:
By applying the steady-state approximation
, and the ethanol concentration inequality, this results in Equation (A14):
In addition, given that, at any given irradiation time, the H• radicals can be at a steady state, the hydroxyl radicals concentration is close to constant (
) and Equation (A14) can be expressed as:
with
k′
i =
ki QH•.
Appendix B. Quantum Yield Calculation
The can be defined as the number of moles of hydrogen radicals produced per absorbed photons on the photocatalyst surface.
A sample
calculation given below considers a hydrogen production rate of 0.2159 μmol*cm
−3 h
−1, using: (a) 0.25 wt.% Pd-TiO
2; (b) a photocatalyst concentration of 1.0 g L
−1; (c) ethanol at 2.0
v/
v%; (d) initial pH = 4 ± 0.05; (e) near-UV light; (f) a gas phase volume in the reactor of 5716 cm
3, and (g) Pa = 1.97 × 10
−6 Einstein s
−1.
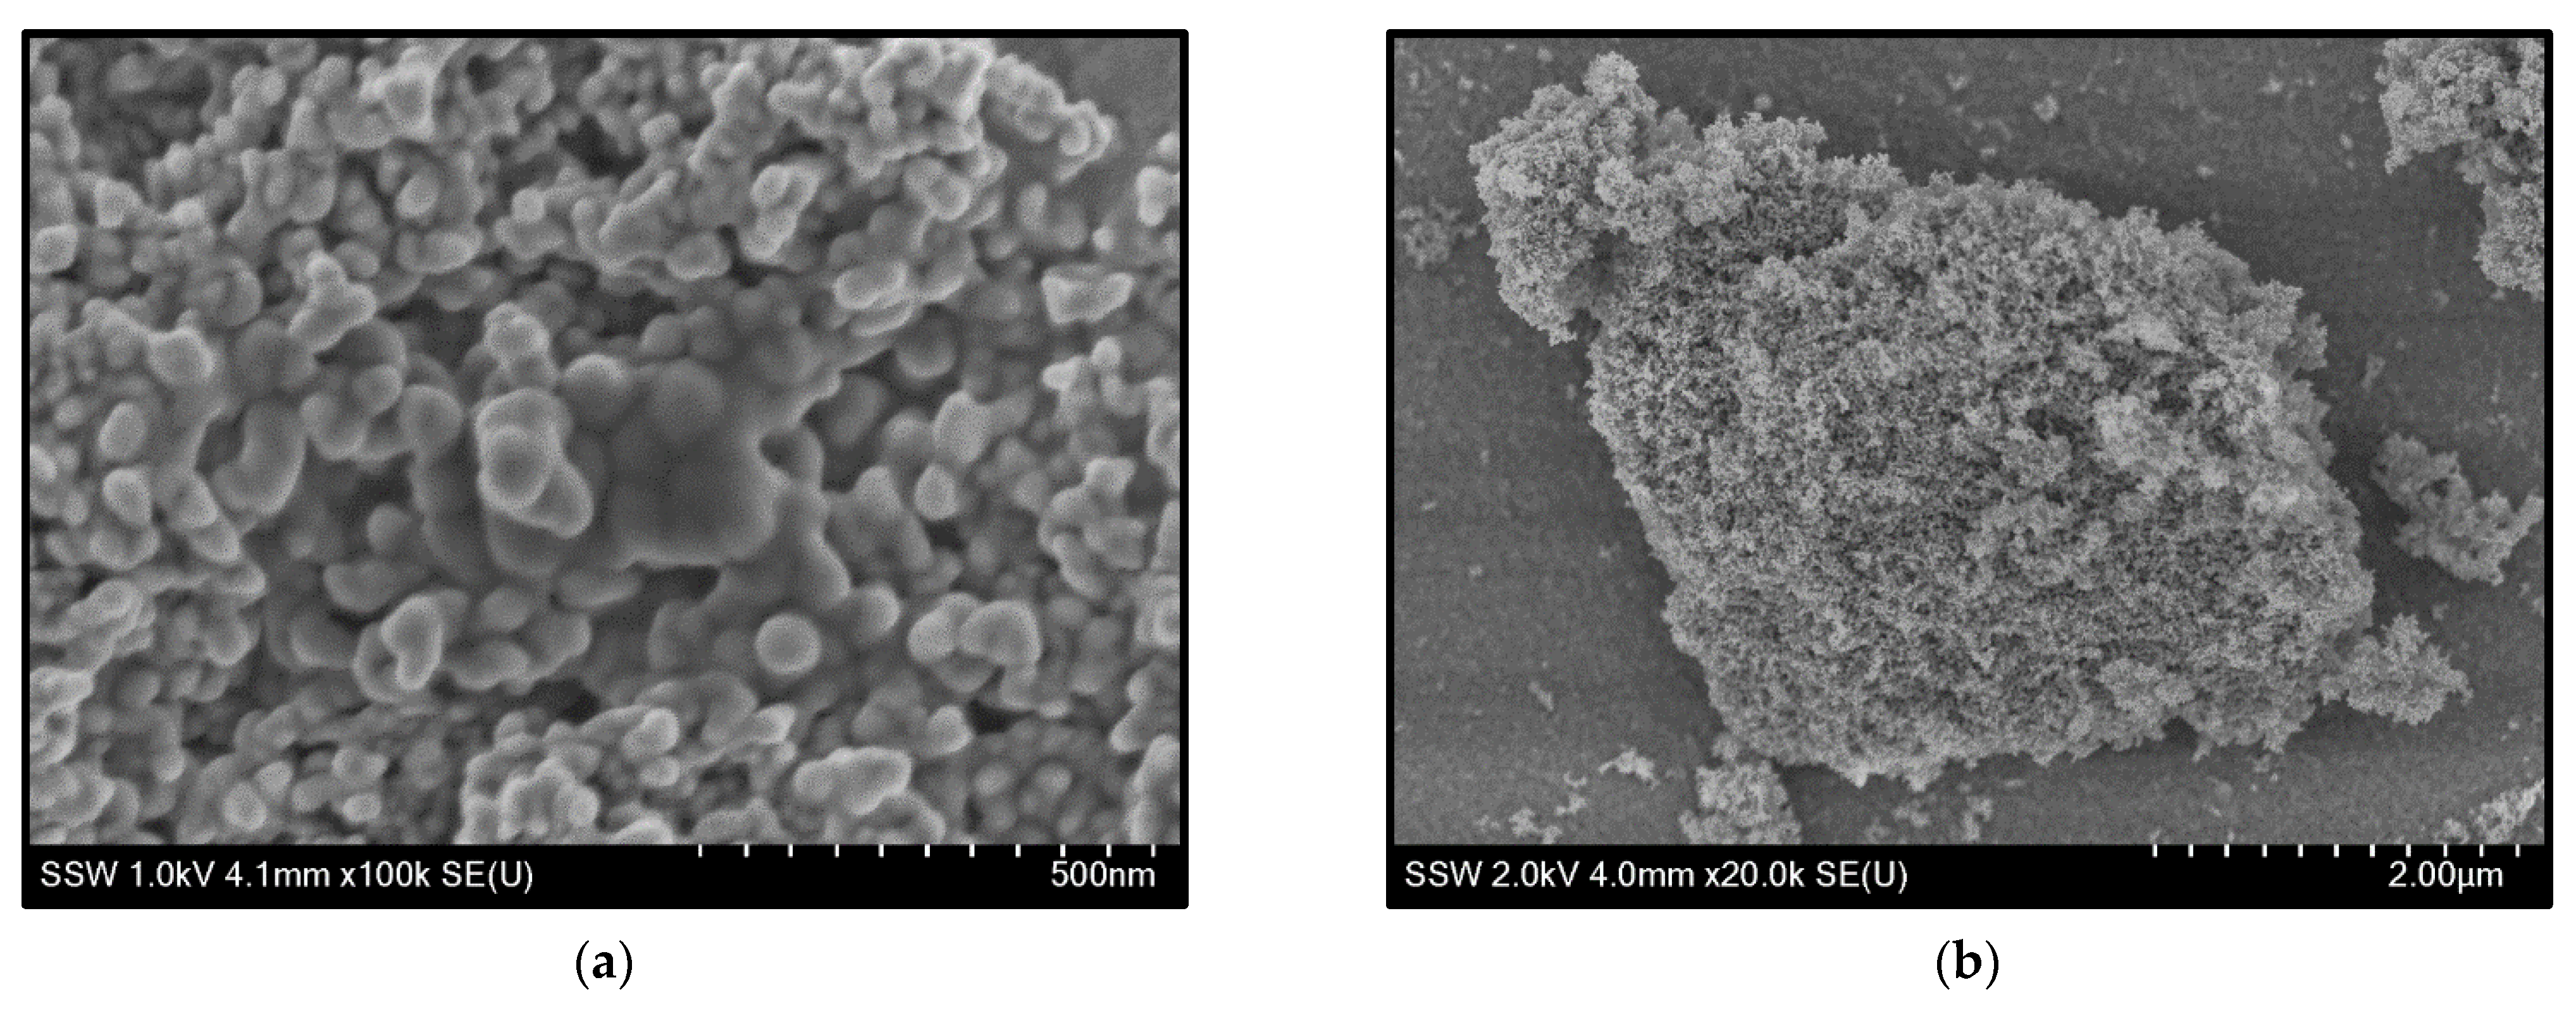
Appendix C. Scanning Electron Microscopy (SEM)
Scanning Electron Microscopy (SEM) provides detailed high-resolution images of the 0.25 wt% Pd-TiO2 photocatalyst.
The semiconductor material was analyzed by scanning electron microscopy using a Hitachi SU8230 Regulus ultra-high resolution field emission scanning electron microscope (FESEM). SEM imaging was performed using accelerating voltages ranging from 1 to 2 kV, as observed in
Figure A1.
Figure A1.
Scan Electron Microscope images for the 0.25 wt% Pd-TiO2 photocatalyst at two different accelerating voltages: (a) 1.0 kV; and (b) 2.0 kV.
Figure A1.
Scan Electron Microscope images for the 0.25 wt% Pd-TiO2 photocatalyst at two different accelerating voltages: (a) 1.0 kV; and (b) 2.0 kV.
Appendix D. Detection of H2 and Carbon Containing Species by a Shimadzu CG 2010
The several gases produced from the photocatalytic water splitting reaction with ethanol as a scavenger were quantified using a Shimadzu GC2010 Gas Chromatograph (Nakagyo-ku, Kyoto, Japan). Samples were taken every hour.
To accomplish this, argon (Praxair 99.999%) was used as a gas carrier. The GC was equipped with two detectors: a Flame Ionization Detector (Nakagyo-ku, Kyoto, Japan) (FID) coupled with a Methanizer and a Thermal Conductivity Detector (TCD). As a result, the analytical equipment employed was able to detect hydrogen (H2), carbon monoxide (CO), methane (CH4), carbon dioxide (CO2), ethane (C2H6), ethylene (C2H4), acetaldehyde (C2H4O) and ethanol (C2H5OH).
The GC method used for the gas phase analysis is described as follows:
Table A1.
Column Oven Temperature Program.
Table A1.
Column Oven Temperature Program.
| Rate | Temperature (°C) | Hold Time (min) |
|---|
| - | 50 | 4 |
| 20.0 | 200 | 18.5 |
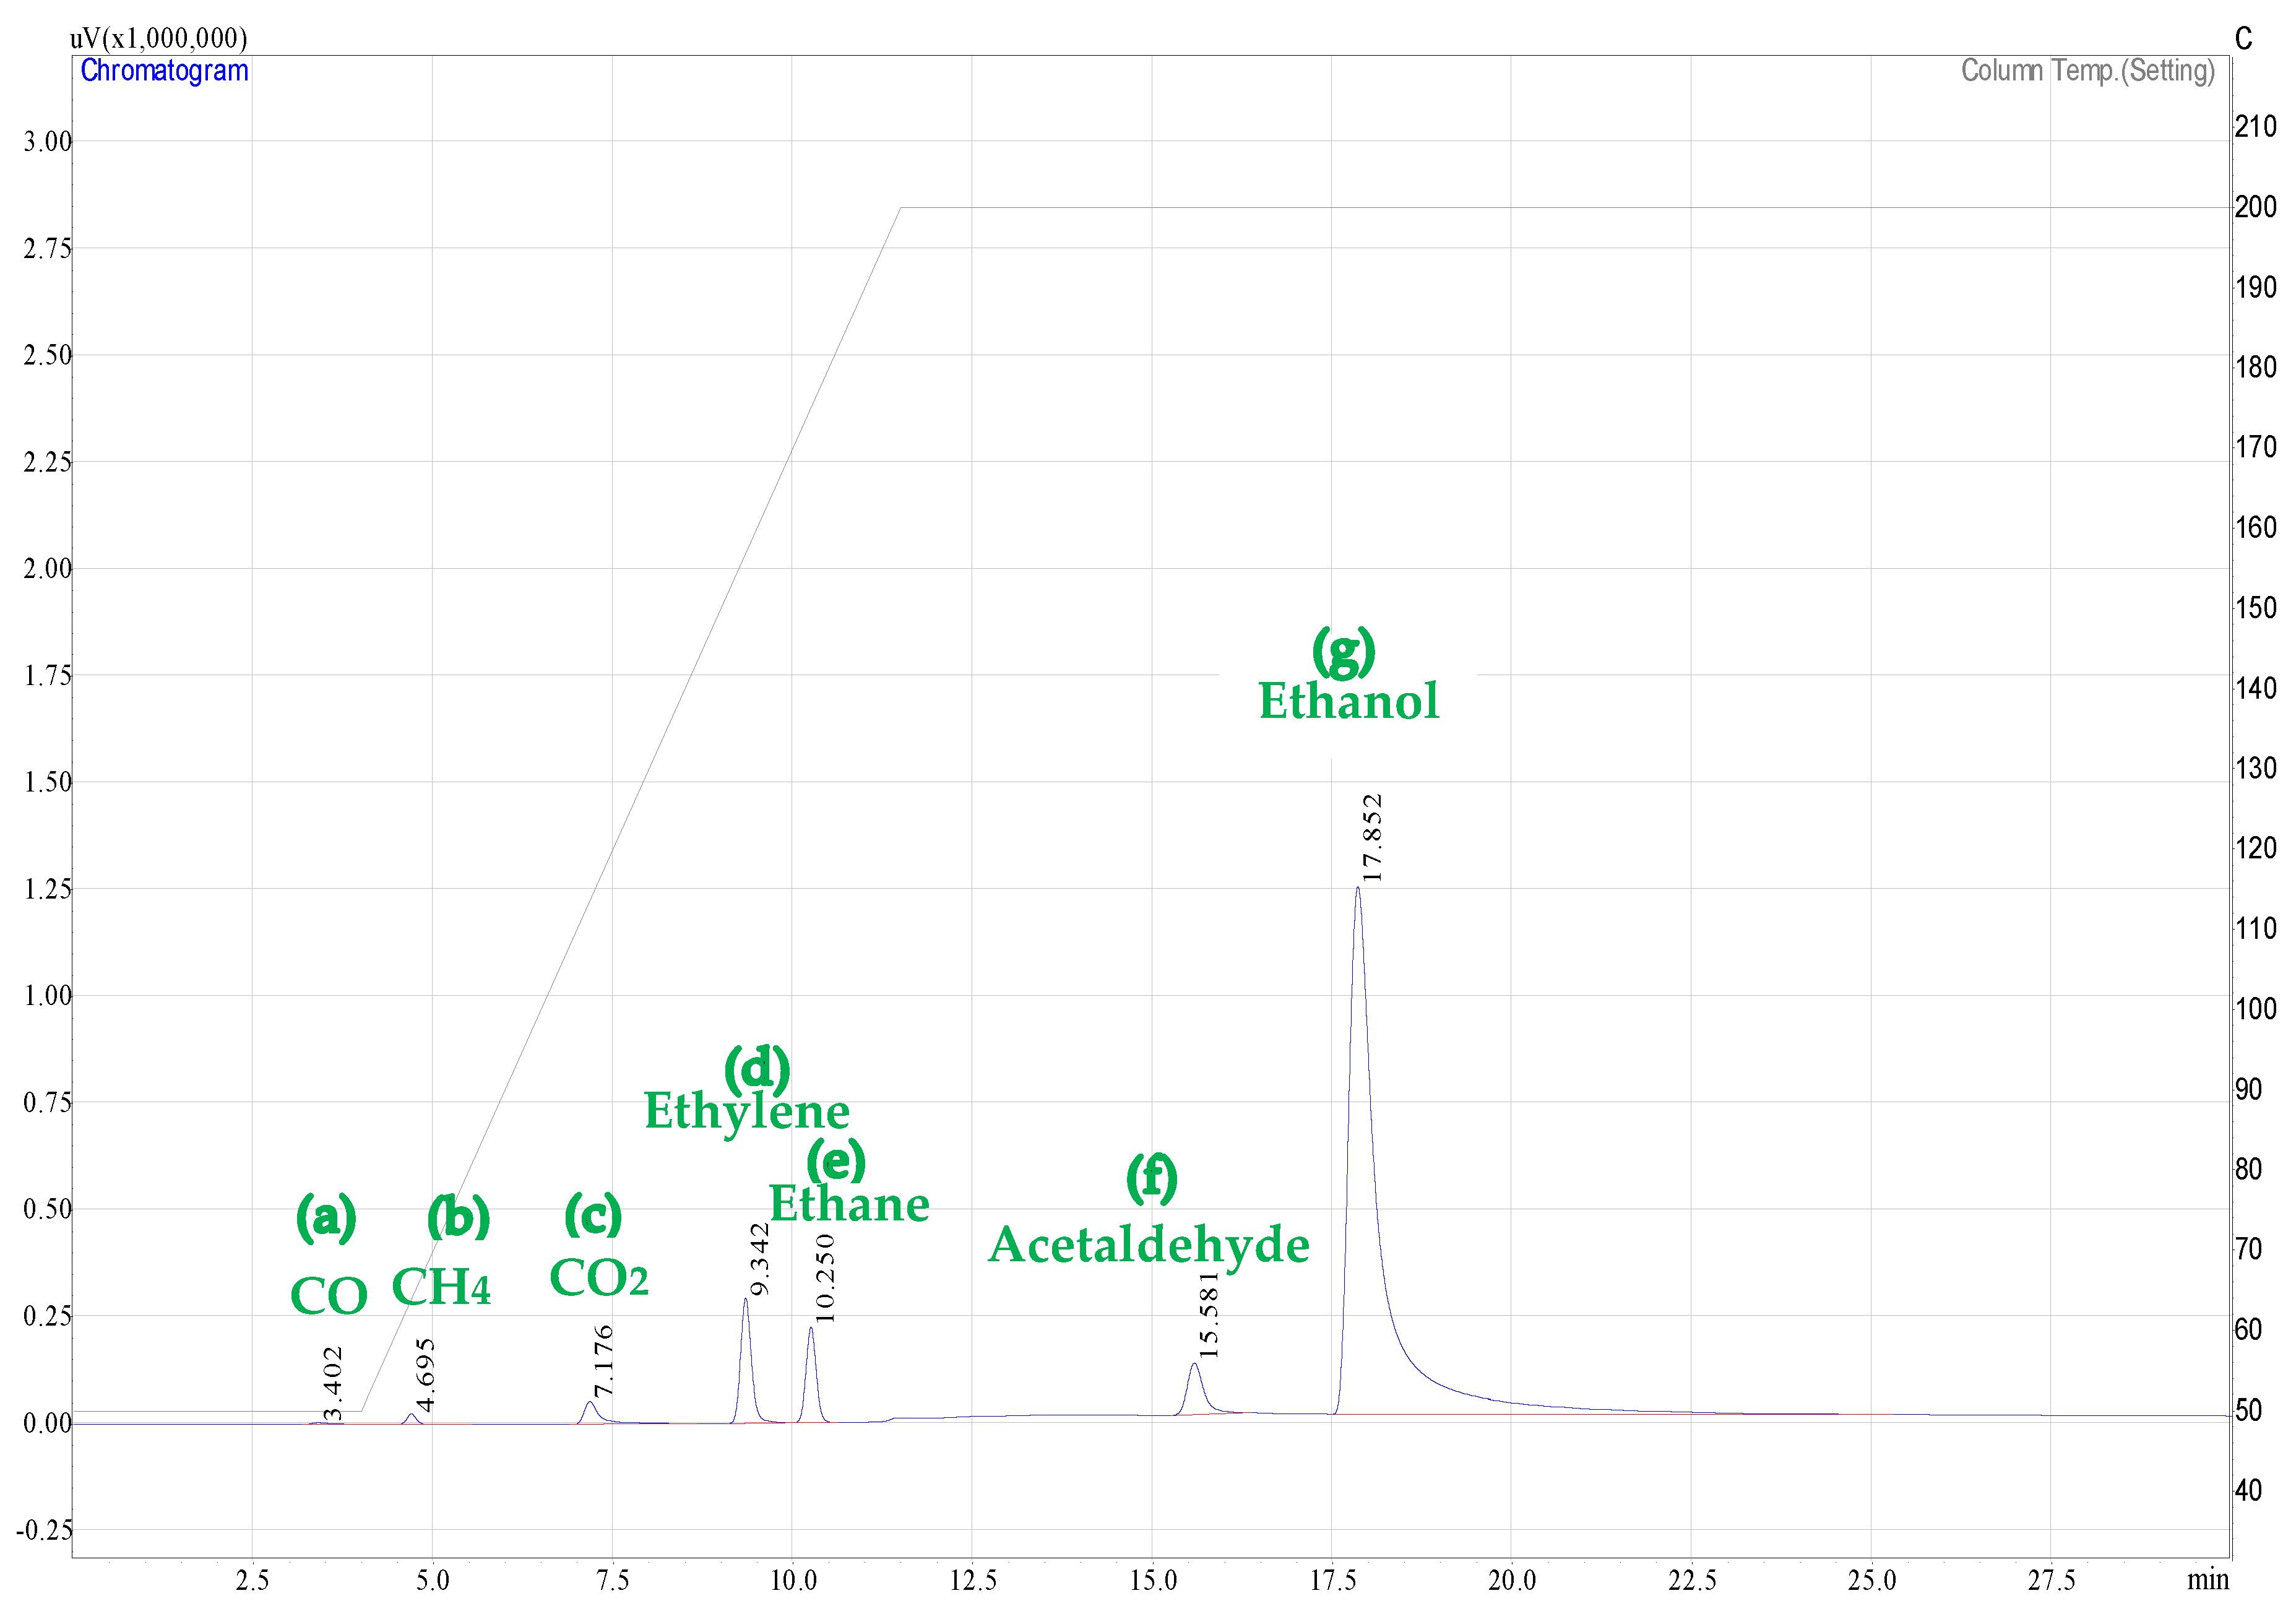
Typical chromatograms obtained for hydrogen and carbon-containing by-products using the employed programmed oven temperature method are reported in
Figure A2 and
Figure A3. Air detected via the TCD was attributed to the air contained in the needle when injecting the gas sample into the GC. This air gas volume is negligible and was disregarded in the product analysis.
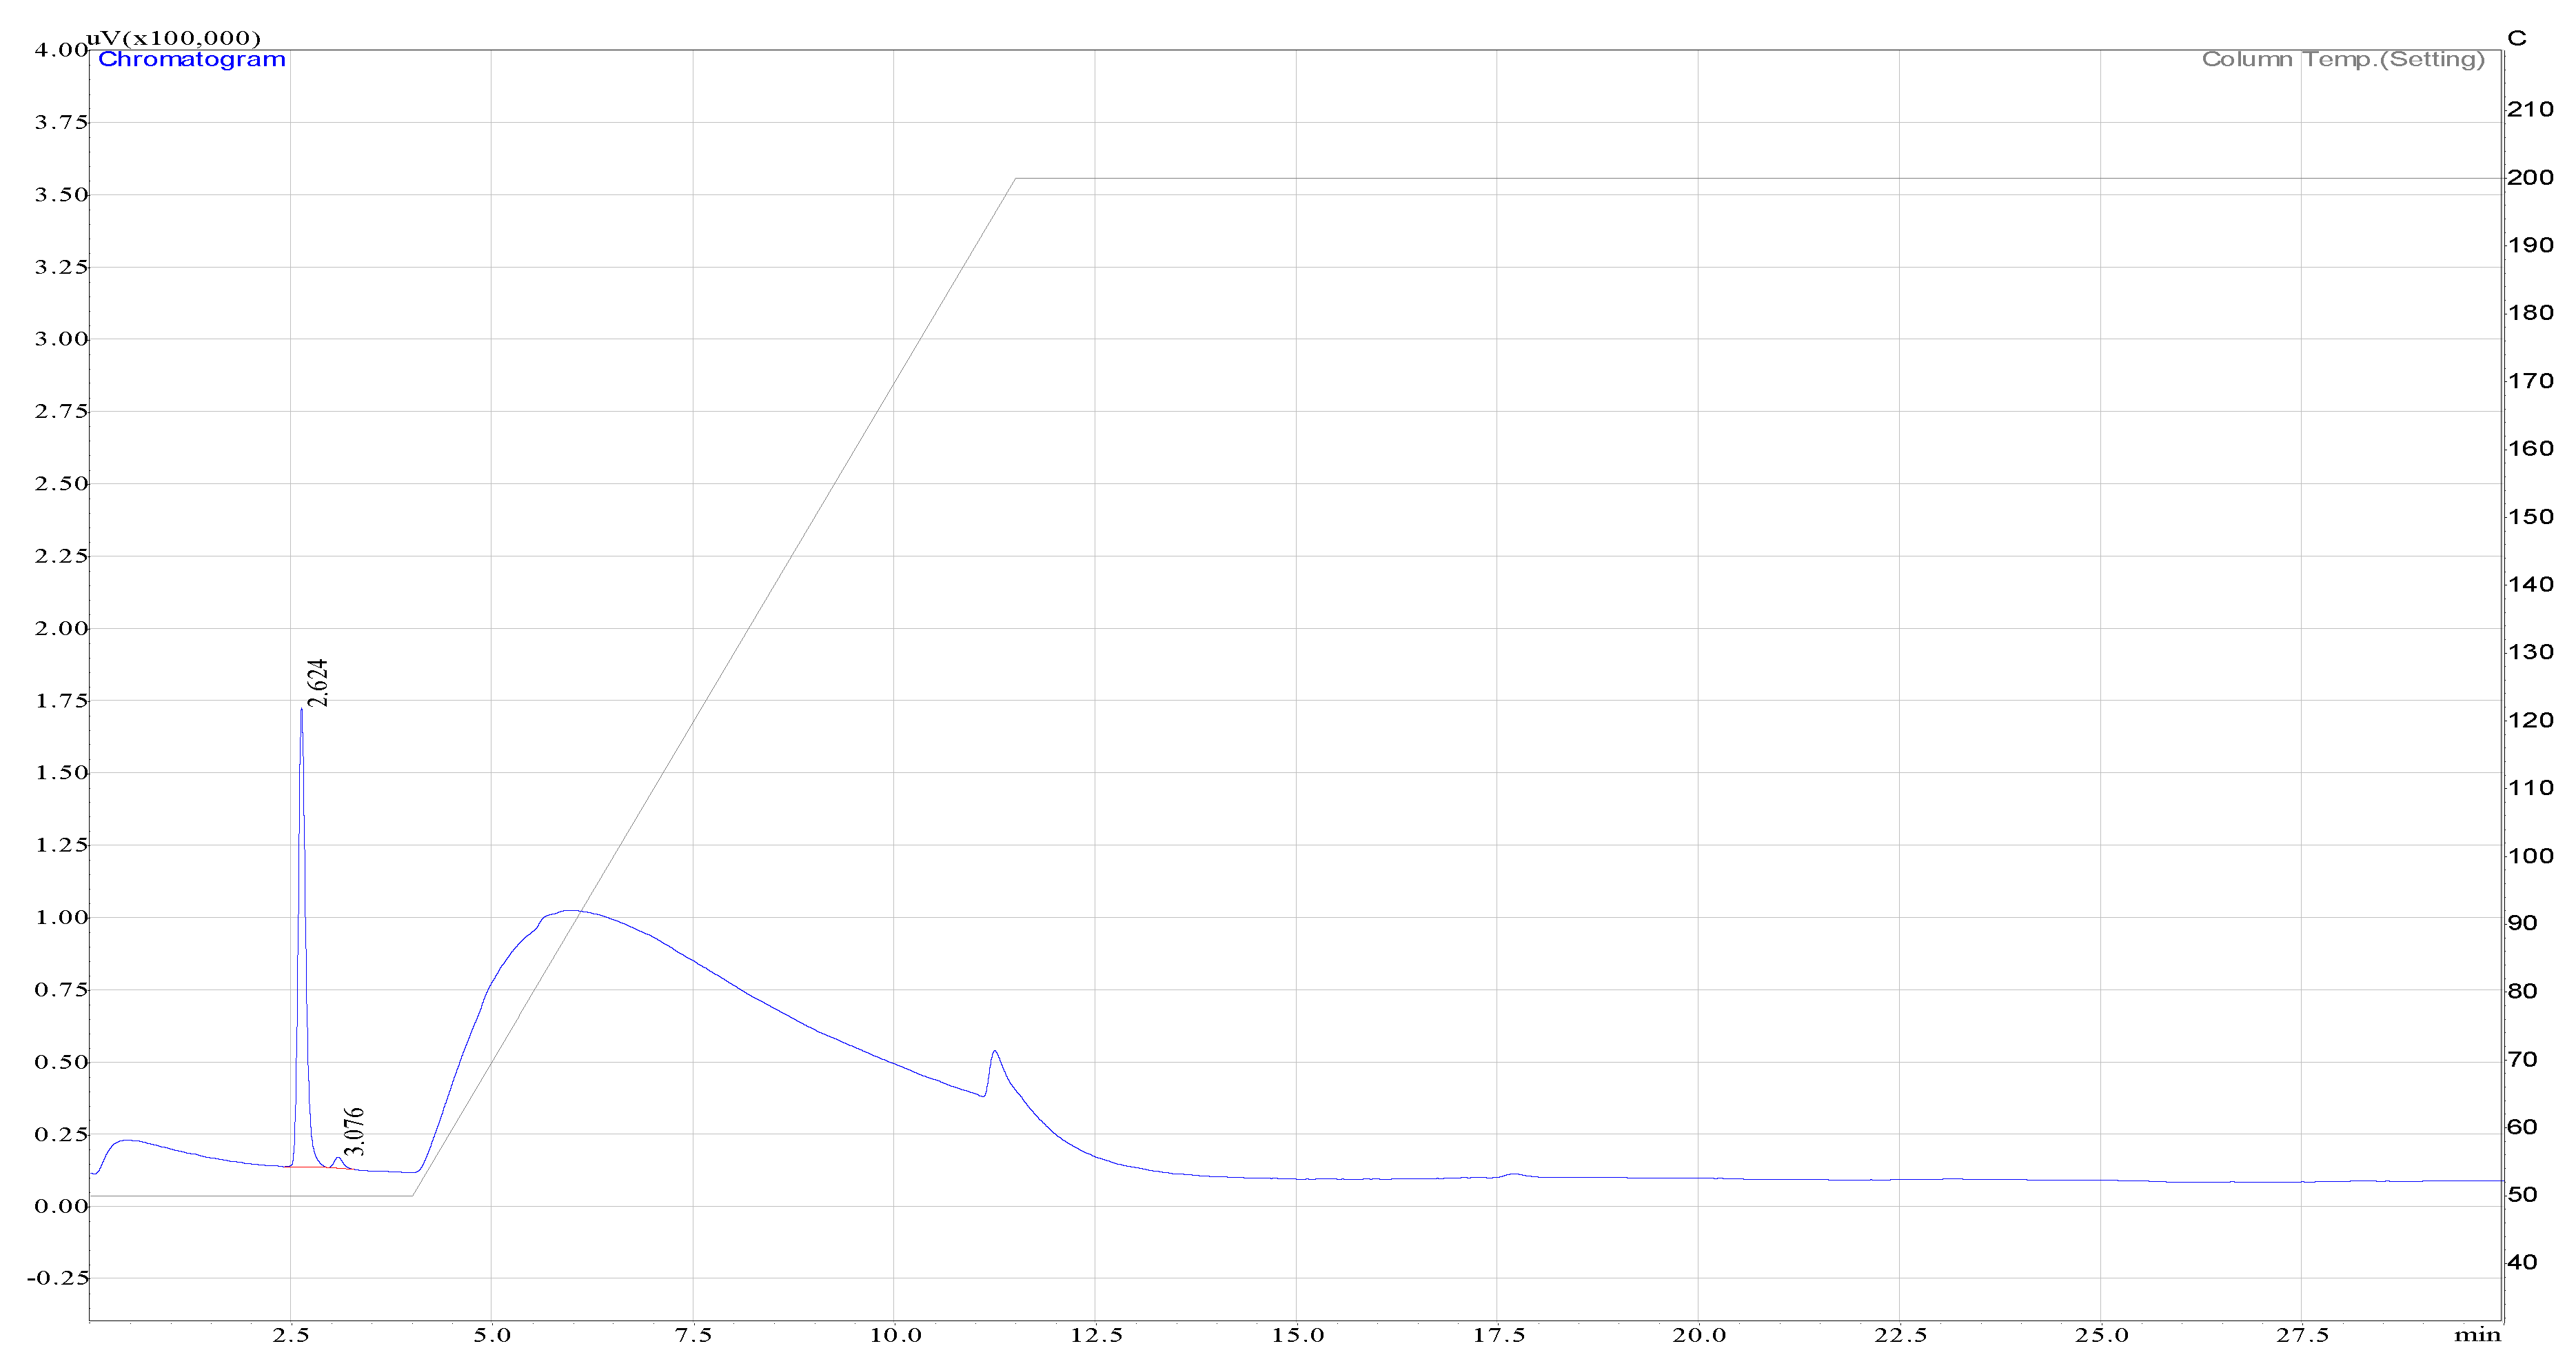
Figure A2.
Hydrogen peak as detected by the TCD.
Figure A2.
Hydrogen peak as detected by the TCD.
Figure A3.
Carbon containing product species peaks as detected by the FID for: (a) carbon monoxide (CO); (b) methane (CH4); (c) carbon dioxide (CO2); (d) ethylene (C2H4); (e) ethane (C2H6); (f) acetaldehyde (C2H4O); and (g) ethanol (C2H5OH).
Figure A3.
Carbon containing product species peaks as detected by the FID for: (a) carbon monoxide (CO); (b) methane (CH4); (c) carbon dioxide (CO2); (d) ethylene (C2H4); (e) ethane (C2H6); (f) acetaldehyde (C2H4O); and (g) ethanol (C2H5OH).
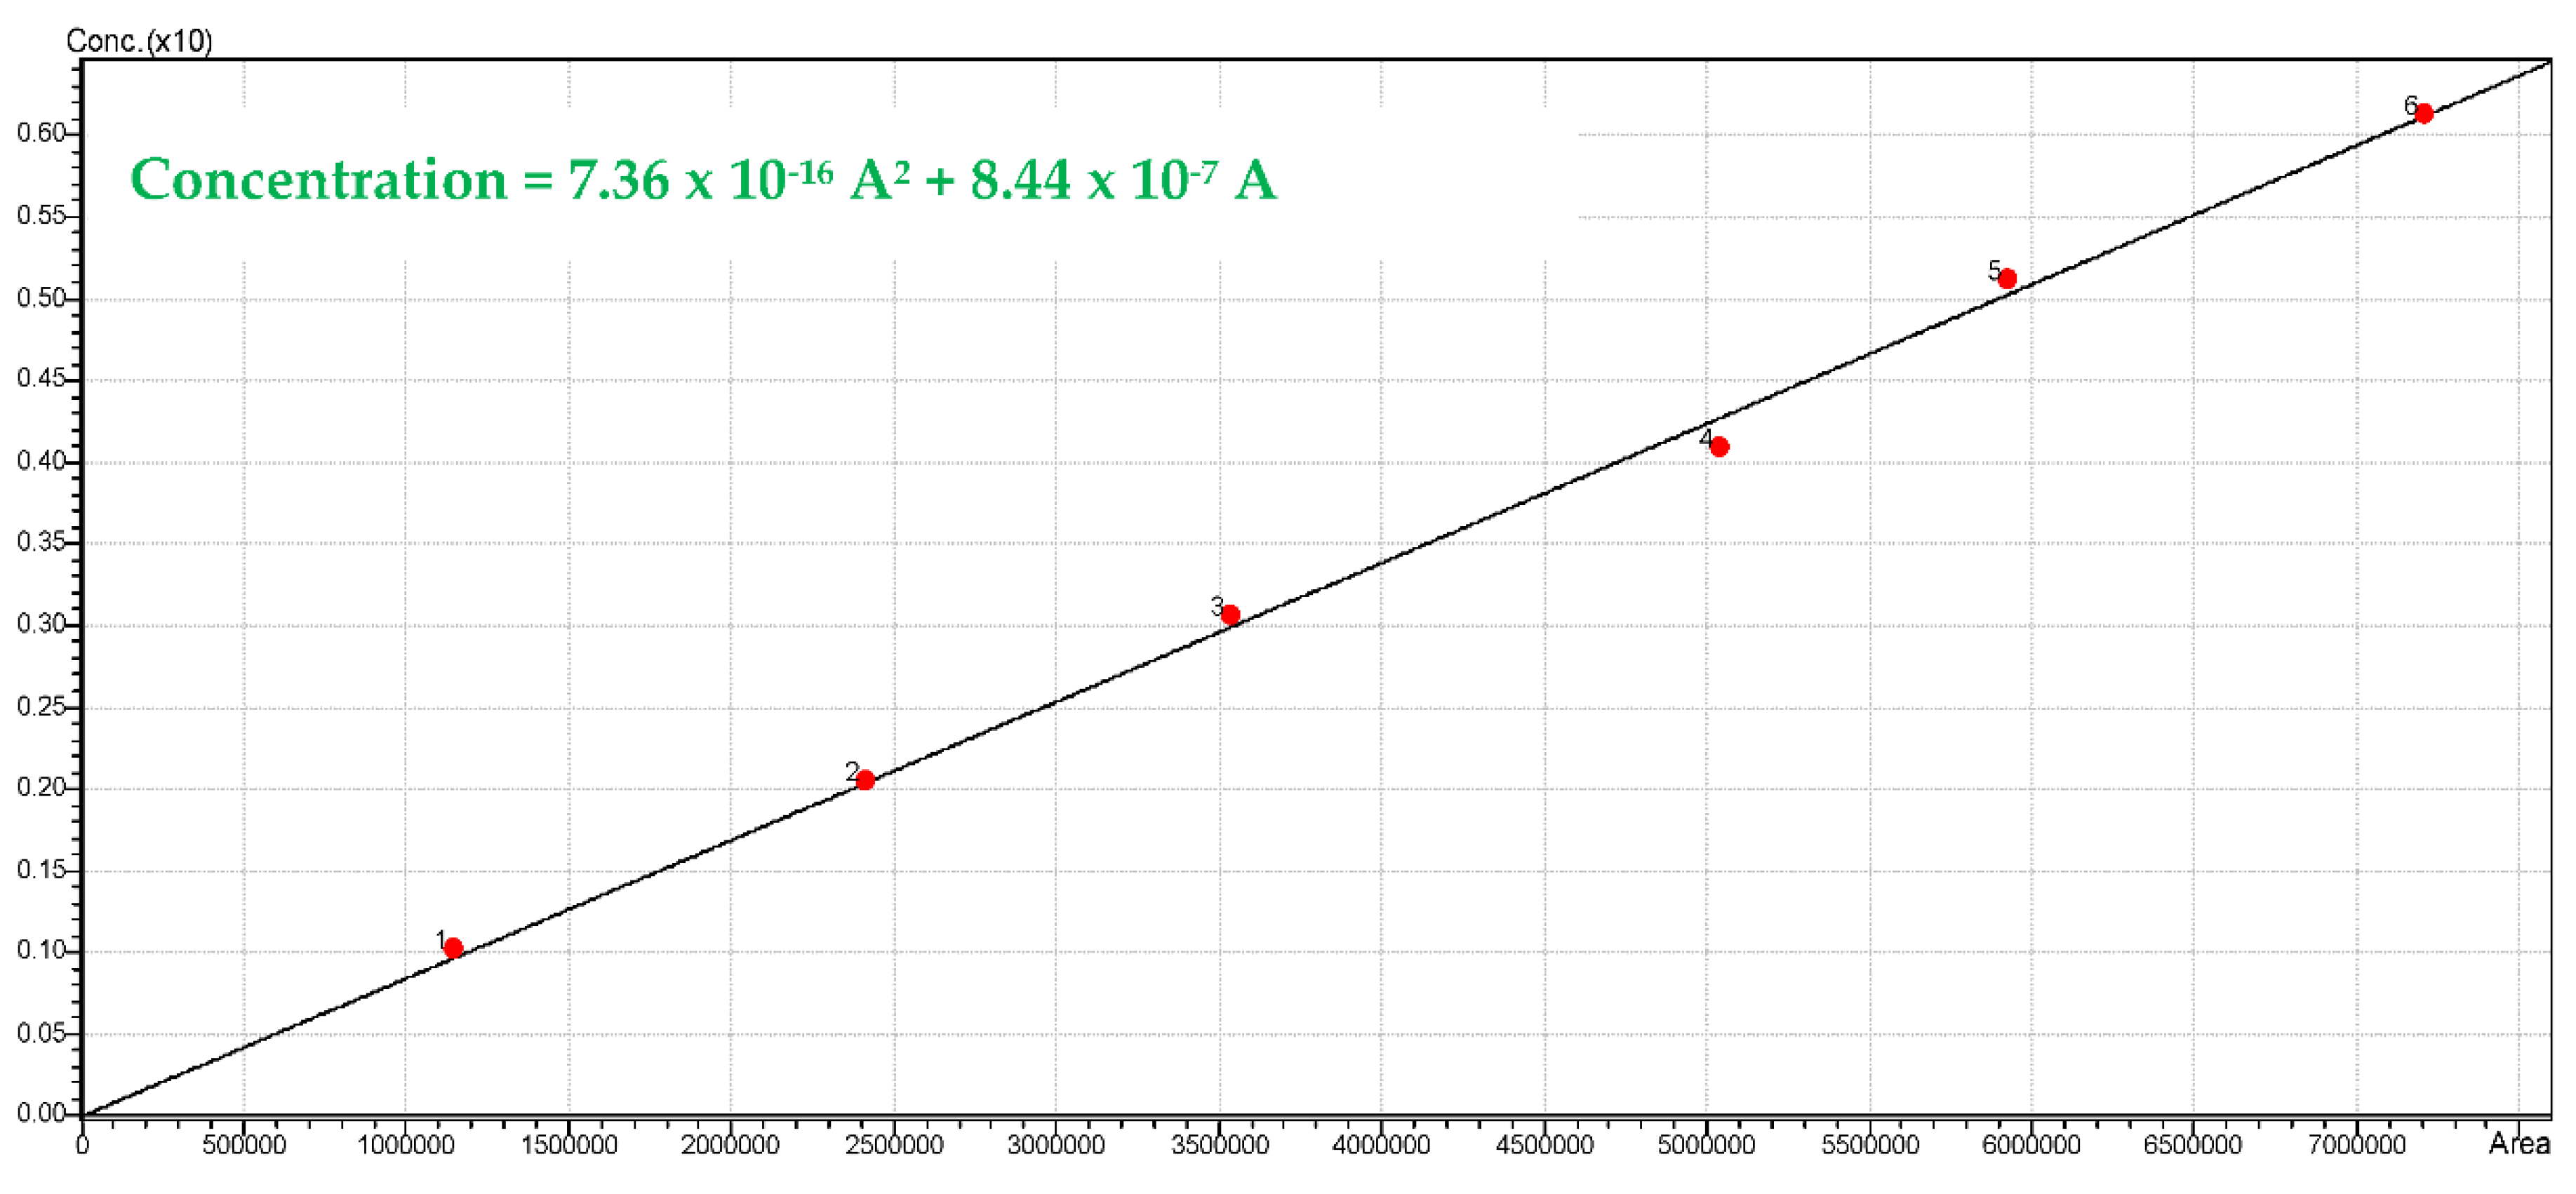
The H
2 gas chromatographic peaks were quantified using the TCD calibration, as reported in
Figure A4. Calibration was established by using an H
2 certified standard gas mixture sample (10% H
2 and 90% He Praxair) and different hydrogen volumes (0.1, 0.2, 0.3, 0.4, 0.5 and 0.6 mL). Injected sample gas volumes were at room temperature and standard pressure conditions (25 °C and 1 atm).
Figure A4.
Calibration curve using the Shimadzu GC 2010 for hydrogen.
Figure A4.
Calibration curve using the Shimadzu GC 2010 for hydrogen.
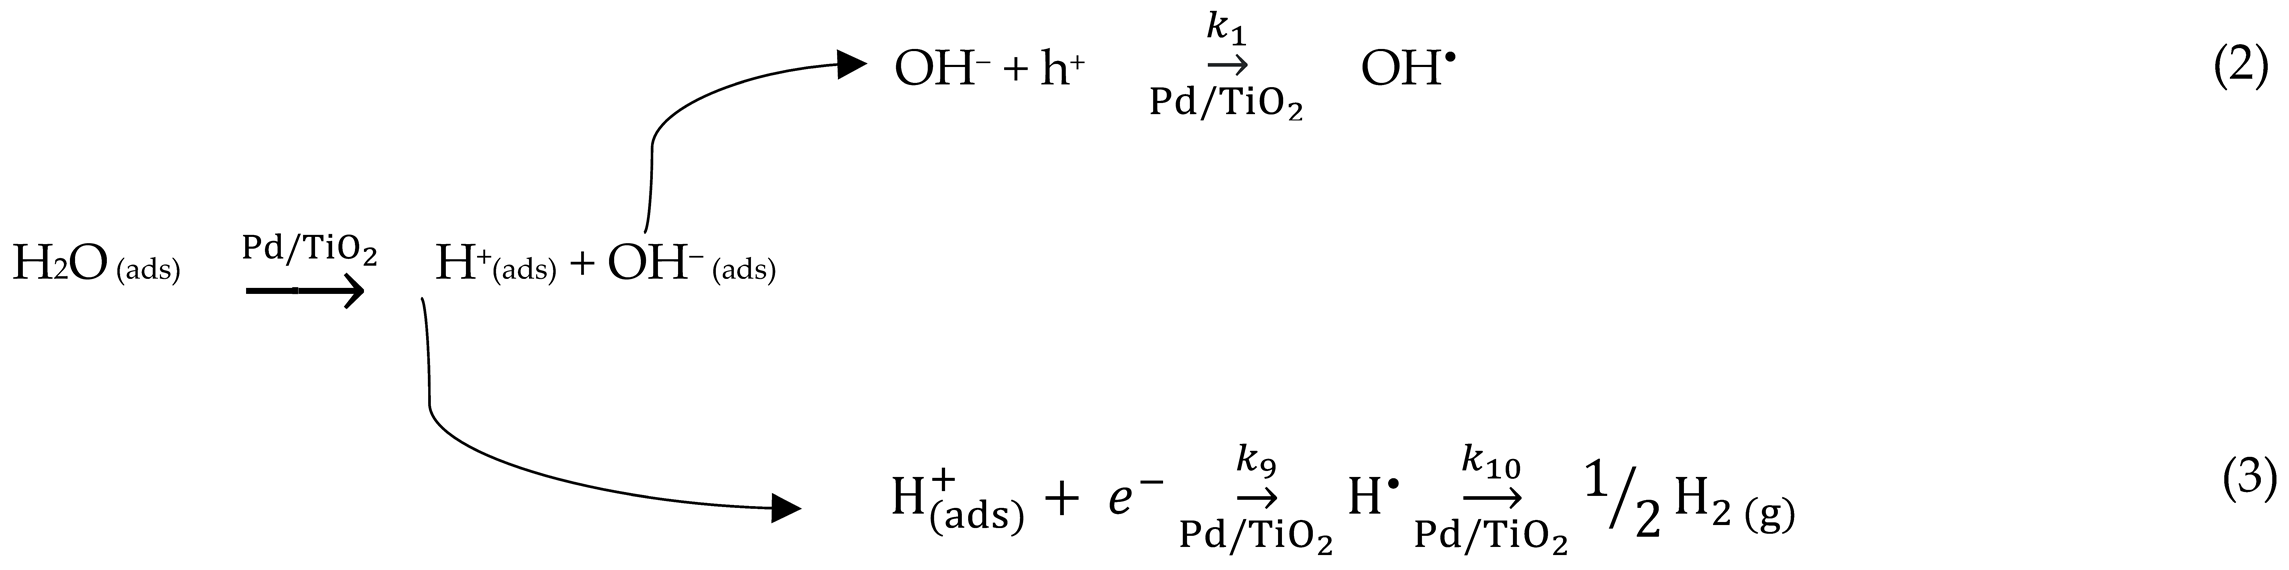
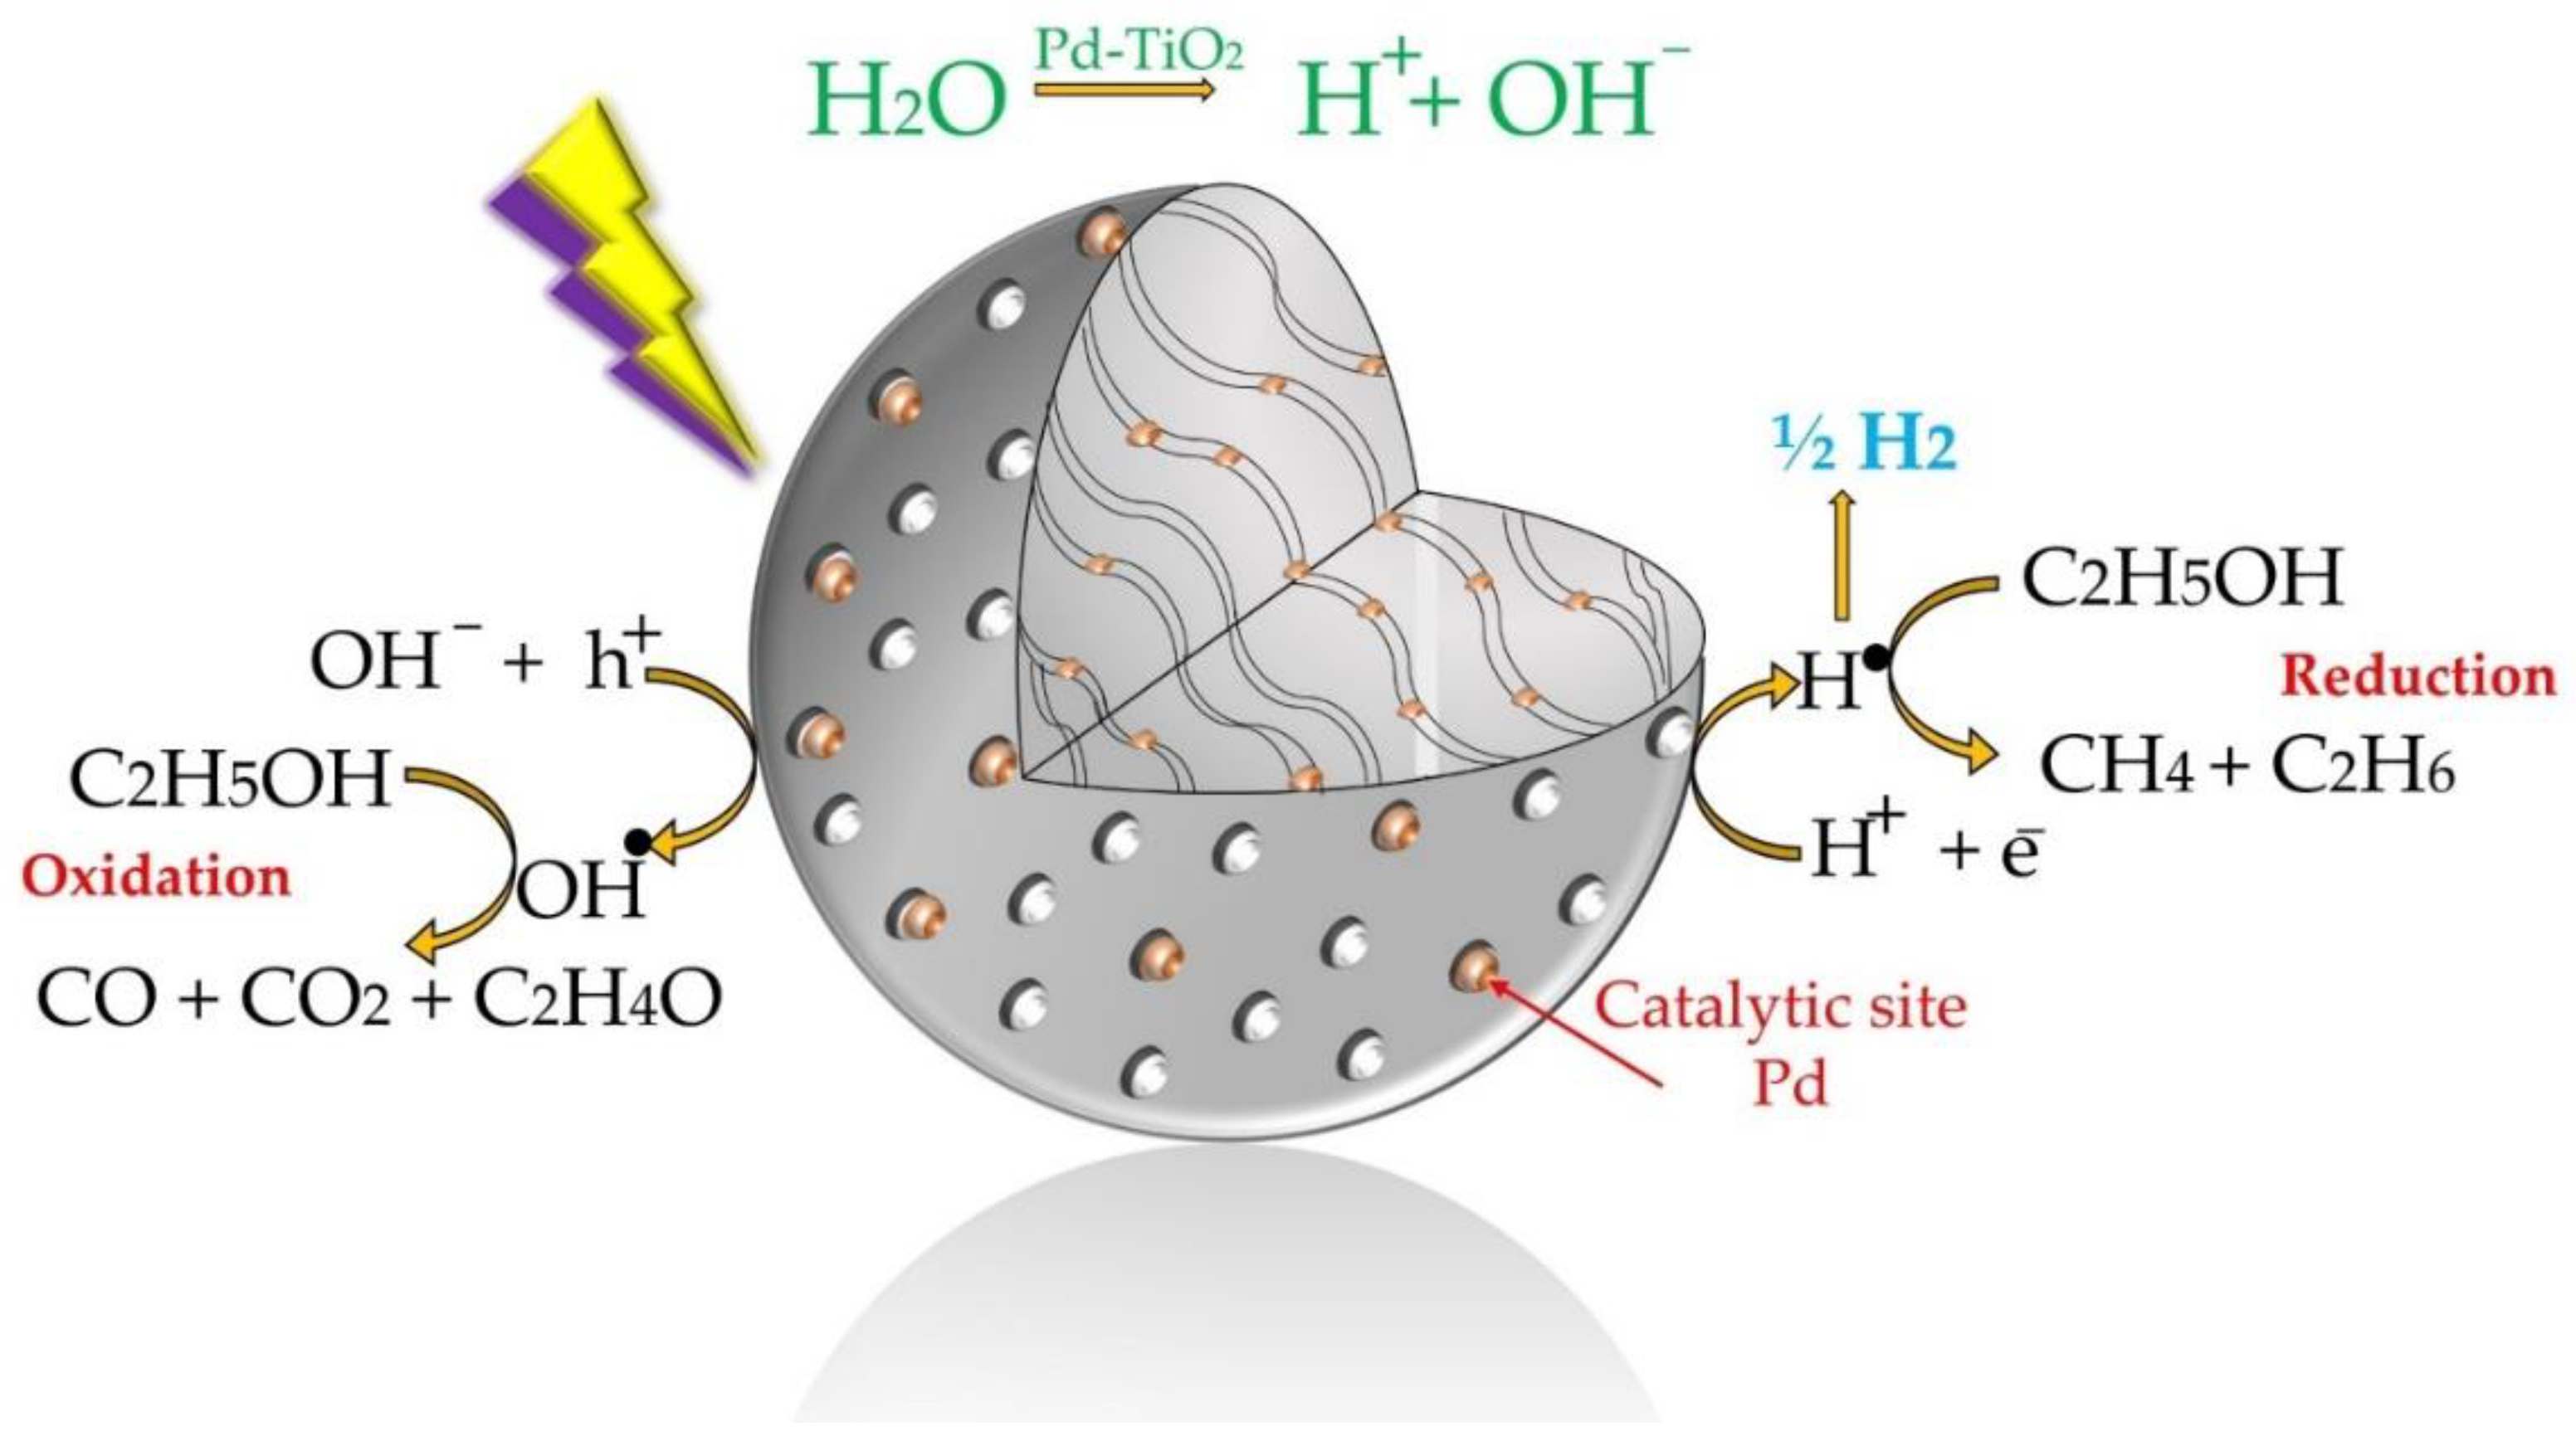
Figure 1.
Schematic description of hydrogen formation reaction steps using Pd-TiO2 as a photocatalyst and ethanol as a scavenger.
Figure 1.
Schematic description of hydrogen formation reaction steps using Pd-TiO2 as a photocatalyst and ethanol as a scavenger.
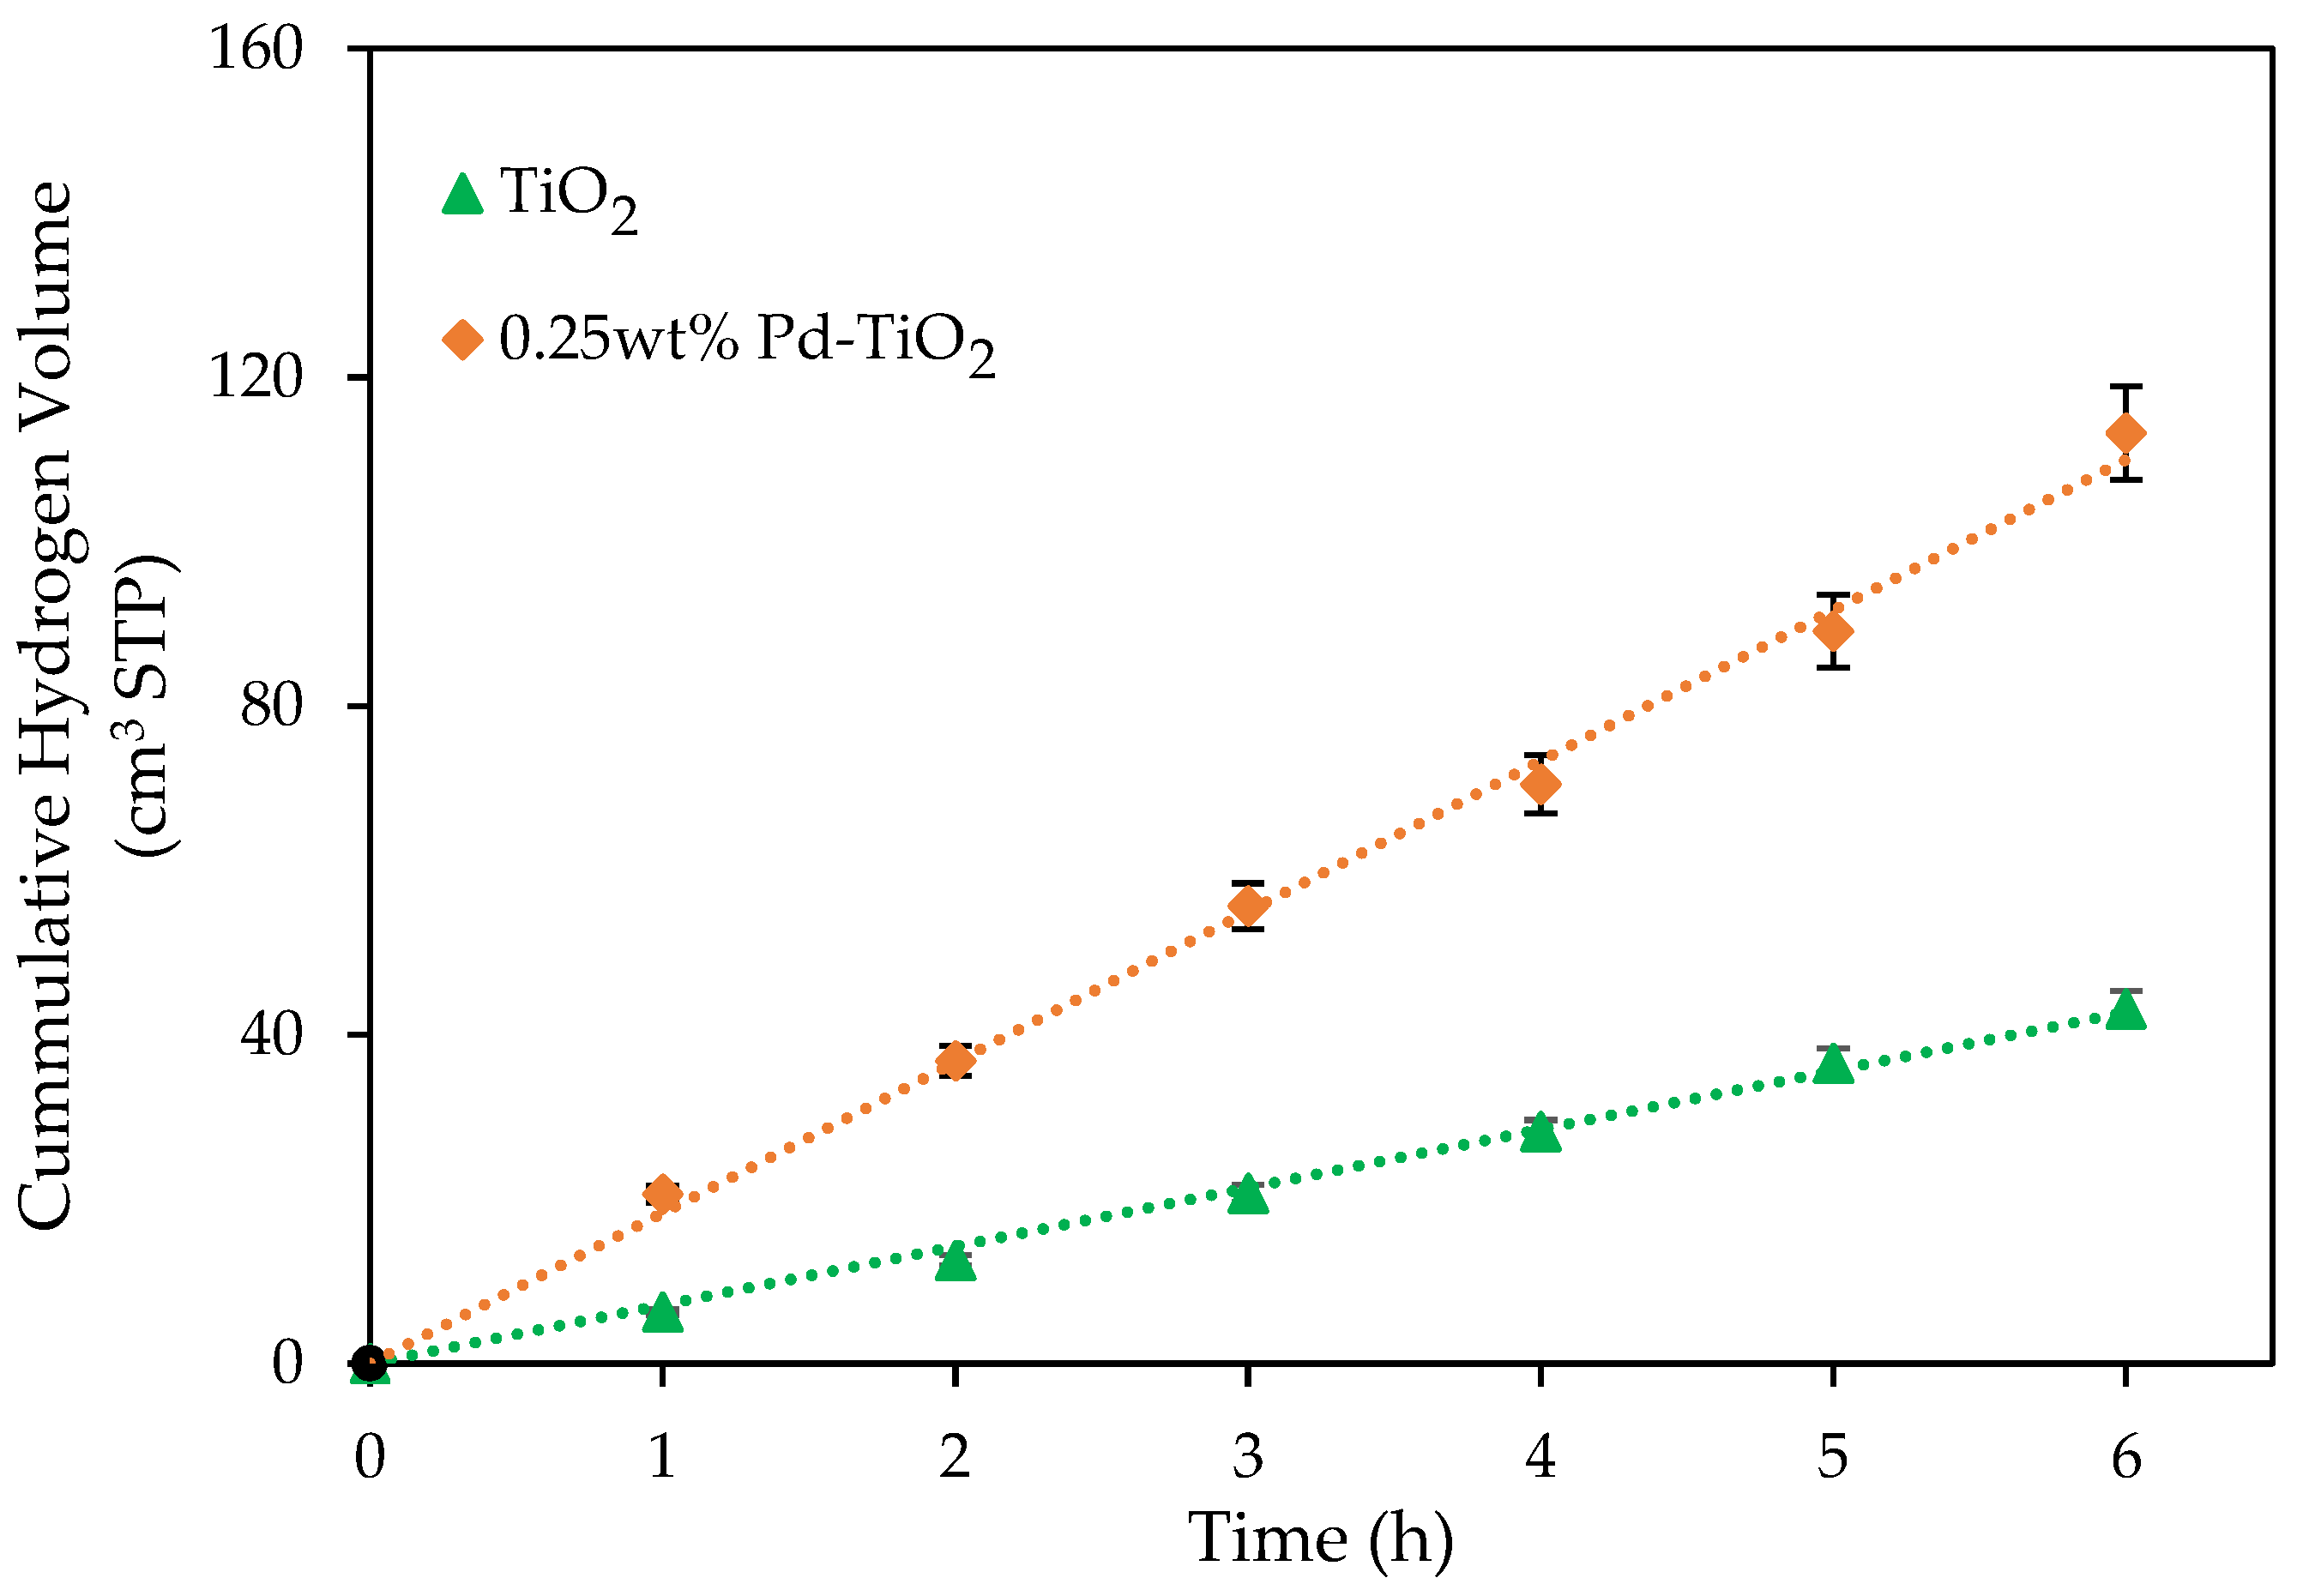
Figure 2.
Cumulative hydrogen volumes produced using an undoped TiO2 photocatalyst and a 0.25 wt% Pd-TiO2 photocatalyst. Conditions: 0.15 g L−1 photocatalyst concentration; 2.0 v/v% ethanol; initial pH = 4 ± 0.05; 6 h under near-UV light. Note: at least three repeats were performed per experiment.
Figure 2.
Cumulative hydrogen volumes produced using an undoped TiO2 photocatalyst and a 0.25 wt% Pd-TiO2 photocatalyst. Conditions: 0.15 g L−1 photocatalyst concentration; 2.0 v/v% ethanol; initial pH = 4 ± 0.05; 6 h under near-UV light. Note: at least three repeats were performed per experiment.
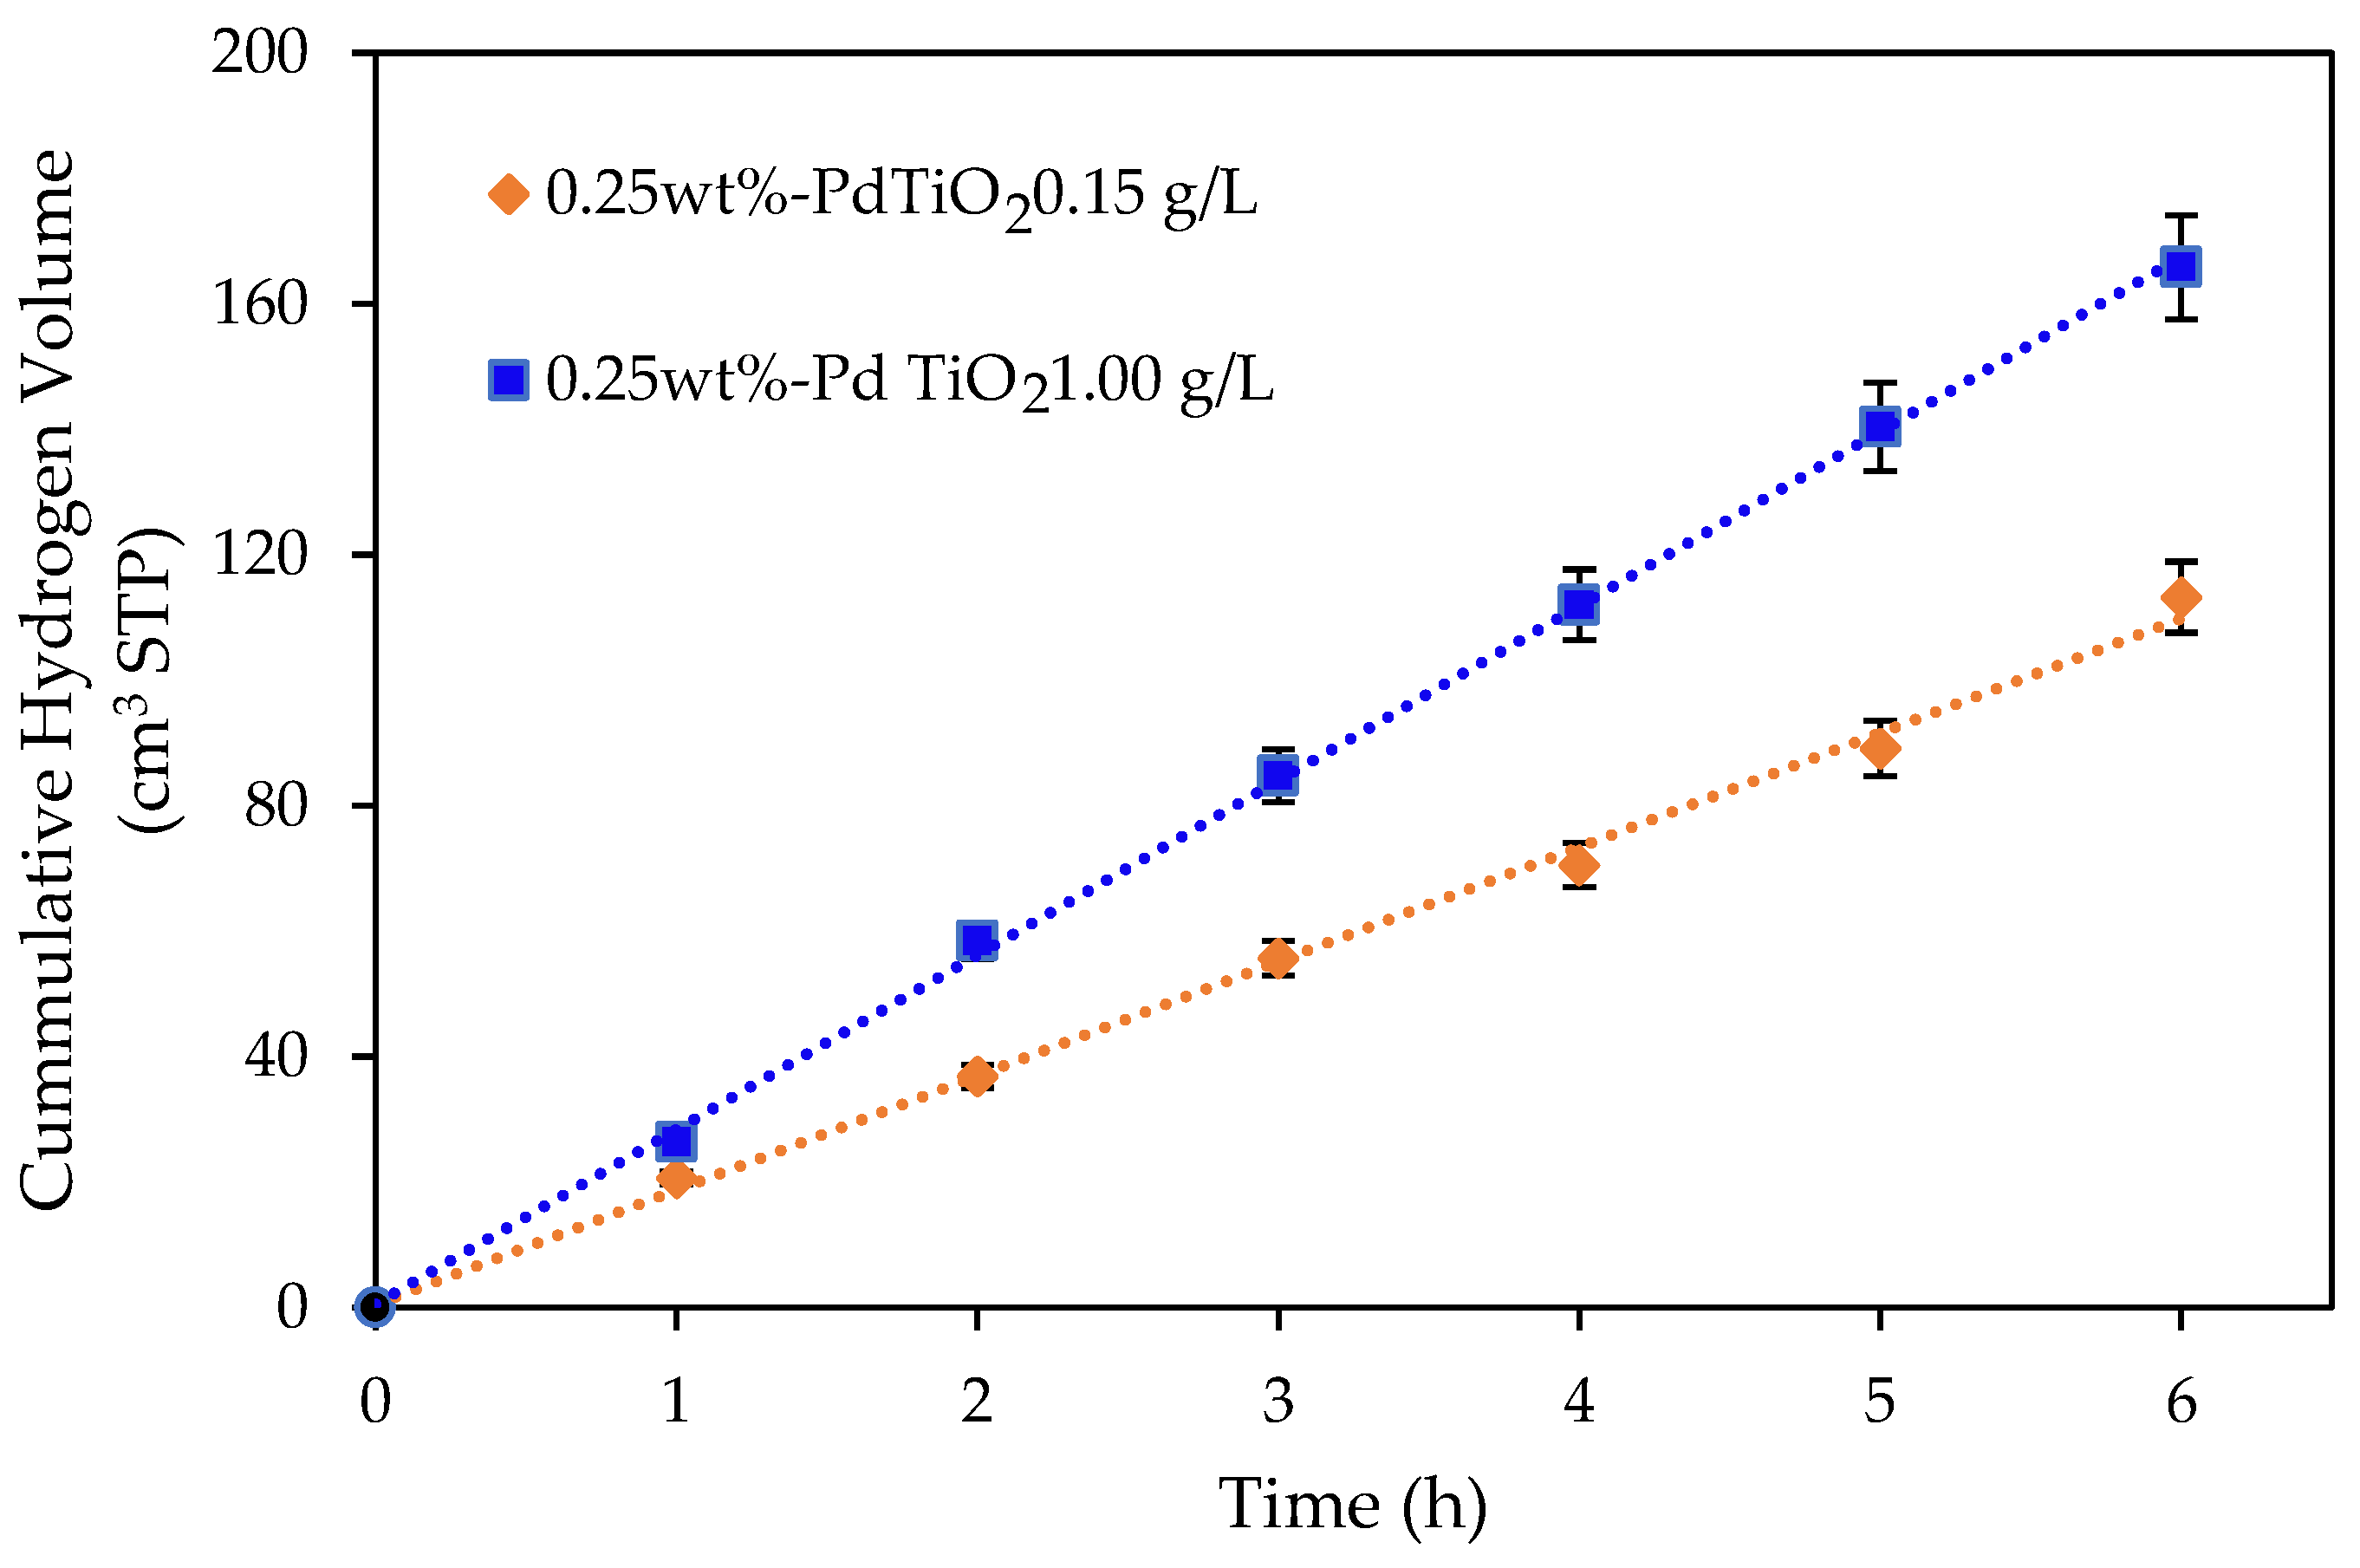
Figure 3.
Cumulative hydrogen production using an undoped TiO2 and a 0.25 wt% Pd-TiO2 at catalyst concentrations of 0.15 and 1.00 g L−1. Conditions: 2.0 v/v% ethanol, initial pH = 4 ± 0.05 and 6 h under near-UV light. Note: at least three repeats per experiment were performed.
Figure 3.
Cumulative hydrogen production using an undoped TiO2 and a 0.25 wt% Pd-TiO2 at catalyst concentrations of 0.15 and 1.00 g L−1. Conditions: 2.0 v/v% ethanol, initial pH = 4 ± 0.05 and 6 h under near-UV light. Note: at least three repeats per experiment were performed.
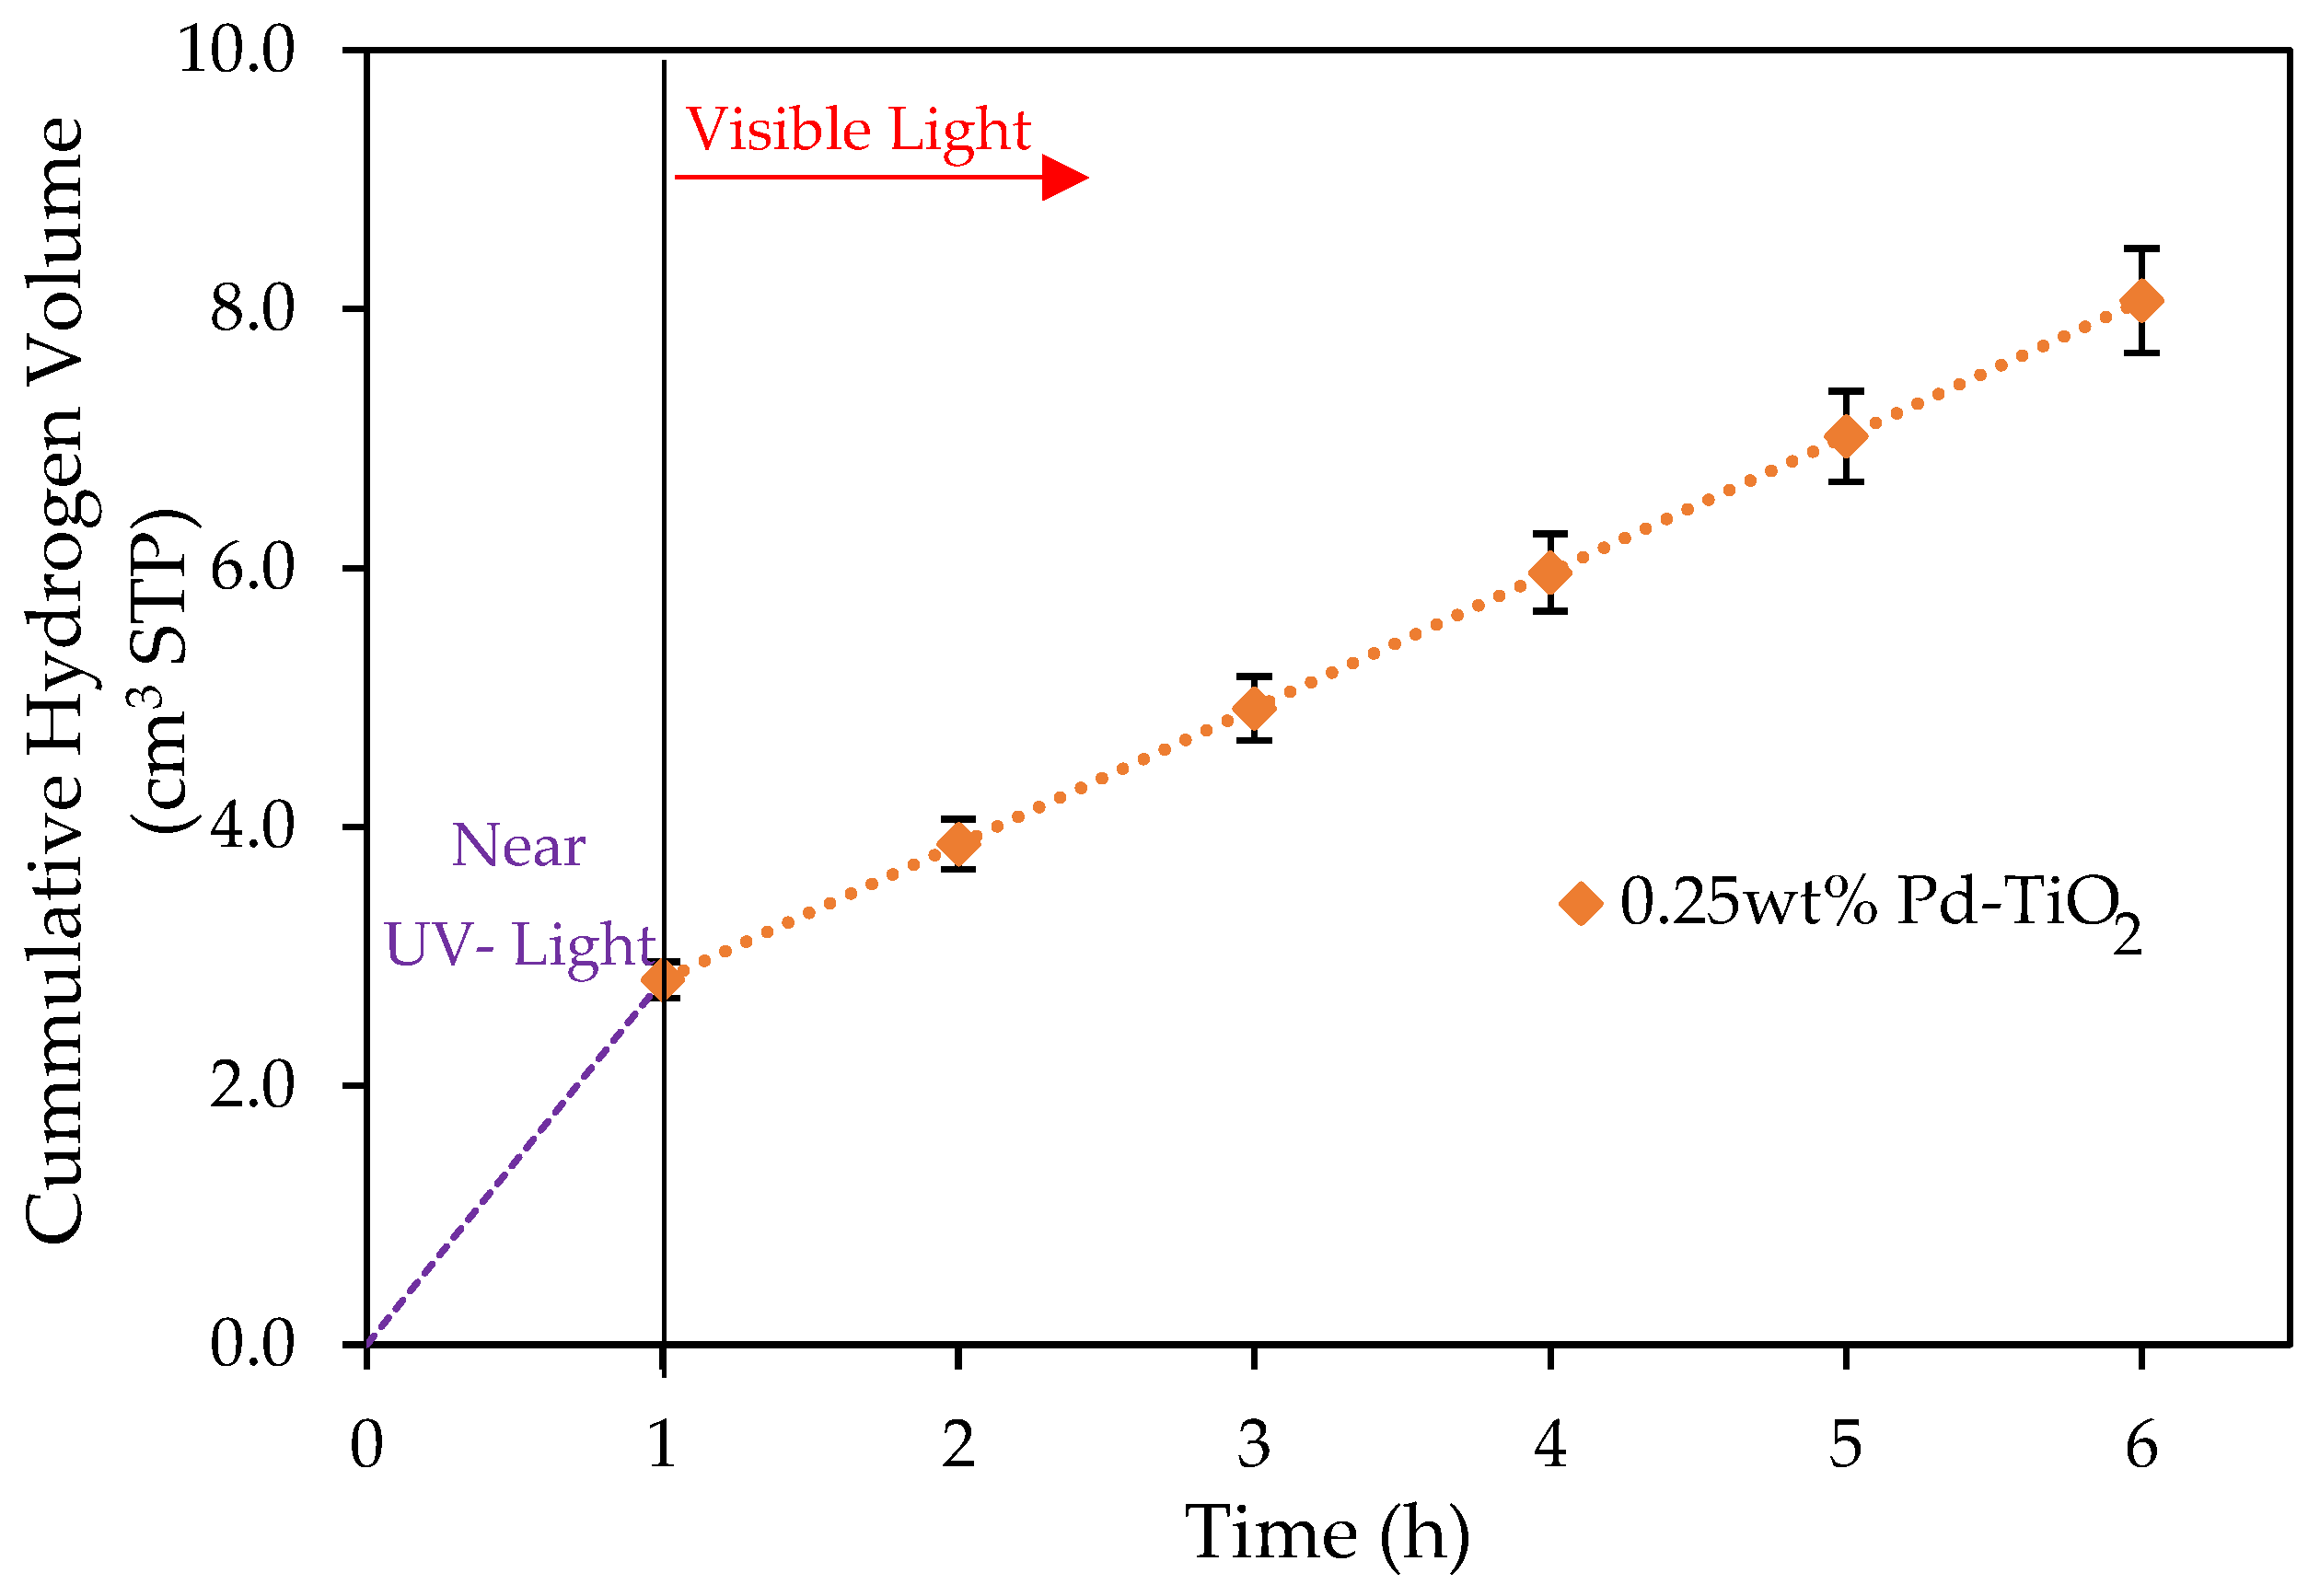
Figure 4.
Cumulative formed hydrogen using 0.25 wt% Pd-TiO2 and a 0.15 g L−1 photocatalyst concentration. Conditions: 1 h near-UV light photoreduction; 5 h of visible light; 2.0 v/v% ethanol; initial pH = 4 ± 0.05. Note: at least three repeats per experiment were performed.
Figure 4.
Cumulative formed hydrogen using 0.25 wt% Pd-TiO2 and a 0.15 g L−1 photocatalyst concentration. Conditions: 1 h near-UV light photoreduction; 5 h of visible light; 2.0 v/v% ethanol; initial pH = 4 ± 0.05. Note: at least three repeats per experiment were performed.
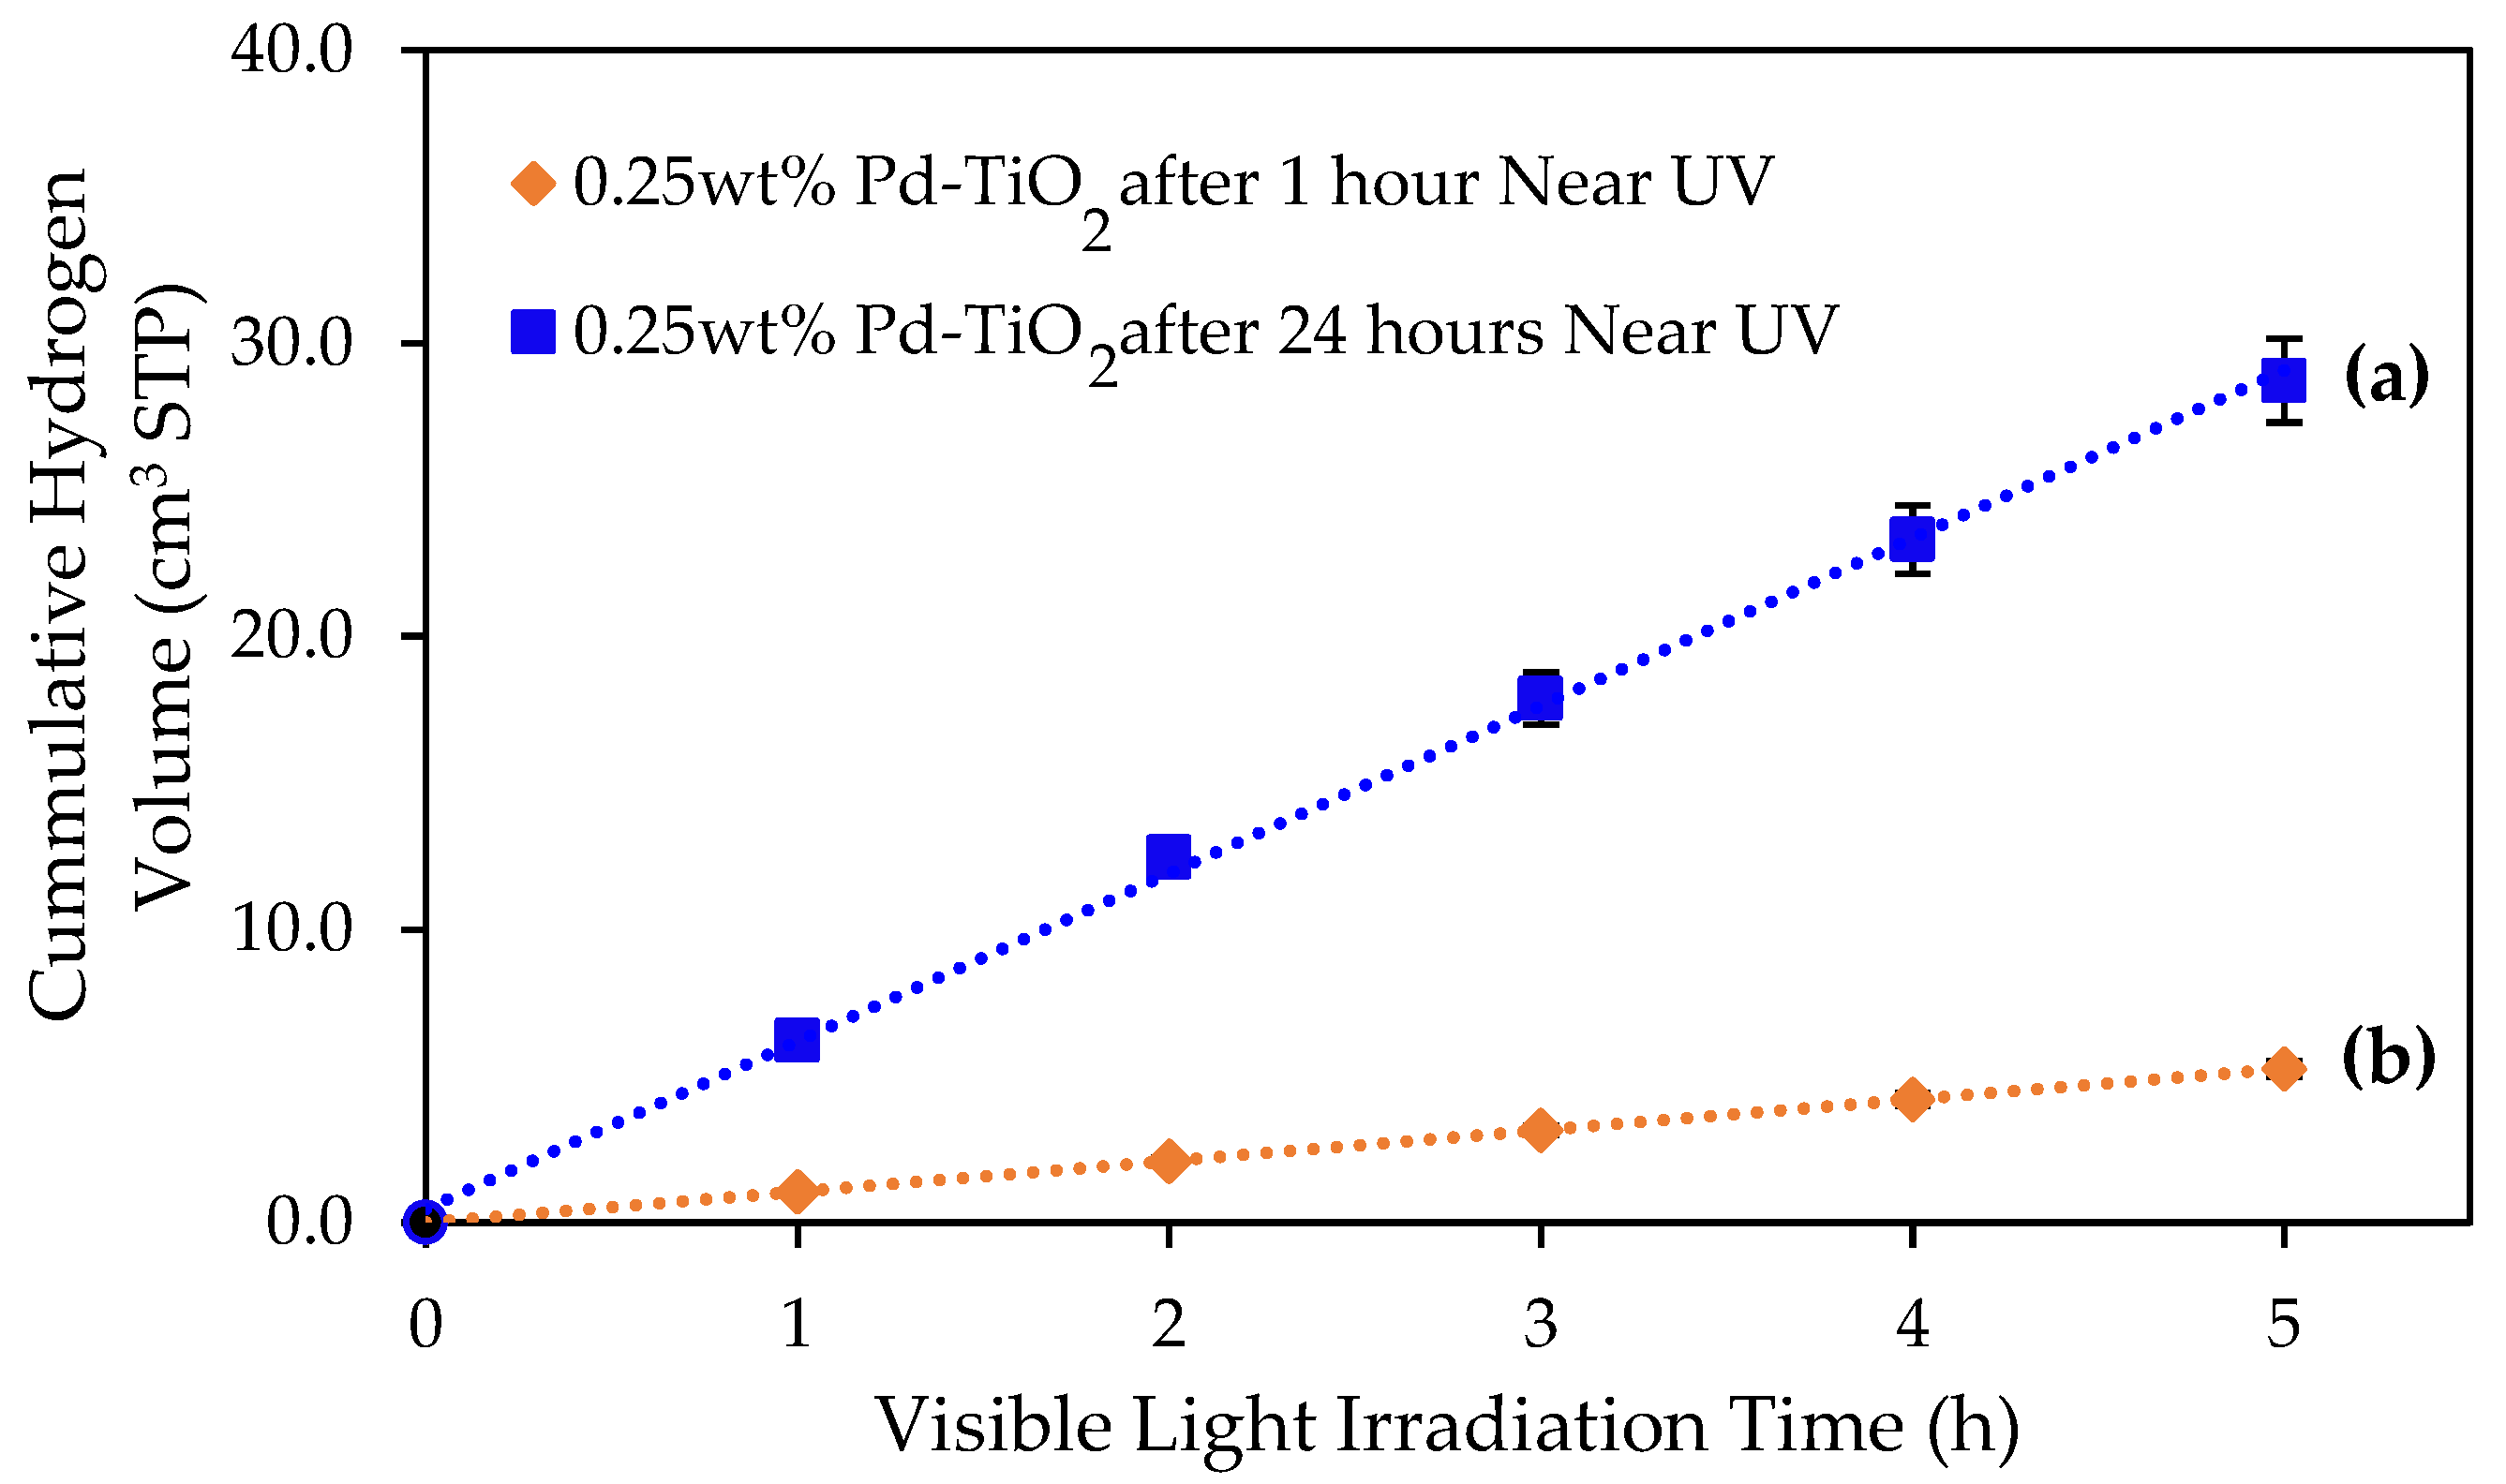
Figure 5.
Comparative cumulative hydrogen volume obtained during 5 h of visible light irradiation using the 0.25 wt% Pd-TiO2 photoreduced photocatalyst as follows: (a) hydrogen volume under visible light after 24 h of near-UV exposure; (b) hydrogen volume under visible light after 1 h of near-UV exposure. Photocatalyst conditions: 0.15 g L−1 photocatalyst concentration; 2.0 v/v% ethanol; and initial pH = 4 ± 0.05. Notes: There were at least three repeats per experiment.
Figure 6.
Ethanol adsorbed on 0.25 wt% Pd-TiO2 photocatalyst.
Figure 6.
Ethanol adsorbed on 0.25 wt% Pd-TiO2 photocatalyst.
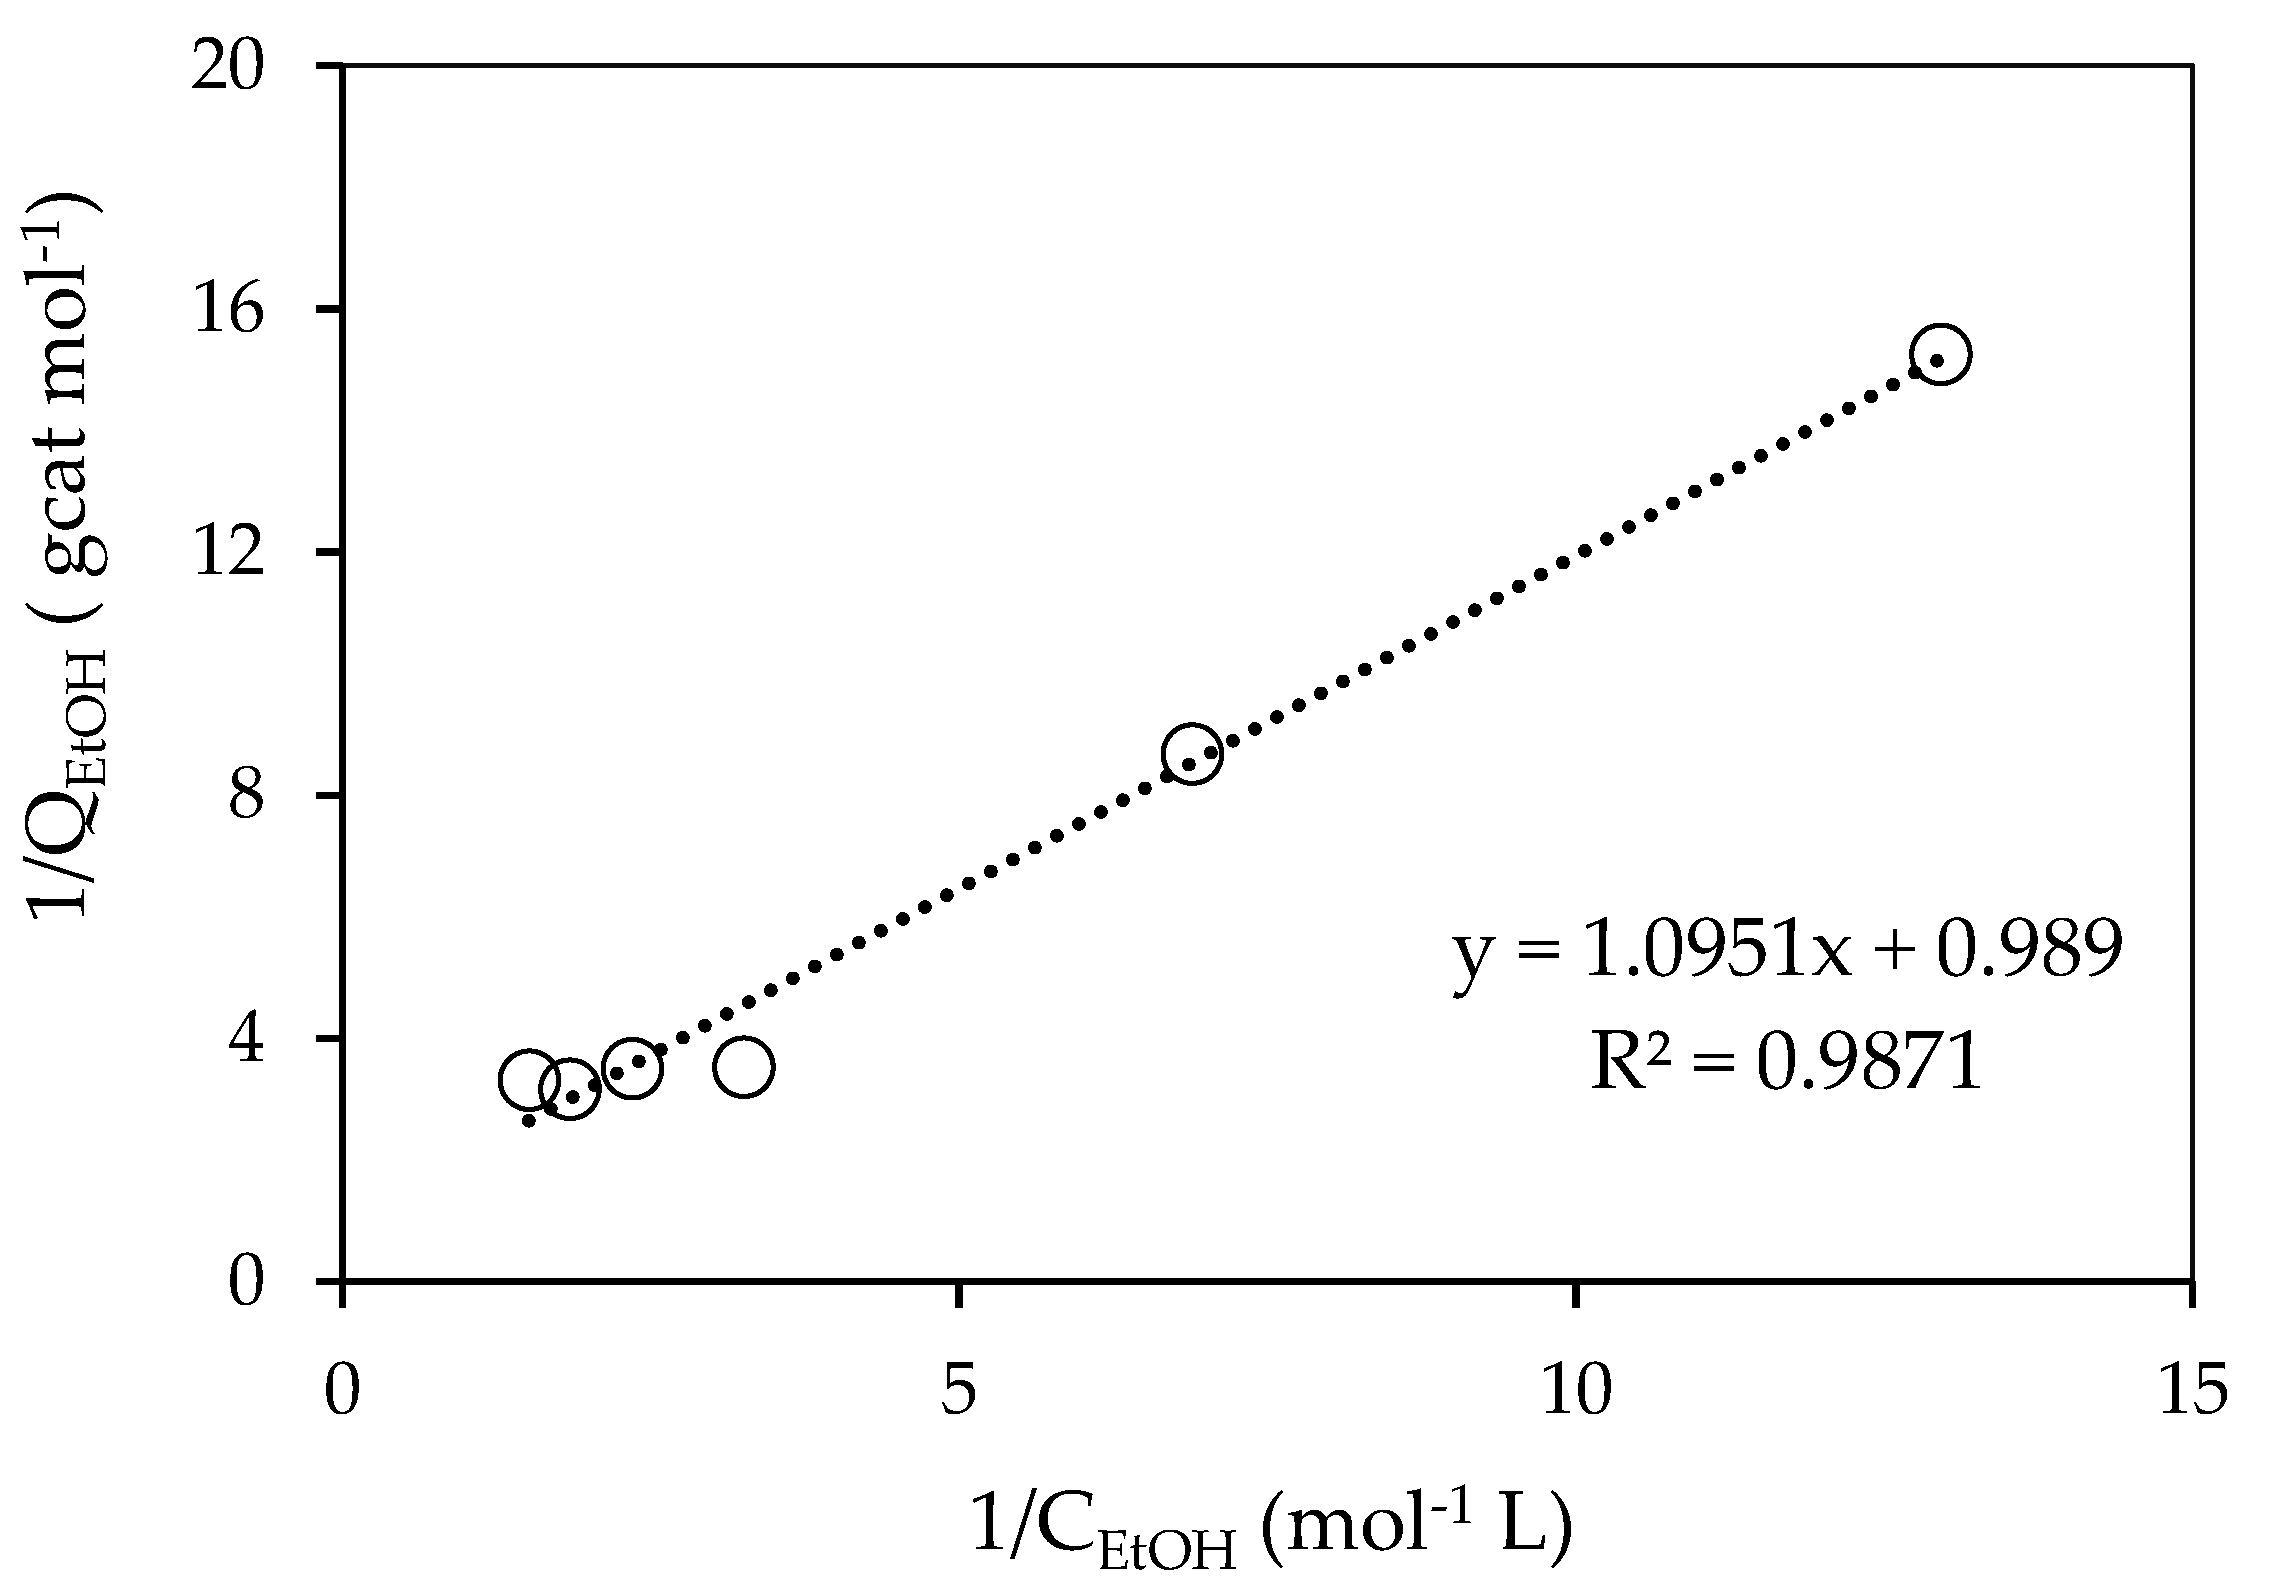
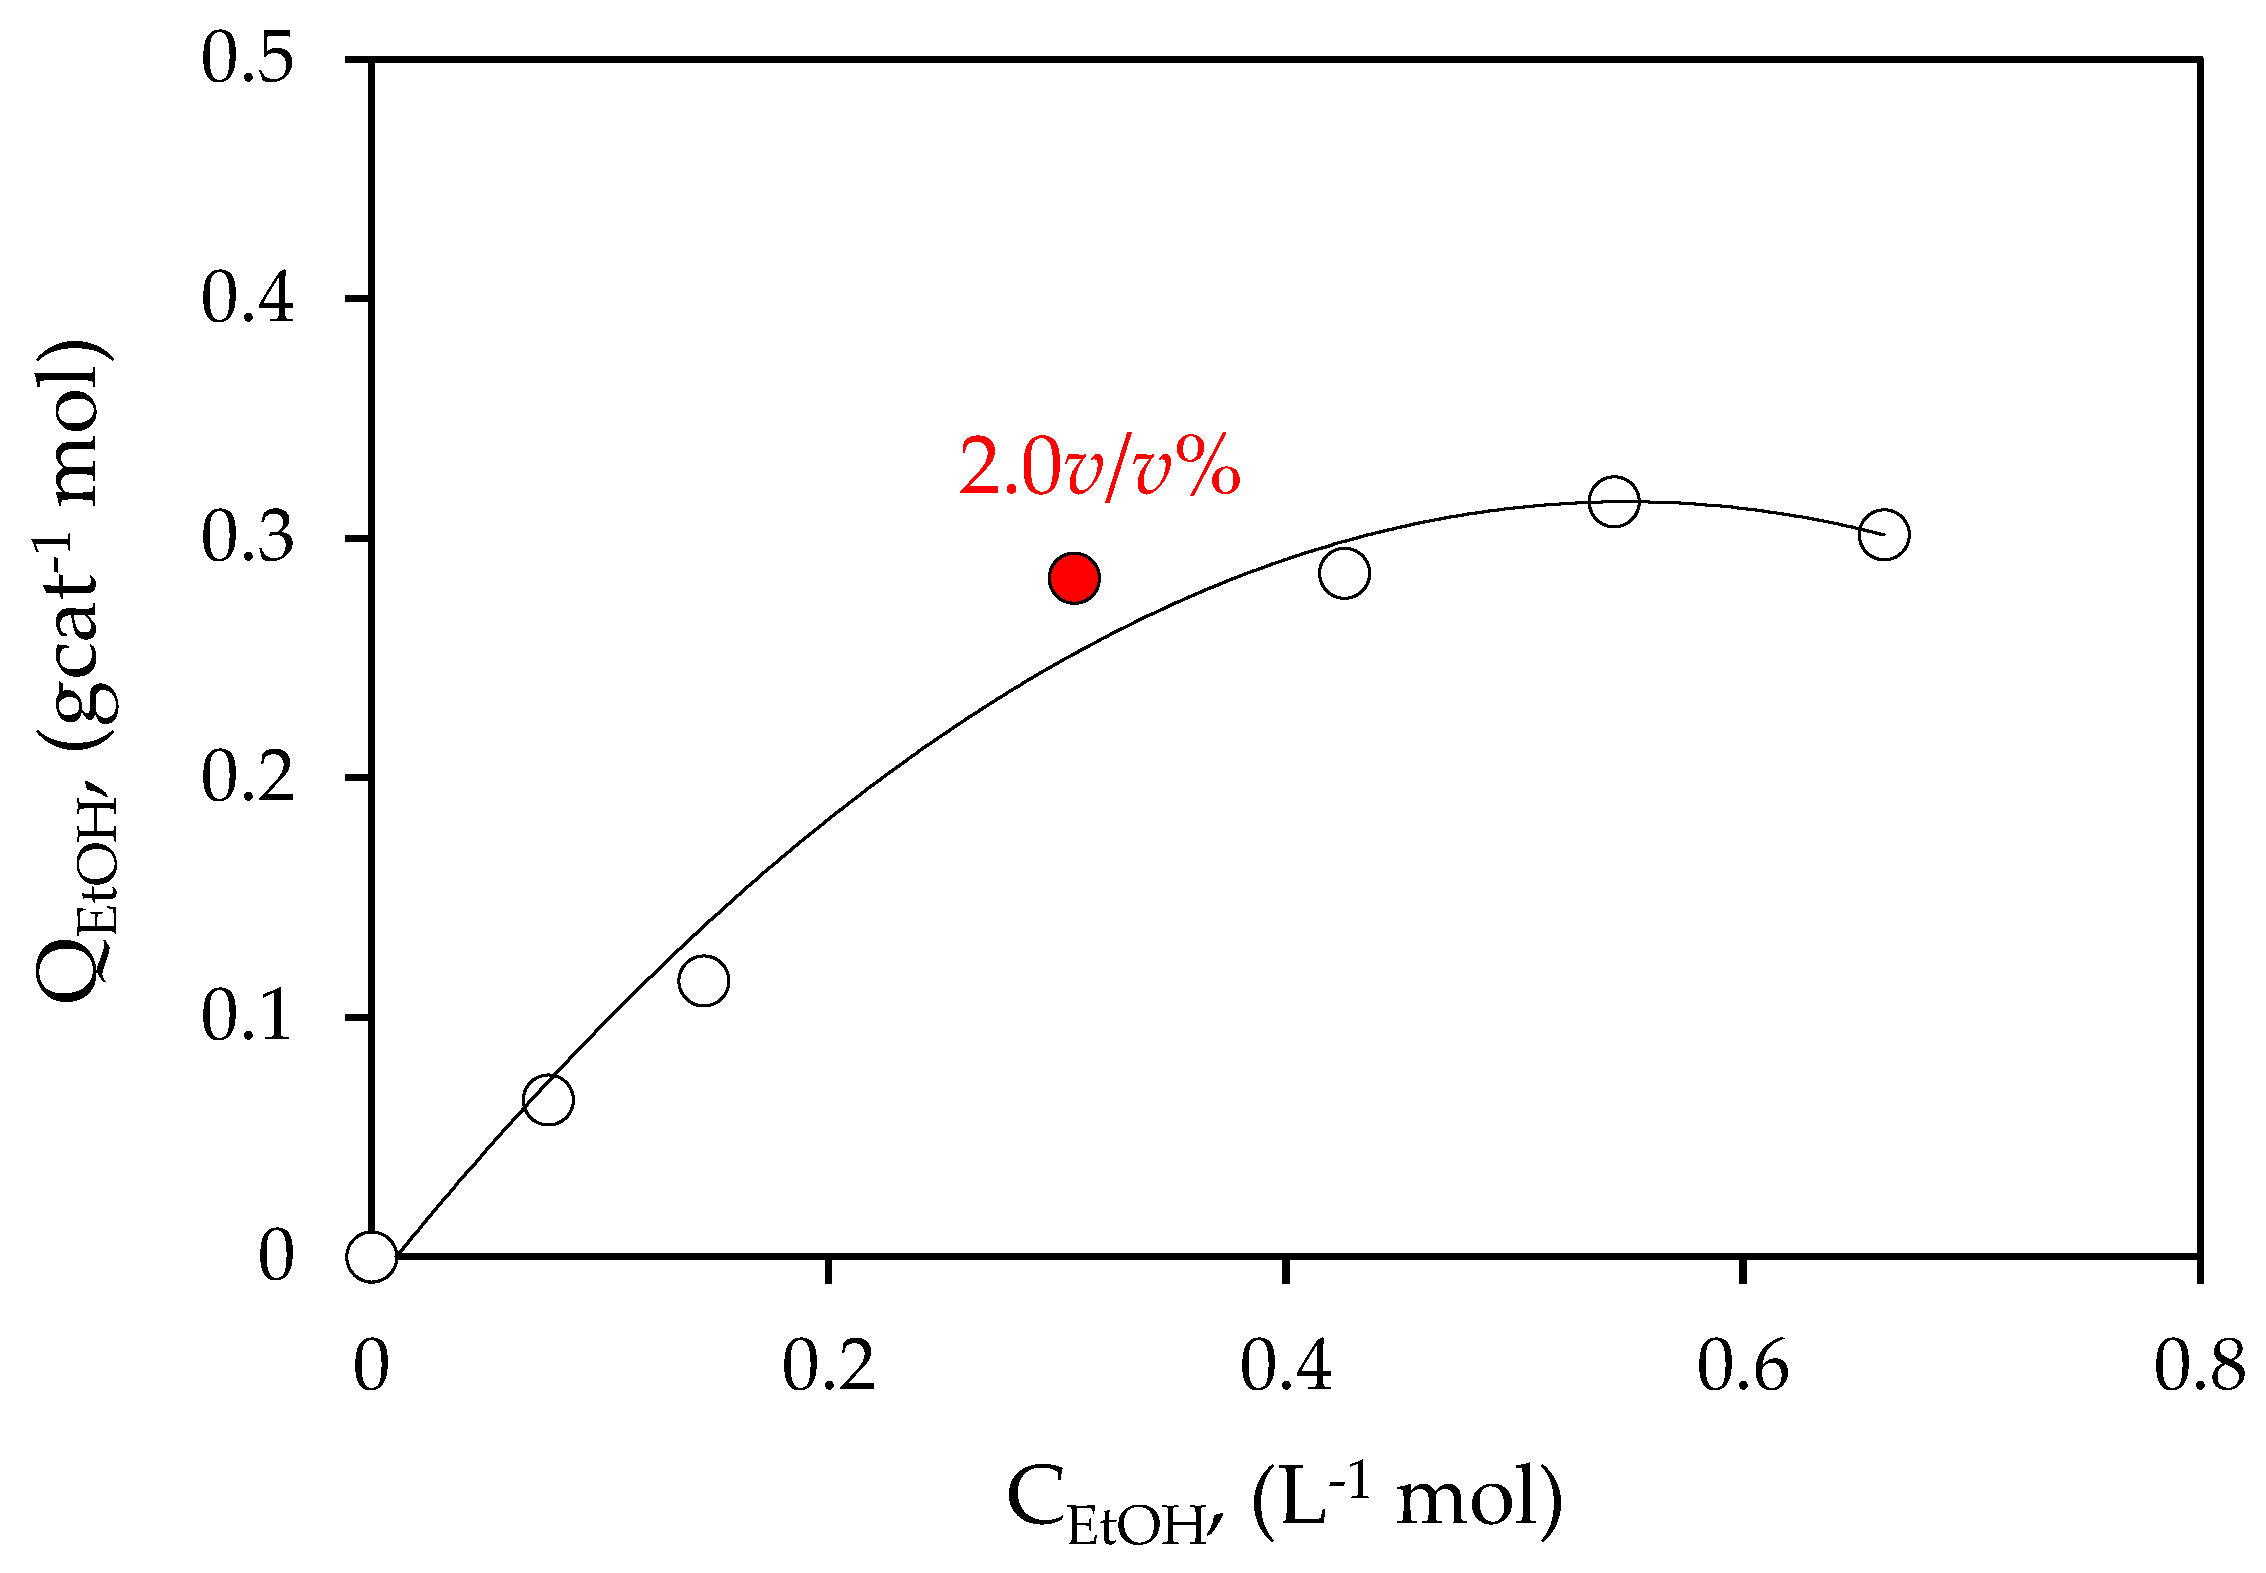
Figure 7.
Linearized Langmuir equilibrium isotherm for ethanol on 0.25 wt% Pd-TiO2.
Figure 7.
Linearized Langmuir equilibrium isotherm for ethanol on 0.25 wt% Pd-TiO2.
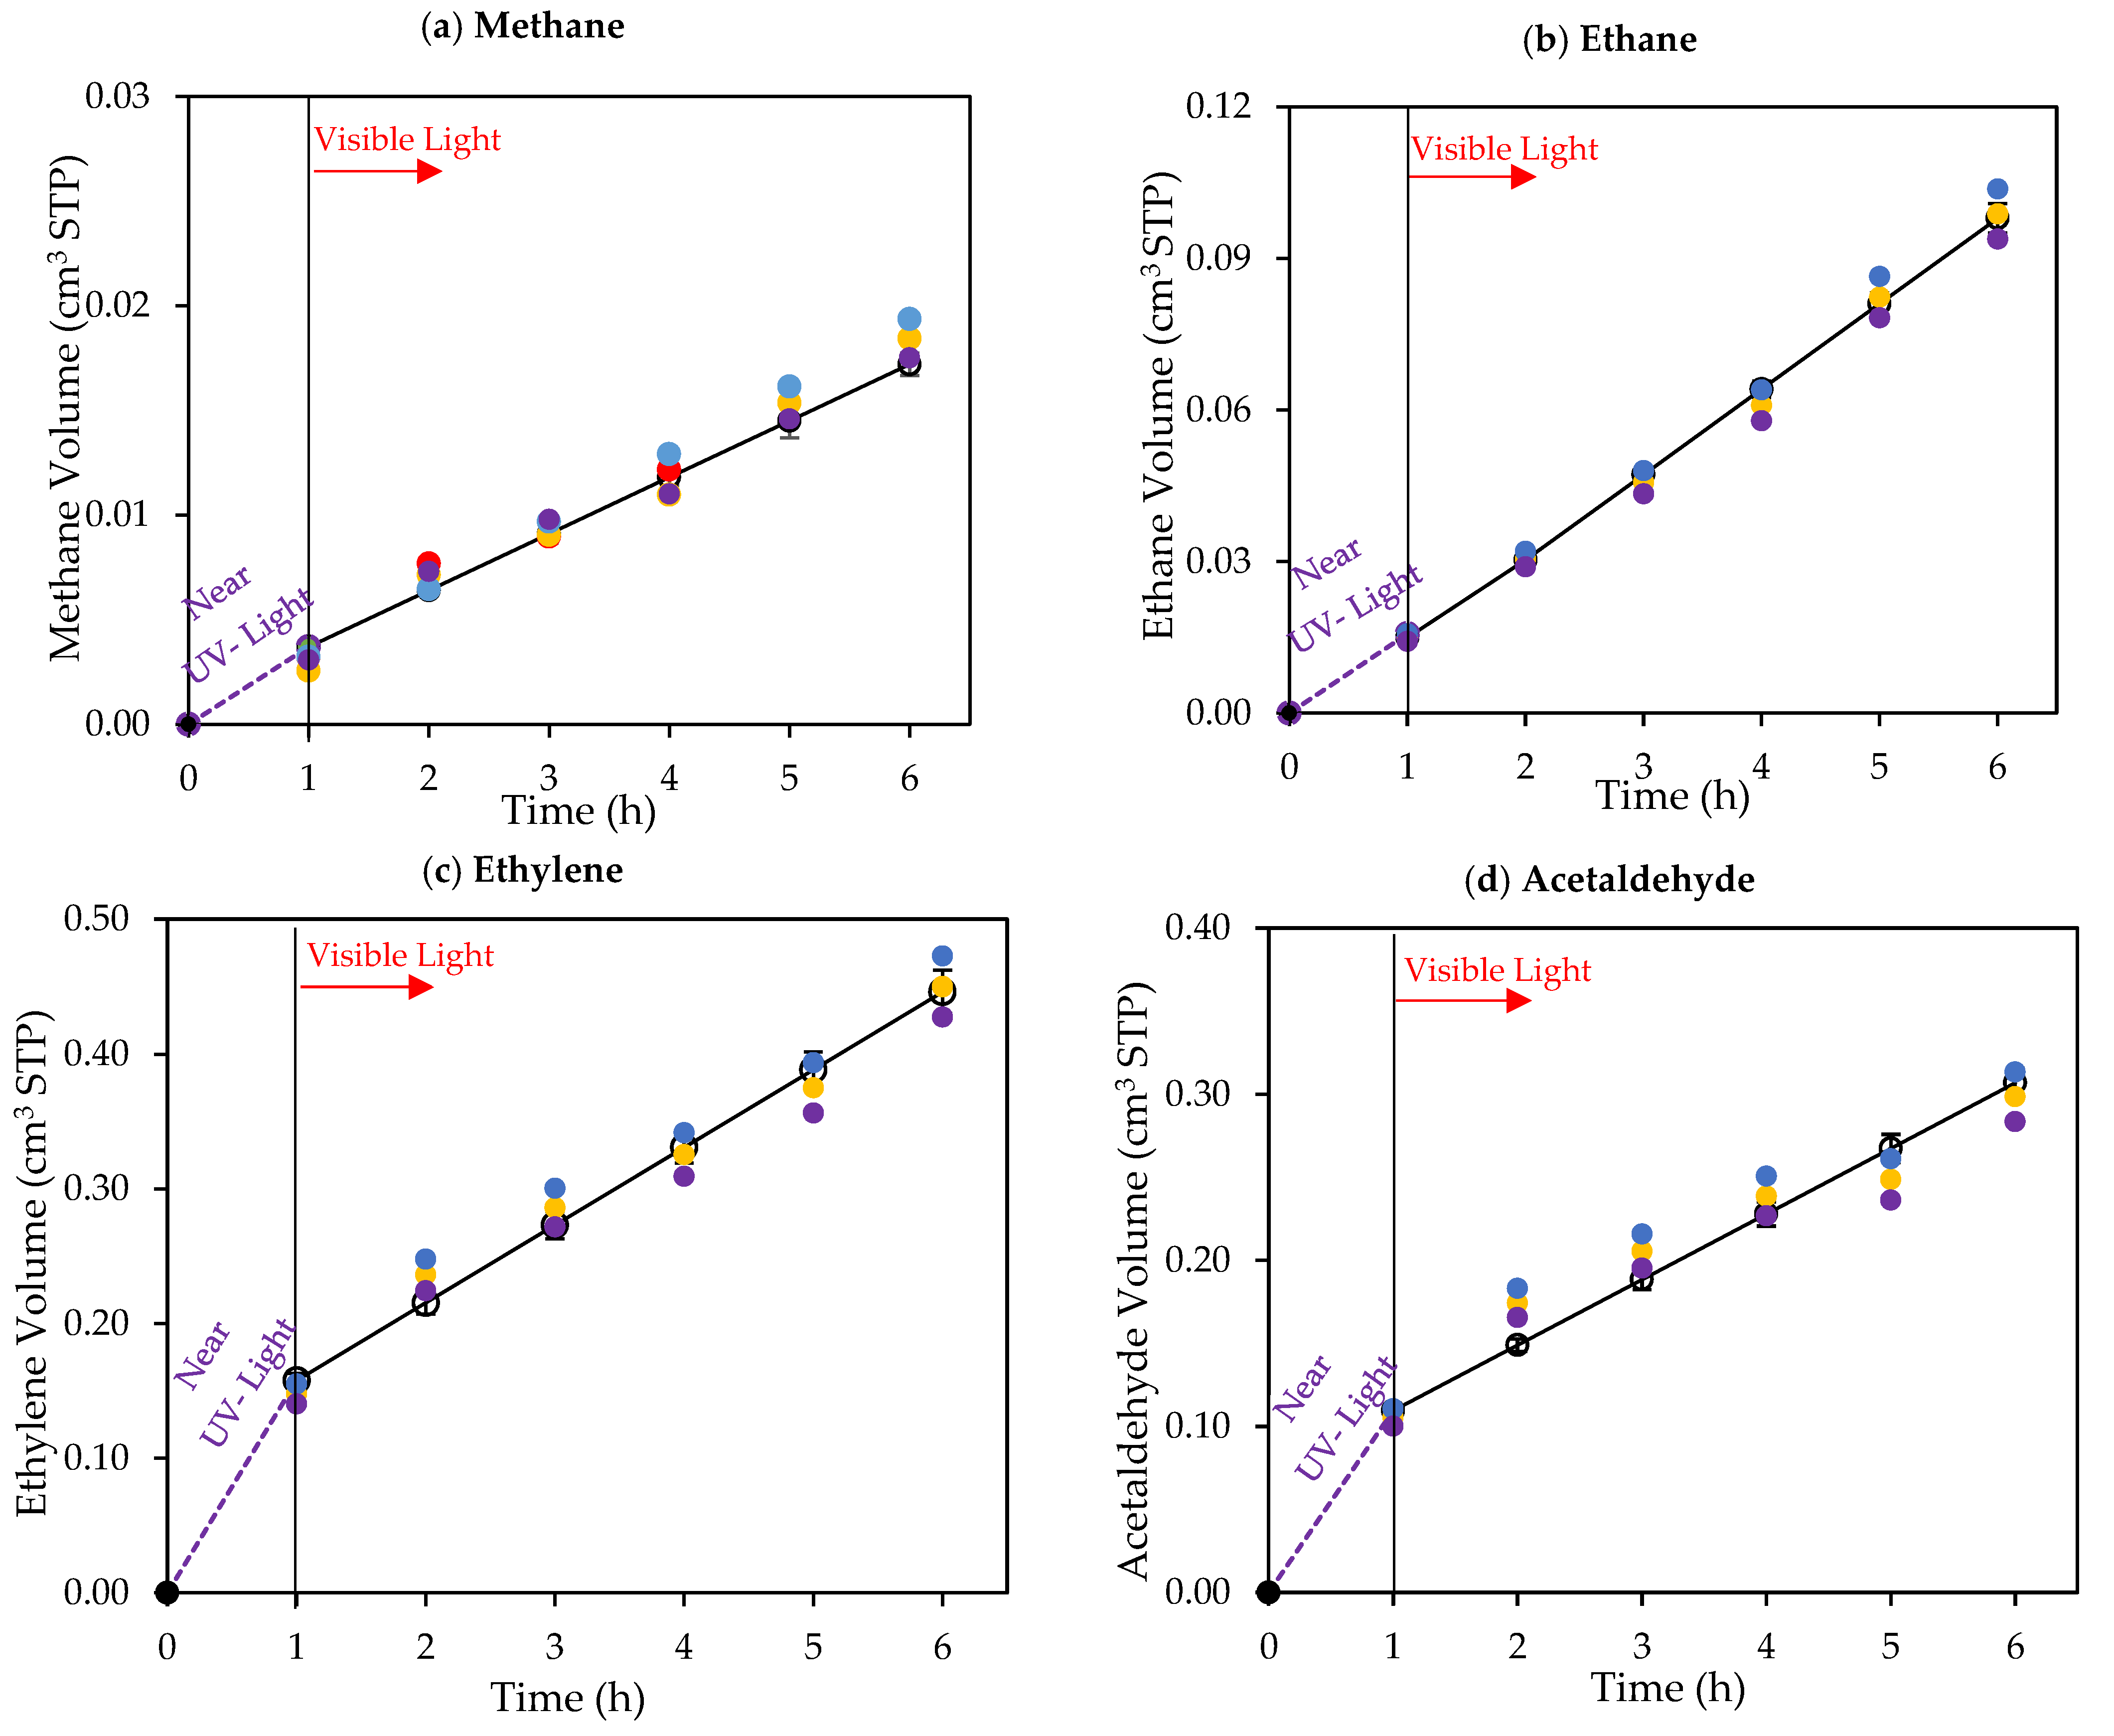
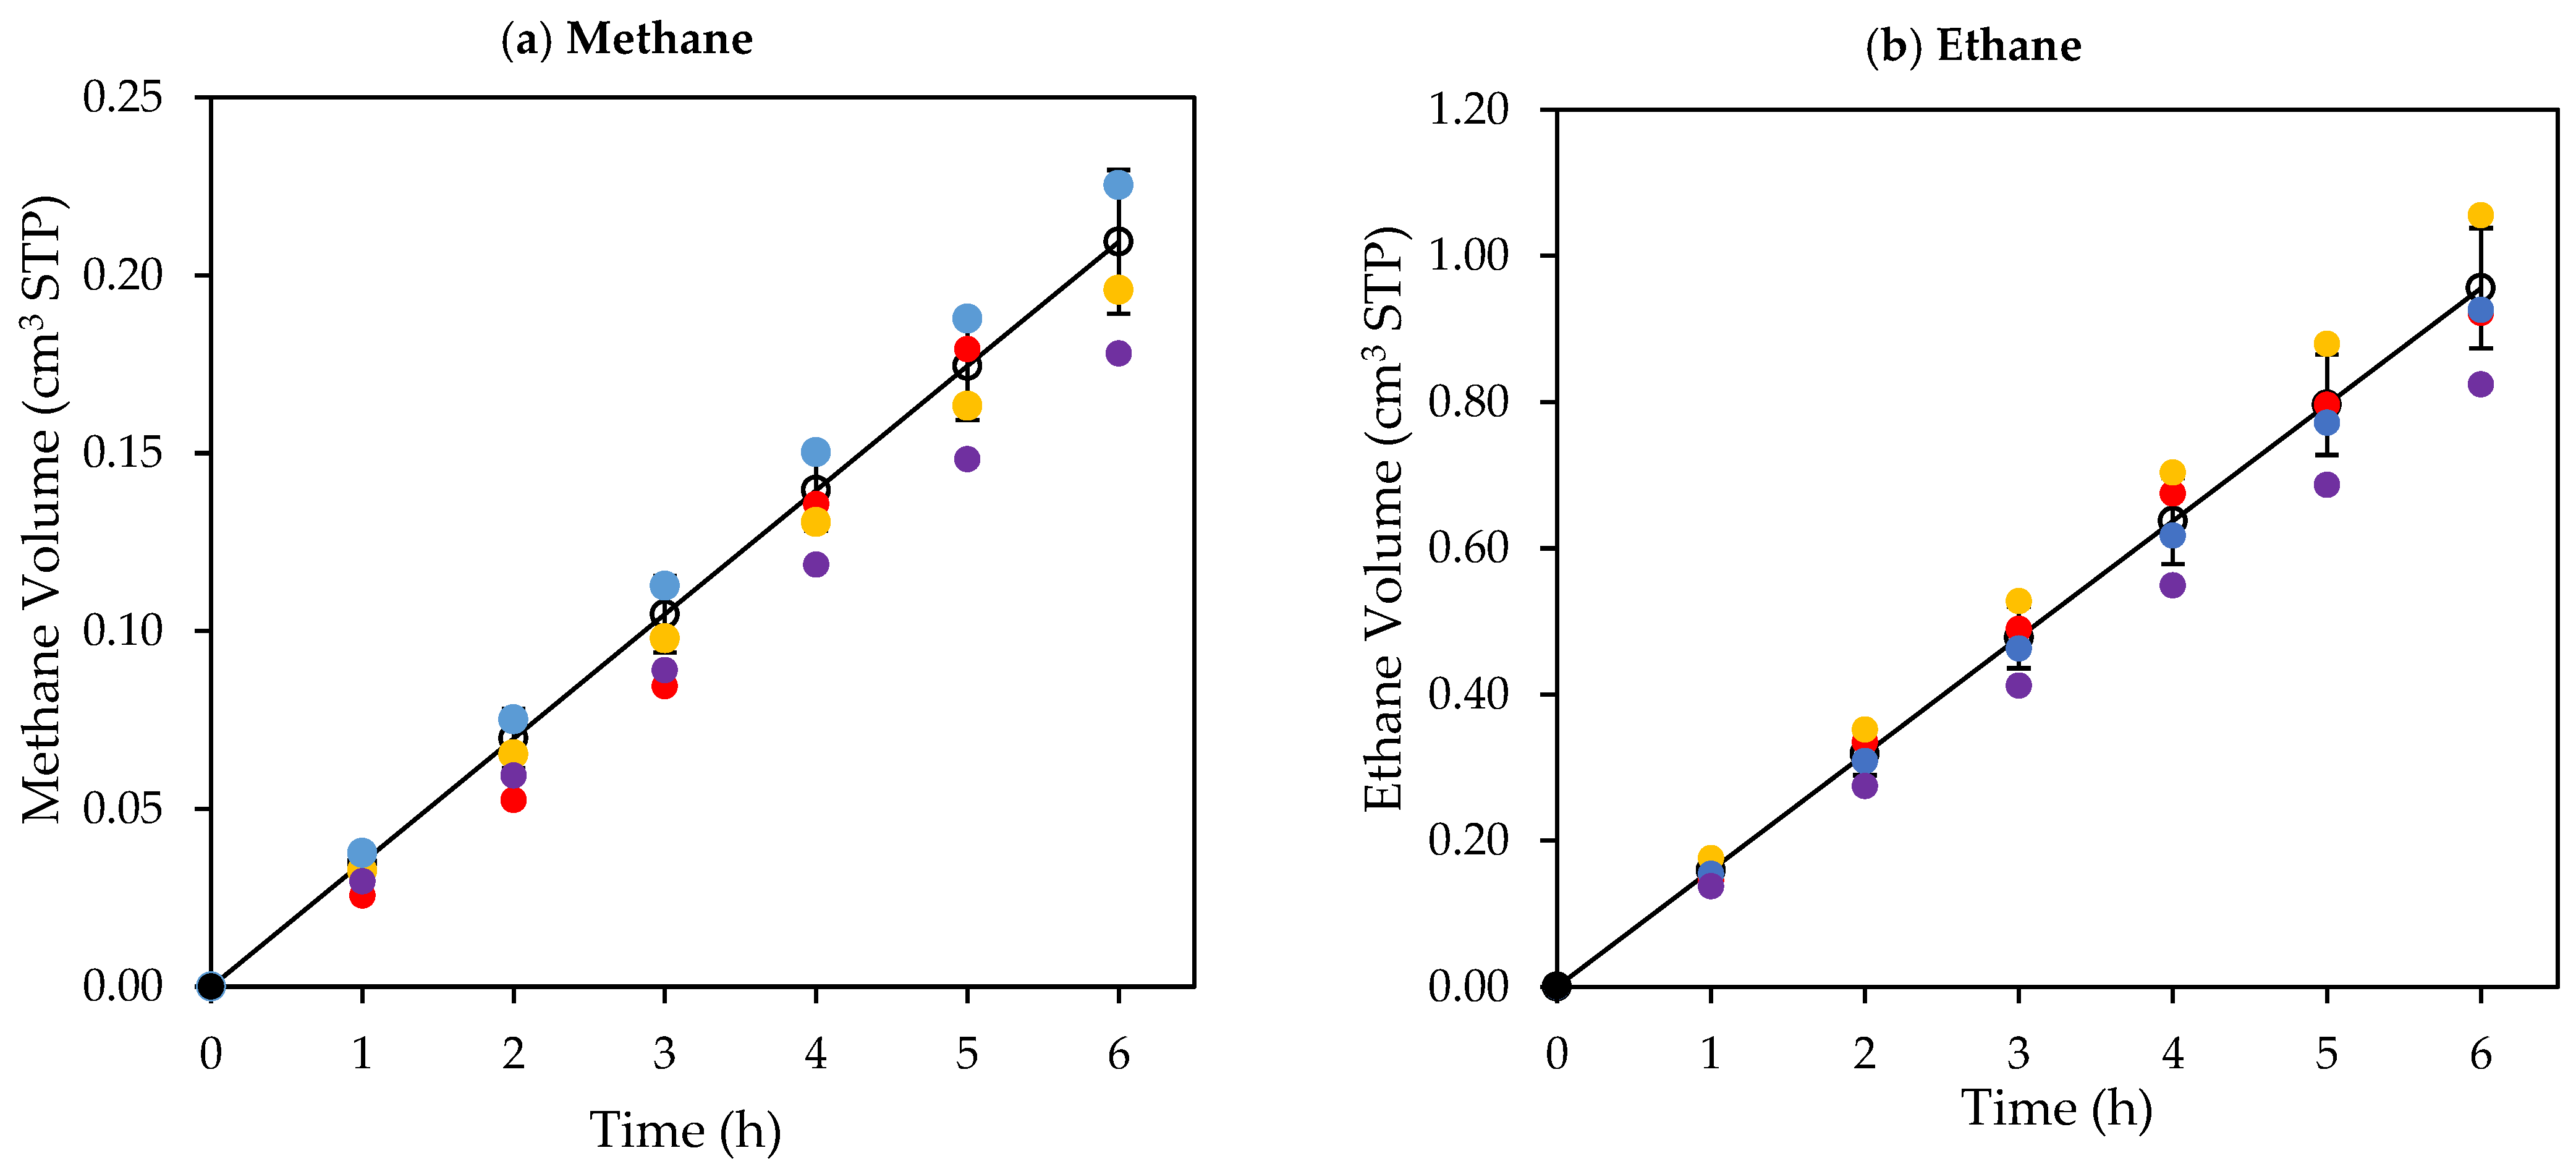
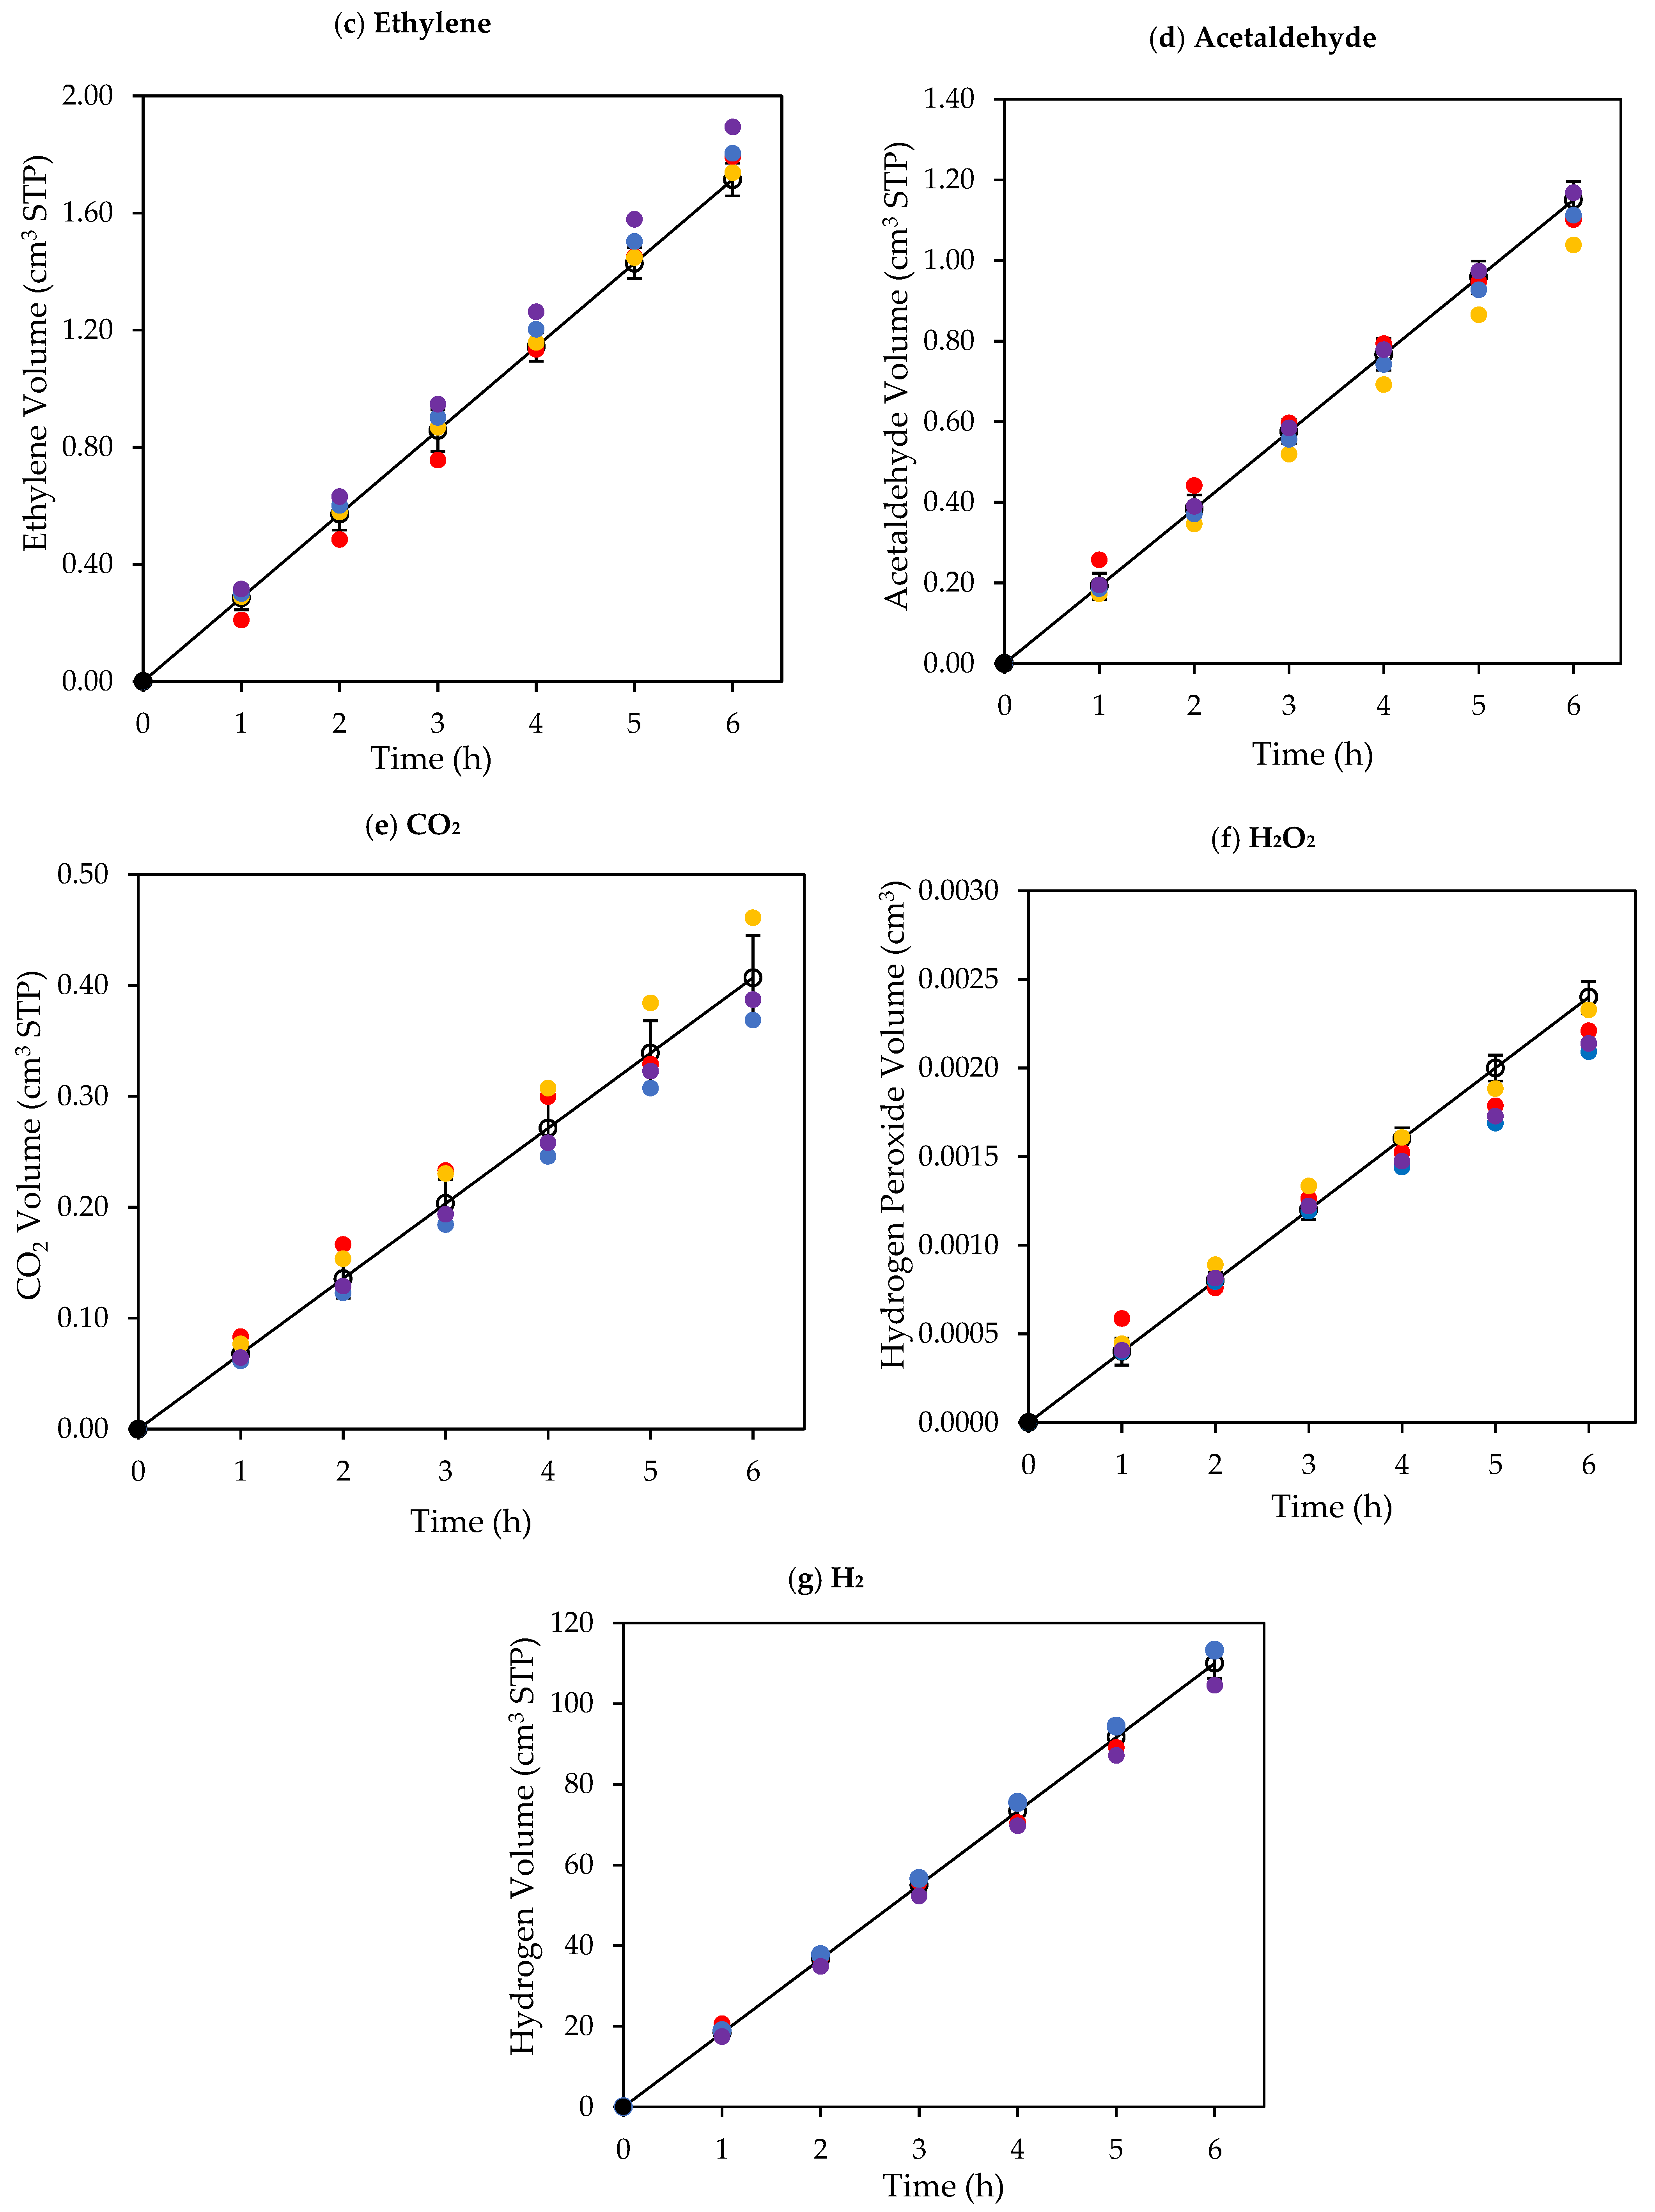
Figure 8.
Cumulative chemical species volumes obtained under near-UV: (a) methane; (b) ethane; (c) ethylene; (d) acetaldehyde; (e) CO2; (f) H2O2; and (g) H2. Experimental data are represented by (○) filled with different colors, each color represents a different experimental run, and model predictions are represented with solid lines. Experimental conditions: 0.25 wt% Pd-TiO2; 0.15 g L−1 photocatalyst concentration; initial pH = 4.0 ± 0.05; and 2.0 v/v% ethanol.
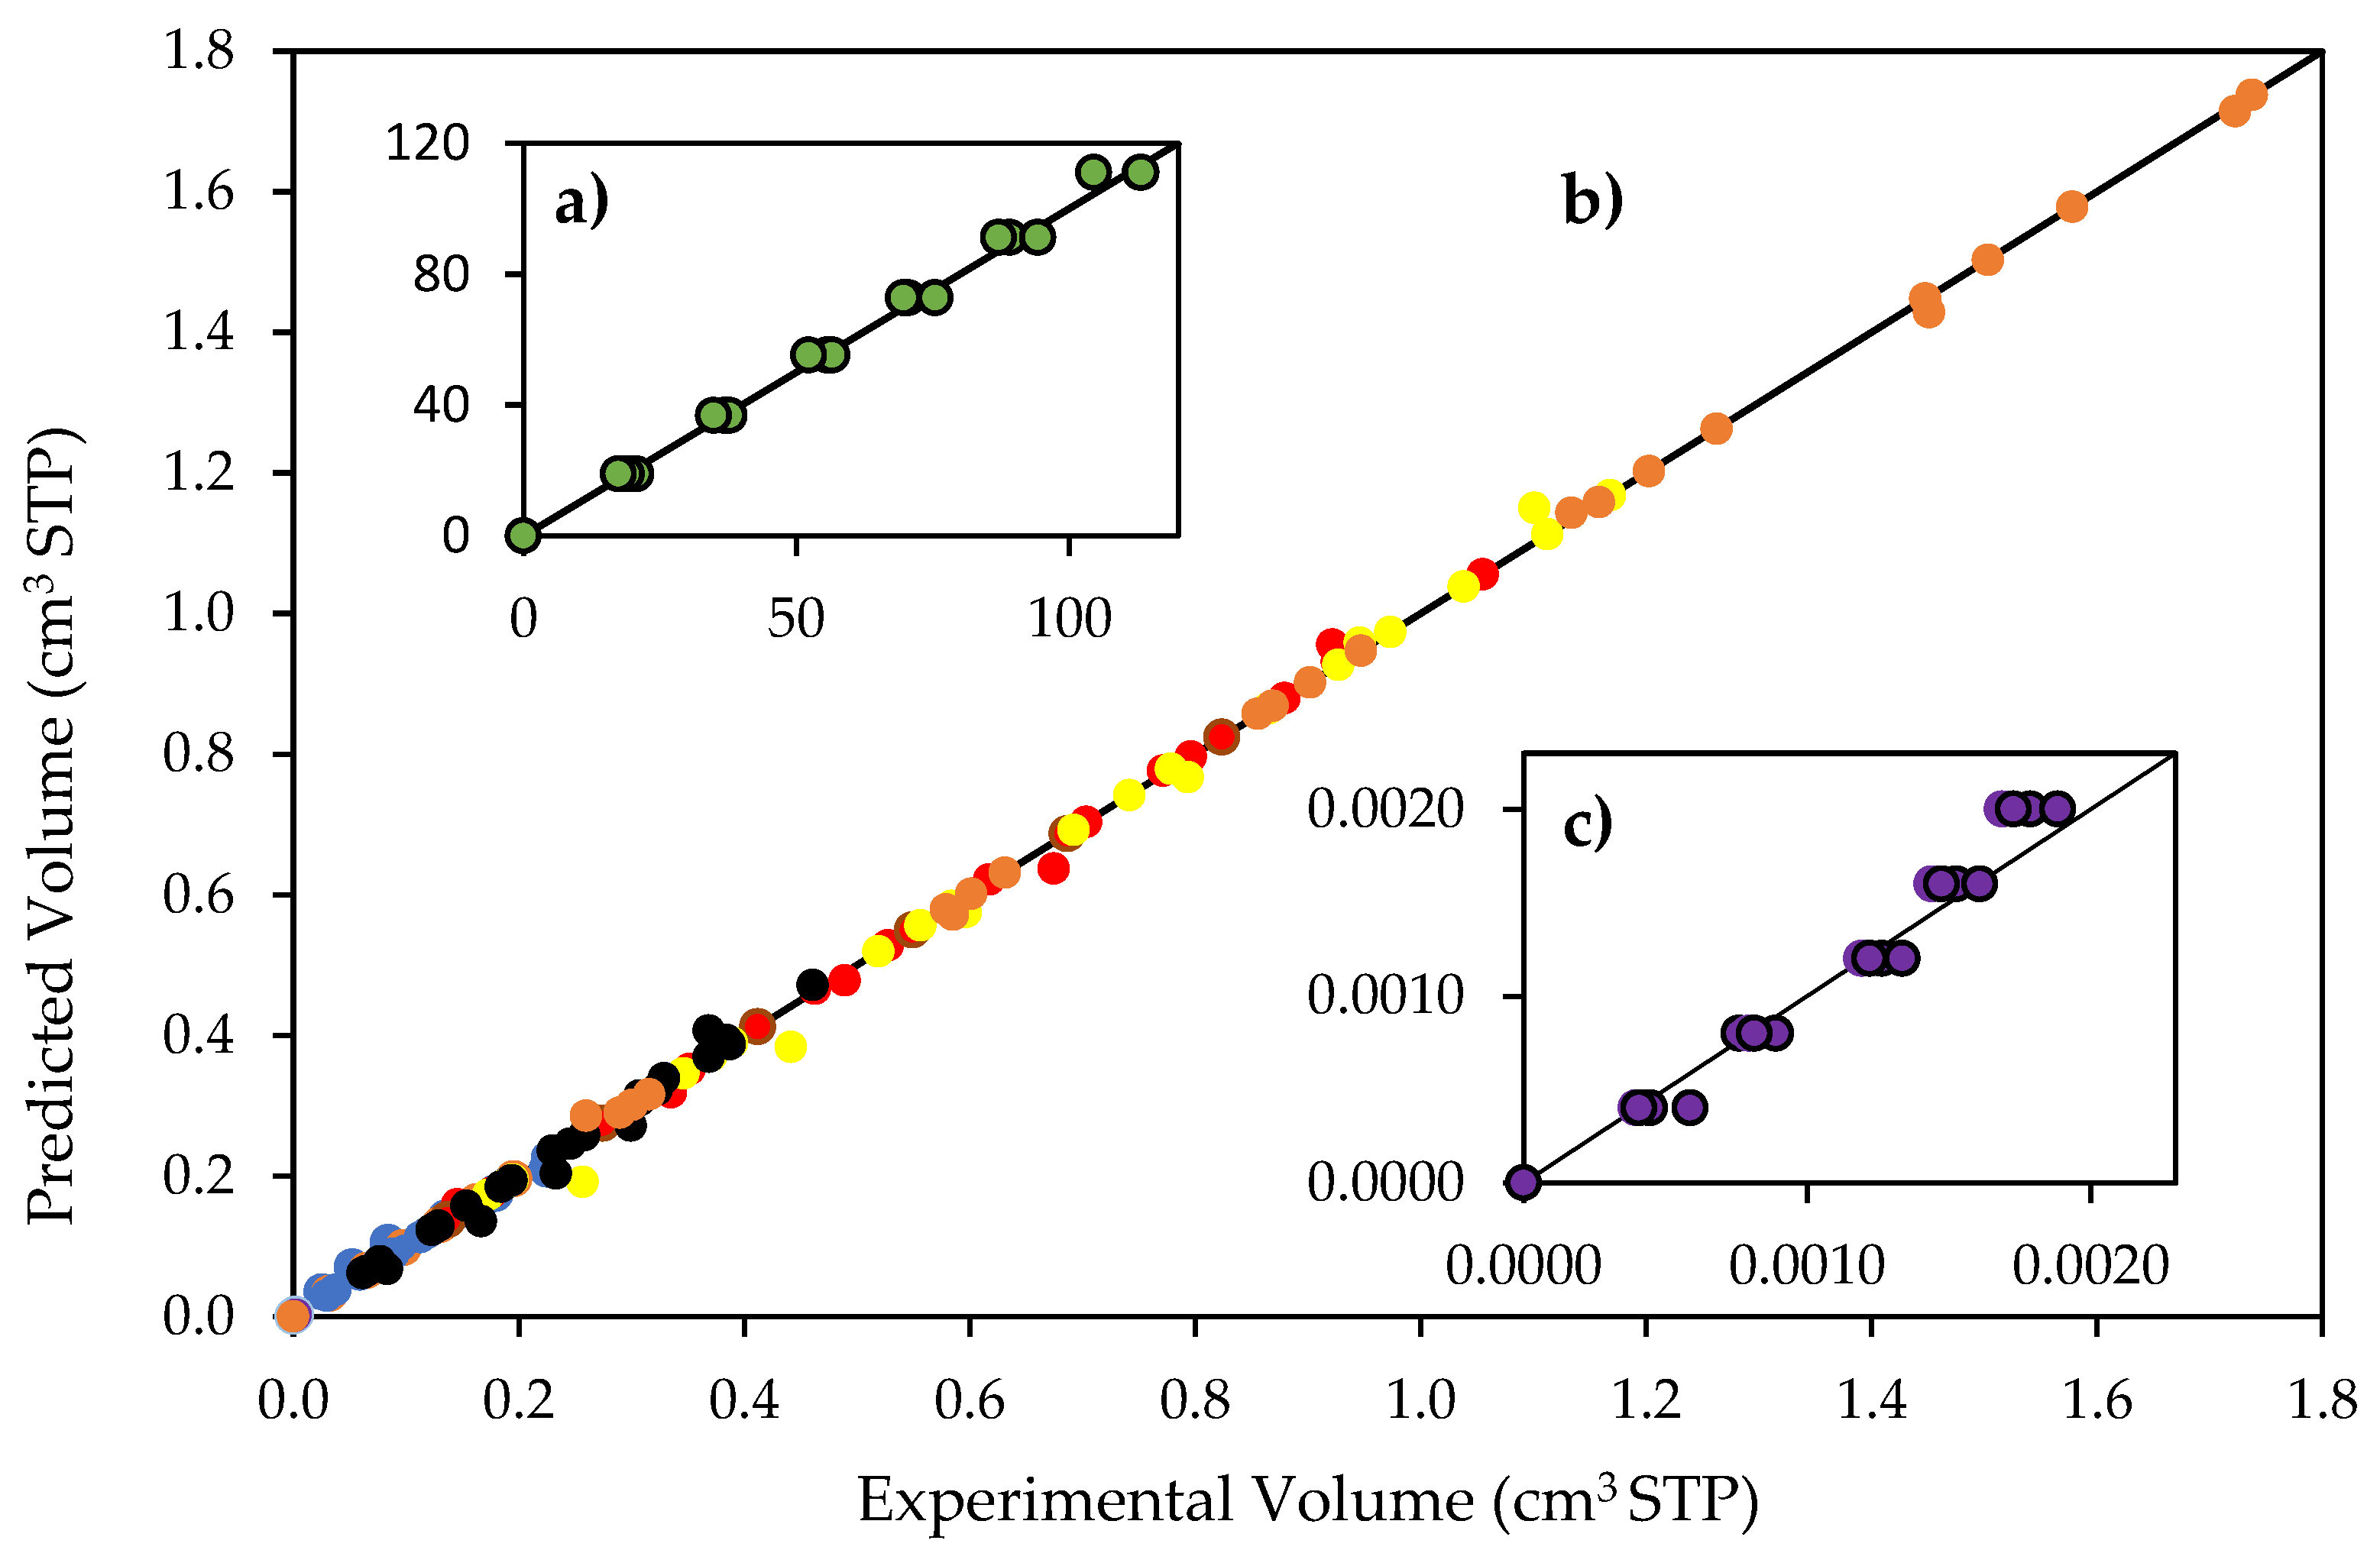
Figure 9.
Reconciliation plot for predicted and experimentally observed species volumes. Notes: (a) hydrogen volumes: 0 to 113 cm3 STP; (b) CO2, CH4, C2H4O, C2H6 and C2H4 volumes, 0 to 1.8 cm3; and (c) hydrogen peroxide volumes, 0 to 0.0022 cm3 STP. Conditions: 0.25 wt% Pd-TiO2 photocatalyst; 0.15 g L−1 photocatalyst concentration; near-UV light. Experimental error of 3.4%.
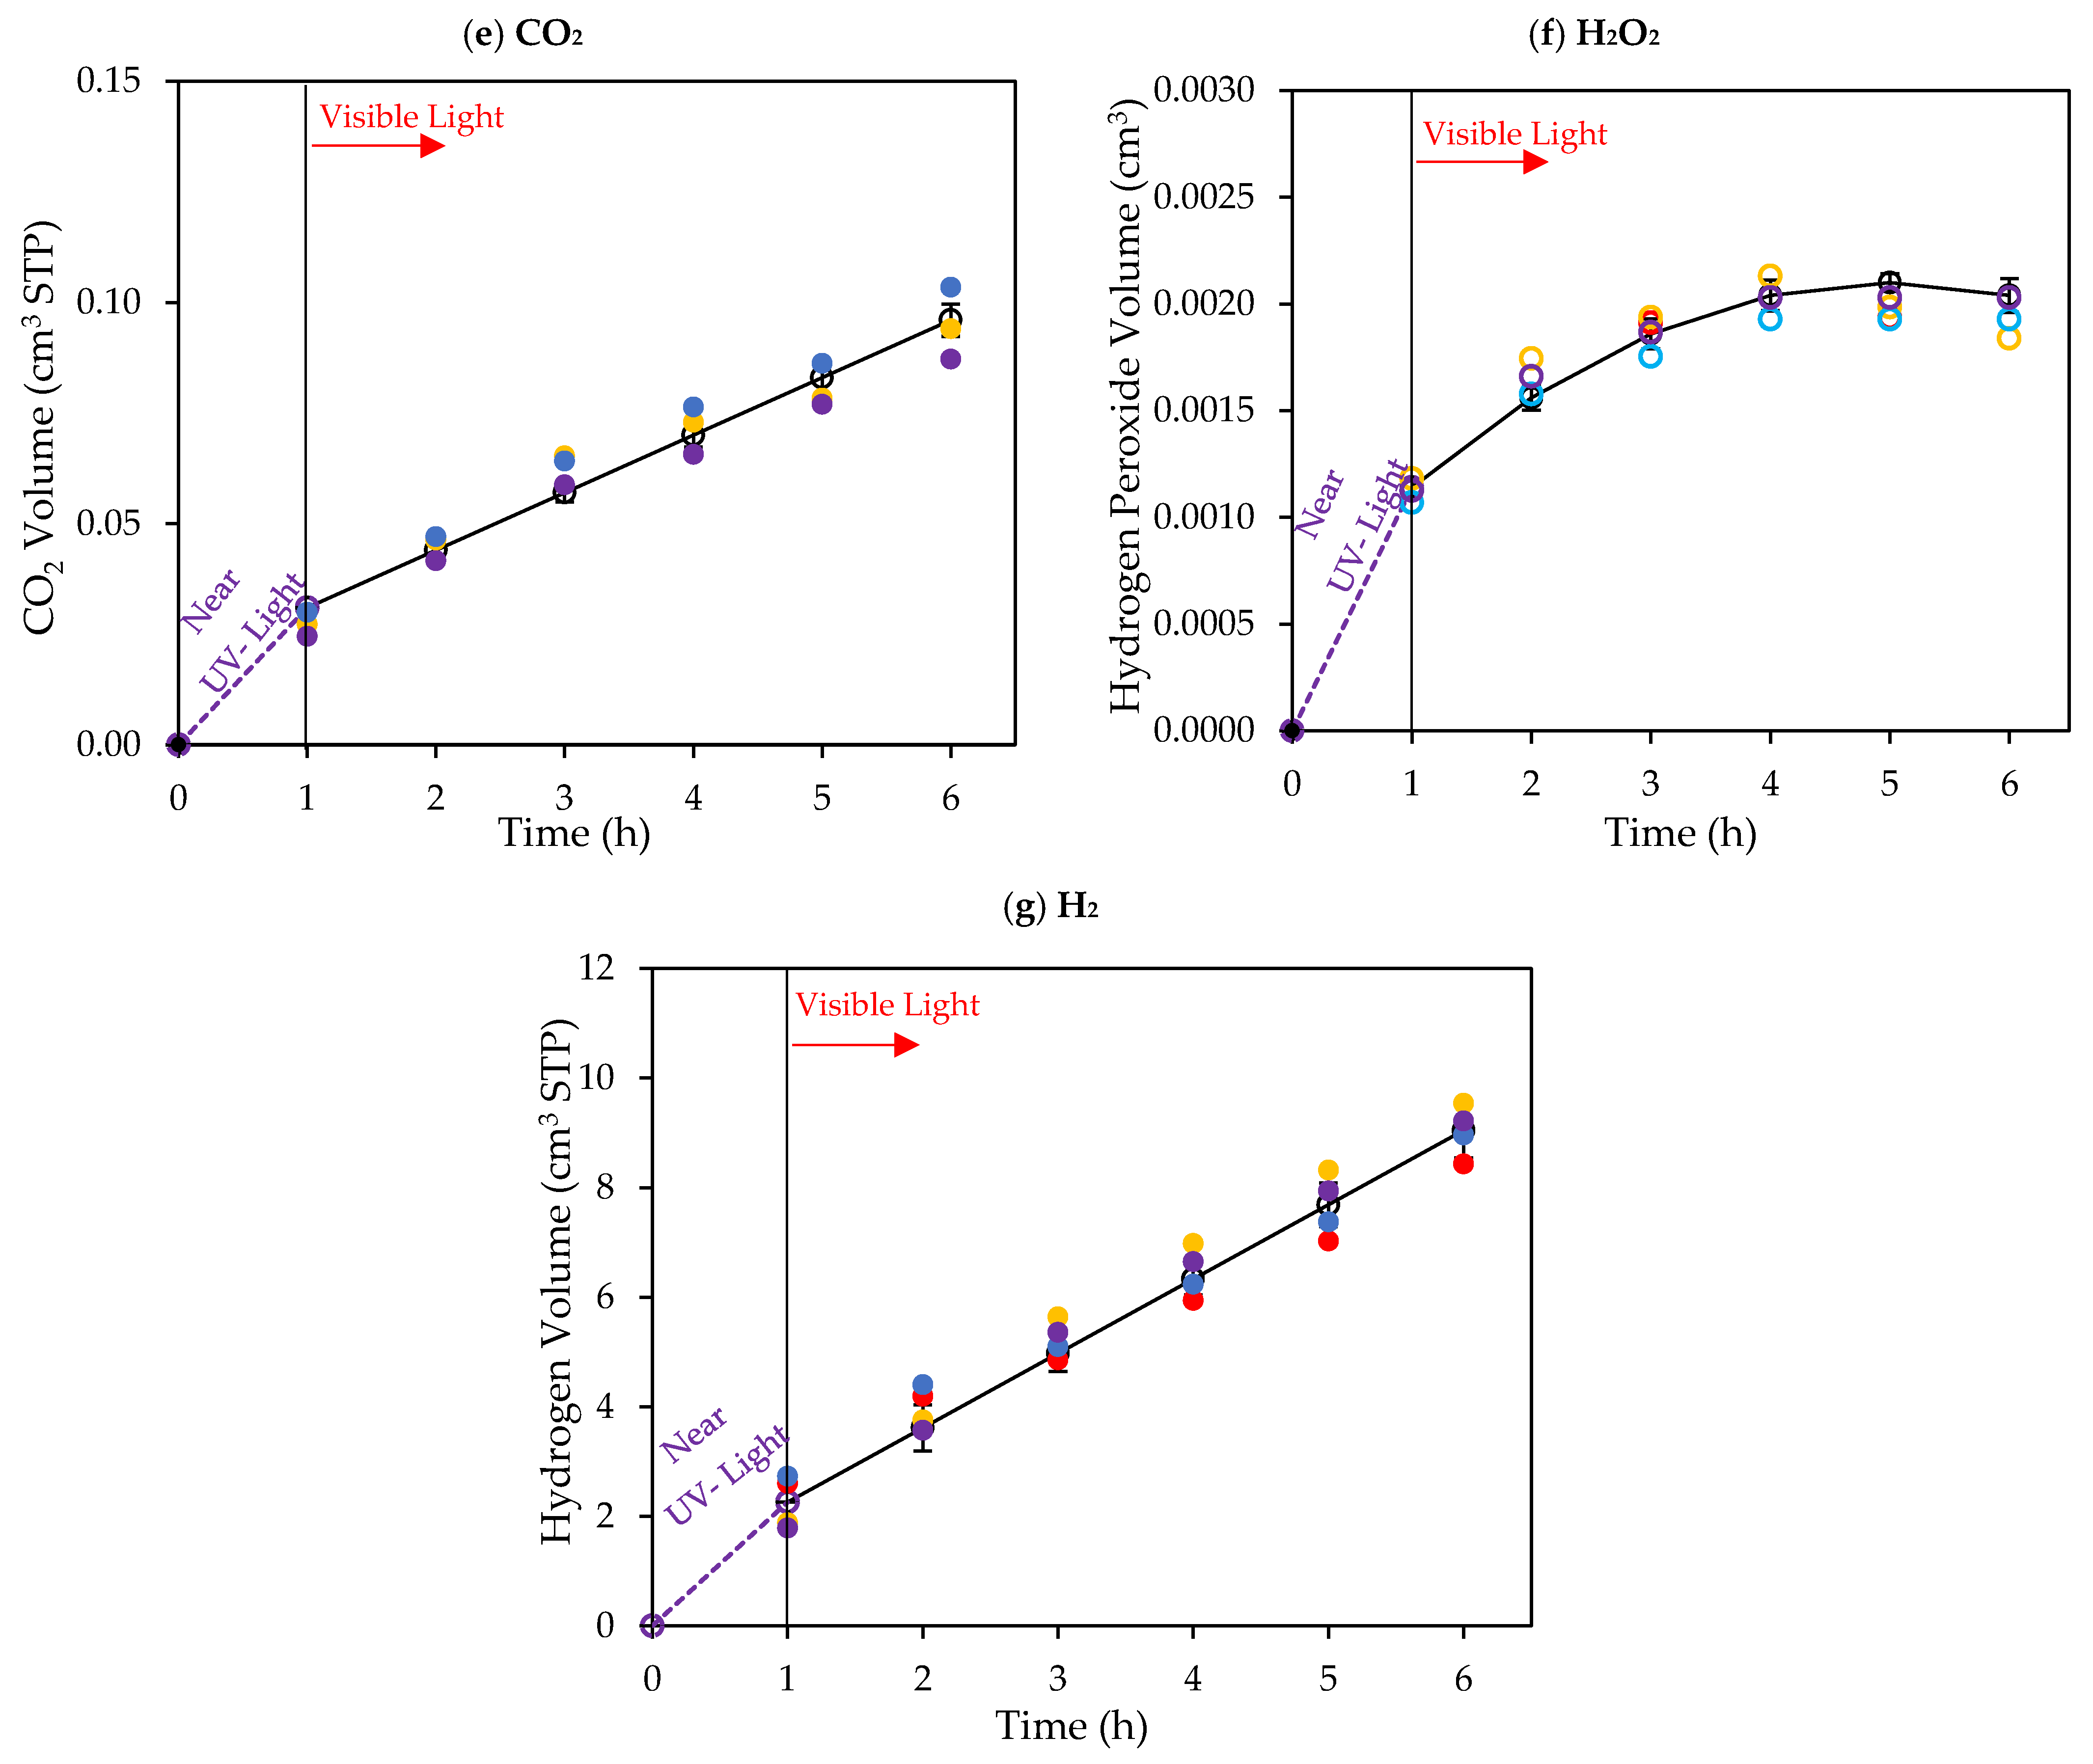
Figure 10.
Cumulative chemical species volumes obtained under 1 h of near-UV followed by 5 h of visible light near-UV: (a) methane; (b) ethane; (c) ethylene; (d) acetaldehyde; (e) CO2; (f) H2O2; and (g) H2. Experimental data are represented by (○) filled with different colors, each color represents each experimental run, and model predictions are represented with solid lines. Experimental conditions: 0.25 wt% Pd-TiO2; 0.15 g L−1 photocatalyst concentration; initial pH = 4.0 ± 0.05; and 2.0 v/v% ethanol.
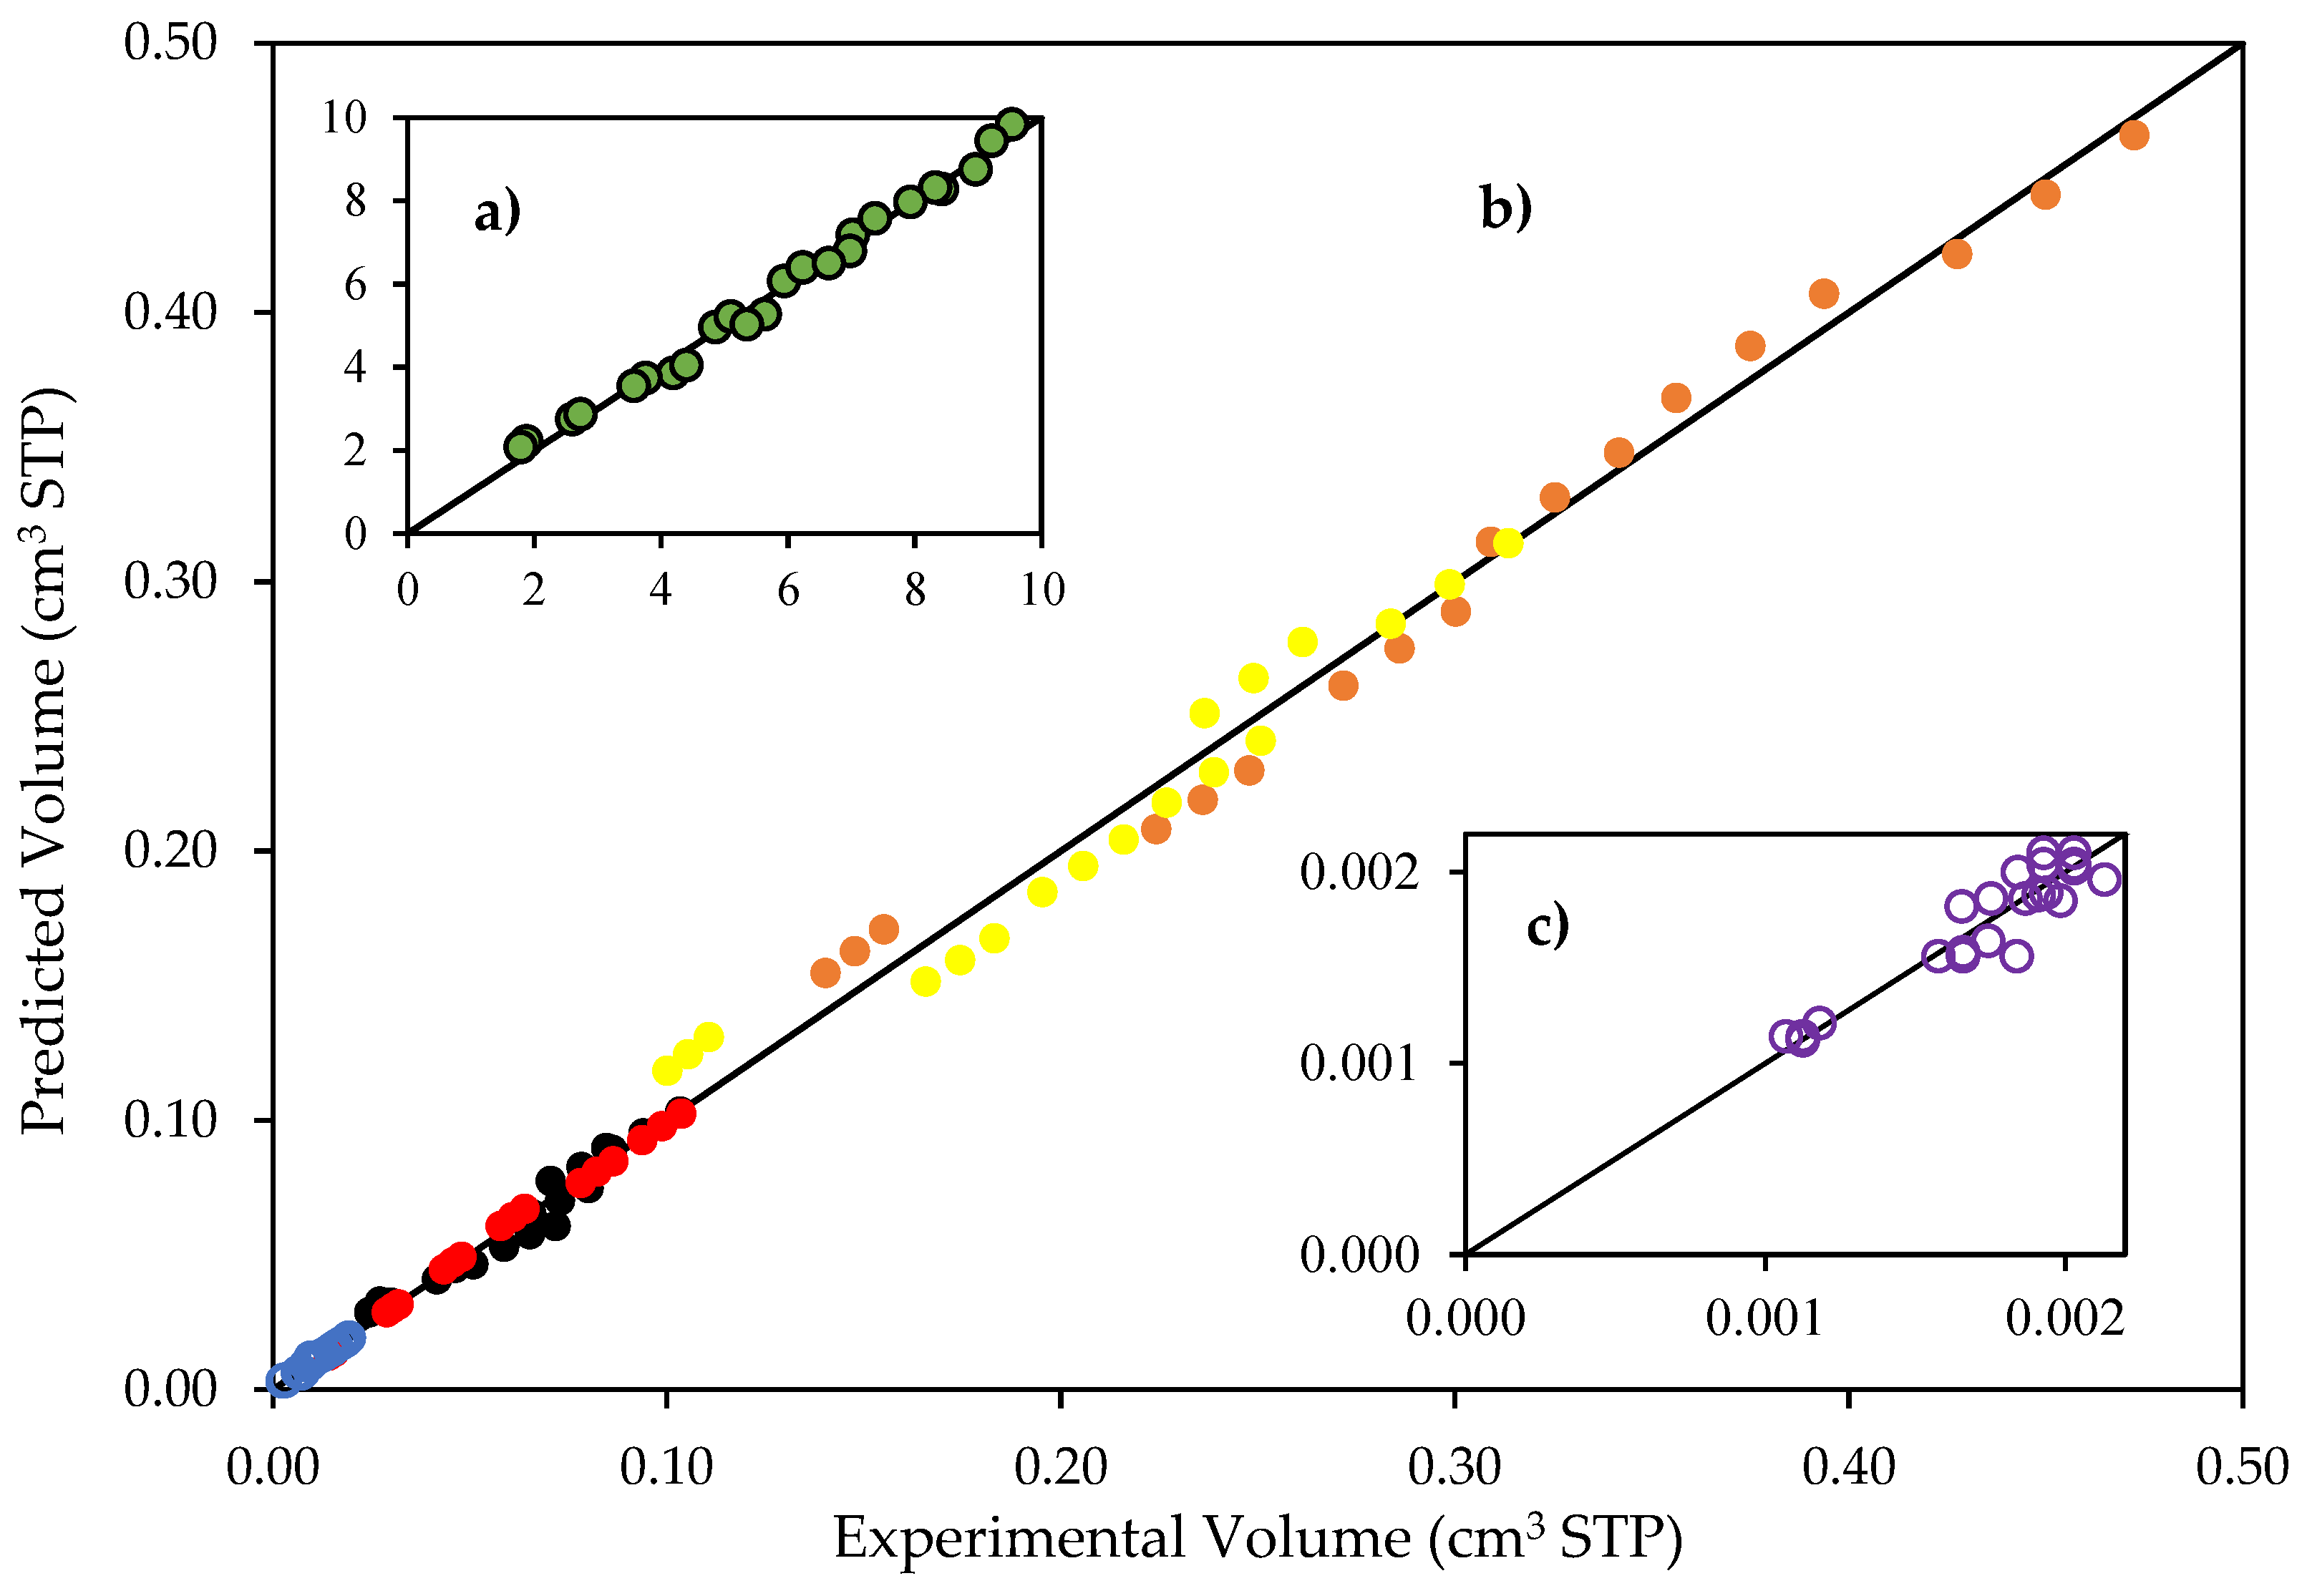
Figure 11.
Reconciliation plot for predicted and experimentally observed species volumes. Notes: (a) hydrogen volumes, 0 to 10 cm3 STP; (b) CO2, CH4, C2H4O, C2H6 and C2H4 volumes, 0 to 0.5 cm3; and (c) hydrogen peroxide volumes, 0 to 0.0022 cm3 STP. Conditions: 0.25 wt% Pd-TiO2 photocatalyst. Experimental error of 5.5%.
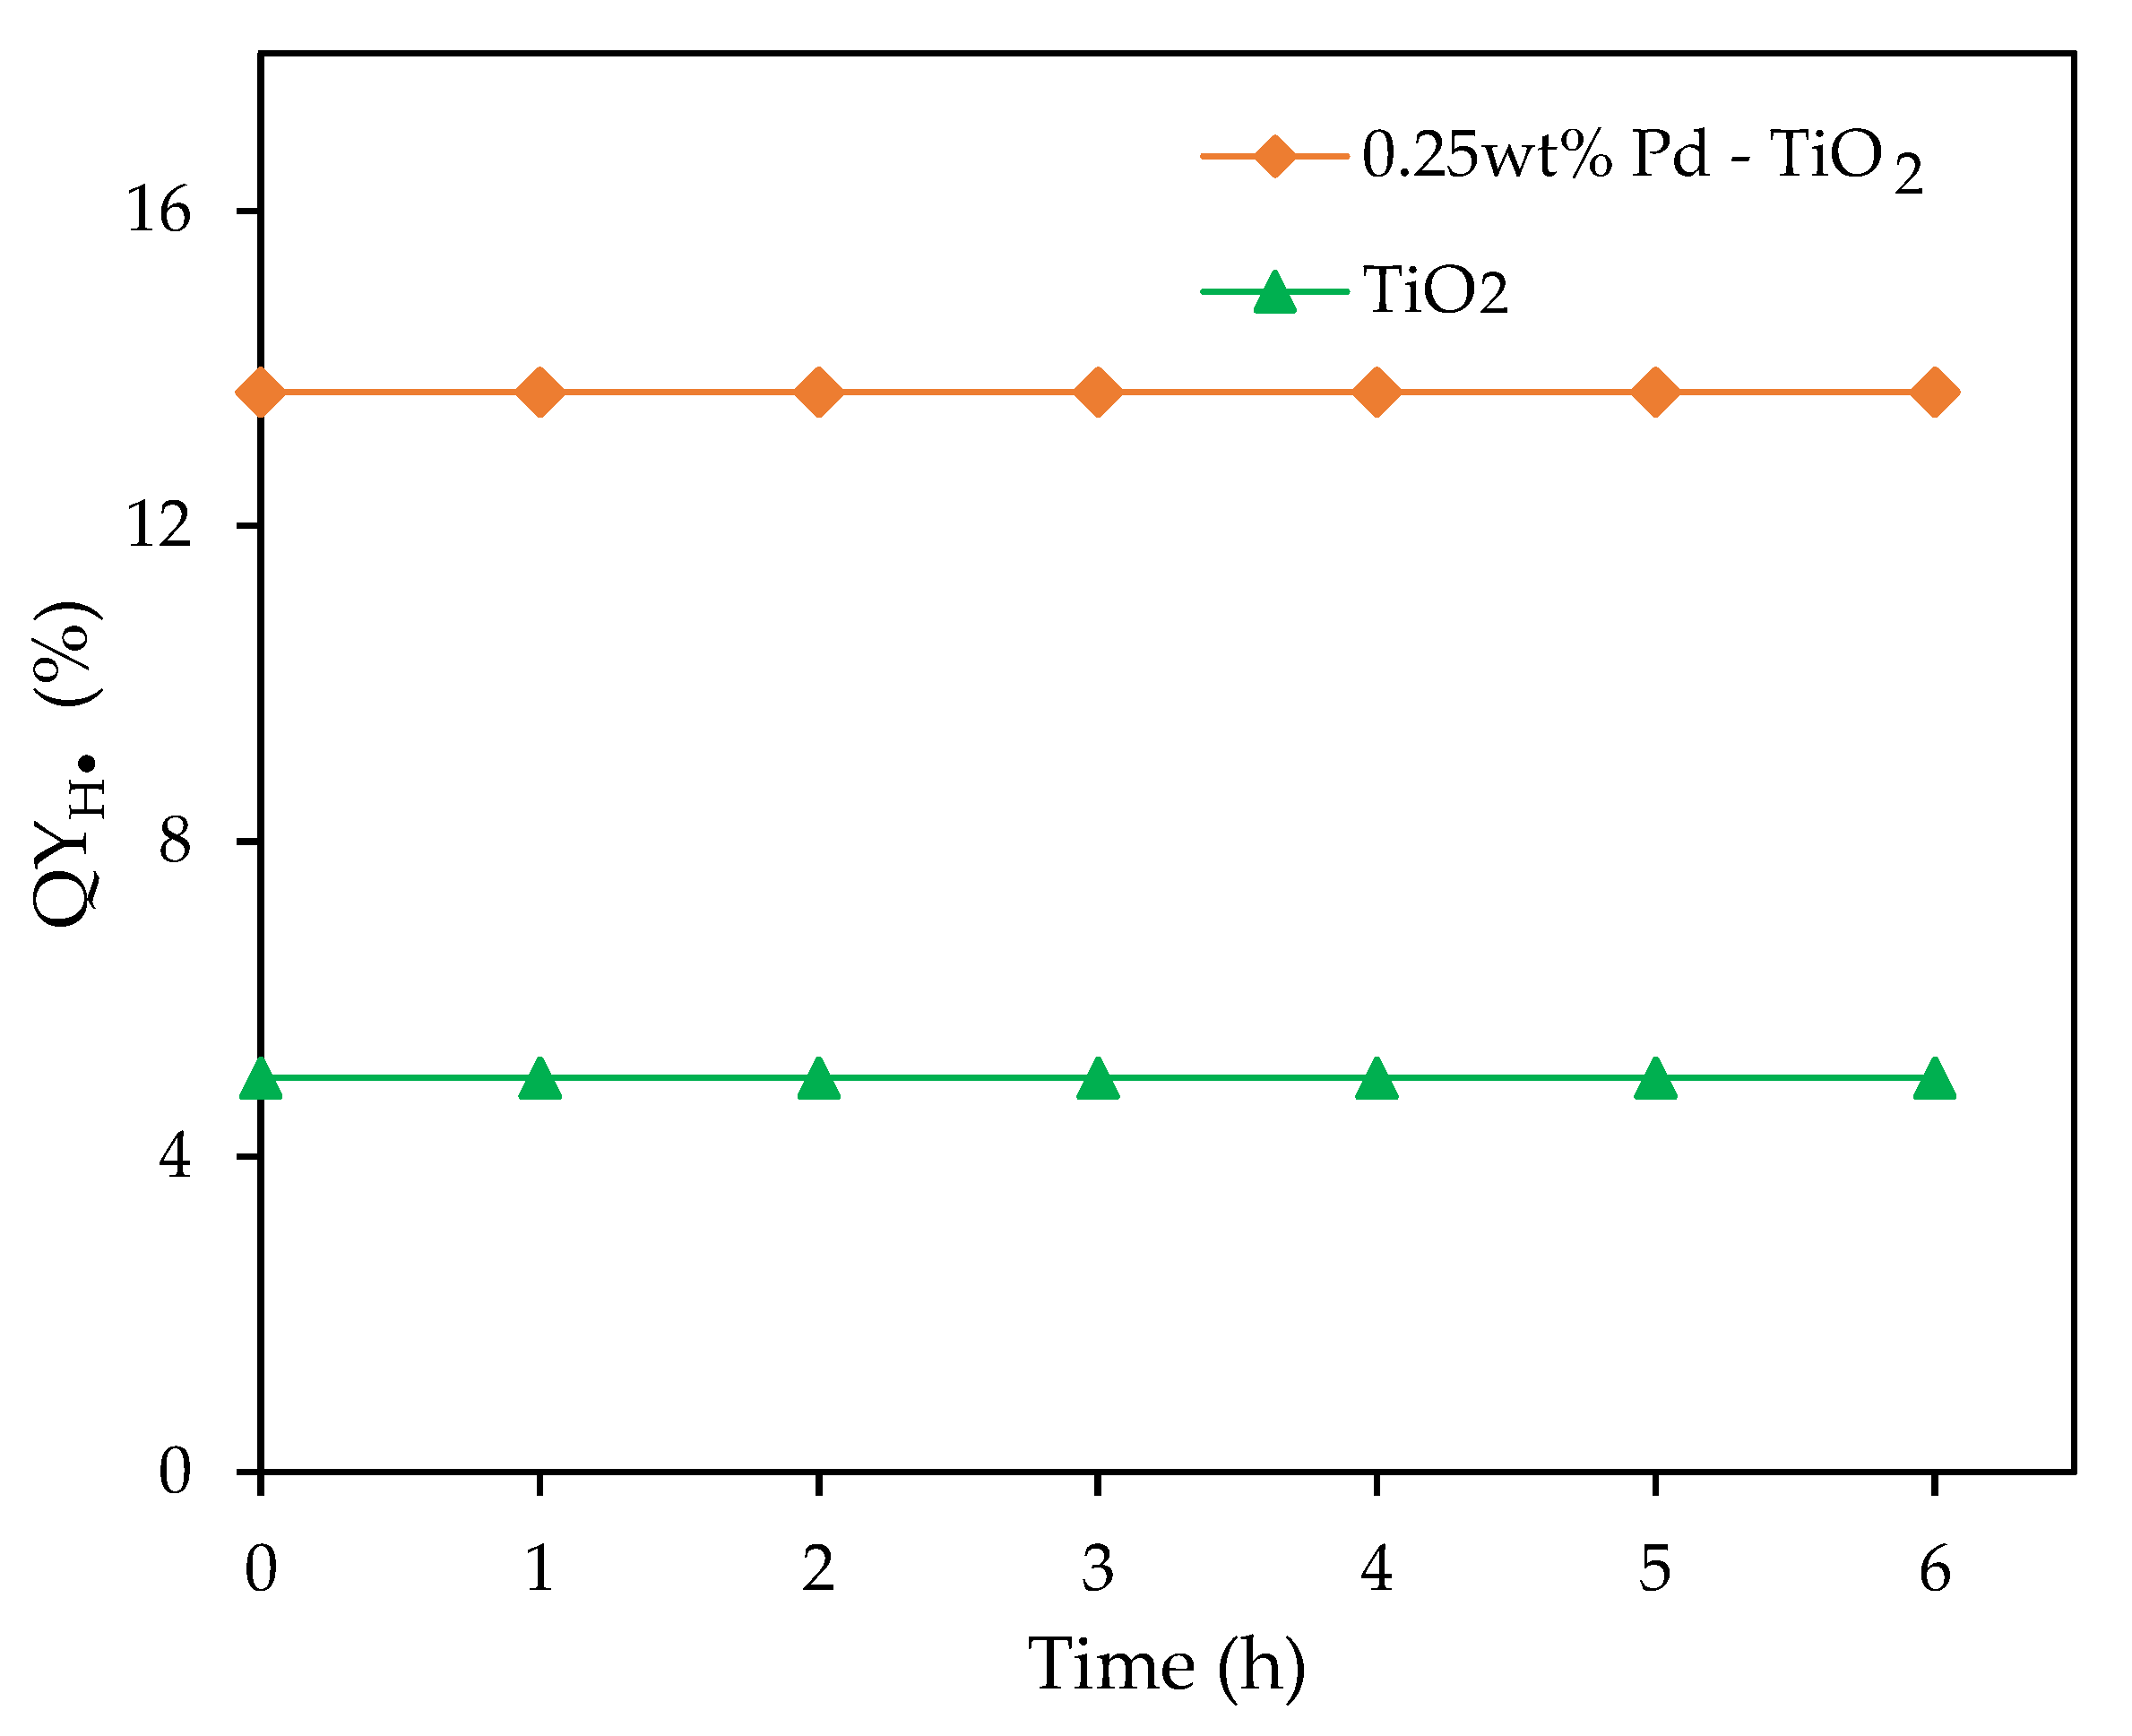
Figure 12.
for a 0.25 wt% Pd-TiO2 and for undoped TiO2 at various irradiation times, under near-UV Light. Conditions: 0.15 g L−1 of photocatalyst; initial pH = 4 ± 0.05; 2.0 v/v% ethanol.
Figure 12.
for a 0.25 wt% Pd-TiO2 and for undoped TiO2 at various irradiation times, under near-UV Light. Conditions: 0.15 g L−1 of photocatalyst; initial pH = 4 ± 0.05; 2.0 v/v% ethanol.
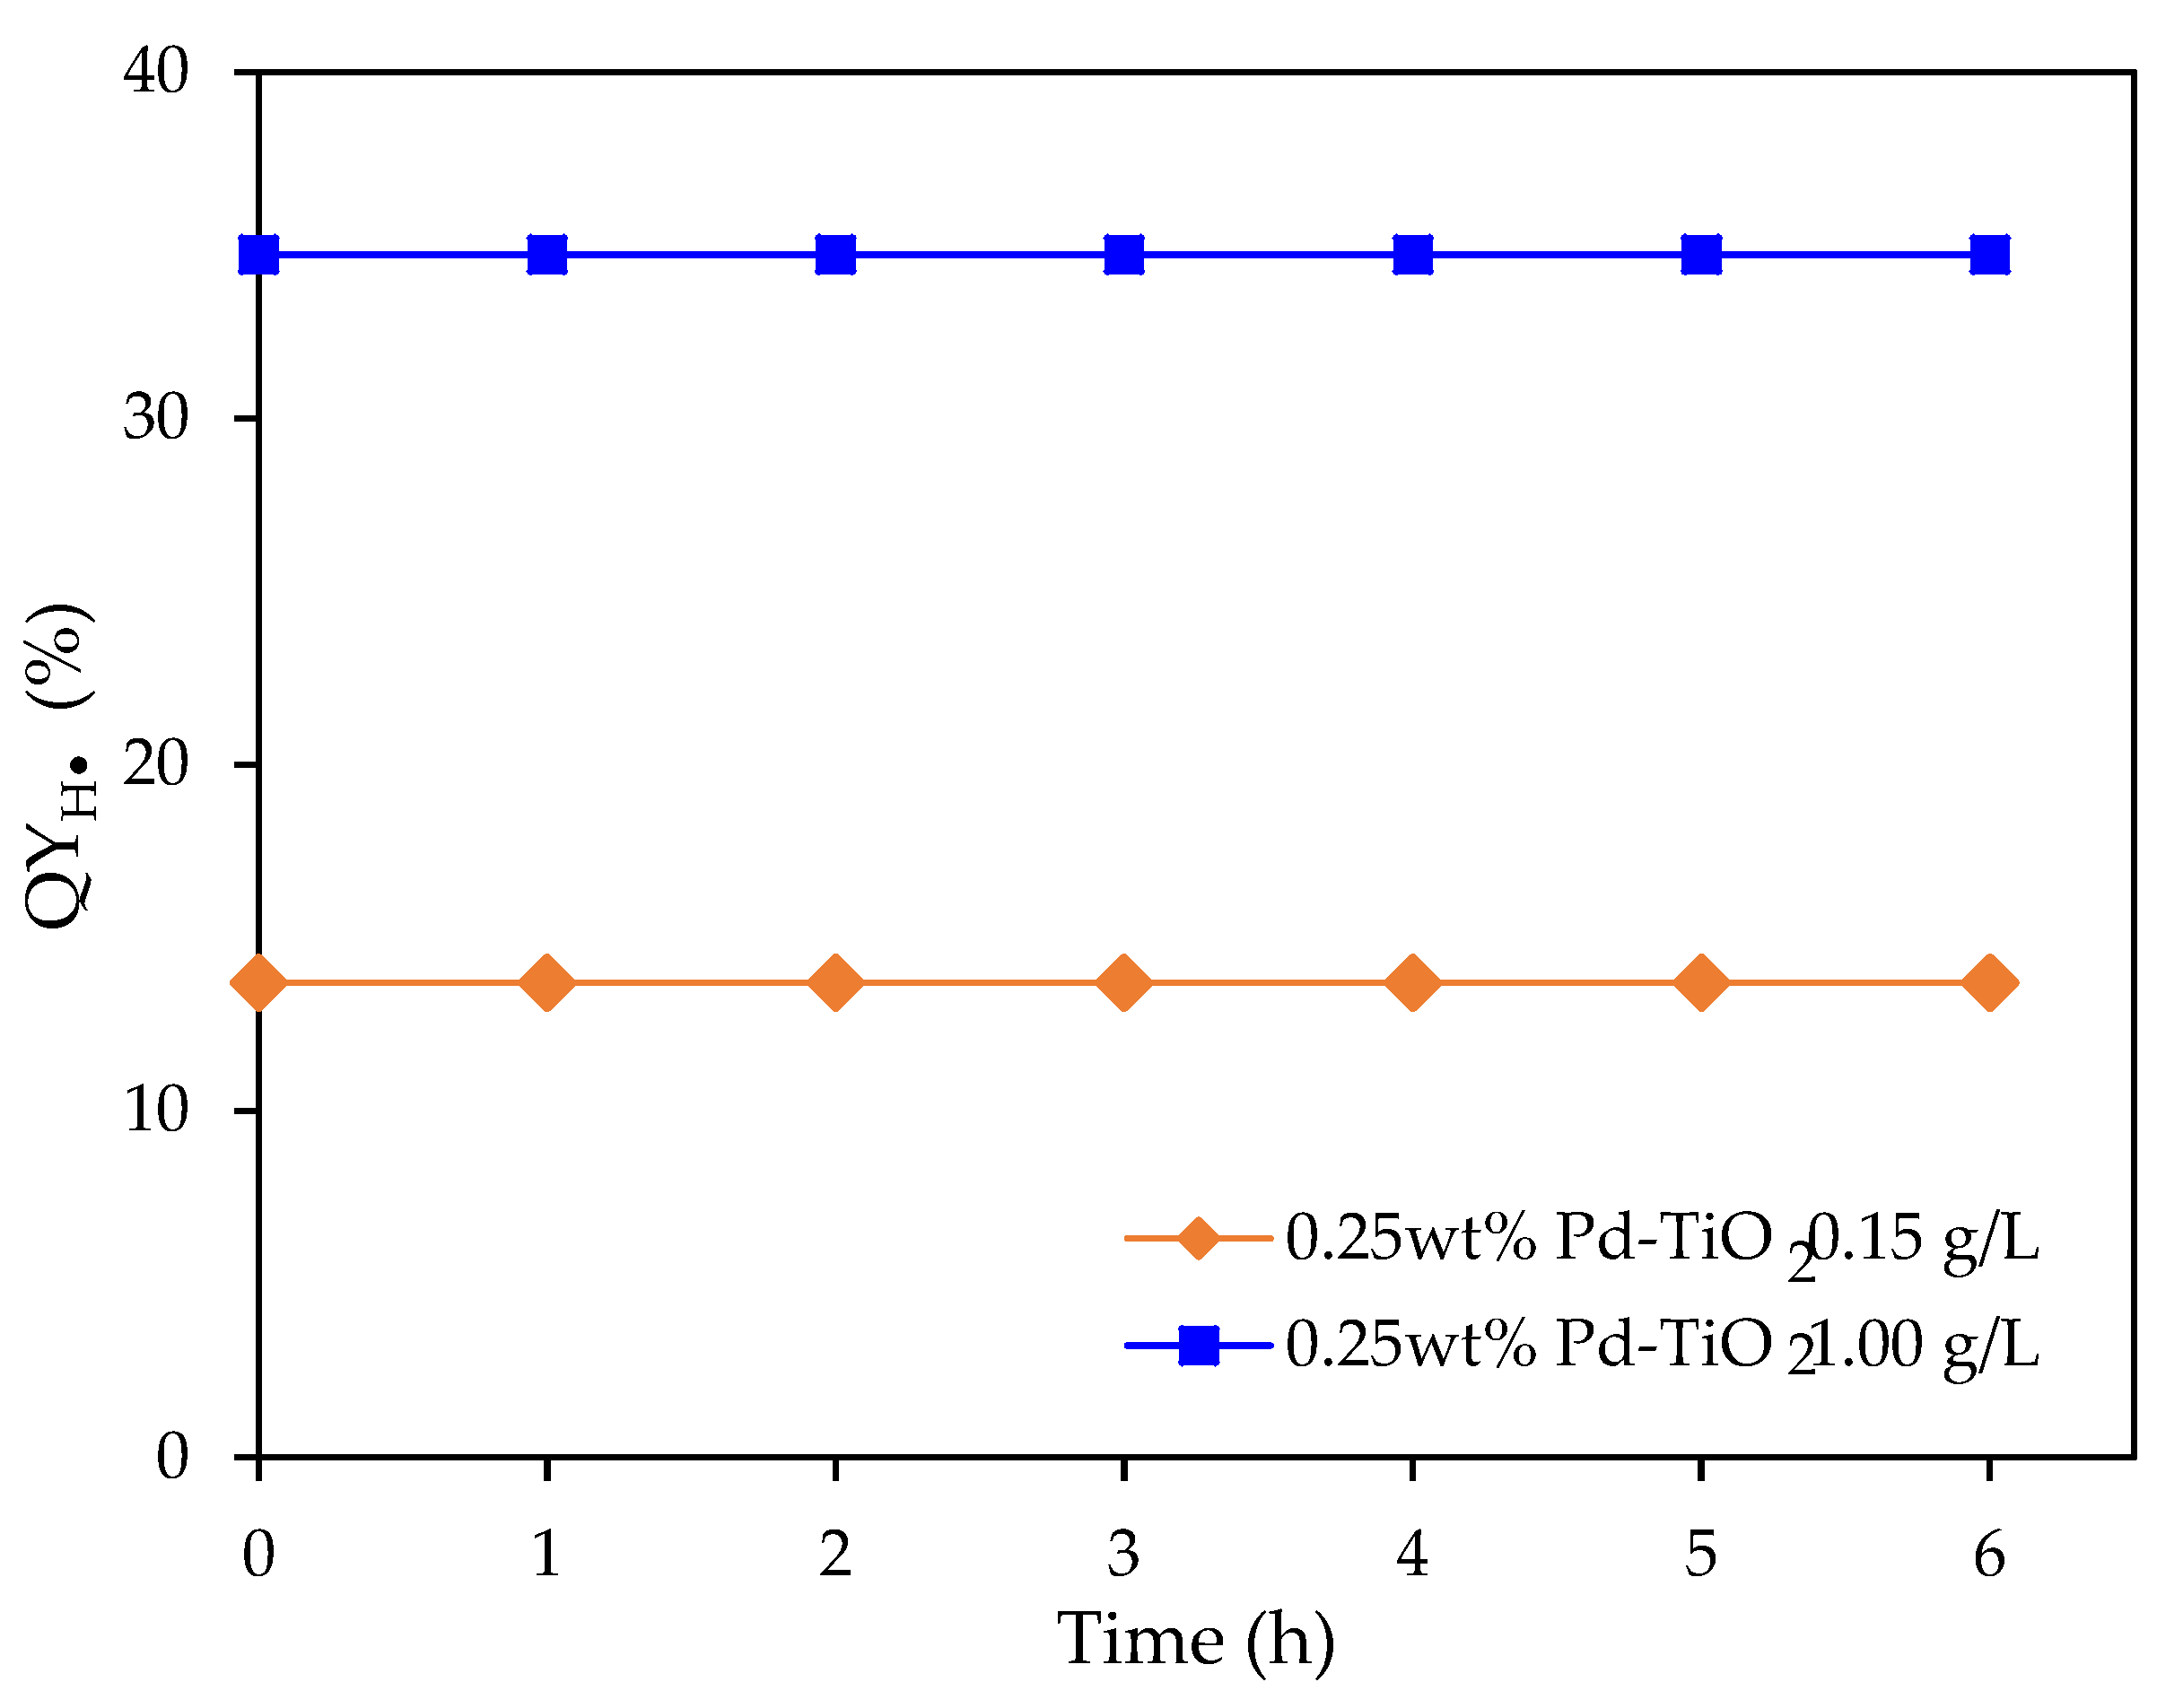
Figure 13.
at various irradiation times under near-UV irradiation using 0.15 and 1.00 g L−1 photocatalyst concentrations. Note: 0.25 wt% Pd on TiO2; 2.0 v/v% ethanol. Initial pH = 4 ± 0.05.
Figure 13.
at various irradiation times under near-UV irradiation using 0.15 and 1.00 g L−1 photocatalyst concentrations. Note: 0.25 wt% Pd on TiO2; 2.0 v/v% ethanol. Initial pH = 4 ± 0.05.
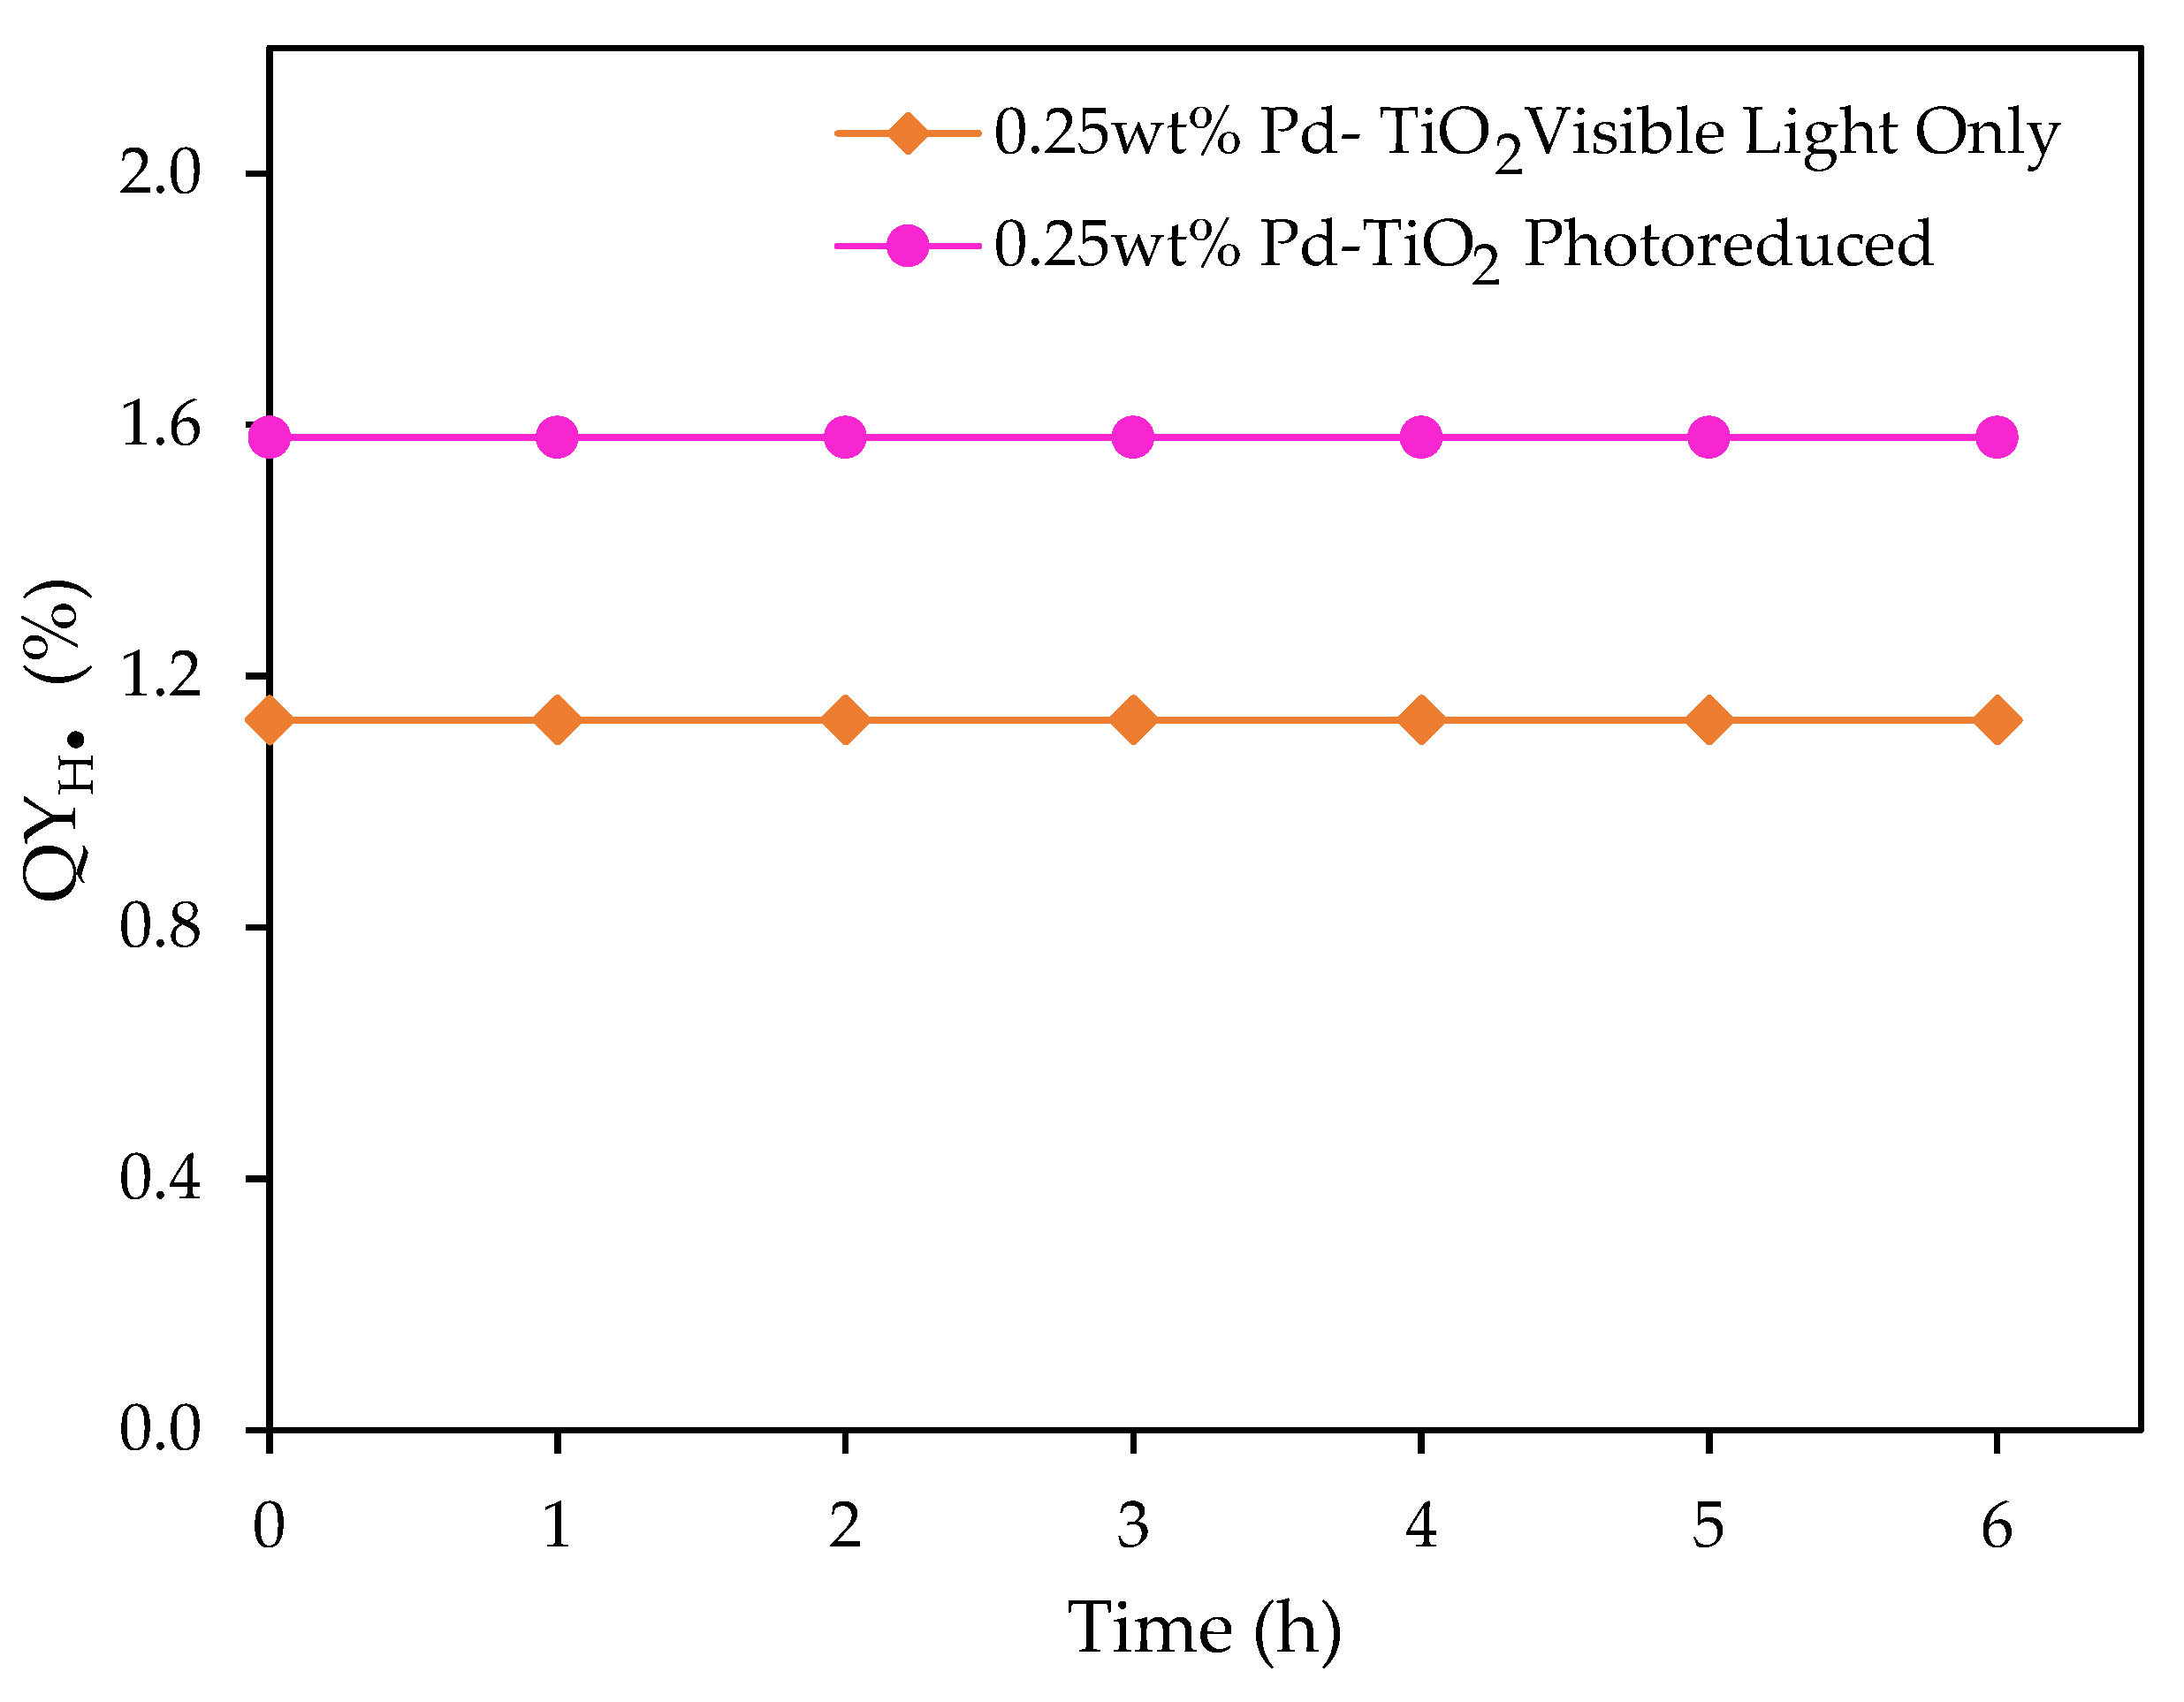
Figure 14.
for the 0.25 wt% Pd-TiO2 photocatalyst, at 0.15 g L−1 photocatalyst concentration, and various visible light irradiation times. Initial pH = 4 ± 0.05 and 2.0 v/v% ethanol. Note: the photocatalyst reported with the pink line was photoreduced for 1 h under near-UV light, followed by 5 h of visible light irradiation.
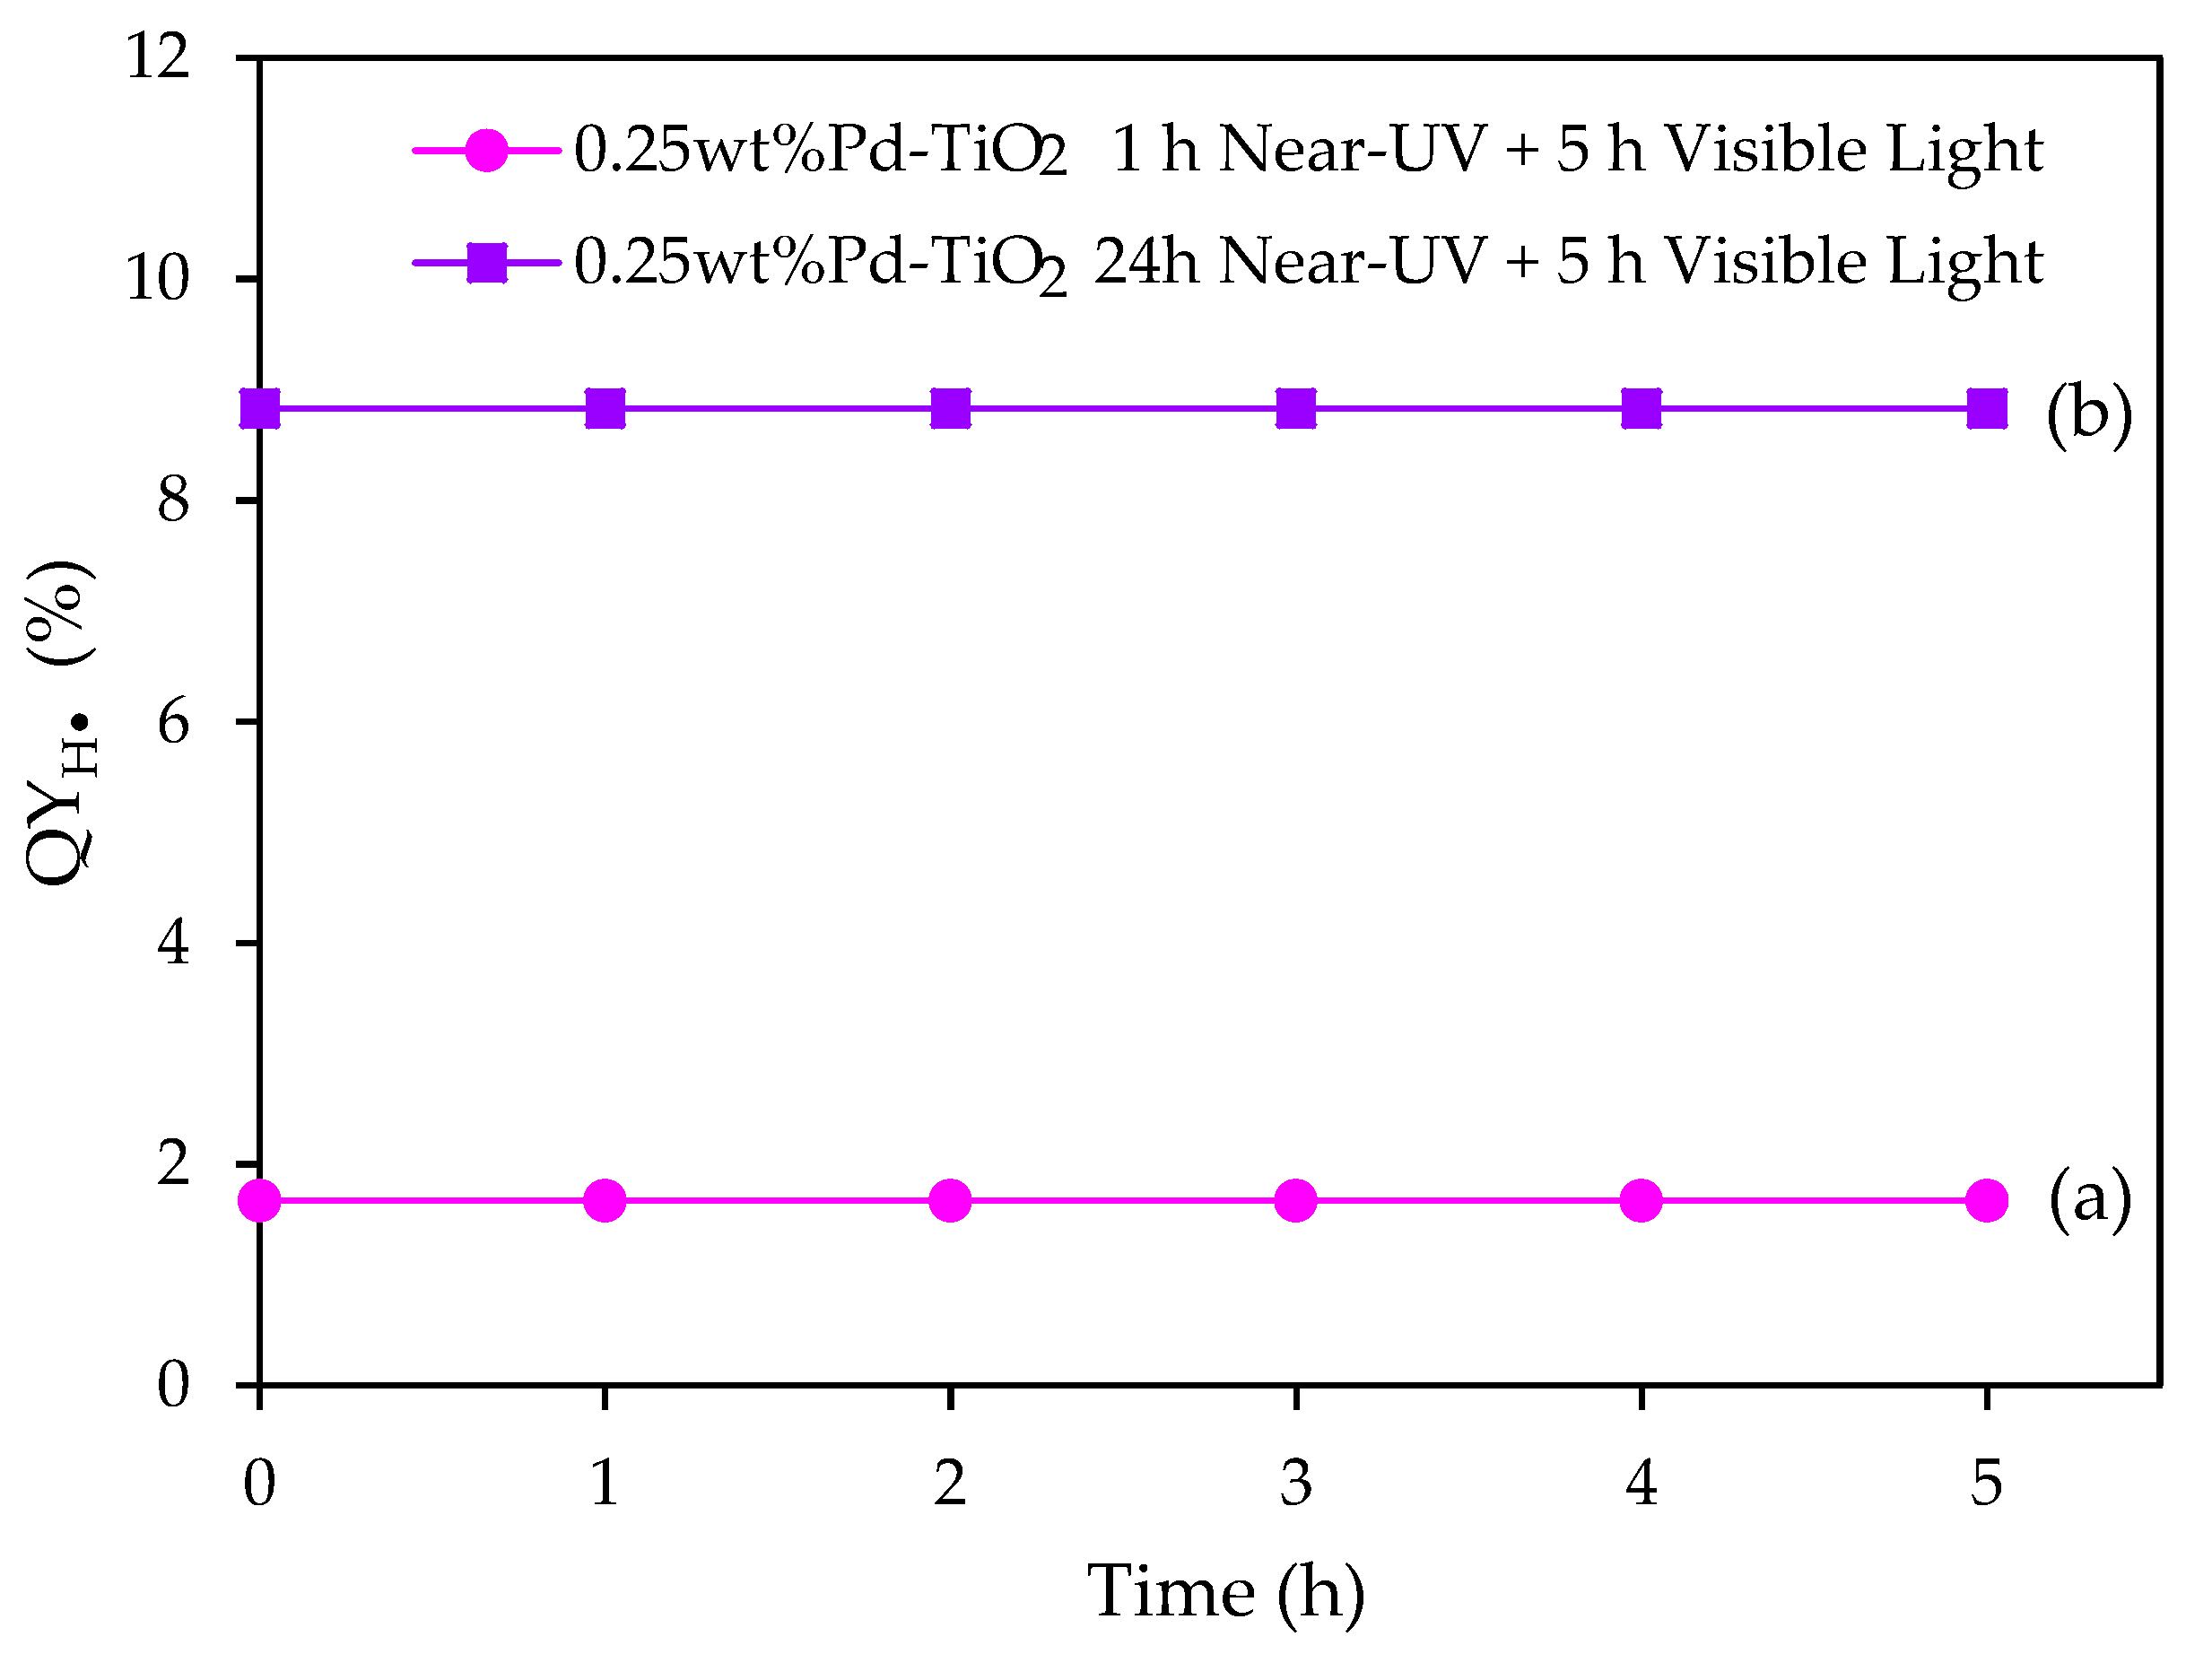
Figure 15.
at various visible light irradiation times: (a) 1 h of near-UV photoreduction, followed by 5 h of visible light irradiation; and (b) 24 h of near-UV photoreduction, followed by 5 h of visible light irradiation. Note: Conditions: 0.15 g L−1 concentration of 0.25 wt% Pd on TiO2; 2.0 v/v% ethanol; initial pH = 4 ± 0.05.
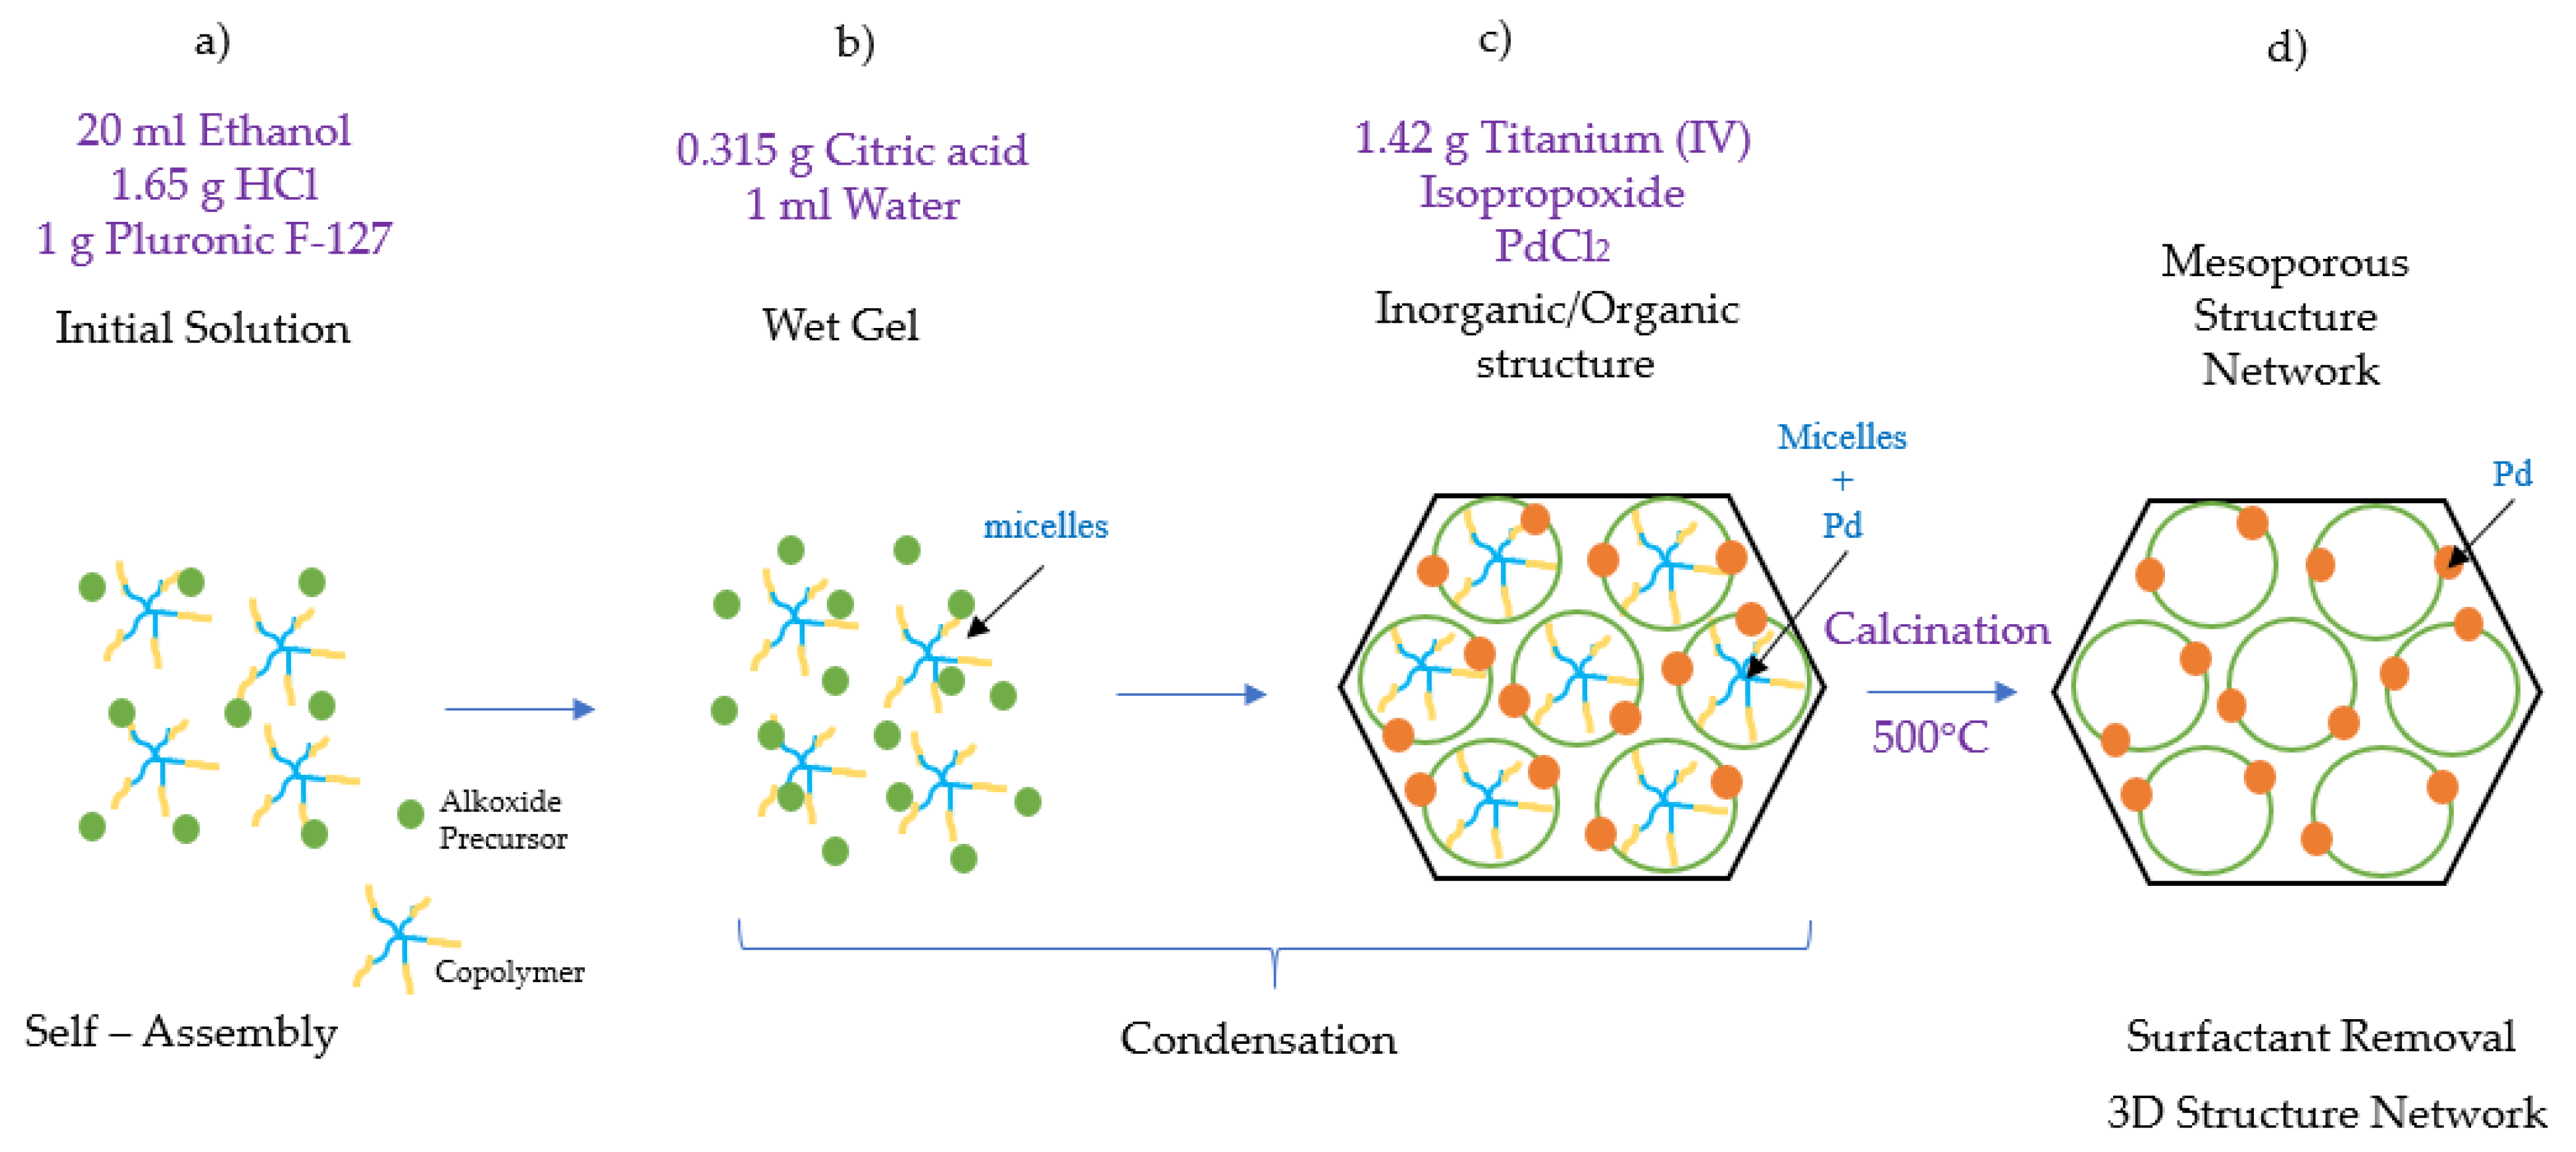
Figure 16.
Schematic description of the Pd-TiO
2 photocatalyst synthesis: (
a)
self-assembly step, ethanol acts as a hydrophilic compound attaching to the hydrophobic PPO core of the polymer F-127; (
b)
condensation step, micelles of the amphiphilic block copolymer are created, (
c) the PEO tails become attached to the metallic precursor TiO
2, forming a hybrid layer; and (
d) s
urfactant removal step, the resultant gel is calcined for 6 h at 500 °C, yielding a well-defined 3D crystalline mesoporous titanium photocatalyst [
31,
32,
33].
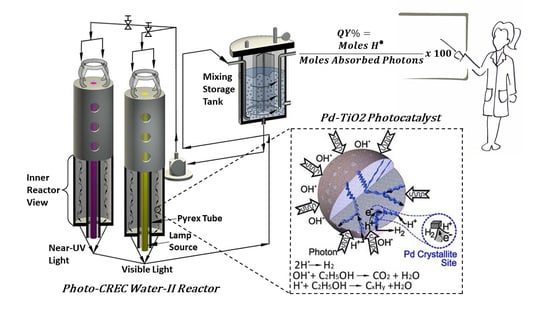
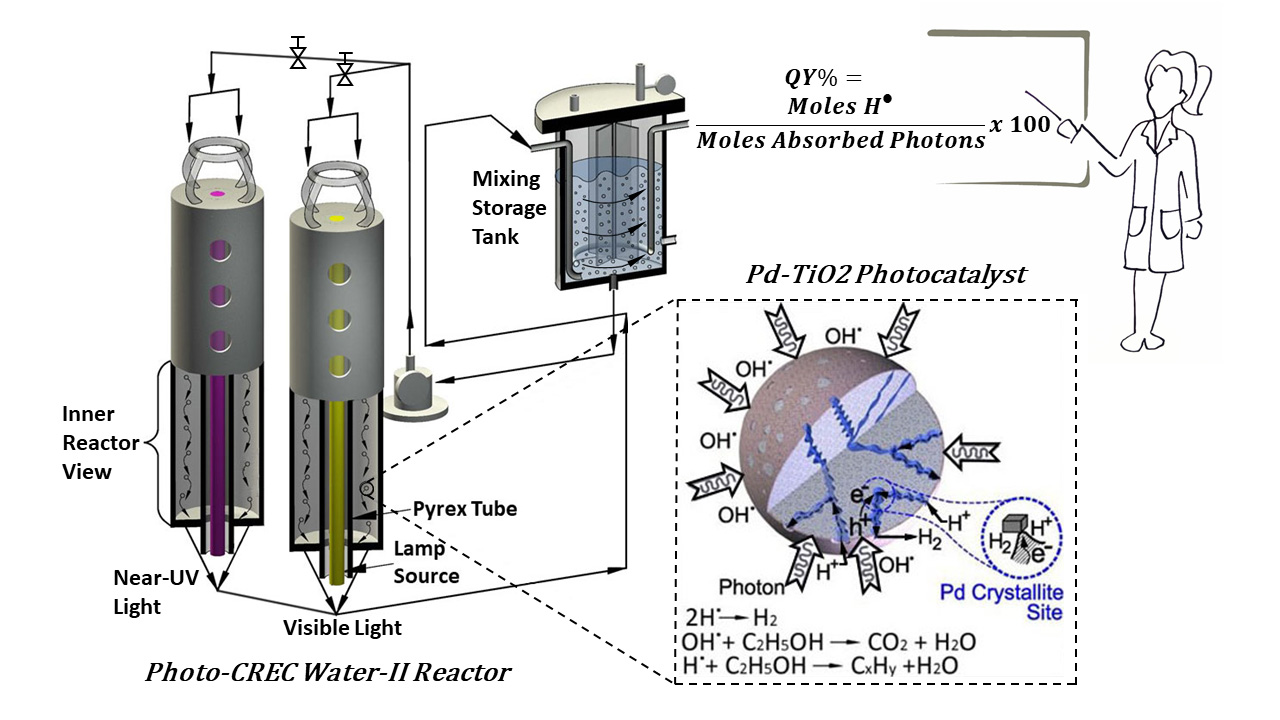
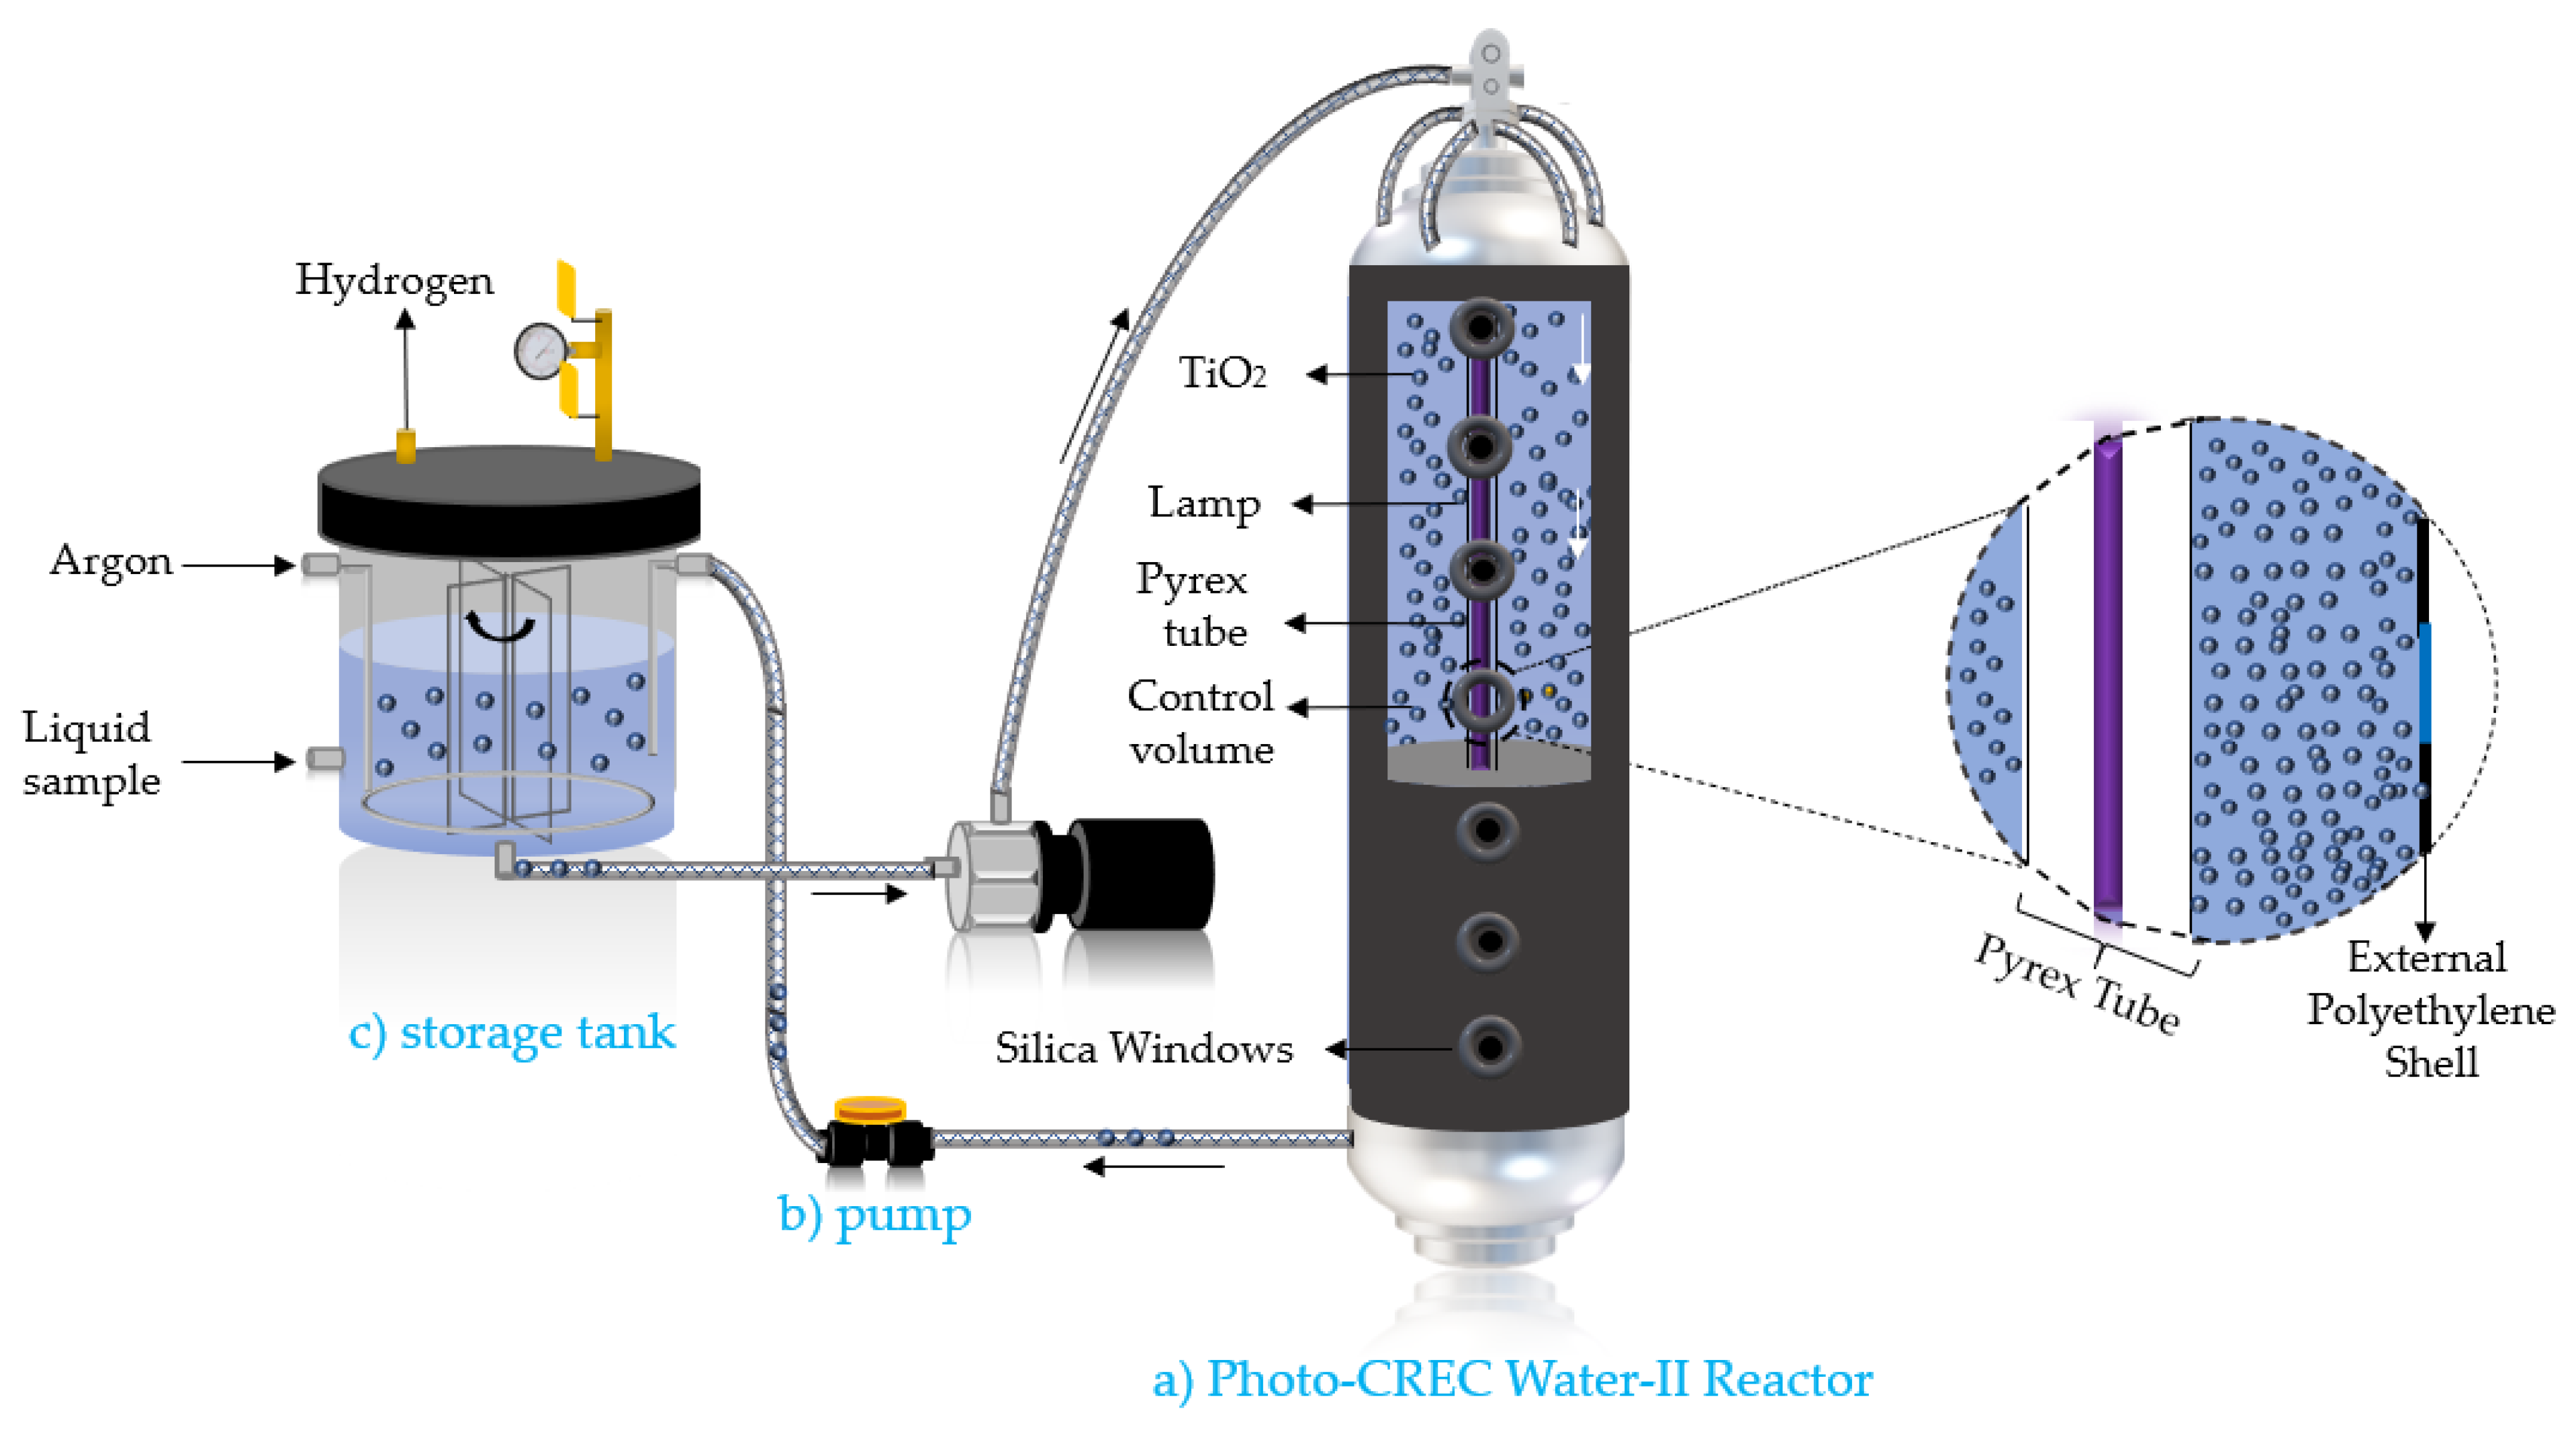
Figure 17.
Schematic representation of the Photo-CREC Water-II Reactor: (a) tubular Photo-CREC Water-II Reactor with downflow slurry circulation; (b) centrifugal pump; and (c) sealed hydrogen storage tank.
Figure 17.
Schematic representation of the Photo-CREC Water-II Reactor: (a) tubular Photo-CREC Water-II Reactor with downflow slurry circulation; (b) centrifugal pump; and (c) sealed hydrogen storage tank.
Table 1.
Adsorption Constants for Ethanol when Using the 0.25 wt% Pd-TiO2.
Table 1.
Adsorption Constants for Ethanol when Using the 0.25 wt% Pd-TiO2.
| QEtOH,max |
|---|
| 1.26 mol−1 L | 0.315 mol−1 gcat |
Table 2.
Proposed Reaction Rates for the Chemical Species Formed in the Photocatalytic Water Splitting Reaction using Ethanol as an Organic Scavenger.
Table 2.
Proposed Reaction Rates for the Chemical Species Formed in the Photocatalytic Water Splitting Reaction using Ethanol as an Organic Scavenger.
| Chemical Species | Reaction Rate |
|---|
| Acetaldehyde | |
| Carbon Dioxide | |
| Hydrogen Peroxide | |
| Methane | |
| Ethane | |
| Ethylene | |
| Hydrogen | |
Table 3.
Intrinsic Kinetic Rate Constants for Hydrogen and By-Products under Near-UV light with 2.0
v/
v% Ethanol. The
adsorption constant for ethanol was set to 0.3 mol g
cat−1, as shown in
Section 3.3.
Table 3.
Intrinsic Kinetic Rate Constants for Hydrogen and By-Products under Near-UV light with 2.0
v/
v% Ethanol. The
adsorption constant for ethanol was set to 0.3 mol g
cat−1, as shown in
Section 3.3.
| | Intrinsic Kinetic Rate Constant (mol gcat−1 h−1) | | Confidence Interval |
|---|
| k2″ | 9.09 × 10⁻⁶ | 3.93 × 10⁻⁷ | 8.72 × 10⁻⁷ |
| k3″ | 3.28 × 10⁻⁶ | 3.11 × 10⁻⁷ | 7.23 × 10⁻⁷ |
| k4′ | 1.67 × 10⁻⁵ | 6.89 × 10⁻⁷ | 1.48 × 10⁻⁶ |
| k6″ | 1.71 × 10⁻⁶ | 1.74 × 10⁻⁷ | 4.16 × 10⁻⁷ |
| k7″ | 7.75 × 10⁻⁶ | 6.79 × 10⁻⁷ | 1.52 × 10⁻⁶ |
| k8″ | 1.50 × 10⁻⁵ | 4.61 × 10⁻⁷ | 9.98 × 10⁻⁷ |
| k9′ | 9.10 × 10⁻⁴ | 2.92 × 10⁻⁵ | 4.85 × 10⁻⁵ |
Table 4.
Intrinsic Kinetic Rate Constants for Hydrogen Production and By-Product Formation under Visible Light, with 2.0
v/
v% Ethanol. Photocatalyst was photoreduced for 1 h under near-UV. The
adsorption constant was set to 0.315 mol g
cat−1, as shown in
Section 3.3.
Table 4.
Intrinsic Kinetic Rate Constants for Hydrogen Production and By-Product Formation under Visible Light, with 2.0
v/
v% Ethanol. Photocatalyst was photoreduced for 1 h under near-UV. The
adsorption constant was set to 0.315 mol g
cat−1, as shown in
Section 3.3.
| Intrinsic Kinetic Rate Constant (mol gcat−1 h−1) | | 95% Confidence Interval |
|---|
| k2″ | 1.15 × 10⁻⁹ | 7.03 × 10⁻¹¹ | 2.14 × 10⁻¹⁰ |
| k3″ | 4.98 × 10⁻⁹ | 3.07 × 10⁻¹⁰ | 8.98 × 10⁻¹⁰ |
| k4′ | 3.68 × 10⁻⁵ | 4.90 × 10⁻⁶ | 1.01 × 10⁻⁵ |
| k6″ | 1.15 × 10⁻⁹ | 7.03 × 10⁻¹¹ | 2.14 × 10⁻¹⁰ |
| k7″ | 6.53 × 10⁻⁹ | 2.31 × 10⁻¹⁰ | 6.70 × 10⁻¹⁰ |
| k8″ | 2.18 × 10⁻⁸ | 7.70 × 10⁻¹⁰ | 2.15 × 10⁻⁹ |
| k9′ | 5.11 × 10⁻⁷ | 7.01 × 10⁻⁸ | 1.76 × 10⁻⁷ |
Table 5.
Quantum Yields Using a 0.25%wt Pd-TiO2 Photocatalyst Based on moles of H2 and at different conditions.
Table 5.
Quantum Yields Using a 0.25%wt Pd-TiO2 Photocatalyst Based on moles of H2 and at different conditions.
| Conditions | (%) = | |
| 17.4 | 34.8 |
| 6.9 | 13.7 |
5 h of visible light, after 24 h under near-UV irradiation. Photocatalyst concentration: 0.15 g L−1 Ethanol concentration: 2.0 v/v% Initial pH: 4 ± 0.05
| 4.4 | 8.8 |


