Abstract
The aim of this work is to evaluate the performance of the stirring 3D Fe/Al2O3 monolithic reactor in batch operation applied to the liquid-phase hydroxylation of phenol by hydrogen peroxide (H2O2). An experimental and numerical investigation was carried out at the following operating conditions: CPHENOL,0 = 0.33 M, CH2O2,0 = 0.33 M, T = 75–95 °C, P = 1 atm, ω = 200–500 rpm and WCAT ~ 1.1 g. The kinetic model described the consumption of the H2O2 by a zero-order power-law equation, while the phenol hydroxylation and catechol and hydroquinone production by Eley–Rideal model; the rate determining step was the reaction between the adsorbed H2O2, phenol in solution with two active sites involved. The 3D CFD model, coupling the conservation of mass, momentum and species together with the reaction kinetic equations, was experimentally validated. It demonstrated a laminar flow characterized by the presence of an annular zone located inside and surrounding the monoliths (u = 40–80 mm s−1) and a central vortex with very low velocities (u = 3.5–8 mm s−1). The simulation study showed the increasing phenol selectivity to dihydroxybenzenes by the reaction temperature, while the initial H2O2 concentration mainly affects the phenol conversion.
1. Introduction
Rotating reactors aim to increase the mixing efficiency and, in this way, enable the reduction of the reactor volumes, estimated by a factor of 10–100 [1], which is of interest for the intensification of the chemical processes [2]. Monolithic stirrer reactors (MSR) are classical intensified reactors developed by the group of prof. Moulijn at Delft Technical University in 1998 [3]. In these reactors, catalysts with monolithic block structures are mounted on the stirrer shaft replacing the typical impeller blades. The concept was demonstrated by an aqueous phase reaction, the decomposition of hydrogen peroxide (H2O2) over manganese oxide catalyst [3] and has since then been extended to multiphase processes (gas-liquid phase reactions) such as the selective hydrogenation of alkyne [3,4,5] and more viscous systems such as the hydrogenation of edible oil over palladium catalysts [6] and the enzyme-catalyzed reactions in organic media [7]. These studies demonstrate the potential of the catalytic stirrer reactors over the conventional slurry reactors not only due to the obvious operational advantages such as no need of catalyst recovery, prevent attrition of the catalyst, lower pressure drops and intrinsically safer operations, but also because MSR improves the conversions and selectivity as a result of the faster gas-liquid mass transfer rates induced by the stirring [5,8] and the larger geometrical surface areas available for the catalysis. Moreover, the gas-liquid mass transfer rates can be modulated according to the disposition of the monoliths in the shaft and the length of the monoliths [5,9]. More recently, MSRs have been demonstrated to be a suitable alternative for the intensification of selective oxidation of hydrocarbons, i.e., dihydroxybenzene production over Fe/SiC by phenol hydroxylation with H2O2 [10] and lactobionic acid production over gold catalyst by lactose oxidation by O2 [11], and for liquid-liquid catalytic reactions such as the alcoholysis of urea to propylene carbonate over different mixed-metal oxides [12].
Despite the demonstrated versatility of the MSRs (applied to the manufacture of fine and renewable chemicals and biotechnology processes at lab scale), their outstanding performance in mass transfer limited reactions and straightforward scaling up, MSRs have not been developed in pilot scale or industrial chemical processes so far. The studies that tackle the economic evaluation of monolith catalytic stirrer technology agree about the reduction of the operational costs in the MSR comparing to the conventional slurry reactors as a consequence of the absence of the filtration step, and also the high catalyst cost heft [6,13]. However, according to the rigorous economic assessment of Boldrini et al. [13] applied to the production of hydrogenated vegetable oils in MSR using Pd/Al2O3 coated monoliths, the economical profit depends on the required catalyst load and catalyst useful life. This is in consonant to the remarks made by Moulijn et al. regarding the practical application of the MSR at the time [14]. They pointed out that the principal bottleneck is the synthesis of the catalyst. Research efforts should be focused on the development of the preparation methods to introduce various coating layers and deposition of the active catalytic species in the appropriate amount, and homogeneously distributed, on the monolithic blocks. Apparently, this aspect has represented an economic risk for the industries, and it has prevented the implementation of the MSR in large scales so far.
The additive manufacturing (AM), or three-dimensional (3D) printing technology, has been parallel developed to the MSR [15] in different sectors including aerospace, aeronautics and defense, medicine and healthcare, construction and chemical industry [15,16]. Currently, AM is shown as an efficient and sustainable tool for manufacturing novel catalysts and reactors [17,18,19,20,21,22]. In particular, the fabrication of 3D monolithic catalysts by using inks with catalytic materials, which implies that the catalytic active phase is included in the ink formulation, is a reality, and it has been demonstrated in liquid [23,24,25] and particularly in gas phase reactions [26,27,28]. Therefore, the use of 3D monolithic catalysts can incentivize the implementation of MSR technology by easily overcoming the mentioned economical limitation found when tailored-coated monoliths were the only option.
In this line, this paper aims to provide insight into the implementation of MSR by the integration of the 3D printed technology for the monolithic catalyst manufacturing and computational fluid dynamic (CFD) simulation for a better understanding of the flow and species mass transport in the stirrer reactor. To achieve this goal, the hydroxylation of phenol by H2O2 in aqueous phase over iron 3D catalysts has been studied as a sustainable industrial process [29]. This is a liquid-solid limited mass transfer reaction with respect to H2O2, as has been demonstrated in our previous work disposing the 3D Fe/Al2O3 monoliths, manufactured by the Robocasting technique, in a fixed-bed configuration [30].
Herein, the kinetic model to produce dihydroxybenzenes (DHBZ) over 3D Fe/Al2O3 monolithic catalysts has been obtained and the reaction mechanism proposed. The reaction kinetic equations for H2O2 consumption, phenol hydroxylation and catechol (CTL) and hydroquinone (HQ) production have been coupled with the hydrodynamic in the 3D CFD model to study the catalytic performance. The flow through and around the monoliths has been characterized and the bulk mixing behavior in the reactor vessel analyzed. The experimental temporal concentration profiles of the involved species are predictable, and this has allowed the simulation of the MSR performance in a wide range of operating conditions to optimize the DHBZ selectivity.
As far as we know, this is the first study regarding the numerical simulation of rotating reactors to capture the catalytic performance inside. The very few existing studies into stirred catalytic reactors deal with stationary rotating basket reactors in which the flow rate of the fluid through the catalyst particles is induced by a magnetic stirrer [31,32,33,34].
2. Results and Discussion
2.1. Catalytic Performance
The results obtained in the hydroxylation of phenol at different temperatures are shown in Figure 1. The experiments were carried out at the following operating conditions: initial phenol concentration (CPHENOL,0) = 0.33 M, initial phenol:H2O2 molar ratio (CPHENOL,0:CH2O2,0) = 1:1 mol, temperature (T) = 75–95 °C, atmospheric pressure, stirring speed (ω) = 250 rpm and mass of catalyst (WCAT) ~ 1.1 g. The ω = 250 rpm was selected for a better performance (see Figure S1 of the Supporting Material to gain insight into the influence of the ω on the MSR performance). As can be seen in Figure 1a, the initial concentration values of H2O2 are ~0.2 M, instead of 0.33 M, this is because the H2O2 was adsorbed on the 3D Fe/Al2O3 surface prior to the beginning of the phenol hydroxylation reaction. The data collected in Figure 1 and used for the further kinetic study were obtained once the chemical reaction started. Moreover, H2O2 concentration decreases linearly with the reaction time, and this decrease is faster when reaction temperature increases. Thereby, complete H2O2 consumption is obtained at 390, 285 and 105 min at 75, 85 and 95 °C, respectively. Phenol is also positively affected by the temperature and, clearly, the hydroxylation of phenol occurs slower than the H2O2 decomposition (Figure 1b). For instance, at complete H2O2 consumption achieved at the above-mentioned reaction times, the phenol conversion (XPHENOL) obtained is between 30 and 40% (from 31% at 75 °C to 38% at 95 °C). As a consequence, the XPHENOL/XH2O2 ratio is low, around 1:2 at the beginning of the reaction and can reach 1:3 from XH2O2 = 80%, particularly, at 75 °C (see Figure S2 of the Supporting Material). This means that for a better use of the oxidant, it should be preferable to operate from 85 °C.
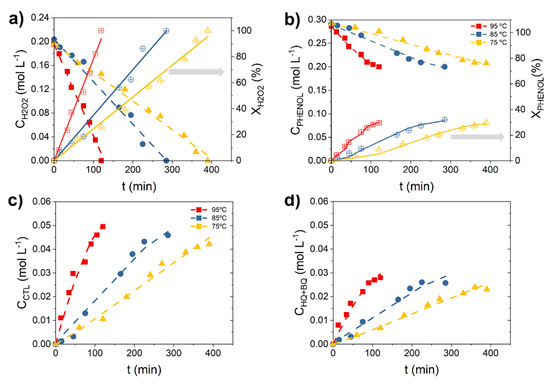
Figure 1.
Experimental (symbols) and predicted (curves) temporal concentration profiles of (a) H2O2, (b) phenol, (c) CTL and (d) HQ at different temperatures. Operating conditions: CPHENOL,0 = CH2O2,0 = 0.33 M, WCAT = 1.1 gCAT and T = 75–95 °C.
On the other hand, the DHBZ concentrations, such as the CTL and HQ concentration, gradually increase with the course of the reaction (Figure 1c,d). Along with them, resorcinol (RSL) and p-benzoquinone (BQ) are detected in very low concentrations (one order of magnitude lower, see Figure S3 of the Supporting Material). BQ is in redox equilibrium with the HQ [29], therefore both have been lumped as HQ for the further discussion and without introducing a significant error due to the far lower production of BQ comparing to HQ. As can be seen in Figure 1c,d, CTL is the majority product and the CTL:HQ molar ratio is around 1.6. Consequently, the phenol selectivity to CTL (SCTL) is always higher than the phenol selectivity to HQ (SHQ). Figure 2 shows the evolution of the selectivity and yield with the phenol conversion. As can be observed, the selectivity to CTL and HQ increases very fast at the beginning of the reaction, up to reach a XPHENOL 5%, and then remains almost constant. This asymptotic value varies from 45 to 52% for SCTL (Figure 2a) and from 27% to 32% for SHQ (Figure 2b), depending on the reaction temperature. A positive influence of the temperature is observed on the phenol selectivity to DHBZ (SDHBZ), achieving a value of 73, 78 and 84% for 75, 85 and 95 °C, respectively. As a consequence, the yield to DHBZ (YDHBZ) is eventually affected by the temperature: 20% (75 °C), 23% (85 °C) and 25% (95 °C).
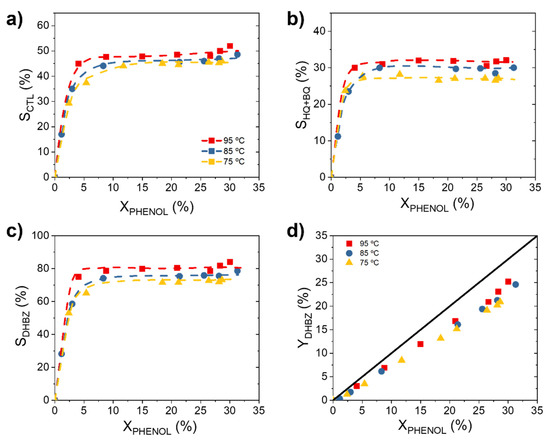
Figure 2.
Evolution of phenol selectivity to (a) CTL, (b) HQ and (c) DHBZ, and (d) evolution of phenol yield to DHBZ at different temperatures. Operating conditions: CPHENOL,0 = CH2O2,0 = 0.33 M, WCAT = 1.1 gCAT and T = 75–95 °C.
These results point out that the overoxidation of the aromatic species to tar is less favorable at 95 °C (see the temporal tar profiles in Figure S4 of the Supporting Material). Similar finding with respect to the increasing selectivity and yield with the temperature was observed when the hydroxylation of phenol was performance in a monolithic fixed bed reactor (MFBR) in our previous work of Salazar et al. [30]. However, in this latter case, SDHBZ = 100% and YDHBZ = 32% were reported at 85 °C while these values diminish to SDHBZ = 75% and YDHBZ = 22% in the MSR. This means that the phenol condensation and overoxidation of DHBZ, both reactions accounted as tar products [29], are more favorable in the MSR than MFBR. According to these results, to operate under the H2O2 mass transfer control, as occurred in the MFBR, is beneficial to improve the SDHBZ in the catalytic hydroxylation of phenol. Likely, a slower H2O2 decomposition rate allows a better use of the HO· radical species involved in the oxidation of phenol and avoid their availability for the further DHBZ oxidation. In addition, the low liquid volume in the reactor, as in MFBR, is beneficial to suppress the phenol condensation and overoxidation [29]. In contrast, the 3D Fe/Al2O3 catalyst stability is higher under the MSR operation. Fe concentrations lower than 1 mg L−1 were obtained in the effluents after total H2O2 decomposition (0.8, 0.9 and 1 mg L−1 at 75, 85 and 95 °C, respectively), while the Fe leaching causes a significant deactivation of the Fe/Al2O3 catalyst in the MFBR [30].
2.2. Kinetic Modeling
The H2O2 disappearance, phenol hydroxylation and DHBZ production rates were obtained considering the experimental concentration vs. time data, shown in Figure 3 at 75, 85 and 95 °C. Attending to the temporal H2O2 concentration profiles (Figure 1a), the decomposition of H2O2 occurs through a zero-order kinetic. This means that only a small fraction of H2O2 is in contact to the catalyst active sites and reacts. This fraction is continually replenished from the bulk liquid in the tank. On the contrary, a completely different kinetic rate expressions are expected for phenol and DHBZ (Figure 1b–d). Potential equations, Langmuir–Hinshelwood–Hougen–Watson (LHHW) and Eley–Rideal (ER) kinetics were considered, and eventually, the following kinetic model was the best-fit equations found:
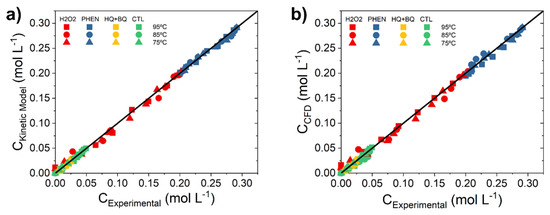
Figure 3.
Parity plot of experimental and calculated concentrations by (a) kinetic equations and (b) the CFD simulation at different operating conditions.
According to this, phenol hydroxylation and CTL and HQ production occur according to an ER kinetic model with a second order in the denominator. This means that the phenol hydroxylation requires two active sites, the first for hydrogen peroxide adsorption and likely, the second for phenol interaction.
The obtained kinetic parameters at each reaction temperature are summarized in Table 1. The kinetic rate constants for H2O2 (kH2O2, in molj gCAT−1 min−1) increase with the temperature and follows the Arrhenius equation (see Figure S5 of the Supporting Material). The activation energy for the H2O2 decomposition is 57.6 kJ mol−1. However, the kinetic rate constant for phenol (kPHENOL, in L2 mol−1 min−1 gCAT−1) decreases with the temperature which suggests that each rate constant does not correspond to one elementary reaction, but they are apparent rate constants that involve a lumping of elementary reactions, as it will be further demonstrated during the elucidation of the reaction mechanisms. The kinetic rate constant for CTL and HQ (kCTL and kHQ+BQ in L2 mol−1 min−1 gCAT−1) remains almost invariable with the temperature (Table 1). These values were fairly coincident to those calculated as and . Therefore, the kCTL/kHQ+BQ value is also around 1.7. Finally, the kinetic parameter (K) that includes the H2O2 adsorption constant was maintained with the same value as that estimated for phenol.

Table 1.
Apparent kinetic parameter values for phenol hydroxylation by H2O2 over 3D 1 wt.%. 3D Fe/Al2O3 monoliths.
2.3. Reaction Mechanism
Attending to the rate equations constituting the kinetic model (Equations (1)–(4)), it is proposed that the phenol hydroxylation by H2O2 over 3D 1 wt.% Fe/Al2O3 monoliths takes place as follows: first, H2O2 is adsorbed on the Fe active sites, Equation (5). Then, the adsorbed molecule of H2O2 needs a neighboring free catalytic site that interacts with phenol. The H2O2 decomposes on the Fe active site into a hydroxyl radical (HO·) and a hydroxyl group (HO−), both remain adsorbed on the catalyst. The HO·species immediately reacts with the phenol molecule that is interacting in a proximal catalytic site, giving rise to the dihydroxybenzene that is released into the water, while leaving a proton on the surface. Each ionic species, OH− and H+, remains separately adsorbed in each active sites, Equation (6). The catalytic sites are regenerated by the desorption of these species, Equations (7) and (8). This mechanism can be expressed according to the next steps:
The following reaction rates can describe each individual step:
Cs, CS-H2O2, CS-HO− and CS-H+, represent the number of sites that are vacant, or occupied by H2O2, HO− and H+ species, respectively. It is considered that the reaction takes place on identical active sites at the surface, active Fe centers [30]. The conservation of the number of active sites leads to the following site balance expression: L = CS + CS-H2O2 + CS-HO− + CS-H+ where L is the total concentration of active sites.
Only by assuming as the rate determining step the surface reaction, Equation (6), is possible to obtain the ER kinetic model for phenol hydroxylation:
The concentration of and is obtained applying the hypothesis of the steady-state for the adsorption equilibrium and with the total mass balance of the active sites:
From Equation (14), the concentration of adsorbed H2O2 species is:
and from Equations (14)–(17), the concentration of the free active sites is:
substituting both Equations (18) and (19) in Equation (13), considering that the concentration of active sites, , is constant, and assuming that, the and are also constant in the reaction media, since water is used as unique solvent, the predicted phenol hydroxylation reaction rate results in the empirical predicted Equation (2):
where kPHENOL and K are apparent constants that lumped ratios of constants of the individual steps involved (Equations (5)–(8)), which explains why kPHENOL and K do not show an exponential dependence with the reaction temperature:
The substitution of the kinetic constants of each elementary reaction involved in Equations (21) and (22) by the Arrhenius equation will result in an expression that relates the kPHENOL and K with the reaction temperature, providing by this way a mechanistic kinetic model for the phenol hydroxylation over 3D Fe/Al2O3 catalysts. This more rigorous kinetic modeling approach would work in a wider range of operating conditions, especially the reaction temperature, in order to provide more data for a more accurate fitting of the rate equations that now would contain more parameters. This approach is out of the scope of this work.
2.4. CFD Modeling and Simulation
A 3D CFD model that couples the hydrodynamic of the MSR, the mass transfer of the involved species and the kinetic equations of the catalytic reactions has been developed to further simulate the MSR performance upon the phenol hydroxylation over 3D Fe/Al2O3 catalysts. This study will allow to investigate variables that are difficult to measure experimentally, such as the velocity through and around the monoliths, the amount of flow passing through the monoliths and besides, to select the most appropriate operating conditions for the reaction, in particular regarding the dosage of H2O2, the most critical variable for the phenol selectivity to DHBZ [35,36,37].
The hydrodynamic study of the MSR, that includes the effect of the stirring speed on the catalytic performance along with the liquid flow pattern, was validated by using the experimental results obtained in a homogeneous catalytic reaction with the aim of assuring the absence of mass transfer limitation. The reaction selected was the Fenton reaction, which consists of the decomposition of H2O2 in the presence of Fe2+ species, introduced as a FeCl2 salt in the reaction media. In this set of experiments, monoliths made from a polylactic acid (PLA) with the same geometry and dimensions than the 3D Fe/Al2O3 structures were used as blades to mimic the fluid dynamic conditions of the hydroxylation reaction. Further details are provided in the Materials and Methods Section.
2.4.1. Validation of the Laminar Flow
The flow induced by the rotating monoliths in the MSR is modeled using a laminar flow. This flow regime was assumed because the space between the monolith blades and the tank wall in the lab reactor is very low and no baffles were used [38,39]. In fact, the impeller-to-vessel diameter ratio, D/T, was 0.62, which is within the laminar flow (0.6 ≤ D/T ≤ 1) [38]. This laminar flow in the mixing performance needs to be validated prior to the CFD modeling of the MSR for the hydroxylation of phenol. For this, the Fenton reaction was performed at CH2O2,0 = 14.7 mM, CFe2+ = 0.178 mM, T = 25 °C and pH0 = 3 (adjusted with HCl) in the MSR, under different ω values, ranged from 100 to 500 rpm, and using the PLA monoliths.
The CFD modeling for this reaction consisted of the Equations (32)–(34) set at the Materials and Methods Section (with their corresponding boundary conditions) coupled to the following mass transport of H2O2 in the liquid phase:
where 0.0083 min−1 at 25 °C was obtained in a magnetic stirring flask reactor. The calculated H2O2 concentrations inside the tank (calculated as the mean concentration of the total volume) upon 140 min of reaction are similar as those experimentally measured when the stirring velocities are below 500 rpm, with deviations lower than 10%. The parity plot is given in Figure S6 of the Supporting Material. This means that the mixing in the MSR under ω < 500 rpm occurs in the laminar flow regime. The best reproduction of the experimental data was obtained at ω = 250 rpm; consequently, this was the stirring speed selected for the hydroxylation reactions.
The numerical investigation of the MSR for phenol hydroxylation was carrying out by coupling the Navier-stokes equations for the laminar flow and incompressible fluids (Equations (33) and (34)) to the species mass transport (Equations (35)–(37), set at the Materials and Methods Section) for phenol, H2O2, CTL and HQ and including the kinetic model equations (Equations (1)–(4)). The resulting concentrations for each species at different reaction times (obtained as the mean concentration of the total volume) have been compared with the experimental results in the parity plot of Figure 3b. Deviation as high as 10% are observed, thus the CFD model proposed to simulate the performance of the MSR can be considered valid.
2.4.2. Velocity and Mass Transport Analysis
In the liquid velocity field of the MSR, two zones can be highlighted, as seen in Figure 4. An annular zone located inside and surrounding the monoliths, corresponding to the maximum flow velocity (u = 40–80 mm s−1), Figure 4a, and a vortex with very low velocities (u = 3.5–8 mm s−1) in the center of the tank, Figure 4b. This vortex is typically displaced in laminar flows [38], and it is caused because the monoliths in rotation induce an axial flow by moving the fluid from the top to the bottom of the tank passing through the monolithic blades, as can be seen in Figure 5a.
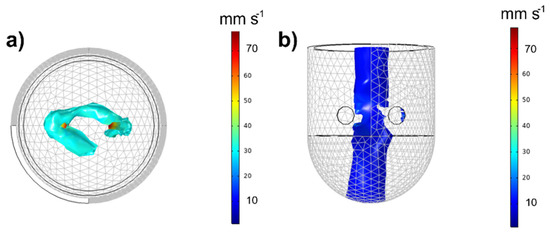
Figure 4.
Velocity fields represented by isosurfaces: (a) maximum velocity zone and (b) minimum velocity zone (b) inside the tank. Operating conditions: ω = 250 rpm and T = 85 °C.
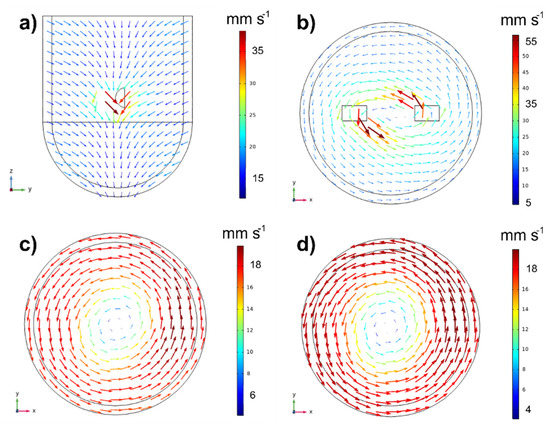
Figure 5.
Velocity vectors (a) on the axial plan at r = 0 (center of the tank), (b) on horizontal plans at z = 65 cm (inter monoliths), (c) z = 90 mm (upper monolith level) and (d) z = 30 mm (lower monolith level). Operating conditions: ω = 250 rpm and T = 85 °C.
Regarding the tangential flow, Figure 5b–d illustrates the tangential velocity on three horizontal plans, inter monoliths (z = 65 mm, Figure 5b), upper monolith level (z = 90 mm, Figure 5c) and lower monolith level (z = 30 mm, Figure 5d). As can be seen, the velocity is maximum at the level of the impeller (Figure 5b). Inside the monolith, the velocity can be as high as 70 mm·s−1 and it can reach a value of 55 mm·s−1 at the exit of the monoliths. Between the monolithic blades, the fluid velocity decreases up to ~25 mm·s−1, and at radial positions between the blade tip and the wall, the velocity decrease to ~5 mm s−1, because this fluid is not in contact to the monoliths, and it is not subjected to their drag force. Above (Figure 5c) and below (Figure 5d) the stirrer, the fluid velocity is ~18 mm·s−1, and now the tangential velocity is lower in the center than at the walls. This is due to the existence of the vortex in the center. The radial velocity profiles at different axial positions, provided in Figure S7 of the Supporting Material, support the above results.
Regarding to the reactant and product mass transport inside the MSR, H2O2 and phenol concentration gradients were not detected and for CTL and HQ, the homogeneity was observed after a few minutes of reaction, despite the laminar flow regimen, Figure S8 of the Supporting Material shows the concentration fields in the reactor at different reaction times. This is because all the species involved in the reaction—phenol, H2O2, CTL and HQ—are soluble in water solvent, and they rapidly diffuse thanks to the mixing. This behavior explains why the H2O2 decomposition rate is constant with the reaction time (or follows a zero-order kinetic). The fraction of H2O2 in contact to the monoliths is low (only a 12.5% of the liquid of the tank) and as it disappears it is instantaneously replaced from the bulk where the concentration is the same in the whole volume.
2.4.3. Catalytic Performance Simulation
A numerical investigation using the 3D CFD model has been carried out to study the influence of the initial phenol:H2O2 molar ratio on the phenol hydroxylation performance. Phenol and H2O2 conversion, selectivity and yield to DHBZ have been calculated in the MSR reactor after 95 min of reaction at different reaction temperatures and by fixing CPHENOL,0 or CH2O2,0 at 0.33 M and modifying the corresponding reactant from 0.66 to 0.15 M. The results obtained at 95 °C are collected in Figure 6. This temperature has been selected because the simulation and the experimental data (Figure 2) clearly show a positive influence of the temperature on the phenol selectivity to DHBZ.
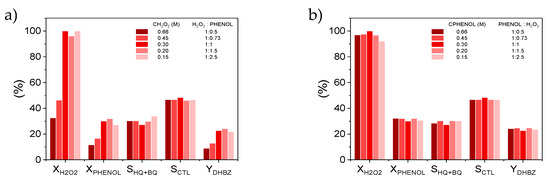
Figure 6.
Effect of the initial concentration of (a) H2O2 and (b) phenol on the catalytic performance at t = 95 min, WCAT = 1.1 gCAT and T = 95 °C. Results calculated by the CFD model.
As can be seen in Figure 6, the XH2O2 is the most affected variable by the initial phenol:H2O2 molar ratio, and consequently the XPHENOL. An excess of H2O2 (Figure 6a), leads to a low consumption of H2O2 which implies also low phenol conversions. This can be explained by the accumulation of HO· species in the media which are recombined into H2O2 [40,41]. When moderate CH2O2,0 is employed closed to a 1:1 mol ratio, or even in defect with respect to stoichiometric amount of phenol (Figure 6b), the HO· radicals are more efficiently used and the XH2O2 significantly increases up to 100%, also XPHENOL enhances to 30%. The SCTL and SHQ remains in all cases close to 50% and 30%, respectively.
On the contrary, the temperature instead of the initial reactant concentration, it was the most influenced variable on the SCTL and SHQ. Figure 7 illustrates the temperature influence at a lower reaction time (90 min), when the highest values for phenol selectivity were calculated by the CFD. This could be as high as 98% when the reaction temperature increases to 100 °C. The YDHBZ values are also more affected by the temperature than the initial reactant concentrations since the selectivity increment by the temperature is higher than the phenol conversion increment by the initial phenol:H2O2 molar ratio. At 100 °C, the YDBHZ can be as high as 40%.
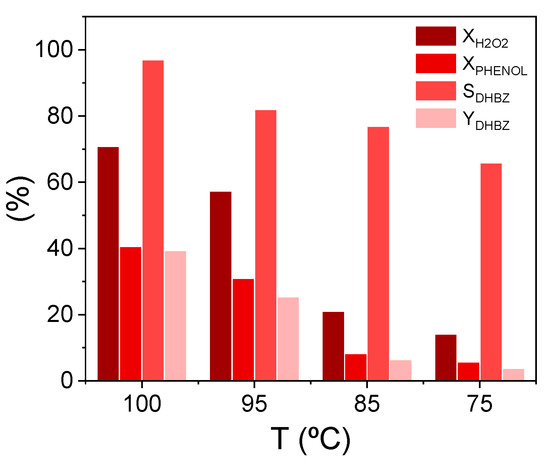
Figure 7.
Effect of the temperature on the phenol hydroxylation performance at t = 90 min, CPHENOL,0 = CH2O2,0 = 0.33 M and WCAT = 1.1 gCAT. Results calculated by the CFD model.
These results reveal that in the hydroxylation of phenol over 3D Fe/Al2O3 catalysts performed in MSR, the oxidant dose is determinant for the H2O2 and phenol conversion, but the phenol selectivity to DHBZ is ruled out by the reaction temperature.
3. Materials and Methods
3.1. Robocasted 3D Fe/Al2O3 Monoliths
One wt.% Fe/Al2O3 honeycomb monoliths with square cell geometry and interconnected channels (~4.4 mm in height and ~13.5 mm in diameter) were additive manufactured by Robocasting (RoboCAD 4.0, 3-D Inks LLC). The details of the ink formulation and the printing process are described in elsewhere [30]. Briefly, the printable ink contained 48 wt.% of ultrapure water (67 vol.%), 25.5 wt.% of boehmite and 13 wt.% of Fe-BTC nanopowders, consisted of trimesic acid-Fe based metal organic framework (MOF) with a weight ratio of 20:1. The procedure of the MOF nanopowders synthesis is fully described elsewhere [42]. The CAD scaffolds were printed in air onto flat alumina substrates using a custom three-axis robocasting system (A-3200, 3-D Inks LLC), a X-Y table speed of 10 mm⋅s−1, and nozzle tips with an inner diameter of 330 μm (Precision Tips; Nordson EFD Inc., East Providence, RI, USA).
The as-printed 3D boehmite/MOF structures were heat treated at 450 °C in air for 1 h using heating and cooling rates of 5 °C·min−1 to remove the trimesic acid-based organic links and give rise 3D monoliths containing a Fe network of dispersed clusters (≤5 µm), nanoclusters (<50 nm) and nanoparticles (~20 nm) into the porous γ-Al2O3 skeleton.
Figure 8a,b shows a real photograph of a fresh cylindrical monolith, the orange color evidences the presence of the iron nanoparticles. It has an open channel length of dopen = 0.66 mm and a wall channel thickness of δwall = 0.13 mm. Figure 8c shows a representative image of the fracture surface where the retention of the 3D architecture is clearly visible and Figure 8d shows the Fe nanoparticles observed by transmission electron microscopy (TEM).
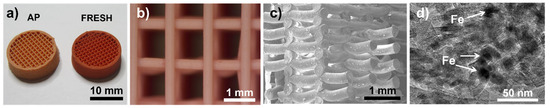
Figure 8.
(a) Real photograph of the as-printed (AP) and after-thermal treated (fresh) 3D cylindrical 1 wt.% Fe/Al2O3 monoliths, (b) optical image of the square channels, (c) FESEM micrographs of the cross-section view of the fracture, (d) TEM micrograph showing some Fe nanoparticles surrounded by Al2O3.
Other physical properties of these monoliths are: specific surface area (SBET) of 112 m2·g−1, apparent density (ρp) of 0.95 ± 0.07 g cm−3, open total (εtotal) and wall (εwall) porosities of 72.5% and 18.2%, respectively, and a cell density of 72 cells·cm2. The mass of each monolith (W) is ~0.26 g. Regarding to the active catalytic phase, electrodeficient Fe species, viz. Fe3+ and Fe2+, were identified by XPS with a with a Fe3+:Fe2+ atomic surface ratio of 63:37 in our previous work [30]. The formation of Fe2O3 and FeO was a consequence of the elimination of the organic linkers and the oxidation of iron nanoparticles during the thermal process.
3.2. Phenol Hydroxylation Reaction
The phenol hydroxylation experiments were carried out batch-wise in the MSR shown in Figure 9. The double-jacketed glass reactor with 1 L of capacity had an internal diameter (T) of 100 mm while the stirrer diameter (D) measured 62 mm from tip to tip. The stirrer shaft (of 262 mm) was constructed in glass to hold a hollow cylindrical blade at 65 mm the shaft at each side where the monolith blocks were located (two monoliths in each blade).
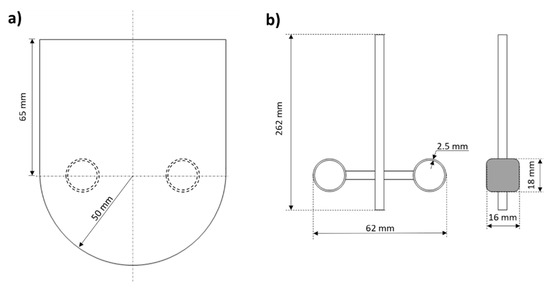
Figure 9.
Dimensions of the experimental MSR: (a) tank and (b) monolithic stirrer used in the hydroxylation of phenol.
In a typical experiment, the reactor was filled with 650 mL of 0.33 M phenol solution and preheating under 250 rpm. While the desired reaction temperature was reached (measured by a thermometer submerge in the liquid), 100 mL of an adjusted concentration of H2O2 (33 wt.%) was feeding by a piston pump at 1 mL min−1 (Gilson 307 HPLC). The kinetic study was carried out at the following operating conditions: CPHENOL,0 = 0.33 M, CPHENOL,0:CH2O2,0 = 1:1 mol, T = 75–95 °C, atmospheric pressure, ω = 250 rpm and WCAT ~ 1.1 g. The reactions were performed under isothermal conditions.
On the other hand, the conversion (X) of reactants, denoted by i: phenol or H2O2, and the phenol selectivity (S) to the identified products, j: CTL, HQ, resorcinol (RSL) or p-benzoquinone (BQ) were calculated as follows:
The selectivity to the undesired product, such as tar, was calculated as:
All the concentrations (C) are expressed on mole basis. The subscripts 0 and t stand for initial and a given reaction time, respectively.
Samples of reaction mixture were taken periodically, and the concentration of phenol and the oxidized species quantified by high performance liquid chromatography (Ultimate 3000, Thermo Scientific, Restek Corporation, Bellefonte, PA, USA) with a C18 5 μm column 150 × 4.6 mm, 4 mM H2SO4 as mobile phase and DAD detector at wavelengths of 210 and 246 nm. H2O2 concentration was obtained by colorimetric titration TiOSO4 method (UV2100 Shimadzu UV-vis spectrophotometer). The content of Fe in solution was measured by TXRF (S2 PicoFox Bruker, GmbH, Berlin, Germany).
3.3. Fenton Reaction
Fenton reaction is the decomposition of H2O2 by Fe2+ in acidic conditions. This reaction was selected as target reaction, due to straightforward monitoring, because only H2O2 needs to be quantified in order to study the influence of the stirring speed in the MSR, to select the appropriate mesh for the CFD investigation and also to validate the flow pattern at the selected stirring speed. For that, Fenton rection was carried out in the MSR at the following conditions: CH2O2,0 = 14.7 mM, CFe2+ = 0.178 mM (from FeCl2 salt), T = 25 °C, pH0 = 3 (adjusted with HCl) and ω = 100–500 rpm. Inert monoliths made from a polylactic acid (PLA) filament (PRUSA i3 MK3S+ printer) with the same geometry and dimensions than the 3D Fe/Al2O3 structures, were used as blades to mimic the fluid dynamic conditions of the hydroxylation reaction.
In addition, the Fenton reaction was also carried out in a magnetic stirring flask reactor at the same operating conditions as in the MSR but without the PLA monoliths to the aim of obtaining the kinetic constant of the H2O2 decomposition rate (kH2O2, FENTON) required in the CFD study.
3.4. Kinetic Modeling
The mass balance of the reactant (i) in the batch MSR under isothermal conditions can be expressed as:
where the reaction rate of i reactant is in moli gCAT−1 min−1 and CCAT is the catalyst concentration in the reactor in gCAT L−1.
Analogously, the mass balance of the j product is:
where the production rate of j product is expressed in molj gCAT−1 min−1.
Therefore, the reaction rates can be expressed, respectively, as:
The numerical integration of the rate equations in the MSR was solved by using the OriginLab 2017 with the initial conditions: CPHENOL = CPHENOL,0, CH2O2 = CH2O2,0 and CCTL,0 = CHQ,0 = CBQ,0 = 0 at CCAT = 1.5 gcat L−1. For solving the differential equations, the classical fourth-order Runge–Kutta method was used in conjunction with Levenberg–Marquardt algorithm for chi-square (χ2) minimization, which is obtained by dividing the residual sum of squares (RSS) by the degrees of freedom. The model discrimination was based on statistical analysis, considering the minimum RSS value and the coefficient of determination (R2) closer to one, and also taking into account the physical meaning of the estimated parameters. Equations (30) and (31) were solved at each temperature.
3.5. CFD Modeling
CFD is applied to predict the flow distribution and mixing performance and to investigate the catalytic performance of the MSR in the DHBZ production by the phenol hydroxylation reaction with H2O2 over 3D Fe/Al2O3 monoliths. It can be assumed that the reactor operates under isothermal conditions, since the temperature of the bulk liquid does not change upon reaction. Then, the heat transfer would not have an appreciable effect on the reactor performance and, consequently, it has not been considering in this numerical study. Software COMSOL Multiphysics v5.5 (COMSOL Inc., Burlington, MA, USA) was used to perform the 3D multiscale modeling. This commercial software is based on the finite element method for the discretization of the domains to solve the model equations.
3.5.1. Geometry and Meshing
The digital MSR geometry was designed in the COMSOL Multiphysics v5.5 builder. The dimension of the tank and monolithic blades were identical to the lab reactor. The double jacket for the heating system has been omitted since the reactor operates under isothermal conditions. To avoid very long computational times, it was considered that the pair of monoliths placed in each impeller blade of the shaft constitutes a single block, and the block was included in the simulation as a porous material with a matrix porosity equivalent to the open total porosity of the monoliths (εtotal = 72%).
The Moving Mesh feature was selected to study the displacement of the fluid caused by the impeller rotation. For that, the fluid in the tank was defined as the deforming domain, and the Yeoh model was selected for the smoothing displacements of the mesh nodes inside the bulk of the fluid [43]. Meanwhile, the monoliths were defined as the rotating domain working under a fixed stirring velocity (w) with the following rotation angle (:
where is the initial angle (rad) fixed at zero and t the reaction time in seconds.
A mesh refinement process was carried out with 6 different sizes of pre-defined tetrahedral meshes (ranged from extra-fine to very-coarse) to acquire the optimum grid mesh to give a good balance between accuracy and computational time. The Fenton reaction was the target reaction for this study (CH2O2,0 = 13 mM, CFe2+ = 0.178 mM (from FeCl2 salt), T = 25 °C, pH0 = 3 and ω = 250 rpm). The mean H2O2 concentration in the vessel domain calculated at different reaction times were compared to the experimental data to evaluate the convergence of the solution with respect to grid mesh used. The normal size was eventually selected resulting in 2 × 10⁴ elements for the monoliths and 2 × 10⁵ for the fluid. Complete information about the results of the meshing process is provided in Figure S9 of the Supplementary Material.
3.5.2. Governing Equations and Boundary Conditions
The flow in the tank domain is described with the continuity equation (mass conservation) and the Navier–Stokes equation (momentum conservation) for laminar flow:
where the Nabla operator (∇) represents the first order spatial derivatives, ρ (SI units: kg m−3) is the mass density, u (m s−1) is the velocity vector, μ (kg m−1 s−1) is the fluid viscosity, p (Pa) is the pressure, I is the identity tensor and F represents the external forces applied to the fluid.
These equations are complemented with the following boundary conditions: at the walls inside the monoliths, the slip condition is employed: u·n = utr·n, where utr is the translational velocity equal to 0; the system pressure has been established as atmospheric pressure p = p0 = 1 atm; symmetry has been imposed on the top of the tank as it is an open contour n·u = 0.
The major species in the liquid phase is water (the solvent). Therefore, the transport of diluted species can be considered along with the physical properties of the water. The convection-diffusion balance equation for the species i in the fluid is:
and the diffusion-reaction balance equation for the species i inside the porous monoliths is:
where Cp,i is the concentration inside the monoliths (mol L−1), Di (m2 s−1) is the diffusion coefficient of the species in the aqueous phase and Di,e (m2 s−1) is the effective diffusion coefficient of the species inside the monoliths. The latter is calculated from the molecular diffusion considering the properties of the porous monolithic catalyst:
where the wall tortuosity (τwall) is set as 1.2 typical for monolithic catalysts. Ri is the reaction rate of reactant or product in mol m−3 s−1.
4. Conclusions
This work exemplifies how 3D printed technology for the monolithic catalyst manufacturing and CFD simulation for fluid dynamic and chemical process understanding can be integrated to boost the implementation of MSR, for instance, in the industrial demanding liquid-phase oxidation reactions by H2O2.
The use of the stirrer with a large diameter due to the presence of the monolith blades favors the presence of a laminar flow in the stirrer tank, as demonstrated by CFD. This is an advantage for the operational cost-effectiveness of the process, since this makes it possible to operate at low stirring speeds without concentration gradients when an appropriate solvent, such as water for the hydroxylation of phenol, is used. Moreover, CFD allows to determine the fluid velocity inside the monolith blades and their surroundings, which can be as high as 70 mm·s−1 and 55 mm·s−1, respectively, at ω = 250 rpm.
Only 12.5% of the liquid volume of the tank is in contact to the monoliths. Despite this, the concentration of the H2O2 on the monoliths surface is continuously replaced from the bulk and the H2O2 decomposition follows a zero-order kinetic equation. The oxidative reactive species on the monoliths react with phenol in solution. The CTL and HQ are produced according to a phenol selectivity and yield to DBHZ as high as 84 and 25%, respectively, with a CTL:HQ = 1.6 mol.
Finally, it is demonstrated that the sustainable production of DHBZ can be efficiently carried out in MSR reactors, with SDHBZ = 98% and YDHBZ = 40%, over 3D 1 wt.% Fe/Al2O3 monolithic catalyst at a phenol:H2O2 = 1 mol and at temperatures around 100 °C.
Supplementary Materials
The following are available online at https://www.mdpi.com/article/10.3390/catal12020112/s1, Figure S1: effect of the stirring speed on the initial reaction rate of the H2O2 decomposition in the Fenton reaction, Figure S2: efficiency in the consumption of H2O2 in the hydroxylation of phenol by H2O2 over 3D Fe/Al2O3 catalysts, Figure S3: experimental concentration profiles of BQ and RSL at different temperatures, Figure S4: experimental concentration profiles of tar at different temperatures, Figure S5: dependence of kH2O2 with the reaction temperature, Figure S6: parity plot of experimental and calculated concentrations by CFD assuming laminar flow for the Fenton reaction carried out at different stirring speed, Figure S7: axial and radial velocity profiles at different radios and axial positions, Figure S8: three-dimensional profiles of the concentration isosurface of CTL and HQ during the hydroxylation of phenol by H2O2, Figure S9: mesh sensitivity analysis in COMSOL Multiphysics® for the MSR.
Author Contributions
Conceptualization, A.Q., M.B. and J.A.C.; methodology, S.M.V.-D., M.B., A.Q. and J.A.C.; software, P.L. and A.Q.; validation, S.M.V.-D., M.B. and J.A.C.; formal analysis, A.D.S.-A., I.D.-H. and P.L; investigation, A.D.S.-A., P.L., A.Q. and M.B.; resources, S.M.V.-D., M.B. and J.A.C.; data curation, P.L., A.Q. and J.A.C.; writing—original draft preparation, P.L. and A.Q.; writing—review and editing, P.L., A.Q. and J.A.C.; visualization, A.Q., M.B. and J.A.C.; supervision, A.Q., S.M.V.-D., M.B. and J.A.C.; project administration, M.B. and J.A.C.; funding acquisition, M.B. and J.A.C. All authors have read and agreed to the published version of the manuscript.
Funding
This work was funded by the following agencies and grants: Spanish Government under project RTI2018-095052-BI00 (MICINN/AEI/FEDER, UE), Community of Madrid under project S2018/EMT-4341, and CSIC project I-COOP+ 2019 (Ref. COOPB20405). P. Lopez acknowledges the Community of Madrid and the European Social Fund for the financing received through the contract PEJ-2019-AI/IND-14385.
Acknowledgments
The authors thank Juliana Mejía for her technical assistance.
Conflicts of Interest
The authors declare no conflict of interest.
References
- Visscher, F.; Van der Schaaf, J.; Nijhuis, T.A.; Schouten, J.C. Rotating reactors—A review. Chem. Eng. Res. Des. 2013, 91, 1923–1940. [Google Scholar] [CrossRef]
- Stankiewicz, A.I.; Moulijn, J.A. Process Intensification: Transforming Chemical Engineering. Chem. Eng. Prog. 2000, 96, 22–34. [Google Scholar]
- Edvinsson-Albers, R.K.; Houterman, M.J.J.; Vergunst, T.; Grolman, E.; Moulijn, J.A. Novel monolithic stirred reactor. AIChE J. 1998, 44, 2459–2464. [Google Scholar] [CrossRef]
- Nijhuis, T.A.; Dautzenberg, F.M.; Moulijn, J.A. Modeling of monolithic and trickle-bed reactors for the hydrogenation of styrene. Chem. Eng. Sci. 2003, 58, 1113–1124. [Google Scholar] [CrossRef]
- Hoek, I.; Nijhuis, T.A.; Stankiewicz, A.I.; Moulijn, J.A. Performance of the monolithic stirrer reactor: Applicability in multi-phase processes. Chem. Eng. Sci. 2004, 59, 4975–4981. [Google Scholar] [CrossRef] [Green Version]
- Boger, T.; Zieverink, M.M.P.; Kreutzer, M.T.; Kapteijn, F.; Moulijn, J.A.; Addiego, W.P. Monolithic catalysts as an alternative to slurry systems: hydrogenation of edible oil. Ind. Eng. Chem. Res. 2004, 43, 2337–2344. [Google Scholar] [CrossRef]
- Lathouder, K.M.; Fló, T.M.; Kapteijn, F.; Moulijn, J.A. A novel structured bioreactor: Development of a monolithic stirrer reactor with immobilized lipase. Catal. Today 2005, 105, 443–447. [Google Scholar] [CrossRef]
- Kapteijn, F.; Nijhuis, T.A.; Heiszwolf, J.J.; Moulijn, J.A. New non-traditional multiphase catalytic reactors based on monolithic structures. Catal. Today 2001, 66, 133–144. [Google Scholar] [CrossRef]
- Boldrini, D.E.; Sánchez, M.J.F.; Tonetto, G.M.; Damiani, D.E. Monolithic stirrer reactor: Performance in the partial hydrogenation of sunflower oil. Ind. Eng. Chem. Res. 2012, 51, 12222–12232. [Google Scholar] [CrossRef]
- Salazar-Aguilar, A.D.; Quintanilla, A.; Vega-Díaz, S.M.; Casas, J.A.; Miranzo, P.; Osendi, M.I.; Belmonte, M. Iron-based metal-organic frameworks integrated into 3D printed ceramic architectures. Open Ceram. 2021, 5, 100047. [Google Scholar] [CrossRef]
- Regenhardta, S.A.; Meyera, C.I.; Sanzb, O.; Sebastianc, V.; Ivanovad, S.; Centenod, M.A.; Odriozolad, J.A.; Montesb, M.; Marchia, A.J.; Garettoa, T.F. Monolithic stirrer reactor: The selective lactose oxidation in liquid phase over Au/Al2O3 nanostructured catalysts. Mol. Catal. 2020, 481, 110219. [Google Scholar] [CrossRef]
- Wu, D.; Guo, Y.; Geng, S.; Xia, Y. Synthesis of propylene carbonate from urea and 1,2-propylene glycol in a monolithic stirrer reactor. Ind. Eng. Chem. Res. 2013, 52, 1216–1223. [Google Scholar] [CrossRef]
- Boldrini, D.E. Monolithic stirrer reactor for vegetable oil hydrogenation: A technical and economic assessment. Chem. Eng. Process. 2018, 132, 229–240. [Google Scholar] [CrossRef]
- Moulijn, J.A.; Kreutzer, M.T.; Nijhuis, T.A.; Kapteijn, F. Monolithic Catalysts and Reactors: High Precision with Low Energy Consumption. In Advances in Catalysis; Gates, B.C., Knözinger, H., Eds.; Elsevier Inc.: Amsterdam, The Netherlands, 2011; Volume 54, pp. 249–327. [Google Scholar]
- Gokhare, V.G.; Raut, D.N.; Shinde, D.K. A Review paper on 3D-Printing aspects and various processes used in the 3D-Printing. Int. J. Eng. Res. 2017, 6, 953–958. [Google Scholar]
- Urhal, P.; Weightman, A.; Diver, C.; Bartolo, P. Robot assisted additive manufacturing: A review. Robot. Comput. Integr. Manuf. 2019, 59, 335–345. [Google Scholar] [CrossRef]
- Symes, M.D.; Kitson, P.J.; Yan, J.; Richmond, C.J.; Cooper, G.J.T.; Bowman, R.W.; Vilbrandt, T.; Cronin, L. Integrated 3D-printed reactionware for chemical synthesis and analysis. Nat. Chem. 2012, 4, 349–354. [Google Scholar] [CrossRef]
- Parra-Cabrera, C.; Achille, C.; Kuhn, S.; Ameloot, R. 3D printing in chemical engineering and catalytic technology: Structured catalysts, mixers and reactors. Chem. Soc. Rev. 2018, 47, 209–230. [Google Scholar] [CrossRef]
- Zentel, K.M.; Fassbender, M.; Power, W.; Luintra, Q.A. 3D Printing as Chemical Reaction Engineering Booster. In Advances in Polymer Reaction Engineering; Moscatelli, D., Sponchioni, M., Eds.; Elsevier Inc.: Amsterdam, The Netherlands, 2020; Volume 56, pp. 97–137. [Google Scholar]
- Alimi, O.A.; Meijboom, R. Current and future trends of additive manufacturing for chemistry applications: A review. J. Mater. Sci. 2021, 56, 16824–16850. [Google Scholar] [CrossRef]
- Lawson, S.; Li, X.; Thakkar, H.; Rownaghi, A.A.; Rezaei, F. Recent advances in 3D Printing of structured materials for adsorption and catalysis applications. Chem. Rev. 2021, 121, 6246–6291. [Google Scholar] [CrossRef]
- Bogdan, E.; Michorczyk, P. 3D Printing in heterogeneous catalysis-The state of the art. Materials 2020, 13, 4534. [Google Scholar] [CrossRef] [PubMed]
- Quintanilla, A.; Casas, J.A.; Miranzo, P.; Osendi, M.I.; Belmonte, M. 3D-Printed Fe-Doped silicon carbide monolithic catalysts for wet peroxide oxidation processes. Appl. Catal. B Environ. 2018, 235, 246. [Google Scholar] [CrossRef]
- Li, Y.; Li, B.; Li, L. Fabrication of 3D Photocatalytic α-Fe2O3 Structure using direct ink writing method. Mod. Phys. Lett. B 2014, 28, 1450051. [Google Scholar] [CrossRef]
- Middelkoop, V.; Slater, T.; Florea, M.; Neatu, F.; Danaci, S.; Onyenkeadi, V.; Boonen, K.; Saha, B.; Baragau, I.A.; Kellici, S. Next frontiers in cleaner synthesis: 3D-printed graphene-supported CeZrLa mixed-oxide nanocatalyst for CO2 Utilization and direct propylene carbonate production. J. Clean. Prod. 2019, 214, 606–614. [Google Scholar] [CrossRef]
- Middelkoop, V.; Vamvakeros, A.; De Wit, D.; Jacques, S.D.M.; Danaci, S.; Jacquot, C.; De Vos, Y.; Matras, D.; Price, S.W.T.; Beale, A.M. 3D-printed Ni/Al2O3 based catalysts for CO2 methanation-a comparative and operando XRD-CT Study. J. CO2 Util. 2019, 33, 478–487. [Google Scholar] [CrossRef]
- Li, X.; Rezaei, F.; Rownaghi, A. Methanol-to-olefin conversion on 3D-Printed ZSM-5 monolith catalysts: Effects of metal doping, mesoporosity and acid strength. Microporous Mesoporous Mater. 2019, 276, 1–12. [Google Scholar] [CrossRef]
- Li, X.; Alwakwak, A.A.; Rezaei, F.; Rownaghi, A.A. Synthesis of Cr, Cu, Ni, and Y-Doped 3D-Printed ZSM-5 Monoliths and Their Catalytic Performance for n-Hexane Cracking. ACS Appl. Energy Mater. 2018, 1, 2740–2748. [Google Scholar] [CrossRef]
- Vega, G.; Quintanilla, A.; Menendez, N.; Belmonte, M.; Casas, J.A. 3D-honeycomb monoliths with interconnected channels for the sustainable production of dihydroxybenzenes: Towards the intensification of selective oxidation processes. Chem. Eng. Process. 2021, 165, 108437. [Google Scholar] [CrossRef]
- Salazar-Aguilar, D.A.; Quintanilla, A.; López, P.; Martínez, C.; Vega-Díaz, S.M.; Casas, J.A.; Miranzo, P.; Osendi, M.I.; Belmonte, M. 3D printed Fe/γ-Al2O3 monoliths from MOF-based boehmite inks for the catalytic hydroxylation of phenol. ACS Appl. Mater. Interfaces 2022, 14, 920–932. [Google Scholar] [CrossRef]
- Warna, J.; Ronnholm, M.; Salmi, T.; Keikko, K. Application of CFD on a catalytic rotating basket reactor. Comput. Aided Chem. Eng. 2002, 10, 1009–1014. [Google Scholar]
- Magnico, P.; Fongarland, P. CFD simulations of two stirred tank reactors with stationary catalytic basket. Chem. Eng. Sci. 2006, 26, 1217–1236. [Google Scholar] [CrossRef]
- Santos-Moreau, V.; Brunet-Errard, L.; Rolland, M. Numerical CFD simulation of a batch stirred tank reactor with stationary catalytic basket. Chem. Eng. J. 2012, 207–208, 596–606. [Google Scholar] [CrossRef]
- Frey, M.; Dominique, L.V.; Fongarland, R.P. Experimental and CFD study of a new one-pot reactor for hybrid Catalysis. Chem. Eng. J. 2020, 383, 1229583. [Google Scholar] [CrossRef]
- Yang, L.; Li, R.; Hu, C. The preparation of Fe/wood-based activated carbon catalyst for phenol hydroxylation from Fe2+ and Fe3+ precursors. Catal. Sci. Technol. 2015, 5, 2486–2495. [Google Scholar] [CrossRef]
- Liang, X.; Yang, R.; Li, G.; Hu, C. Phenol hydroxylation over Fe-incorporated mesoporous materials prepared by coprecipitation. Microporous Mesoporous Mater. 2013, 182, 62–72. [Google Scholar] [CrossRef]
- Shi, F.; Luo, Y.; Li, Z.; Shan, C.; Zhang, L. Preparation of 5,10,15,20-(4-hydroxy)phenylporphyrin copper/γ-Al2O3 and its performance as catalyst in phenol hydroxylation. React. Kinet. Mech. Catal. 2017, 120, 555–565. [Google Scholar] [CrossRef]
- Brodkey, R.S.; Hershey, H.C. Agitation. In Transport Phenomena: A Unified Approach. Part II and III; McGraw-Hill Inc.: Columbus, OH, USA, 1988; Volume 2, pp. 359–399. [Google Scholar]
- Hayes, R.E.; Afacan, A.; Boulanger, B.; Tanguy, P.A. Experimental Study of Reactive Mixing in a Laminar Flow Batch Reactor. Chem. Eng. Res. Des. 1998, 76, 73–81. [Google Scholar] [CrossRef]
- Quintanilla, A.; Diaz de Tuesta, J.L.; Figueruelo, C.; Munoz, M.; Casas, J.A. Condensation By-Products in Wet Peroxide Oxidation: Fouling or Catalytic Promotion? Part I. Evidences of an Autocatalytic Process. Catalysts 2019, 9, 516. [Google Scholar] [CrossRef] [Green Version]
- Rueda Márquez, J.J.; Levchuk, I.; Sillanpää, M. Application of Catalytic Wet Peroxide Oxidation for Industrial and Urban Wastewater Treatment: A Review. Catalysts 2018, 8, 673. [Google Scholar] [CrossRef] [Green Version]
- Salazar-Aguilar, A.D.; Vega, G.; Casas, J.A.; Vega-Díaz, S.M.; Tristan, F.; Meneses-Rodríguez, D.; Belmonte, M.; Quintanilla, A. Direct Hydroxylation of Phenol to Dihydroxybenzenes by H2O2 and Fe-based Metal-Organic Framework Catalyst at Room Temperature. Catalysts 2020, 10, 172. [Google Scholar] [CrossRef] [Green Version]
- Renaud, C.; Cros, J.; Feng, Z.; Yang, B. The Yeoh model applied to the modeling of large deformation contact/impact problems. Int. J. Impact Eng. 2009, 36, 659–666. [Google Scholar] [CrossRef] [Green Version]
Publisher’s Note: MDPI stays neutral with regard to jurisdictional claims in published maps and institutional affiliations. |
© 2022 by the authors. Licensee MDPI, Basel, Switzerland. This article is an open access article distributed under the terms and conditions of the Creative Commons Attribution (CC BY) license (https://creativecommons.org/licenses/by/4.0/).