Abstract
Three series of zeolite catalysts Co all-silica and Co Al-containing zeolites beta were prepared for use in the selective oxidative dehydrogenation of propane to propylene. Two series of zeolite catalysts Co all-silica were prepared by a two-step postsynthesis method at pH = 2.5 and pH = 3.0–9.0, respectively, which allows the incorporation of cobalt into SiBEA zeolite in the form of isolated framework pseudo-tetrahedral Co(II) species. The incorporation of Co ions into vacant T-atom sites and their reaction with silanol groups were demonstrated by NMR and FTIR methods. The generation of Lewis acid sites without the formation of Brønsted sites was proved by FTIR using pyridine and CO as probe molecules. The state of cobalt in three series of prepared and calcined zeolite catalysts was characterized by DR UV-vis. This technique allowed to show that for low Co content (<2 wt.%) cobalt is present in the form of framework pseudo-tetrahedral Co(II) species. For higher Co content (>2 wt.%), both framework pseudo-tetrahedral and extra-framework octahedral Co(II) species are present. The Co Al-containing zeolite beta series prepared on non-dealuminated support shows the presence of extra-framework octahedral Co(II) only.
1. Introduction
The catalytic dehydrogenation of propane is the most direct and selective way to produce propylene, which is a well-known, essential chemical intermediate that is in great demand. Thermal dehydrogenation of propane is a strongly endothermic process that requires operation at high temperature and a high alkanes partial pressure []. However, the harsh conditions of the reaction process cause technical limitations and pronounced deactivation of the noble metal-based catalysts used in this process, which limits the development of such an industrial process []. The catalytic oxidative dehydrogenation of propane (ODHP) may be a promising alternative process to fill the growing gap between propene demand and production []. The advantages of the propane ODH reaction are that it is exothermic, thermodynamically unrestricted, runs at relatively low temperatures, and minimizes coke formation, which allows for long-term catalyst stability. However, due to undesirable consecutive and parallel non-selective oxidation reactions, the propene yield is still insufficient. Therefore, further enhancement of propene yield based on ODH of propane is challenging and of great interest.
The ODHP reaction was found to follow the redox mechanism previously described by Mars and van Krevelen [] and involves the activation of C-H bonds. Noble metal catalysts have been shown to be active in C-H bond activation [,], but their high cost limits their large-scale application []. Therefore, the discovery of earth-abundant elements that catalyze chemical transformations similar to those typical of noble metals is still the subject of numerous investigations. In a recent work by Davis et al. [], atomically dispersed Co(II) species supported on N-doped carbon were found to catalyze the oxidative dehydrogenation of benzyl alcohol. Furthermore, the Co(II) species remained atomically dispersed and coordinated with nitrogen atoms on the carbon support up to 480 °C.
The present work describes the preparation of well-dispersed Co(II) species on siliceous SiBEA support by the two-step postsynthesis method at pH = 2.5 and pH = 3.0–9.0 conditions, which allows the incorporation of different amounts of cobalt into the BEA zeolite framework. The activity of such framework Co(II) species in the oxidative dehydrogenation reaction of propane will be reported in our following paper.
XRD, FT-IR, NMR, DR UV-vis, TPR, TEM, and XPS have been used to characterize the three series of CoxSiBEA(I), CoxHAlBEA(II), and CoxSiBEA(III) zeolites. The purpose of this study was to determine the state of the Co species in these catalysts.
2. Results and Discussion
2.1. Evidence for Cobalt Incorporation into SiBEA Framework
2.1.1. XRD
The XRD patterns of CoxSiBEA(I), CoxHAlBEA(II), and CoxSiBEA(III) selected samples, as well as HAlBEA and SiBEA supports show reflections characteristic for parent BEA zeolite at about 7.6 and 22.4° (Figure 1). This proves that all Co-containing samples retain zeolite beta structure, significantly its crystalline structure, in line with earlier reports [,].
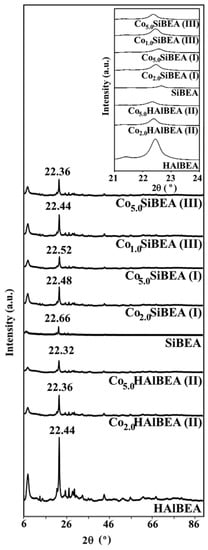
Figure 1.
XRD patterns of selected samples of three CoxSiBEA(I), CoxHAlBEA(II), and CoxSiBEA(III) series recorded at room temperature and under ambient atmosphere.
The introduction of cobalt ions into HAlBEA by conventional wet impregnation causes an increase in the d302 spacing value from 3.959 Å (with 2θ of 22.44°) to 3.969 Å (with 2θ of 22.32°) for Co5.0HAlBEA(II) (Figure 1), which indicates that introduction of cobalt involves only a small expansion of HAlBEA zeolite structure.
When cobalt ions are introduced into siliceous SiBEA by two-step postsynthesis method, the d302 spacing value increases from 3.917 Å (with 2θ of 22.66°) to 3.943 Å (with 2θ of 22.52°) for Co5.0SiBEA(I) and even to 3.968 Å (with 2θ of 22.36°) for Co5.0SiBEA(III) (see Figure 1). It is evident that introduction of cobalt into siliceous SiBEA involves expansion of SiBEA structure and strongly suggests that cobalt is incorporated into SiBEA framework.
2.1.2. FTIR Investigation
IR investigation of HAlBEA sample showed characteristic bands attributed to AlO-H groups (bands at 3778 and 3662 cm−1), to Si-O(H)-Al acidic hydroxyls (band at 3607 cm−1) [,] and to isolated external SiO-H groups (band at 3741 cm−1) (Figure 2A), in agreement with earlier reports []. After introduction of cobalt ions into HAlBEA, the intensity of all these bands have decreased significantly (Figure 2A, Co1.0HAlBEA(II) and Co5.0HAlBEA(II) spectra), which indicates that the Co species interacted with all of the various hydroxyl groups of the pristine support.
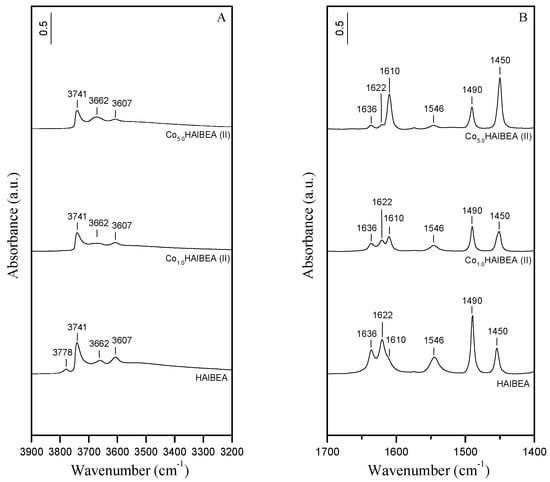
Figure 2.
(A) FTIR spectra (vibration region of the OH groups) recorded at room temperature of HAlBEA, Co1.0HAlBEA(II), and Co5.0HAlBEA(II) and (B) FTIR difference spectra recorded at room temperature of HAlBEA, Co1.0HAlBEA(II), and Co5.0HAlBEA(II) after adsorption of pyridine (133 Pa) for 1 h at room temperature and desorption at 150 °C for 1 h.
The acidic treatment of HAlBEA support leads to the removal of Al atoms from the zeolitic framework as shown by the disappearance of the IR bands at 3778, 3662, and 3607 cm−1 related to AlO-H and bridging Si-O(H)-Al hydroxyls groups, respectively (Figure 3A), in agreement with our earlier investigations [,]. The intense band at 3736 cm−1 and a shoulder at about 3695 cm−1 are attributed to internal and terminal isolated silanol groups, respectively []. The broad intense band at 3515 cm−1, attributed to H-bonded SiOH groups in SiBEA, proves the creation of vacant T-atom sites after dealumination, in agreement with our previous reports [,]. As shown by comparing HAlBEA and SiBEA spectra (Figure 2B and Figure 3B, Table 1), the dealumination of HAlBEA leads to the disappearance of the Brønsted and Lewis acid sites in the resulting SiBEA material.
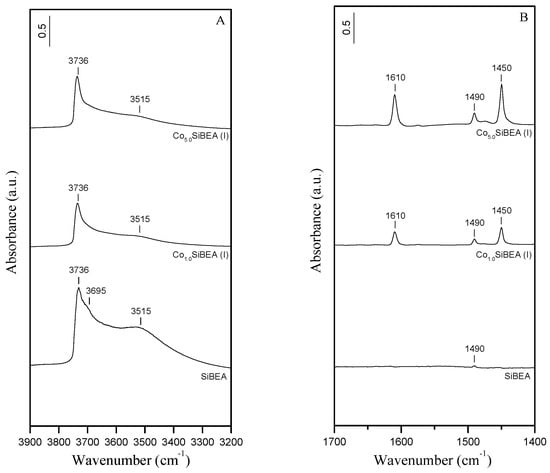
Figure 3.
(A) FTIR spectra (vibration region of the OH groups) recorded at room temperature of SiBEA, Co1.0SiBEA(I), and Co5.0SiBEA(I) and (B) FTIR difference spectra recorded at room temperature of SiBEA, Co1.0SiBEA(I), and Co5.0SiBEA(I) after adsorption of pyridine (133 Pa) for 1 h at room temperature and desorption at 150 °C for 1 h.

Table 1.
The number of Brønsted and Lewis acid sites in HAlBEA, Co1.0HAlBEA(II), Co5.0AlBEA(II), SiBEA, Co1.0SiBEA(I), Co5.0SiBEA(I), Co1.0SiBEA(III), and Co5.0SiBEA(III).
The impregnation of SiBEA with aqueous solutions of Co(NO3)2 at pH = 2.5 results in a significant reduction in intensity of the OH bands related to H-bonded silanol groups at 3515 cm−1, and to internal and terminal isolated silanol groups at 3736 and 3695 cm−1, respectively (Figure 3A, Co1.0SiBEA(I) and Co5.0SiBEA(I) spectra). However, it can be noted that bands related to H-bonded and terminal silanols at 3515 and 3695 cm−1, respectively, are more affected by Co incorporation than the internal silanols (3736 cm−1). Compared to the CoxSiBEA(I) series (Figure 3A), the preparation of Co1.0SiBEA(III) and Co5.0SiBEA(III) at pH = 3.0–9.0 leads to a more pronounced consumption of the OH bands at 3736, 3695, and 3515 cm−1 (Figure 4A). Above observations indicate that cobalt ions interact with silanol groups leading to the incorporation of cobalt ions into the vacant T-atom sites of SiBEA. These results suggest also that the incorporation of cobalt ions into the framework of SiBEA must be stronger at pH 3.0–9.0 than at pH 2.5. It is evidenced by the lower intensity of the remaining silanol bands found for CoxSiBEA(III) (Figure 4A) compared to CoxSiBEA(I) (Figure 3A). As the Point of Zero Charge (PZC) of silica has been reported to be around 2.0 [], the suggested difference in dispersion of Co species in both series of samples may be attributed to greater deprotonation of the silanol groups (SiO-H + OH− = SiO− + H2O). In such case, as the pH of the impregnation medium increases, the number of electronegatively-charged SiBEA sites that are able to interact with the positively-charged Co ions also increases. This lead to a stronger incorporation of cobalt into CoxSiBEA(III) series than CoxSiBEA(I) ones.
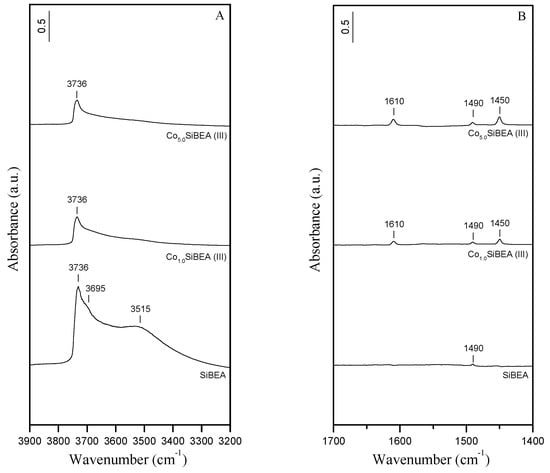
Figure 4.
(A) FTIR spectra (vibration region of the OH groups) recorded at room temperature of SiBEA, Co1.0SiBEA(III), and Co5.0SiBEA(III) and (B) FTIR difference spectra recorded at room temperature of SiBEA, Co1.0SiBEA(III), and Co5.0SiBEA(III) after adsorption of pyridine (133 Pa) for 1 h at room temperature and desorption at 150 °C for 1 h.
2.2. The Local Environment of Cobalt in Co-BEA Zeolites
2.2.1. NMR Investigation
The 27Al MAS NMR spectrum of HAlBEA (Figure S1) exhibits three signals at −2.4, 51.3, and 54.1 ppm. The first signal corresponds to extra-framework aluminum atoms in octahedral coordination (AlOh), whereas the others correspond to aluminum atoms in tetrahedral coordination (AlTd) of zeolite framework. After removing aluminum, the dealuminated SiBEA sample presents only one low-intensity signal at 51.3 ppm which comes from the traces of framework AlTd atoms in agreement with earlier reports [,]. The 27Al MAS NMR spectra of Co1.0SiBEA(I), Co2.0SiBEA(I), Co1.0SiBEA(III), and Co5.0SiBEA(III) show a signal at 51.3 ppm (Figure S1) only, which is related to framework tetrahedral Al(III) species (AlTd). The presence of cobalt in the SiBEA matrix causes this signal to be broadened which is related to the paramagnetic properties of Co(II) species. Indeed, the disruption of NMR signal due to paramagnetic species has been reported previously [,,].
The 1H MAS NMR spectra of HAlBEA, SiBEA, Co1.0SiBEA(I), Co2.0SiBEA(I), Co1.0SiBEA(III), and Co5.0SiBEA(III) are shown in Figure S2. In the HAlBEA sample, two signals at 1.8 and 5.0 ppm can be seen coming from the silanol protons and bridged Si-O(H)-Al groups, respectively. The dealumination treatment of the TEABEA parent zeolite with nitric acid results in the creation of vacant T-atom sites in SiBEA, which is manifested by the appearance of two peaks at 1.4 and 5.2 ppm attributed to the presence of isolated silanol groups (SiOH) and hydrogen bonded silanol groups, respectively. For all cobalt samples, Co1.0SiBEA(I), Co2.0SiBEA(I), Co1.0SiBEA(III), and Co5.0SiBEA(III), the intensity of these signals is much lower and almost disappears for the latter sample, which suggests that the incorporation of cobalt ions into the vacant T-atom sites leads to the consumption of both silanol groups. Similarly to the 27Al MAS NMR signal, a widening of the 1H MAS NMR signal is observed due to the paramagnetic effect of cobalt (II) species.
The 29Si MAS NMR spectrum of HAlBEA (Figure S3) shows three peaks at −115 and −112 ppm due to the framework Si atom in a Si(OSi)4 (Q4) environment located at different crystallographic sites, and at about −104 ppm due to overlapping signals from the (OSi)3Si(OH) (about −103 ppm) and (OSi)3Si(Al) (about −105 ppm) groups. After dealumination, the signal originating from Si atoms in close proximity to Al atoms ((OSi)3Si(Al)) has disappeared. Therefore, the 29Si MAS NMR spectrum of SiBEA shows only two resolved peaks at −103 and −112 ppm (Figure S3) due to framework Si atoms in a (OSi)3Si(OH) (Q3) and Si(OSi)4 (Q4) surroundings, respectively. The 29Si MAS NMR spectra of Co1.0SiBEA(I) and Co1.0SiBEA(III) show that the incorporation of cobalt lowers the intensity of the signal corresponding to Si present in the (OSi)3Si(OH) (Q3) environment (−103 ppm), which suggests that the Co species interact with the silanols of the zeolite. Like the above, the large amount of paramagnetic cobalt species introduced into the samples strongly disrupts 29Si MAS NMR spectra, which is particularly well seen in Co2.0SiBEA(I) and Co5.0SiBEA(III) spectra as the baseline distortion and intensity increase on the spinning sidebands.
Figure S4 shows the 1H-29Si cross polarization (CP) MAS NMR spectra of SiBEA, Co1.0SiBEA(III) and Co5.0SiBEA(III). Significant enhancement of silicon Q3 signal (−103 ppm) in SiBEA sample is associated with the presence of protons in the neighborhood of the silicon atoms, as for the (OSi)3Si(OH) groups. Such enhancement is not observed in the case of Co1.0SiBEA(III) and Co5.0SiBEA(III) samples because there is much less Q3 species remaining after the incorporation of cobalt and after the reaction with (OSi)3Si(OH) groups.
Overall, the observation of strong disturbances in 29Si MAS NMR spectra of CoxSiBEA zeolites associated with the paramagnetic effect of the cobalt(II) species, leads to the conclusion that the cobalt ions are located in the proximity of Si and formed as a result of reaction of cobalt with silanol nests, created by dealumination of the AlTd framework sites of the zeolite.
2.2.2. DR UV-vis Investigation
The DR UV-vis spectra of selected samples of AP-CoxHAlBEA(II) and CoxHAlBEA(II) series (Figure 5) show bands at around 520 nm characteristic for octahedral Co(II) species (3d7 configuration). There are also broad bands around 269–301 nm likely related to the oxygen-to-metal charge transfer (CT), in line with earlier reports on framework Co(II) in Co-MFI and CoAPO-5 [,,].
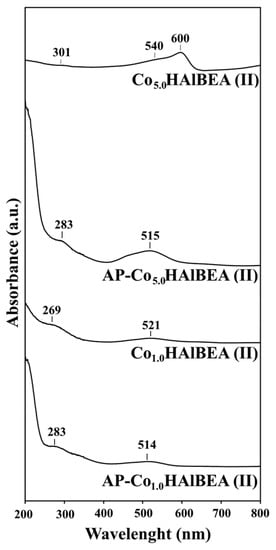
Figure 5.
DR UV-vis spectra of selected samples of AP-CoxHAlBEA(II) and CoxHAlBEA(II) series recorded at room temperature and under ambient atmosphere.
In DR UV-vis spectra of selected samples of AP-CoxSiBEA(I) series (Figure 6), one can find bands at around 520 nm which indicate the presence of octahedral Co(II) species, same as for AP-CoxHAlBEA(II) series (Figure 5). Moreover, the pink color of the samples also confirms the presence of octahedral Co(II) species, in line with earlier reports on Co-MFI and Co-BEA zeolites systems [,,]. In contrast, the bands characteristic for octahedral Co(II) species are not visible in CoxSiBEA(I) samples. However, the bands occurring at about 527, 594 and 660 nm for Co1.0SiBEA(I) and at about 542 and 600 nm for Co5.0SiBEA(I) are consistent with the formation of isolated pseudo-tetrahedral Co(II) species due to dehydration upon calcination at 500 °C.
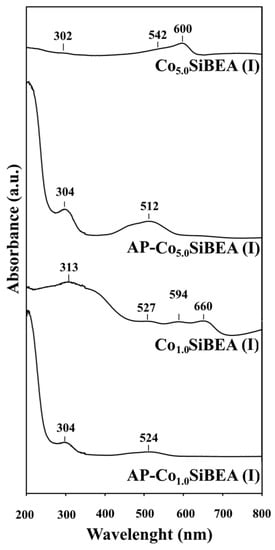
Figure 6.
DR UV-vis spectra of selected samples of AP-CoxSiBEA(I) and CoxSiBEA(I) series recorded at room temperature and under ambient atmosphere.
The DR UV-vis spectra of selected samples of AP-CoxSiBEA(III) series exhibit three characteristic and relatively intense bands at about 521, 591, and 645 nm (Figure 7) assigned to the presence of isolated pseudo-tetrahedral Co(II) species and attributed to 4A2 → 4T1 (4P), 4A2 → 4T1 (4F) and 4A2 → 4T2 d-d transitions, respectively, in line with earlier studies on Co-MFI and CoAPO-5 [,,]. Both series exhibit a blue color consistent with the presence of pseudo-tetrahedral Co(II) species. Significant differences in AP-Co5.0SiBEA(III) and AP-Co5.0SiBEA(I) DR UV-vis spectra are due to greater deprotonation of the silanol groups of the first series prepared at pH = 3.0–9.0 than the second series prepared at pH = 2.5. Such deprotonation of the silanol groups increases the number of electronegatively charged sites in SiBEA capable of interacting with the positively charged Co ions. So, the incorporation of Co ions into the SiBEA matrix is much more effective at pH = 3.0–9.0 than at pH = 2.5. This phenomenon may lead to more pseudo-tetrahedral Co(II) species in AP-Co5.0SiBEA(III) than in AP-Co5.0SiBEA(I). There is a good correlation between DR UV-vis studies and XRD and IR results presented above.
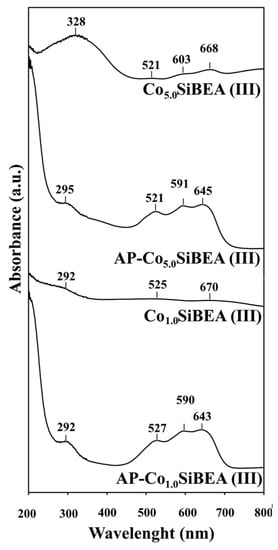
Figure 7.
DR UV-vis spectra of selected samples of AP-CoxSiBEA(III) and CoxSiBEA(III) series recorded at room temperature and under ambient atmosphere.
2.2.3. XPS Investigation
The high-resolution XPS spectra of Al 2p, Si 2p, C 1s, O 1s, and Co 2p were used to study the chemical states of obtained zeolites. The procedure of samples dealumination has been fully completed which was confirmed by the absence of any photoelectron signal in the BE region of Al 2p.
High-resolution Si 2p spectra of all zeolites showed three components with the most intensive contribution of over 90%. The main component with Si 2p3/2 BE values of 103.8–104.3 eV is related to the presence of tetrahedral Si(IV) [,,]. Similar binding energy values were reported for BEA, MFI, and MOR zeolites [,,,,]. There is also a small (<8%) low-BE component with Si 2p3/2 BE of 101.7–102.6 eV in all samples, which is characteristic for silicon in lower than 4+ oxidation state. This can be attributed to the silicon present in Si-O(H)-Co groups and also proves that the silicon matrix was only slightly affected by the dealumination process.
Three contributions at 285.0 eV (organic contaminants), 286.4–286.6 eV (C–O bonds), and 288.2–289.6 eV (O–C=O bonds) can be distinguished in the C 1s spectra of fresh catalysts (not shown here). Spent catalysts are also characterized by three carbon components, however, with slightly lower BE (285.8–286.0 eV for C–O bonds and 287.6–287.8 eV for C=O bonds). The hydrocarbon contamination was used as an internal calibration for all samples, as we mentioned above.
The O 1s spectra show three components located at BE close to 531.4, 533.5, and 534.8 eV related to Co-O and Co-Si-O bonds, Si-O-Si bonds, and OH groups, adsorbed water and/or oxygen of organic contaminants, respectively (Table S1, Supporting Information). The dominant component referred to as the lattice oxygen in the zeolite matrix (Si-O-Si bonds) has total area exceeding 86%. It is well known that cobalt oxides CoO, Co3O4, and Co(OH)2 show O 1s core lines at binding energy of 529.2, 529.6, and 530.1 eV, respectively [,]. Thus, one can conclude that the low-BE contribution positioned as high as 531.4 eV cannot be assigned to the extra-framework oxides. Chuang et al. [] found that non-stoichiometric oxygen surface region gives a signal at 531.2 eV for CoO and at 530.8 eV for Co3O4, whereas stoichiometric oxygen in CoO and Co3O4 is assigned to low-energy peaks of 529.6 and 529.5 eV, respectively. In turn, McIntyre and Cook [] affiliated the presence of the high-BE peak at 531.2 eV with Co(OH)2.15. Here, we postulate that the non-stoichiometric oxygen and hydroxide intra-framework species contribute to low-BE O 1s peak []. The total area of low-BE component does not exceed 9% (Table S1, Supporting Information). There are significant differences between samples prepared under different pH conditions.
Figure 8 and Figure 9 clearly illustrate complicated character of Co 2p spectra and the need to present both branches of the spin-orbit splitted doublets, 2p3/2 and 2p1/2, for the fitting procedure. A correct spectra fitting can only be performed when, in addition to characteristic photoelectron peaks, some additional structures are taken into account. These structures depend on (i) multiplet splitting of the final states, (ii) charge transfer (CT) satellites, (iii) crystal field splitting of 3d-states and (iv) plasmon loss structures []. In case of Co 2p spectra, the most intense contribution comes from the CT satellite peaks, while the multiplet splitting adds to the fine structure causing lines broadening []. The CT states 2p53d8L−1 generate the main photoelectron peaks, whereas shake-up satellites are related to the non-CT 2p53d7 states. Depending on the nature of the virtual levels to which the valence electrons can be excited, one or more satellite lines in shake-up processes are observed. The strong satellites as well as the Co 2p components with relatively high binding energies confirm that cobalt is present almost exclusively in the +2 oxidation state in studied samples.
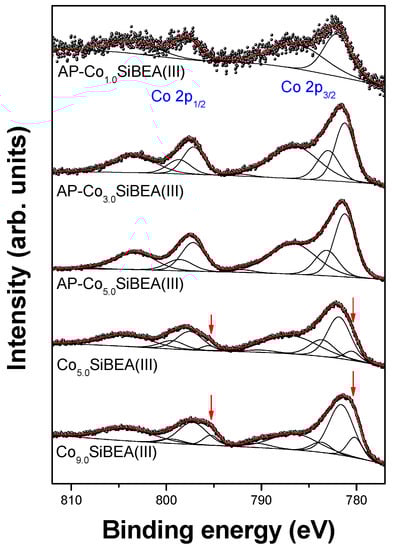
Figure 8.
Co 2p XPS spectra of CoxSiBEA (pH = 3.0–9.0). Red arrows mark a low-BE component which is not seen in as received samples.
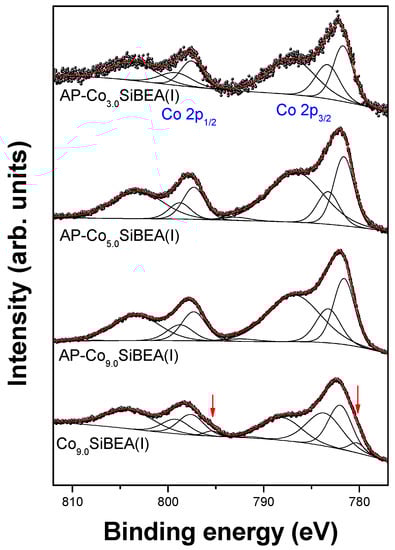
Figure 9.
Co 2p XPS spectra of CoxSiBEA (pH = 2.5). Red arrows mark a low-BE component which is not seen in as received samples.
No evidence of bulk CoO (780.0 eV), Co(OH)2 (780.7 eV), CoOOH (780.4 eV), and Co3O4 (779.9 eV) was found in AP-CoxSiBEA(I) and AP-CoxSiBEA(III) series (Figure 8 and Figure 9, Table 2 and Table 3). This suggests that most of the cobalt has been incorporated into the zeolite structure. However, due to the low concentration of cobalt, it cannot be ruled out that some cobalt oxide-like adspecies are present in the zeolite channels as a highly dispersed phase. The Co 2p3/2 component with BE ~ 781.7 eV found in AP-CoxSiBEA(I) samples (Figure 9) can be assigned to isolated extra-framework Co(II) in octahedral coordination []. It is worth noting that the Co 2p component with similar BE was associated with Co(II) ions located at charge compensation sites by Xie et al. [] in Co-ZSM-11 and by Boix and Ferro [] in Co-ZSM-5. A series of AP-CoxSiBEA(III) samples prepared in a more alkaline environment show a slight shift of this component towards lower binding energies (~781.1 eV) (Figure 8), indicating the presence of another form of cobalt in addition to isolated intra-framework Co(II) in pseudo-tetrahedral coordination. It can evidence the formation of Co(II) species coordinated octahedrally, such as amorphous microaggregates of the hydrated [Co(H2O)6]2+ form. The mechanism of formation of such aggregates in Co-ZSM-5 has been well explained by Chupin et al. [].
Table 2.
The BE values (eV) and relative areas of components (%) of Co 2p3/2 core excitation obtained for CoxSiBEA samples (pH = 3.0–9.0. A, B, and C denote Co 2p components visible in Figure 8. The spin–orbit splitting Δ (eV) of each doublet is also presented.
Table 3.
The BE values (eV) and relative areas of components (%) of Co 2p3/2 core excitation obtained for CoxSiBEA samples (pH = 2.5). A, B, and C denote Co 2p components visible in Figure 9. The spin–orbit splitting Δ (eV) of each doublet is also presented.
The peaks at BE higher than 783 eV should be assigned to highly dispersed Co(II) species located in tetrahedral positions [,]. Such species are coordinated to framework oxygen, and probably associated with silanol groups. There are significant differences in relative area ratio of both components between samples prepared under different pH conditions.
2.3. Reducibility of the Cobalt Species Present in the Co-BEA Zeolites
The reducibility of cobalt species in three series of samples was determined using H2-TPR (Figure 10). According to previous studies, H2-TPR profiles of Co-containing materials can be divided into three ranges of hydrogen consumption assigned to the reduction of (I) extra-framework bulk-like Co3O4 particles below 460 °C [,], (II) cobalt ions present in the form of small and poorly organized CoOx oligomers between 460 and 800 °C, and (III) isolated cobalt (II) species above 800 °C [].
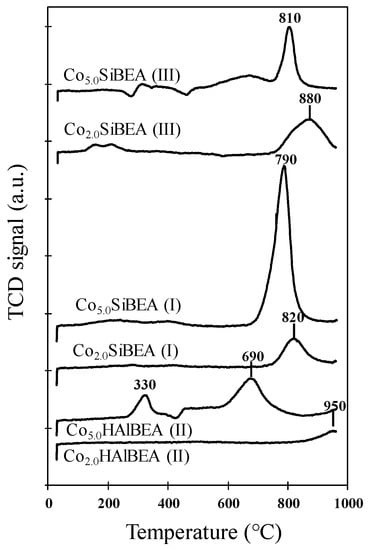
Figure 10.
TPR-H2 profiles of selected samples of CoxHAlBEA(II), CoxSiBEA(I), and CoxSiBEA(III) series.
The TPR profile of Co2.0HAlBEA(II) does not show any reduction peak until 900 °C (Figure 10) which suggests that much higher temperatures are needed to reduce the cobalt species present in this sample. A small peak, probably related to the reduction of Co species in the exchange positions, isolated and very strongly bonded to zeolite, is only seen above 950 °C. In contrast, Co5.0HAlBEA(II) shows two peaks around 330 and 690 °C attributed to the reduction of extra-framework bulk-like Co3O4 particles and CoOx oligomers, respectively [,,].
The Co2.0SiBEA(I) sample showed one small reduction peak at 820 °C which could be attributed to the reduction of framework pseudo-tetrahedral Co(II) species [,,,,,,,,,,,,] (Figure 10). For Co5.0SiBEA(I), a very intense H2-consumption peak appears at a slightly lower temperature (790 °C) suggesting that this sample mainly contains well dispersed Co species strongly bonded to the SiBEA support.
Co2.0SiBEA(III) showed only one reduction peak at around 880 °C (Figure 10). It can be assigned to the reduction of well dispersed pseudo-tetrahedral cobalt(II) species strongly bonded to SiBEA support, in line with earlier reports []. The slightly higher reduction temperature in these samples confirms that the cobalt is more strongly bonded to the zeolite framework if prepared at a higher pH. For Co5.0SiBEA(III), two reduction peaks at 810 and 690 °C appeared. The first one could be assigned to reduction of well dispersed pseudo-tetrahedral cobalt(II) species and the second large peak at 690 °C to the reduction of extra-framework CoOx oligomers. The similar peak at 690 °C but with much higher intensity was observed for Co5.0HAlBEA(II) as shown in Figure 10.
2.4. Acidic Properties of Catalytic Systems
The nature and strength of the acid sites of selected samples were determined by the adsorption of pyridine and CO as probe molecules followed by FTIR. It should be noted that CO adsorption was also used to better understand the speciation of cobalt in the prepared samples.
2.4.1. Pyridine Adsorption Followed by FTIR
The IR bands observed at 1546 and 1636 cm−1 for HAlBEA after pyridine adsorption (Figure 2B) indicate the presence of Brønsted acid sites related to the acidic proton of the Al–O(H)–Si groups, in line with earlier studies [,]. The interaction of pyridine molecules with strong Lewis acid sites (Al3+) is indicated by the 1450 and 1622 cm−1 bands, while the 1610 cm−1 band indicates interaction with Lewis acid sites of moderate strength. The band at 1490 cm−1 corresponds to pyridine molecules interacting with both Brønsted and Lewis acid sites.
The introduction of cobalt ions into the HAlBEA zeolite causes a significant decrease in the number of Brønsted acid sites, while increasing the number of Lewis acid sites (Figure 2B and Table 1). This observation can be partially attributed to ion exchange between protons of bridging hydroxyls Si-O(H)-Al groups and cobalt ions. Moreover, the Co5.0HAlBEA(II) sample shows an increase in the number of moderate (1610 cm−1) and strong (1450 cm−1) Lewis acid sites compared to the Co1.0HAlBEA(II) one.
The impregnation of SiBEA with the aqueous Co(NO3)2 solutions leads to the creation of Lewis acid sites of moderate and strong strength in CoxSiBEA(I) and CoxSiBEA(III) as indicated by the appearance of FTIR bands at 1610 and 1450 cm−1 (Figure 3B and Figure 4B) probably due to the binding of pyridine to isolated cobalt(II) species. The intensity of these bands increased with increasing of Co loading, and was higher in CoxSiBEA(I) than in CoxSiBEA(III). The latter observation can be linked to stronger cobalt incorporation in the samples of III-series than I-series. Consequently, the framework Co(II) species in CoxSiBEA(III) are more difficult to access for pyridine than in CoxSiBEA(I). This phenomenon was also proved by XRD and IR.
2.4.2. FTIR Study of Adsorbed CO
It was reported by Hadjiivanov and Vayssilov [] that FTIR spectroscopy of adsorbed CO is excellent for characterizing the acidity of various catalysts. In such a case, CO interacts at a low temperature (about −173 °C) with both Brønsted and Lewis acid sites, which triggers a shift in the CO vibrational band to higher wavenumbers with respect to the position of pseudo-liquid gas phase CO band (2143 cm−1). This shift reflects the nature and strength of the probed acid and redox sites.
The FTIR difference spectra obtained by subtracting the spectra recorded after and before CO exposure are shown in Figure 11 for HAlBEA, Co1.0HAlBEA(II), Co5.0HAlBEA(II) and in Figure 12 for SiBEA, Co1.0SiBEA(I), Co5.0SiBEA(I), Co1.0SiBEA(III), and Co5.0SiBEA(III). Due to H-bonding, adsorbed CO induces a broadening and a red shift of the OH bands. The higher the acidity of OH, the larger the shift of OH modes and the higher the frequency of carbonyl stretching []. The weak interaction between CO and OH requires testing at low temperatures.
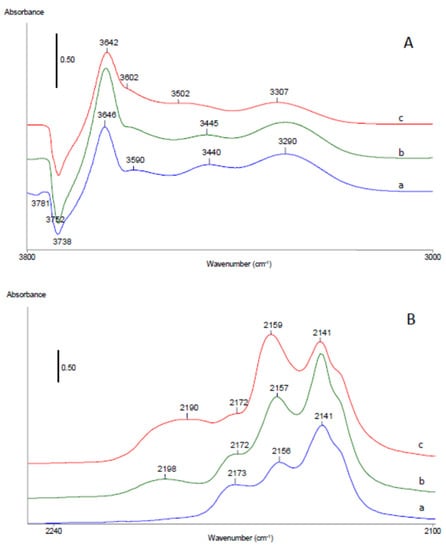
Figure 11.
FTIR difference spectra in hydroxyl (A) and carbonyl (B) stretching ranges of HAlBEA, Co1.0HAlBEA(II), and Co5.0HAlBEA(II) after adsorption of CO (equilibrium pressure 133 Pa) at −173 °C then evacuation to equilibrium CO pressure of 10 Pa.
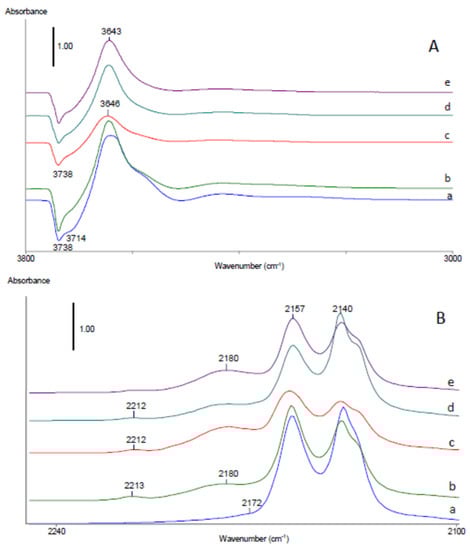
Figure 12.
FTIR difference spectra in hydroxyl (A) and carbonyl (B) stretching ranges of SiBEA, Co1.0SiBEA(I), Co5.0SiBEA(I), Co1.0SiBEA(III), and Co5.0SiBEA(III) after adsorption of CO (equilibrium pressure 133 Pa) at −173 °C then evacuation to equilibrium CO pressure of 10 Pa.
The differential spectra of HAlBEA, Co1.0HAlBEA(II), and Co5.0HAlBEA(II) samples reveal four positive bands at around of 3647–3642, 3598–3595, 3491–3442, and 3312–3292 cm−1 and five negative bands at 3783–3780, 3737–3740, 3716, 3673–3670, and 3617–3616 cm−1 (Figure 11A and Figure S5A). The observed shifts of 93 cm−1 from 3740 to 3647 cm−1 for isolated external SiO-H groups and 131 cm−1 from 3716 to 3585 cm−1 for terminal isolated SiO-H groups indicate that both silanol groups have weak acidic character. The positive bands at 3446 and 3292 cm−1 related to red shifted bands of perturbed AlO-H and Al-O(H)-Si groups suggest that both types of acidic hydroxyls groups occur in HAlBEA. A large red shift of the band related to bridged Al-O(H)-Si groups from 3616 cm−1 to 3292 cm−1 (324 cm−1) proves strong proton acidity of these groups. Moreover, the FTIR band at 3446 cm−1 seems to be related to perturbed extra-framework AlO-H groups (3670 cm−1) (shift of 224 cm−1) with moderate acidic character, in line with the previous work of Chakarowa and Hadjiivanov []. The negative hydroxyl bands in FTIR spectra after adsorption of CO at −173 °C indicate consumption of the hydroxyl groups in corresponding HAlBEA and SiBEA supports and Co-containing HAlBEA and Co-containing SiBEA zeolites.
The lower intensity of the positive bands at around of 3447–3491 and 3295–3308 cm−1 for Co1.0HAlBEA(II) and Co5.0HAlBEA(II) after adsorption of CO at −173 °C at equilibrium CO pressure of 10 Pa (Figure 11A) and after evacuation at −173 °C (Figure S5A) suggests that part of AlO-H and Al-O(H)-Si groups have been consumed by ion exchange with Co2+ ions during preparation procedure.
For siliceous SiBEA support and Co1.0SiBEA(I), Co5.0SiBEA(I), Co1.0SiBEA(III), and Co5.0SiBEA(III) catalysts, four positive IR bands appear at 3642–3646, 3589–3595, 3433–3429, and 3293–3301 cm−1 and two negative bands at 3738–3737 and 3700–3711 cm−1 after adsorption at equilibrium CO pressure of 133 Pa and evacuation to 10 Pa, FTIR measurement at equilibrium CO pressure of 10 Pa (Figure 12A). The intensity of the bands at 3642–3646 and 3589–3595 cm−1 is decreasing rapidly after evacuation at −173 °C, while the bands at 3737 and 3711 cm−1 are restored (Figure S6A). This observation together with small band shifts from 3737 to 3646 cm−1 (91 cm−1) for isolated internal SiO-H groups and from 3711 to 3595 cm−1 (116 cm−1) for terminal isolated SiO-H groups indicate that both silanol groups have a weak acidic character. The very low intensities of positive bands at 3433–3429 cm−1 and 3293–3301 cm−1 suggest a very low content of Al-OH and Al-O(H)-Si groups, respectively, in SiBEA support and Co1.0SiBEA(I), Co5.0SiBEA(I), Co1.0SiBEA(III), and Co5.0SiBEA(III) catalysts (Figure 12A and Figure S6A).
Figure 11B shows changes in the wavenumber range characteristic for carbonyls when CO is adsorbed on HAlBEA, Co1.0HAlBEA(II), and Co5.0HAlBEA(II). For convenience, the same set of spectra as that presented in Figure 11A is given.
FTIR differential spectra in carbonyl stretching range after adsorption of CO at −173 °C at equilibrium CO pressure of 10 Pa (Figure 11B) and after evacuation at −173 °C (Figure S5B) measured on HAlBEA show carbonyl bands at 2227, 2215, 2192, 2172, 2156, and 2140 cm−1 (Figure 11B). The band at 2140 cm−1 is assigned to weakly bonded physically adsorbed CO which disappears first upon outgassing (see Figure S5B). Next, the band at 2156 cm−1 disappears. This change occurs simultaneously with the change of band at 3647 cm−1, allowing the former band to be assigned to CO bonded to isolated internal silanol groups, as reported earlier []. Further outgassing of this sample causes the band at 2175 cm−1 to fade (Figure S5B, results not shown). It is typical for CO molecules to interact with bridging zeolite hydroxyls (Al-O(H)-Si) [,]. The carbonyl bands at 2195, 2216, and 2227 cm−1 have shown that the framework and extra-framework Al sites are present in HAlBEA, in agreement with previous reports []. These bands disappeared on the IR spectrum only during high evacuation suggesting strong interaction between CO and Al sites.
For adsorption of CO on Co1.0HAlBEA(II) and Co5.0HAlBEA(II), up to CO equilibrium, the main bands appear at 2202 and 2188–2189 cm−1 (Figure 11B), whereas they are not observed after CO adsorption on HAlBEA. Usually, the bands at these wavenumbers are assigned to Co2+-CO monocarbonyls [,,,,,]. However, the band at 2202 cm−1 is more likely assigned to Co3+-CO adducts, in agreement with earlier reports [,,,], while the band at 2188–2189 cm−1 is attributed to Co2+-CO monocarbonyls. Moreover, for both Co1.0HAlBEA(II) and Co5.0HAlBEA(II) samples after adsorption of CO up to CO equilibrium, the supplementary bands appeared at 2175 and 2165 cm−1. These two bands could be attributed to the interaction of CO with Al sites and bridging zeolite hydroxyls (Al-O(H)-Si), respectively, in agreement with previous reports []. The band at 2165 cm−1 disappeared simultaneously with the broad OH band at 3595 cm−1 (Figure S6B), suggesting that they are assigned to the formation of OH…CO complexes, in line with an earlier report []. The position of the band at 2165 cm−1, with respect to the bands characteristic of CO interacting with silanol groups (2150 cm−1) or with Brønsted acid sites in HAlBEA (2175 cm−1), points to relatively weak acidity of the corresponding OH groups. Upon further outgassing at higher dynamic vacuum the bands at 2230, 2203, and 2195 cm−1 occur (the results not shown) which could correspond to the interaction of CO with Lewis acid sites, Al3+, Co3+, and Co2+, respectively. CO adsorbed on these Al sites and cobalt species disappeared from the IR spectrum only upon high evacuation suggesting strong interaction between CO and these sites.
Figure 12B shows the changes in the wavenumber range characteristic for carbonyls when CO is adsorbed on SiBEA, Co1.0SiBEA(I), Co5.0SiBEA(I), Co1.0SiBEA(III), and Co5.0SiBEA(III). For convenience, the same set of spectra as that presented in Figure 12A is given. Two main carbonyl bands are detected at 2157 and 2139 cm−1 for SiBEA. The band at 2139 cm−1 assigned to weakly bonded physically adsorbed CO disappears first upon outgassing (Figure S6B). The band at 2157 cm−1 can be assigned to CO interacting with internal silanol groups of the vacant T-atom sites, which confirms that in SiBEA mainly silanol groups in the vacant T-atom sites are present. A very low intensity of the band at 2176 cm−1 occurred at CO equilibrium pressure of 10 Pa (Figure 12B) could be attributed to interaction of CO with bridging zeolite hydroxyls (Al-O(H)-Si) present as traces in SiBEA zeolite.
For Co1.0SiBEA(I), Co5.0SiBEA(I), Co1.0SiBEA(III), and Co5.0SiBEA(III) after adsorption of CO up to CO equilibrium pressure of 10 Pa the FTIR spectra exhibit five different bands in the carbonyl range at 2140, 2157, 2170, 2182, and 2213 cm−1 (Figure 12B). The band at 2140 cm−1 assigned to weakly bonded physically adsorbed CO disappears first upon outgassing (Figure S6B). The bands at 2157 and 2170 cm−1 are assigned to CO interacting with SiO-H group and bridged Si-O(H)-Al, respectively, in agreement with an earlier report []. The latter appeared due to small traces of framework aluminum remaining in SiBEA matrix after treatment of parent TEABEA zeolite with nitric acid in the first step of the preparation procedure. The bands at 2213 and 2182 cm−1 observed after adsorption of CO on Co1.0SiBEA(I), Co5.0SiBEA(I), Co1.0SiBEA(III), and Co5.0SiBEA(III) but not observed after adsorption of CO on SiBEA, are therefore attributed to Con+-CO adducts. These bands are assigned to two types of monocarbonyl species formed after CO adsorption on the cobalt species, in line with earlier reports [,]. As shown in Figure 10B, the former cobalt species occur in much higher concentration than that corresponding to the band at 2213 cm−1. Usually, the bands located at these frequencies are assigned to Co2+-CO monocarbonyls, in line with previous reports [,]. However, as shown by Sushkevich et al. [], the band at 2213 cm−1 is more likely assigned to Co3+-CO adducts, while the much more intense band at 2182 cm−1 is attributed to Co2+-CO monocarbonyls. It seems to confirm that the framework Co(II) species are mainly present in Co1.0SiBEA(I), Co5.0SiBEA(I), Co1.0SiBEA(III), and Co5.0SiBEA(III) samples, although a very small amount of extra-framework Co(III) species is also present as evidenced by the bands at 2182 and 2213 cm−1 (Figure 12B and Figure S6B).
3. Materials and Methods
3.1. Catalysts Preparation
Two series of zeolite catalysts were obtained by a two-step postsynthesis method as previously described by Dzwigaj et al. [,]. Firstly, the tetraethylammonium BEA zeolite (Si/Al = 19) was treated with nitric acid solution at 80 °C for 4 h to create vacant T-atom sites. Then, the 2 g of as obtained dealuminated SiBEA zeolite (Si/Al = 1000) was added into excessive amounts of aqueous solutions of cobalt(II) nitrate. Two series of BEA catalysts were received: CoxSiBEA(I) (pH = 2.5) and CoxSiBEA(III) (pH = 3.0–9.0). The pH value of CoxSiBEA(III) was controlled by adding drops of ammonia solution. By changing the concentration of the Co(NO3)2 solution from 1.7 × 10⁻³ to 15.3 × 10⁻³ mol L−1, the CoxSiBEA(I) and CoxSiBEA(III) series with 1, 2, 3, 5, and 9 Co wt.% were prepared. An amount of 200 mL of the suspensions were stirred for 24 h at room temperature with continuous measurement of the pH. It is very important to mention that just after addition of 2 g of SiBEA into aqueous solutions of Co(NO)3 at pH 9.0, the pH of suspensions decreased strongly up to pH 3.0 and to obtain the final pH of 9.0, some drops of concentrated ammonia solution was added. Then the solids were separated in a rotary evaporator under vacuum at 70 °C for 2 h. The samples are labelled as CoxSiBEA(I) and CoxSiBEA(III), where x stands for the Co wt.%. Due to the low concentration of Co(NO3)2·6 H2O (~10−3 mol L−1) at pH−2.5 and 3.0–9.0 the aqueous nitrate cobalt solution is expected to contain mainly mononuclear Co2+ ions [] and allows the incorporation of Co ions into the zeolite matrix as pseudo-tetrahedral Co(II) framework species [,,,,,].
The third series of samples labelled CoxHAlBEA(II) was prepared by a conventional wet impregnation of the parent HAlBEA (Si/Al = 19) zeolite with aqueous solutions of Co(NO3)2·6 H2O at pH of 3.0. The concentration of the Co(NO3)2 solution was varied in the same range as the previous series to obtain CoxHAlBEA(II) samples with 1, 2, 3, 5, and 9 Co wt.%. Additionally, the processes of stirring and separating the solids were the same as described above. The samples are labelled as CoxHAlBEA(II), where x stands for the Co wt.%. In view of the fact that there is only small amount of vacant T-atom sites in the parent HAlBEA zeolite [], the preparation procedure applied to the CoxHAlBEA(II) series should mainly lead to the formation of extra-framework octahedral Co(II) species []. The diagram of each catalyst preparation is shown in Figure 13.
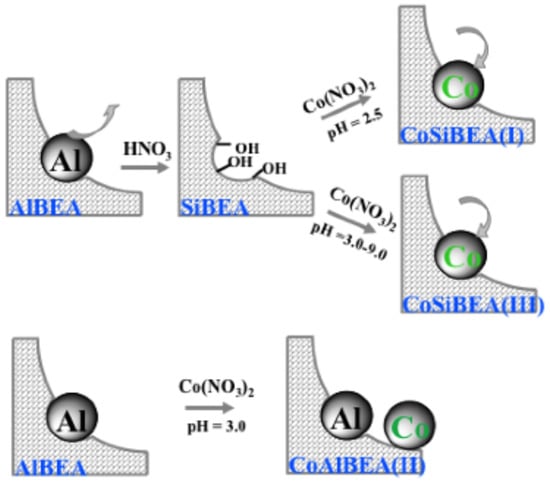
Figure 13.
Diagram of each catalyst preparation.
As prepared (AP) CoxSiBEA(I), CoxHAlBEA(II), and CoxSiBEA(III) series were then calcined at 500 °C (100 °C h−1) for 3 h in static air and named as CoxSiBEA(I), CoxHAlBEA(II), and CoxSiBEA(III) series.
3.2. Catalysts Characterization
The specific surface area and pore volume of tested materials were measured at 77 K by N2 adsorption–desorption isotherms on a Micromeritics ASAP 2020 V3.05 G equipment. Before measurements, the samples were heated under vacuum at 350 °C for 2 h.
The chemical composition of the samples was evaluated by X-ray fluorescence (XRF) spectroscopy performed with a SPECTRO X-LabPro apparatus.
The XRD studies have been conducted on a PANalytical X’Pert Pro diffractometer using Cu Kα radiation (λ = 154.05 pm) within the 2θ angle range of 5–90°.
Analysis of acidic properties was performed using infrared spectroscopy after adsorption of CO and pyridine as probe molecules. Before analysis, all samples were pressed at ~1 tons cm−2 into thin wafers of ca. 10 mg cm−2 and placed inside the IR cell. In the case of CO adsorption experiments, the wafers were calcined at 450 °C for 2 h in flowing 2.5% O2/Ar and then outgassed at 300 °C (10−3 Pa) for 1 h. Then, the samples were cooled down to about −173 °C and increasing doses of CO were introduced up to an equilibrium pressure of 133 Pa. The infrared spectra were recorded using a Bruker Vertex 70 spectrometer (resolution of 2 cm−1, 128 scans). The differential spectra presented in this paper are the result of subtracting the spectra recorded after CO exposures and the spectrum recorded after calcination. When necessary, the gas-phase CO contribution was removed by subtraction of the gas-phase spectrum.
For the pyridine measurements, the FTIR spectra of the studied samples were recorded on a Bruker Vector 22 spectrometer equipped with a DTGS detector (resolution of 2 cm−1, 128 scans). The samples (about 20 mg) were pressed at ~1 ton cm−2 into thin wafers of c.a. 10 mg cm−2 by using a hydraulic press before inserting into the IR cell. Then, the wafers were calcined at 450 °C for 3 h in O2 (100 Torr) and outgassed at 300 °C (10−3 Pa) for 1 h. The wafers prepared in this way were contacted at room temperature with gaseous pyridine (1 Torr). After evacuation of pyridine (150 °C, 1 h) FTIR spectra were recorded at room temperature in the range of 4000–400 cm−1.
Solid state magic angle spinning nuclear magnetic resonance (MAS NMR) experiments were performed on a Bruker AVANCE500 spectrometer at 11.7 T. The resonance frequencies of 1H, 27Al, and 29Si were 500.16, 130.33, and 99.4 MHz, respectively. The chemical shifts (δ) were reported relative to TMS and aqueous Al(NO3)3 1 N solution. The spectra of 1H and 27Al were acquired at a spinning rate of νRot = 12 kHz in 4 mm zirconia rotors. The 1H MAS NMR spectra were registered with a 90° pulse duration of 2.5 μs, a recycle delay of 5 s and 16 accumulations. The 27Al MAS NMR spectra were recorded by the small-flip-angle technique with a pulse of 0.9 μs (π/8), 0.5 s for the recycle delay and 2048 accumulations. The 29Si MAS NMR and 1H-29Si cross polarization (CP) MAS NMR were performed with a 5 mm zirconia rotor at 5 kHz spinning speed, 2 μs excitation pulse and 10 s recycle delay. Furthermore, 3-(trimethylsilyl)-1-propanosulfonic sodium salt was used for setting the Hartmann-Hahn conditions. The proton π/2 pulse duration, the contact time and recycle delay were 3 μs, 5 ms and 5 s, respectively.
The X-ray Photoelectron Spectroscopy (XPS) studies were performed in UHV system equipped with a hemispherical analyzer made by Gammadata Scienta (SES R4000). The X-ray source was a dual Al/Mg lamp emitting non-monochromatic radiation Al Kα (1486.6 eV) at 180 W (12 kV, 15 mA). Calibration of the spectrometer was carried out according to the ISO 15472:2001 procedure. The energy resolution of the measurements was determined from the Ag 3d5/2 line as close to 0.9 eV (pass energy of 100 eV). The survey scans were collected at an analyzer pass energy of 200 eV (with 0.25 eV step), whereas the high-resolution spectra were registered at pass energy of 100 eV (with 25 meV step). During the experiments, a base pressure in the analysis chamber did not exceed 5 × 10⁻⁹ mbar. The area of sample analysis was about 3 mm2. The obtained spectroscopic data were fitted in CasaXPS 2.3.23 software with a pseudo-Voigt profile (70:30) after subtraction of the Shirley-type background. The relative intensity ratio of Co 2p3/2 and Co 2p1/2 lines was fixed to 2:1. All binding energy (BE) values were charge-corrected to the hydrocarbon contamination (C-C bonds in C 1s peak), which was set at 285.0 eV.
Hydrogen temperature-programmed reduction (H2-TPR) studies were performed in a quartz reactor. The samples containing cobalt (0.09 g) were reduced from 30 to 970 °C (10 °C min−1) in a H2-Ar (5%/95%, 30 mL min−1) flow. The quantitative consumption of H2 was registered by a Gow-Mac thermal conductivity detector (TCD).
4. Conclusions
Two series of CoxSiBEA(I) and CoxSiBEA(III) zeolite catalysts prepared by the two-step postsynthesis method at pH = 2.5 and pH = 3.0–9.0, respectively, allowed to incorporate the cobalt into SiBEA zeolite as isolated framework pseudo-tetrahedral Co(II) species. The incorporation of Co ions into vacant T-atom sites as a result of their reaction with silanol groups have been evidenced by NMR and FTIR with pyridine and CO as molecule probes.
FTIR studies with pyridine and CO as probe molecules confirmed formation of acidic Lewis sites in the absence of Brønsted centers in two series of CoxSiBEA(I) and CoxSiBEA(III) zeolite catalysts.
The local environment of cobalt in AP-CoxSiBEA(I), AP-CoxSiBEA(III), CoxSiBEA(I), and CoxSiBEA(III) zeolite catalysts has been determined by DR UV-vis, XPS and FTIR with CO adsorption.
DR UV-vis allowed to show that for low Co content (<2 wt.%) the cobalt is present as framework pseudo-tetrahedral Co(II) for two series of CoxSiBEA(I) and CoxSiBEA(III) zeolite catalysts. For higher Co content (>2 wt.%) both framework pseudo-tetrahedral and extra-framework octahedral Co(II) species have been evidenced.
FTIR with CO adsorption showed that mostly framework pseudo-tetrahedral Co(II) species are present in Co1.0SiBEA(I), Co5.0SiBEA(I), Co1.0SiBEA(III), and Co5.0SiBEA(III) with a very small amount of extra-framework Co(III) species evidenced by the bands at 2182 and 2213 cm−1.
Supplementary Materials
The following supporting information can be downloaded at: https://www.mdpi.com/article/10.3390/catal12121644/s1, Figure S1: 27Al MAS NMR of HAlBEA, SiBEA, Co1.0SiBEA(I), Co2.0SiBEA(I) Co1.0SiBEA(III) and Co5.0SiBEA(III); Figure S2: 1H MAS NMR of HAlBEA, SiBEA, Co1.0SiBEA(I), Co2.0SiBEA(I), Co1.0SiBEA(III) and Co5.0SiBEA(III); Figure S3: 29Si MAS NMR of HAlBEA, SiBEA, Co1.0SiBEA(I), Co2.0SiBEA(I), Co1.0SiBEA(III) and Co5.0SiBEA(III); Figure S4: 1H-29Si CP MAS NMR of SiBEA, Co1.0SiBEA(III) and Co5.0SiBEA(III); Figure S5: FTIR difference spectra in hydroxyl (A) and carbonyl (B) stretching range of HAlBEA (a), Co1.0HAlBEA(II) (b) and Co5.0HAlBEA(II) (c) after CO adsorption at 173 °C with equilibrium pressure 133 Pa of CO and secondary vacuum evacuation for 5 min (pressure < 5 × 10⁻² Pa); Figure S6: FTIR difference spectra in hydroxyl (A) and carbonyl (B) stretching range of SiBEA (a), Co1.0SiBEA(I) (b), Co5.0SiBEA(I) (c), Co1.0SiBEA(III) (d) and Co5.0SiBEA(III) (e) after CO adsorption at 173°C with equilibrium pressure 133 Pa of CO and secondary vacuum evacuation for 5 min (pressure < 5 × 10⁻² Pa); Table S1: XPS O 1s data of catalysts with pH = 2.5 (upper part) and pH = 9 (lower part).
Author Contributions
R.S.: Investigation, Methodology, DR UV-vis; K.C.-S.: Investigation, TPR; J.-M.K.: Investigation, IR-CO; Y.M.: Investigation, Methodology: NMR; L.V.: Investigation, Methodology: IR; S.C.: Methodology; J.G.: Writing, Investigation, Methodology: XPS; S.D.: Conceptualization, Writing, Supervision. All authors have read and agreed to the published version of the manuscript.
Funding
This research received no external funding.
Data Availability Statement
Data available upon request due to restrictions, e.g., privacy or ethical. The data presented in this study are available upon request from the corresponding author. The data are not publicly available due to privacy reasons.
Acknowledgments
We gratefully acknowledge Saremblé Koné-Guira from Laboratoire Réactivité de Surface, UMR 7197 CNRS-Sorbonne Universite for TPR measurement.
Conflicts of Interest
The authors declare no conflict of interest.
References
- Chen, S.; Chang, X.; Sun, G.; Zhang, T.; Xu, Y.; Wang, Y.; Pei, C.; Gong, J. Propane dehydrogenation: Catalyst development, new chemistry, and emerging technologies. Chem. Soc. Rev. 2021, 50, 3315–3354. [Google Scholar] [CrossRef] [PubMed]
- Iglesias-Juez, A.; Beale, A.M.; Maaijen, K.; Weng, T.C.; Glatzel, P.; Weckhuysen, B.M. A combined in situ time-resolved UV–Vis, Raman and high-energy resolution X-ray absorption spectroscopy study on the deactivation behavior of Pt and PtSn propane dehydrogenation catalysts under industrial reaction conditions. J. Catal. 2010, 276, 268–279. [Google Scholar] [CrossRef]
- Grant, J.T.; Venegas, J.M.; McDermott, W.P.; Hermans, I. Aerobic oxidations of light alkanes over solid metal oxide catalysts. Chem. Rev. 2018, 118, 2769–2815. [Google Scholar] [CrossRef] [PubMed]
- Mars, P.; Van Krevelen, D.W. Oxidations carried out by means of vanadium oxide catalysts. Eng. Sci. 1954, 3, 41–57. [Google Scholar] [CrossRef]
- Santoro, S.; Kozhushkov, S.L.; Ackermann, I.; Vaccaro, L. Heterogeneous Catalytic Approches in C-H Activation Reactions. Green Chem. 2016, 18, 3471–3493. [Google Scholar] [CrossRef]
- Santen, R.A.V.; Neurock, M.; Shetty, S.G. Reactivity theory of transition-metal surfaces: A Bronsted-Evans-Polanyi linear activation energy-free-energy analysis. Chem. Rev. 2010, 110, 2005–2048. [Google Scholar] [CrossRef] [PubMed]
- Vesborg, P.C.K.; Jaramillo, T.F.; Adressing the Terawatt Challenge. Scalability in the supply of chemical elements for renewable energy. RSC Adv. 2012, 2, 7933–7947. [Google Scholar] [CrossRef]
- Xie, J.; Kammert, J.D.; Keylor, N.; Zheng, J.W.; Choi, E.; Pham, H.N.; Sang, X.; Stavitski, E.; Attenkofer, K.; Unocic, R.R.; et al. Atomically dispersed Co and Cu on N-doped carbon for reactions involving C-H activation. ACS Catal. 2018, 8, 3875–3884. [Google Scholar] [CrossRef]
- Dzwigaj, S.; Che, M. Incorporation of Co(II) in Dealuminated BEA Zeolite at Lattice Tetrahedral Sites Evidenced by XRD, FTIR, Diffuse Reflectance UV−Vis, EPR, and TPR. J. Phys. Chem. B 2006, 110, 12490–12493. [Google Scholar] [CrossRef]
- Chalupka, K.A.; Jozwiak, W.K.; Rynkowski, J.; Maniukiewicz, W.; Casale, S.; Dzwigaj, S. Partial oxidation of methane on NixAlBEA and NixSiBEA zeolite catalysts: Remarkable effect of preparation procedure and Ni content. Appl. Catal. B 2014, 146, 227–236. [Google Scholar] [CrossRef]
- Bourgeat-Lami, E.; Fajula, F.; Anglerat, D.; des Courieres, T. Single step dealumination of zeolite beta precursors for the preparation of hydrophobic adsorbents. Microporous Mater. 1993, 1, 237–245. [Google Scholar] [CrossRef]
- Janin, A.; Maache, M.; Lavalley, J.-C.; Joly, J.F.; Raatz, F.; Szydlowski, N. FTIR study of the silanol groups in dealuminated HY zeolites: Nature of the extraframework debris. Zeolites 1991, 11, 391–396. [Google Scholar] [CrossRef]
- Jentys, A.; Pham, N.H.; Vinek, H.J. Nature of hydroxy groups in MCM-41. Chem. Soc. Faraday Trans. 1996, 92, 3287–3291. [Google Scholar] [CrossRef]
- Dzwigaj, S.; Matsuoka, M.; Franck, R.; Anpo, M.; Che, M. Probing different kinds of vanadium species in the VSiß zeolite by diffuse reflectance UV-Visible and photoluminescence spectroscopies. J. Phys. Chem. B 1998, 102, 6309–6312. [Google Scholar] [CrossRef]
- Ivanova, E.; Hadjiivanov, K.; Dzwigaj, S.; Che, M. FT-IR study of CO and NO adsorption on a VSiBEA zeolite. Microporous Mesoporous Mater. 2006, 89, 69–77. [Google Scholar] [CrossRef]
- Dzwigaj, S.; Matsuoka, M.; Franck, R.; Anpo, M.; Che, M. Evidence of three kinds of tetrahedral vanadium (V) species in VSiß zeolite by diffuse reflectance UV-visible and photoluminescence spectroscopies. J. Phys. Chem. B 2000, 104, 6012–6020. [Google Scholar] [CrossRef]
- Emeis, C.A. Determination of Integrated Molar Extinction Coefficients for Infrared Absorption Bands of Pyridine Adsorbed on Solid Acid Catalysts. J. Catal. 1993, 141, 34. [Google Scholar] [CrossRef]
- Jiao, L.; Regalbuto, J.R. The synthesis of highly dispersed noble and base metals on silica via strong electrostatic adsorption: II. Mesoporous silica SBA15. J. Catal. 2008, 260, 342–350. [Google Scholar] [CrossRef]
- Hajjar, R.; Millot, Y.; Man, P.P.; Che, M.; Dzwigaj, S. Transform Infrared spectroscopy, NMR techniques and V probe. J. Phys. Chem. C 2008, 112, 20167–20175. [Google Scholar] [CrossRef]
- Baran, R.; Millot, Y.; Onfroy, T.; Krafft, J.M.; Dzwigaj, S. Influence of the nitric acid treatment on Al removal, framework composition and acidity of BEA zeolite investigated by XRD, FTIR and NMR. Microporous Mesoporous Mater. 2012, 163, 122–130. [Google Scholar] [CrossRef]
- Bakhmutov, V.I. Strategies for solid-state NMR studies of materials: From diamagnetic to paramagnetic porous solids. Chem. Rev. 2011, 111, 530–562. [Google Scholar] [CrossRef] [PubMed]
- Pintacuda, G.; Kervern, G. Paramagnetic solid-state magic-angle spinning NMR Spectroscopy. Top. Curr. Chem. 2013, 335, 157–200. [Google Scholar] [PubMed]
- Pell, A.; Pintacula, G.; Grey, C. Paramagnetic NMR in solution and the solid state. Prog. Nucl. Magn. Reson. Spectrosc. 2019, 111, 1–271. [Google Scholar] [CrossRef]
- Thomson, S.; Luca, V.; Howe, R.F. Framework Co(II) in CoAPO-5. Phys. Chem. Chem. Phys. 1999, 1, 615–619. [Google Scholar] [CrossRef]
- Eldewik, A.; Howe, R.F. Cobalt substitution in ETS-10. Microporous Mesoporous Mater. 2001, 48, 65–71. [Google Scholar] [CrossRef]
- Weckhuysen, B.M.; Verberckmoes, A.A.; Uytterhoeven, M.G.; Mabbs, F.E.; Collison, D.; de Boer, E.; Schoonheydt, R.A. Electron Spin Resonance of High-Spin Cobalt in Microporous Crystalline Cobalt-Containing Aluminophosphates. J. Phys. Chem. B 2000, 104, 37–42. [Google Scholar] [CrossRef]
- da Cruz, R.; Mascarenhas, A.; Andrade, H. Co-ZSM-5 catalysts for N2O decomposition. Appl. Catal. B 1998, 18, 223–231. [Google Scholar] [CrossRef]
- Mhamdi, M.; Marceau, E.; Khaddar-Zine, S.; Ghorbel, A.; Che, M.; Ben Taarit, Y.; Villain, F. Preparation of Co2+/ZSM5 Catalysts by Solid-State Reaction: Influence of the Precursor on Cobalt Speciation. Z. Phys. Chem. 2005, 219, 963–978. [Google Scholar] [CrossRef]
- Janas, J.; Machej, T.; Gurgul, J.; Socha, R.P.; Che, M.; Dzwigaj, S. Effect of Co content on the catalytic activity of CoSiBEA zeolite in the selective catalytic reduction of NO with ethanol: Nature of the cobalt species. Appl. Catal. B 2007, 75, 239–248. [Google Scholar] [CrossRef]
- Boroń, P.; Chmielarz, L.; Gurgul, J.; Łątka, K.; Shishido, T.; Krafft, J.-M.; Dzwigaj, S. BEA zeolite modified with iron as effective catalyst for N2O decomposition and selective reduction of NO with ammonia. Appl. Catal. B 2013, 138–139, 434–445. [Google Scholar] [CrossRef]
- Boroń, P.; Chmielarz, L.; Gurgul, J.; Łątka, K.; Gil, B.; Krafft, J.-M.; Dzwigaj, S. The influence of the preparation procedures on the catalytic activity of Fe-BEA zeolites in SCR of NO with ammonia and N2O decomposition. Catal. Today 2014, 235, 210–225. [Google Scholar] [CrossRef]
- Kocemba, I.; Rynkowski, J.; Gurgul, J.; Socha, R.P.; Łątka, K.; Krafft, J.-M.; Dzwigaj, S. Nature of the active sites in CO oxidation on FeSiBEA zeolites. Appl. Catal. A 2016, 519, 16–26. [Google Scholar] [CrossRef]
- Kumar, M.S.; Schwidder, M.; Grünert, W.; Bentrup, U.; Brückner, A. Selective reduction of NO with Fe-ZSM-5 catalysts of low Fe content: Part II. Assessing the function of different Fe sites by spectroscopic in situ studies. J. Catal. 2006, 239, 173–186. [Google Scholar]
- Arishtirova, K.; Kovacheva, P.; Predoeva, A. Activity and basicity of BaO modified zeolite and zeolite-type catalysts. Appl. Catal. A 2003, 243, 191–196. [Google Scholar] [CrossRef]
- Kovacheva, P.; Arishtirova, K.; Predoeva, A. Basic zeolite and zeolite-type catalysts for the oxidation methylation of toluene with methane. React. Kin. Catal. Lett. 2003, 79, 149–155. [Google Scholar] [CrossRef]
- Oleksenko, L.P. Characteristics of active site formation in Co-containing catalysts for CO oxidation on chemically different supports. Theor. Exp. Chem. 2004, 40, 331–336. [Google Scholar] [CrossRef]
- Grünert, W.; Schlögl, R. Photoelectron Spectroscopy of Zeolites. Mol. Sieves 2004, 4, 467–515. [Google Scholar]
- Cabrera-German, D.; Gomez-Sosa, G.; Herrera-Gomez, A. Accurate peak fitting and subsequent quantitative composition analysis of the spectrum of Co 2p obtained with Al Kα radiation: I: Cobalt spinel. Surf. Interface Anal. 2016, 48, 252–256. [Google Scholar] [CrossRef]
- Martinez-Gil, M.; Cabrera-German, D.; Pintor-Monroy, M.I.; Garcia-Velenzuela, J.A.; Cota-Leal, M.; De la Cruz, W.; Quevedo-Lopez, M.A.; Perez-Salas, R.; Sotelo-Lerma, M. Effect of annealing temperature on the thermal transformation to cobalt oxide of thin films obtained via chemical solution deposition. Mater. Sci. Semicond. Process. 2020, 107, 104825. [Google Scholar] [CrossRef]
- Chuang, T.J.; Brundle, C.R.; Rice, D.W. Interpretation of the X-ray photoemission spectra of cobalt oxides and cobalt oxide surfaces. Surf. Sci. 1976, 59, 413–429. [Google Scholar] [CrossRef]
- McIntyre, N.S.; Cook, M.G. X-ray photoelectron studies on some oxides and hydroxides of cobalt, nickel, and copper. Anal. Chem. 1975, 47, 2208–2213. [Google Scholar] [CrossRef]
- Weidler, N.; Paulus, S.; Schuch, J.; Klett, J.; Hoch, S.; Stenner, P.; Maljusch, A.; Brötz, J.; Wittich, C.; Kaiser, B.; et al. CoOx thin film deposited by CVD as efficient water oxidation catalyst: Change of oxidation state in XPS and its correlation to electrochemical activity. Phys. Chem. Chem. Phys. 2016, 18, 10708–10718. [Google Scholar] [CrossRef]
- Kochur, A.G.; Kozakov, A.T.; Googlev, K.A.; Kubrin, S.P.; Nikolskii, A.V.; Torgashev, V.I.; Bush, A.A.; Shkuratov, V.Y.; Shevtsova, S.I. Valence state of transition metal ions in Co1−xFexCr2O4 (x = 0.1, 0.2, 0.5) ceramics from X-ray photoelectron and Mössbauer spectroscopy data. J. Alloys Compd. 2015, 636, 241–248. [Google Scholar] [CrossRef]
- Vaz, C.A.F.; Prabhakaran, D.; Altman, E.I.; Henrich, V.E. Experimental study of the interfacial cobalt oxide in Co3O4/α−Al2O3(0001) epitaxial films. Phys. Rev. B 2009, 80, 155457. [Google Scholar] [CrossRef]
- Boroń, P.; Chmielarz, L.; Casale, S.; Calers, C.; Krafft, J.-M.; Dzwigaj, S. Effect of Co content on the catalytic activity of CoSiBEA zeolites in N2O decomposition and SCR of NO with ammonia. Catal. Today 2015, 258, 507–517. [Google Scholar] [CrossRef]
- Xie, P.; Luo, Y.; Ma, Z.; Wang, L.; Huang, C.; Yue, Y.; Hua, W.; Gao, Z. CoZSM-11 catalysts for N2O decomposition: Effect of preparation methods and nature of active sites. Appl. Catal. B 2015, 170–171, 34–42. [Google Scholar] [CrossRef]
- Boix, A.; Fierro, J.L.G. X-ray photoelectron spectroscopy analysis of platinum- and/or cobalt-loaded zeolites relevant for selective catalytic reduction of NOx. Surf. Interface Anal. 1999, 27, 1107–1113. [Google Scholar] [CrossRef]
- Chupin, C.; Van Veen, A.C.; Konduru, M.; Despres, J.; Mirodatos, C. Identity and location of active species for NO reduction by CH4 over Co-ZSM-5. J. Catal. 2006, 241, 103–114. [Google Scholar] [CrossRef]
- Hadjiivanov, K.; Vayssilov, G. Characterization of oxide surfaces and zeolites by carbon monoxide as an IR probe molecule. Adv. Catal. 2002, 47, 307–511. [Google Scholar]
- Chakarowa, K.; Hadjiivanov, K. H-Bonding of Zeolite Hydroxyls with Weak Bases: FTIR Study of CO and N2 Adsorption on HD-ZSM-5. J. Phys. Chem. 2011, 115, 4806–4817. [Google Scholar]
- Dzwigaj, S.; Ivanova, E.; Kefirov, R.; Hadjiivanov, K.; Averseng, F.; Krafft, J.M.; Che, M. Remarkable effect of the preparation method on the state of vanadium in BEA zeolite: Lattice and extra-lattice V species. Catal. Today 2009, 142, 185–191. [Google Scholar] [CrossRef]
- Hadjiivanov, K.; Tsyntsarski, B.; Venkov, T.; Daturi, M.; Saussey, J.; Lavalley, J.C. New types of polycarbonyls of Co+ formed after interaction of CO with Co–ZSM-5: An FTIR spectroscopic study. Phys. Chem. Chem. Phys. 2003, 5, 243–245. [Google Scholar] [CrossRef]
- Hadjiivanov, K.; Mihaylov, M. Redox couples in the selective catalytic reduction of NOx with hydrocarbons over Co–ZSM-5 and Ni–ZSM-5 catalysts: An FT-IR study. Chem. Commun. 2004, 2131–2241. [Google Scholar]
- Djonev, B.; Tsyntsarski, B.; Klissurski, D.; Hadjiivanov, K. IR spectroscopic study of NOx adsorption and NOx–O2 coadsorption on Co2+/SiO2 catalysts. J. Chem. Soc. Faraday Trans. 1997, 93, 4055–4063. [Google Scholar] [CrossRef]
- Campa, M.; de Rossi, S.; Ferraris, G.; Indovina, V. Catalytic activity of Co-ZSM-5 for the abatement of NOx with methane in the presence of oxygen. Appl. Catal. B 1996, 8, 315–331. [Google Scholar] [CrossRef]
- Rakic, V.; Hercigonja, R.; Dondur, V. CO interaction with zeolites studied by TPD and FTIR: Transition-metal ion-exchanged FAU-type zeolites. Microporous Mesoporous Mater. 1999, 27, 27–39. [Google Scholar] [CrossRef]
- Marchese, L.; Gianotti, E.; Palella, B.; Pirone, R.; Martra, G.; Coluccia, S.; Ciambelli, P. Spectroscopic and catalytic investigation of the NO reactivity on CoAPOs with chabasite-like structure. Stud. Surf. Sci. Catal. 2000, 130, 3309–3310. [Google Scholar]
- Busca, G.; Riccardo, G.; Lorenzelli, V. Fourier-transform infrared study of the surface properties of cobalt oxides. J. Chem. Soc. Faraday Trans. 1990, 86, 989–994. [Google Scholar] [CrossRef]
- Gonzalez-Tejuga, L.; Rochester, C.H.; Fierro, J.L.G.; Tascon, J.M.D. Infrared spectroscopic study of the adsorption of pyridine, carbon monoxide and carbon dioxide on the perovskite-type oxides LaMO3. J. Chem. Soc. Faraday Trans. 1984, 80, 1089–1099. [Google Scholar] [CrossRef]
- Busca, G.; Trifiro, F.; Vaccari, A. Characterization and catalytic activity of cobalt-chromium mixed oxides. Langmuir 1990, 6, 1440–1447. [Google Scholar] [CrossRef]
- Pietrogiacomi, D.; Tuti, S.; Campa, M.C.; Indovina, V. Cobalt supported on ZrO2: Catalysts characterization and their activity for the reduction of NO with C3H6 in the presence of excess O2. Appl. Catal. B 2000, 28, 43–54. [Google Scholar] [CrossRef]
- Sushkevich, V.L.; Vimont, A.; Travert, A.; Ivanova, I.I. C–C Coupling Catalyzed by Zeolites: Is Enolization the Only Possible Pathway for Aldol Condensation? J. Phys. Chem. C 2016, 110, 17633–17639. [Google Scholar]
- Mihaylova, A.; Hadjiivanov, K.; Dzwigaj, S.; Che, M. Remarkable effect of the preparation technique on the state of cobalt ions in BEA zeolites evidenced by FTIR spectroscopy of adsorbed CO and NO, TPR and XRD. J. Phys. Chem. B 2006, 110, 19530–19536. [Google Scholar] [CrossRef] [PubMed]
- Dzwigaj, S.; Peltre, M.J.; Massiani, P.; Davidson, A.; Che, M.; Sen, T.; Sivasanker, S. Incorporation of vanadium species in a dealuminated ß zeolite. Chem. Commun. 1998, 87–88. [Google Scholar] [CrossRef]
- Dzwigaj, S.; Massiani, P.; Davidson, A.; Che, M. Role of silanol groups in the incorporation of V in ß zeolite. J. Mol. Catal. 2000, 155, 169–182. [Google Scholar] [CrossRef]
- Baes, C.F., Jr.; Mesmer, R.E. The Hydrolysis of Cations; Reprint Edition; Krieger Publishing Company: Malabar, FL, USA, 1986; p. 210. [Google Scholar]
- Baran, R.; Onfroy, T.; Casale, S.; Dzwigaj, S. Introduction of Co into vacant T-atom sites of SiBEA zeolite as isolated mononuclear Co species. J. Phys. Chem. C 2014, 118, 20445–20451. [Google Scholar] [CrossRef]
- Baran, R.; Krafft, J.M.; Onfroy, T.; Grzybek, T.; Dzwigaj, S. Influence of the nature and environment of cobalt on the catalytic activity of Co-BEA zeolites in selective catalytic reduction of NO with ammonia. Microporous Mesoporous Mater. 2016, 225, 515–523. [Google Scholar] [CrossRef]
Publisher’s Note: MDPI stays neutral with regard to jurisdictional claims in published maps and institutional affiliations. |
© 2022 by the authors. Licensee MDPI, Basel, Switzerland. This article is an open access article distributed under the terms and conditions of the Creative Commons Attribution (CC BY) license (https://creativecommons.org/licenses/by/4.0/).