Article

Arbutin Stabilized Silver Nanoparticles: Synthesis, Characterization, and Its Catalytic Activity against Different Organic Dyes

by
Umar Farooq
1,
Shahina Akter
2,
Ahmad Kaleem Qureshi
3,
Hayaa M. Alhuthali
4,
Mazen Almehmadi
4,*,
Mamdouh Allahyani
4,
Ahad Amer Alsaiari
4,
Abdulelah Aljuaid
4,
Maisha Farzana
5,
Abdulfattah Yahya M. Alhazmi
6 and
Muhammad Shahab
7,*
1
Department of Chemistry, The Islamia University of Bahawalpur, Baghdad-ul-Jadeed Campus, Bahawalpur 63100, Pakistan
2
Bangladesh Council of Scientific and Industrial Research, Dhaka 1205, Bangladesh
3
Department of Chemistry, University of Sahiwal, Sahiwal 57000, Pakistan
4
Department of Clinical Laboratory Sciences, College of Applied Medical Sciences, Taif University, P.O. Box 11099, Taif 21944, Saudi Arabia
5
Department of Chemistry, University of New Brunswick, Fredericton, NB E3B 5A3, Canada
6
Clinical Pharmacy Department, Umm Al-Qura University, Makkah 24382, Saudi Arabia
7
State Key Laboratories of Chemical Resources Engineering, Beijing University of Chemical Technology, Beijing 100029, China
*
Authors to whom correspondence should be addressed.
Catalysts 2022, 12(12), 1602; https://doi.org/10.3390/catal12121602
Submission received: 27 October 2022 / Revised: 1 December 2022 / Accepted: 2 December 2022 / Published: 7 December 2022
(This article belongs to the Section Nanostructured Catalysts)

Abstract

:
In this study, we report one-pot, single step synthesis of silver nanoparticles stabilized by using arbutin. The concentration of reducing agent (NaBH4) used in the preparation was kept at double, and arbutin was used as a stabilizing agent. The confirmation of prepared silver nanoparticles was done by color change and UV-Vis surface plasmon resonance peak at 435 nm in UV-Vis spectrum. Size dispersion of nanoparticles was carried out by Dynamic Light Scattering (DLS) and surface charge on nanoparticles. Stability was analyzed by Zeta potential. A strong negative charge indicated that nanoparticles are well stabilized throughout the solution. Morphology and 3D topographic images were obtained by Atomic Force Microscopy (AFM). The crystalline nature of nanoparticles was elucidated by X-ray diffraction analysis. The size and morphology of solid, well-grinded nanoparticles was proceeded by Scanning Electron Microscopy (SEM). The catalytic activities of nanoparticles were carried out against methylene blue, methyl orange, safranin, and eosin. The results demonstrated that synthesized silver nanoparticles commenced the degradation reaction of dyes mentioned. Prepared silver nanoparticles are found to have adequate catalytic activity, as it can be comprehended in time-dependent UV-Vis spectrums of dyes after treating them with AgNPs.

1. Introduction

From the early 21st century, nanotechnology has gained a remarkable status as scientists exploit its distinctive characteristics from drug delivery to cosmetics, wastewater treatment, and self-cleaning building surfaces [1]. Nanotechnology exhibits itself in a broad spectrum of materials that can be handy for a scientist [2]. Scientists are now implanting nanoparticles into various plants to invent a new nutrient delivery system [3]. Some relative examples include carbon nanotubes in tomato seeds [4] and zinc oxide nanoparticles in ryegrass’s root tissue [5]. A study further revealed that scientists utilized zinc-aluminum-layered double-hydroxide in order to control chemical compounds that balance the plant growth [6]. Fertilizers fused with cochelate nanotubes have been asserted to provide better yields [7]. Gold nanoparticles with a diameter of 1.6 nm regulated the DNA flow through nanopores ultimately resulted in very swift genome sequencing [8,9]. Meanwhile, bionanotechnology has appeared as a combination of biotechnology and nanotechnology for instituting eco-friendly and biosynthetic technology for synthesis of nanoparticles [10]. A variety of metallic nanoparticles have appeared, including alginate [11], magnesium, gold [12], zinc, copper, and titanium [13], but among all these, silver has appeared to be an excellent antimicrobial agent against various bacteria, viruses, and different eukaryotic microorganisms [14].
Over the centuries, silver has been used in meditating burns and dire wounds. Early in 1000 BC, silver was utilized in water cleansing [15]. Later, silver, and silver nitrate in its solid form, were used intensively in different cases, i.e., treating venereal diseases, perianal abscesses, antidoting ophthalmia neonatorum, and designing bandages for skin wounds [16,17]. However, in 1940 when penicillin was discovered, silver’s usage for wound treatment was minimized [18,19,20]. Methods reported for the synthesis of silver nanoparticles include biological methods, physical methods, and chemical methods [21].
The dimensional classification of silver nanomaterials was briefly described by Skorokhod and Pokropivny, which was expressed as 0D, 1D, 2D, and 3D depending on their usage in the specific fields of science, varying from biological sensor designing, energy storage, electronics, photo catalyst, to energy storage batteries [22,23,24,25,26]. Among all the classes mentioned above, one-dimensional silver nanowires (AgNWs) do possess major superiority due to their highest electro-conductive capability, and thus are being utilized in constituting nanodevices of high-quality value [27]. Another breakthrough of AgNWs enhancing the attraction of researchers towards it was the idea of substitution of indium tin oxide with AgNWs for the manufacturing of transparent thin films [28]. Right after that, AgNWs were processed against enormous applications, including nanogenerators [29], soft robots [30], fuel cells [31], supercapacitors [32], and stretchable electronics. AgNWs are easy to synthesize and are conveniently soluble in different solvents in order to pursue any solvent-based execution of specific application. The supremacy of AgNWs over ITO can also be accomplished as AgNWs seek minimum quantity of the starting material, imparting the same electronic properties as an alternative to ITO, whose negative consequences are brittleness, expense, and absorbing harmful UV radiations.
Organic dyes cover a vast area of industrial zone, including paper, plastic, ceramics, cosmetics, textile, and pharmaceutical. Their dispensation in the wastewater is a serious menace to both aquatic and human lives due to their carcinogenic and mutagenic effects [33]. Traditional methods that were used have now been found to be unproductive against the dyes due to their stable aromatic structure. In light of these problems, nanocatalysis is found to be a promising field, using metallic nanoparticles as a catalyst in the degradation of toxic dyes [34,35].
In the current study, we synthesized stable silver nanoparticles using Arbutin, a drug that was used as a stabilizing agent for the first time. A single one-pot method was selected to prepare nanoparticles at room temperature (26 °C). Different analytical techniques were utilized to confirm the well-dispersed nanoparticles. The whole mechanism for the reaction is mentioned below in Section 3. In addition, we carried out catalytic activity for the degradation of different toxic dyes. Moreover, to the best of our knowledge, no work has been done on either synthesis of arbutin-stabilized silver nanoparticles or their degradation trend against various classes of dyes. The method adopted for this purpose was cost-effective, eco-friendly, and green. The effect of synthesized silver nanoparticles on degradation from different intervals of time using NaBH4 as a hydrogen donor in the solution was examined. The results conclude that Arbutin stabilized nanoparticles can be used for any forthcoming biological advancements in order to design suitable antimicrobial agents.

2. Results

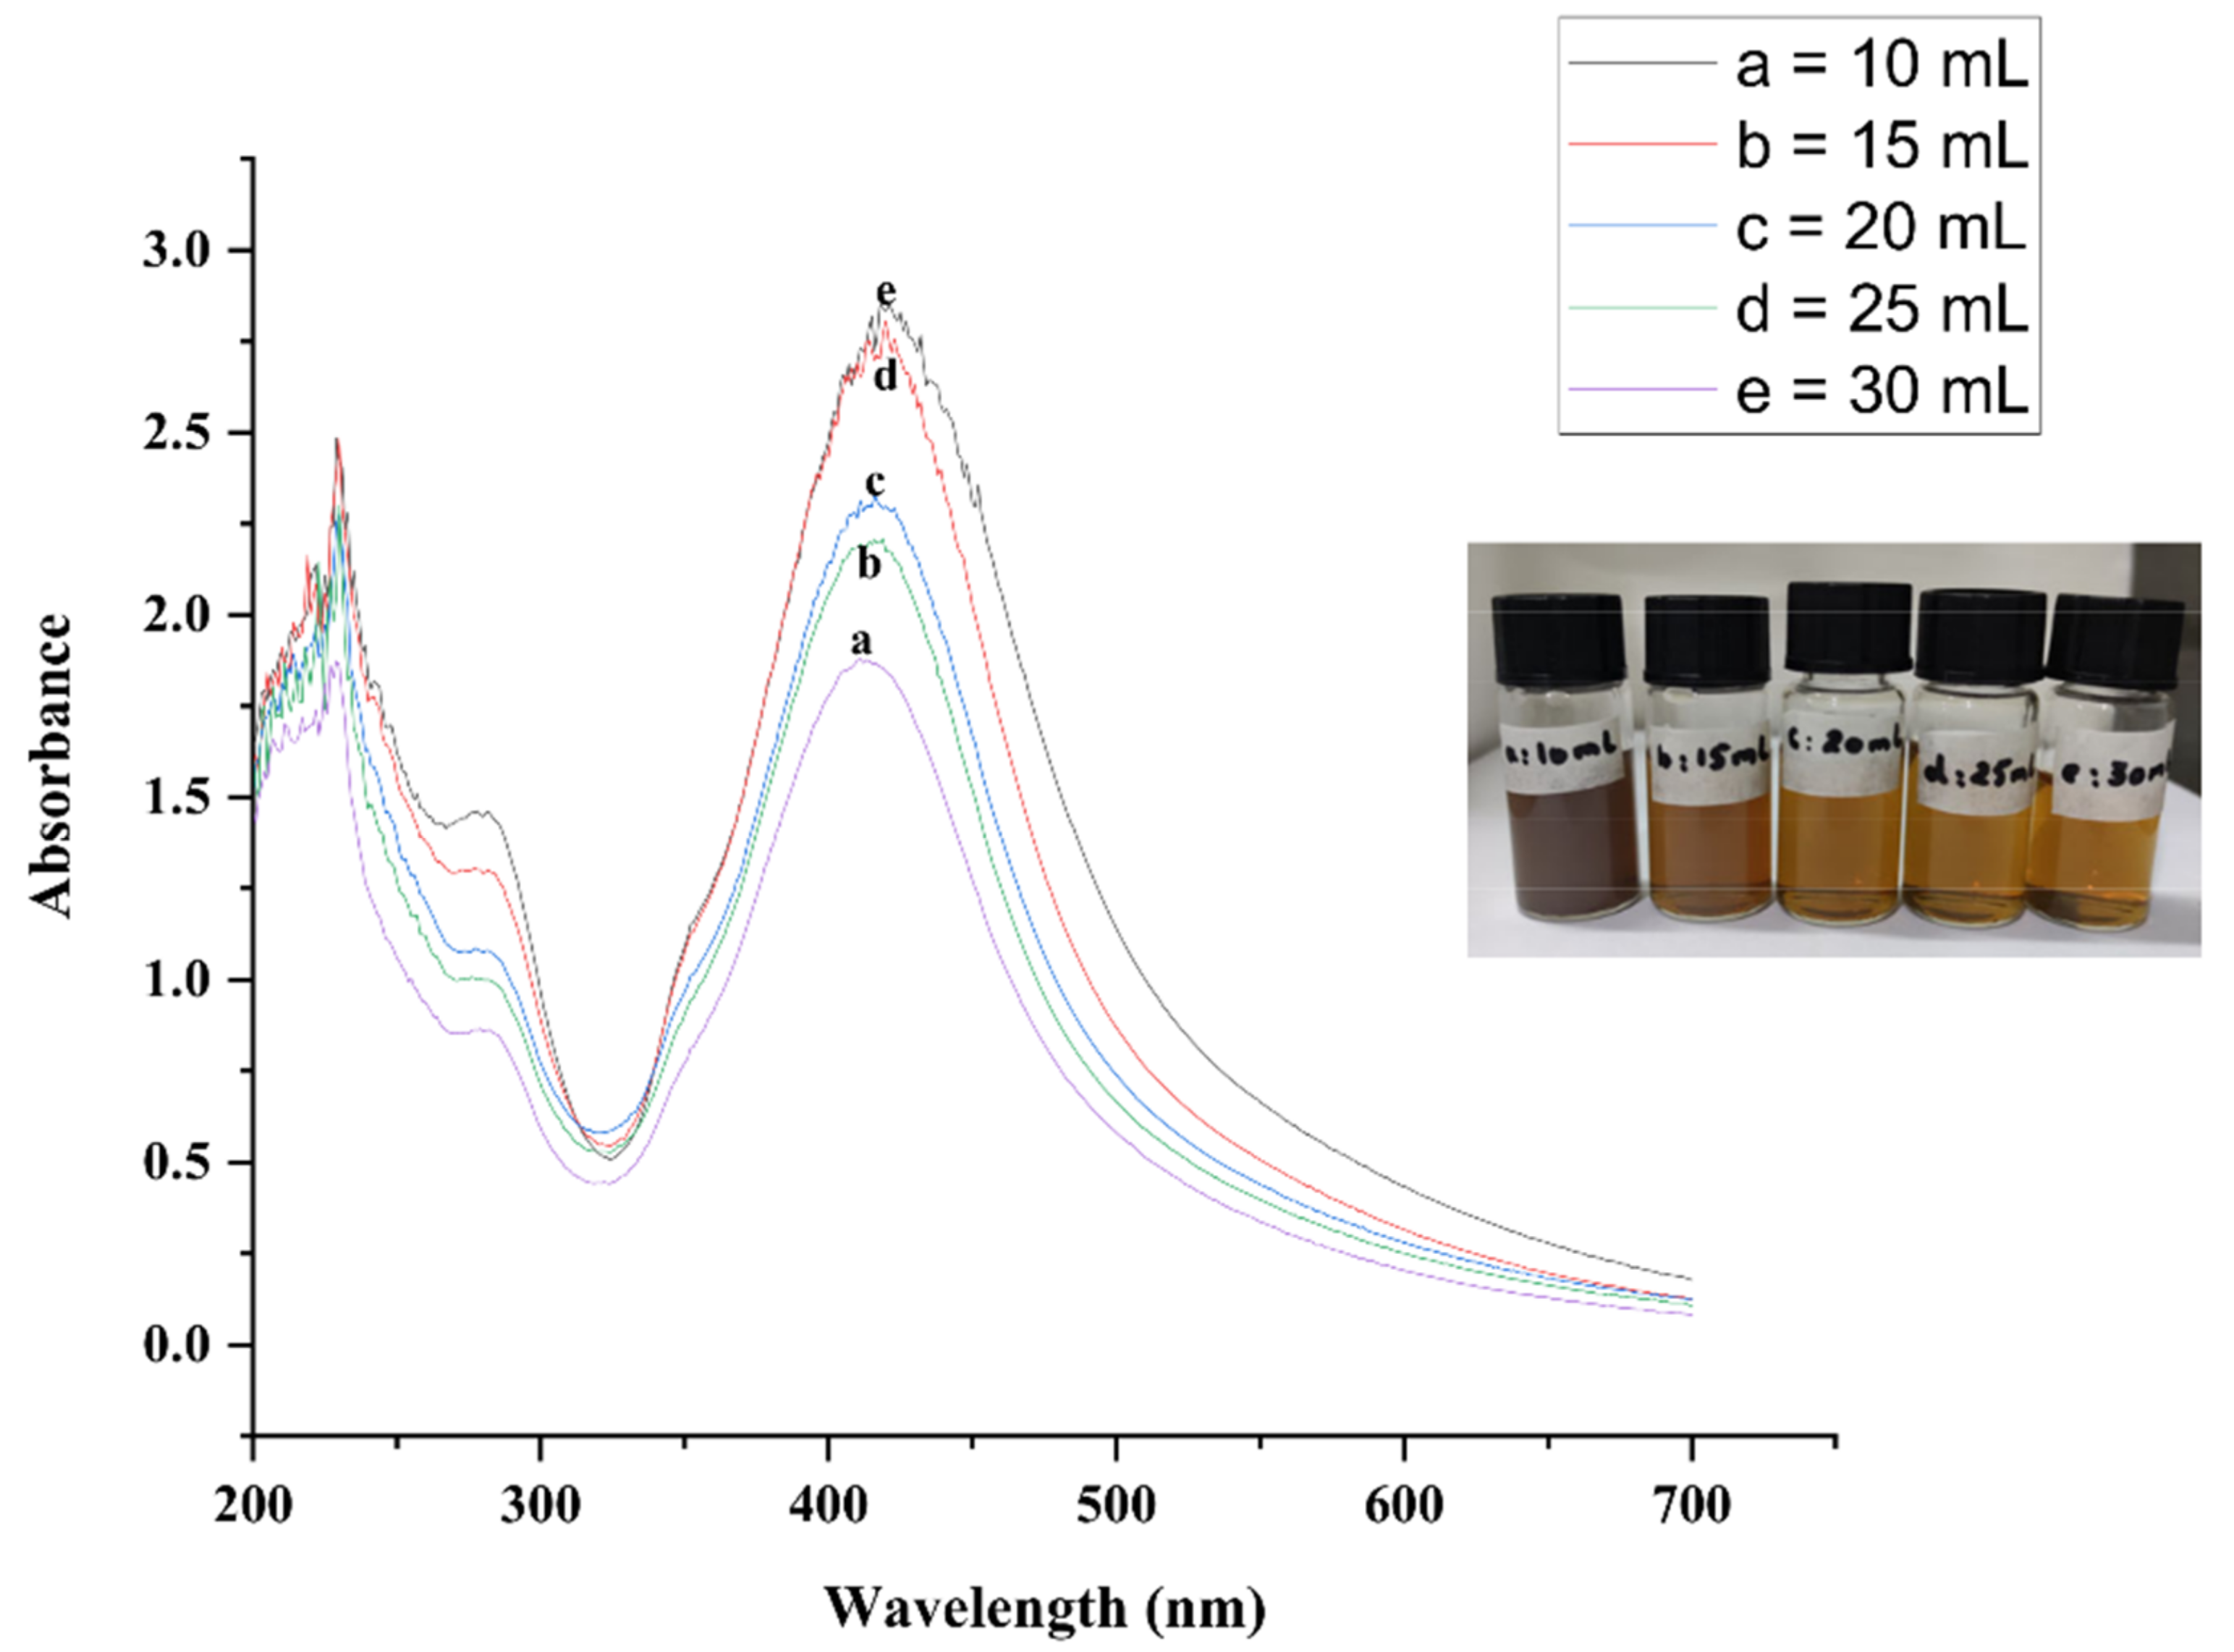
2.1. UV-Vis Spectroscopy

UV-Vis spectroscopy is a very efficient and definitive technique for analyzing the primary indication of formation of nanoparticles. The pattern of color change observed is shown in Figure 1a–c. The initial light yellow color of the solution turned darker yellow and finally changed to dark brown. The reduction of monovalent silver to zerovalent silver, and then its stabilization with arbutin was confirmed by UV-vis. Absorbance was selected up to 2 and wavelength was measured from 200 nm to 800 nm. Overall, 10 mL of distilled water was taken as reference. UV-Vis spectra were taken after each 10 min to find out the effect of time change on stability. UV-Vis spectra are given in Figure 2. A sharp peak at 435 nm indicated the formation and surface plasmon resonance of well-dispersed silver nanoparticles. This surface plasmon resonance is created when incident photons conduct with electrons of metal nanoparticles. In addition, pursuing the ideal quantities to obtain stable silver nanoparticles different concentrations of reducing agent NaBH4 and precursor AgNO3 along with arbutin were analyzed. Figure 3 illustrates different concentrations of AgNO3 and arbutin treated with the same quantity (30 mL) of NaBH4. Thus, a perception can be made that maximum quantity (10 mL) of AgNO3 and arbutin can result in the formation of stable and well-dispersed silver nanoparticles. Meanwhile, to avoid precipitation and contriving the absolute quantity of NaBH4, 5 repetitions of reactions were carried out. The results concluded that minimum concentration of NaBH4 (10 mL) gave rise to a greyish brown solution, which ultimately resulted in precipitation. However, as soon as we increased the concentration from 10 mL to 30 mL, the greyish brown color changed into a dark brown, which is a clear indication of well-stabilized silver nanoparticles. Figure 4 indicates the spectrum of different concentrations of NaBH4 against the same concentrations of precursor and drug. The same results have been published in various research works [36,37,38].

2.2. Dynamic Light Scattering and Zeta Potential

A Nano ZS zetasizer system (Malvern instruments) was used to perform zeta potential and DLS, aiming to calculate the surface charge and size distribution of silver nanoparticles in the solution. Both zeta potential and DLS are predicated on light scattering, and the analysis can be influenced by some of the factors, i.e., pH, ionic strength, sample preparation, sample concentration, effect of precipitation, shape, and rotational diffusion of nanoparticles [39]. Moreover, samples for analysis were kept sufficient diluted, as concentrated solutions are not recommended for DLS and Zeta potential measurement. The sample was loaded in a transparent cuvette and three measurements were recorded from it. DLS analysis depends upon the relation of particles with light. Figure 5a,b represent the spectrum of dynamic light scattering and zeta potential. Zeta potential spectra elucidated that synthesized silver nanoparticles have sufficient negative charge, which indicates that nanoparticles are stable and contribute to improved colloidal peculiarity. Figure 5b clearly depicts the presence of −27.2 surface charge of triple replications having standard and zeta deviation of 7.30 mV. A DLS image indicating size distribution of silver nanoparticles is given in Figure 5a. The spectrum shows three peaks at sizes of 101.5 nm, 19.20 nm, and 3.677 nm, respectively, with an average size value of 42 nm. The Polydispersity index (PDI) obtained was 0.239, which means that nanoparticles are perfectly dispersed in the solution. Some of the other specifications of DLS image are given below in Table 1.

2.3. Atomic Force Microscopy

Atomic force microscopy was carried out to analyze the size, morphology, and nanomechanical properties of prepared silver nanoparticles. A 5500 Atomic Force Microscope (Agilent technologies) was used for AFM analysis. A probe of Silicon nitride was used with the frequency of 298.563 kHz. Various measurements of AFM were carried out to find out if the probing of equipment affected the stability of synthesized silver nanoparticles. The height color scale was taken up to 2.5 μm. AFM images of silver nanoparticles are given in Figure 6a–e. It can be seen that round-shaped silver nanoparticles have uniform geometry and are well-dispersed throughout the solution without forming any aggregation. The main precedence of AFM over conventional imaging techniques like SEM and TEM is that AFM offers 3D imaging of nanoparticles to better understand nanoparticle geometry, shape, and volume. AFM analysis also visualizes the presence of attraction between cantilever sharp tips and the sample’s surface, as can be seen in Figure 6c,d.

2.4. X-ray Diffraction

XRD is a constructive technique to investigate the crystallinity, nature, and size of nanoparticles being examined [40]. The arrangement of patterns obtained from spectra provides information about its elucidation. This typical spectrum of every metal is then compared with the Joint Committee on Powder Diffraction Standards (JCPDS) library. The crystalline nature of silver nanoparticles was evaluated by XRD spectra by recording the spectra from 2θ range of 10–90°. The formation of a face-centered cubic structure was also confirmed by the analysis. The distinguished peaks at 2θ = 31.60°, 45.67°, 54.72°, 66.88°, and 76.22° represent the (111), (200), (142), (220), and (311) planes, respectively. The XRD spectra of silver nanoparticles is shown below in Figure 7. The same results have also been reported in various studies [41,42].

2.5. Scanning Electron Microscopy and Energy Dispersive X-ray Spectroscopy

SEM is a non-destructive technique which can be utilized to evaluate the nanoparticle composition, their morphology and surface topography [43]. It can also be used to find out the shape and size distribution throughout the sample. The sample was prepared by dropping a minute quantity of nanoparticles on a carbon-coated copper grid, extended by sputtering it with a conductive material. Figure 8a–c depict the SEM and EDX images of synthesized silver nanoparticles. It can be observed that round shaped nanoparticles are well-dispersed and homogenous. Some clusters are also obvious that are formed due to accumulation of silver nanoparticles between themselves. The average size of nanoparticles that appeared was 20–30 nm. The presence of silver metal is clearly visible in the EDX image.

2.6. FTIR Analysis

FTIR spectroscopy was performed to evaluate the presence of important functional groups. Figure 9 shows the FTIR spectra of prepared silver nanoparticles. A broad peak at 3307.63 cm−1 indicates the presence of –OH group, which might be derived from arbutin, assisting in the stabilization of nanoparticles. Other peaks at 2359, 1635, and 1011 cm−1 correlate to CO2, C=C stretching, and C-O moieties, respectively.

2.7. Catalytic Activity

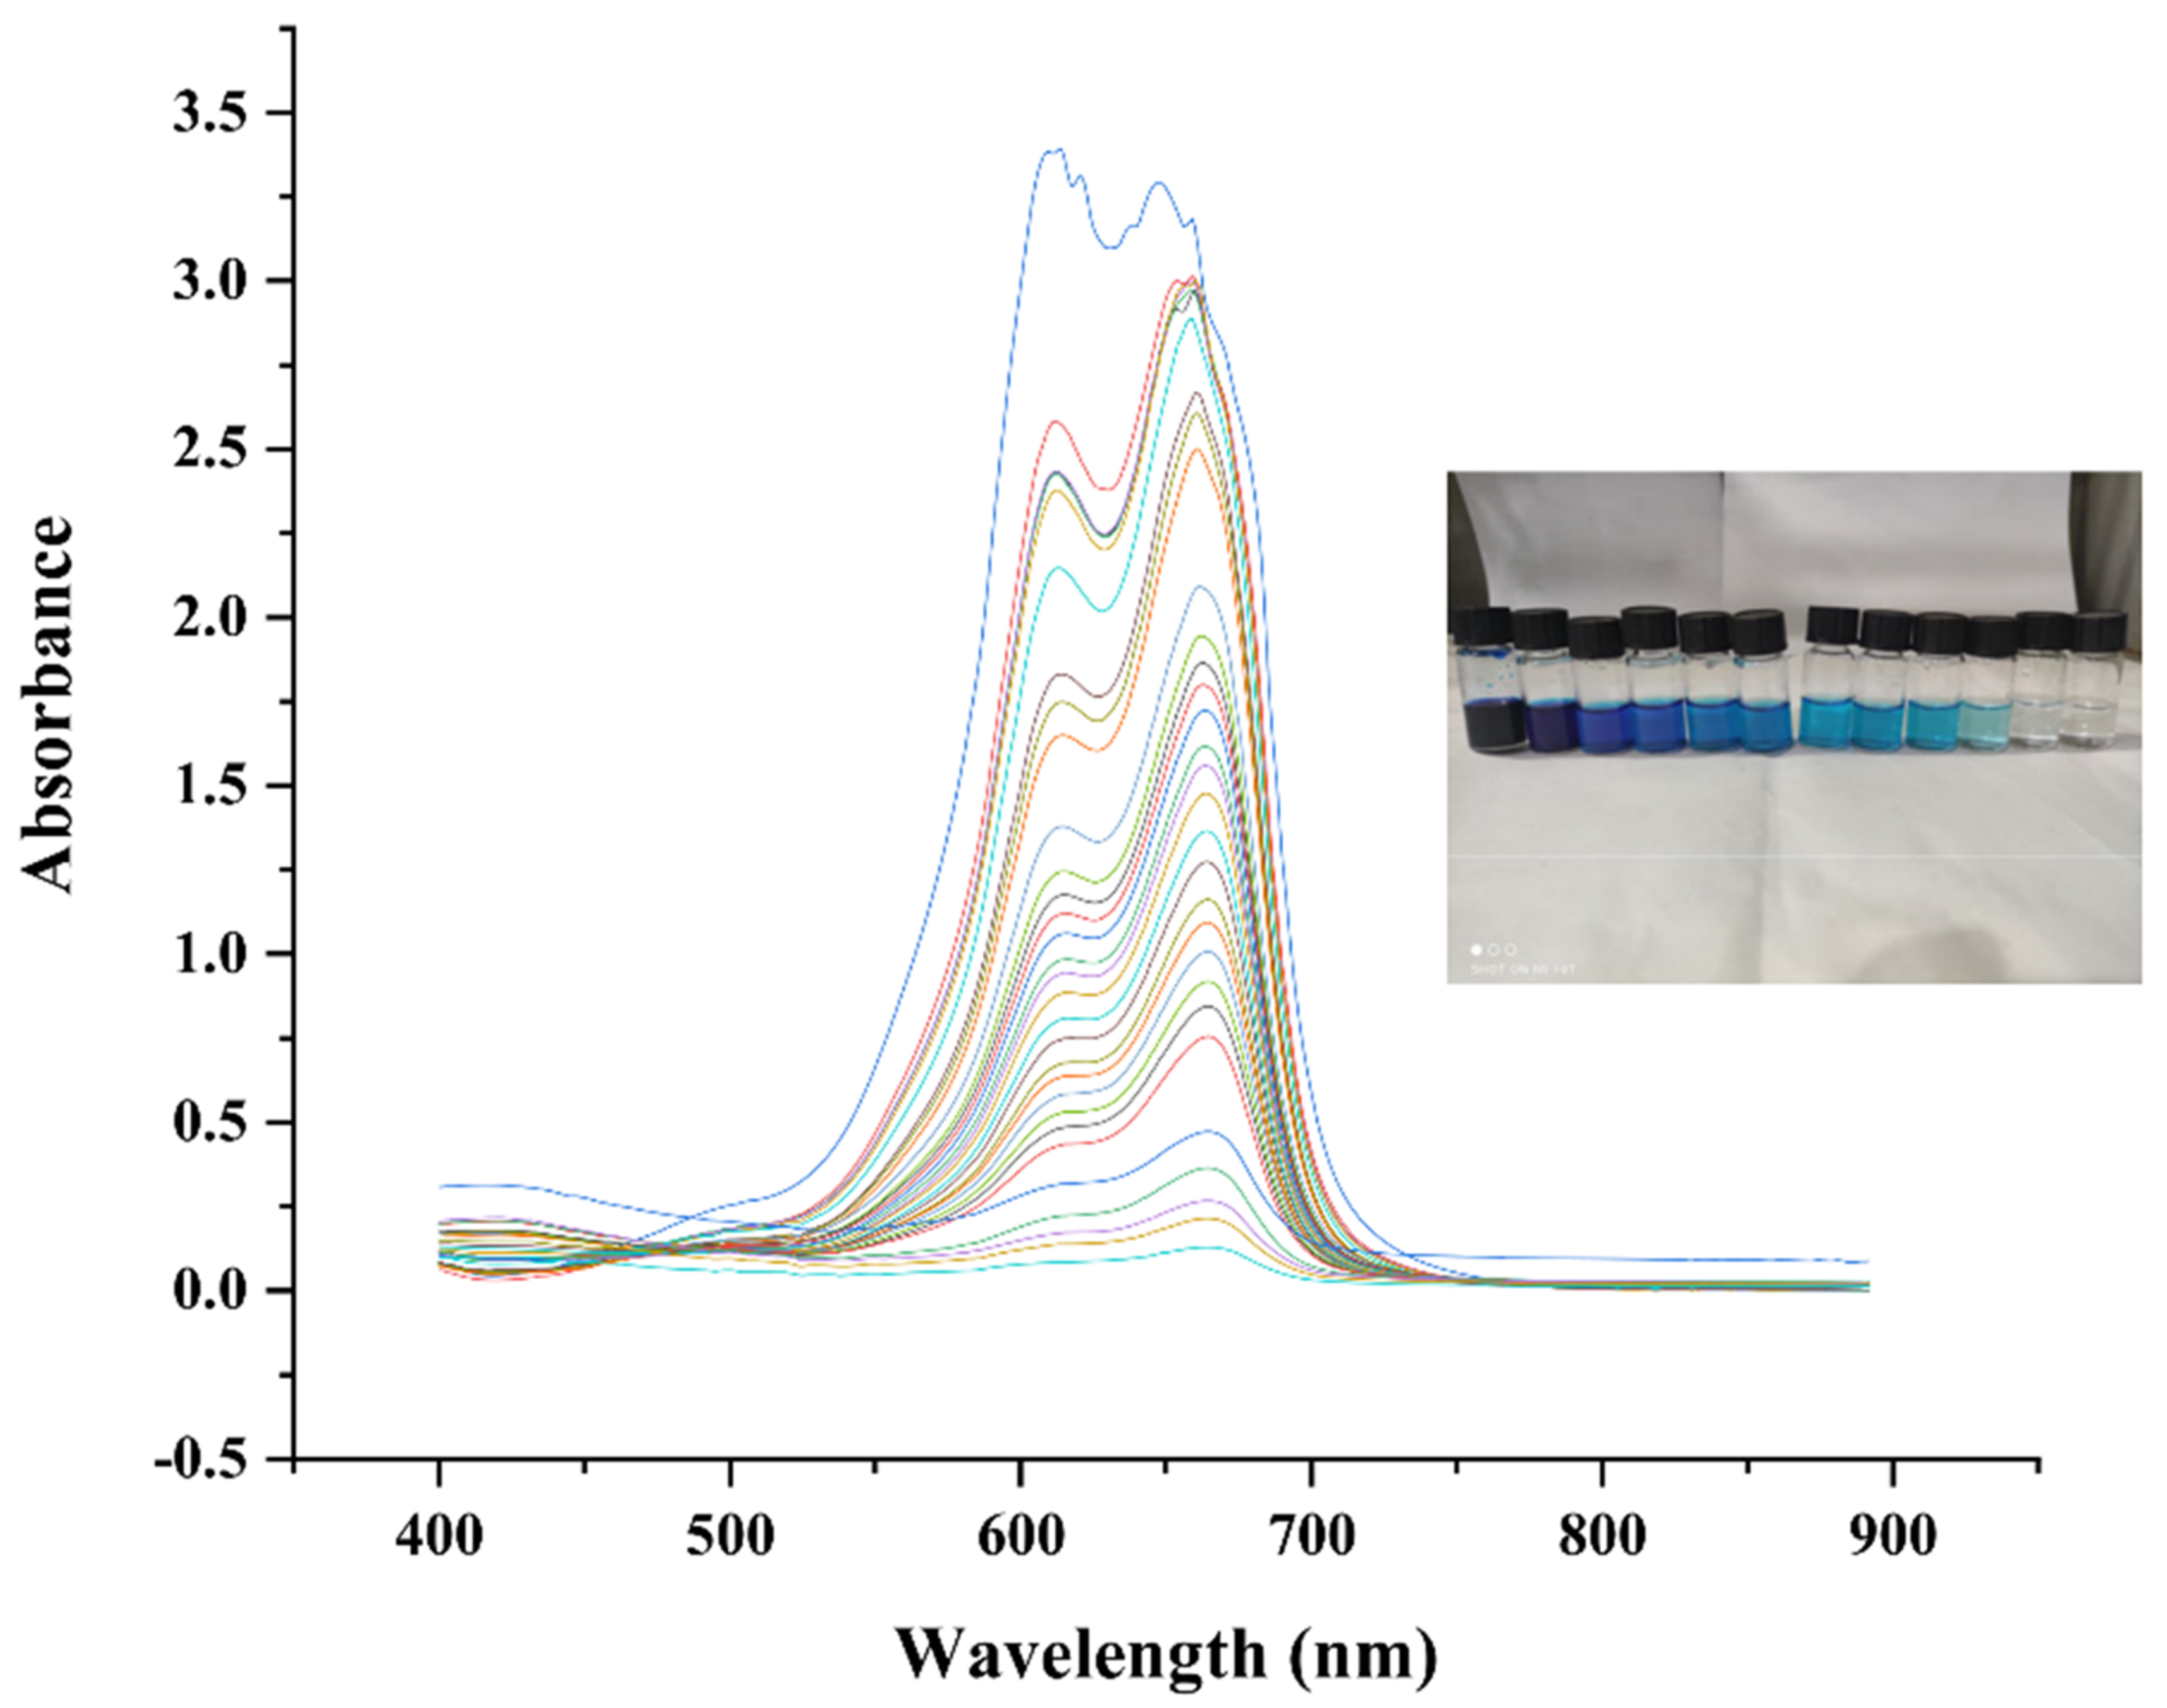
2.7.1. Catalytic Activity of Methylene Blue

Methylene blue is a water-soluble tricyclic phenothiazine drug/dye. It has been extensively used in medicines and as a staining reagent. The catalytic activity of AgNPs against MB was carried out along with NaBH4. Time-dependent readings were monitored on a UV-Vis spectrophotometer. MB usually gives a strong peak at 664 nm. After recording UV-Vis spectra of MB, the NaBH4 solution was added. After the addition shoulder peak of MB shifted to lower absorbance value, the characteristic peak showed a slight downfall. Soon after the addition of as-synthesized silver nanoparticles, catalytic activity started to appear. After intervals of every two min peak’s absorbance tending to be lower, and as soon as the characteristic blue color of MB solution faded, there was no evidence of the presence of MB’s distinctive peak. Statistical data included the MB peak in UV-Vis (Figure 10a) after treating it with the NaBH4 solution (Figure 10b) degradation trend (Figure 10c), time dependent kinetically plotted graph (Figure 10d) and multiple peaks take after specific intervals of time, indicating the degradation of dye given below in Figure 11. The percentage degradation calculated for methylene blue was 94%. The rate constant calculated from the reaction absorbance value was 0.0517min−1.

2.7.2. Possible Mechanism of Degradation of Methylene Blue

A chemical illustration of degradation of methylene blue is given in Figure 12. Possible mechanism of degradation is also reported in these research papers [44,45,46,47,48,49,50,51].

2.7.3. Catalytic Activity against Methyl Orange

The catalytic activity of prepared silver nanoparticles was further extended against the degradation of methyl orange, an azo dye. Methyl orange can be usually observed in UV-Vis at 464 nm of wavelength due to the transition of azo group. UV-Vis spectra of methyl orange is also shown below in Figure 13a, while Figure 14 illustrates the degradation of methyl orange by the addition of NaBH4 first, and further with the solution of silver nanoparticles. It can be observed that an identical peak of methyl orange at 464 nm remained uninterrupted even after the addition of NaBH4, disclosing that -N=N- moiety prevails in the methyl orange solution in the presence of NaBH4 but only causes a minor downfall in absorbance value. The degradation trend of methyl orange after the addition of both NaBH4 and silver nanoparticles was measured spectrophotometrically, which was verified by a progressive decrease in absorption peak intensity. It was also observed that the degradation of methyl orange with NaBH4 without any catalyst has a much slower reaction rate. The degradation trend and kinetically plotted graph of methyl orange using AgNPs as a catalyst is given below in Figure 13b,c. Each spectrum was recorded after 4 min for an hour. The percentage degradation of methyl orange obtained after one hour was almost 92%. The value of rate constant K calculated from the formula was 0.0435 min−1.

2.7.4. Possible Mechanism of Catalytic Activity of Methyl Orange

Chemical illustration of degradation of methyl orange is given in Figure 15. The same chemical illustration of degradation is also reported in given research papers [52,53,54].

2.7.5. Catalytic Activity against Safranin O

Safranin is a heterocyclic dye that has an azine functional group in it. The occupancy of this dye in wastewater can spawn many harmful effects in aquatic ecosystems. Safranin O’s characteristic peak in UV-Vis can be observed at 520 nm. The catalytic activity of safranin O was carried out against prepared silver nanoparticles and NaBH4 as a catalyst, which was monitored via a UV-Vis spectrophotometer. Figure 16a depicts the UV-Vis spectra of safranin. The addition of NaBH4 solution gave rise to a slight downfall in the dye’s peak, which can be observed in Figure 16b. The degradation of organic dye was monitored for an hour in intervals of every four minutes (Figure 17). The degradation trend and, ultimately, reduction in absorption peak of safranin are shown in Figure 16c and 3.15, respectively. The percentage degradation in the case of Safranin O obtained was 87%. A kinetically time-dependent plotted graph (Figure 16d) showed that the reaction which followed the dynamic of pseudo first order and value of constant K calculated was 0.0341 min−1.

2.7.6. Possible Mechanism of Degradation of Safranin O

The chemical illustration of dye degradation of Safranin O is given in Figure 18. Ref. [55] Barman et al. reported the catalytic activity of silver nanoparticles against safranin O with the matched mechanism. The same mechanism is also depicted in these research works [56,57].

2.7.7. Catalytic Activity against Eosin Y

Eosin Y is a water-soluble tetrabromofluorescein dye commonly used in the paper and textile industries [58]. Metabolites of this fluorescein dye are very pernicious and carcinogenic to aquatic ecosystems; that is why the removal of this dye from wastewater is required. The most considerable primacy of catalytic activity of EY is its appropriate monitoring by UV-Vis spectroscopy. The degradation of Eosin Y dye was carried out in the presence of excessive NaBH4 to find out the catalytic proficiency of stable silver nanoparticles. The distinctive peak of EY dye was monitored at 514 nm which, when gradually lowered by passage of time and peak intensity, almost dropped to zero. Figure 19a depicts the UV-Vis spectra of Eosin Y, while treating the dye solution with NaBH4 solution caused a slight fall in the peak, which can be observed in Figure 19b. It can be witnessed from Figure 19b that reaction rate is very slow in the absence of the catalyst. As soon as we introduced silver nanoparticles in the solution reaction, the rate accelerated. Kinetically time dependent graph is shown in Figure 19c. A series of spectra showing degradation of dye monitored against silver nanoparticles are shown in Figure 20. The percentage degradation of Eosin Y dye calculated was 96%. While following the pseudo first order kinetics, the value of rate constant calculated was 0.0529 min−1, as can be observed from Figure 19d.

2.7.8. Possible Mechanism of Catalytic Degradation of Eosin Y

A chemical illustration of Eosin Y degradation is given below (Figure 21). The scheme was verified with research work published already [59,60].
Numerous reports are available concerning to the catalytic activity of silver nanoparticles against the degradation of hazardous dyes prepared biologically and chemically [61,62,63,64,65]. These studies conclude that smaller particle sizes tend to undergo excellent catalytic activity, minimizing the time required for degradation. Correspondingly, the availability of catalyst also increases the efficiency of catalytic activity due to the larger surface area obtainable. However, there is no such study reported where drug-loaded nanoparticles were being used for catalytic activity. The rate constant and percentage degradation calculated from our experiment were significantly better than the one reported. Therefore, drug-loaded nanoparticles can be used in industrial wastewater treatments.

2.7.9. Quenching Study against Eosin Y

The scavenger quenching experiment was performed against Eosin Y to better understand the title role of active species in catalytic degradation of organic dyes. For the experiment, 60 µL of Eosin Y dye was taken in a glass cuvette and examined against different scavengers, including methanol for OH radical scavenger and ammonium oxalate as an H+ scavenger. Figure 22 demonstrated that after the addition of oxalate, a modest inhibitory effect was noticed, where around 63% of dye was degraded. Meanwhile, the addition of methanol led to a remarkable loss in degradation, as 42% of the dye was degraded. This further proposed that hydroxyl radicals and superoxide radicals play a pivotal role in dye degradation being found as reactive species in the solution. The percentage degradation of Eosin Y without any scavenger was 96%. A study revealed that increasing air superficial velocity escalates the degradation rate of dyes as it enhances the production of OH radicals. Oxygen molecules present on the surface of the catalyst react with the free electrons available, leading to the formation of more dye oxidants (OH radicals) [66]. Hence, the deoxygenation of dye solution will unorthodoxly recede the degradation rate.

3. Experimental

3.1. Materials and Instrumentation

Silver nitrate (AgNO3, 99.8%), sodium borohydride (NaBH4, 98%), arbutin (C12H16O7), methylene blue (C16H18ClN3S), methyl orange (C14H14N3NaO3S), safranin (C20H19N4+.Cl−), and eosin (C20H6Br4Na2O5) were purchased from Sigma-Aldrich (St. Louis, Germany) and were subjected for reactions without any further purification. All solutions were prepared using double distilled water to avoid contamination and impurities. Evolution 300 UV-Visible spectrophotometer (ThermoScientific, Madison, WI, USA) was used for UV-Visible spectroscopy, Nano ZS zetasizer system (Malvern instruments, Malvern, UK) for DLS and zeta potential, 5500 Atomic Force Microscope (Agilent technologies, Santa Clara, CA, USA) for atomic force microscopy, and Bruker D8 venture X-ray powder diffractometer (Bruker, Billerica, MA, USA) for XRD analysis.

3.2. Synthesis of Silver Nanoparticles

All glassware was washed and dried carefully. A stock solution of 4 mM NaBH4, 2 mM AgNO3, and 2 mM of arbutin was prepared using chilled water in order to minimize the decomposition of salts. The quantity of NaBH4 was taken as double, as there should be enough reducing agent to reduce and cap the prepared nanoparticles. Overall, a 30 mL solution of NaBH4 was taken in a conical flask and 10 mL each of AgNO3 and Arbutin solutions were added by each drop being added after a second. The transparent solution of NaBH4 turned light yellow first, and after the whole addition of AgNO3 and arbutin solutions, the color changed from light yellow to dark brown. As soon as the addition was complete, stirring was stopped and the magnetic stirrer was removed so that if stirring was continued, the precipitation would start. The whole addition took almost five minutes. The prepared mixture was subjected for UV analysis and then stored for 10 days to check the stability of silver nanoparticles.

3.3. Preparation of Dye’s Solution for Catalytic Activity

Catalysis of various types of chemical reactions is a conceivable characteristic of metallic nanoparticles that may not happen. The catalytic activity of synthesized silver nanoparticles was carried out against methylene blue, methyl orange, Safranin O, and Eosin. All dyes for catalytic activity were purchased from Sigma-Aldrich. The reaction was carried out in a quartz cuvette and absorbance was monitored by UV-Vis spectrophotometer. In a typical experiment, 60 µL of each dye solution (5 mM) was mixed with 1.5 mL of distilled water and its UV-Vis spectra was obtained. A further 0.2 mL of NaBH4 (0.2 M) was mixed in the same cuvette, and a slight fall in absorbance was observed due to inadequate reaction rates in the reduction of dyes by NaBH4. Before performing the experiment, solutions of both NaBH4 and dyes were stored at 4 °C. Ultimately, 500 µL solution of silver nanoparticles (62.5 µM) was added into the spectrum, which was recorded for an hour after each 2 min. Sharp peculiar colors of dyes turned light and finally became colorless. Sharp characteristic peaks appeared first, which gradually went downward, and no absorbance was observed as soon as the solution turned colorless. The reaction was performed at room temperature, and it was continually stirred throughout the activity. Blank control was measured without any addition of silver nanoparticles solution. The degradation rate of all dyes was calculated by the formula given below:
Degradation rate (%) = (Co − Ct/Co) × 100
Here, Co is the initial absorbance value while Ct is the final absorbance value taken before and after catalytic activity. The chemical kinetics of decolorization of all dyes are found to be following pseudo first order, as it can be derived from the equation given below:
−Ln(C/Co) = kt
Here, k is the rate constant, Co is initial dye concentration, and C is final concentration of dye at given time t.

3.4. Characterization of Silver Nanoparticles Using UV-Vis, DLS, Zeta Potential, AFM, XRD, and SEM

After the physical observation of color changing from light to dark yellow, the solution was further analyzed for its characterization. The initial characterization carried out was UV-vis. After indicating characteristic peak of silver, the sample was used for other analytical techniques. To elucidate surface charge and size distribution, zeta potential and Dynamic Light Scattering were performed. AFM and SEM were used to investigate the morphology, shape, and size of nanoparticles. To calculate the crystalline structure, XRD was performed.

4. Conclusions

In summary, stable silver nanoparticles were prepared in an aqueous medium by using NaBH4 as a reducing agent and stabilized by Arbutin. The adopted method delivered highly crystalline and well-dispersed nanoparticles. Enhanced catalytic activity of AgNPs was performed against methylene blue, methyl orange, safranin O, and Eosin Y. Our work demonstrated that AgNPs can be used as an ideal degrading agent to remove toxic dyes from wastewater and neutralize them to much less harmful towards environment. Synthesized silver nanoparticles showed excellent catalytic degradation towards different classes of dyes. The degradation rate proved that Eosin Y degraded with the highest rate (0.0529 min−1), followed by methylene blue (0.0517 min−1), methyl orange (0.0435 min−1), and safranin O (0.0341 min−1), respectively. Nanoparticles being used as a catalyst can be recycled and removed from the reaction mixture by centrifugation. The method performed is simple, ecofriendly, cheap, and can be used for industrial and research purposes. Moreover, this new approach for using drug-mediated AgNPs holds several valuable attractions and offers an efficient and economic route to environmental protection.

Author Contributions

Conceptualization, U.F. and S.A.; Data curation, H.M.A. and M.F.; Funding acquisition, M.A. (Mazen Almehmadiand) and S.A.; Methodology, M.A. (Mamdouh Allahyani), A.A.A., A.A. and A.Y.M.A.; Software, M.S. and S.A.; Supervision, A.K.Q. and M.A. (Mamdouh Allahyani); Validation, S.A., A.K.Q., M.F. and M.S.; Writing—original draft, U.F. and M.A. (Mazen Almehmadiand). All authors have read and agreed to the published version of the manuscript.

Funding

The authors would like to acknowledge the support of Taif University for support in Article Processing Charges (APC) of this publication.

Data Availability Statement

Not available.

Acknowledgments

The authors would like to thank Taif University and Department of Chemistry, University of New Brunswick, Fredericton, Canada for their assistance during the work on this article.

Conflicts of Interest

The authors declare no conflict of interest.

References

  1. McNeil, S.E. Nanotechnology for the biologist. J. Leukoc. Biol. 2005, 3, 585–594. [Google Scholar] [CrossRef] [PubMed]
  2. Zhang, S. Emerging biological materials through molecular self-assembly. Biotechnol. Adv. 2002, 20, 321–339. [Google Scholar] [CrossRef] [PubMed]
  3. Ricci-Vitiani, L.; Fabrizi, E.; Palio, E.; De Maria, R. Colon cancer stem cells. J. Mol. Med. 2009, 11, 1097–1104. [Google Scholar] [CrossRef] [PubMed]
  4. Khodakovskaya, M.; Dervishi, E.; Mahmood, M.; Xu, Y.; Li, Z.; Watanabe, F.; Biris, A.S. Carbon nanotubes are able to penetrate plant seed coat and dramatically affect seed germination and plant growth. ACS Nano 2009, 10, 3221–3227. [Google Scholar] [CrossRef] [PubMed]
  5. Lin, D.; Xing, B. Root uptake and phytotoxicity of ZnO nanoparticles. Environ. Sci. Technol. 2008, 15, 5580–5585. [Google Scholar] [CrossRef]
  6. Bin Hussein, M.Z.; Zainal, Z.; Yahaya, A.H.; Foo, D.W.V. Controlled release of a plant growth regulator, α-naphthalene acetate from the lamella of Zn–Al-layered double hydroxide nanocomposite. J. Control. Release 2002, 82, 417–427. [Google Scholar] [CrossRef]
  7. Mehrazar, E.; Rahaie, M.; Rahaie, S. Application of nanoparticles for pesticides, herbicides, fertilizers and animals feed management. Int. J. Nanopart. 2015, 1, 1–19. [Google Scholar] [CrossRef]
  8. Emerich, D.F.; Thanos, C.G. Nanotechnology and medicine. Expert Opin. Biol. Ther. 2003, 4, 655–663. [Google Scholar] [CrossRef]
  9. Kalishwaralal, K.; Deepak, V.; Ramkumarpandian, S.; Nellaiah, H.; Sangiliyandi, G. Extracellular biosynthesis of silver nanoparticles by the culture supernatant of Bacillus licheniformis. Mater. Lett. 2008, 29, 4411–4413. [Google Scholar] [CrossRef]
  10. Rai, M.; Yadav, A.; Gade, A. Silver nanoparticles as a new generation of antimicrobials. Biotechnol. Adv. 2009, 1, 76–83. [Google Scholar] [CrossRef]
  11. Ahmad, Z.; Pandey, R.; Sharma, S.; Khuller, G.K. Alginate nanoparticles as antituberculosis drug carriers: Formulation development, pharmacokinetics and therapeutic potential. Indian J. Chest Dis. Allied Sci. 2006, 3, 171. [Google Scholar]
  12. Gu, H.; Ho, P.L.; Tong, E.; Wang, L.; Xu, B. Presenting vancomycin on nanoparticles to enhance antimicrobial activities. Nano Lett. 2003, 9, 1261–1263. [Google Scholar] [CrossRef]
  13. Schabes-Retchkiman, P.S.; Canizal, G.; Herrera-Becerra, R.; Zorrilla, C.; Liu, H.B.; Ascencio, J.A. Biosynthesis and characterization of Ti/Ni bimetallic nanoparticles. Opt. Mater. 2006, 1, 95–99. [Google Scholar] [CrossRef]
  14. Gong, P.; Li, H.; He, X.; Wang, K.; Hu, J.; Tan, W.; Yang, X. Preparation and antibacterial activity of Fe3O4@ Ag nanoparticles. Nanotechnology 2007, 28, 285604. [Google Scholar] [CrossRef]
  15. Castellano, J.J.; Shafii, S.M.; Ko, F.; Donate, G.; Wright, T.E.; Mannari, R.J.; Robson, M.C. Comparative evaluation of silver-containing antimicrobial dressings and drugs. Inter. Wound J. 2007, 2, 114–122. [Google Scholar] [CrossRef]
  16. Klasen, H.J. Historical review of the use of silver in the treatment of burns. I. Early uses. Burns 2000, 2, 117–130. [Google Scholar] [CrossRef]
  17. Lansdown, A.B. Silver I: Its antibacterial properties and mechanism of action. J. Wound Care 2002, 4, 125–130. [Google Scholar] [CrossRef]
  18. Hugo, W.B. Types of antimicrobial agents. Disinfect. Preserv. Steriliz. 1992, 2, 7–88. [Google Scholar]
  19. Demling, R.H.; DeSanti, L. Effects of silver on wound management. Wounds 2001, 1, 4–15. [Google Scholar]
  20. Chopra, I. The increasing use of silver-based products as antimicrobial agents: A useful development or a cause for concern? J. Antimicrob. Chemother. 2007, 4, 587–590. [Google Scholar] [CrossRef] [Green Version]
  21. Mujaddidi, N.; Nisa, S.; Al Ayoubi, S.; Bibi, Y.; Khan, S.; Sabir, M.; Qayyum, A. Pharmacological properties of biogenically synthesized silver nanoparticles using endophyte Bacillus cereus extract of Berberis lyceum against oxidative stress and pathogenic multidrug-resistant bacteria. Saudi J. Biol. Sci. 2021, 11, 6432–6440. [Google Scholar] [CrossRef]
  22. Shen, Q.; Jiang, L.; Zhang, H.; Min, Q.; Hou, W.; Zhu, J.J. Three-dimensional dendritic Pt nanostructures: Sonoelectrochemical synthesis and electrochemical applications. J. Phys. Chem. C 2008, 42, 16385–16392. [Google Scholar] [CrossRef]
  23. Mann, A.K.; Skrabalak, S.E. Synthesis of single-crystalline nanoplates by spray pyrolysis: A metathesis route to Bi2WO6. Chem. Mater. 2011, 4, 1017–1022. [Google Scholar] [CrossRef]
  24. Pokropivny, V.V.; Skorokhod, V.V. Classification of nanostructures by dimensionality and concept of surface forms engineering in nanomaterial science. Mater. Sci. Eng. C 2007, 27, 990–993. [Google Scholar] [CrossRef]
  25. Mai, L.; Tian, X.; Xu, X.; Chang, L.; Xu, L. Nanowire electrodes for electrochemical energy storage devices. Chem. Rev. 2014, 23, 11828–11862. [Google Scholar] [CrossRef]
  26. Muhmood, T.; Cai, Z.; Lin, S.; Xiao, J.; Hu, X. Dimensions controllable synthesis of silver Nano-morphologies via moderate one step methodology. Adv. Powder Technol. 2021, 9, 3388–3394. [Google Scholar] [CrossRef]
  27. Kewes, G.; Herrmann, K.; Rodríguez-Oliveros, R.; Kuhlicke, A.; Benson, O.; Busch, K. Limitations of particle-based spasers. Phys. Rev. Lett. 2017, 23, 237402. [Google Scholar] [CrossRef] [Green Version]
  28. Chen, S.; Guan, Y.; Li, Y.; Yan, X.; Ni, H.; Li, L. A water-based silver nanowire ink for large-scale flexible transparent conductive films and touch screens. J. Mater. Chem. C 2017, 9, 2404–2414. [Google Scholar] [CrossRef]
  29. Liang, X.; Zhao, T.; Jiang, W.; Yu, X.; Hu, Y.; Zhu, P.; Wong, C.P. Highly transparent triboelectric nanogenerator utilizing in-situ chemically welded silver nanowire network as electrode for mechanical energy harvesting and body motion monitoring. Nano Energy 2019, 59, 508–516. [Google Scholar] [CrossRef]
  30. Park, C.; Lee, B.; Kim, J.; Lee, H.; Kang, J.; Yoon, J.; Cho, S.J. Flexible Sensory Systems: Structural Approaches. Polymers 2022, 6, 1232. [Google Scholar] [CrossRef]
  31. Kim, H.; Choi, J.; Kim, K.K.; Won, P.; Hong, S.; Ko, S.H. Biomimetic chameleon soft robot with artificial crypsis and disruptive coloration skin. Nat. Commun. 2021, 1, 4658. [Google Scholar] [CrossRef] [PubMed]
  32. Zhang, X.Y.; Wang, H.Q.; Sun, Y.; Zhou, W.; Wang, J. Facile synthesis of aqueous silver nanoparticles and silver/molybdenum disulfide nanocomposites and investigation of their nonlinear optical properties. Tungsten 2021, 4, 482–491. [Google Scholar] [CrossRef]
  33. Muhmood, T.; Ahmad, F.; Hu, X.; Yang, X. Silver Nanowires: A Focused Review about Their Synthesis, Properties, and Major Factors Limiting Their Commercialization. Nano Futures 2022, 6, 3. [Google Scholar] [CrossRef]
  34. Banat, I.M.; Nigam, P.; Singh, D.; Marchant, R. Microbial decolorization of textile-dyecontaining effluents: A review. Bioresour. Technol. 1996, 3, 217–227. [Google Scholar] [CrossRef]
  35. Kruis, F.E.; Fissan, H.; Rellinghaus, B. Sintering and evaporation characteristics of gas-phase synthesis of size-selected PbS nanoparticles. Mater. Sci. Eng. B 2000, 69, 329–334. [Google Scholar] [CrossRef]
  36. Magnusson, M.H.; Deppert, K.; Malm, J.O.; Bovin, J.O.; Samuelson, L. Gold nanoparticles: Production, reshaping, and thermal charging. J. Nanopart. Res. 1999, 2, 243–251. [Google Scholar] [CrossRef]
  37. Jung, J.H.; Oh, H.C.; Noh, H.S.; Ji, J.H.; Kim, S.S. Metal nanoparticle generation using a small ceramic heater with a local heating area. J. Aerosol Sci. 2006, 12, 1662–1670. [Google Scholar] [CrossRef]
  38. Mishra, G.; Tripathy, M. A critical review of the treatments for decolourization of textile effluent. Colourage 1993, 40, 35. [Google Scholar]
  39. Raghavacharya, C. Colour removal from industrial effluents: A comparative review of available technologies. Chem. Eng. World 1997, 7, 53–54. [Google Scholar]
  40. Slokar, Y.M.; Le Marechal, A.M. Methods of decoloration of textile wastewaters. Dyes Pigm. 1998, 4, 335–356. [Google Scholar] [CrossRef]
  41. Obaid, A.Y.; Al-Thabaiti, S.A.; El-Mossalamy, E.H.; Al-Harbi, L.M.; Khan, Z. Extracellular bio-synthesis of silver nanoparticles. Arab. J. Chem. 2017, 2, 226–231. [Google Scholar] [CrossRef] [Green Version]
  42. Gardea-Torresdey, J.L.; Parsons, J.G.; Gomez, E.; Peralta-Videa, J.; Troiani, H.E.; Santiago, P.; Yacaman, M.J. Formation and growth of Au nanoparticles inside live alfalfa plants. Nano Lett. 2002, 4, 397–401. [Google Scholar] [CrossRef]
  43. Jacob, S.J.P.; Finub, J.S.; Narayanan, A. Synthesis of silver nanoparticles using Piper longum leaf extracts and its cytotoxic activity against Hep-2 cell line. Colloids Surf. B Biointerfaces 2012, 91, 212–214. [Google Scholar] [CrossRef]
  44. Takahara, P.M.; Rosenzweig, A.C.; Frederick, C.A.; Lippard, S.J. Crystal structure of double-stranded DNA containing the major adduct of the anticancer drug cisplatin. Nature 1995, 6550, 649–652. [Google Scholar] [CrossRef]
  45. Wunder, S.; Polzer, F.; Lu, Y.; Mei, Y.; Ballauff, M. Kinetic analysis of catalytic reduction of 4-nitrophenol by metallic nanoparticles immobilized in spherical polyelectrolyte brushes. J. Phys. Chem. C 2010, 19, 8814–8820. [Google Scholar] [CrossRef]
  46. Leonard, K.; Ahmmad, B.; Okamura, H.; Kurawaki, J. In situ green synthesis of biocompatible ginseng capped gold nanoparticles with remarkable stability. Colloids Surf. B Biointerfaces 2011, 2, 391–396. [Google Scholar] [CrossRef]
  47. Naraginti, S.; Sivakumar, A. Eco-friendly synthesis of silver and gold nanoparticles with enhanced bactericidal activity and study of silver catalyzed reduction of 4-nitrophenol. Spectrochim. Acta A Mol. Biomol. Spectrosc. 2014, 128, 357–362. [Google Scholar] [CrossRef]
  48. Bindhu, M.R.; Umadevi, M. Antibacterial and catalytic activities of green synthesized silver nanoparticles. Spectrochim. Acta A Mol. Biomol. Spectrosc. 2015, 135, 373–378. [Google Scholar] [CrossRef]
  49. Vidhu, V.K.; Philip, D. Catalytic degradation of organic dyes using biosynthesized silver nanoparticles. Micron 2014, 56, 54–62. [Google Scholar] [CrossRef] [PubMed]
  50. Vidhu, V.K.; Philip, D. Spectroscopic, microscopic and catalytic properties of silver nanoparticles synthesized using Saraca indica flower. Spectrochim. Acta A Mol. Biomol. Spectrosc. 2014, 117, 102–108. [Google Scholar] [CrossRef] [PubMed]
  51. Hao, Y.; Zhang, N.; Luo, J.; Liu, X. Green synthesis of silver nanoparticles by tannic acid with improved catalytic performance towards the reduction of methylene blue. Nano 2018, 1, 1850003. [Google Scholar] [CrossRef]
  52. Edison, T.J.I.; Sethuraman, M.G. Instant green synthesis of silver nanoparticles using Terminalia chebula fruit extract and evaluation of their catalytic activity on reduction of methylene blue. Process Biochem. 2012, 9, 1351–1357. [Google Scholar] [CrossRef]
  53. Joseph, S.; Mathew, B. Microwave-assisted green synthesis of silver nanoparticles and the study on catalytic activity in the degradation of dyes. J. Mol. Liq. 2015, 204, 184–191. [Google Scholar] [CrossRef]
  54. Barman, K.; Chowdhury, D.; Baruah, P.K. Bio-synthesized silver nanoparticles using Zingiber officinale rhizome extract as efficient catalyst for the degradation of environmental pollutants. Inorg. Nano-Met. Chem. 2020, 2, 57–65. [Google Scholar] [CrossRef]
  55. Muhmood, T.; Uddin, A. Fabrication of spherical-graphitic carbon nitride via hydrothermal method for enhanced photo-degradation ability towards antibiotic. Chem. Phys. Lett. 2020, 753, 137604. [Google Scholar] [CrossRef]
  56. Mahmood, A.; Muhmood, T.; Ahmad, F. Carbon nanotubes heterojunction with graphene like carbon nitride for the enhancement of electrochemical and photocatalytic activity. Mater. Chem. Phys. 2022, 278, 125640. [Google Scholar] [CrossRef]
  57. Vijayan, R.; Joseph, S.; Mathew, B. Green synthesis of silver nanoparticles using Nervalia zeylanica leaf extract and evaluation of their antioxidant, catalytic, and antimicrobial potentials. Parti. Sci. Technol. 2018, 37, 809–819. [Google Scholar] [CrossRef]
  58. Muthu, K.; Priya, S. Green synthesis, characterization and catalytic activity of silver nanoparticles using Cassia auriculata flower extract separated fraction. Spectrochim. Acta A Mol. Biomol. Spectrosc. 2017, 179, 66–72. [Google Scholar] [CrossRef]
  59. Moon, S.A.; Salunke, B.K.; Saha, P.; Deshmukh, A.R.; Kim, B.S. Comparison of dye degradation potential of biosynthesized copper oxide, manganese dioxide, and silver nanoparticles using Kalopanax pictus plant extract. Korean J. Chem. Eng. 2018, 3, 702–708. [Google Scholar] [CrossRef]
  60. Bhakya, S.; Muthukrishnan, S.; Sukumaran, M.; Muthukumar, M.; Kumar, S.T.; Rao, M.V. Catalytic degradation of organic dyes using synthesized silver nanoparticles: A green approach. J. Bioremediat. Biodegrad. 2015, 5, 1. [Google Scholar]
  61. Rajamanikandan, R.; Shanmugaraj, K.; Ilanchelian, M. Concentration dependent catalytic activity of glutathione coated silver nanoparticles for the reduction of 4-nitrophenol and organic dyes. J. Clust. Sci. 2017, 3, 1009–1023. [Google Scholar] [CrossRef]
  62. Vijayan, R.; Joseph, S.; Mathew, B. Eco-friendly synthesis of silver and gold nanoparticles with enhanced antimicrobial, antioxidant, and catalytic activities. IET nanobiotechnol. 2018, 6, 850–856. [Google Scholar] [CrossRef]
  63. Lijuan, S.U.N.; Jiang, H.E.; Songsong, A.N.; ZHANG, J.; ZHENG, J.; Dong, R.E.N. Recyclable Fe3O4@ SiO2-Ag magnetic nanospheres for the rapid decolorizing of dye pollutants. Chinese J. Catal. 2013, 7, 1378–1385. [Google Scholar]
  64. Roy, A.; Bharadvaja, N. Silver nanoparticle synthesis from Plumbago zeylanica and its dye degradation activity. Bioinspired, Biomim. Nanobiomater. 2019, 2, 130–140. [Google Scholar] [CrossRef]
  65. Awais, M.; Khursheed, S.; Tehreem, R.; Mok, S.Y.; Siddiqui, G.U. pH-regulated rapid photocatalytic degradation of methylene blue dye via niobium-nitrogen co-doped titanium dioxide nanostructures under sunlight. Appl. Catal. A-Gen. 2022, 643, 118764. [Google Scholar] [CrossRef]
  66. Abdellah, M.H.; Nosier, S.A.; El-Shazly, A.H.; Mubarak, A.A. Photocatalytic decolorization of methylene blue using TiO2/UV system enhanced by air sparging. Alex. Eng. J. 2018, 4, 3727–3735. [Google Scholar] [CrossRef]
Figure 1. Color change observed after each 10 min escorted out by their UV-Vis spectrum given below ((ac) pictures taken at 0, 10, and 20 min, respectively).
Catalysts 12 01602 g001
Figure 2. UV-Vis spectra of silver nanoparticles at different intervals of time.
Catalysts 12 01602 g002
Figure 3. UV-Vis spectra taken at different volumes of AgNO3 and arbutin solution.
Catalysts 12 01602 g003
Figure 4. UV-Vis spectra taken against different volumes of NaBH4 against the same volume of arbutin and AgNO3 solutions.
Catalysts 12 01602 g004
Figure 5. (a) DLS spectra of silver nanoparticles showing size distribution in the solution. (b) Zeta potential of synthesized silver nanoparticles.
Catalysts 12 01602 g005
Figure 6. AFM images of prepared silver nanoparticles, (a,b) 2D images, (c,d) 3D zoomed images of nanoparticles along Z-axis, and (e) size distribution throughout the solution.
Catalysts 12 01602 g006
Figure 7. XRD spectra of prepared silver nanoparticles.
Catalysts 12 01602 g007
Figure 8. SEM (a,b) and EDX images (c) of synthesized silver nanoparticles.
Catalysts 12 01602 g008
Figure 9. FTIR spectra of synthesized silver nanoparticles.
Catalysts 12 01602 g009
Figure 10. (a) UV-Vis spectra of methylene blue solution. (b) UV-Vis spectra of methylene blue solution after treatment with NaBH4. (c) Degradation trend of methylene blue monitored for an hour with regular intervals of 2 min showing decrease in absorbance, time-dependent kinetically plotted graph (d).
Catalysts 12 01602 g010
Figure 11. UV-vis spectrum recorded after treating solution of methylene blue with NaBH4 and synthesized silver nanoparticles (taken after each 2 min for an hour).
Catalysts 12 01602 g011
Figure 12. Possible mechanism of degradation of Methylene Blue.
Catalysts 12 01602 g012
Figure 13. (a,b) UV-Vis spectrum of methyl orange solution in water (a), degradation trend of methyl orange after addition of catalysts, kinetically plotted graph (c).
Catalysts 12 01602 g013
Figure 14. UV-Vis spectra of methyl orange after treating it with NaBH4 and silver nanoparticles respectively (taken after each 4 min for an hour).
Catalysts 12 01602 g014
Figure 15. Possible mechanism of catalytic activity of Methyl Orange.
Catalysts 12 01602 g015
Figure 16. UV-Vis spectra of safranin O dye (a), UV-Vis spectra of safranin O after treating with NaBH4 (b), degradation trend of safranin by passage of time (c), kinetically plotted graph between time and Ln (Co/Ct) (d).
Catalysts 12 01602 g016
Figure 17. Time-dependent spectra of dye degradation after addition of silver nanoparticles solution monitored after each 4 min.
Catalysts 12 01602 g017
Figure 18. Possible mechanism of degradation of Safranin O.
Catalysts 12 01602 g018
Figure 19. UV-Vis spectra of Eosin Y solution (a), UV-Vis spectra of Eosin Y after treating it with NaBH4 (b), degradation trend of EY dye after addition of silver nanoparticles solution (c), time-dependent kinetically plotted graph (d).
Catalysts 12 01602 g019
Figure 20. Series of spectra showing the degradation of EY against silver nanoparticles taken after each 4 min for an hour.
Catalysts 12 01602 g020
Figure 21. Possible mechanism of catalytic degradation of Eosin Y.
Catalysts 12 01602 g021
Figure 22. The effect of different radical scavengers on catalytic degradation of Eosin Y by arbutin-mediated AgNPs.
Catalysts 12 01602 g022
Table 1. Specifications of peaks observed in DLS.
Size (d.nm)% IntensitySt. Dev. (d.nm)
Peak 1101.571.659.04
Peak 219.2018.85.815
Peak 33.6775.10.9729
Publisher’s Note: MDPI stays neutral with regard to jurisdictional claims in published maps and institutional affiliations.

