

Hydrogen Production through Bi-Reforming of Methane: Improving Ni Catalyst Performance via an Exsolution Approach

 , , , , , and
Abstract
:
1. Introduction
2. Results and Discussion
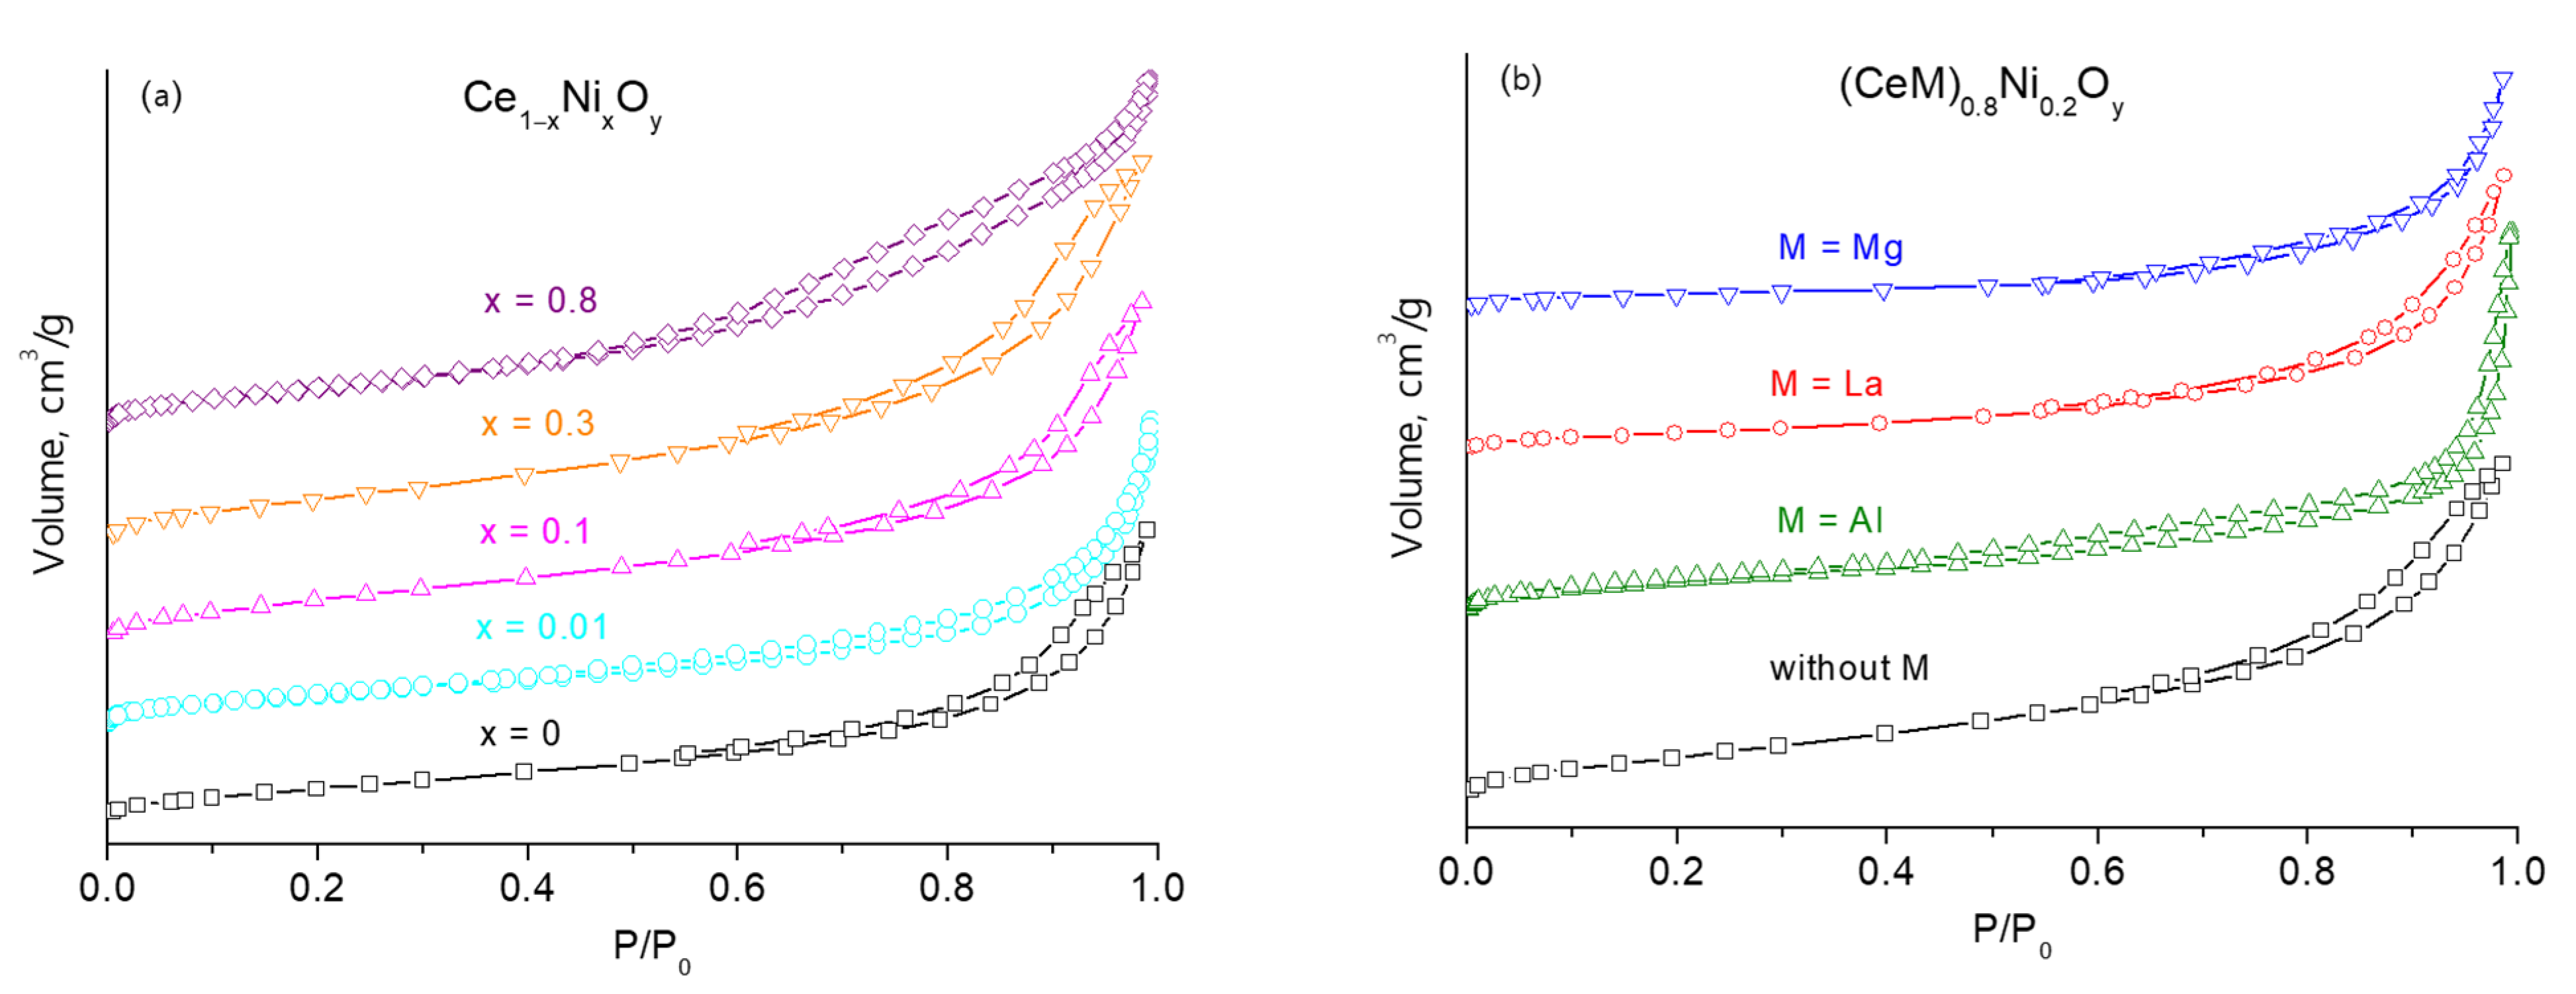
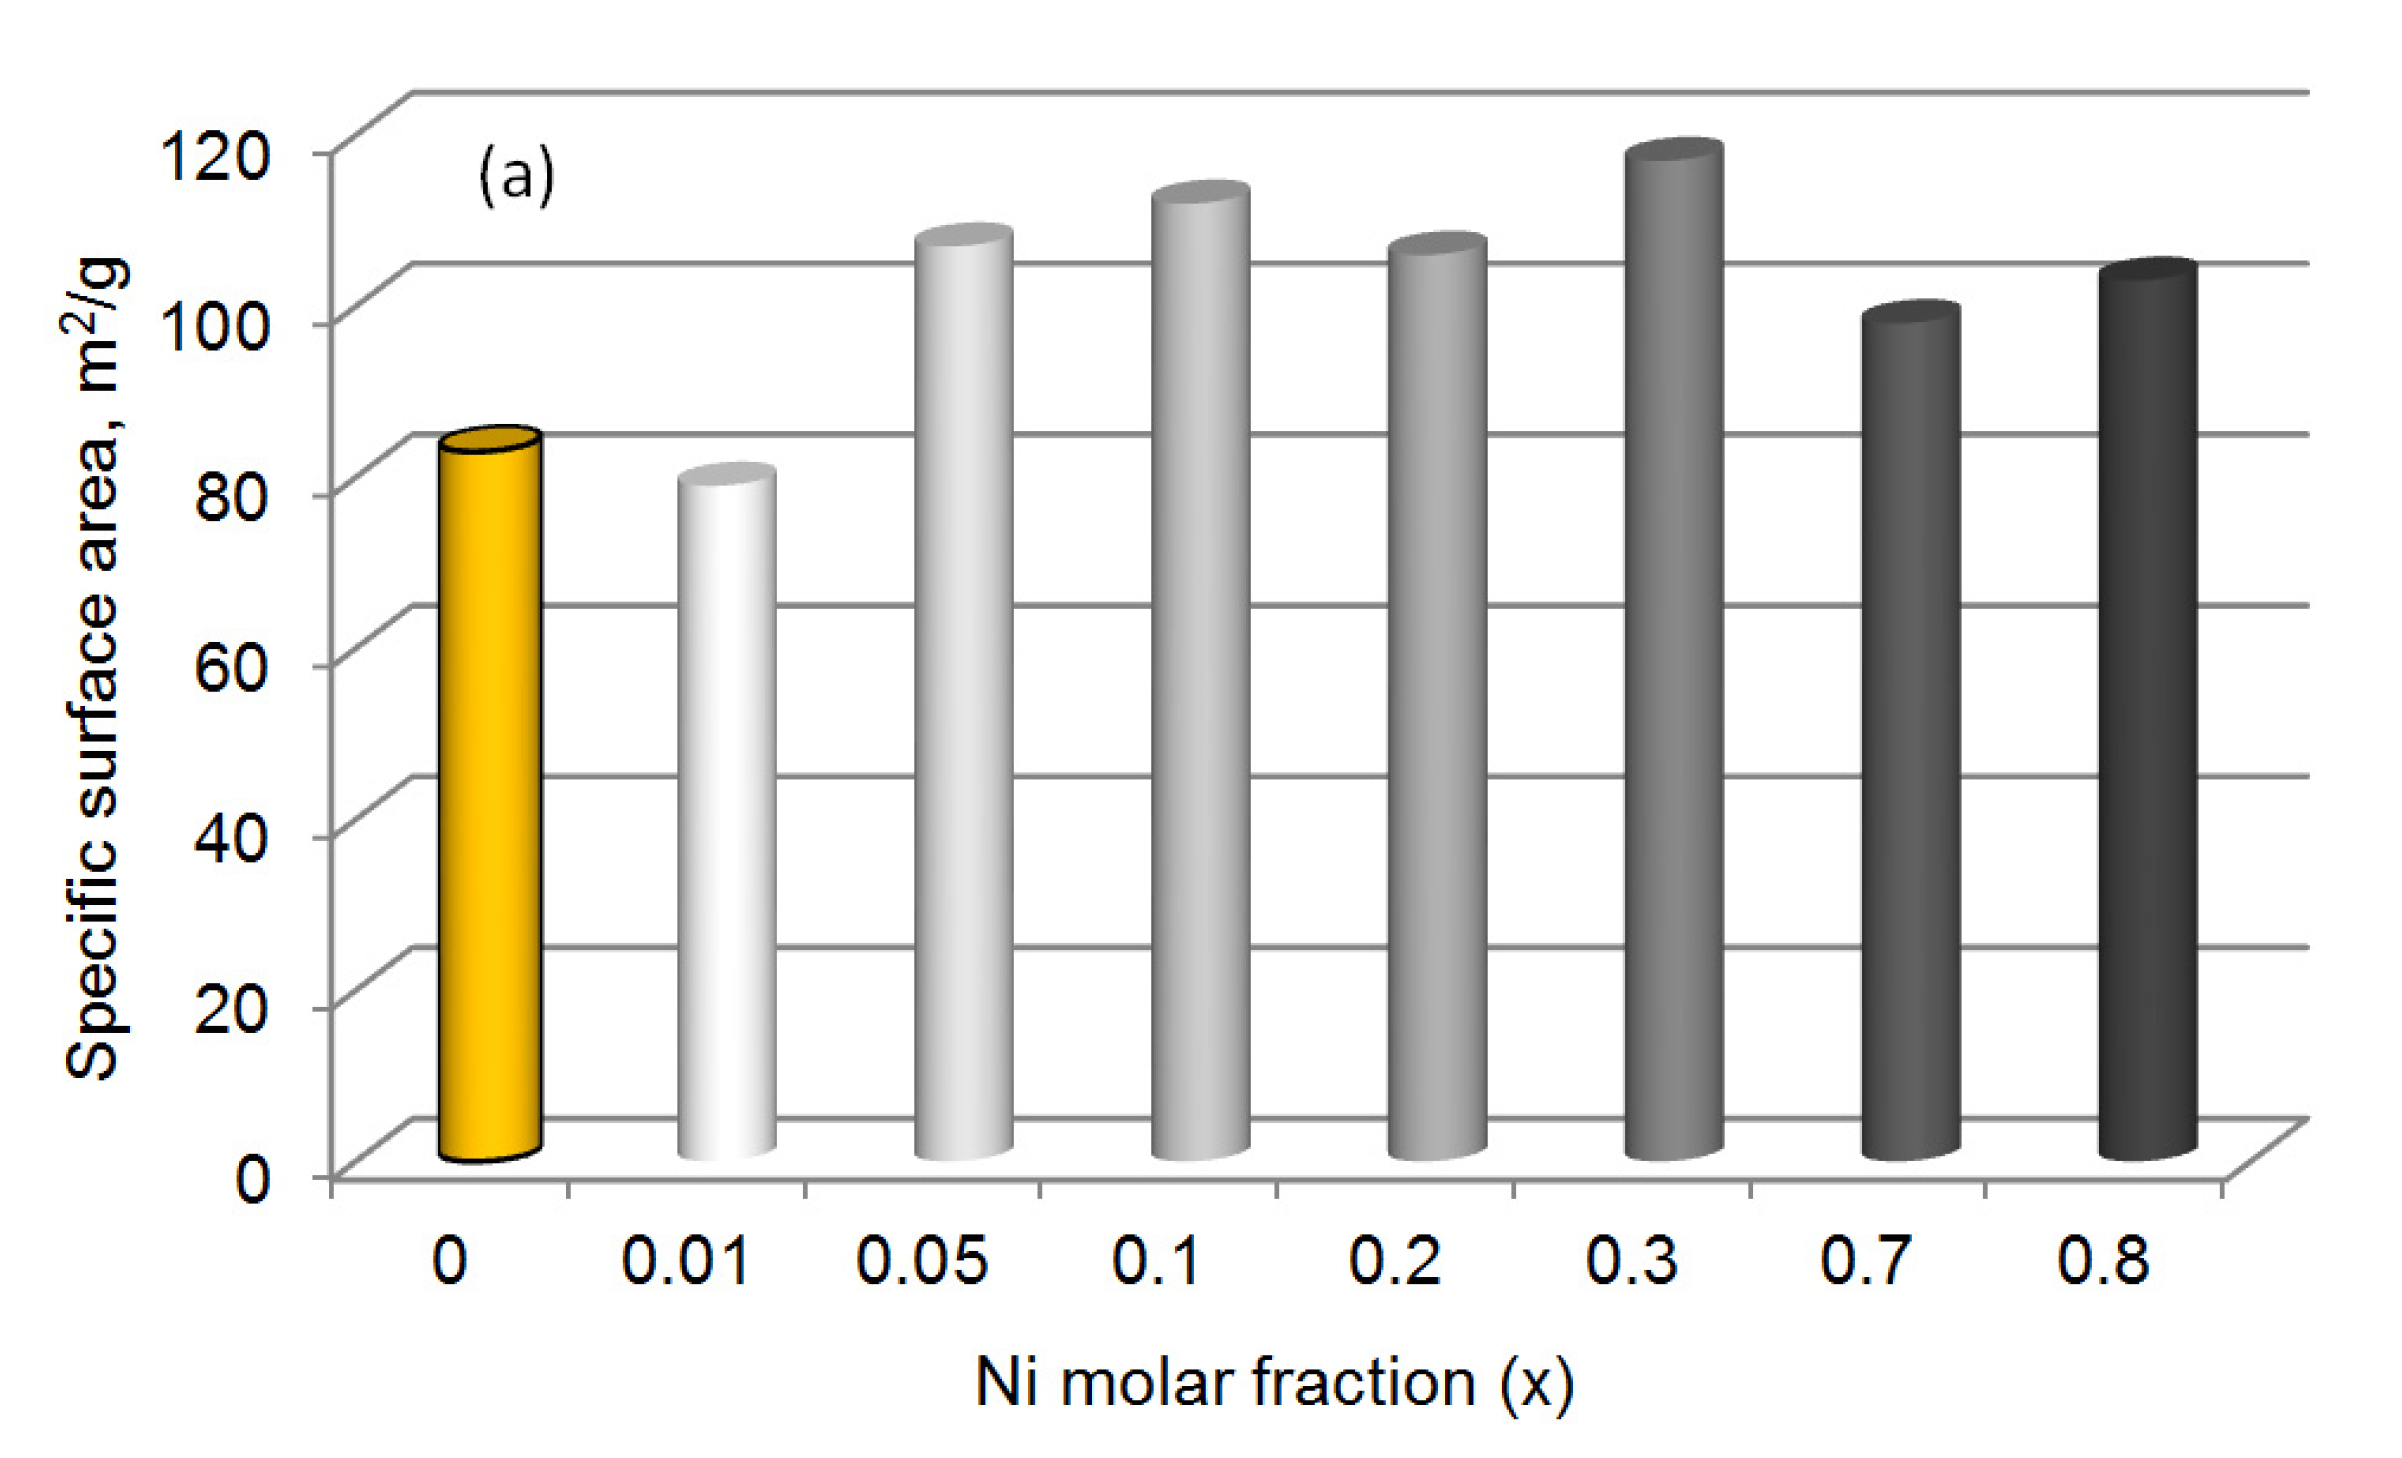
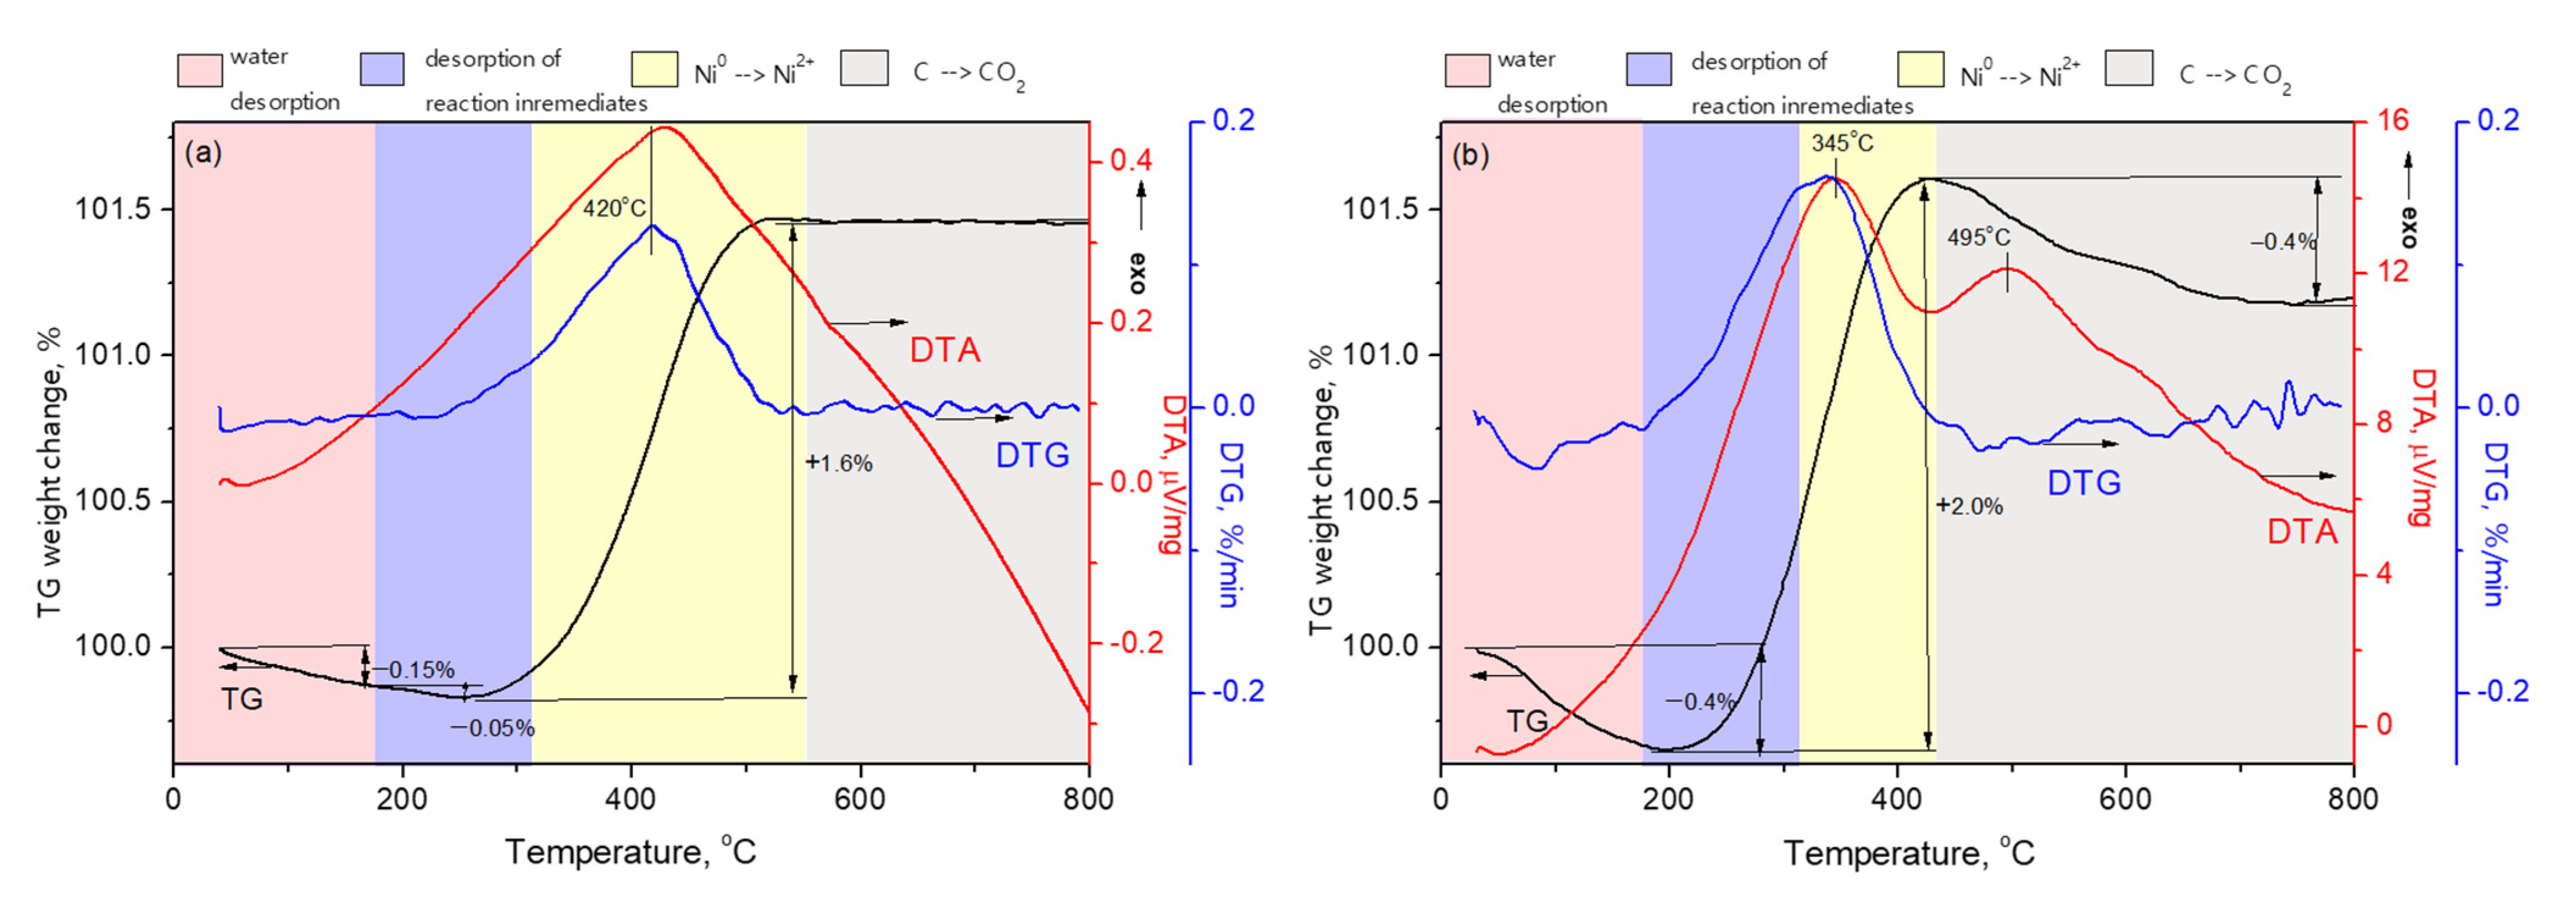
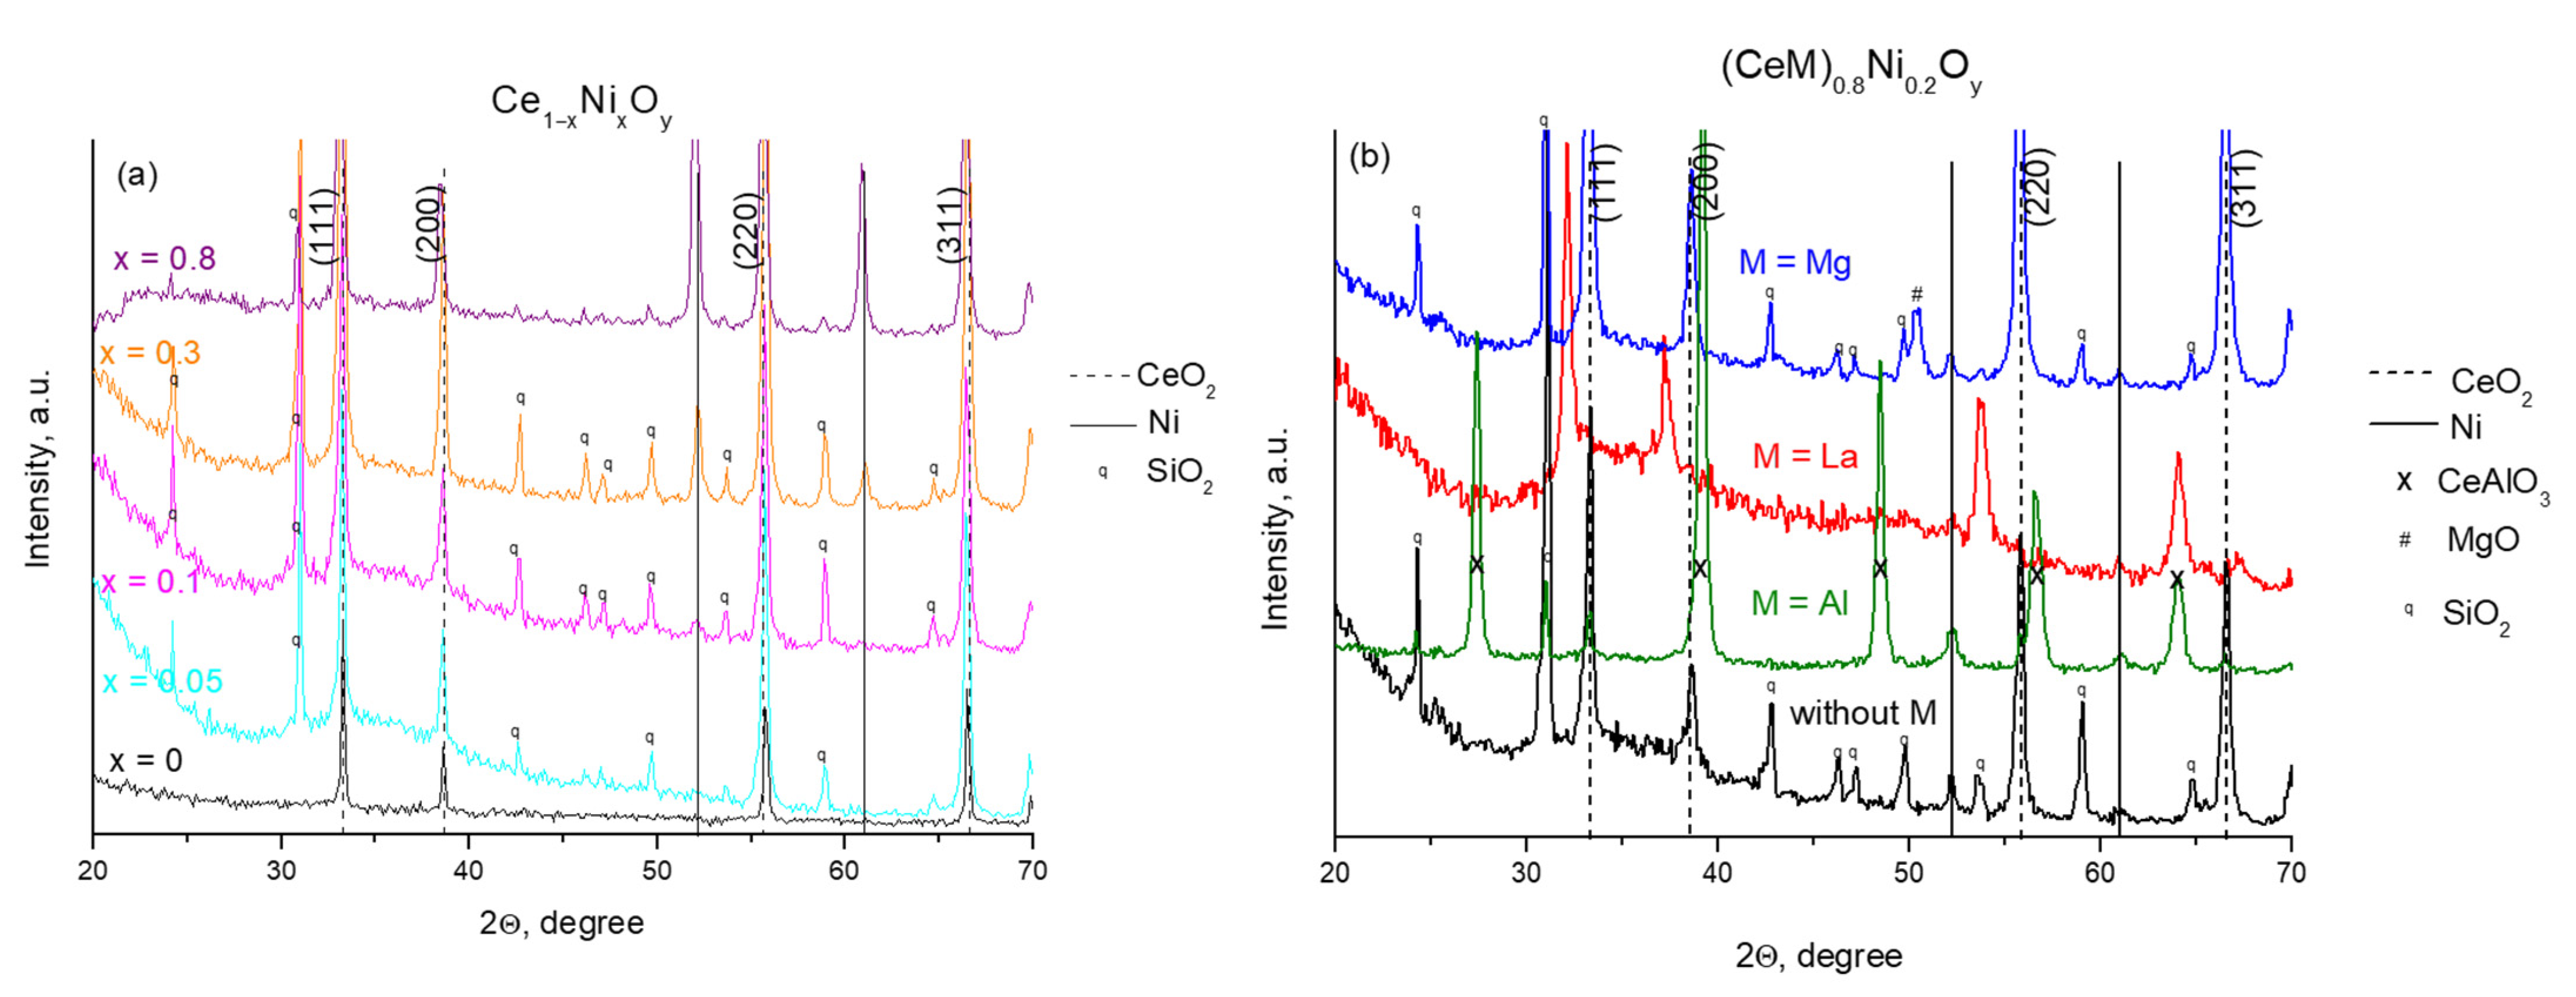
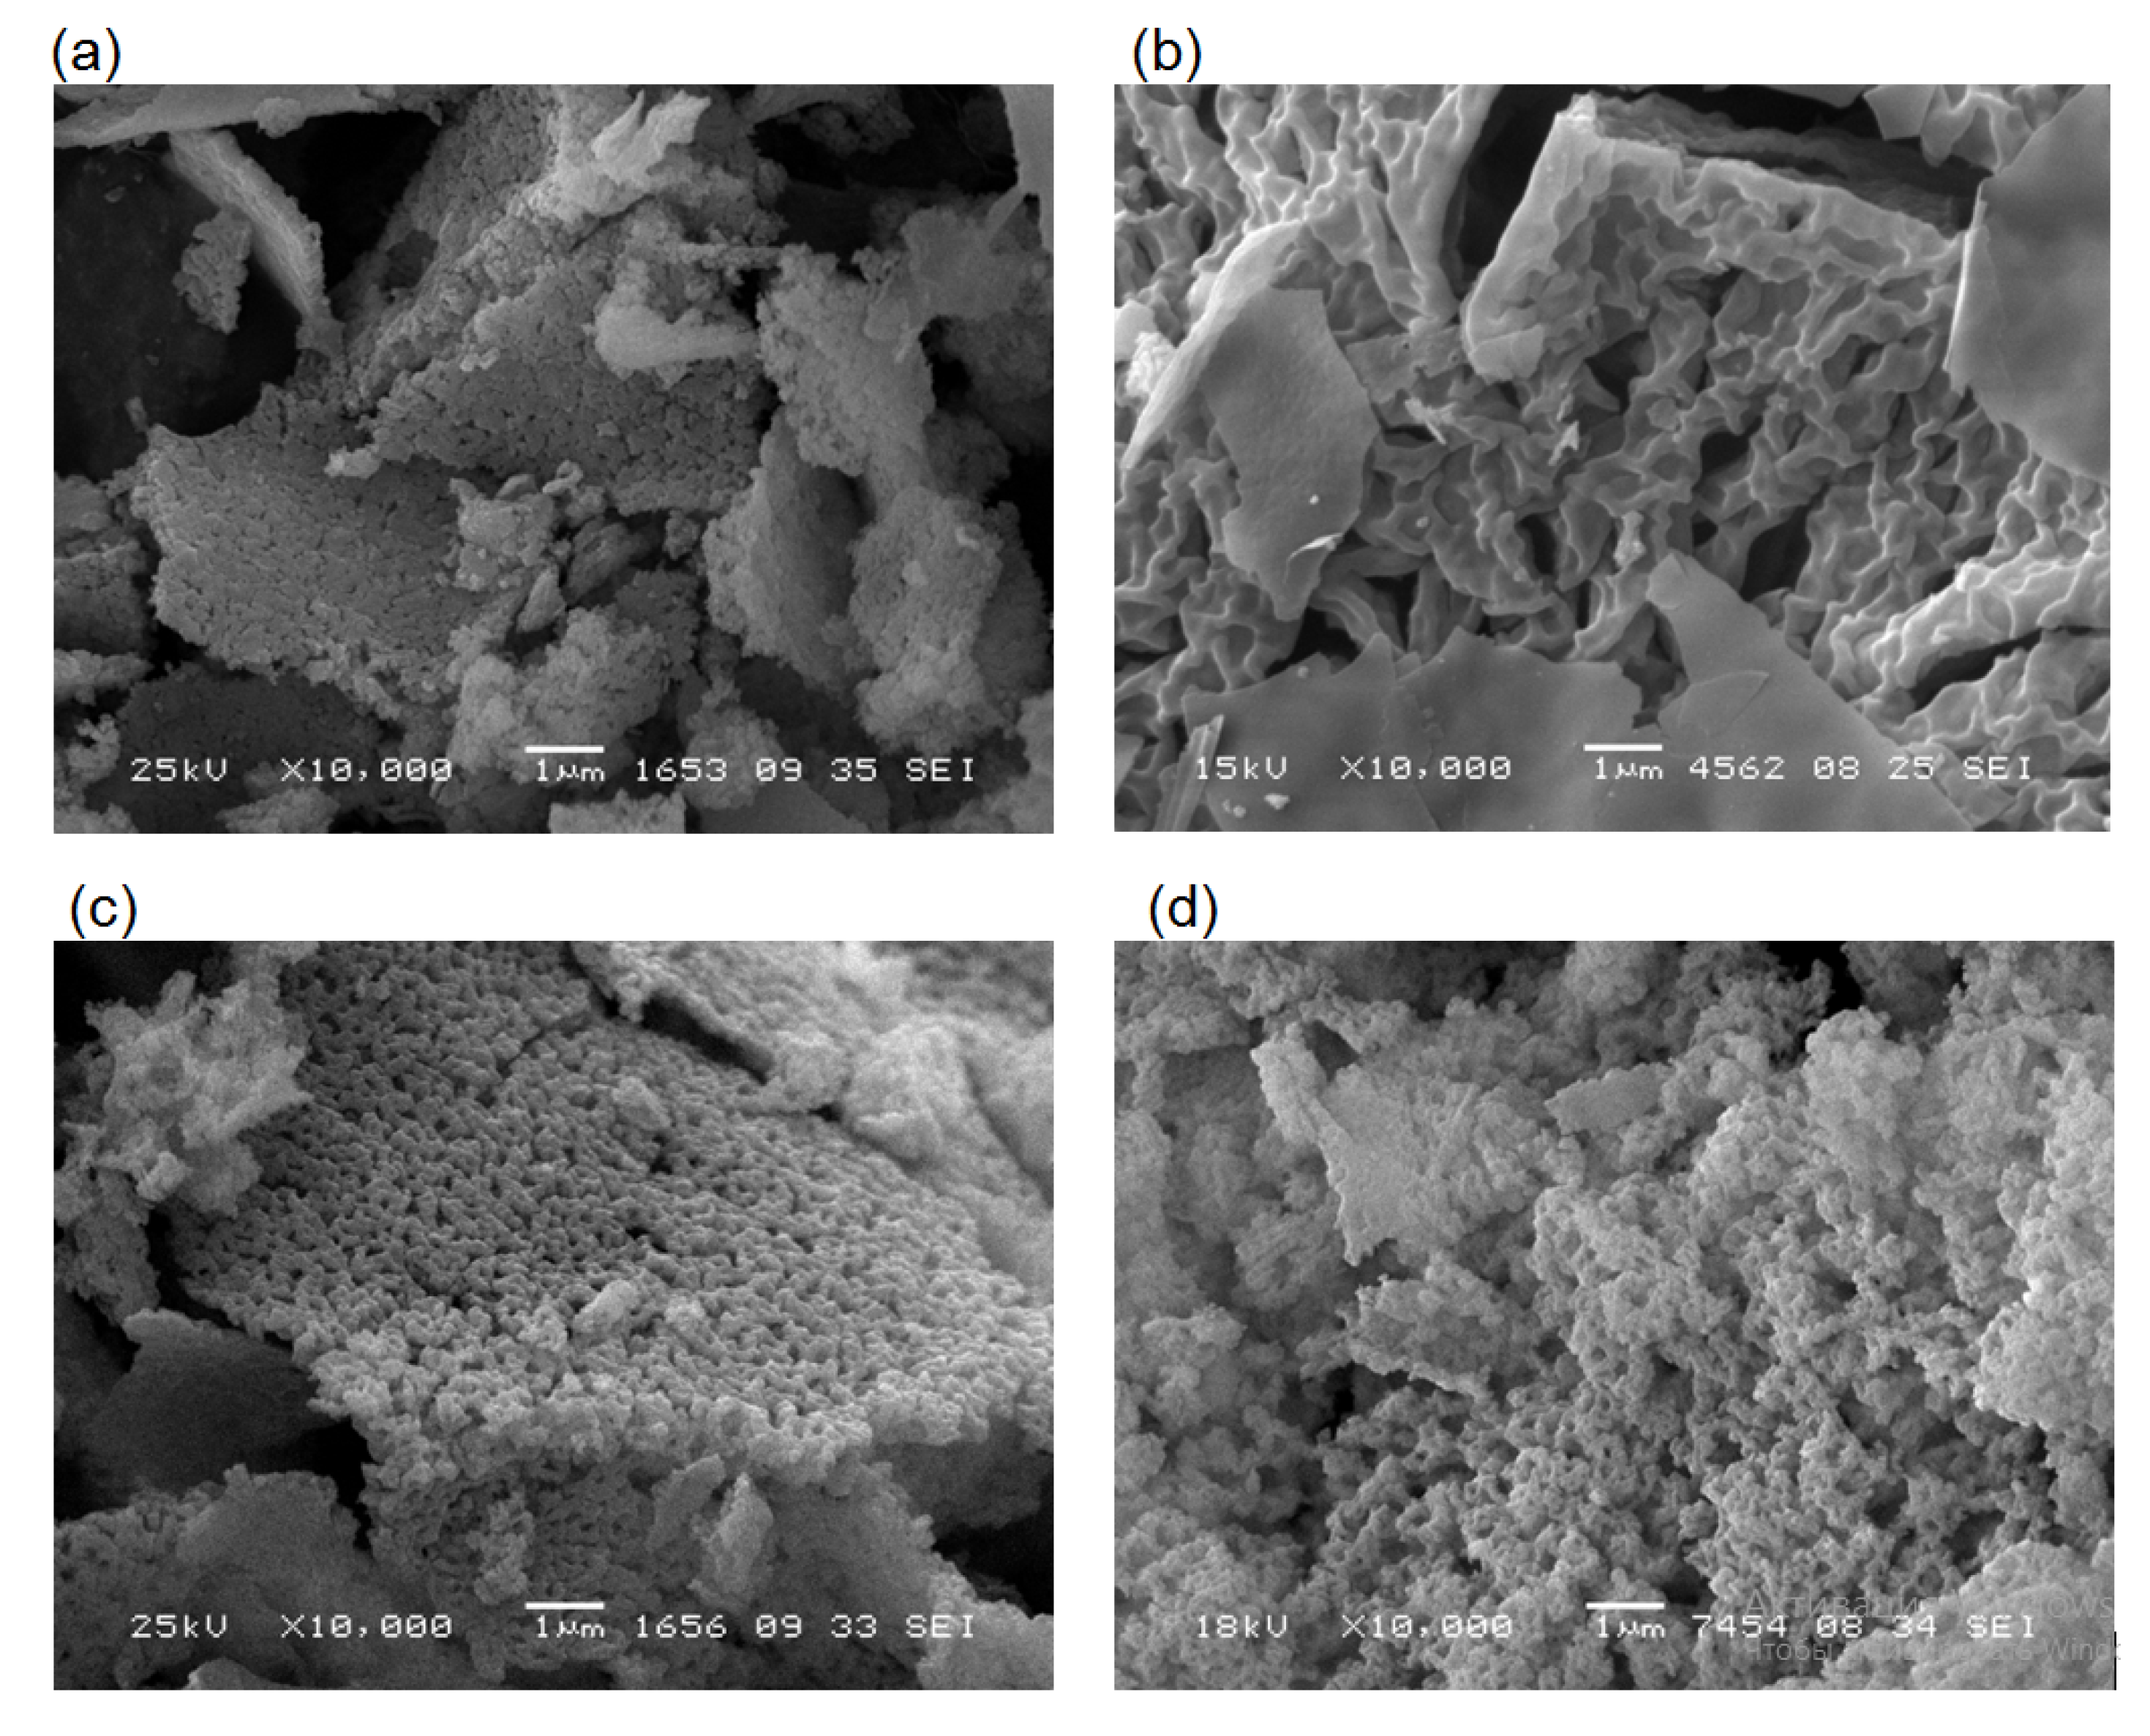
2.1. Characterization of Fresh Samples
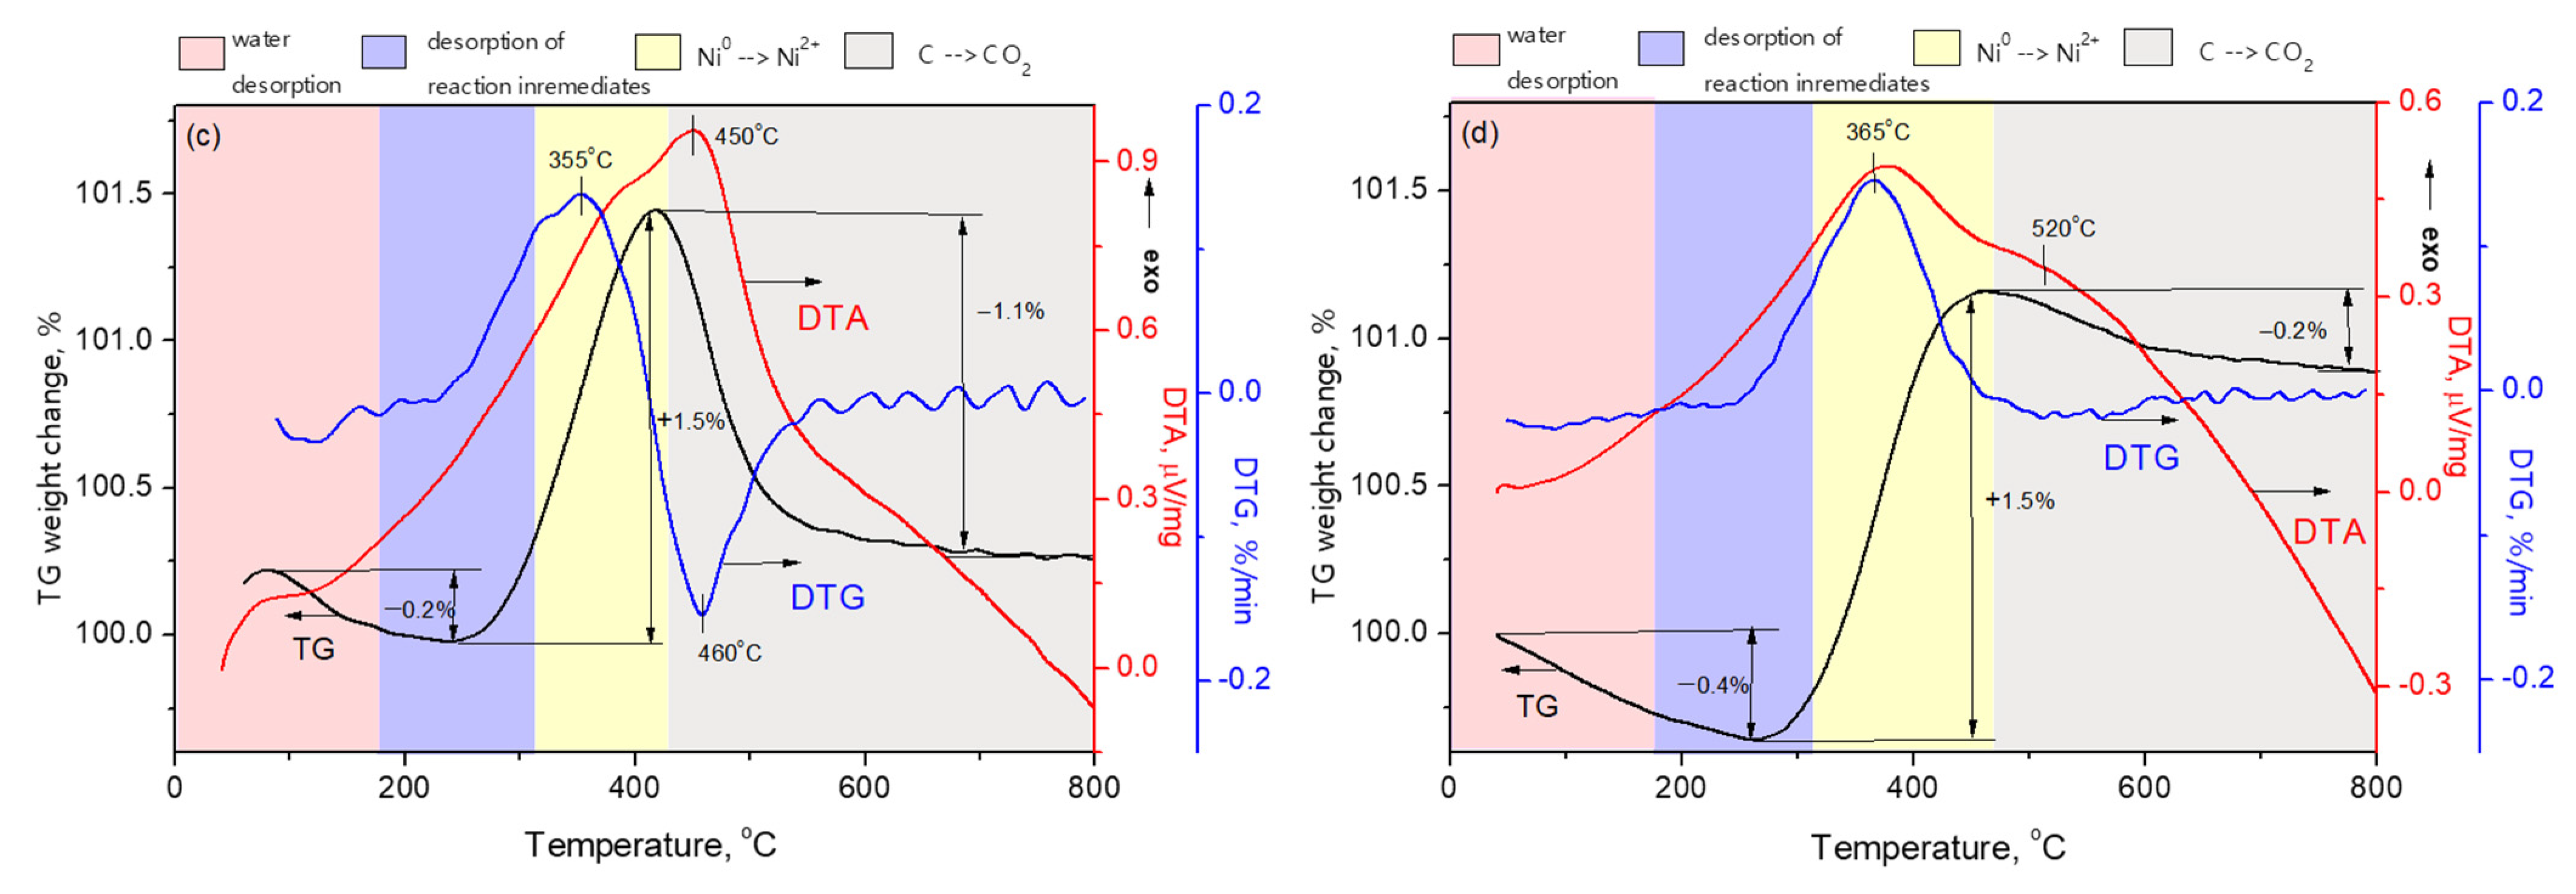
2.2. Activation of Samples
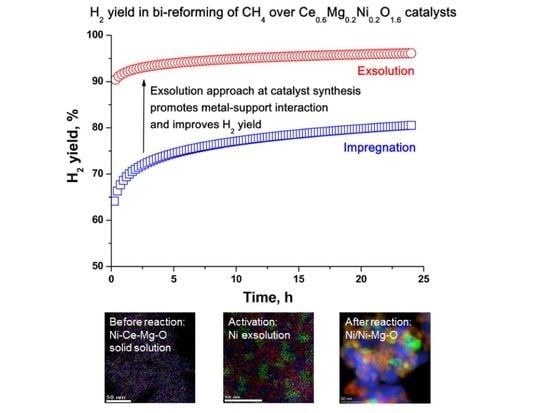
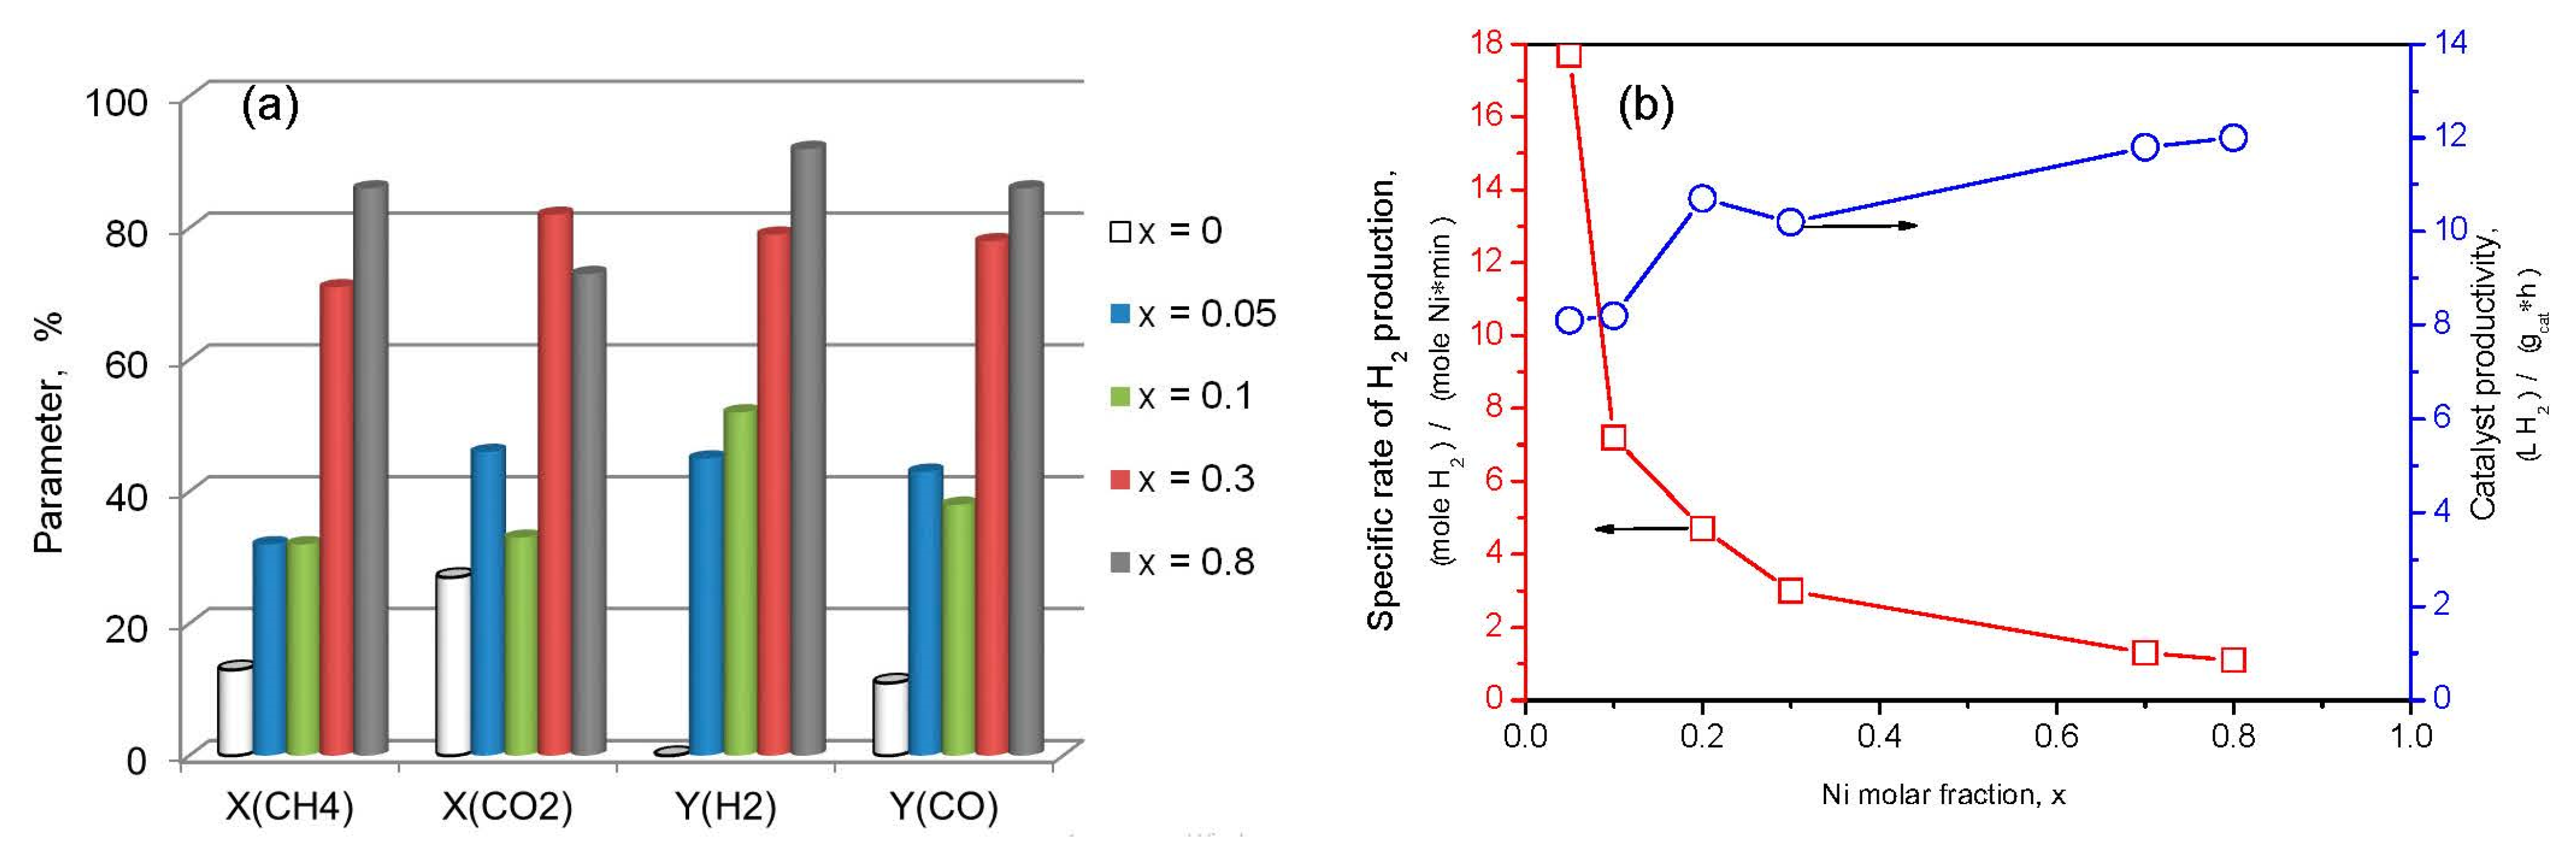
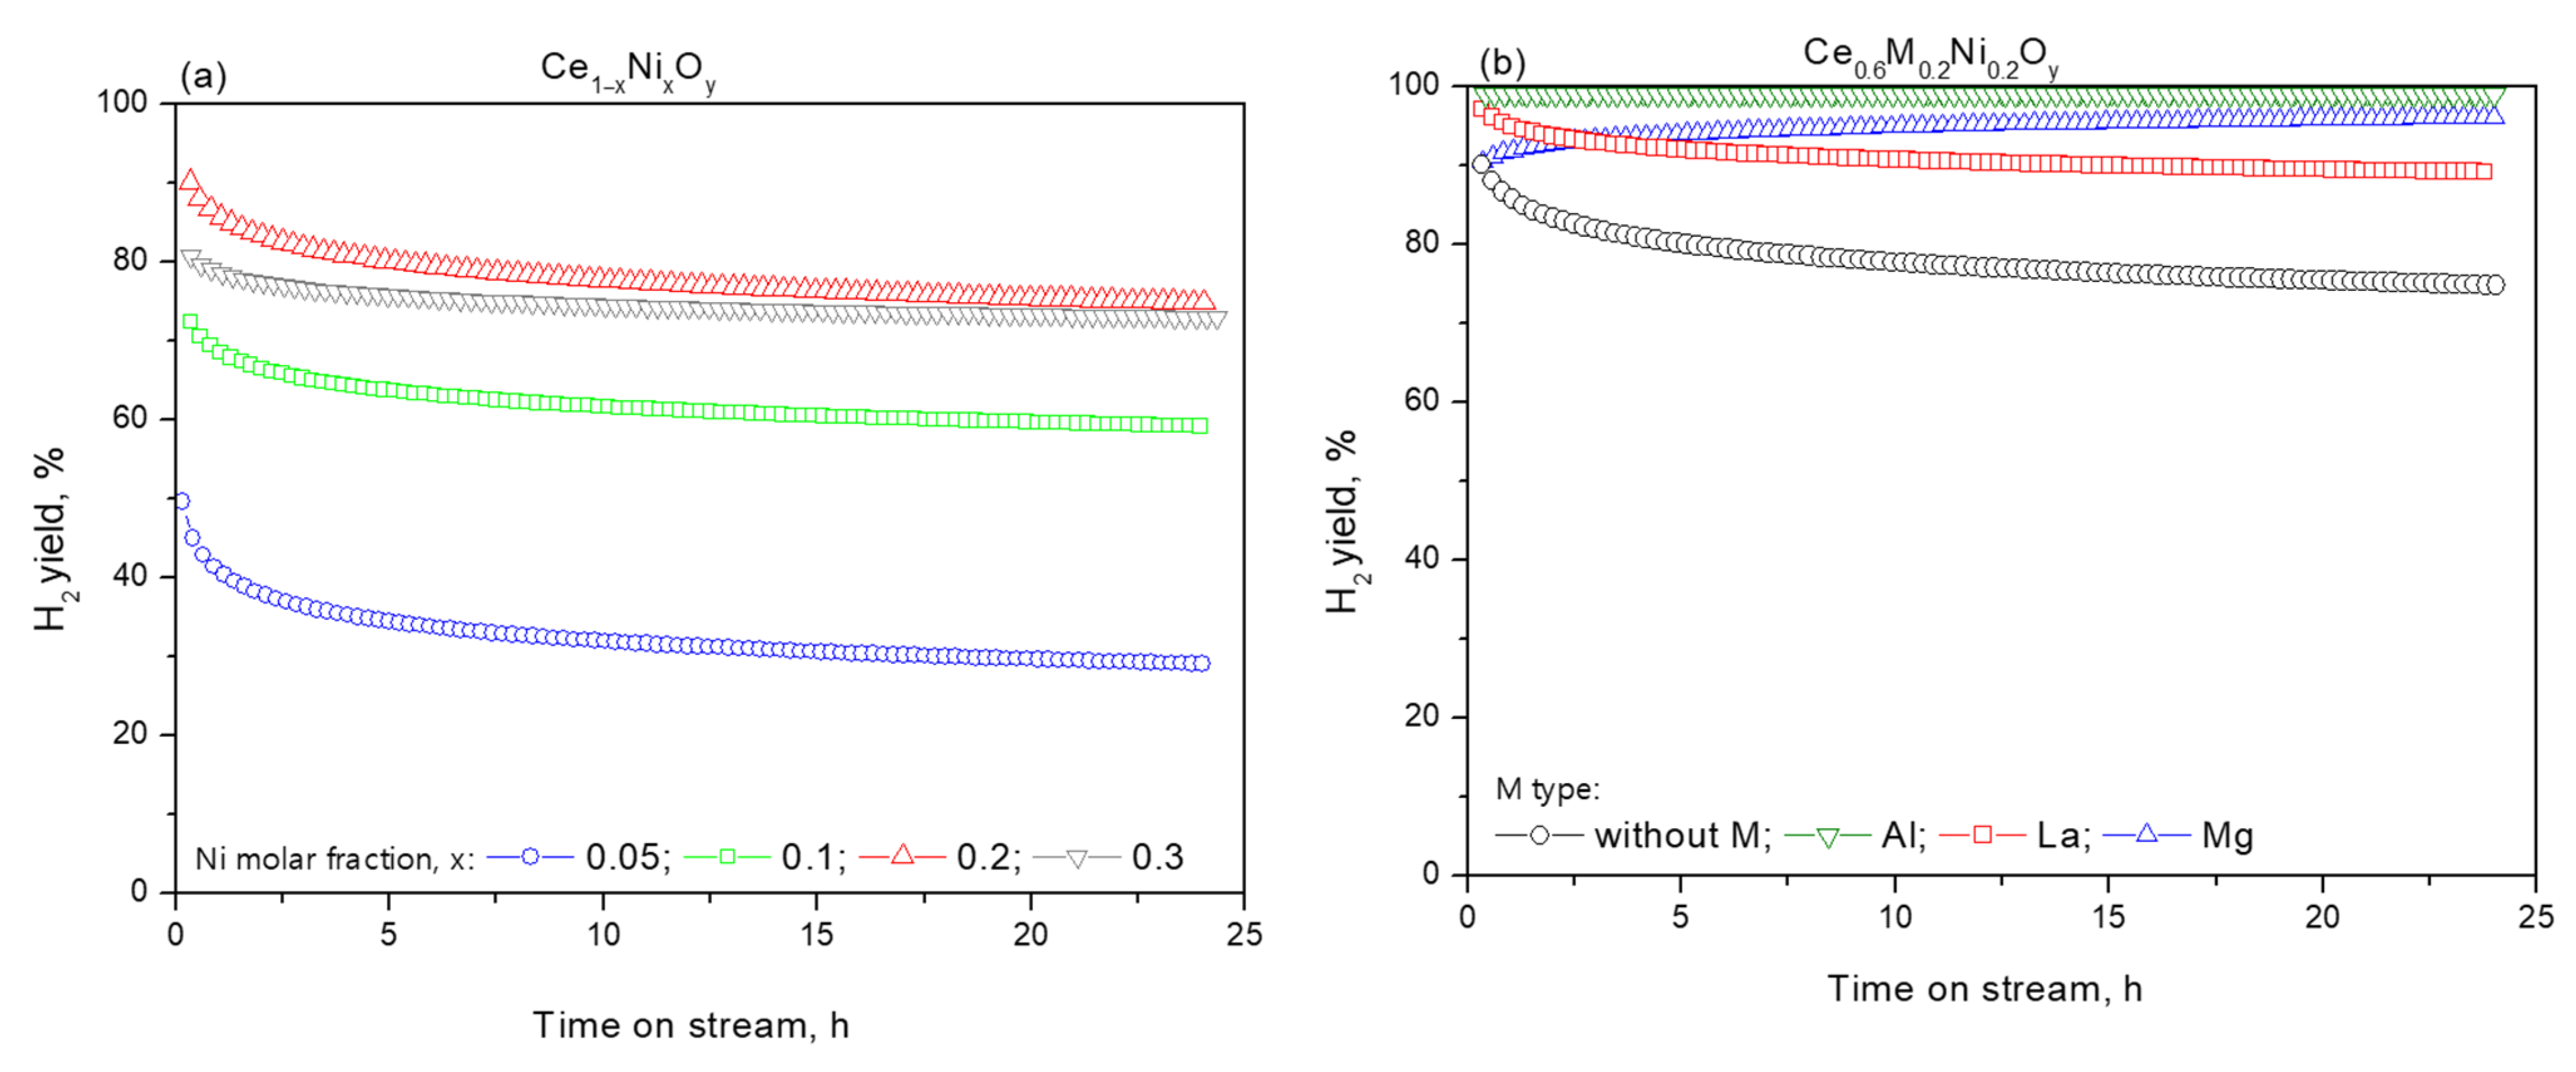
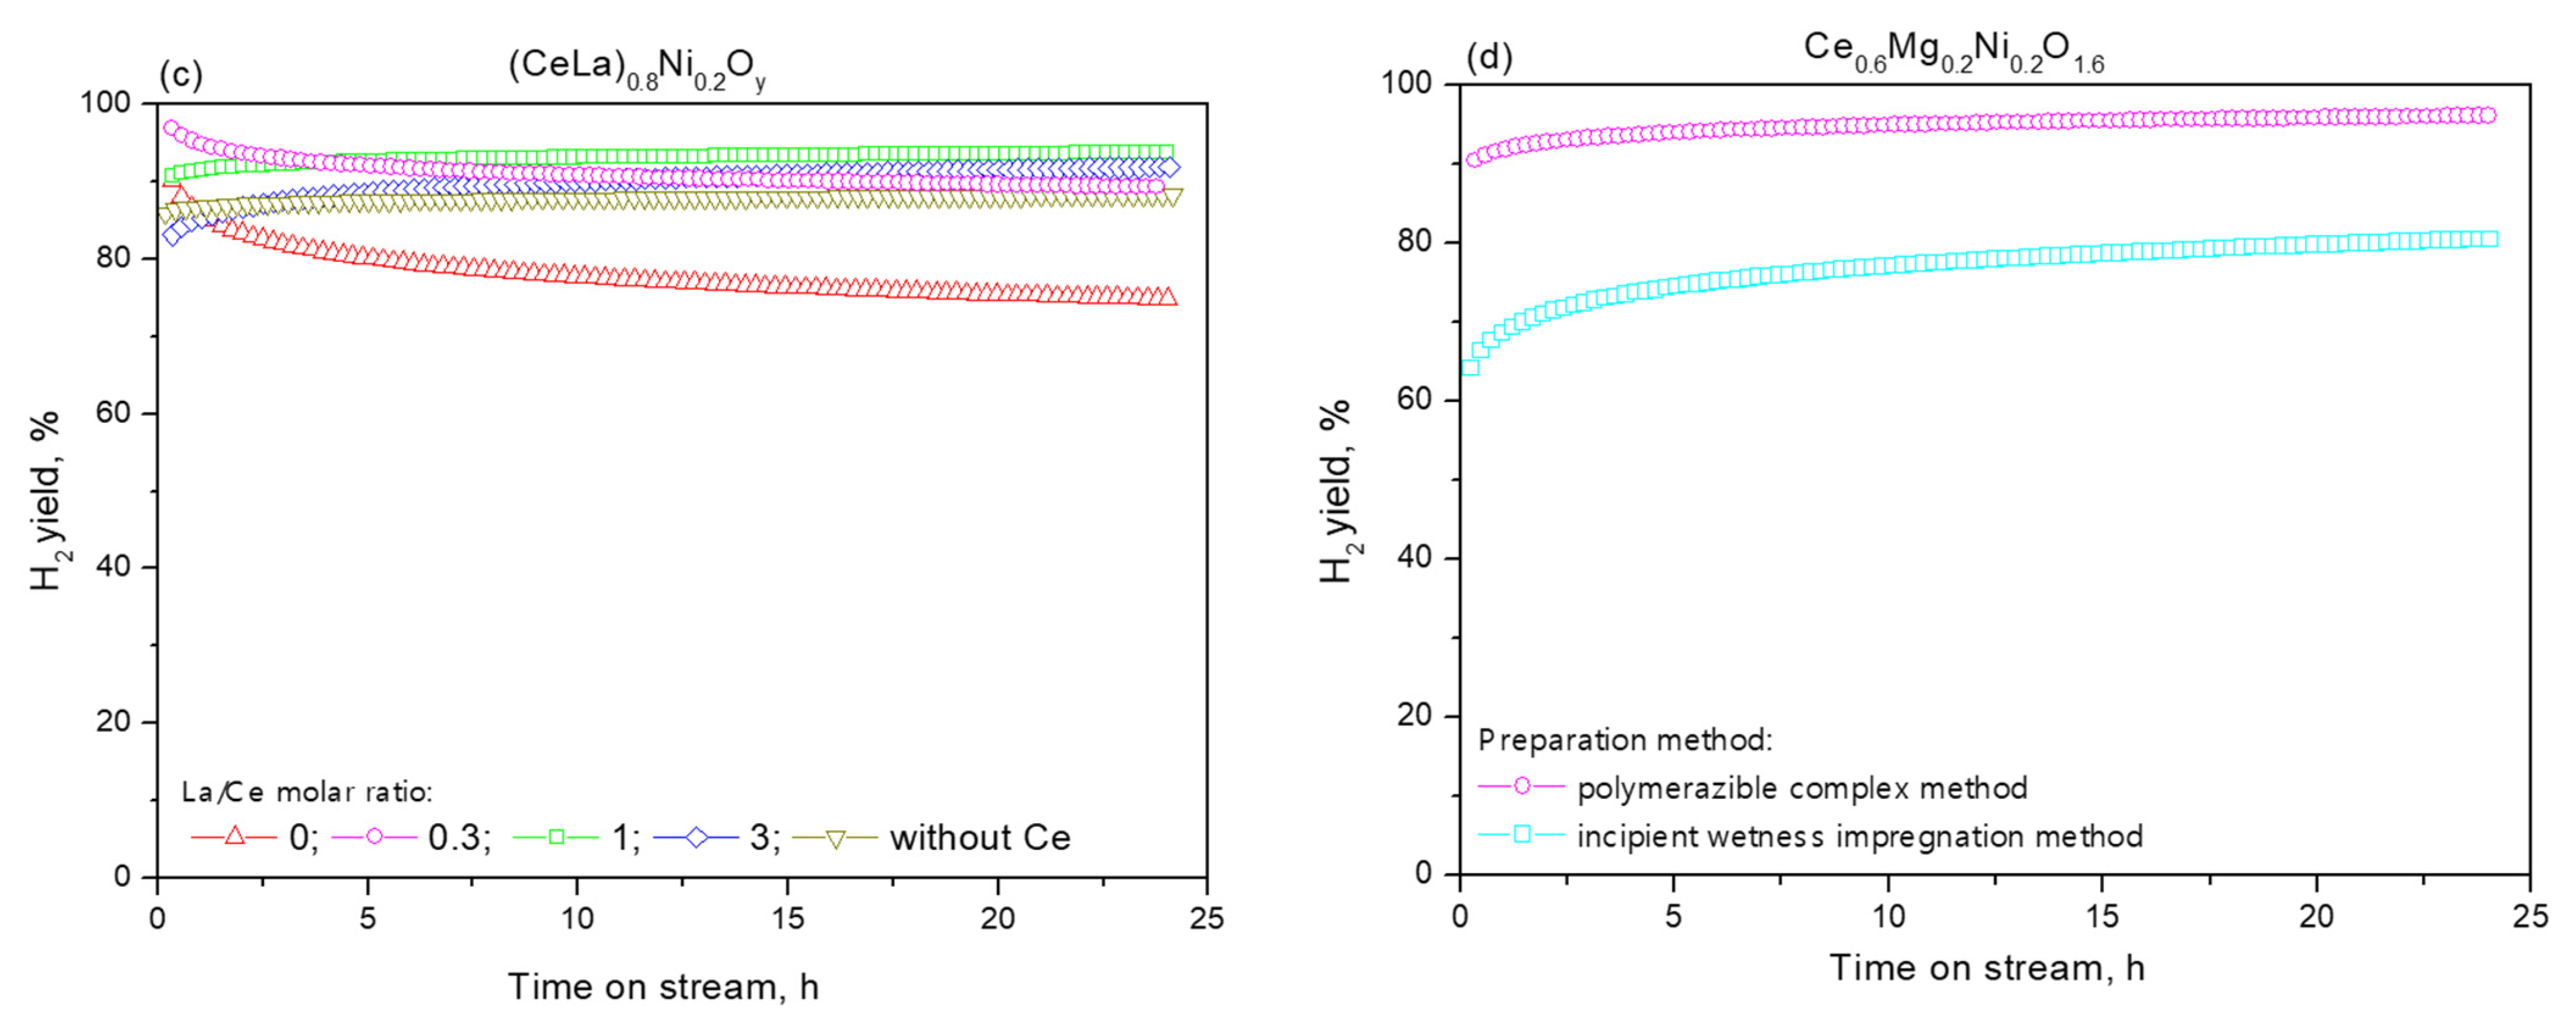
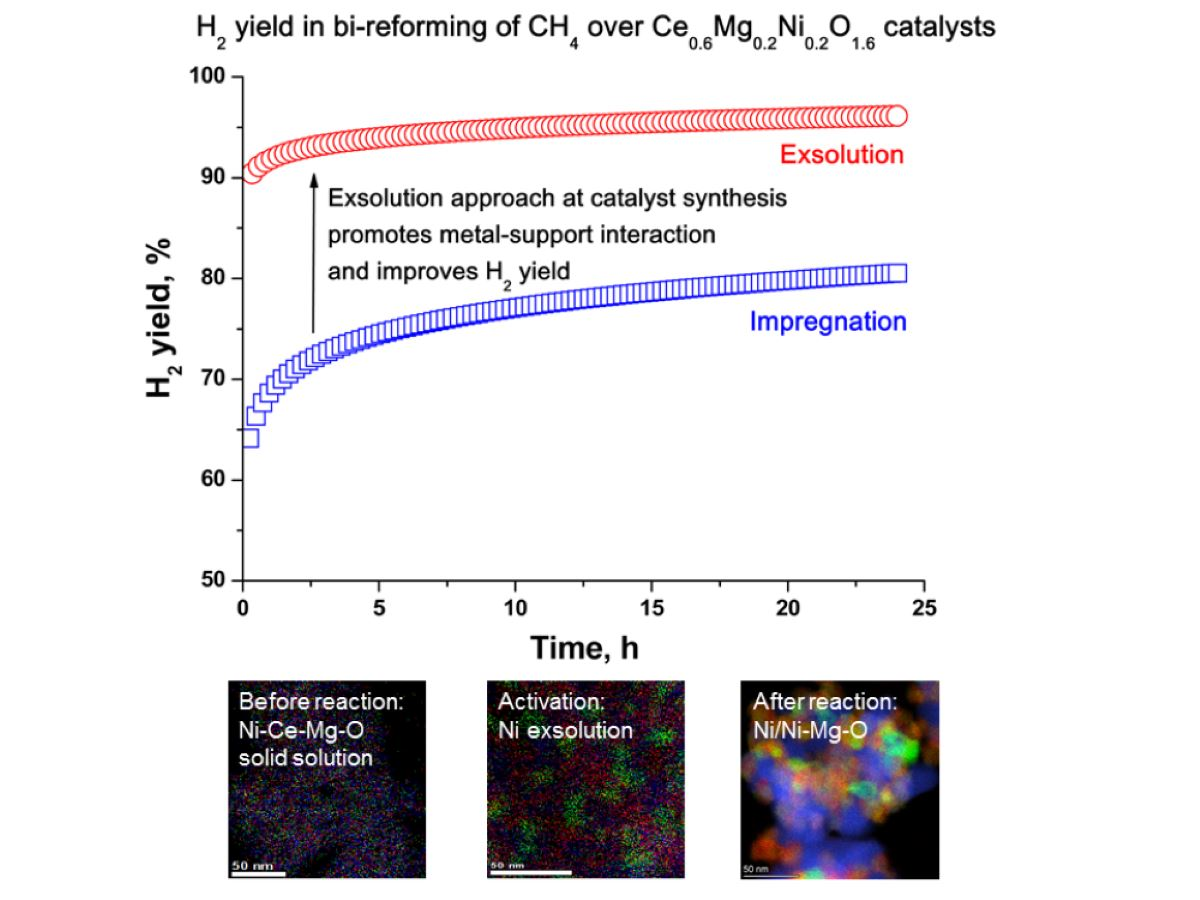
2.3. Functional Properties
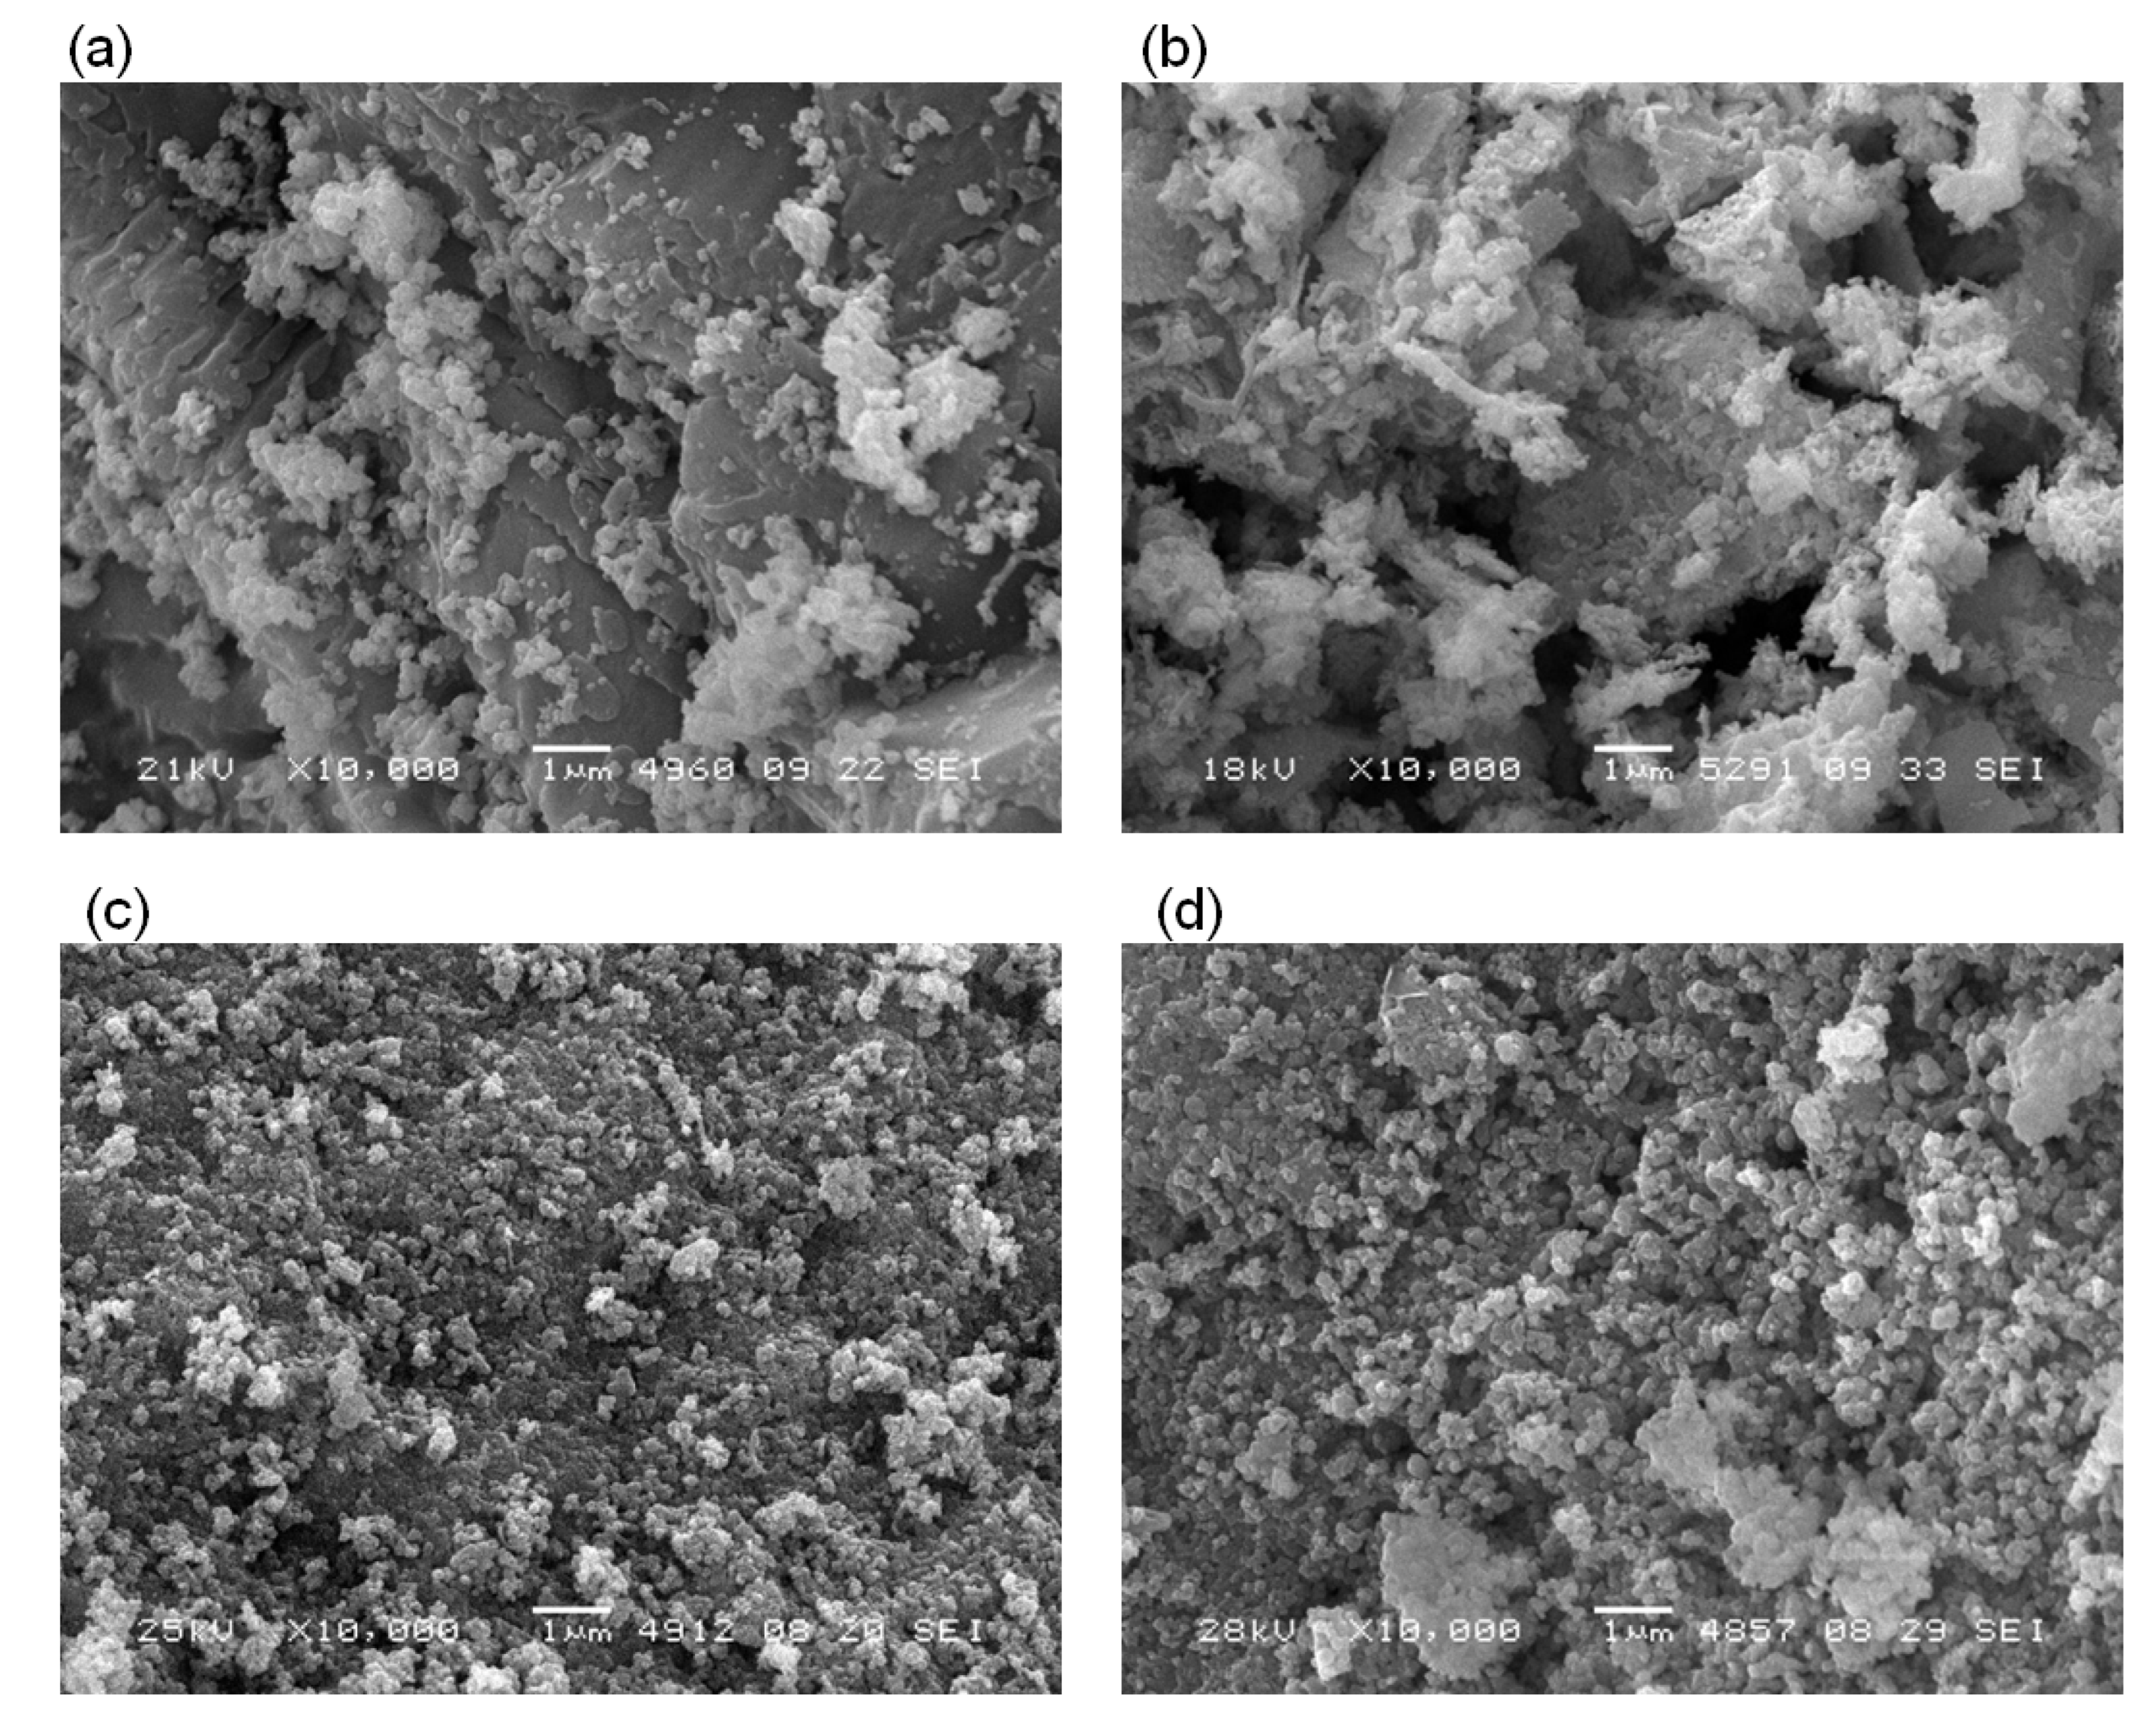
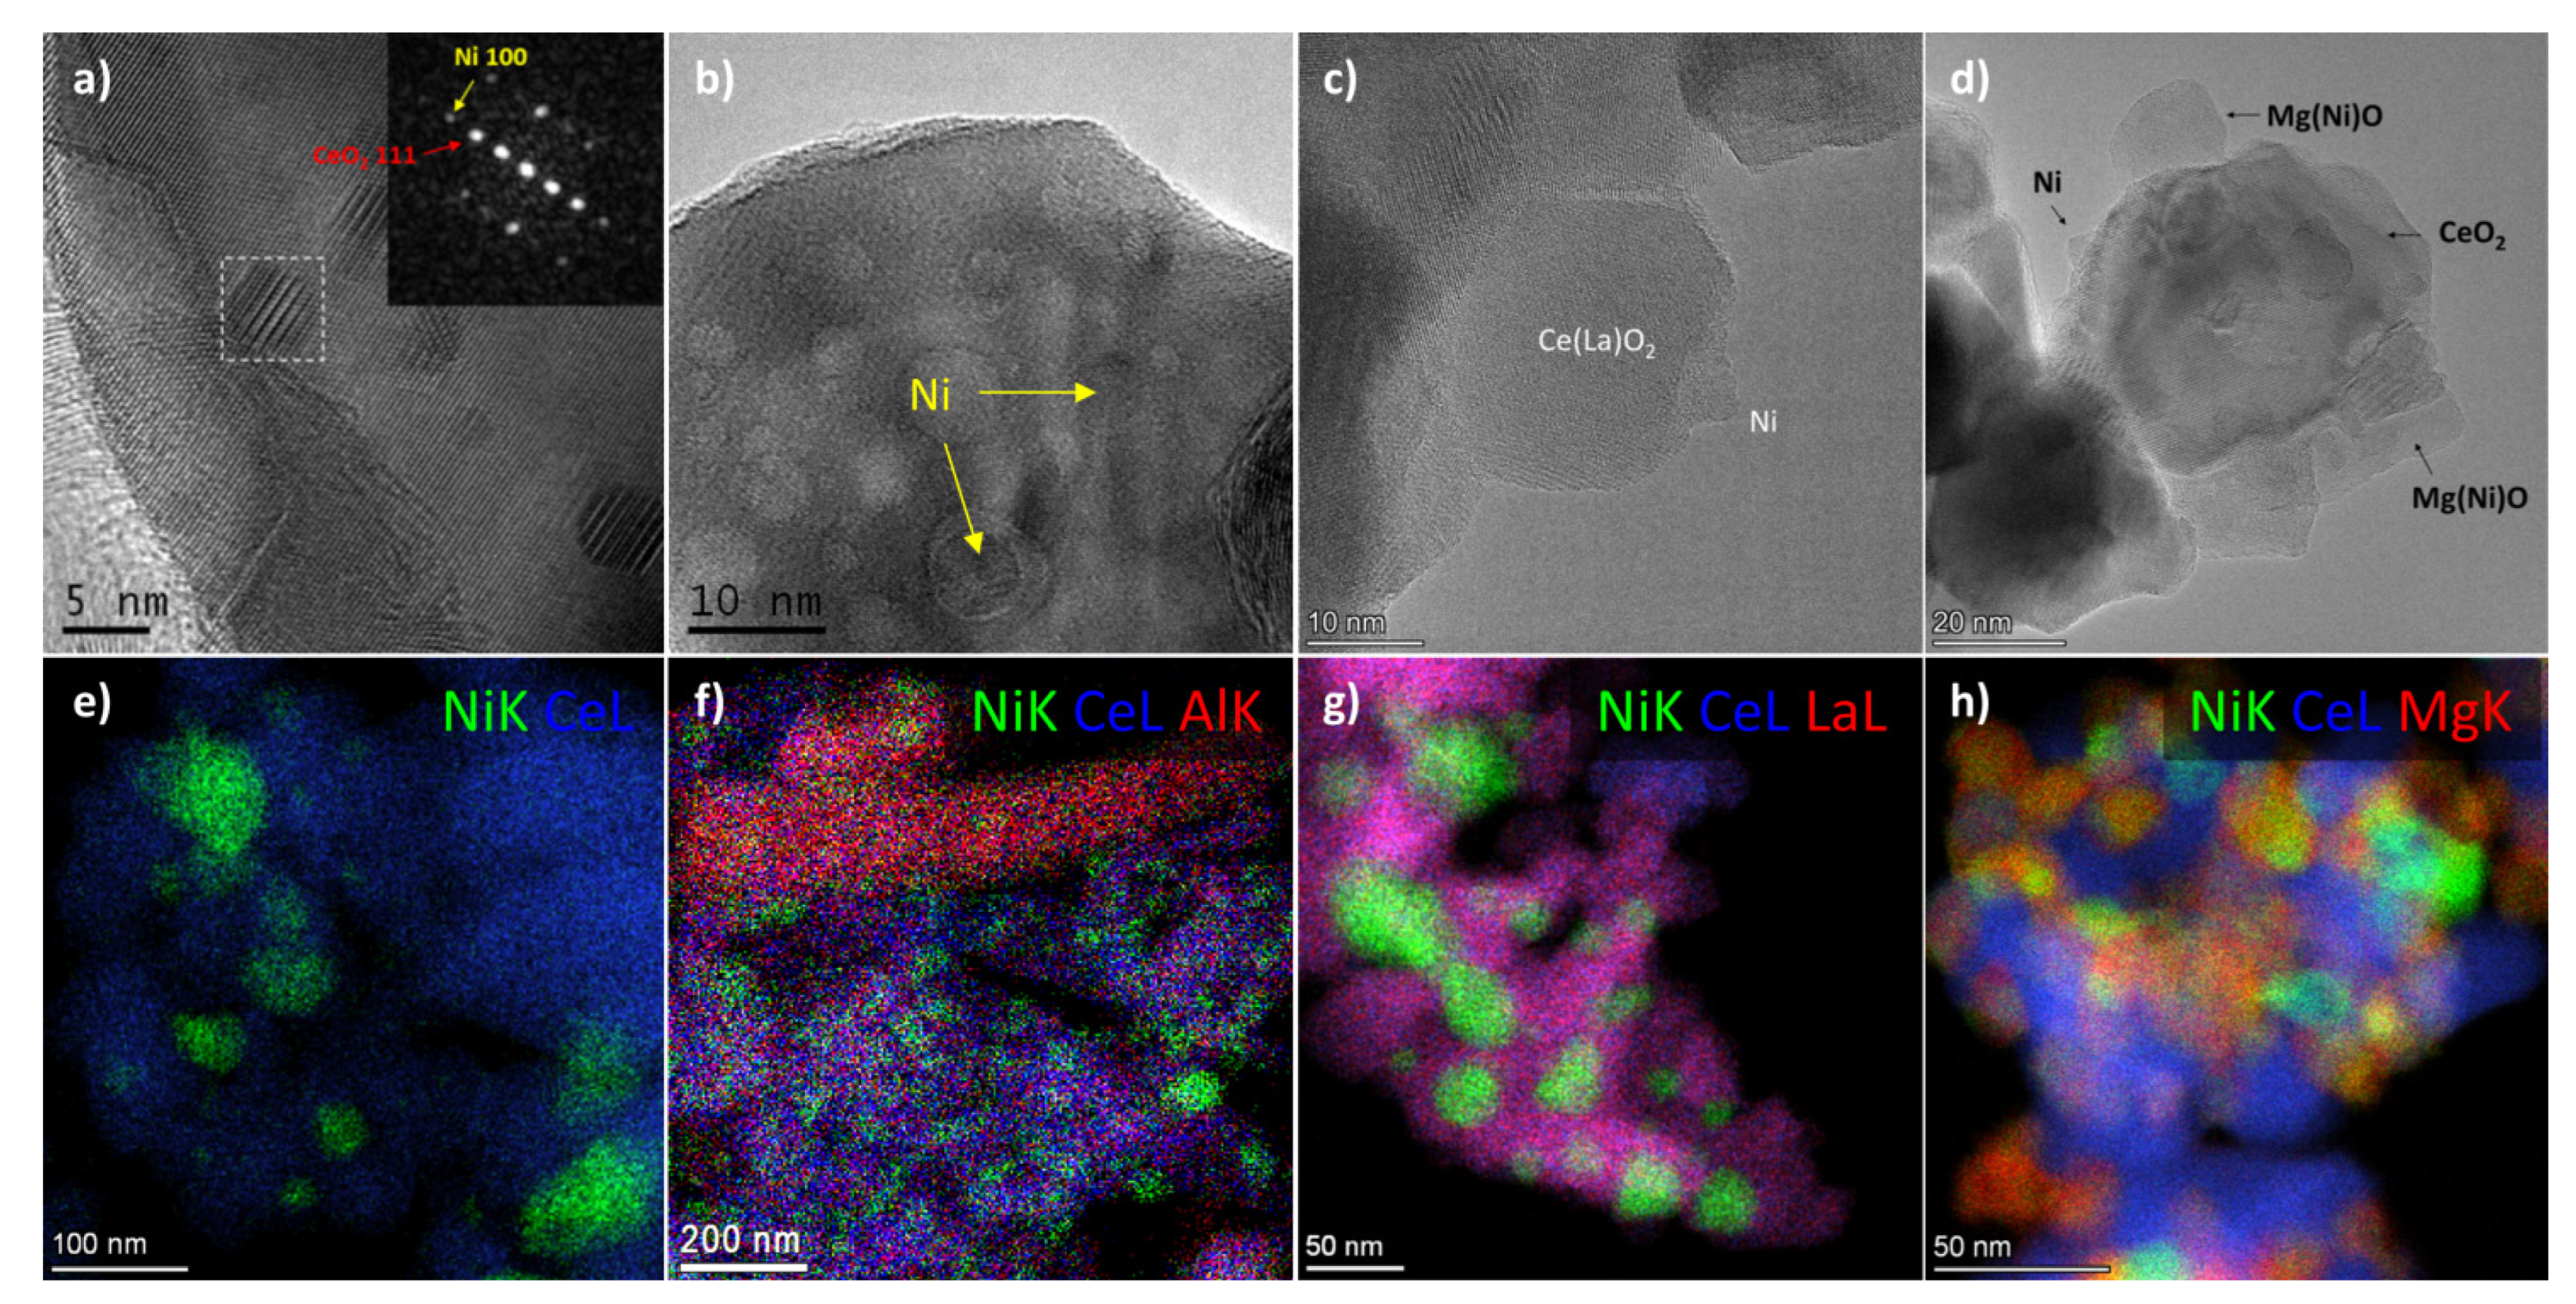
2.4. Characterization of Spent Samples
3. Materials and Methods
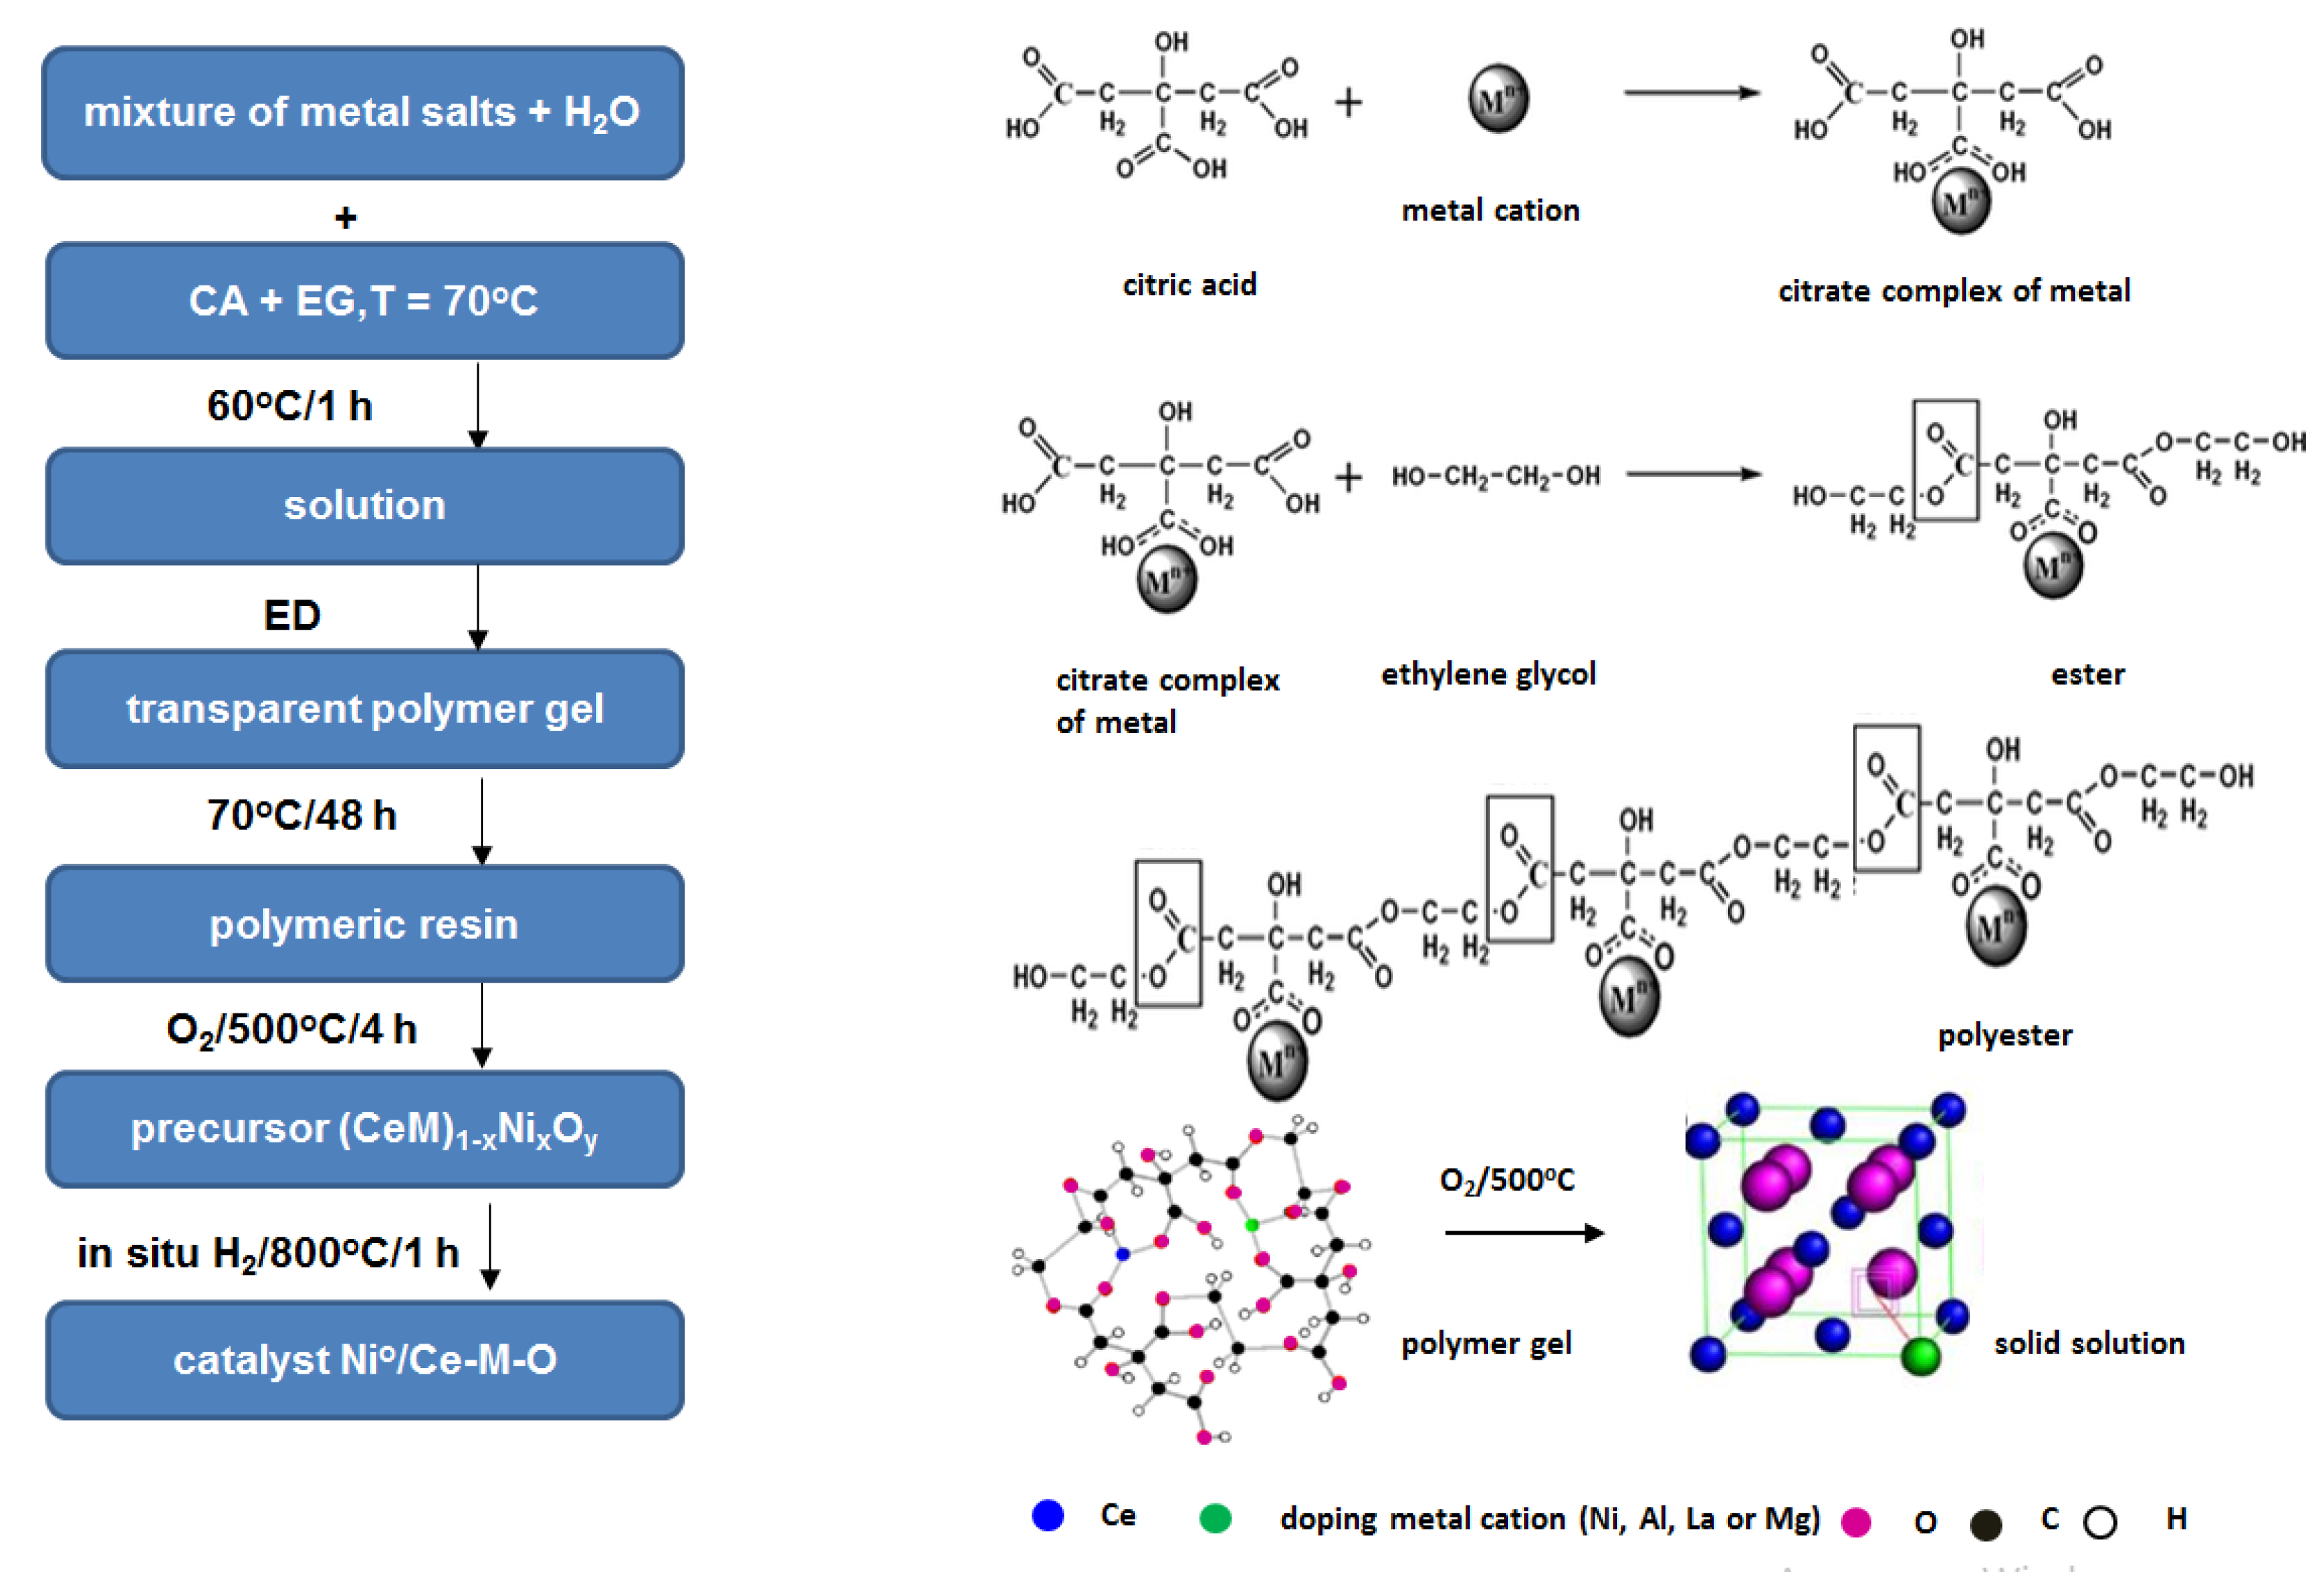
3.1. Sample Preparation
3.2. Sample Characterization
3.3. Catalytic Activity Testing
4. Conclusions
Author Contributions
Funding
Data Availability Statement
Acknowledgments
Conflicts of Interest
References
- Birol, F. The Future of Hydrogen: Seizing Today’s Opportunities. Available online: https://www.hydrogenexpo.com/media/9370/the_future_of_hydrogen_iea.pdf (accessed on 1 November 2022).
- International Energy Agency. Cross-Cutting: Hydrogen. 2020. Available online: https://www.cceguide.org/wp-content/uploads/2020/08/07-IEA-Cross-cutting.pdf (accessed on 1 November 2022).
- Lebrouhi, B.E.; Djoupo, J.J.; Lamrani, B.; Benabdelaziz, K.; Kousksou, T. Global hydrogen development—A technological and geopolitical overview. Int. J. Hydrogen Energy 2022, 47, 7016–7048. [Google Scholar] [CrossRef]
- Pal, D.B.; Singh, A.; Bhatnagar, A. A review on biomass based hydrogen production technologies. Int. J. Hydrogen Energy 2022, 47, 1461–1480. [Google Scholar] [CrossRef]
- Faye, O.; Szpunar, J.; Eduok, U. A critical review on the current technologies for the generation, storage, and transportation of hydrogen. Int. J. Hydrogen Energy 2022, 47, 13771–13802. [Google Scholar] [CrossRef]
- Yu, M.; Wang, K.; Vredenburg, H. Insights into low-carbon hydrogen production methods: Green, blue and aqua hydrogen. Int. J. Hydrogen Energy 2021, 46, 21261–21273. [Google Scholar] [CrossRef]
- Matus, E.; Sukhova, O.; Ismagilov, I.; Kerzhentsev, M.; Stonkus, O.; Ismagilov, Z. Hydrogen production through autothermal reforming of ethanol: Enhancement of Ni catalyst performance via promotion. Energies 2021, 14, 5176. [Google Scholar] [CrossRef]
- Matus, E.V.; Ismagilov, I.Z.; Mikhaylova, E.S.; Ismagilov, Z.R. Hydrogen Production from Coal Industry Methane. Eurasian Chem.-Technol. J. 2022, 24, 69–91. [Google Scholar] [CrossRef]
- Howarth, R.W.; Jacobson, M.Z. How green is blue hydrogen? Energy Sci. Eng. 2021, 9, 1676–1687. [Google Scholar] [CrossRef]
- IEA. Net Zero by 2050: A Roadmap for the Global Energy Sector. International Energy Agency, 2021. Available online: https://www.iea.org/reports/net-zero-by-2050 (accessed on 1 November 2022).
- Quarton, C.J.; Samsatli, S. The value of hydrogen and carbon capture, storage and utilisation in decarbonising energy: Insights from integrated value chain optimisation. Appl. Energy 2020, 257, 113936. [Google Scholar] [CrossRef]
- Deng, J.; Chu, W.; Wang, B.; Yang, W.; Zhao, X.S. Mesoporous Ni/Ce1−xNixO2−y heterostructure as an efficient catalyst for converting greenhouse gas to H2 and syngas. Catal. Sci. Technol. 2016, 6, 851–862. [Google Scholar] [CrossRef]
- Batebi, D.; Abedini, R.; Mosayebi, A. Combined steam and CO2 reforming of methane (CSCRM) over Ni–Pd/Al2O3 catalyst for syngas formation. Int. J. Hydrogen Energy 2020, 45, 14293–14310. [Google Scholar] [CrossRef]
- Cunha, A.F.; Morales-Torres, S.; Pastrana-Martínez, L.M.; Maldonado-Hódar, F.J.; Caetano, N.S. Syngas production by bi-reforming of methane on a bimetallic Ni-ZnO doped zeolite 13X. Fuel 2022, 311, 122592. [Google Scholar] [CrossRef]
- Peng, J.B.; Geng, H.Q.; Wu, X.F. The Chemistry of CO: Carbonylation. Chem 2019, 5, 526–552. [Google Scholar] [CrossRef] [Green Version]
- Qi, J.; Christopher, P. Atomically dispersed rh active sites on oxide supports with controlled acidity for gas-phase halide-free methanol carbonylation to acetic acid. Ind. Eng. Chem. Res. 2019, 58, 12632–12641. [Google Scholar] [CrossRef]
- Qi, J.; Finzel, J.; Robatjazi, H.; Xu, M.; Hoffman, A.S.; Bare, S.R.; Pan, X.; Christopher, P. Selective Methanol Carbonylation to Acetic Acid on Heterogeneous Atomically Dispersed ReO4/SiO2 Catalysts. J. Am. Chem. Soc. 2020, 142, 14178–14189. [Google Scholar] [CrossRef]
- Dall’Anese, A.; Fiorindo, M.; Olivieri, D.; Carfagna, C.; Balducci, G.; Alessio, E.; Durand, J.; Milani, B. Pd-Catalyzed CO/Vinyl Arene Copolymerization: When the Stereochemistry is Controlled by the Comonomer. Macromolecules 2020, 53, 7783–7794. [Google Scholar] [CrossRef]
- Stadler, B.M.; Wulf, C.; Werner, T.; Tin, S.; De Vries, J.G. Catalytic Approaches to Monomers for Polymers Based on Renewables. ACS Catal. 2019, 9, 8012–8067. [Google Scholar] [CrossRef] [Green Version]
- Jang, W.J.; Jeong, D.W.; Shim, J.O.; Kim, H.M.; Roh, H.S.; Son, I.H.; Lee, S.J. Combined steam and carbon dioxide reforming of methane and side reactions: Thermodynamic equilibrium analysis and experimental application. Appl. Energy 2016, 173, 80–91. [Google Scholar] [CrossRef]
- Matus, E.V.; Sukhova, O.B.; Ismagilov, I.Z.; Kerzhentsev, M.A.; Li, L.; Ismagilov, Z.R. Bi-reforming of methane: Thermodynamic equilibrium analysis and selection of preferable reaction conditions. J. Phys. Conf. Ser. 2021, 1749, 012023. [Google Scholar] [CrossRef]
- Chen, L.; Qi, Z.; Zhang, S.; Su, J.; Somorjai, G.A. Catalytic hydrogen production from methane: A review on recent progress and prospect. Catalysts 2020, 10, 858. [Google Scholar] [CrossRef]
- Ismagilov, Z.R.; Matus, E.V.; Ismagilov, I.Z.; Sukhova, O.B.; Yashnik, S.A.; Ushakov, V.A.; Kerzhentsev, M.A. Hydrogen production through hydrocarbon fuel reforming processes over Ni based catalysts. Catal. Today 2019, 323, 166–182. [Google Scholar] [CrossRef]
- Abdullah, B.; Abd Ghani, N.A.; Vo, D.V.N. Recent advances in dry reforming of methane over Ni-based catalysts. J. Clean. Prod. 2017, 162, 170–185. [Google Scholar] [CrossRef] [Green Version]
- Pham, X.H.; Ashik, U.P.M.; Hayashi, J.I.; Alonso, A.P.; Pla, D.; Gómez, M.; Minh, D.P. Review on the catalytic tri-reforming of methane—Part II: Catalyst development. Appl. Catal. A Gen. 2021, 623, 118286. [Google Scholar] [CrossRef]
- Matus, E.V.; Ev, S.D.V.; Ismagilov, I.Z.; Ushakov, V.A.; Kerzhentsev, O.A.; Ismagilov, Z.R. Development of Supported Ni Catalysts for Autothermal Reforming of Methane. Chem. Sustain. Dev. 2020, 28, 403–411. [Google Scholar] [CrossRef]
- Mierczynski, P.; Mosinska, M.; Stepinska, N.; Chalupka, K.; Nowosielska, M.; Maniukiewicz, W.; Rogowski, J.; Goswami, N.; Vasilev, K.; Szynkowska, M.I. Effect of the support composition on catalytic and physicochemical properties of Ni catalysts in oxy-steam reforming of methane. Catal. Today 2021, 364, 46–60. [Google Scholar] [CrossRef]
- Zagaynov, I.V. Active Components of Catalysts of Methane Conversion to Synthesis Gas: Brief Perspectives. Energy Fuels 2021, 35, 9124–9136. [Google Scholar] [CrossRef]
- Matus, E.V.; Ismagilov, I.Z.; Yashnik, S.A.; Ushakov, V.A.; Prosvirin, I.P.; Kerzhentsev, M.A.; Ismagilov, Z.R. Hydrogen production through autothermal reforming of CH4: Efficiency and action mode of noble (M = Pt, Pd) and non-noble (M = Re, Mo, Sn) metal additives in the composition of Ni-M/Ce0.5Zr0.5O2/Al2O3 catalysts. Int. J. Hydrogen Energy 2020, 45, 33352–33369. [Google Scholar] [CrossRef]
- Matus, E.V.; Shlyakhtina, A.S.; Sukhova, O.B.; Ismagilov, I.Z.; Ushakov, V.A.; Yashnik, S.A.; Nikitin, A.P.; Bharali, P.; Kerzhentsev, M.A.; Ismagilov, Z.R. Effect of Preparation Methods on the Physicochemical and Functional Properties of Ni/CeO2 Catalysts. Kinet. Catal. 2019, 60, 221–230. [Google Scholar] [CrossRef]
- Lyu, Y.; Jocz, J.; Xu, R.; Stavitski, E.; Sievers, C. Nickel Speciation and Methane Dry Reforming Performance of Ni/CexZr1–xO2 Prepared by Different Synthesis Methods. ACS Catal. 2020, 10, 11235–11252. [Google Scholar] [CrossRef]
- Khani, Y.; Bahadoran, F.; Shariatinia, Z.; Varmazyari, M.; Safari, N. Synthesis of highly efficient and stable Ni/CexZr1−xGdxO4 and Ni/X-Al2O3 (x = Ce, Zr, Gd, Ce-Zr-Gd) nanocatalysts applied in methane reforming reactions. Ceram. Int. 2020, 46, 25122–25135. [Google Scholar] [CrossRef]
- Matus, E.V.; Nefedova, D.V.; Kuznetsov, V.V.; Ushakov, V.A.; Stonkus, O.A.; Ismagilov, I.Z.; Kerzhentsev, M.A.; Ismagilov, Z.R. Effect of the support composition on the physicochemical properties of Ni/Ce1–xLaxOy catalysts and their activity in an autothermal methane reforming reaction. Kinet. Catal. 2017, 58, 610–621. [Google Scholar] [CrossRef]
- Cheephat, C.; Daorattanachai, P.; Devahastin, S.; Laosiripojana, N. Partial oxidation of methane over monometallic and bimetallic Ni-, Rh-, Re-based catalysts: Effects of Re addition, co-fed reactants and catalyst support. Appl. Catal. A Gen. 2018, 563, 1–8. [Google Scholar] [CrossRef]
- Ismagilov, I.Z.; Vosmerikov, A.V.; Korobitsyna, L.L.; Matus, E.V.; Kerzhentsev, M.A.; Stepanov, A.A.; Mihaylova, E.S.; Ismagilov, Z.R. Promoters for improvement of the catalyst performance in methane valorization processes. Eurasian Chem.-Technol. J. 2021, 23, 147–168. [Google Scholar] [CrossRef]
- da Fonseca, R.O.; Ponseggi, A.R.; Rabelo-Neto, R.C.; Simões, R.C.C.; Mattos, L.V.; Noronha, F.B. Controlling carbon formation over Ni/CeO2 catalyst for dry reforming of CH4 by tuning Ni crystallite size and oxygen vacancies of the support. J. CO2 Util. 2022, 57, 101880. [Google Scholar] [CrossRef]
- Juan-Juan, J.; Román-Martínez, M.C.; Illán-Gómez, M.J. Nickel catalyst activation in the carbon dioxide reforming of methane. Effect of pretreatments. Appl. Catal. A Gen. 2009, 355, 27–32. [Google Scholar] [CrossRef]
- Pino, L.; Italiano, C.; Vita, A.; Laganà, M.; Recupero, V. Ce0.70La0.20Ni0.10O2−Δ catalyst for methane dry reforming: Influence of reduction temperature on the catalytic activity and stability. Appl. Catal. B Environ. 2017, 218, 779–792. [Google Scholar] [CrossRef]
- Sokolov, S.; Kondratenko, E.V.; Pohl, M.M.; Rodemerck, U. Effect of calcination conditions on time on-stream performance of Ni/La2O3-ZrO2 in low-temperature dry reforming of methane. Int. J. Hydrogen Energy 2013, 38, 16121–16132. [Google Scholar] [CrossRef]
- Feng, X.; Feng, J.; Li, W. Insight into MgO promoter with low concentration for the carbon-deposition resistance of Ni-based catalysts in the CO2 reforming of CH4. Cuihua Xuebao/Chin. J. Catal. 2018, 39, 88–98. [Google Scholar] [CrossRef]
- Al-Fatesh, A.S.; Naeem, M.A.; Fakeeha, A.H.; Abasaeed, A.E. Role of La2O3 as Promoter and Support in Ni/γ-Al2O3 Catalysts for Dry Reforming of Methane. Chin. J. Chem. Eng. 2014, 22, 28–37. [Google Scholar] [CrossRef]
- Damaskinos, C.M.; Zavašnik, J.; Djinović, P.; Efstathiou, A.M. Dry reforming of methane over Ni/Ce0.8Ti0.2O2−δ: The effect of Ni particle size on the carbon pathways studied by transient and isotopic techniques. Appl. Catal. B Environ. 2021, 296, 120321. [Google Scholar] [CrossRef]
- Liu, Z.; Duchoň, T.; Wang, H.; Grinter, D.C.; Waluyo, I.; Zhou, J.; Liu, Q.; Jeong, B.; Crumlin, E.J.; Matolín, V.; et al. Ambient pressure XPS and IRRAS investigation of ethanol steam reforming on Ni-CeO2(111) catalysts: An: In situ study of C-C and O-H bond scission. Phys. Chem. Chem. Phys. 2016, 18, 16621–16628. [Google Scholar] [CrossRef] [PubMed]
- Salcedo, A.; Lustemberg, P.G.; Rui, N.; Palomino, R.M.; Liu, Z.; Nemsak, S.; Senanayake, S.D.; Rodriguez, J.A.; Ganduglia-Pirovano, M.V.; Irigoyen, B. Reaction Pathway for Coke-free methane steam reforming on a Ni/CeO2 Catalyst: Active Sites and the Role of Metal-Support Interactions. ACS Catal. 2021, 11, 8327–8337. [Google Scholar] [CrossRef]
- Lustemberg, P.G.; Mao, Z.; Salcedo, A.; Irigoyen, B.; Ganduglia-Pirovano, M.V.; Campbell, C.T. Nature of the Active Sites on Ni/CeO2 Catalysts for Methane Conversions. ACS Catal. 2021, 11, 10604–10613. [Google Scholar] [CrossRef] [PubMed]
- Singha, R.K.; Tsuji, Y.; Mahyuddin, M.H.; Yoshizawa, K. Methane Activation at the Metal-Support Interface of Ni4-CeO2(111) Catalyst: A Theoretical Study. J. Phys. Chem. C 2019, 123, 9788–9798. [Google Scholar] [CrossRef]
- Lian, Z.; Olanrele, S.O.; Si, C.; Yang, M.; Li, B. Critical Role of Interfacial Sites between Nickel and CeO2 Support in Dry Reforming of Methane: Revisit of Reaction Mechanism and Origin of Stability. J. Phys. Chem. C 2020, 124, 5118–5124. [Google Scholar] [CrossRef]
- Carrasco, J.; López-Durán, D.; Liu, Z.; Duchoň, T.; Evans, J.; Senanayake, S.D.; Crumlin, E.J.; Matolín, V.; Rodríguez, J.A.; Ganduglia-Pirovano, M.V. In situ and theoretical studies for the dissociation of water on an active Ni/CeO2 Catalyst: Importance of strong metal-support interactions for the cleavage of O-H bonds. Angew. Chem. Int. Ed. 2015, 54, 3917–3921. [Google Scholar] [CrossRef]
- Gao, X.; Li, J.; Zheng, M.; Cai, S.; Zhang, J.; Askari, S.; Dewangan, N.; Ashok, J.; Kawi, S. Recent progress in anti-coking Ni catalysts for thermo-catalytic conversion of greenhouse gases. Process. Saf. Environ. Prot. 2021, 156, 598–616. [Google Scholar] [CrossRef]
- Cop, P.; Maile, R.; Sun, Y.; Khalid, O.; Djerdj, I.; Esch, P.; Heiles, S.; Over, H.; Smarsly, B.M. Impact of Aliovalent/Isovalent Ions (Gd, Zr, Pr, and Tb) on the Catalytic Stability of Mesoporous Ceria in the HCl Oxidation Reaction. ACS Appl. Nano Mater. 2020, 3, 7406–7419. [Google Scholar] [CrossRef]
- Kerzhentsev, M.A.; Matus, E.V.; Ismagilov, I.Z.; Ushakov, V.A.; Stonkus, O.A.; Larina, T.V.; Kozlova, G.S.; Bharali, P.; Ismagilov, Z.R. Structural and morphological properties of Ce1–xMxOy (M = Gd, La, Mg) supports for the catalysts of autothermal ethanol conversion. J. Struct. Chem. 2017, 58, 126–134. [Google Scholar] [CrossRef]
- Yu, Q.; Wu, X.; Tang, C.; Qi, L.; Liu, B.; Gao, F.; Sun, K.; Dong, L.; Chen, Y. Textural, structural, and morphological characterizations and catalytic activity of nanosized CeO2-MOx (M = Mg2+, Al3+, Si4+) mixed oxides for CO oxidation. J. Colloid Interface Sci. 2011, 354, 341–352. [Google Scholar] [CrossRef]
- Matus, E.V.; Okhlopkova, L.B.; Sukhova, O.B.; Ismagilov, I.Z.; Kerzhentsev, M.A.; Ismagilov, Z.R. Effects of preparation mode and doping on the genesis and properties of Ni/Ce1−xMxOy nanocrystallites (M = Gd, La, Mg) for catalytic applications. J. Nanopart. Res. 2019, 21, 11. [Google Scholar] [CrossRef]
- Kumar, P.; Matoh, L.; Kaur, R.; Štangar, U.L. Synergic effect of manganese oxide on ceria based catalyst for direct conversion of CO2 to green fuel additive: Catalyst activity and thermodynamics study. Fuel 2021, 285, 119083. [Google Scholar] [CrossRef]
- Pakharukova, V.P.; Potemkin, D.I.; Stonkus, O.A.; Kharchenko, N.A.; Saraev, A.A.; Gorlova, A.M. Investigation of the Structure and Interface Features of Ni/Ce1−xZrxO2 Catalysts for CO and CO2 Methanation. J. Phys. Chem. C 2021, 125, 20538–20550. [Google Scholar] [CrossRef]
- Wang, F.; Wei, M.; Evans, D.G.; Duan, X. CeO2-based heterogeneous catalysts toward catalytic conversion of CO2. J. Mater. Chem. A 2016, 4, 5773–5783. [Google Scholar] [CrossRef]
- Li, X.; Zhao, Z.J.; Zeng, L.; Zhao, J.; Tian, H.; Chen, S.; Li, K.; Sang, S.; Gong, J. On the role of Ce in CO2 adsorption and activation over lanthanum species. Chem. Sci. 2018, 9, 3426–3437. [Google Scholar] [CrossRef] [Green Version]
- Zhang, F.; Liu, Z.; Chen, X.; Rui, N.; Betancourt, L.E.; Lin, L.; Xu, W.; Sun, C.J.; Abeykoon, A.M.; Rodriguez, J.A.; et al. Effects of Zr Doping into Ceria for the Dry Reforming of Methane over Ni/CeZrO2 Catalysts: In Situ Studies with XRD, XAFS, and AP-XPS. ACS Catal. 2020, 10, 3274–3284. [Google Scholar] [CrossRef]
- Matus, E.V.; Ismagilov, I.Z.; Ushakov, V.A.; Nikitin, A.P.; Stonkus, O.A.; Gerasimov, E.Y.; Kerzhentsev, M.A.; Bharali, P.; Ismagilov, Z.R. Genesis and structural properties of (Ce1–xMx)0.8Ni0.2Oy (M = La, Mg) oxides. J. Struct. Chem. 2020, 61, 1080–1089. [Google Scholar] [CrossRef]
- Matus, E.V.; Nefedova, D.V.; Sukhova, O.B.; Ismagilov, I.Z.; Ushakov, V.A.; Yashnik, S.A.; Nikitin, A.P.; Kerzhentsev, M.A.; Ismagilov, Z.R. Formation and Properties of Ni–Ce–La–O Catalysts of Reforming. Kinet. Catal. 2019, 60, 496–507. [Google Scholar] [CrossRef]
- Tao, K.; Zhou, S.; Zhang, Q.; Kong, C.; Ma, Q.; Tsubaki, N.; Chen, L. Sol-gel auto-combustion synthesis of Ni-CexZr1−xO2 catalysts for carbon dioxide reforming of methane. RSC Adv. 2013, 3, 22285–22294. [Google Scholar] [CrossRef]
- Liu, F.; Zhao, L.; Wang, H.; Bai, X.; Liu, Y. Study on the preparation of Ni-La-Ce oxide catalyst for steam reforming of ethanol. Int. J. Hydrogen Energy 2014, 39, 10454–10466. [Google Scholar] [CrossRef]
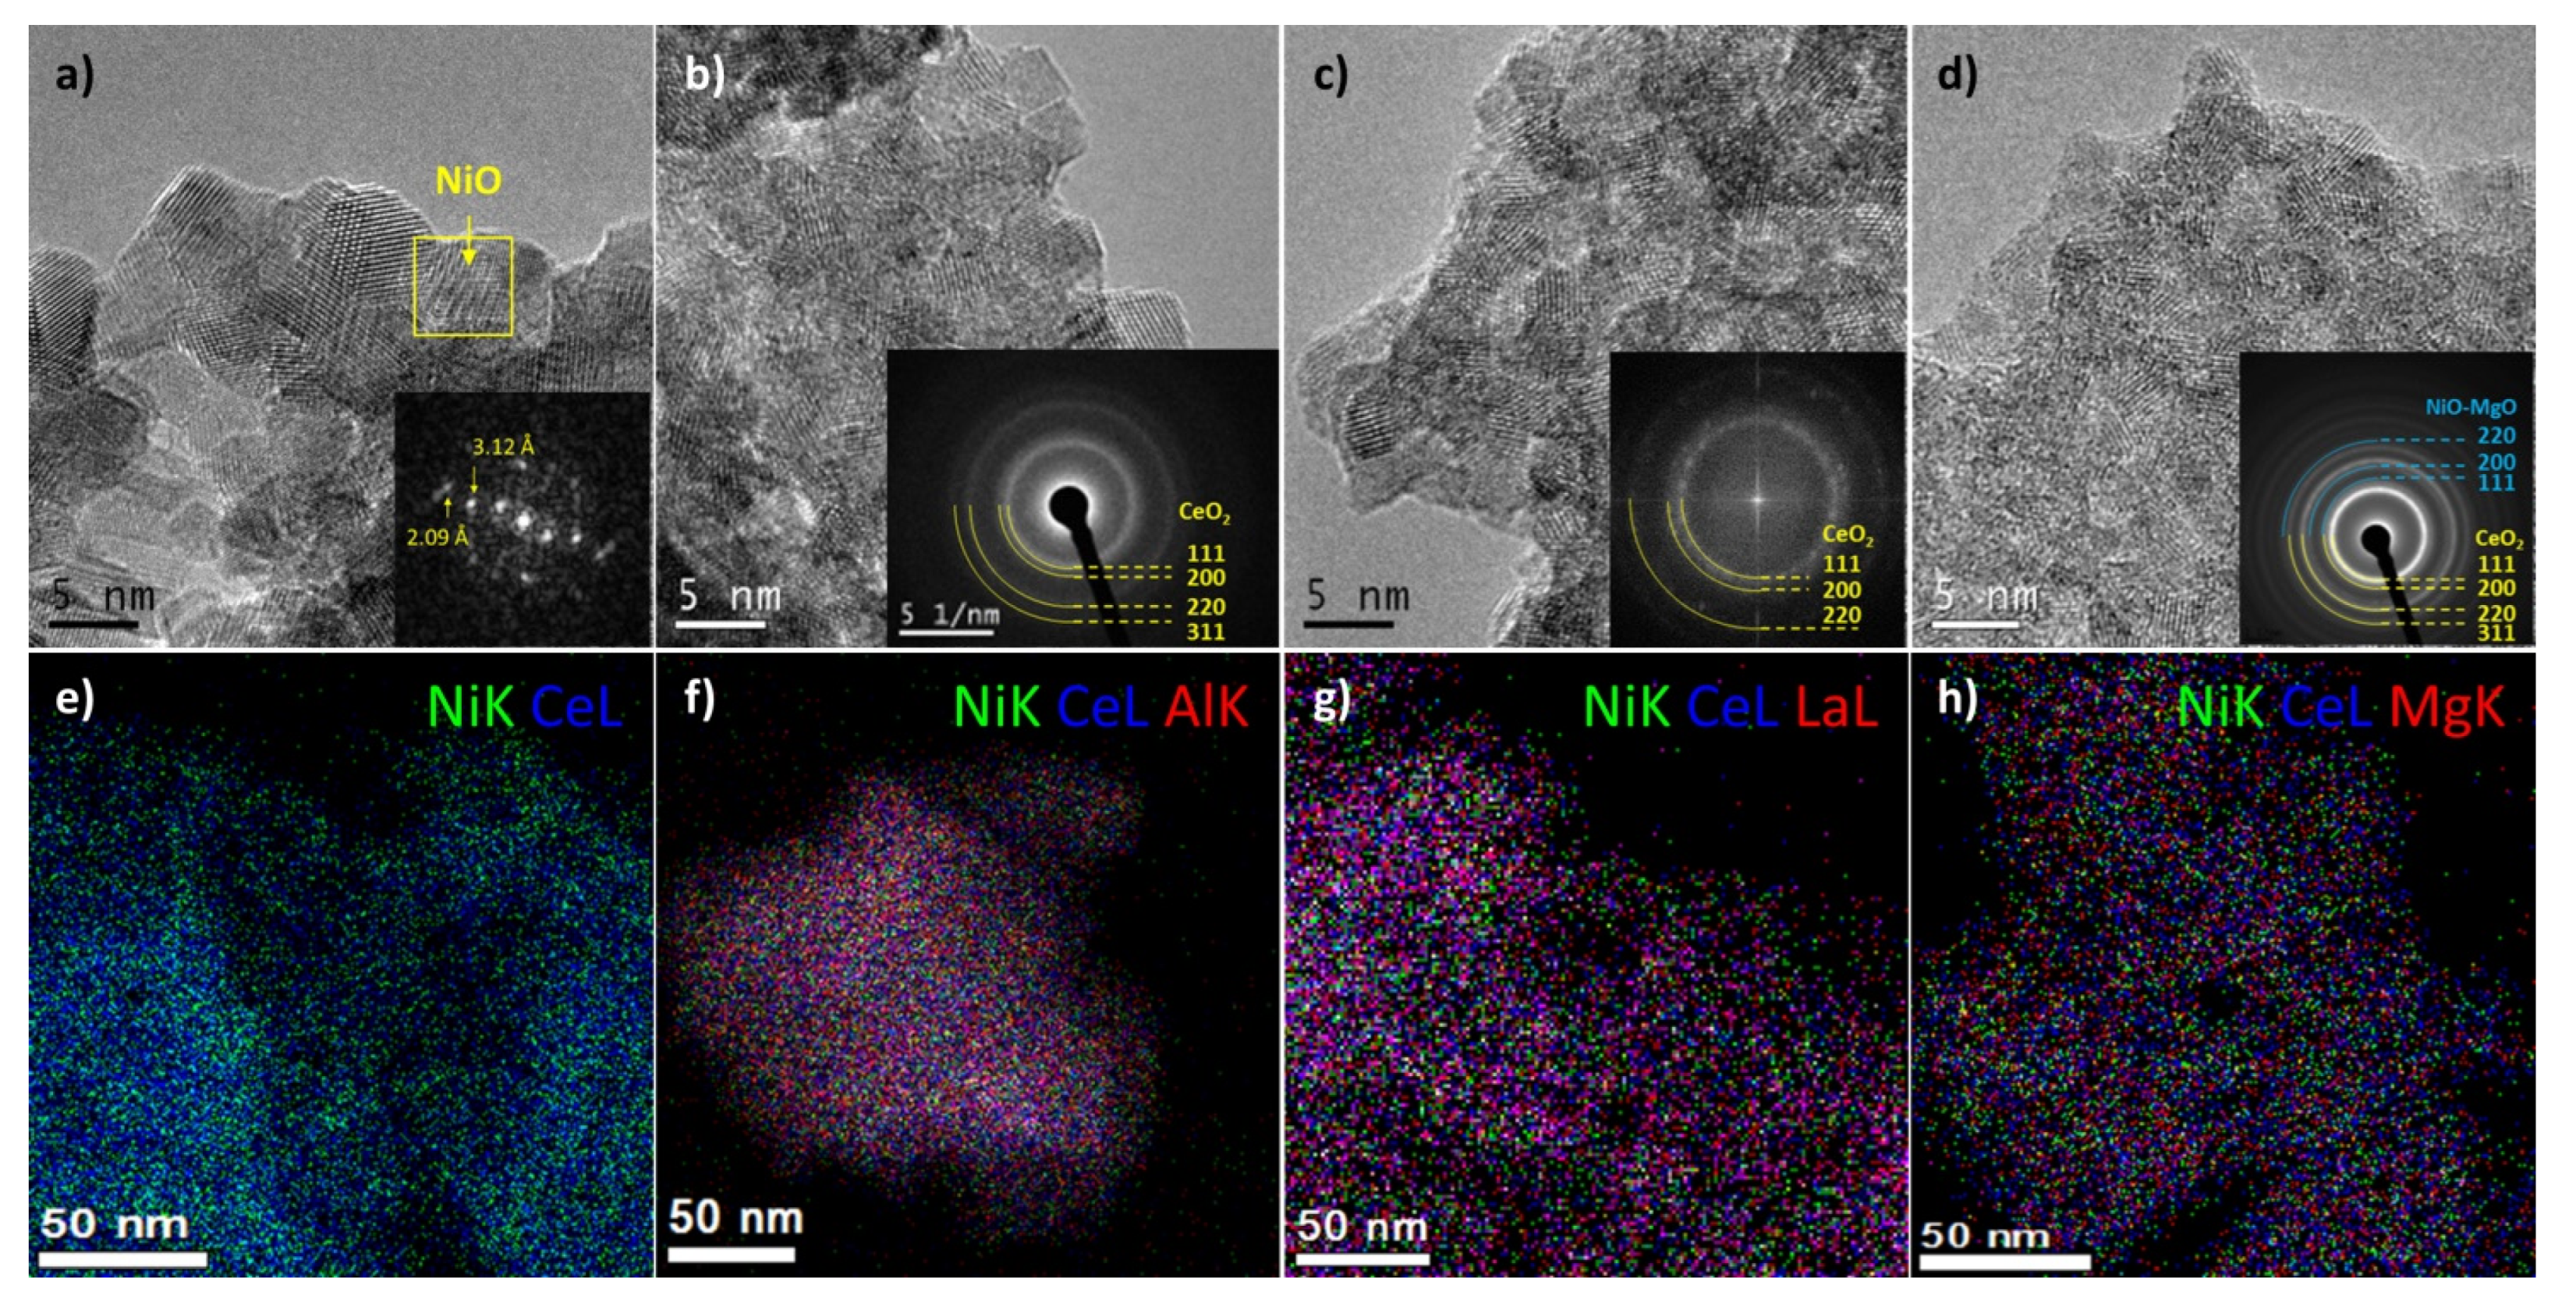
- Ponchel, A.; D’huysser, A.; Lamonier, C.; Jalowiecki-duhamel, L. CeNiO and CeAlNiO solids studied by electron microscopy. Phys. Chem. Chem. Phys. 2000, 2, 303–312. [Google Scholar] [CrossRef]
- Sun, X.; Chen, H.; Yin, Y.; Curnan, M.T.; Han, J.W.; Chen, Y.; Ma, Z. Progress of Exsolved Metal Nanoparticles on Oxides as High Performance (Electro)Catalysts for the Conversion of Small Molecules. Small 2021, 17, 2005383. [Google Scholar] [CrossRef] [PubMed]
- Kwon, O.; Joo, S.; Choi, S.; Sengodan, S.; Kim, G. Review on exsolution and its driving forces in perovskites. J. Phys. Energy 2020, 2, 032001. [Google Scholar] [CrossRef]
- Kousi, K.; Neagu, D.; Metcalfe, I.S. Combining Exsolution and Infiltration for Redox, Low Temperature CH4 Conversion to Syngas. Catalysts 2020, 10, 468. [Google Scholar] [CrossRef]
- Rodriguez, J.A.; Grinter, D.C.; Liu, Z.; Palomino, R.M.; Senanayake, S.D. Ceria-based model catalysts: Fundamental studies on the importance of the metal-ceria interface in CO oxidation, the water-gas shift, CO2 hydrogenation, and methane and alcohol reforming. Chem. Soc. Rev. 2017, 46, 1824–1841. [Google Scholar] [CrossRef] [PubMed]
- Mueller, V.H.; Duduković, M.P.; Lo, C.S. The role of metal-support interaction on catalytic methane activation. Appl. Catal. A Gen. 2014, 488, 138–147. [Google Scholar] [CrossRef]
- Romero-Núñez, A.; Díaz, G. High oxygen storage capacity and enhanced catalytic performance of NiO/NixCe1−xO2−δ nanorods: Synergy between Ni-doping and 1D morphology. RSC Adv. 2015, 5, 54571–54579. [Google Scholar] [CrossRef]
- Barrio, L.; Kubacka, A.; Zhou, G.; Estrella, M.; Martinez-Arias, A.; Hanson, J.C.; Fernandez-Garcia, M.; Rodriguez, J.A. Unusual physical and chemical properties of ni in Ce1−xNixO2−y oxides: Structural characterization and catalytic activity for the water gas shift reaction. J. Phys. Chem. C 2010, 114, 12689–12697. [Google Scholar] [CrossRef]
- Kerzhentsev, M.A.; Matus, E.V.; Ismagilov, I.Z.; Sukhova, O.B.; Bharali, P.; Ismagilov, Z.R. Control of Ni/Ce1−xMxOy catalyst properties via the selection of dopant M = Gd, La, Mg. Part 1. physicochemical characteristics. Eurasian Chem. J. 2018, 20, 283–291. [Google Scholar] [CrossRef] [Green Version]
- Gondim, M.S.; Silva, E.C.; dos Santos, A.L.; de Assis, M.; Mercury, J.M.; Leite, E.R.; Nogueira, I.C. Synthesis of ZnWO4 by the polymerizable complex method: Evidence of amorphous phase coexistence during the phase formation process. Ceram. Int. 2021, 47, 19073–19078. [Google Scholar] [CrossRef]
- Stability Constants of Complex Compounds. Available online: https://www.freechemistry.ru/cen3.htm (accessed on 26 April 2022).
- Li, Y.; Huo, Y.; Li, C.; Xing, S.; Liu, L.; Zou, G. Thermal analysis of Cu-organic composite nanoparticles and fabrication of highly conductive copper films. J. Alloys Compd. 2015, 649, 1156–1163. [Google Scholar] [CrossRef]
- Sing, K.S.W.; Williams, R.T. Physisorption Hysteresis Loops and the Characterization of Nanoporous Materials. Adsorpt. Sci. Technol. 2004, 22, 773–782. [Google Scholar] [CrossRef]
- El Hannach, M.; Soboleva, T.; Malek, K.; Franco, A.A.; Prat, M.; Pauchet, J.; Holdcroft, S. Characterization of pore network structure in catalyst layers of polymer electrolyte fuel cells. J. Power Sources 2014, 247, 322–326. [Google Scholar] [CrossRef] [Green Version]
- Zhao, P.; Qin, F.; Huang, Z.; Sun, C.; Shen, W.; Xu, H. Morphology-dependent oxygen vacancies and synergistic effects of Ni/CeO2 catalysts for N2O decomposition. Catal. Sci. Technol. 2018, 8, 276–288. [Google Scholar] [CrossRef]
- Chen, P.-L.; Chen, I.-W. Grain Growth in CeO2: Dopant Effects, Defect Mechanism, and Solute Drag. J. Am. Ceram. Soc. 1996, 79, 1793–1800. [Google Scholar] [CrossRef] [Green Version]
- Khandale, K.N.A.; Bhoga, S. Synthesis and characterization of nanocrystalline Gd doped CeO2. Asian J. Chem. 2009, 21, 13–16. [Google Scholar]
- Wu, L.; Wiesmann, H.J.; Moodenbaugh, A.R.; Klie, R.F.; Zhu, Y.; Welch, D.O.; Suenaga, M. Oxidation state and lattice expansion of CeO2−x nanoparticles as a function of particle size. Phys Rev. B 2004, 69, 125415. [Google Scholar] [CrossRef]
- Fuentes, R.O.; Acuña, L.M.; Albornoz, C.A.; Leyva, A.G.; Sousa, N.; Figueiredo, F.M. Structural, physical and chemical properties of nanostructured nickel-substituted ceria oxides under reducing and oxidizing conditions. RSC Adv. 2016, 6, 64861–64870. [Google Scholar] [CrossRef] [Green Version]
- Wrobel, G.; Sohier, M.P.; D’Huysser, A.; Bonnelle, J.P.; Marcq, J.P. Hydrogenation catalysts based on nickel and rare earth oxides. Part II: XRD, electron microscopy and XPS studies of the cerium-nickel-oxygen-hydrogen system. Appl. Catal. A Gen. 1993, 101, 73–93. [Google Scholar] [CrossRef]
- Zhang, J.; Ke, C.; Wu, H.; Yu, J.; Wang, J.; Wang, Y. Solubility limits, crystal structure and lattice thermal expansion of Ln2O3 (Ln = Sm, Eu, Gd) doped CeO2. J. Alloys Compd. 2017, 718, 85–91. [Google Scholar] [CrossRef]
- Gong, W.; Zhang, R.; Chen, Z. Thermodynamic modelling and applications of Ce–La–O phase diagram. Trans. Nonferrous Met. Soc. China 2011, 21, 2671–2676. [Google Scholar] [CrossRef]
- Wilkes, M. Catalytic studies on ceria lanthana solid solutions III. Surface segregation and solid state studies. J. Catal. 2003, 219, 305–309. [Google Scholar] [CrossRef]
- Chen, M.; Zheng, H.; Shi, C.; Zhou, R.; Zheng, X. Synthesis of nanoparticle Ce–Mg–O mixed oxide as efficient support for methane oxidation. J. Mol. Catal. A Chem. 2005, 237, 132–136. [Google Scholar] [CrossRef]
- Nguyen, V.-K.; Park, J.-H.; Shin, C.-H. Synthesis, characterization and catalytic performance of binary CeO2-MgO oxides in the dehydrogenation of ethylbenzene. React. Kinet. Mech. Catal. 2012, 107, 157–165. [Google Scholar] [CrossRef]
- Dimitrov, M.D.; Ivanova, R.N.; Stengl, V.; Henych, J.; Kovacheva, D.G.; Tsoncheva, T.S. Optimization of CeO2-ZrO2 mixed oxide catalysts for ethyl acetate combustion. Bulg. Chem. Commun. 2015, 47, 323–329. [Google Scholar]
- Martínez-Arias, A.; Fernández-García, M.; Salamanca, L.N.; Valenzuela, R.X.; Conesa, J.C.; Soria, J. Structural and Redox Properties of Ceria in Alumina-Supported Ceria Catalyst Supports. J. Phys. Chem. B 2000, 104, 4038–4046. [Google Scholar] [CrossRef]
- Weber, W.H.; Hass, K.C.; McBride, J.R. Raman study of CeO2: Second-order scattering, lattice dynamics, and particle-size effects. Phys. Rev. B 1993, 48, 178–185. [Google Scholar] [CrossRef]
- Sánchez Escribano, V.; Fernández López, E.; Panizza, M.; Resini, C.; Gallardo Amores, J.M.; Busca, G. Characterization of cubic ceria–zirconia powders by X-ray diffraction and vibrational and electronic spectroscopy. Solid State Sci. 2003, 5, 1369–1376. [Google Scholar] [CrossRef]
- Yao, X.; Tang, C.; Ji, Z.; Dai, Y.; Cao, Y.; Gao, F.; Dong, L.; Chen, Y. Investigation of the physicochemical properties and catalytic activities of Ce0.67M0.33O2 (M = Zr4+, Ti4+, Sn4+) solid solutions for NO removal by CO. Catal. Sci. Technol. 2013, 3, 688–698. [Google Scholar] [CrossRef]
- Li, L.; Chen, F.; Lu, J.-Q.; Luo, M.-F. Study of Defect Sites in Ce1–xMxO2−δ (x = 0.2) Solid Solutions Using Raman Spectroscopy. J. Phys. Chem. A 2011, 115, 7972–7977. [Google Scholar] [CrossRef]
- Guo, M.; Lu, J.; Wu, Y.; Wang, Y.; Luo, M. UV and visible Raman studies of oxygen vacancies in rare-earth-doped ceria. Langmuir 2011, 27, 3872–3877. [Google Scholar] [CrossRef] [PubMed]
- Avram, D.; Sanchez-Dominguez, M.; Cojocaru, B.; Florea, M.; Parvulescu, V.; Tiseanu, C. Toward a Unified Description of Luminescence–Local Structure Correlation in Ln Doped CeO2 Nanoparticles: Roles of Ln Ionic Radius, Ln Concentration, and Oxygen Vacancies. J. Phys. Chem. C 2015, 119, 16303–16313. [Google Scholar] [CrossRef]
- Al-Fatesh, A.S.A.; Fakeeha, A.H. Effects of calcination and activation temperature on dry reforming catalysts. J. Saudi Chem. Soc. 2012, 16, 55–61. [Google Scholar] [CrossRef]
- Braidy, N.; Bastien, S.; Blanchard, J.; Fauteux-Lefebvre, C.; Achouri, I.E.; Abatzoglou, N. Activation mechanism and microstructural evolution of a YSZ/Ni-alumina catalyst for dry reforming of methane. Catal. Today 2017, 291, 99–105. [Google Scholar] [CrossRef]
- Shan, W.; Luo, M.; Ying, P.; Shen, W.; Li, C. Reduction property and catalytic activity of Ce1−xNiXO2 mixed oxide catalysts for CH4 oxidation. Appl. Catal. A Gen. 2003, 246, 1–9. [Google Scholar] [CrossRef]
- Lamonier, C.; Ponchel, A.; D’Huysser, A.; Jalowiecki-Duhamel, L. Studies of the cerium-metal-oxygen-hydrogen system (metal = Cu, Ni). Catal. Today 1999, 50, 247–259. [Google Scholar] [CrossRef]
- Jalowiecki-Duhamel, L.; Zarrou, H.; D’Huysser, A. Hydrogen production at low temperature from methane on cerium and nickel based mixed oxides. Int. J. Hydrogen Energy 2008, 33, 5527–5534. [Google Scholar] [CrossRef]
- Fang, W.; Pirez, C.; Paul, S.; Capron, M.; Jobic, H.; Dumeignil, F.; Jalowiecki-Duhamel, L. Room Temperature Hydrogen Production from Ethanol over CeNiXHZOY Nano-Oxyhydride Catalysts. ChemCatChem 2013, 5, 2207–2216. [Google Scholar] [CrossRef]
- Wang, Y.H.; Liu, H.M.; Xu, B.Q. Durable Ni/MgO catalysts for CO2 reforming of methane: Activity and metal-support interaction. J. Mol. Catal. A Chem. 2009, 299, 44–52. [Google Scholar] [CrossRef]
- Natesakhawat, S.; Oktar, O.; Ozkan, U.S. Effect of lanthanide promotion on catalytic performance of sol-gel Ni/Al2O3 catalysts in steam reforming of propane. J. Mol. Catal. A Chem. 2005, 241, 133–146. [Google Scholar] [CrossRef]
- Cao, P.; Tang, P.; Bekheet, M.F.; Du, H.; Yang, L.; Haug, L.; Gili, A.; Bischoff, B.; Gurlo, A.; Kunz, M.; et al. Atomic-Scale Insights into Nickel Exsolution on LaNiO3 Catalysts via In Situ Electron Microscopy. J. Phys. Chem. C 2022, 126, 786–796. [Google Scholar] [CrossRef]
- Marinho, A.L.A.; Rabelo-Neto, R.C.; Epron, F.; Bion, N.; Toniolo, F.S.; Noronha, F.B. Embedded Ni nanoparticles in CeZrO2 as stable catalyst for dry reforming of methane. Appl. Catal. B Environ. 2020, 268, 118387. [Google Scholar] [CrossRef]
- Pinto, F.M.; Suzuki, V.Y.; Silva, R.C.; La Porta, F.A. Oxygen Defects and Surface Chemistry of Reducible Oxides. Front. Mater. 2019, 6, 260. [Google Scholar] [CrossRef]
- Klabunde, K.J.; Stark, J.; Koper, O.; Mohs, C.; Park, D.G.; Decker, S.; Jiang, Y.; Lagadic, I.; Zhang, D. Nanocrystals as stoichiometric reagents with unique surface chemistry. New adsorbents for air purification. Nanostructured Mater. 1999, 12, 463–466. [Google Scholar] [CrossRef]
- Ismagilov, Z.R.; Matus, E.V.; Li, L. Catalytic methods of converting carbon dioxide into useful products to reduce the impact of coal generation on global climate change. Uspekhi Fiz Nauk. 2022, 192, 1214–1230. [Google Scholar] [CrossRef]
- Roh, H.S.; Koo, K.Y.; Yoon, W.L. Combined reforming of methane over co-precipitated Ni-CeO2, Ni-ZrO2 and Ni-Ce0.8Zr0.2O2 catalysts to produce synthesis gas for gas to liquid (GTL) process. Catal. Today 2009, 146, 71–75. [Google Scholar] [CrossRef]
- Li, P.; Park, Y.H.; Moon, D.J.; Park, N.C.; Kim, Y.C. Carbon deposition onto Ni-Based catalysts for combined steam/CO2 reforming of methane. J. Nanosci. Nanotechnol. 2016, 16, 1562–1566. [Google Scholar] [CrossRef]
- Siang, T.J.; Pham, T.L.; Van Cuong, N.; Phuong, P.T.; Phuc, N.H.H.; Truong, Q.D.; Vo, D.V.N. Combined steam and CO2 reforming of methane for syngas production over carbon-resistant boron-promoted Ni/SBA-15 catalysts. Microporous Mesoporous Mater. 2018, 262, 122–132. [Google Scholar] [CrossRef]
- Wysocka, I.; Mielewczyk-Gryń, A.; Łapiński, M.; Cieślik, B.; Rogala, A. Effect of small quantities of potassium promoter and steam on the catalytic properties of nickel catalysts in dry/combined methane reforming. Int. J. Hydrogen Energy 2021, 46, 3847–3864. [Google Scholar] [CrossRef]
- Sukonket, T.; Khan, A.; Saha, B.; Ibrahim, H.; Tantayanon, S.; Kumar, P.; Idem, R. Influence of the Catalyst Preparation Method, Surfactant Amount, and Steam on CO2 Reforming of CH4 over 5Ni/Ce0.6Zr0.4O2 Catalysts. Energy Fuels 2011, 25, 864–877. [Google Scholar] [CrossRef]
- Zhao, Z.; Ren, P.; Li, W.; Miao, B. Effect of mineralizers for preparing ZrO2 support on the supported Ni catalyst for steam-CO2 bi-reforming of methane. Int. J. Hydrogen Energy 2017, 42, 6598–6609. [Google Scholar] [CrossRef]
- Agarwal, S.; Mojet, B.L.; Lefferts, L.; Datye, A.K. Ceria Nanoshapes—Structural and Catalytic Properties. In Catalysis by Materials with Well-Defined Structures; Elsevier: Amsterdam, The Netherlands, 2015; pp. 31–70. [Google Scholar] [CrossRef]
- Dai, Y.; Lu, P.; Cao, Z.; Campbell, C.T.; Xia, Y. The physical chemistry and materials science behind sinter-resistant catalysts. Chem. Soc. Rev. 2018, 47, 4314–4331. [Google Scholar] [CrossRef] [PubMed]
- Gonzalez-DelaCruz, V.M.; Holgado, J.P.; Pereñíguez, R.; Caballero, A. Morphology changes induced by strong metal-support interaction on a Ni-ceria catalytic system. J. Catal. 2008, 257, 307–314. [Google Scholar] [CrossRef]
- Rehman, S.; Kim, H.; Farooq Khan, M.; Hur, J.H.; Lee, A.D.; Kim, D.K. Tuning of ionic mobility to improve the resistive switching behavior of Zn-doped CeO2. Sci. Rep. 2019, 9, 193870. [Google Scholar] [CrossRef] [Green Version]
- Ismagilov, I.Z.; Matus, E.V.; Nefedova, D.V.; Kuznetsov, V.V.; Yashnik, S.A.; Kerzhentsev, M.A.; Ismagilov, Z.R. Effect of support modification on the physicochemical properties of a NiPd/Al2O3 catalyst for the autothermal reforming of methane. Kinet. Catal. 2015, 56, 394–402. [Google Scholar] [CrossRef]
- Chan, S.H.; Wang, H.M. Effect of natural gas composition on autothermal fuel reforming products. Fuel Process. Technol. 2000, 64, 221–239. [Google Scholar] [CrossRef]
- Zhu, J.; Zhang, D.; King, K.D. Reforming of CH4 by partial oxidation: Thermodynamic and kinetic analyses. Fuel 2001, 80, 899–905. [Google Scholar] [CrossRef]


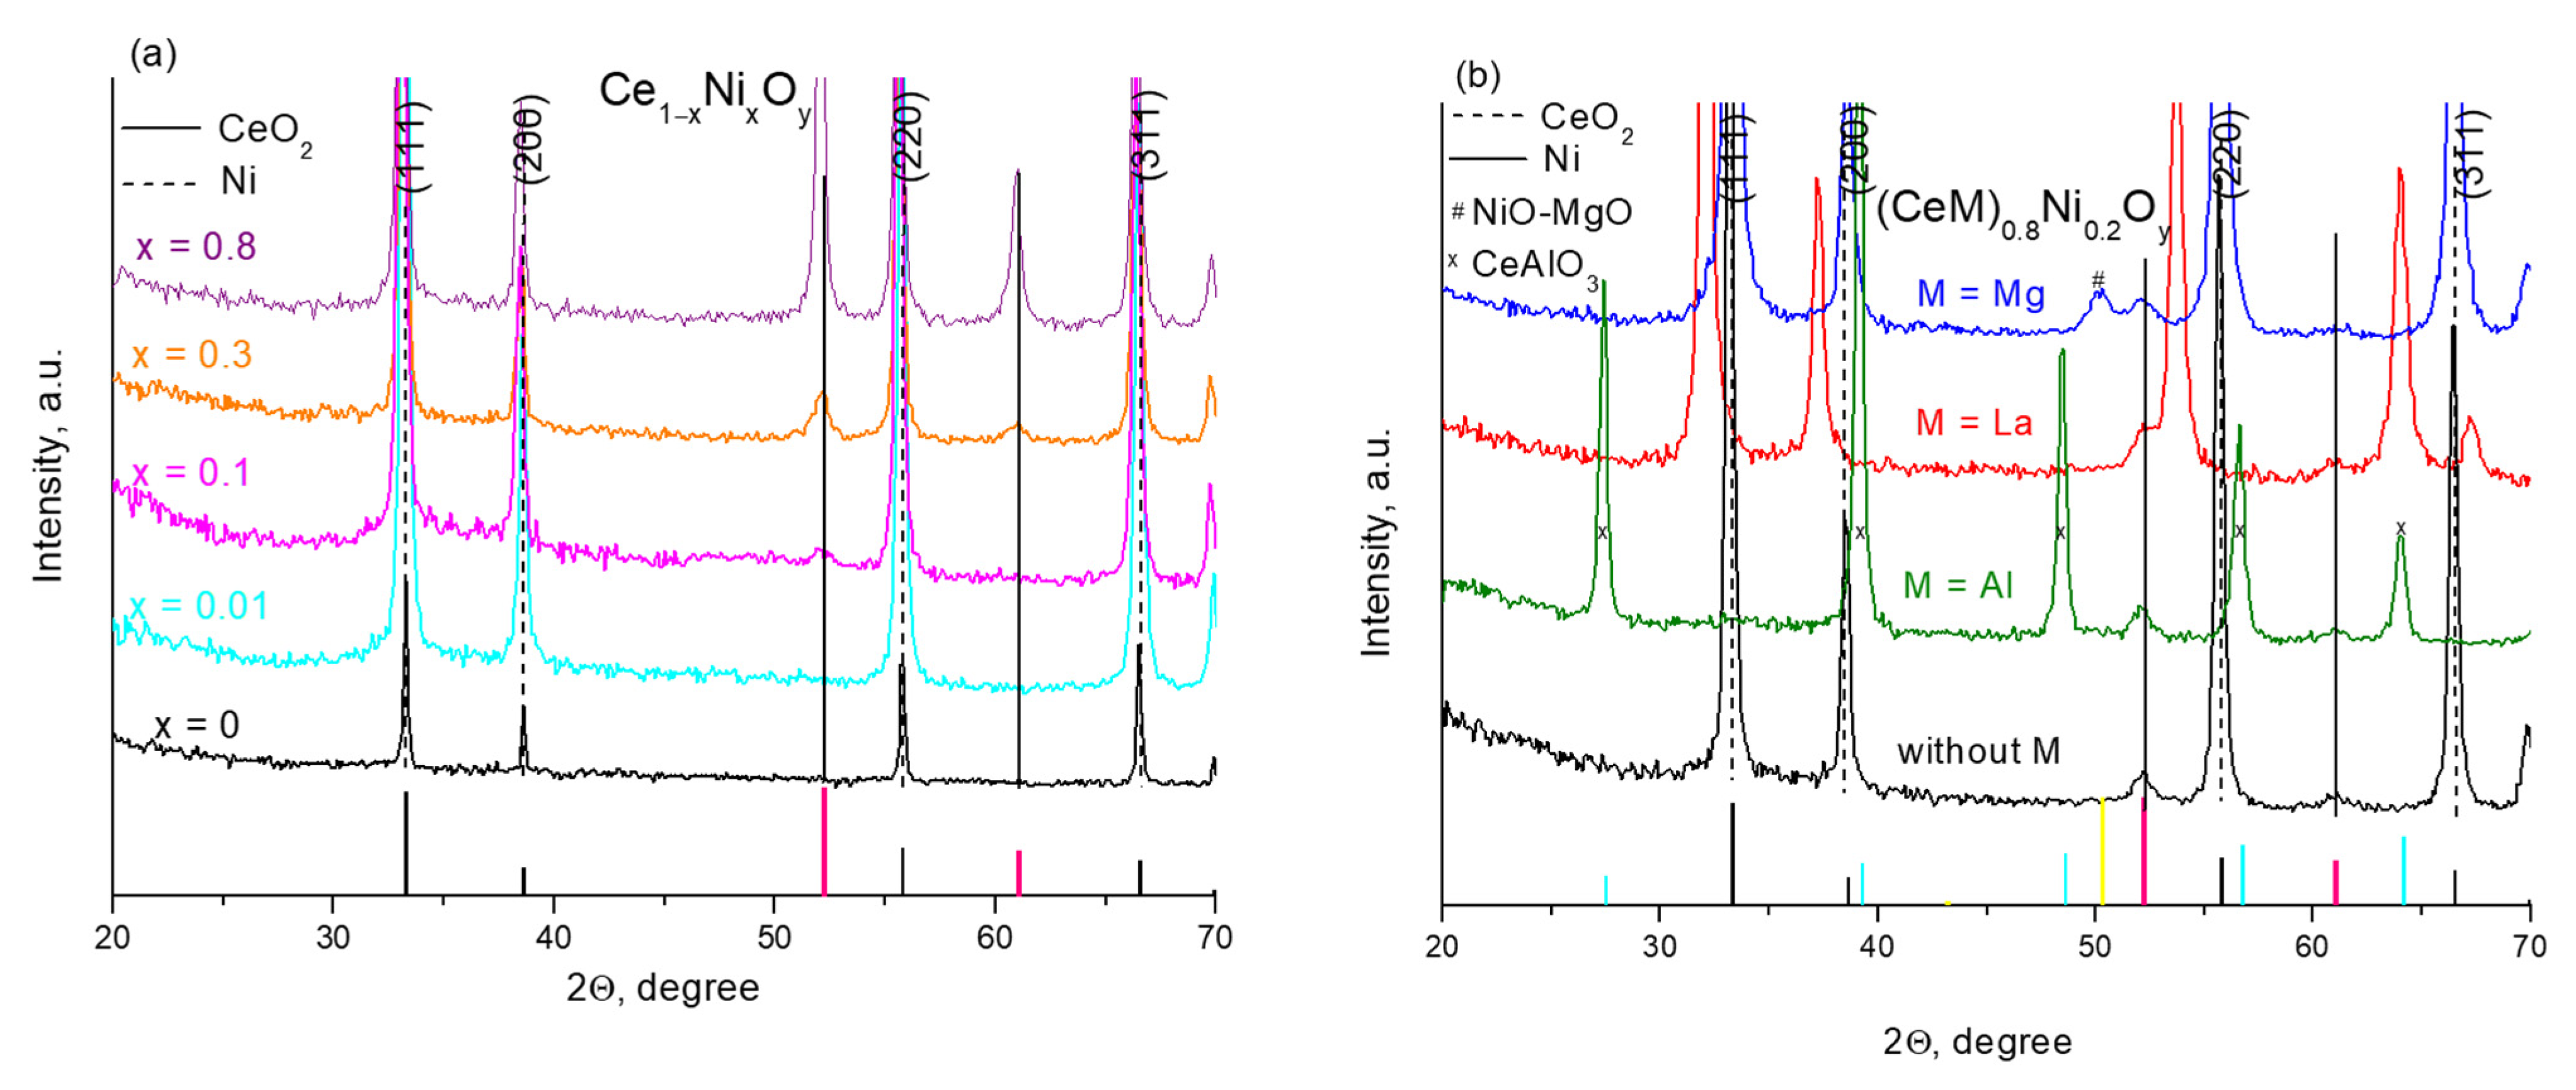
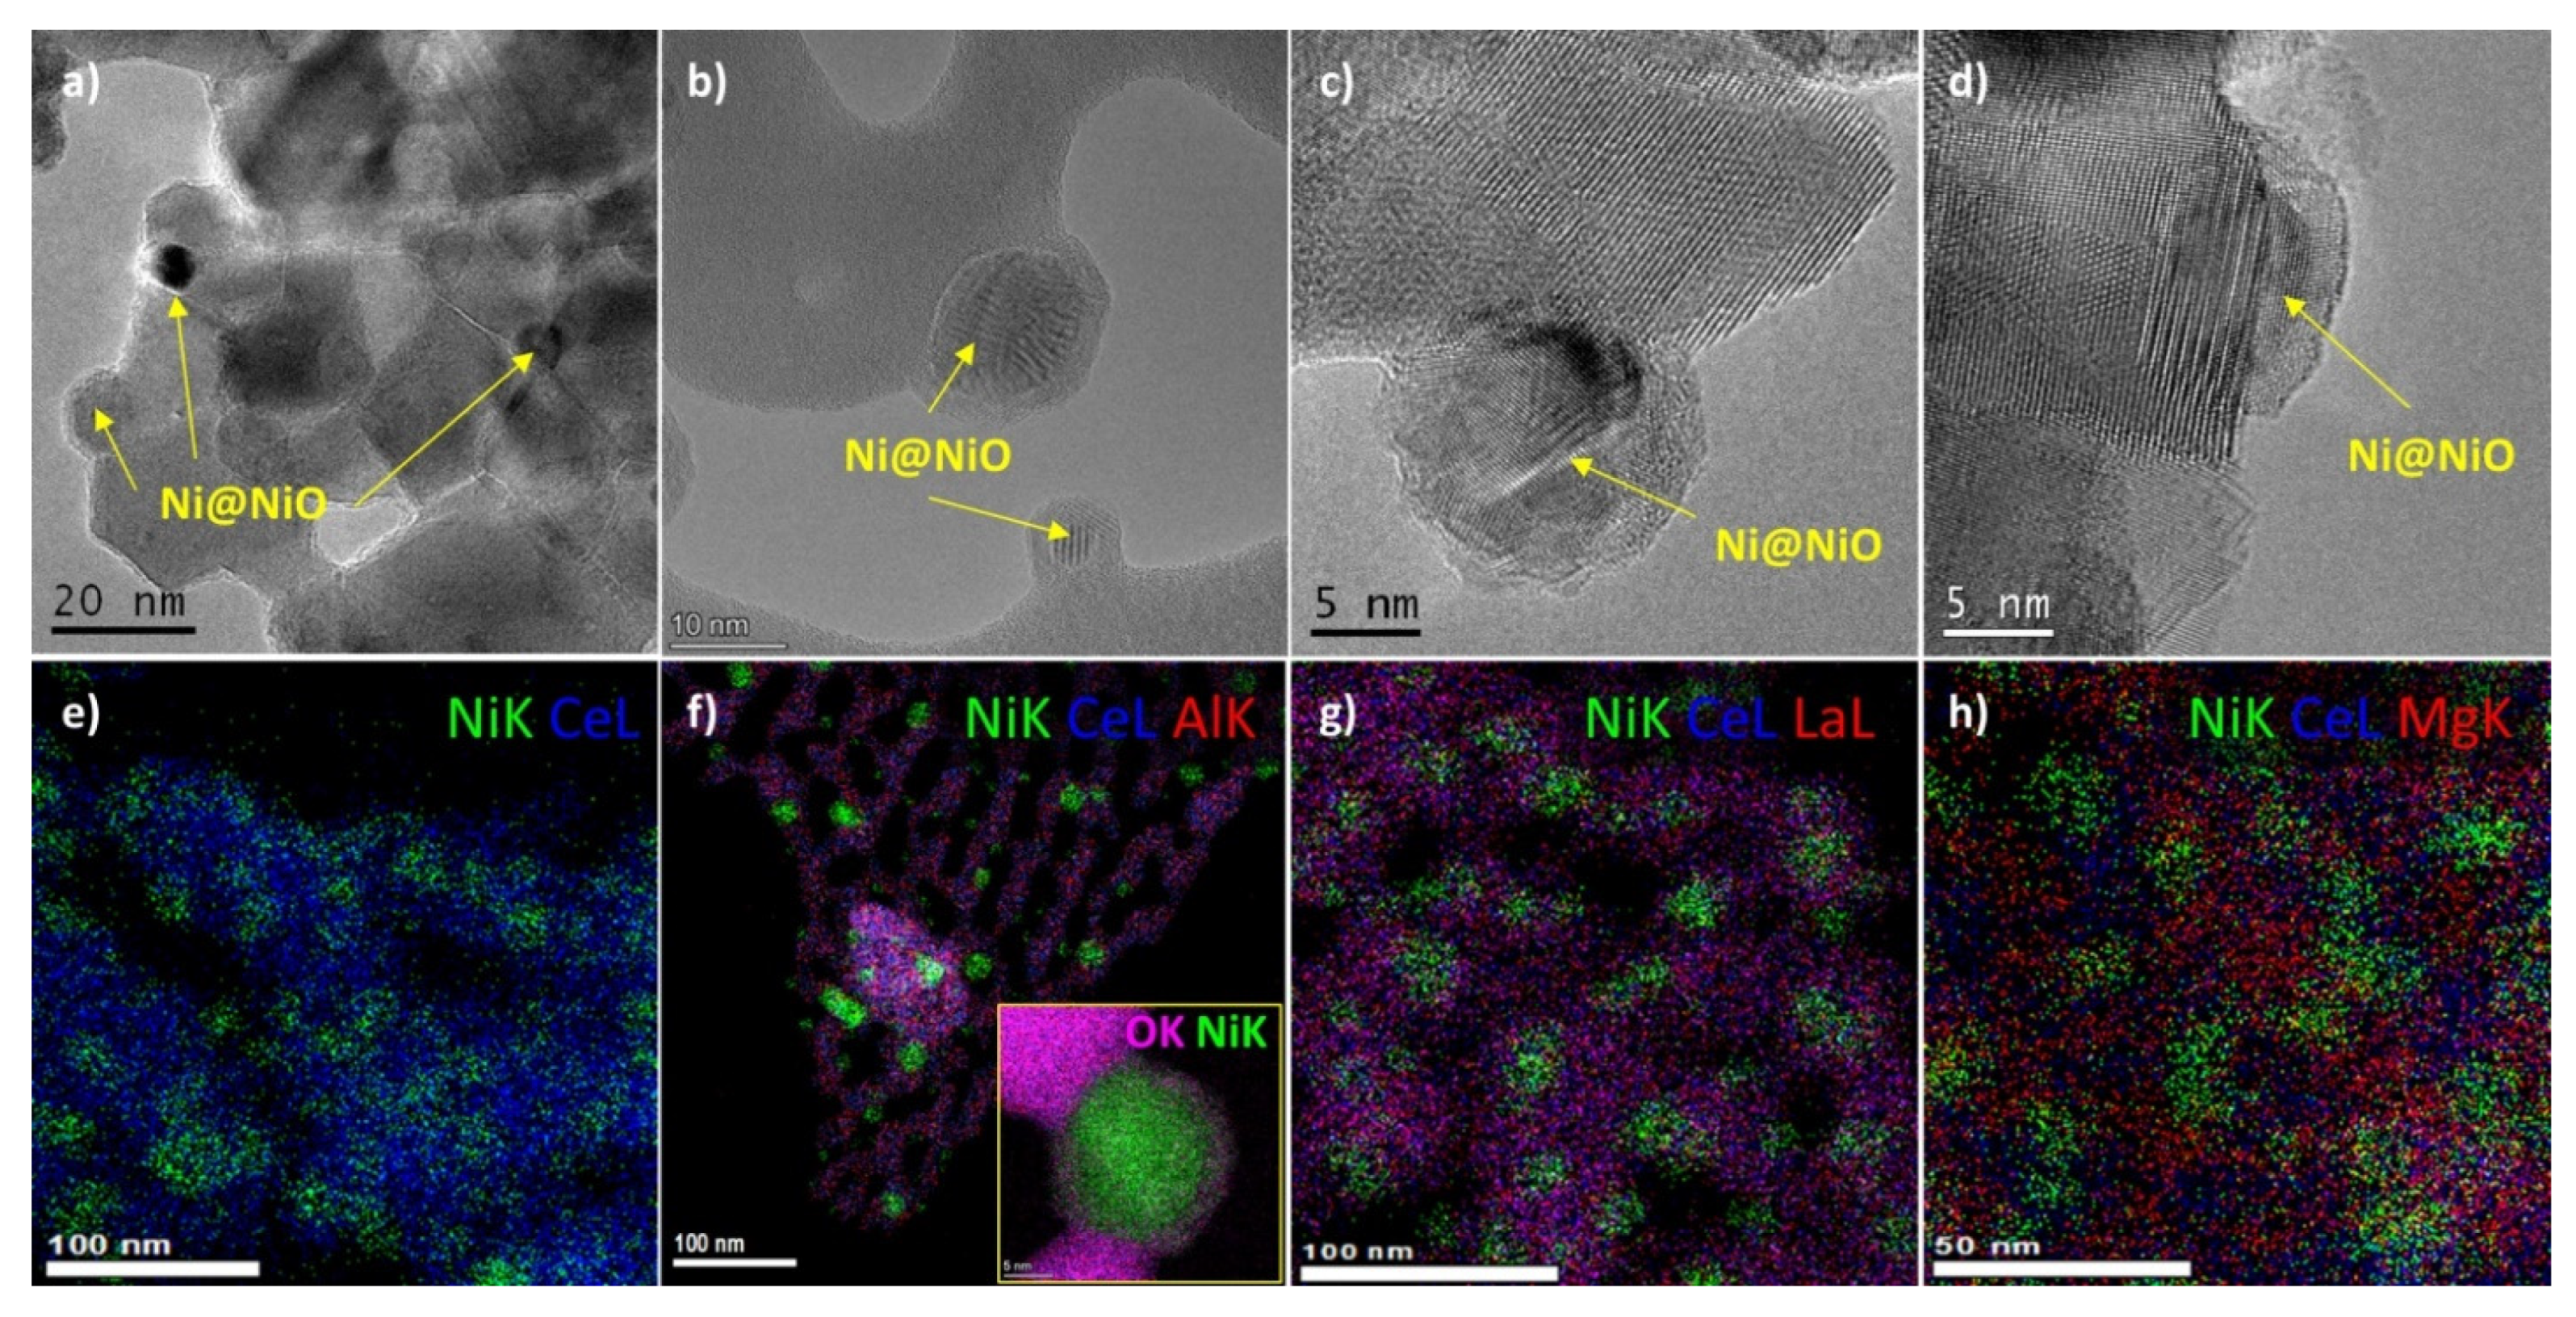

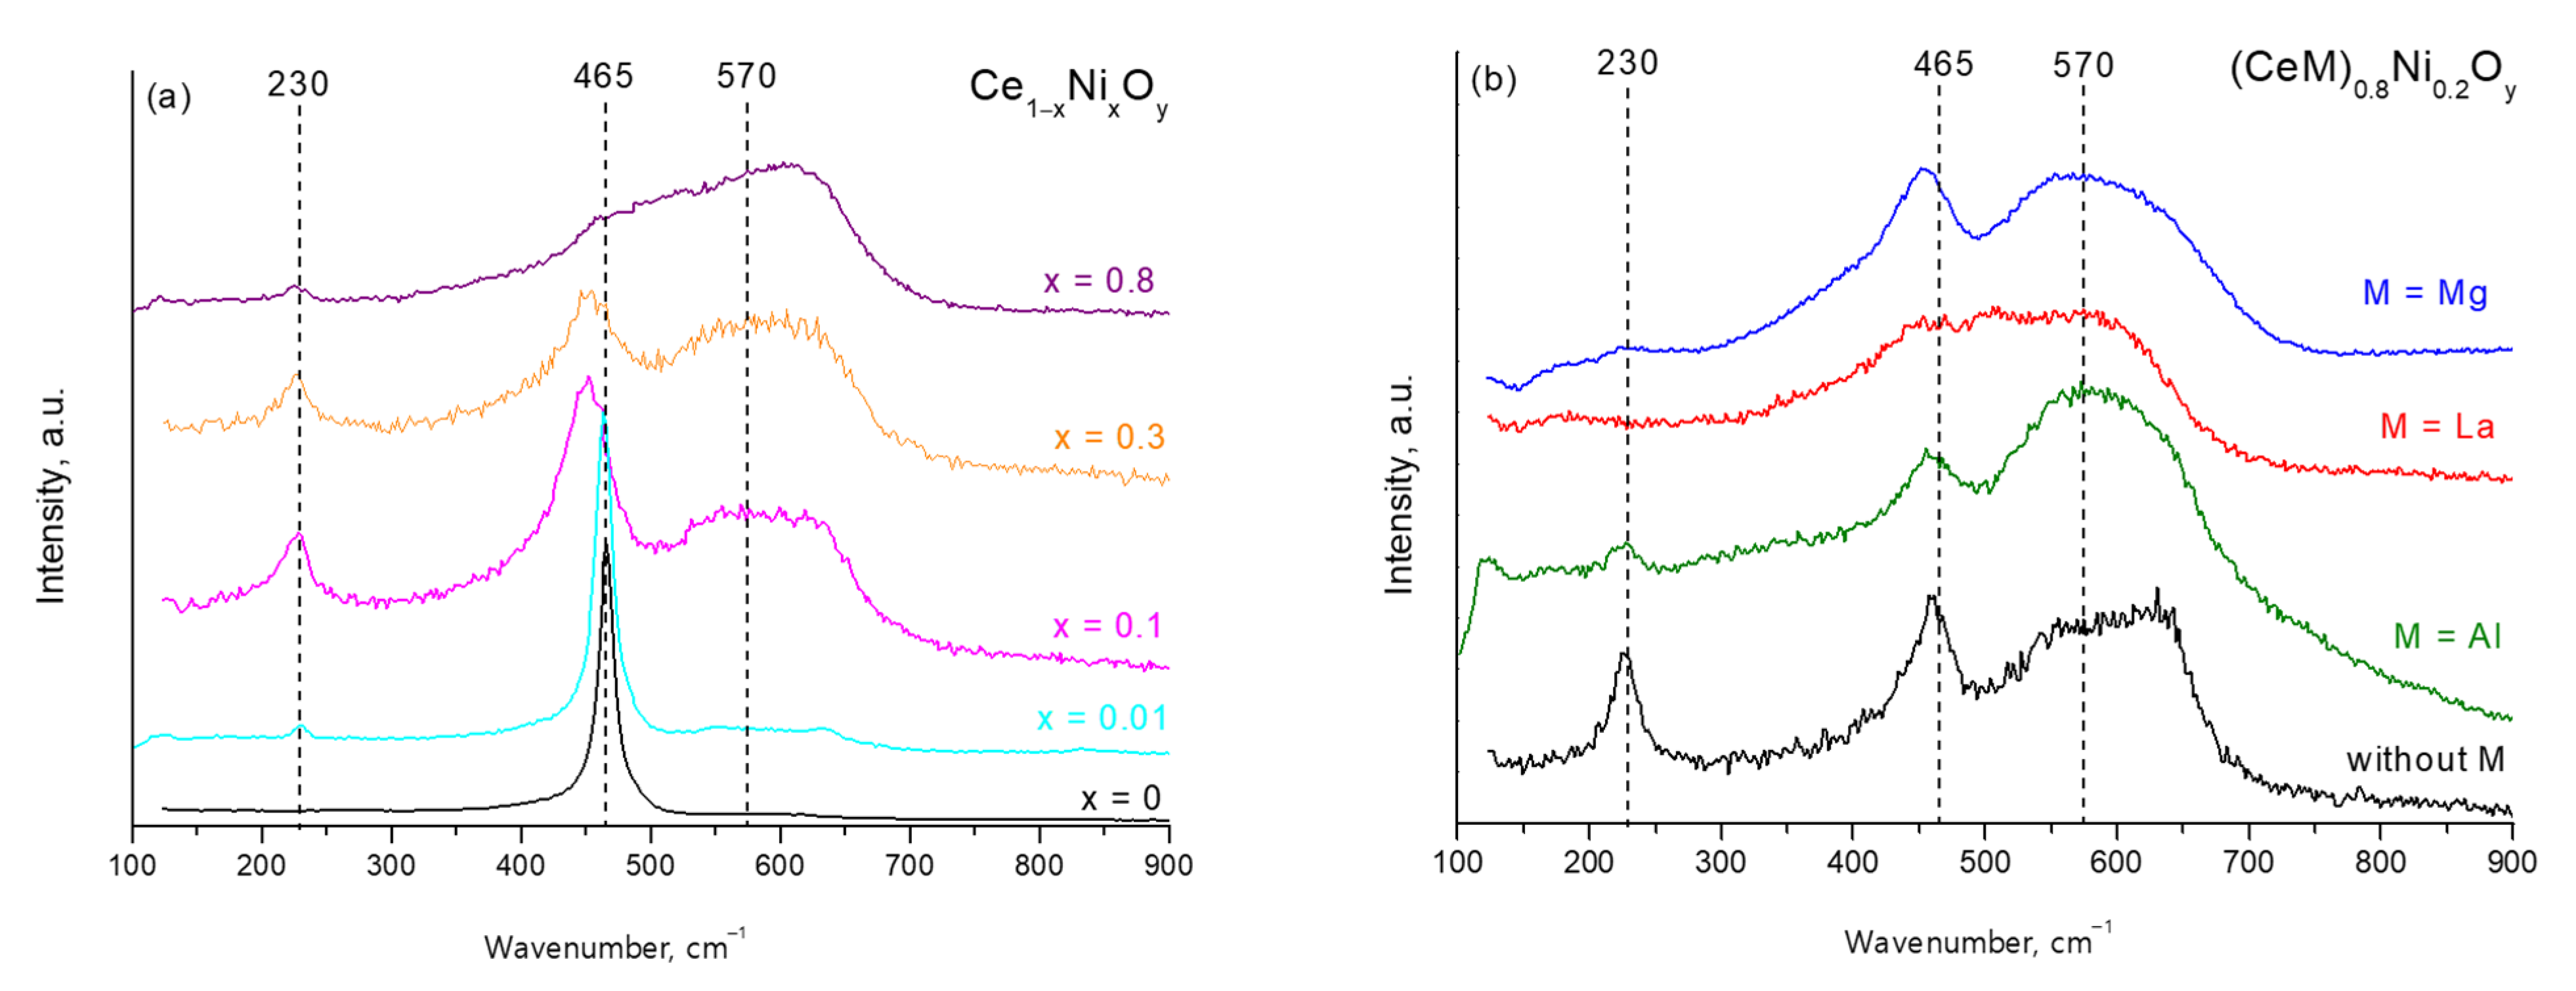
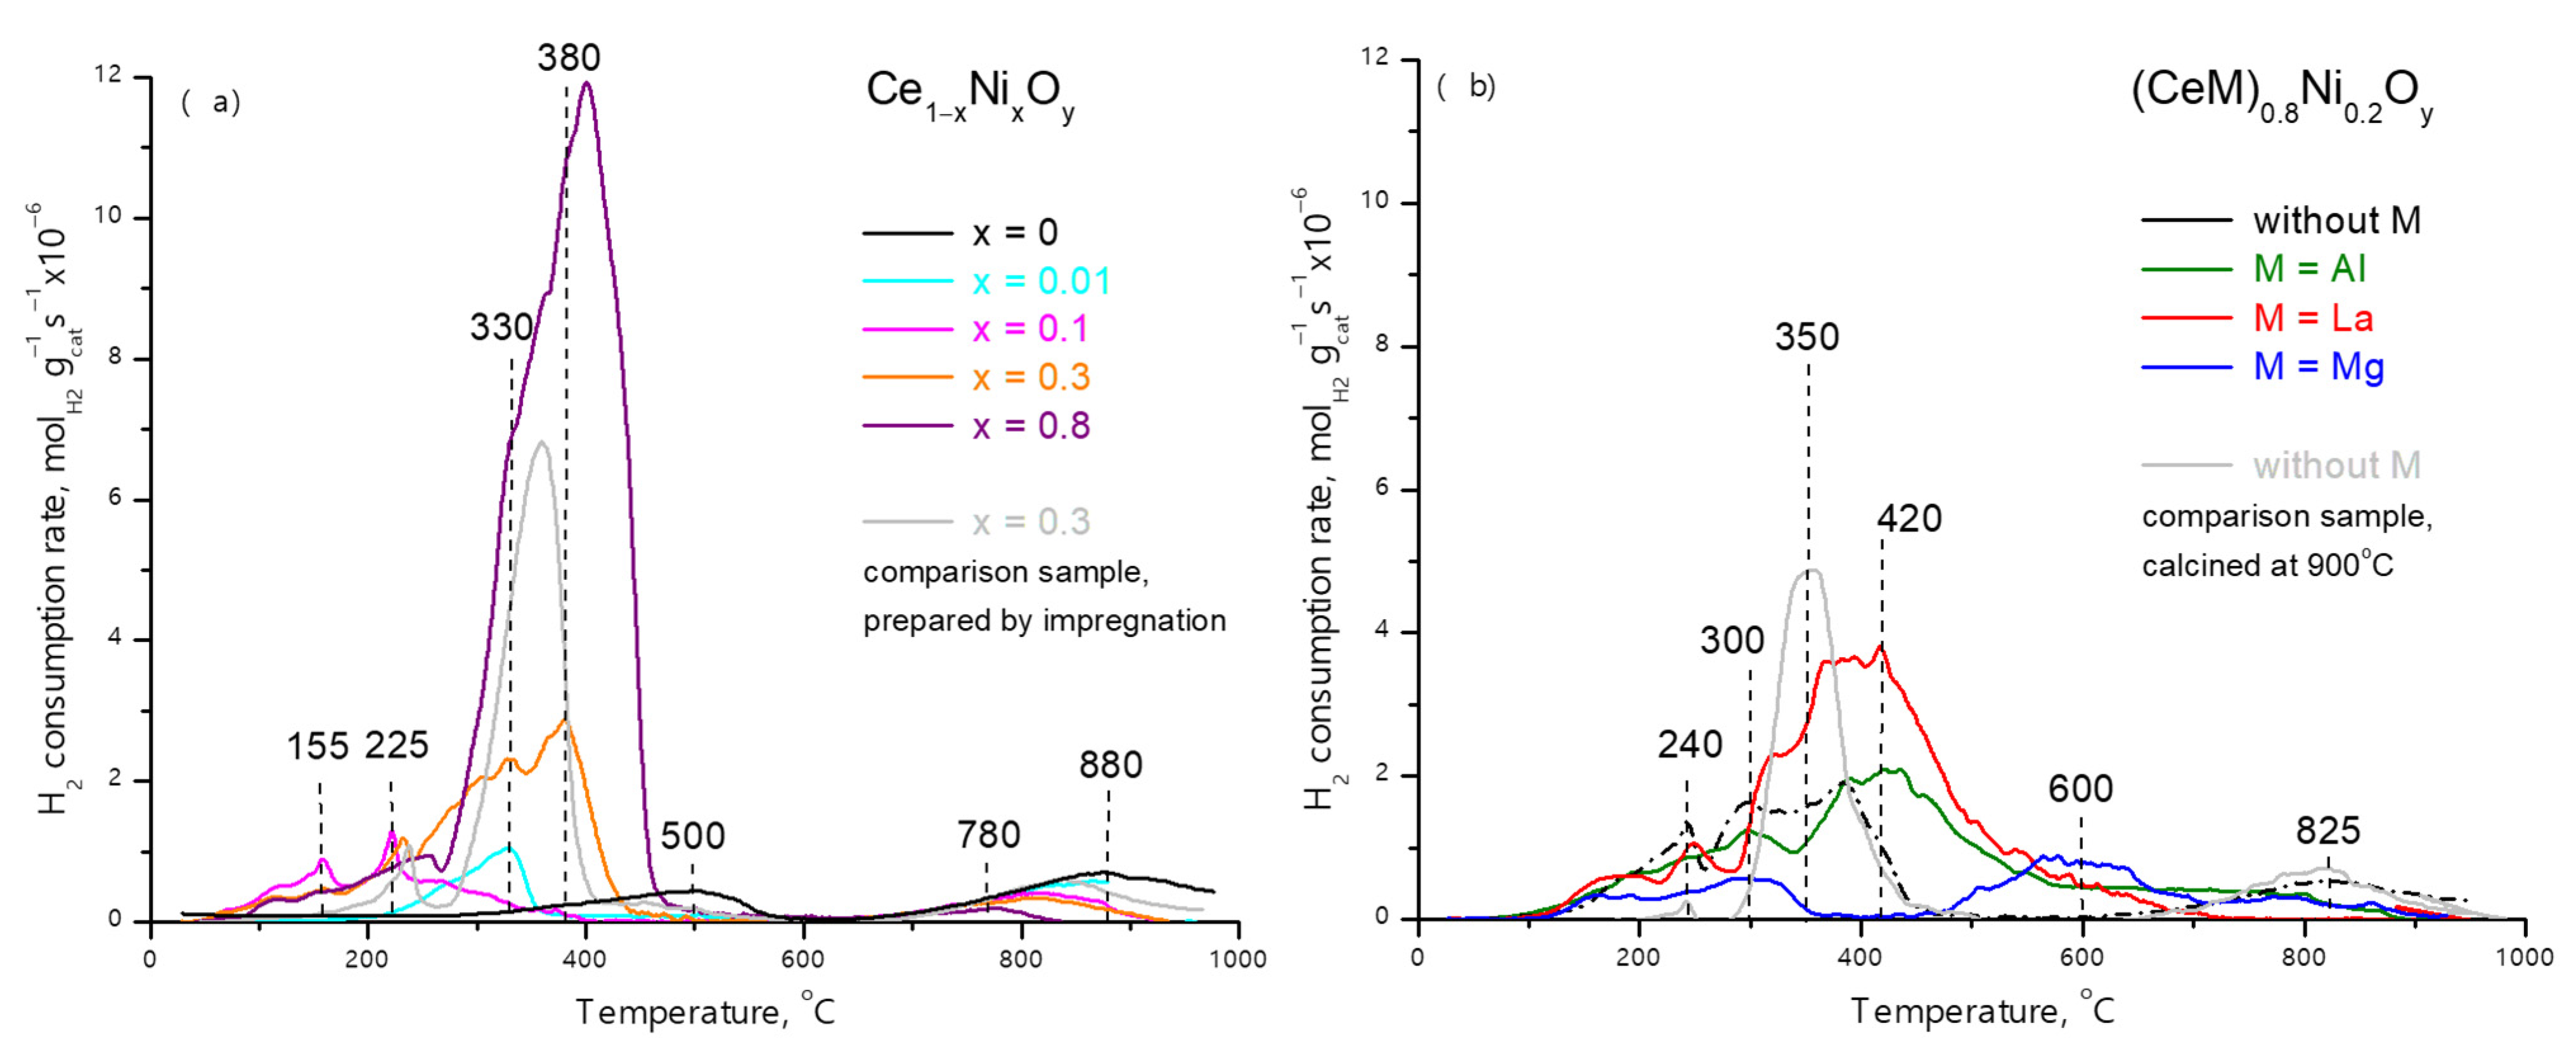
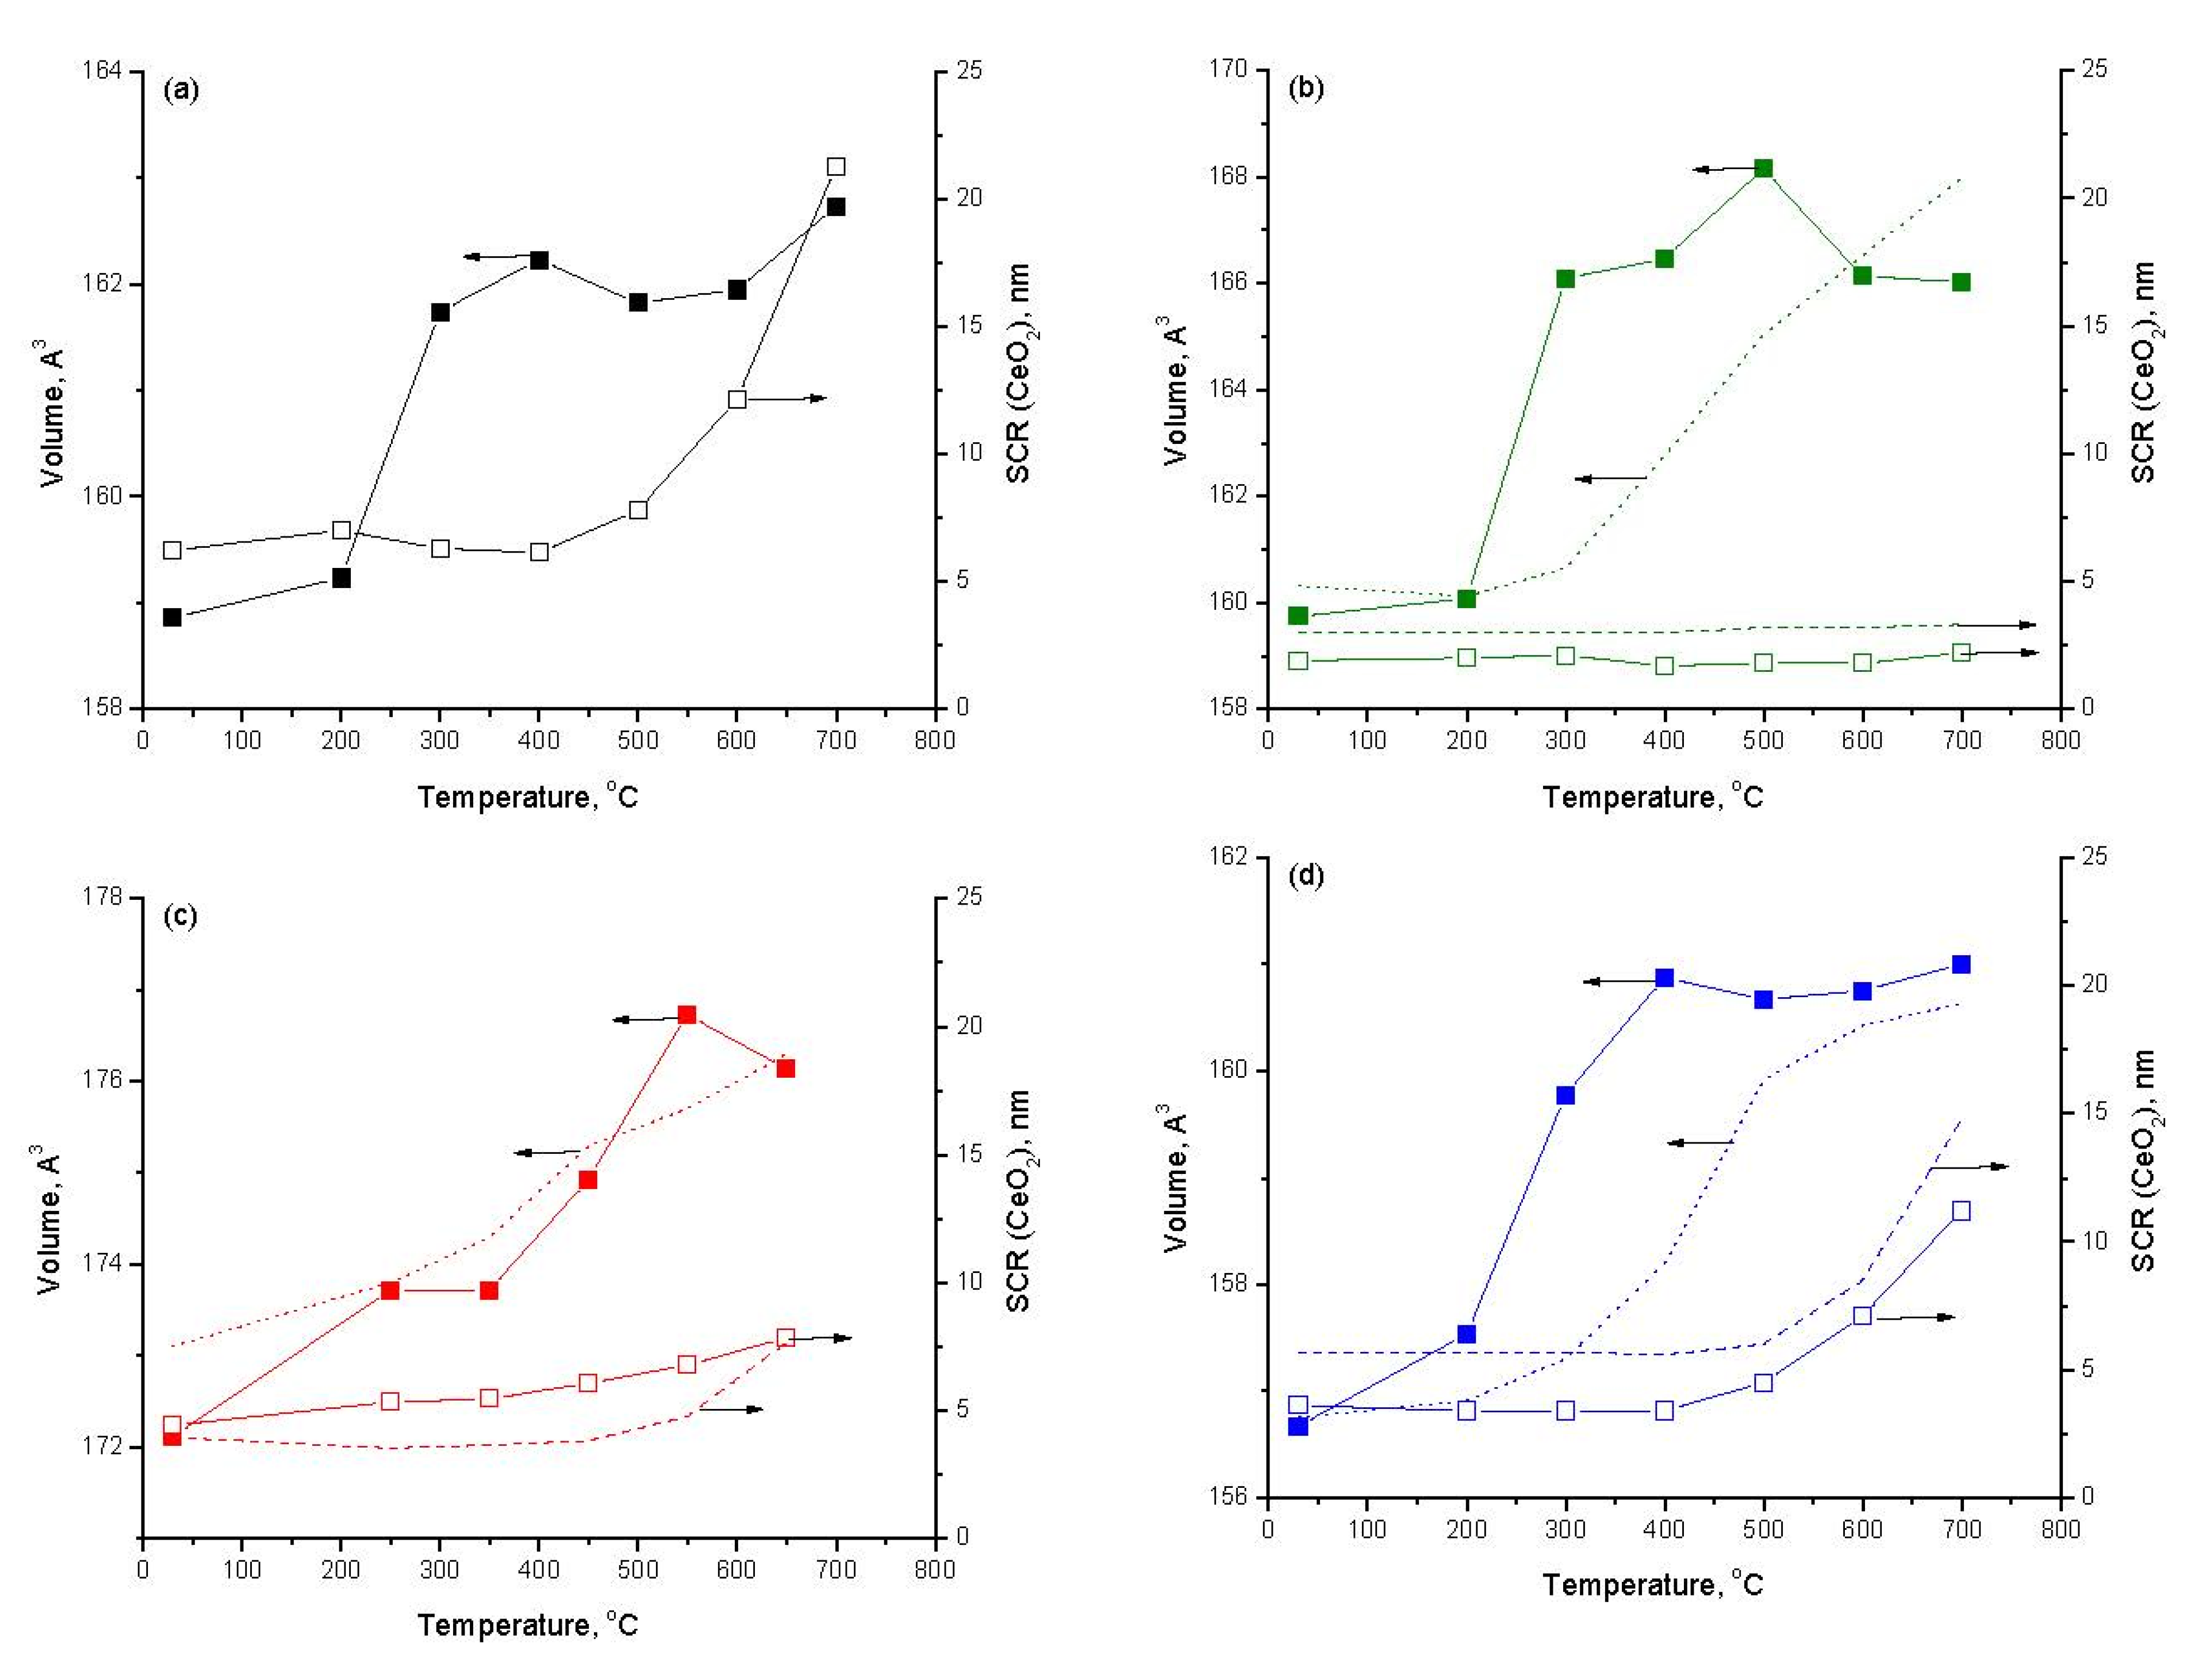
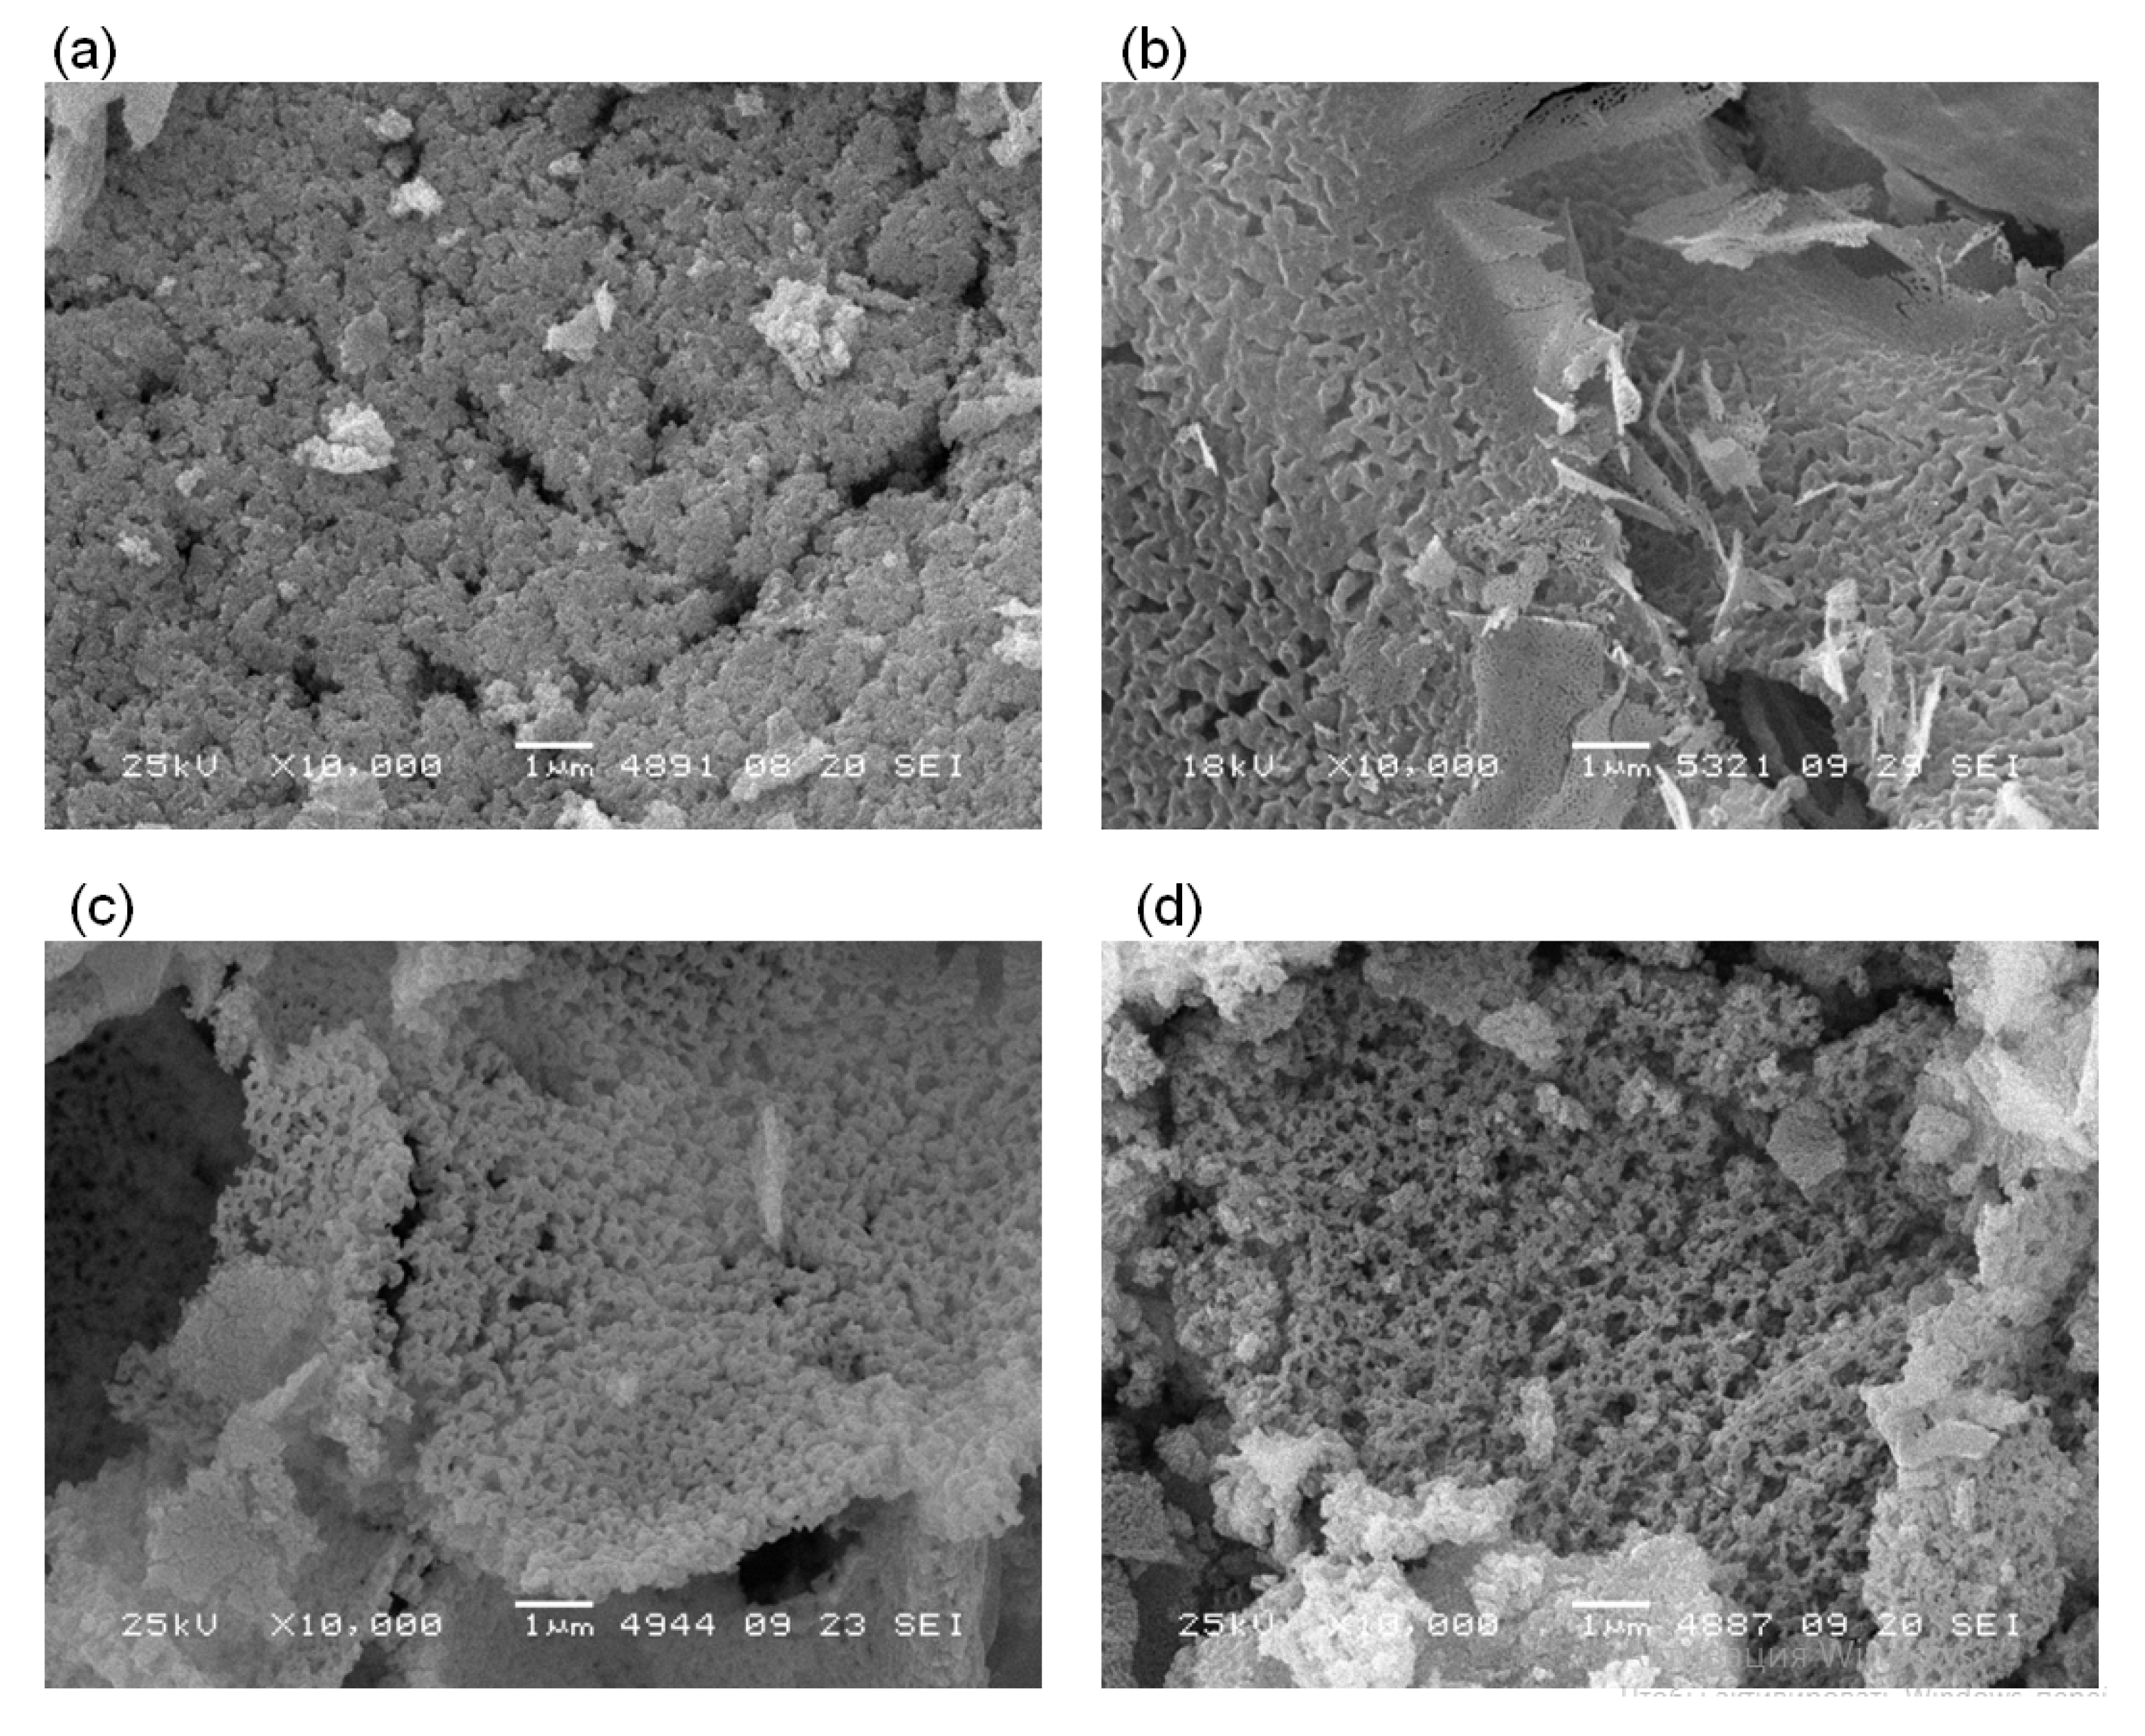
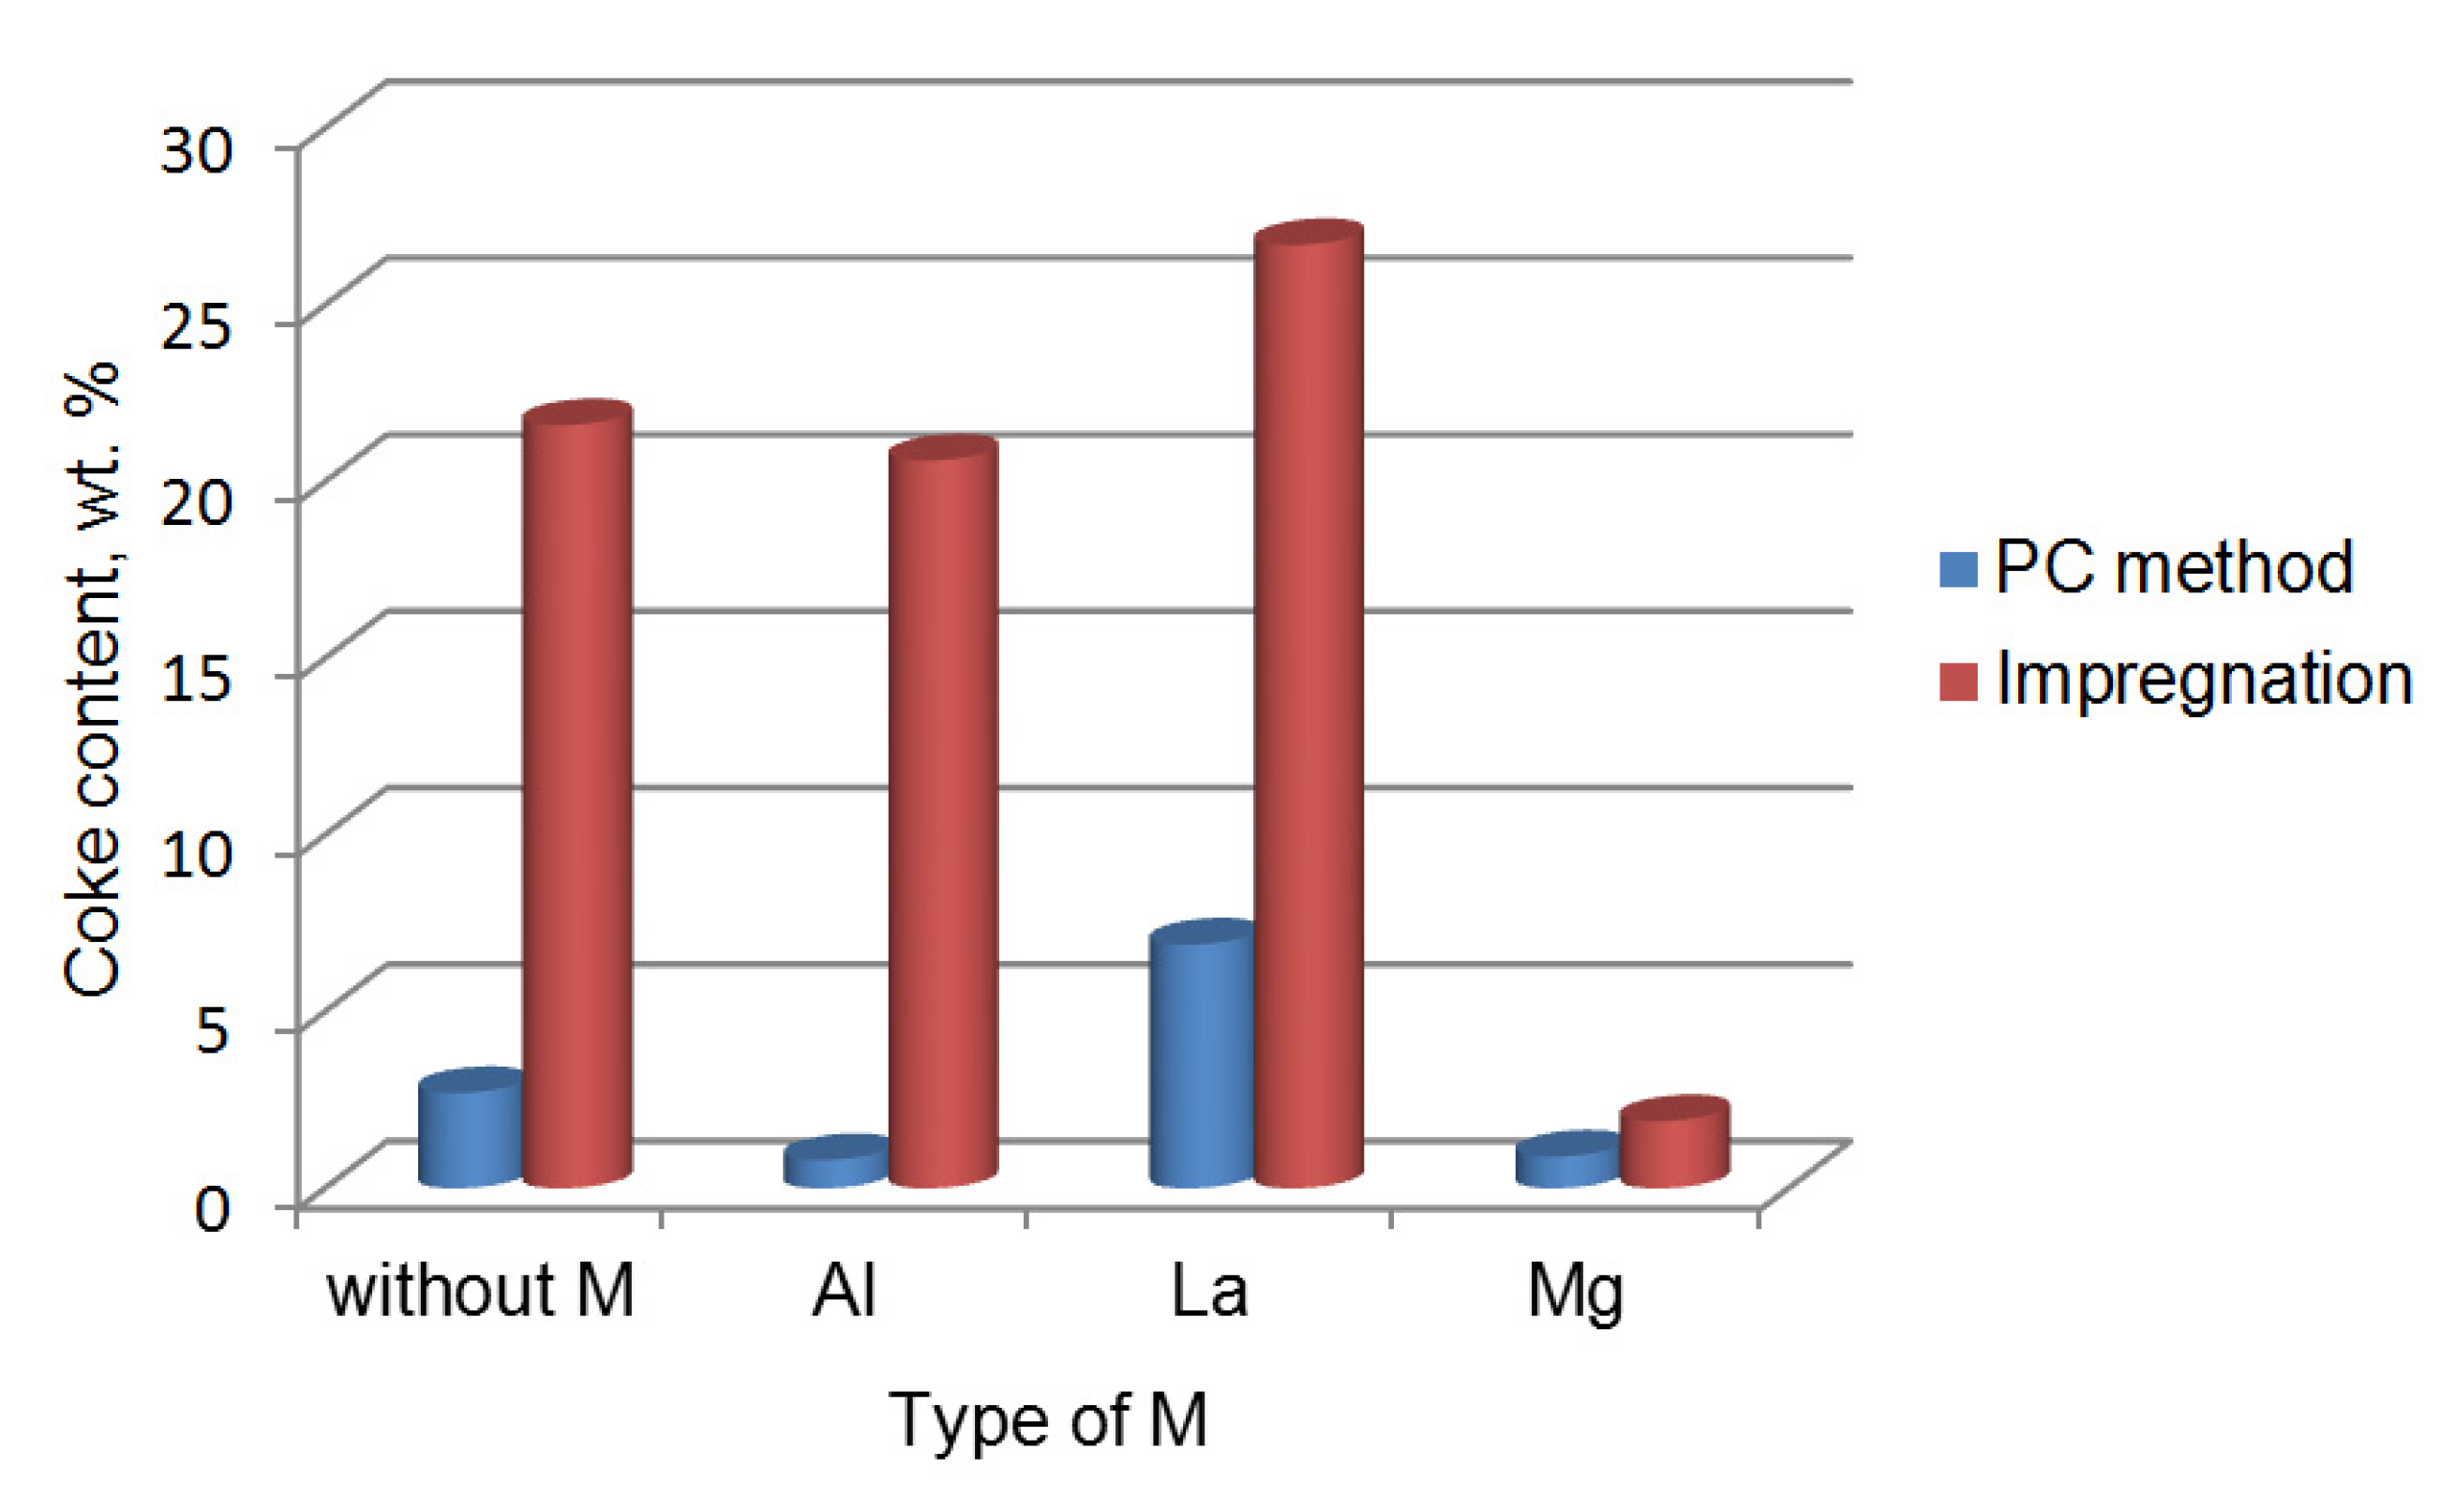
 without M;
  M = Al;
  M = La;
  M = Mg.
without M; M = Al; M = La; M = Mg.
M = Mg.
without M; M = Al; M = La; M = Mg.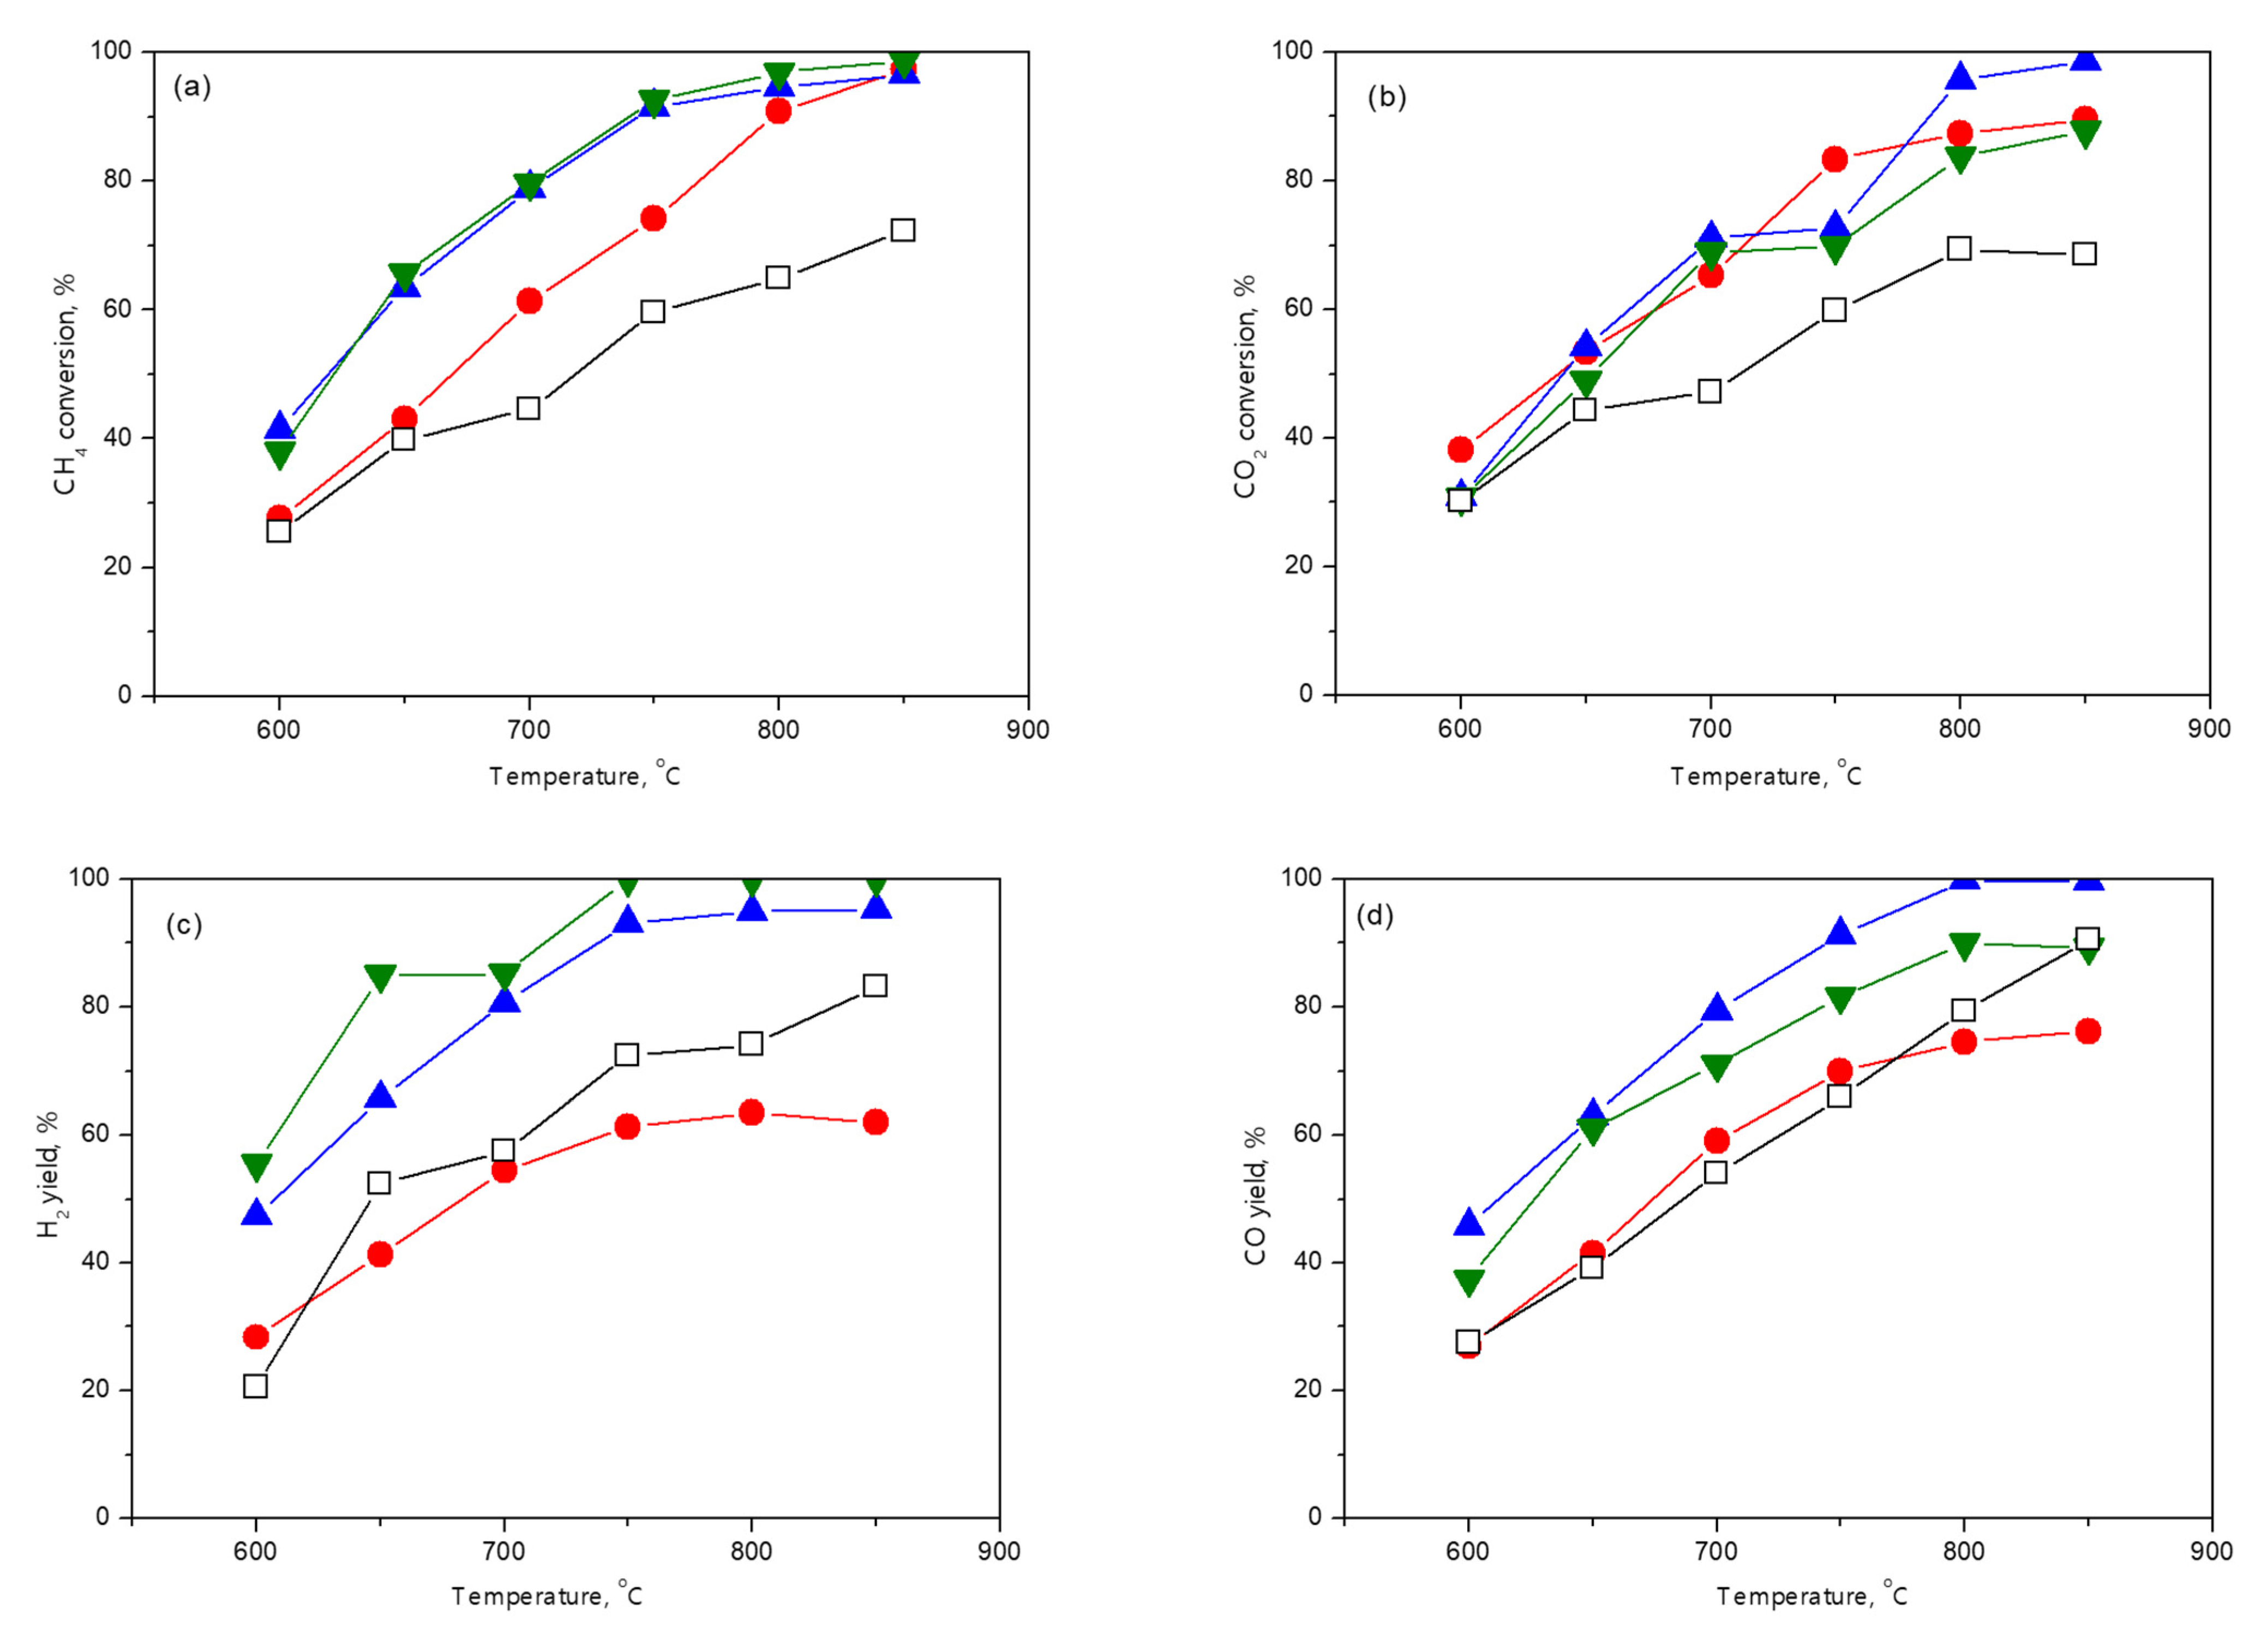


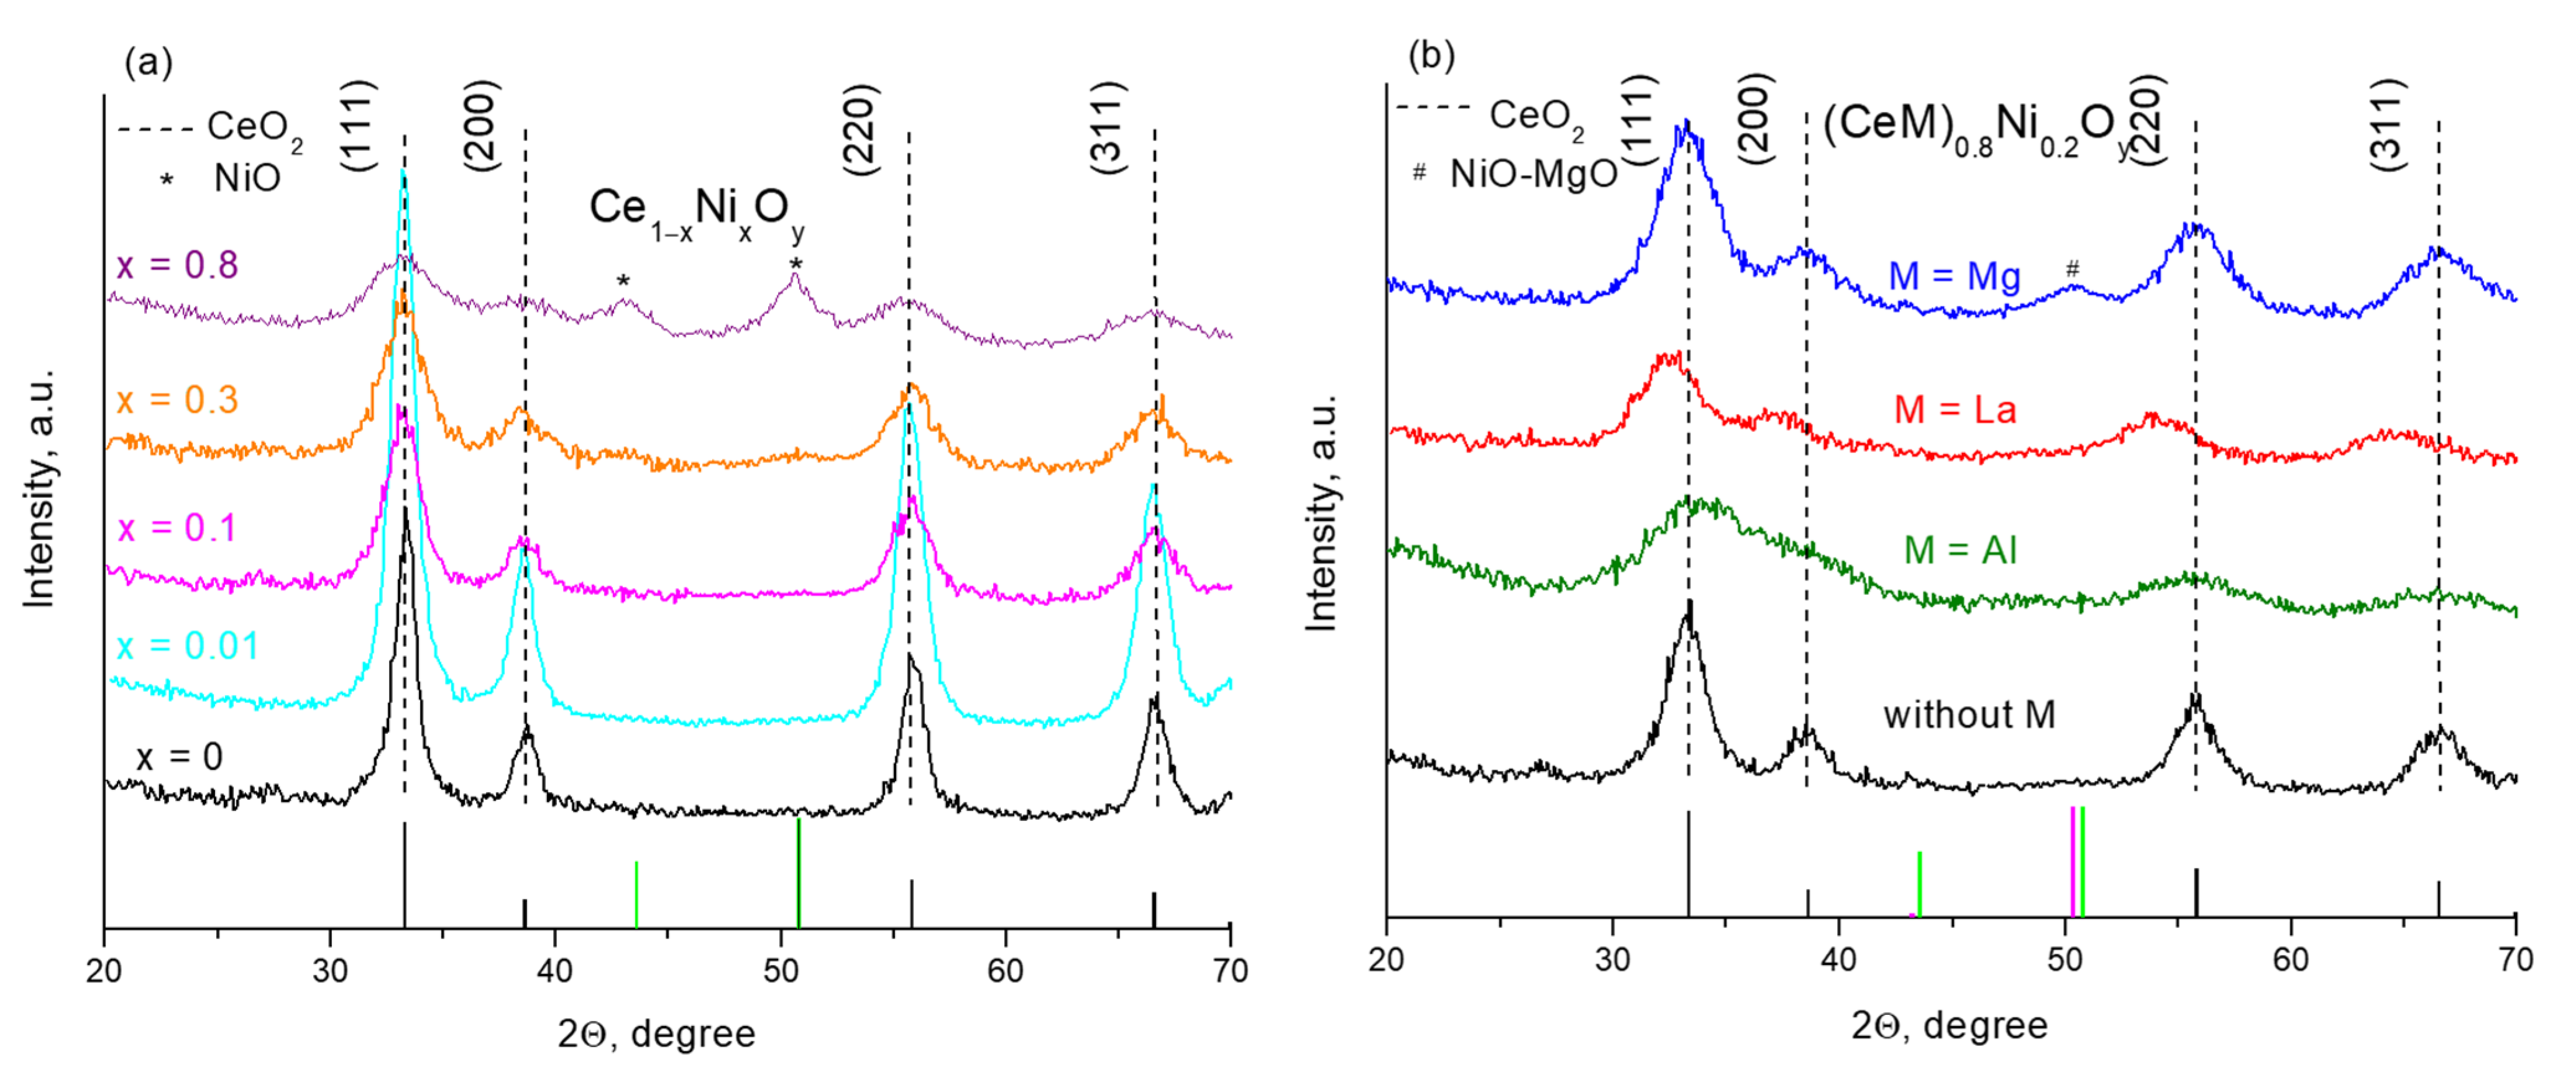
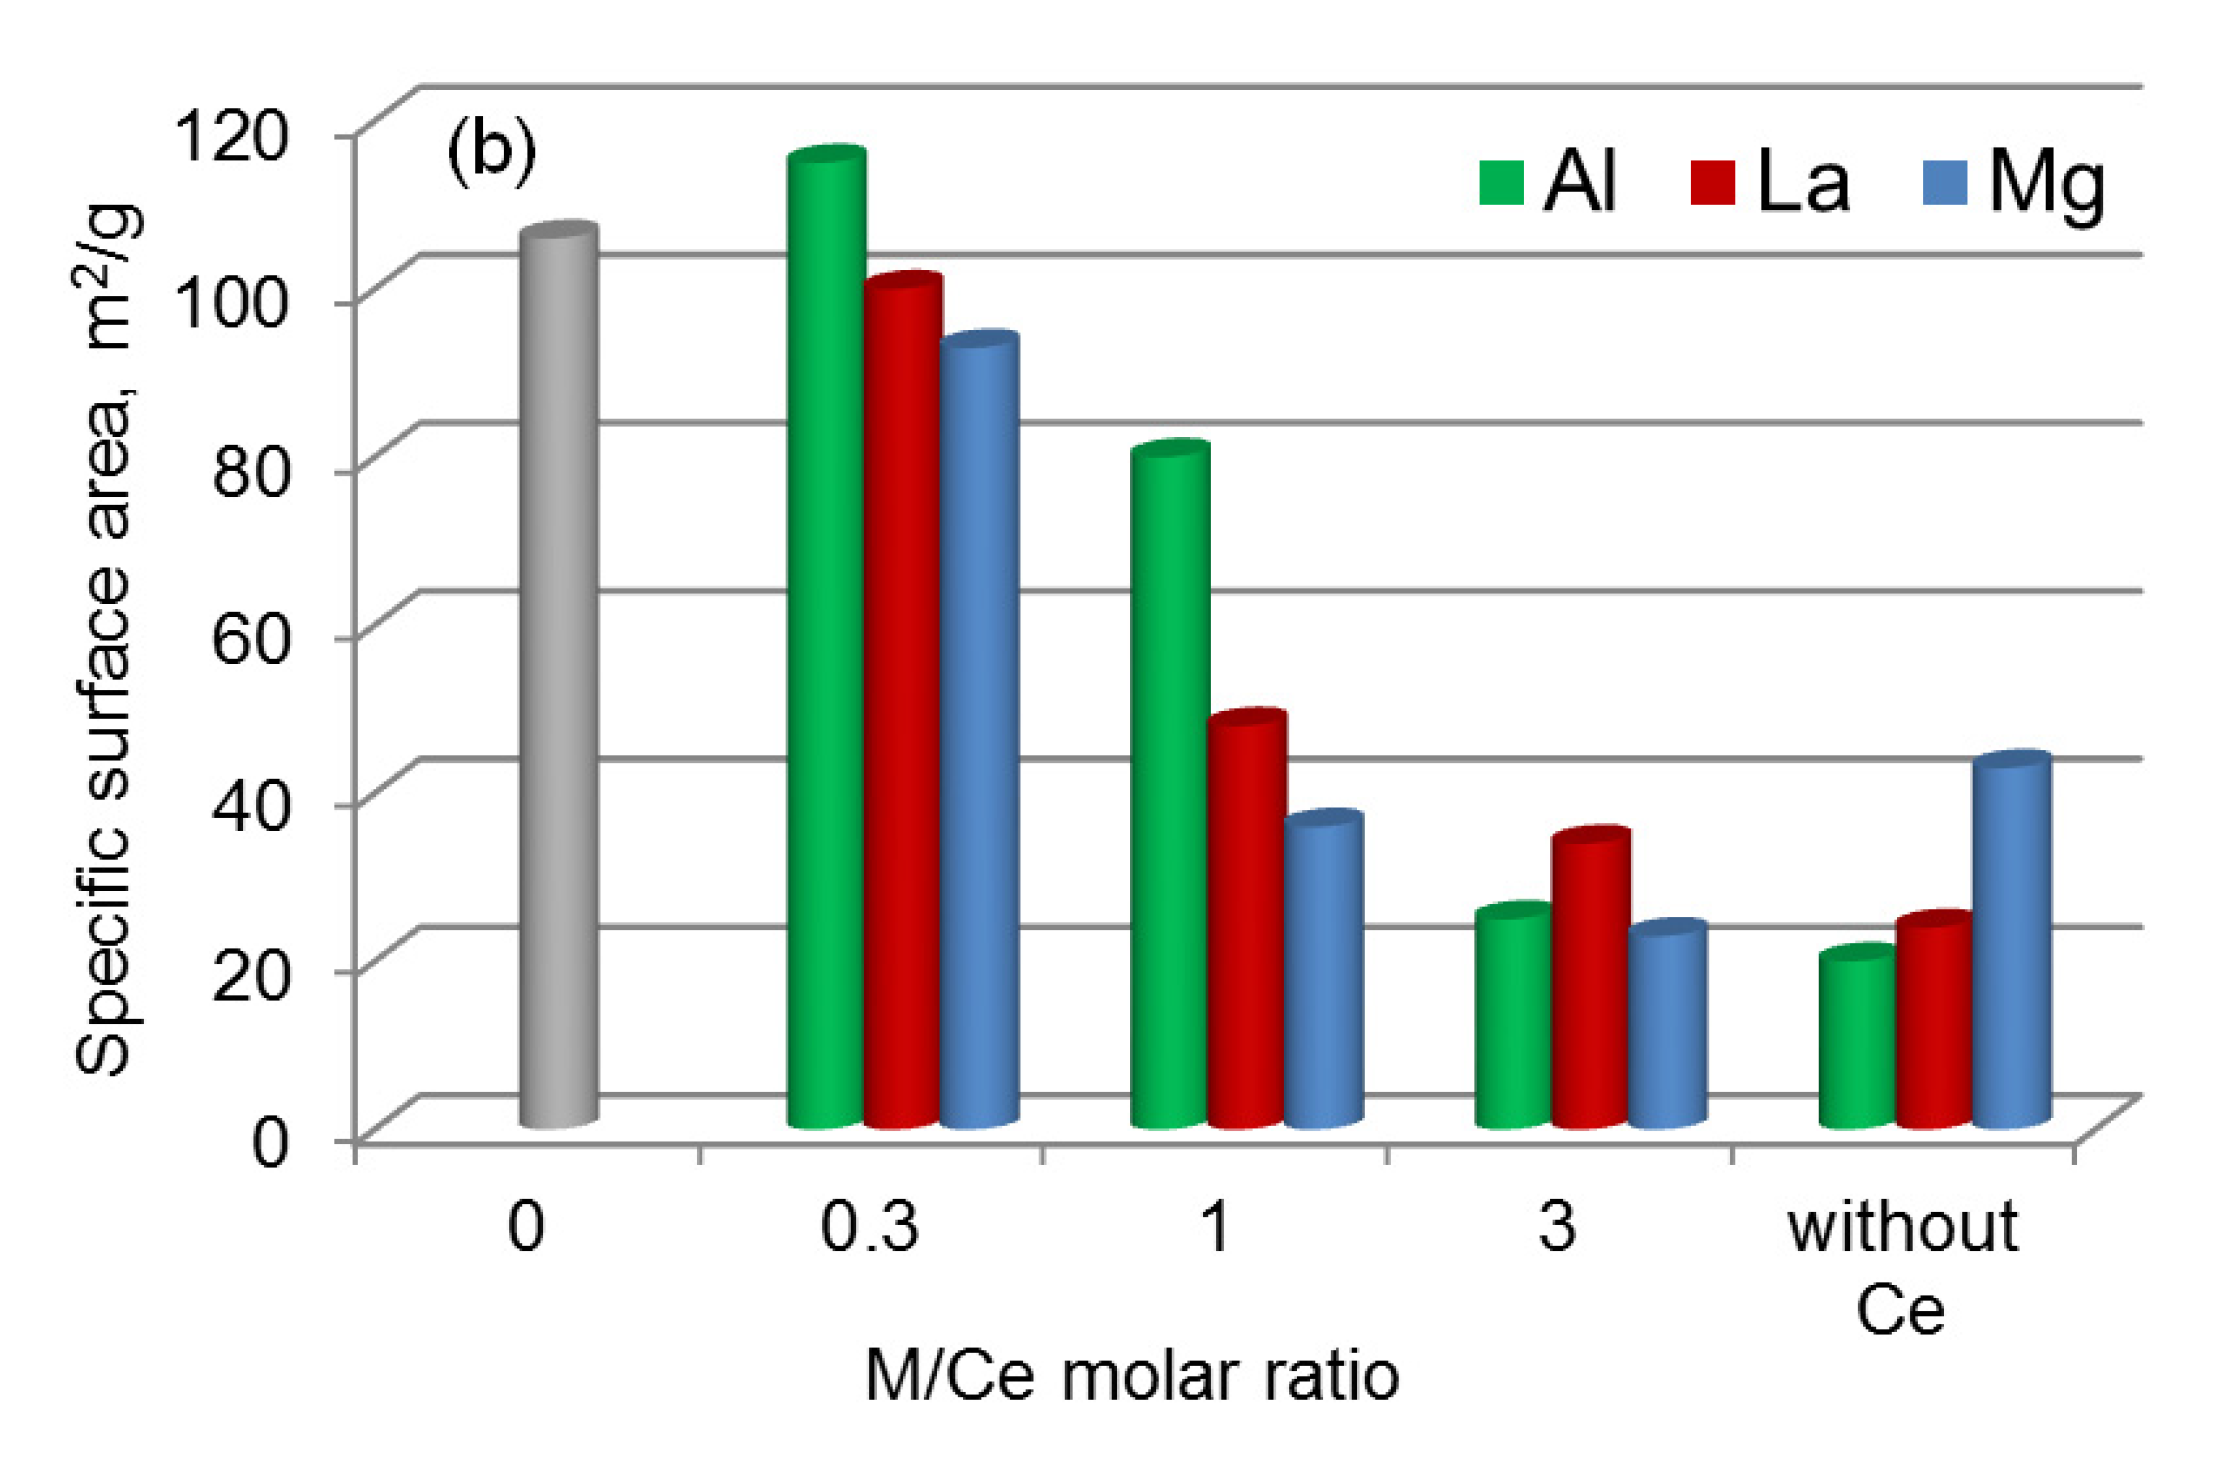
| Sample | Chemical Composition, wt.% | Textural Characteristics | ||||
|---|---|---|---|---|---|---|
| Ce | M | Ni | SBET, m2/g | Vp, cm3/g | Dp, nm | |
| Unmodified CeO2 | ||||||
| CeO2 | 82.6 | – | – | 83 | 0.20 | 9.6 |
| Without M | ||||||
| Ce0.99Ni0.01O1.99 * | 81.0 | – | 0.3 | 79 | 0.19 | 9.6 |
| Ce0.95Ni0.05O1.95 | 80.1 | – | 2.2 | 107 | 0.20 | 7.3 |
| Ce0.9Ni0.1O1.9 | 78.1 | – | 5.1 | 112 | 0.24 | 8.5 |
| Ce0.8Ni0.2O1.8 | 72.1 | – | 11.0 | 106 | 0.23 | 8.8 |
| Ce0.7Ni0.3O1.7 | 67.5 | – | 15.6 | 117 | 0.27 | 9.1 |
| Ce0.3Ni0.7O1.3 | 40.8 | – | 39.5 | 98 | 0.26 | 10.8 |
| Ce0.2Ni0.8O1.2 | 30.1 | – | 49.6 | 103 | 0.23 | 9.0 |
| M = Al | ||||||
| Ce0.6Al0.2Ni0.2O1.7 | 66.2 | 3.2 | 10.1 | 115 | 0.19 | 6.9 |
| Ce0.4Al0.4Ni0.2O1.6 | 54.6 | 10.6 | 9.8 | 80 | 0.22 | 11.3 |
| Ce0.2Al0.7Ni0.1O1.5 | 32.5 | 25.1 | 10.0 | 25 | 0.11 | 16.7 |
| Al0.9Ni0.1O1.5 | – | 46.3 | 9.9 | 20 | 0.11 | 22.0 |
| M = La | ||||||
| Ce0.6La0.2Ni0.2O1.7 | 57.4 | 14.2 | 9.8 | 100 | 0.31 | 12.3 |
| Ce0.4La0.4Ni0.2O1.6 | 36.5 | 36.2 | 9.4 | 48 | 0.18 | 15.6 |
| Ce0.2La0.6Ni0.2O1.5 | 14.8 | 58.6 | 9.2 | 34 | 0.15 | 18.1 |
| La0.8Ni0.2O1.4 | – | 74.2 | 10.0 | 24 | 0.10 | 17.1 |
| M = Mg | ||||||
| Ce0.6Mg0.2Ni0.2O1.6 | 67.0 | 2.9 | 9.9 | 93 | 0.25 | 10.8 |
| Ce0.4Mg0.4Ni0.2O1.4 | 57.0 | 9.9 | 9.2 | 36 | 0.15 | 17.0 |
| Ce0.2Mg0.7Ni0.1O1.2 | 37.7 | 25.4 | 9.7 | 23 | 0.10 | 17.7 |
| Mg0.9Ni0.1O | – | 54.1 | 10.2 | 43 | 0.22 | 20.4 |
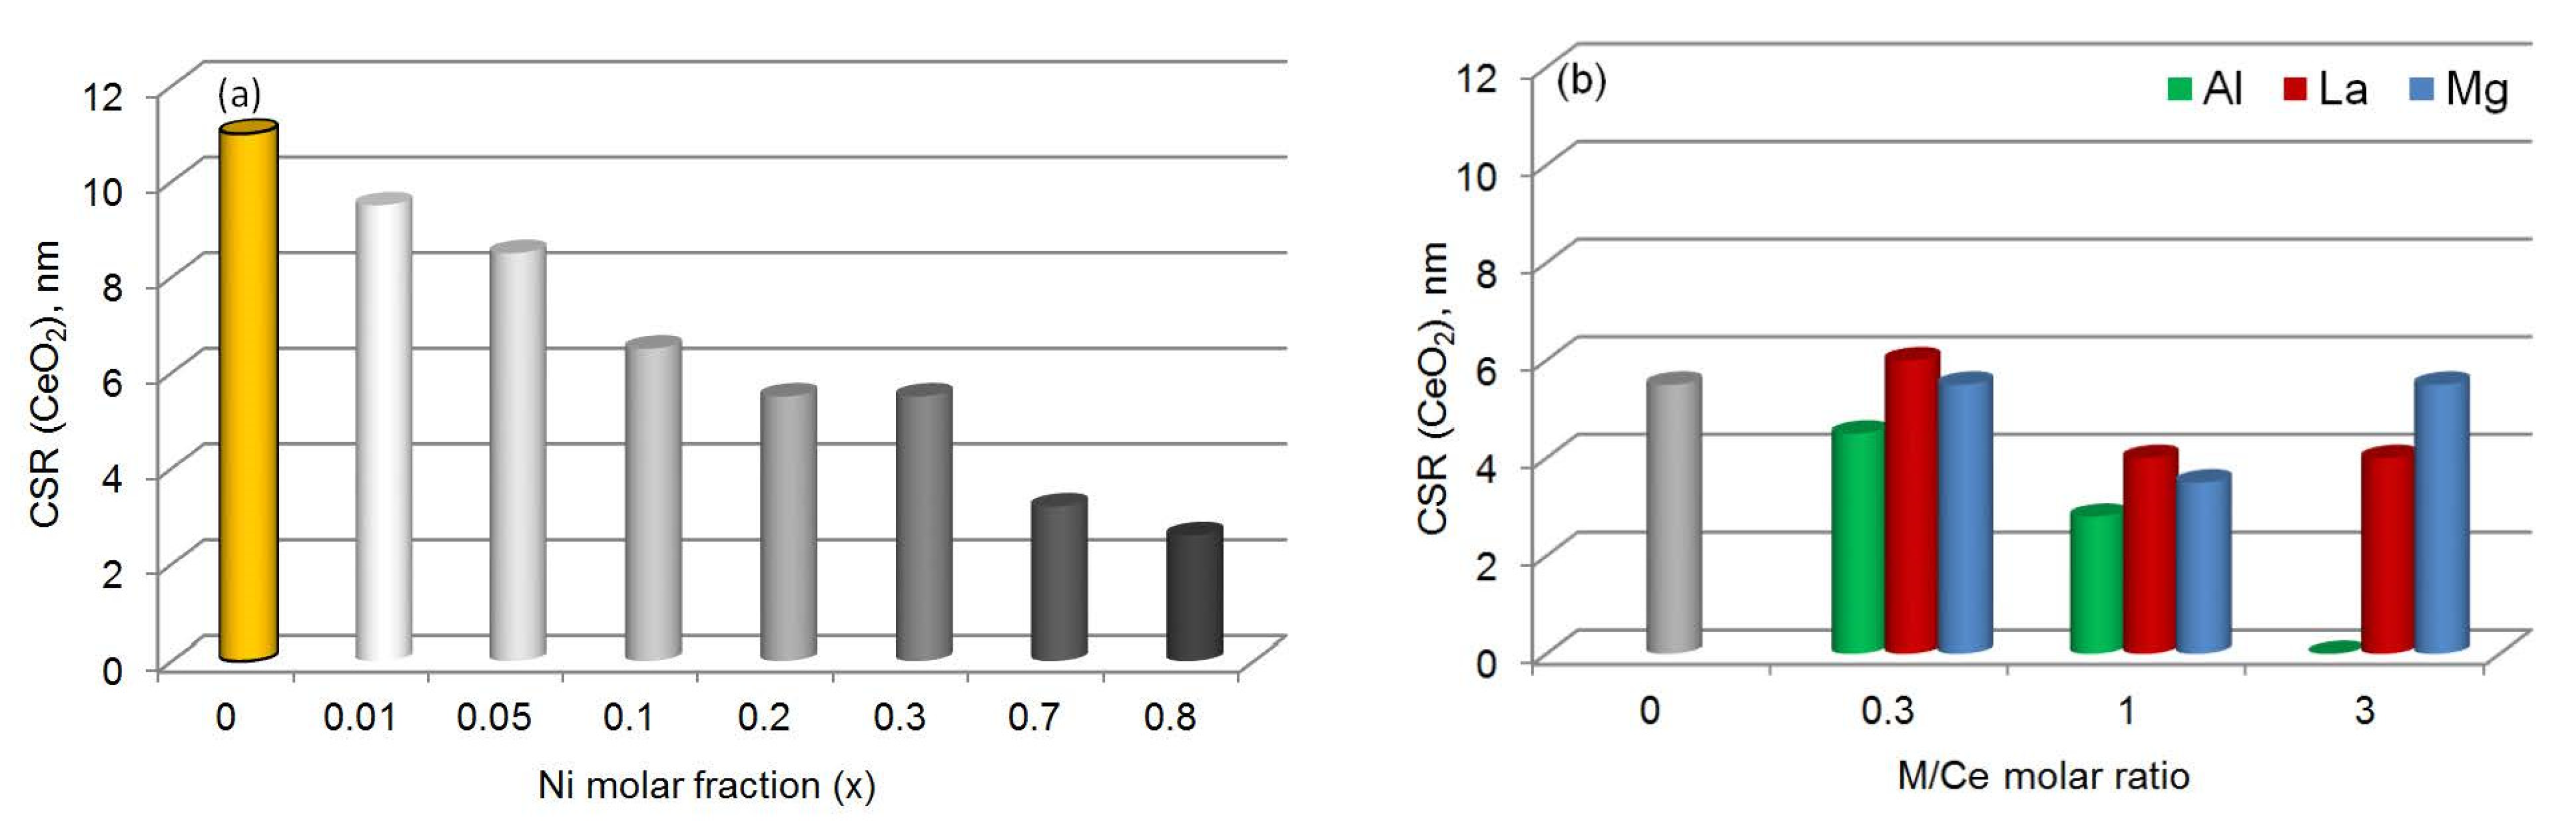
| Sample | XRD Data | Raman Spectroscopy Data | ||
|---|---|---|---|---|
| Phase Composition | a, nm | CSR, nm | I570/I465 | |
| Unmodified CeO2 | ||||
| CeO2 | CeO2 | 0.5412 | 11.0 | 0 |
| Without M | ||||
| Ce0.99Ni0.01O1.99 | CeO2 | 0.5414 | 9.5 | 0 |
| Ce0.95Ni0.05O1.95 | CeO2 | 0.5416 | 8.5 | 0.4 |
| Ce0.9Ni0.1O1.9 | CeO2 | 0.5413 | 6.5 | 0.6 |
| Ce0.8Ni0.2O1.8 | CeO2 | 0.5412 | 5.5 | 1.0 |
| Ce0.7Ni0.3O1.7 | CeO2 | 0.5414 | 5.5 | 1.4 |
| Ce0.3Ni0.7O1.3 | CeO2 NiO | 0.5412 | 3.2 5.0 | 7.4 |
| Ce0.2Ni0.8O1.2 | CeO2 NiO | 0.5405 | 2.6 5.5 | 10.8 |
| M = Al | ||||
| Ce0.6Al0.2Ni0.2O1.7 | CeO2 | 0.5409 | 4.5 | 1.1 |
| Ce0.4Al0.4Ni0.2O1.6 | CeO2 | 0.5412 | 2.8 | 4.0 |
| Ce0.2Al0.7Ni0.1O1.5 | X-ray amorphous phase | – | – | – |
| Al0.9Ni0.1O1.5 | X-ray amorphous phase | – | – | – |
| M = La | ||||
| Ce0.6La0.2Ni0.2O1.7 | CeO2 | 0.5468 | 6.0 | 1.4 |
| Ce0.4La0.4Ni0.2O1.6 | CeO2 | 0.5553 | 4.0 | – |
| Ce0.2La0.6Ni0.2O1.5 | CeO2 | 0.5661 | 4.0 | – |
| La0.8Ni0.2O1.4 | La2O2CO3 | – | – | – |
| M = Mg | ||||
| Ce0.6Mg0.2Ni0.2O1.6 | CeO2 MgO-NiO | 0.5408 0.4182 | 5.5 4.0 | 1.1 |
| Ce0.4Mg0.4Ni0.2O1.4 | CeO2 MgO-NiO | 0.5410 0.4204 | 3.5 3.6 | 0.8 |
| Ce0.2Mg0.7Ni0.1O1.2 | CeO2 MgO-NiO | 0.5414 0.4212 | 5.5 8.5 | 1.4 |
| Mg0.9Ni0.1O | MgO | 0.4222 | 18.0 | – |
| Sample | Textural Characteristics | XRD Data | ||||
|---|---|---|---|---|---|---|
| SBET, m2/g | Vp, cm3/g | Dp, nm | Phase Composition | a, nm | CSR, nm | |
| Unmodified CeO2 | ||||||
| CeO2 | 7 | 0.07 | 39.4 | CeO2 | 0.5414 | 50.0 |
| Without M | ||||||
| Ce0.99Ni0.01O1.99 | 13 | 0.08 | 26.5 | CeO2 | 0.5415 | 50.0 |
| Ce0.95Ni0.05O1.95 | 21 | 0.06 | 11.0 | CeO2 | 0.5419 | 25.0 |
| Ce0.9Ni0.1O1.9 | 21 | 0.08 | 14.7 | CeO2 Ni | 0.5419 | 25.0 8.5 |
| Ce0.8Ni0.2O1.8 | 20 | 0.07 | 15.0 | CeO2 Ni | 0.5419 | 25.0 15.0 |
| Ce0.7Ni0.3O1.7 | 28 | 0.15 | 21.7 | CeO2 Ni | 0.5419 | 50.0 50.0 |
| Ce0.3Ni0.7O1.3 | CeO2 Ni | 0.5426 | 50.0 50.0 | |||
| Ce0.2Ni0.8O1.2 | 4 | 0.05 | 50.0 | CeO2 Ni | 0.5426 | 50.0 50.0 |
| M = Al | ||||||
| Ce0.6Al0.2Ni0.2O1.7 | 23 | 0.14 | 24.8 | CeO2 Ni | 0.5424 | 6.5 6.0 |
| Ce0.4Al0.4Ni0.2O1.6 | 11 | 0.15 | 55.0 | CeAlO3 Ni | 15.0 | |
| Ce0.2Al0.7Ni0.1O1.5 | 10 | 0.04 | 15.8 | X-ray amorphous phase | – | – |
| Al0.9Ni0.1O1.5 | X-ray amorphous phase | – | – | |||
| M = La | ||||||
| Ce0.6La0.2Ni0.2O1.7 | 10 | 0.11 | 44.1 | CeO2 Ni | 0.5490 | 25.0 15.0 |
| Ce0.4La0.4Ni0.2O1.6 | 17 | 0.14 | 32.7 | CeO2 Ni | 0.5600 | 22.0 12.0 |
| Ce0.2La0.6Ni0.2O1.5 | 20 | 0.25 | 50.6 | La(OH)3 | – | – |
| La0.8Ni0.2O1.4 | 29 | 0.23 | 30.9 | La(OH)3 | – | – |
| M = Mg | ||||||
| Ce0.6Mg0.2Ni0.2O1.6 | 12 | 0.16 | 53.1 | CeO2 MgO (traces) Ni | 0.5420 | 50.0 12.0 |
| Ce0.4Mg0.4Ni0.2O1.4 | 12 | 0.10 | 25.8 | CeO2 MgO Ni | 0.5425 0.4222 | 22.0 12.0 12.0 |
| Ce0.2Mg0.7Ni0.1O1.2 | 30 | 0.26 | 34.0 | CeO2 MgO Ni | 0.5417 0.4221 | 12.5 12.5 15.0 |
| Mg0.9Ni0.1O | 51 | 0.33 | 26.6 | MgO | 0.4221 | 19.5 |
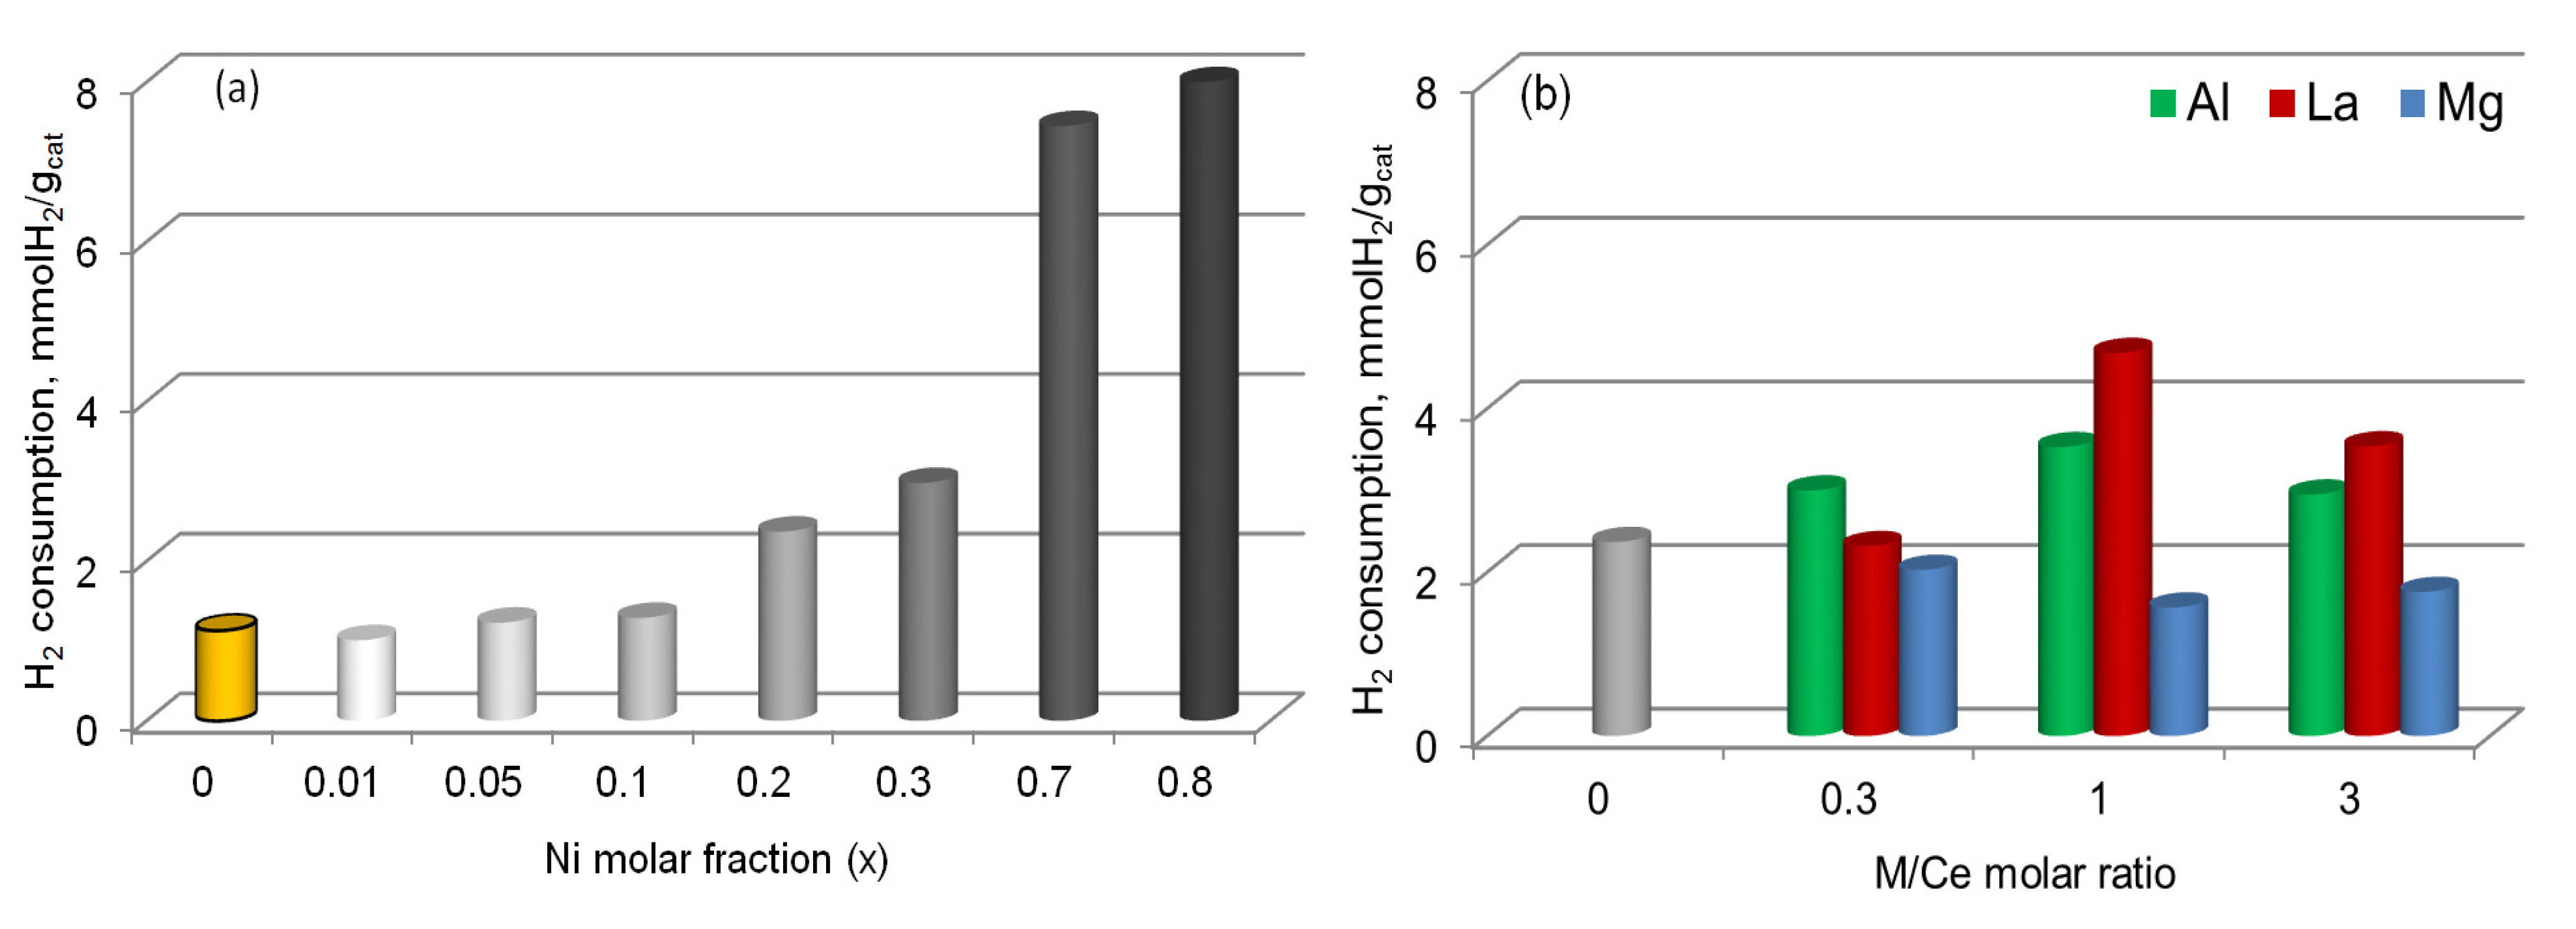
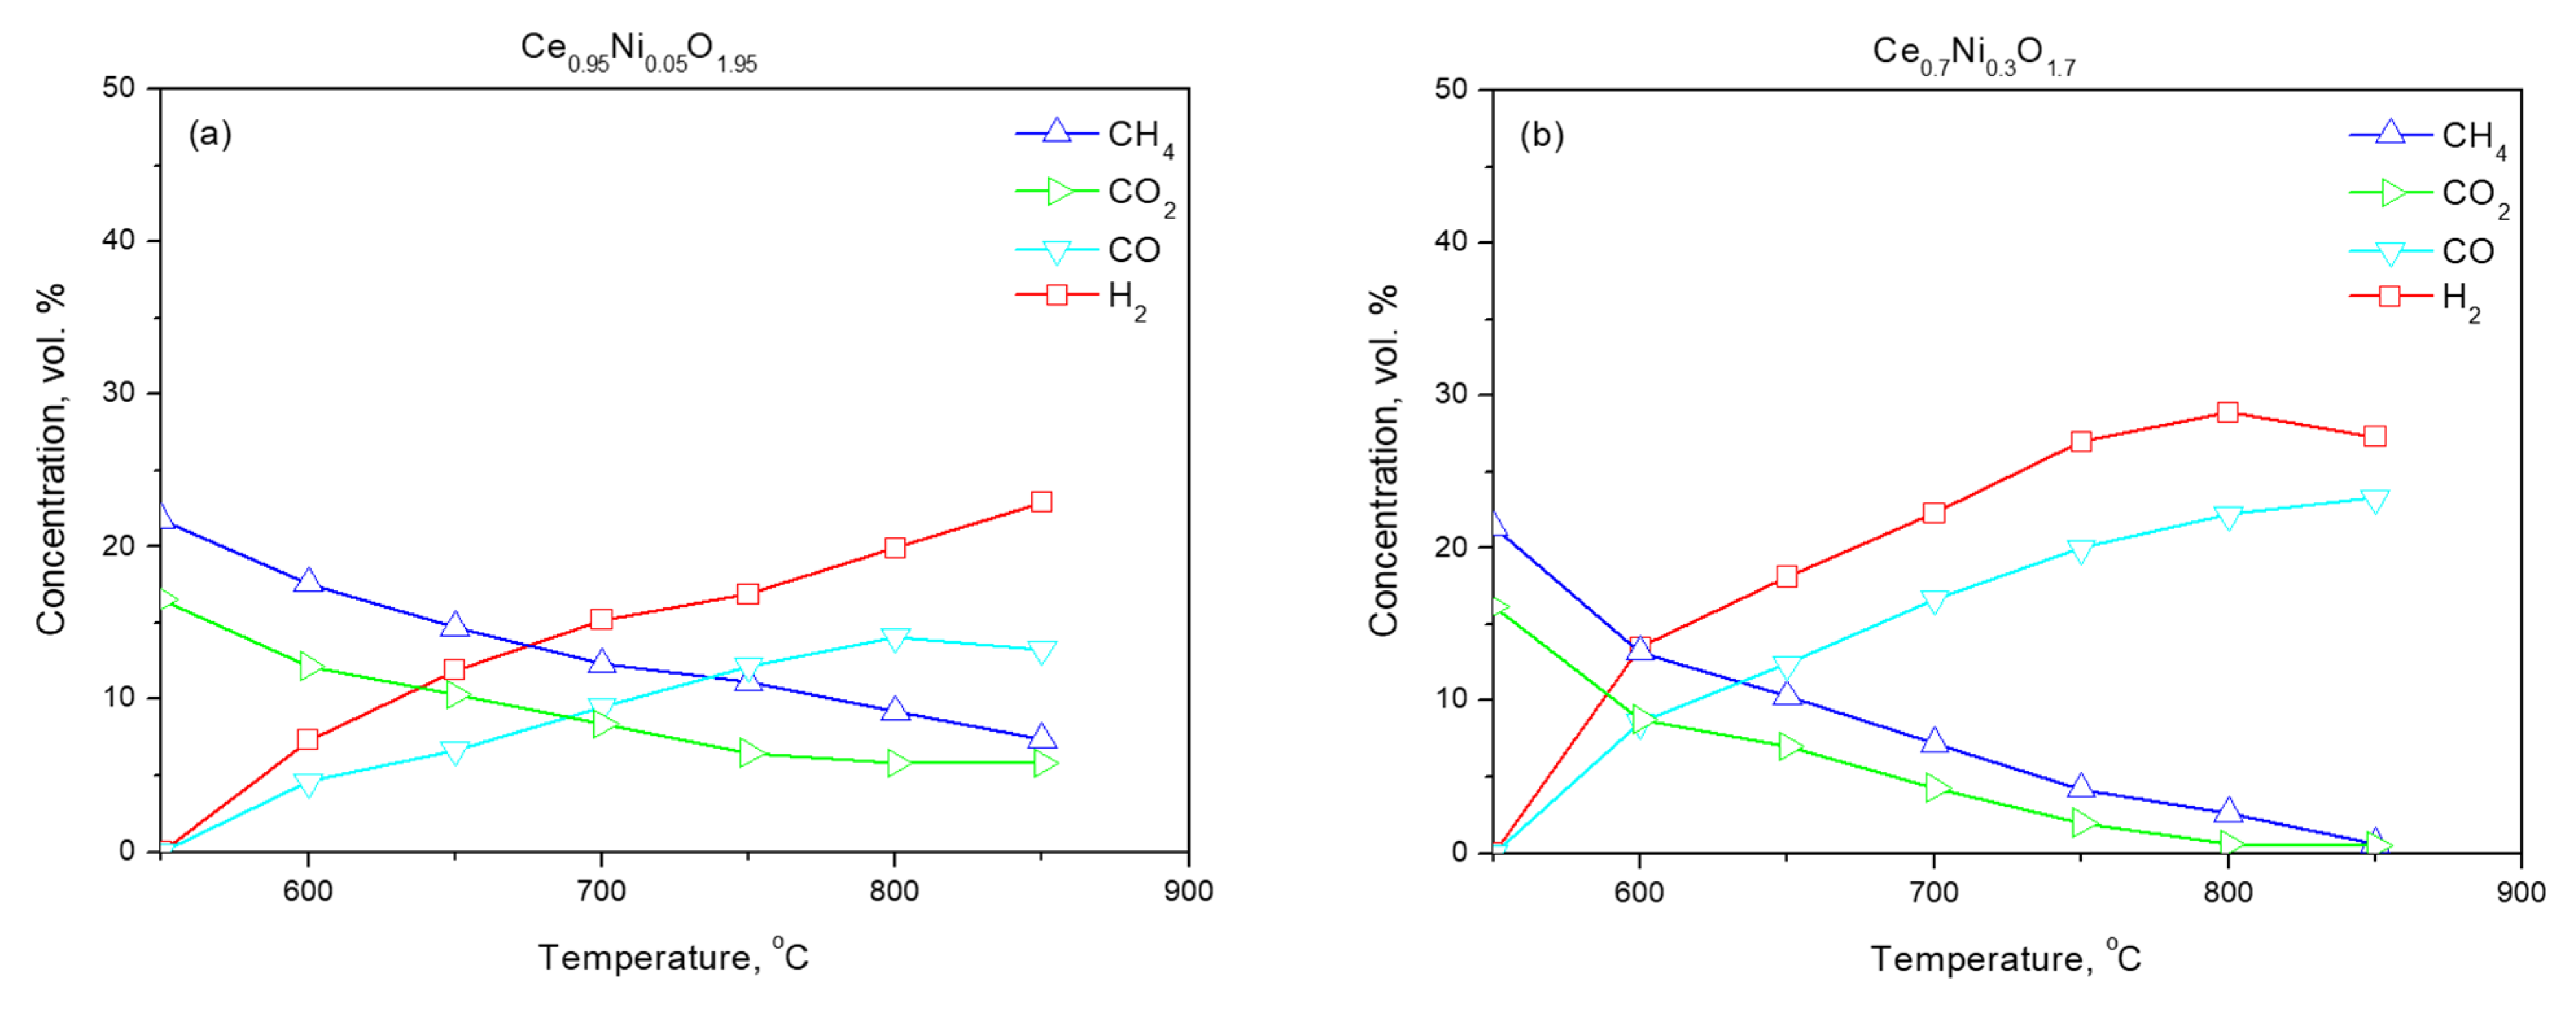
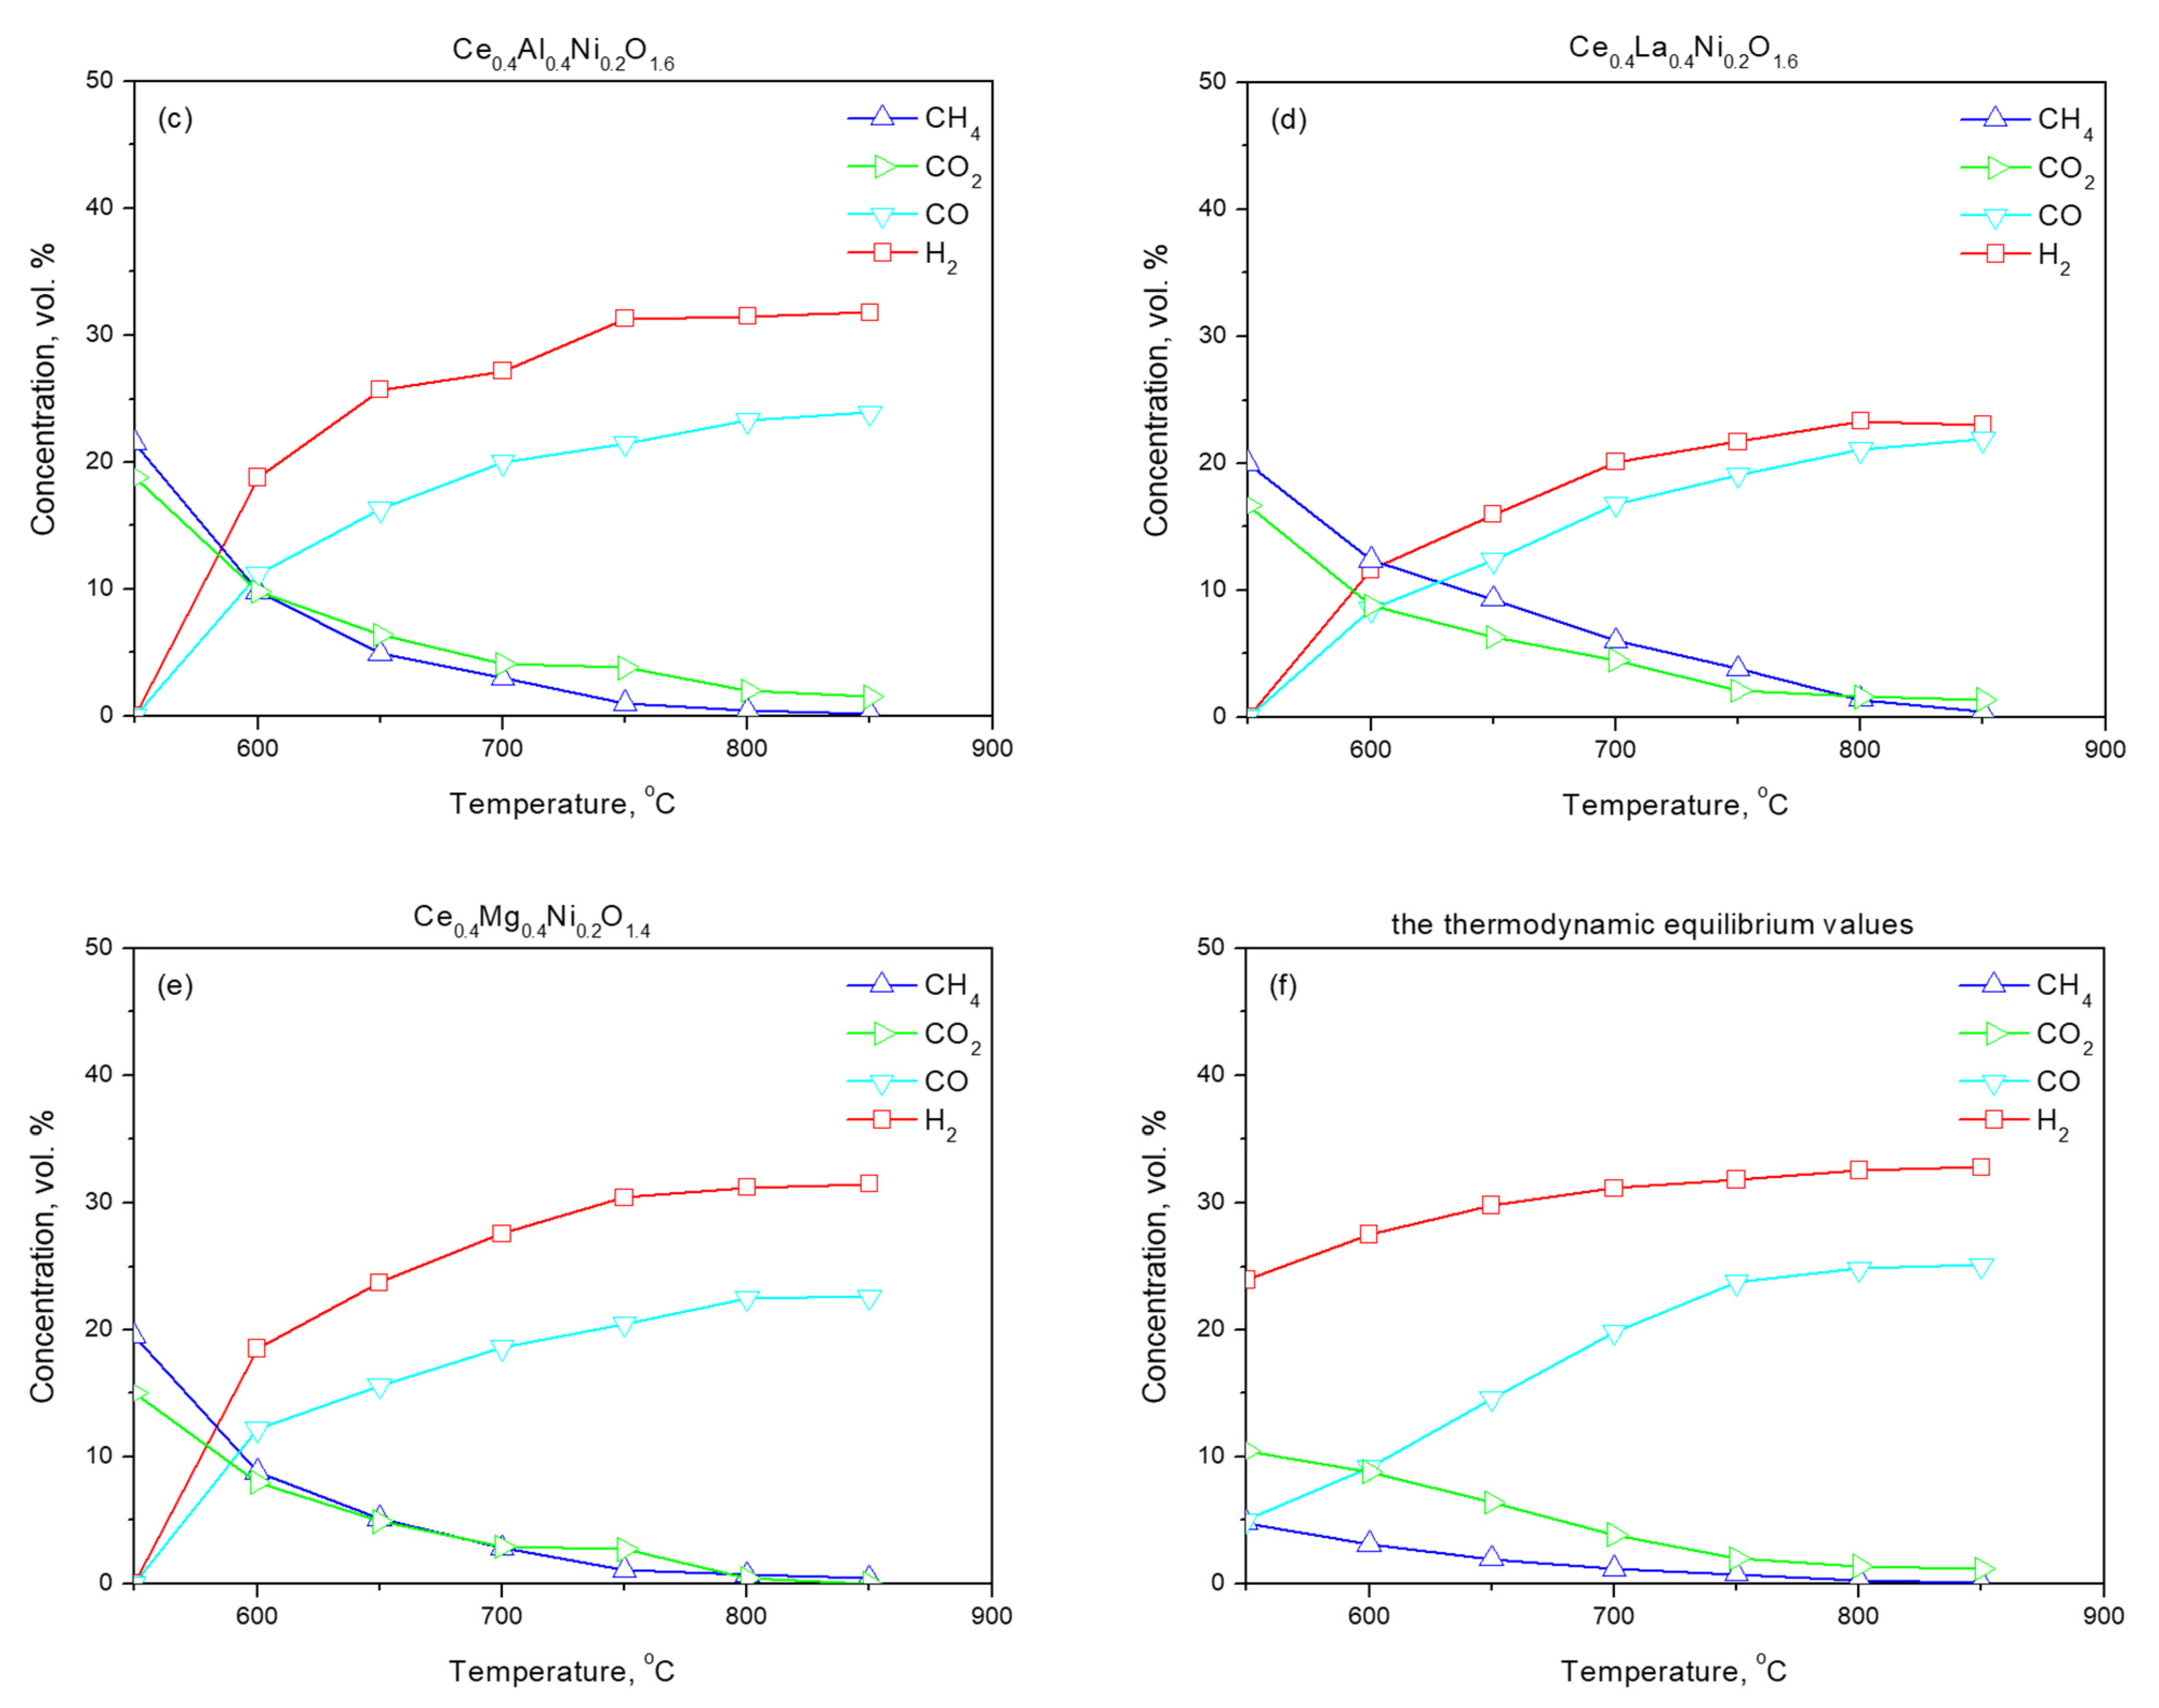
| Sample | Time on Stream, h | XCH4 | XCO2 | YH2 | YCO | H2/CO | Degree of Deactivation *, % | Carbon Accumulation Rate, mgC/gcat·h |
|---|---|---|---|---|---|---|---|---|
| Ce0.95Ni0.05O1.95 | 2 | 31 | 39 | 40 | 37 | 1.5 | 35 | 0 |
| 24 | 19 | 31 | 26 | 25 | 1.4 | |||
| Ce0.9Ni0.1O1.9 | 2 | 62 | 61 | 67 | 60 | 1.4 | 21 | 0 |
| 24 | 48 | 48 | 53 | 49 | 1.5 | |||
| Ce0.8Ni0.2O1.8 | 2 | 79 | 75 | 84 | 79 | 1.5 | 15 | 0 |
| 24 | 67 | 66 | 72 | 67 | 1.5 | |||
| Ce0.7Ni0.3O1.7 | 2 | 74 | 83 | 73 | 78 | 1.3 | 10 | 0.38 |
| 24 | 68 | 67 | 75 | 70 | 1.4 | |||
| Ce0.6Al0.2Ni0.2O1.6 | 2 | 87 | 84 | 99 | 88 | 1.4 | 0 | 0.16 |
| 24 | 93 | 89 | 99 | 91 | 1.4 | |||
| Ce0.6La0.2Ni0.2O1.7 | 2 | 92 | 94 | 92 | 90 | 1.4 | 5 | 0.46 |
| 24 | 96 | 87 | 88 | 89 | 1.4 | |||
| Ce0.4La0.4Ni0.2O1.6 | 2 | 91 | 90 | 91 | 87 | 1.4 | 0 | 1.33 |
| 24 | 94 | 89 | 95 | 88 | 1.5 | |||
| Ce0.2La0.6Ni0.2O1.5 | 2 | 92 | 89 | 83 | 85 | 1.4 | 0 | 1.71 |
| 24 | 92 | 90 | 93 | 88 | 1.5 | |||
| La0.8Ni0.2O1.4 | 2 | 93 | 86 | 99 | 89 | 1.5 | 10 | 3.79 |
| 24 | 95 | 87 | 90 | 91 | 1.5 | |||
| Ce0.6Mg0.2Ni0.2O1.6 | 2 | 90 | 86 | 90 | 87 | 1.4 | 0 | 0.08 |
| 24 | 90 | 85 | 94 | 89 | 1.5 | |||
| Ce0.2Mg0.7Ni0.1O1.2 | 2 | 70 | 74 | 80 | 77 | 1.3 | 0 | 0.21 |
| 24 | 84 | 90 | 86 | 84 | 1.3 | |||
| Mg0.9Ni0.1O | 2 | 89 | 93 | 89 | 92 | 1.3 | 0 | 0.38 |
| 24 | 88 | 89 | 91 | 87 | 1.4 |
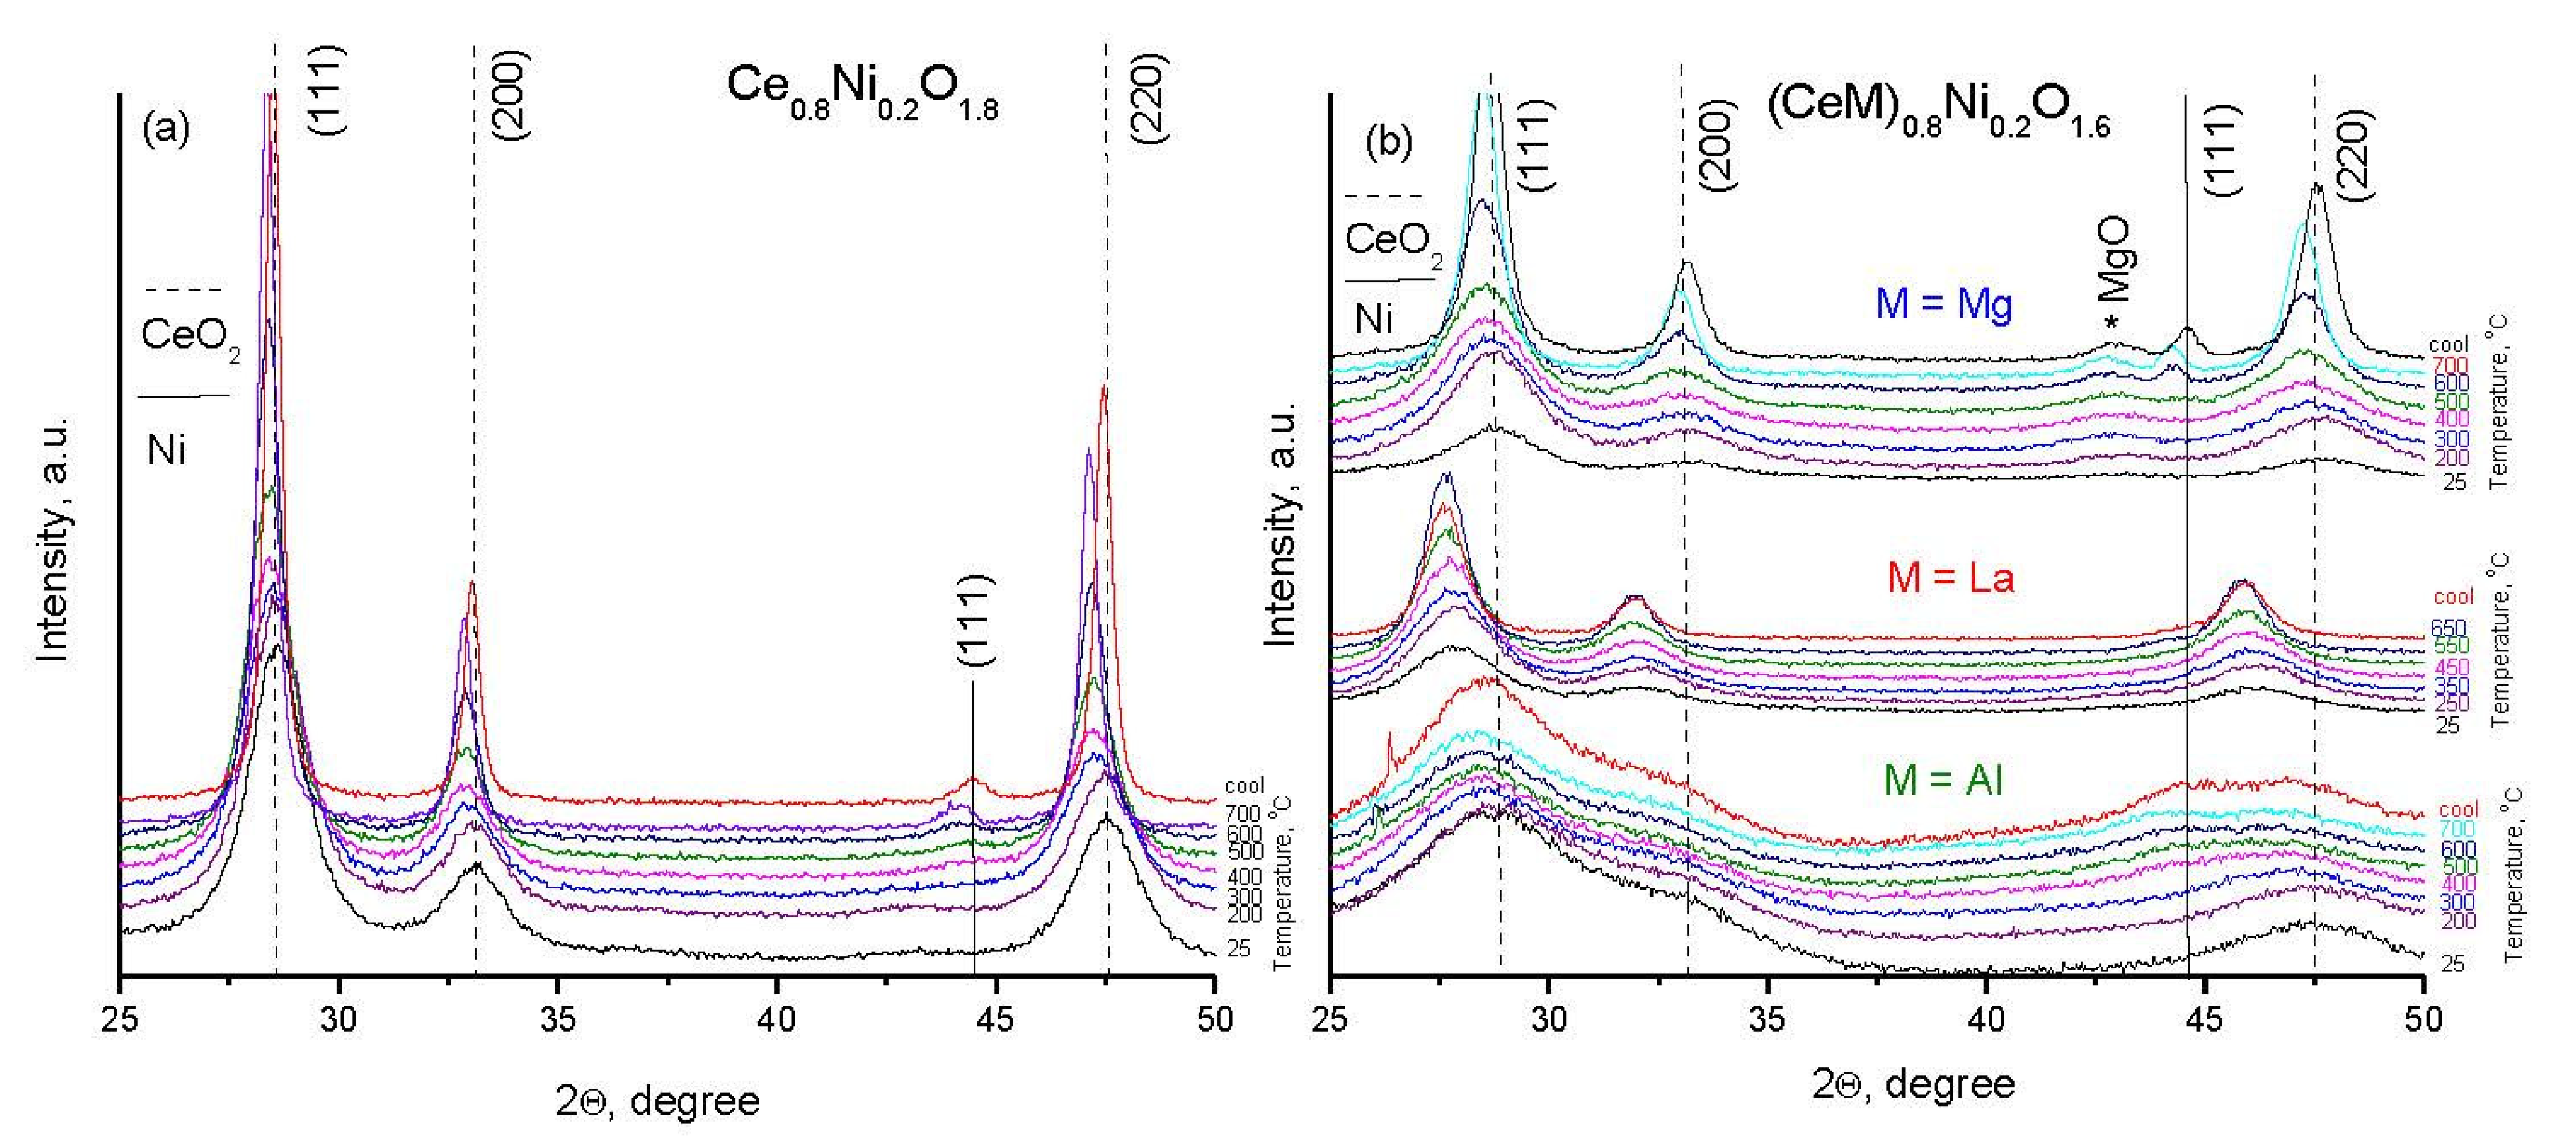
| Sample | Textural Properties | Phase Composition * | ||
|---|---|---|---|---|
| SBET, m2/g | Vp, cm3/g | Dp, nm | ||
| Without M | ||||
| Ce0.95Ni0.05O1.95 | 3 | 0.02 | 29.9 | CeO2 (50 nm, 0.5414 nm) ** Ni (50 nm) |
| Ce0.9Ni0.1O1.9 | 4 | 0.03 | 34.8 | CeO2 (50 nm, 0.5411 nm) Ni (50 nm) |
| Ce0.8Ni0.2O1.8 | 3 | 0.02 | 23.6 | CeO2 (50 nm, 0.5418 nm) Ni (50 nm) |
| Ce0.7Ni0.3O1.7 | 5 | 0.03 | 23.9 | CeO2 (50 nm, 0.5418 nm) Ni (50 nm) |
| M = Al | ||||
| Ce0.6Al0.2Ni0.2O1.7 | 11 | 0.14 | 51.9 | CeO2 (12.0 nm, 0.5415 nm) Ni (25.0 nm) |
| Ce0.4Al0.4Ni0.2O1.6 | 10 | 0.13 | 51.4 | CeAlO3 Ni (21.0 nm) |
| Ce0.2Al0.7Ni0.1O1.5 | 8 | 0.09 | 44.5 | X-ray amorphous phase Ni (8.0 nm) |
| Al0.9Ni0.1O1.5 | 21 | 0.12 | 22.5 | Al-Ni-O (–, 0.8000 nm) Ni |
| M = La | ||||
| Ce0.6La0.2Ni0.2O1.7 | 10 | 0.03 | 11.2 | CeO2 (50 nm, 0.5476 nm) Ni (traces) |
| Ce0.4La0.4Ni0.2O1.6 | 14 | 0.14 | 39.8 | CeO2 (50 nm, 0.5598 nm) Ni (traces) |
| Ce0.2La0.6Ni0.2O1.5 | 13 | 0.06 | 17.5 | La(OH)3 (traces) |
| La0.8Ni0.2O1.4 | 8 | 0.02 | 11.2 | La(OH)3 (traces) Ni (50 nm) |
| M = Mg | ||||
| Ce0.6Mg0.2Ni0.2O1.6 | 10 | 0.07 | 27.7 | CeO2 (25 nm, 0.5415 nm) Ni (25 nm) |
| Ce0.4Mg0.4Ni0.2 O1.4 | 11 | 0.05 | 18.0 | CeO2 (25 nm, 0.5415 nm) Ni (30 nm) MgO (25 nm) |
| Ce0.2Mg0.7Ni0.1O1.2 | 19 | 0.12 | 26.0 | CeO2 (25 nm, 0.5415 nm) Ni (40 nm) MgO (25 nm) |
| Mg0.9Ni0.1O | 23 | 0.17 | 29.7 | Ni (18 nm) MgO |
Publisher’s Note: MDPI stays neutral with regard to jurisdictional claims in published maps and institutional affiliations. |
© 2022 by the authors. Licensee MDPI, Basel, Switzerland. This article is an open access article distributed under the terms and conditions of the Creative Commons Attribution (CC BY) license (https://creativecommons.org/licenses/by/4.0/).
Share and Cite
Matus, E.; Sukhova, O.; Kerzhentsev, M.; Ismagilov, I.; Yashnik, S.; Ushakov, V.; Stonkus, O.; Gerasimov, E.; Nikitin, A.; Bharali, P.; et al. Hydrogen Production through Bi-Reforming of Methane: Improving Ni Catalyst Performance via an Exsolution Approach. Catalysts 2022, 12, 1493. https://doi.org/10.3390/catal12121493
Matus E, Sukhova O, Kerzhentsev M, Ismagilov I, Yashnik S, Ushakov V, Stonkus O, Gerasimov E, Nikitin A, Bharali P, et al. Hydrogen Production through Bi-Reforming of Methane: Improving Ni Catalyst Performance via an Exsolution Approach. Catalysts. 2022; 12(12):1493. https://doi.org/10.3390/catal12121493
Chicago/Turabian StyleMatus, Ekaterina, Olga Sukhova, Mikhail Kerzhentsev, Ilyas Ismagilov, Svetlana Yashnik, Vladimir Ushakov, Olga Stonkus, Evgeny Gerasimov, Andrey Nikitin, Pankaj Bharali, and et al. 2022. "Hydrogen Production through Bi-Reforming of Methane: Improving Ni Catalyst Performance via an Exsolution Approach" Catalysts 12, no. 12: 1493. https://doi.org/10.3390/catal12121493