Article

Biological Hydrogen Production by Dark Fermentation in a Stirred Tank Reactor and Its Correlation with the pH Time Evolution

by
Verónica L. Martínez
1,
Gabriel L. Salierno
2,
Rodrigo E. García
3,
María José Lavorante
1,
Miguel A. Galvagno
4 and
Miryan C. Cassanello
2,*
1
División de Investigación y Desarrollo en Energías Renovables, Instituto de Investigaciones Científicas y Técnicas para la Defensa (CITEDEF), S.J.B. de La Salle 4793, Vicente López, Buenos Aires B1603ALO, Argentina
2
LARSI e ITAPROQ, Dpto. Industrias, FCEyN, Universidad de Buenos Aires-CONICET, Ciudad Universitaria, Buenos Aires C1428BGA, Argentina
3
Dirección de Investigación de la Armada, DIIV, Laprida 555, Vicente López, Buenos Aires B1638AEJ, Argentina
4
Instituto de Micología y Botánica (INMIBO), Universidad de Buenos Aires-CONICET, Pabellon 2, Ciudad Universitaria, Buenos Aires C1428BGA, Argentina
*
Author to whom correspondence should be addressed.
Catalysts 2022, 12(11), 1366; https://doi.org/10.3390/catal12111366
Submission received: 8 October 2022 / Revised: 26 October 2022 / Accepted: 31 October 2022 / Published: 4 November 2022

Abstract

:
Dark fermentation is a hydrogen generating process carried out by anaerobic spore-forming bacteria that metabolize carbon sources producing gas and short-chain acids. The process can be controlled, and the hydrogen harvested if bacteria are grown in a reactor with favorable conditions. In this work, bacteria selected from natural sources were grown with a defined culture media, while pH was monitored, with the aim of relating the amount of generated hydrogen to the increase in hydron ion concentration. Therefore, a model based on the acid-base species mass balance is proposed and solved to estimate the lag phase time and measure the hydrogen production efficiency and kinetics. Hydrogen production in a stirred batch reactor was performed for 150–200 h, at given operating conditions using a previously defined growth media, to validate the model. Using the proposed model, the cumulated moles of produced hydrogen correlate well with those predicted from the pH curve. Hence, the modified Gompertz model parameters, largely used for describing the hydrogen generation kinetics by dark fermentation, were estimated from the pH curve and from the experimentally measured generated hydrogen. Satisfactory agreement was found, thus, validating the method.

1. Introduction

The energy matrix is of deep concern to humanity. Modern life has become energy intensive [1], and energy problems are very disruptive in our society [2]. We depend on energy for transportation, food production, goods manufacturing, communications, heating, cooling, and entertainment [3]. The most common energy sources we use today are fossil fuels, which are non-renewable. Oil will slowly become scarce and increasingly expensive before running out. Another downside of using fossil fuels is that they are the most important source of humanity-driven climate change [4,5]. Additionally, because oil reserves are localized in a few countries, their availability is centralized and is often the source of international conflicts [6]. Hence, alternative energy sources to fossil fuels are becoming increasingly important. Sustainable fuels play a particularly important role in this scenario since the transition into a sustainable economy should also mean energy security. The research community has, thus, strongly devoted itself to developing alternative energy from renewable sources. The transition to more sustainable and carbon-free energy sources has brought hydrogen into the spotlight, as a clean energy vector. It is one of the candidates for diversifying the energy matrix due to its high energy yield and clean emissions. Then, hydrogen production processes are extensively investigated, particularly using renewable resources [7,8]. A clean and sustainable way of producing hydrogen is from biomass.
Biomass refers to all masses of living organisms, such as bacteria, fungi, plants, animals, or their remains [9]. Therefore, biomass can be transformed and absorbed by the Earth’s ecosystems as part of the carbon cycle. Energy derived from biomass can then be considered sustainable [10]. Hydrogen can be produced from biomass using natural bacterial communities. The bioprocess by which anaerobic bacteria ferment carbohydrates releasing H2 is called dark fermentation. This process can be carried out in rather simple fermentation tanks and potentially works with direct carbon sources, such as fermentable sugars, but also degrading second-generation biomass from crops or animal residues from livestock, among others [11]. Hydrogen-producing bacteria can be collected from several natural sources. In a previous contribution, the authors reported evidence on the feasibility of using bacterial communities from different sources [12,13]. The one extracted directly from a wastewater treatment plant on board a navy ship was selected, considering the convenience of in situ production for ship maintenance. Before its usage, the source was submitted to a heat pre-treatment to eliminate hydrogen trophic bacteria and retain the producers, which were mainly Clostridium sp. spore-forming bacteria [14,15].
The conditions inside the bioreactor require an optimized media to promote bacterial growth, since hydrogen is a byproduct of their metabolism, along with carbon dioxide. The gas mixture can be easily collected and used as a green energy vector. Although it can be stored, in situ consumption for feeding an onboard proton exchange membrane (PEM) fuel cell is an attractive alternative [16]. Moreover, it can also be devised for being used in hydrogenation processes, if any is carried out on board.
Dark fermentation is a stage in the natural degradation of organic material, which usually ends up in methane and carbon dioxide, which are greenhouse gases [17]. However, by eliminating the non-hydrogen-producing bacteria through a pre-treatment, it is possible to produce hydrogen with high efficiency, mixed only with carbon dioxide [15,18]. The gas mixture produced, which contains only hydrogen and carbon dioxide in a ratio of around 2:1, is very convenient for a PEM fuel cell operation, with almost no need for a downstream purification step. Moreover, the gas has no carbon monoxide, as in gas reforming, which poisons PEM fuel cells electrocatalysts [19].
The amount of gas produced is less than in a methanogenic fermentation because the carbon atoms that would form methane and carbon dioxide mostly become short-chain carboxylic acids in the effluent. Mainly, acetic and butyric acids are formed [20,21]. Therefore, the dark fermentation of selected hydrogen-producing bacteria strongly modifies the acidity of the cultivation media [22,23,24]. As the pH lowers and the acid concentration increases in the culture media, hydrogen production starts slowing down, showing pH has an inhibitory effect [11,25]. The pH and the developed hydrogen is, thus, strongly linked, and controlling pH has been proposed to improve hydrogen generation [24,26,27,28]. Although there are works focusing on the influence of pH, a quantitative relationship between pH variation and hydrogen generation that allows obtaining kinetic information on H2 production has not been proposed. The pH curve can be readily measured with an appropriate sensor and monitored during the whole fermentation. Therefore, this work aims at exploiting the information provided by the pH curve to infer the hydrogen production efficiency and kinetics.

2. Results and Discussion

2.1. Hydrogen Measure and Production

Typical results of the moles of produced hydrogen superimposed on the evolution of the pH in the reactor as a function of time are shown in Figure 1. The generated hydrogen is expressed as the number of moles divided by the time during which the gas was collected. As observed, the largest hydrogen production is associated with a sharp decrease in pH, in agreement with the generally accepted mechanism that suggests simultaneous production of short-chain acids. Acetic and butyric acids have been found during dark fermentation of different starting materials when Clostridium species are dominant, as in this case [14].

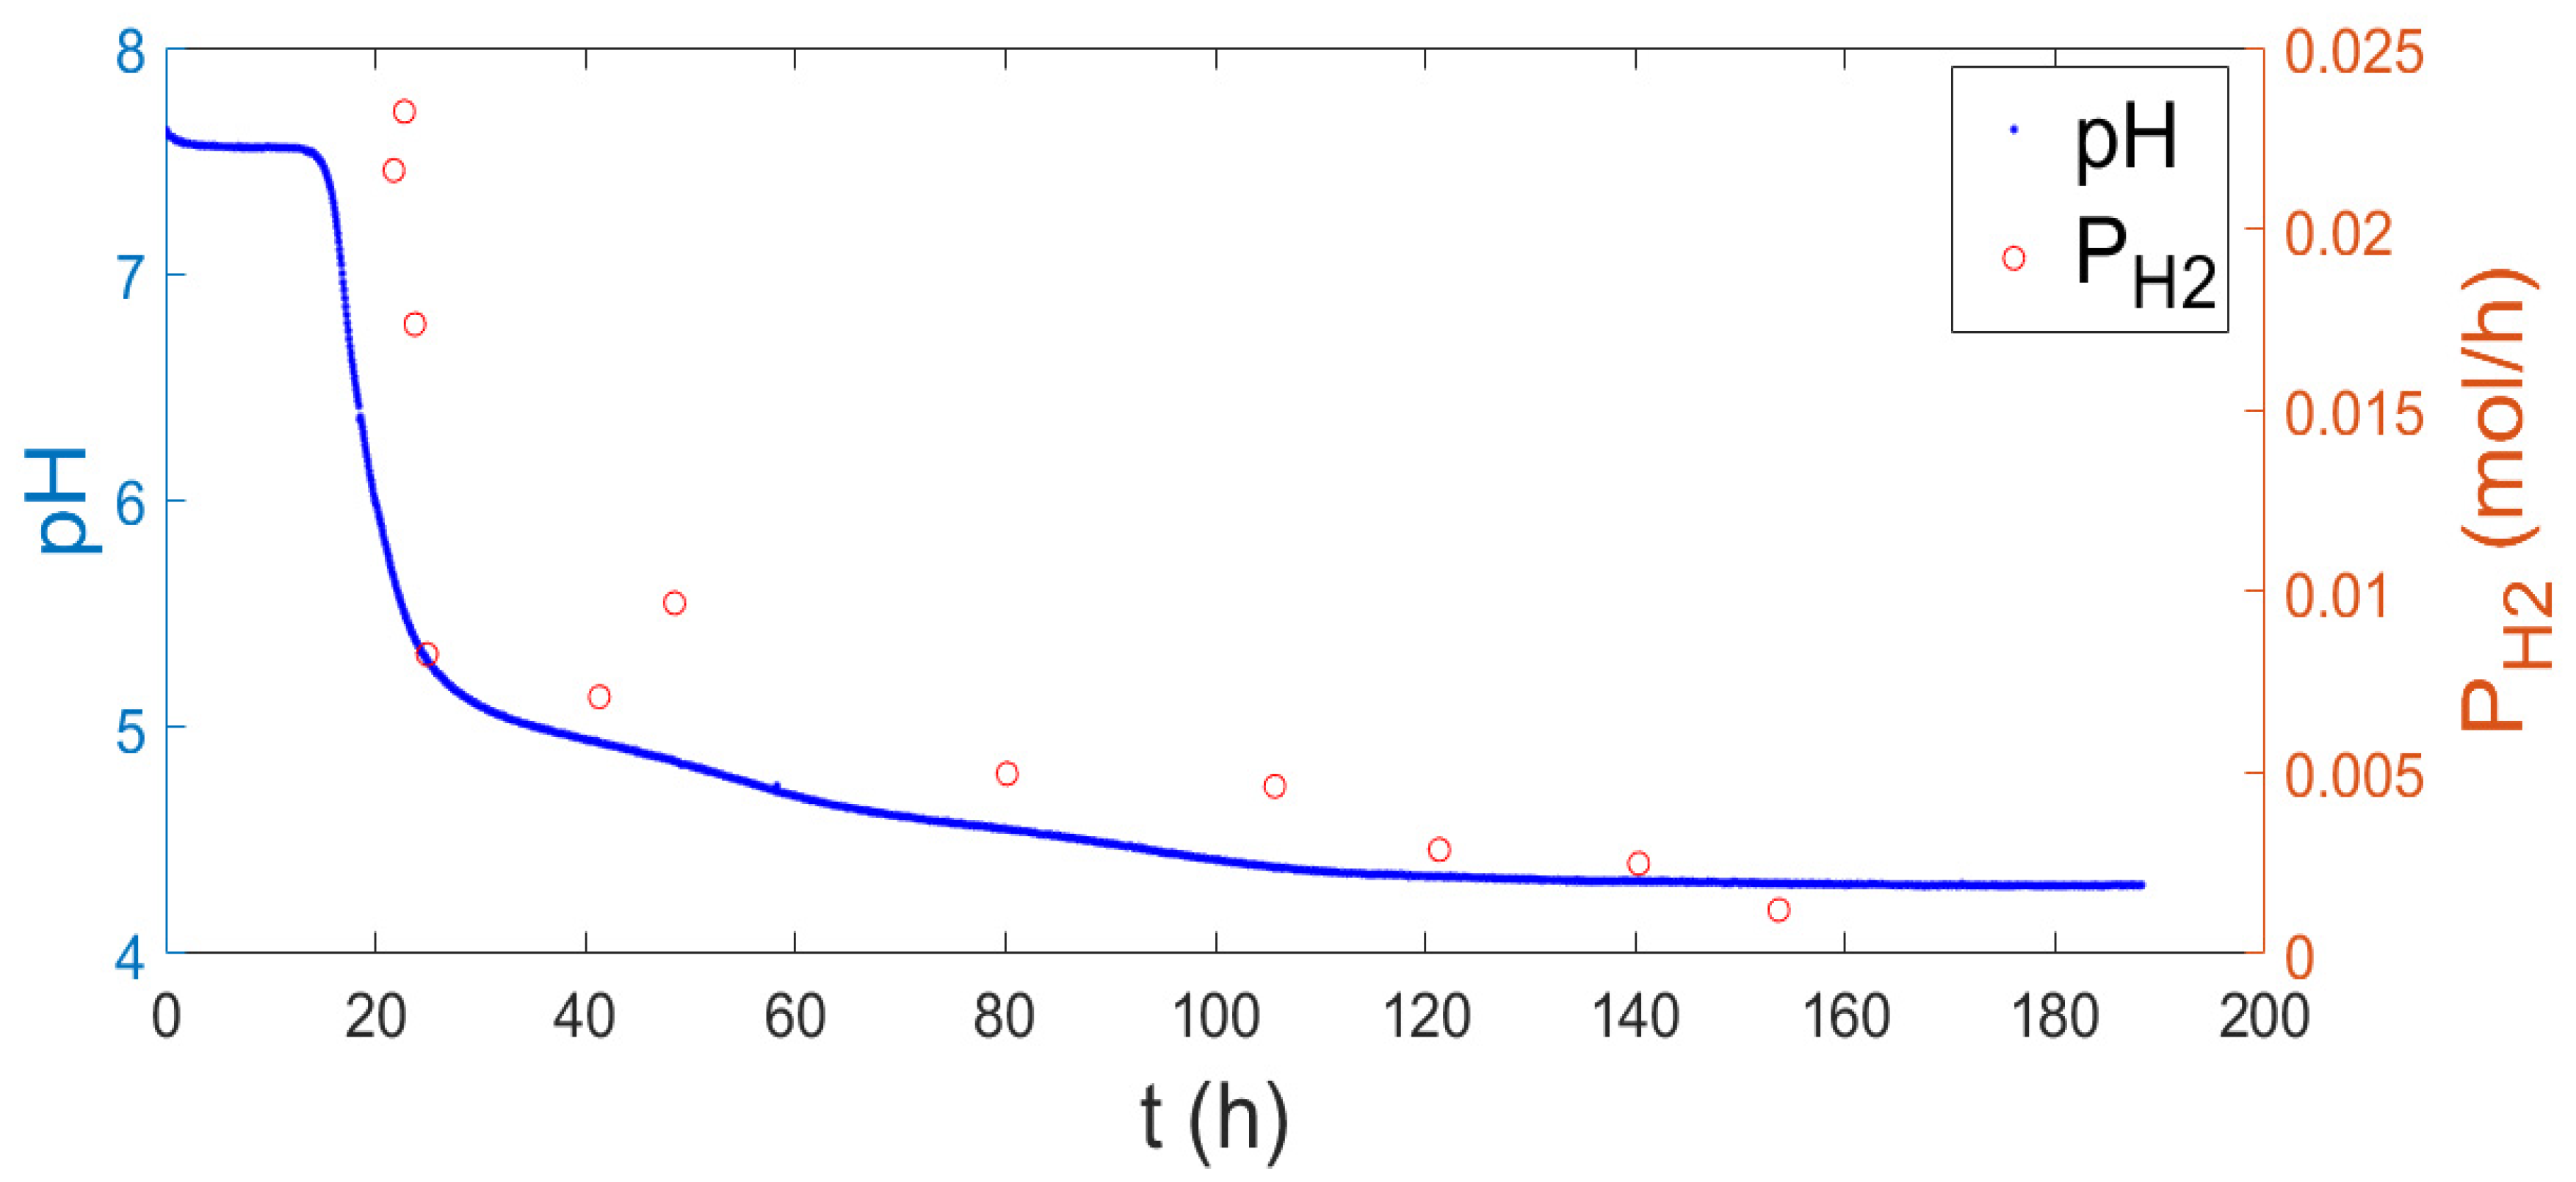
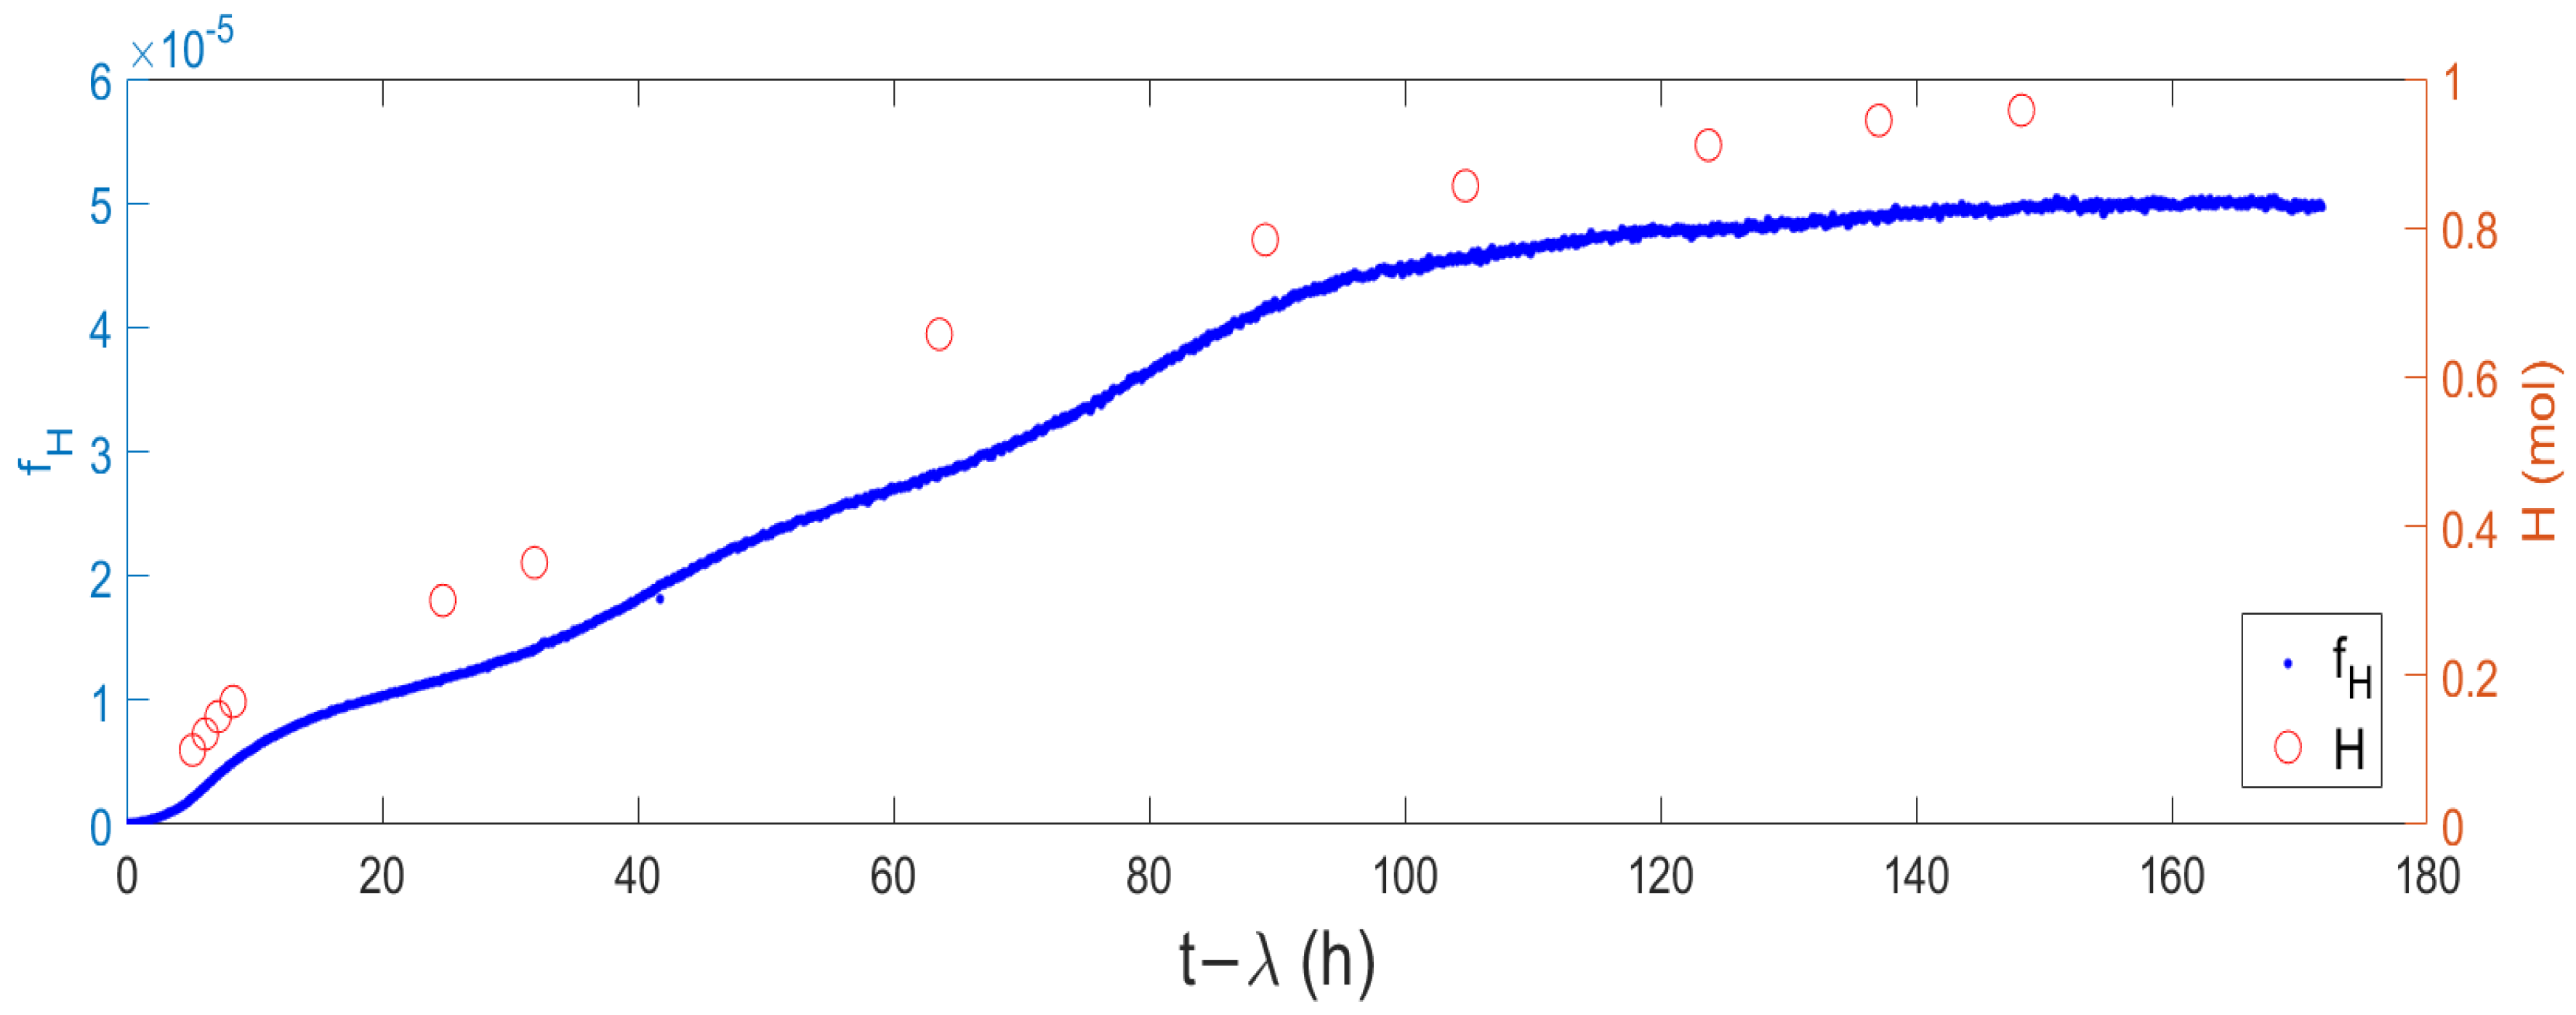
2.2. Relation between the Evolved Hydrogen and the pH Curve

In this section, a model oriented to explain the relationship between the observed production of H2 as a function of the pH evolution over time is developed and resolved. Considering the simplified acetogenic reaction path [20,29], Equation (1) indicates that the evolution of hydrogen is linked to the formation of acid species. According to Equation (1), as hydrogen is generated, acetic acid and carbon dioxide are produced. Although other acids can be formed, leading to a lower ratio of hydrogen to acid per gram of substrate, we assume this route in the analysis to be representative. If other routes are apparent, they will be reflected in a lower estimated efficiency.
Substrate + H 2 O 2 AcOH + 2 CO 2 + 4 H 2

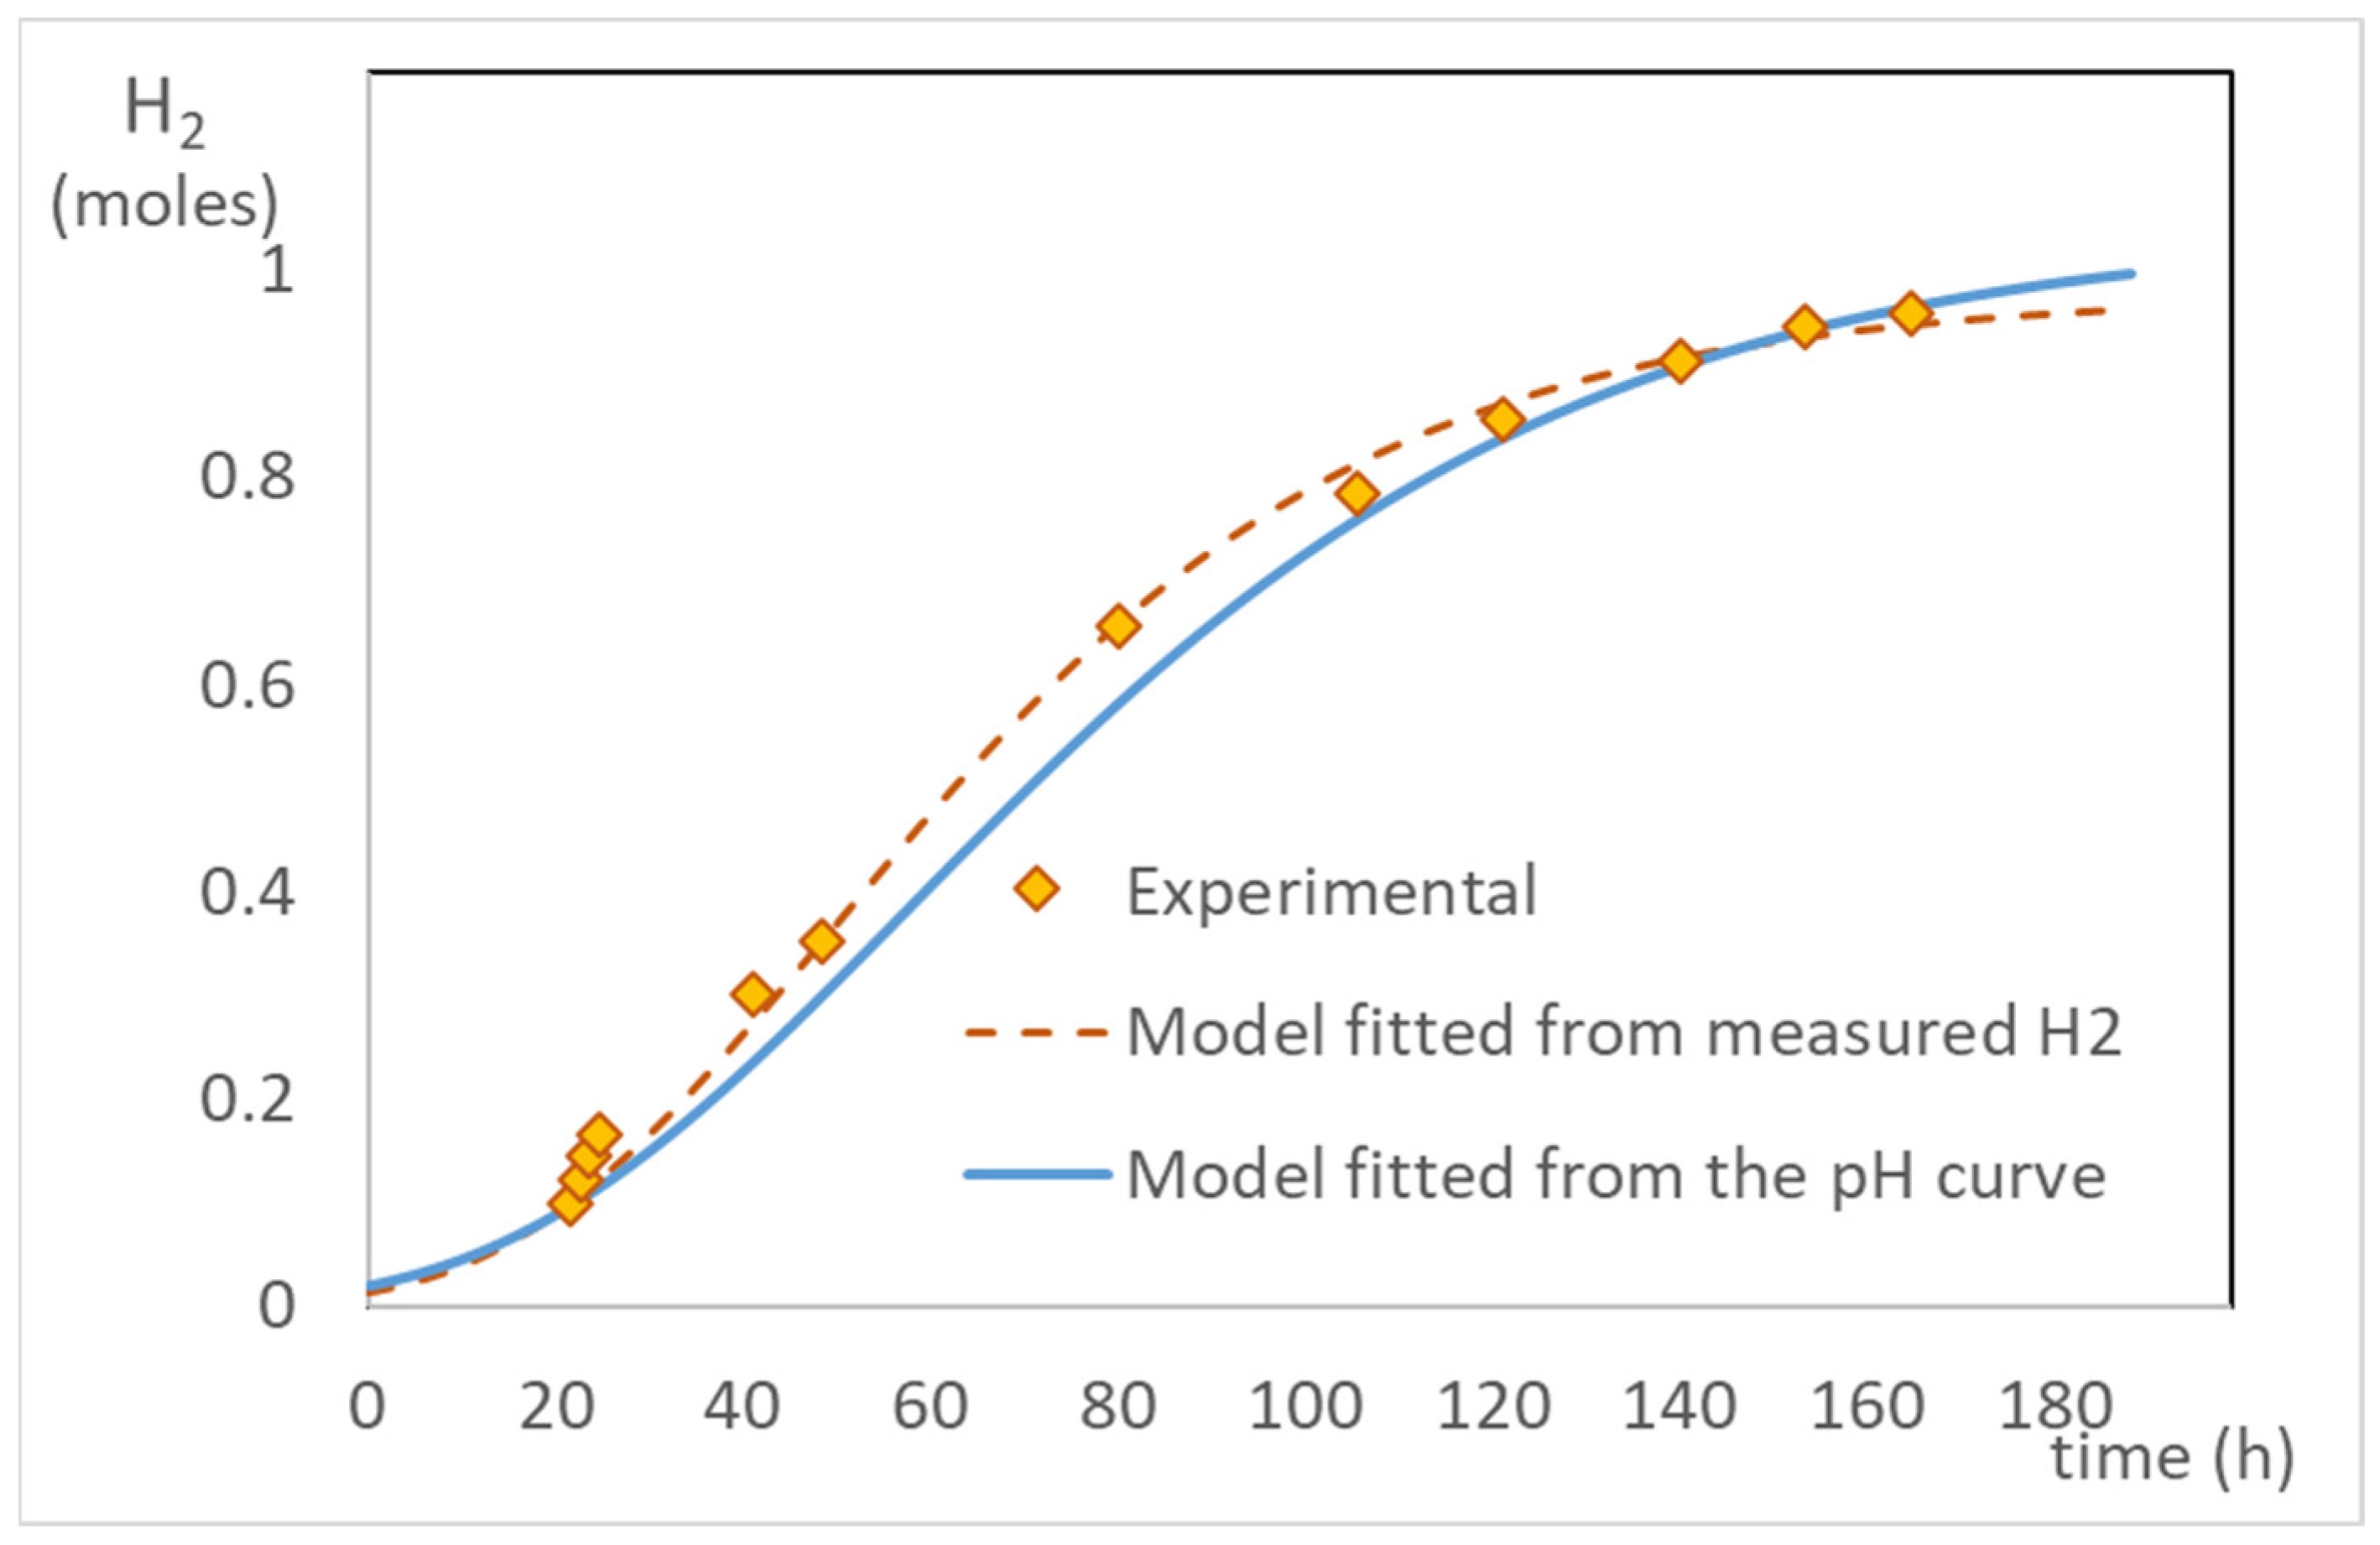
2.3. Correlation between pH Evolution and Hydrogen Production

The monitored pH curve shows an initial period of constant value, corresponding to the lag phase of the microorganism culture. Then, the culture activity starts with an abrupt change in pH towards acidic conditions until several buffer stages are reached. The buffer stages are likely due to the action of phosphate, dicarboxylic acids, and by the mixture of saturated carboxylic acids, dominated by acetate (pKa = 4.75) from the media.
Considering a generic situation where m weak bases ( W b n ) are used as alkalizing agents, and that the generation of acetic acid and carbon dioxide are linked to hydrogen generation, the mass balance given by Equation (2) is proposed to describe the change in the observed molar concentration of protons, [ H +   ] obs , in the media. Since the formed acids are generally weak acids, they will remain partially dissociated. Variation of the molar proton concentration would depend on the generated acetic acid and on the dissociation constant and will be linked to the variation in acetate concentration. The generated carbon dioxide is supposed to be totally released to the gaseous phase together with hydrogen. Additionally, for pH < 7, carbonic acid is hardly dissociated.
Δ [ H + ] obs = Δ [ AcO ] i = 1 m Δ [ HW b i 1 n ] 2 Δ n H 2 gen V R + 2 Δ n H 2 cons V R
The generation and consumption of molecular hydrogen are assumed to take place, mediated by biochemical or abiotic means, through the reaction given by Equation (3).
2 H + + 2 e H 2
It is also assumed that the entire change in acetic acid concentration and acid-base carbon dioxide species are generated by dark fermentation and stoichiometrically linked to hydrogen generation, as expressed in Equation (4).
Δ [ AcOH ] = Δ [ CO 2 ] = Δ n H 2 gen 2 V R = P H 2 Δ t 2 V R
where P H 2 is the production of hydrogen due to dark fermentation. Since in the culture medium there is hydrogen degradation activity, it is proposed that:
Δ n H 2 gen Δ n H 2 cons = η P H 2 Δ t
where η is the net efficiency of molecular hydrogen production. Given that adenosyl phosphates are produced and consumed by biological activity, it is reasonable to consider that the concentration of inorganic phosphates present in the medium is constant regardless of whether they are located within or outside the cells. In addition, since the pH of the time series, shown in Figure 1, is between 8 and 5, the dominant phosphate acid-base balance is its second protonation (Equation (6)):
[ Phos ] o = [ H . PO 4 2 ] + [ H 2 PO 4 ] [ H . P . O 4 2 ] [ H 2 PO 4 ] = 10 pKa 2 + pH = K a 2 [ H + ] = > [ H 2 PO 4 ] = [ Phos ] o ( 1 + K a 2 [ H + ] )
Analogously, for the remaining acid-base species present in the culture, { Wb i } , a simplified ionic balance (Equation (7)) can be performed considering a dominant acid-base couple in the case of polyprotic species:
[ Wb i ] o = [ Wb i n i ] + [ HWb i 1 n i ] [ Wb i n i ] [ HWb i 1 n i ] = 10 pKa i + pH = K ai [ H + ] = > [ HWb i 1 n i ] = [ Wb i ] o ( 1 + K ai [ H + ] )
The variation in acetate concentration is linked to the amount of acetic acid produced, through the acetic acid constant. Acetic acid will partially dissociate, generating acetate. Although there is acetate in the medium, which would regulate the dissociation degree, Equation (1), in this case, is representative of any of the short chain carboxylic acids formed. Hence, we assume a variation of acetate concentration as the one expected in pure water and that the dissociation constant of acetic acid, K AcOH , represents a lumped constant for other weak acids formed, since they are generally in the same order (~10−5 M) [24]. The variation in acetate concentration is proposed to be approximately related to the produced acetic acid through Equation (8).
Δ [ AcO ] 1 2   ( K AcOH ) ½ Δ [ AcOH ]
By conveniently replacing each term of the balance given in Equation (2) as a function of the proton concentration and hydrogen production, Equation (9) is obtained.
Δ [ H + ] obs = K AcOH ½ P H 2 Δ t 4 V R Δ { [ Phos ] o ( 1 + K a 2 [ H + ] obs ) + i = 1 m [ Wb i ] o ( 1 + K ai [ H + ] obs ) } 2 η P H 2 V R Δ t
where m is the number of acid-base equilibria other than acetate, carbonate, and phosphate. Rearranging Equation (9) and at the limit when Δt→0:
t { [ Phos ] o ( 1 + K a 2 [ H + ] obs ) + i = 1 m [ Wb i ] o ( 1 + K ai [ H + ] obs ) } = { [ Phos ] o K a 2 ( K a 2 + [ H + ] obs ) 2 + i = 1 m [ Wb i ] o K ai ( K ai + [ H + ] obs ) 2 } [ H + ] obs t
[ H + ] obs t = ( 1 4 K AcOH ½ 2 η ) P H 2 V R { [ Phos ] o K a 2 ( K a 2 + [ H + ] obs ) 2 + i = 1 m [ Wb i ] o K ai ( K ai + [ H + ] obs ) 2 } [ H + ] obs t
{ 1 + [ Phos ] o K a 2 ( K a 2 + [ H + ] obs ) 2 + i = 1 m [ Wb i ] o K ai ( K ai + [ H + ] obs ) 2 } · [ H + ] obs t = ( 1 4 K AcOH ½ 2 η ) P H 2 V R
Numerically integrating Equation (12) over time in the observed pH range, where the major acid-base equilibrium is the one of phosphate, the following expression is approximately valid:
λ t f { 1 + [ Phos ] o K a 2 ( K a 2 + [ H + ] obs ) 2 } · Δ [ H + ] obs Δ t Δ t = λ t f ( 1 4 K AcOH ½ 2 η ) P H 2 V R d t = ( 1 4 K AcOH ½ 2 η ) V R H
where λ is the lag phase time and H is the molar cumulative hydrogen production; the left-hand side of Equation (13) indicates the numerical integration. Aimed at facilitating notation, the function f H is defined and indicates the numerical integral when Δt→0.
f H = λ t f { 1 + [ Phos ] o K a 2 ( K a 2 + [ H + ] obs ) 2 } · Δ [ H + ] obs Δ t Δ t Δ t 0 { 1 + [ Phos ] o ( 1 + K a 2 / [ H + ] obs ) } [ H + ] obs
f H can be obtained entirely from the bulk pH time series. Since the pH sampling period used is exceedingly small, compared with the characteristic time of the dark fermentation, the numerical cumulative sum can approximate the integral, thus, simplifying the calculation of the f H function. The value obtained for f H is close to the proton concentration, [ H + ] obs , since the correction factor is close to 1.
Statistical analysis of the experimental results and the developed models were implemented in MATLAB R2021b (The MathWorks Inc., Natick, MA, USA).

2.4. Lag Time Calculation

The lag time can be estimated directly from the pH curve. It is observed that during an initial period, the pH presents a constant value, corresponding to the lag phase of the microorganism culture. Then, the intersection between a forward extrapolation of the initial pH with the back extrapolation of a function describing the pH decay would be a robust estimator of the lag phase time, λ. The culture activity starts with an abrupt change in pH towards acidic conditions until several buffer stages are reached, by a mixture of species and saturated carboxylic acids, dominated by the acetate (pKa = 4.75) from the media. To find the lag phase time, we make an exponential adjustment (Figure 2) of the pH curve between 7.2 and 5.4. The time obtained from the exponential curve fit intersection with the pH at the lag phase is an unbiased measure of lag phase time. This direct adjustment can give an accurate estimation directly from experimental information without the need of assuming any kinetic model.

2.5. A Measure of Hydrogen Production Efficiency

Taking the results shown in Figure 1 and representing the measured cumulated moles of produced hydrogen in the same figure, superimposed with the time evolution of the function f H , described in Equation (14), a correlation between the two variables is evidenced (Figure 3). Even if the scales do not match, the trends are remarkably similar, indicating a strong relation despite the scale factor. Therefore, we propose to level scales through an estimated efficiency obtained by fitting Equation (13).
Figure 4 illustrates the goodness of fit of a linear model relating the f H function and the cumulated moles of produced hydrogen. Hence, we postulate that the coefficient η of Equation (13) obtained by comparing the experimental hydrogen production to the synchronic values of the f H function would provide a reasonable estimate of the process relative efficiency. Knowing the effective volume of the reactor, 5000 mL, and converting the hydrogen production from volumetric to molar, η can be obtained (Figure 4) from the linear fit parameters, forcing the ordinate at the origin to cross zero, as expressed in Equation (13).
Table 1 lists the calculated efficiencies determined from the proposed model and statistical figures that describe the goodness of fit. Additionally, values of the lag time, estimated directly from the pH curve, as described in Section 2.4, are indicated for each experiment. The lag time is generally between 13 and 16 h, except in Batch V, which also led to the lowest efficiency and the worst fit. Hence, a mean value for the explored conditions would be 17 ± 7 h. The estimated efficiency is quite low, around 0.04%, indicating many metabolic routes consuming protons, apart from the one leading to hydrogen gas formation. Nevertheless, it should be kept in mind that the scale factor is given by the acetic acid dissociation constant as a lumped factor. Although the value of this factor modifies the calculated efficiency, it provides a quantitative mean to compare results obtained with different media. The estimated values for the efficiency coefficient are also quite regular, always between 0.029% and 0.043%, leading to a mean value of 0.037% ± 0.006% for the conditions explored in this work.

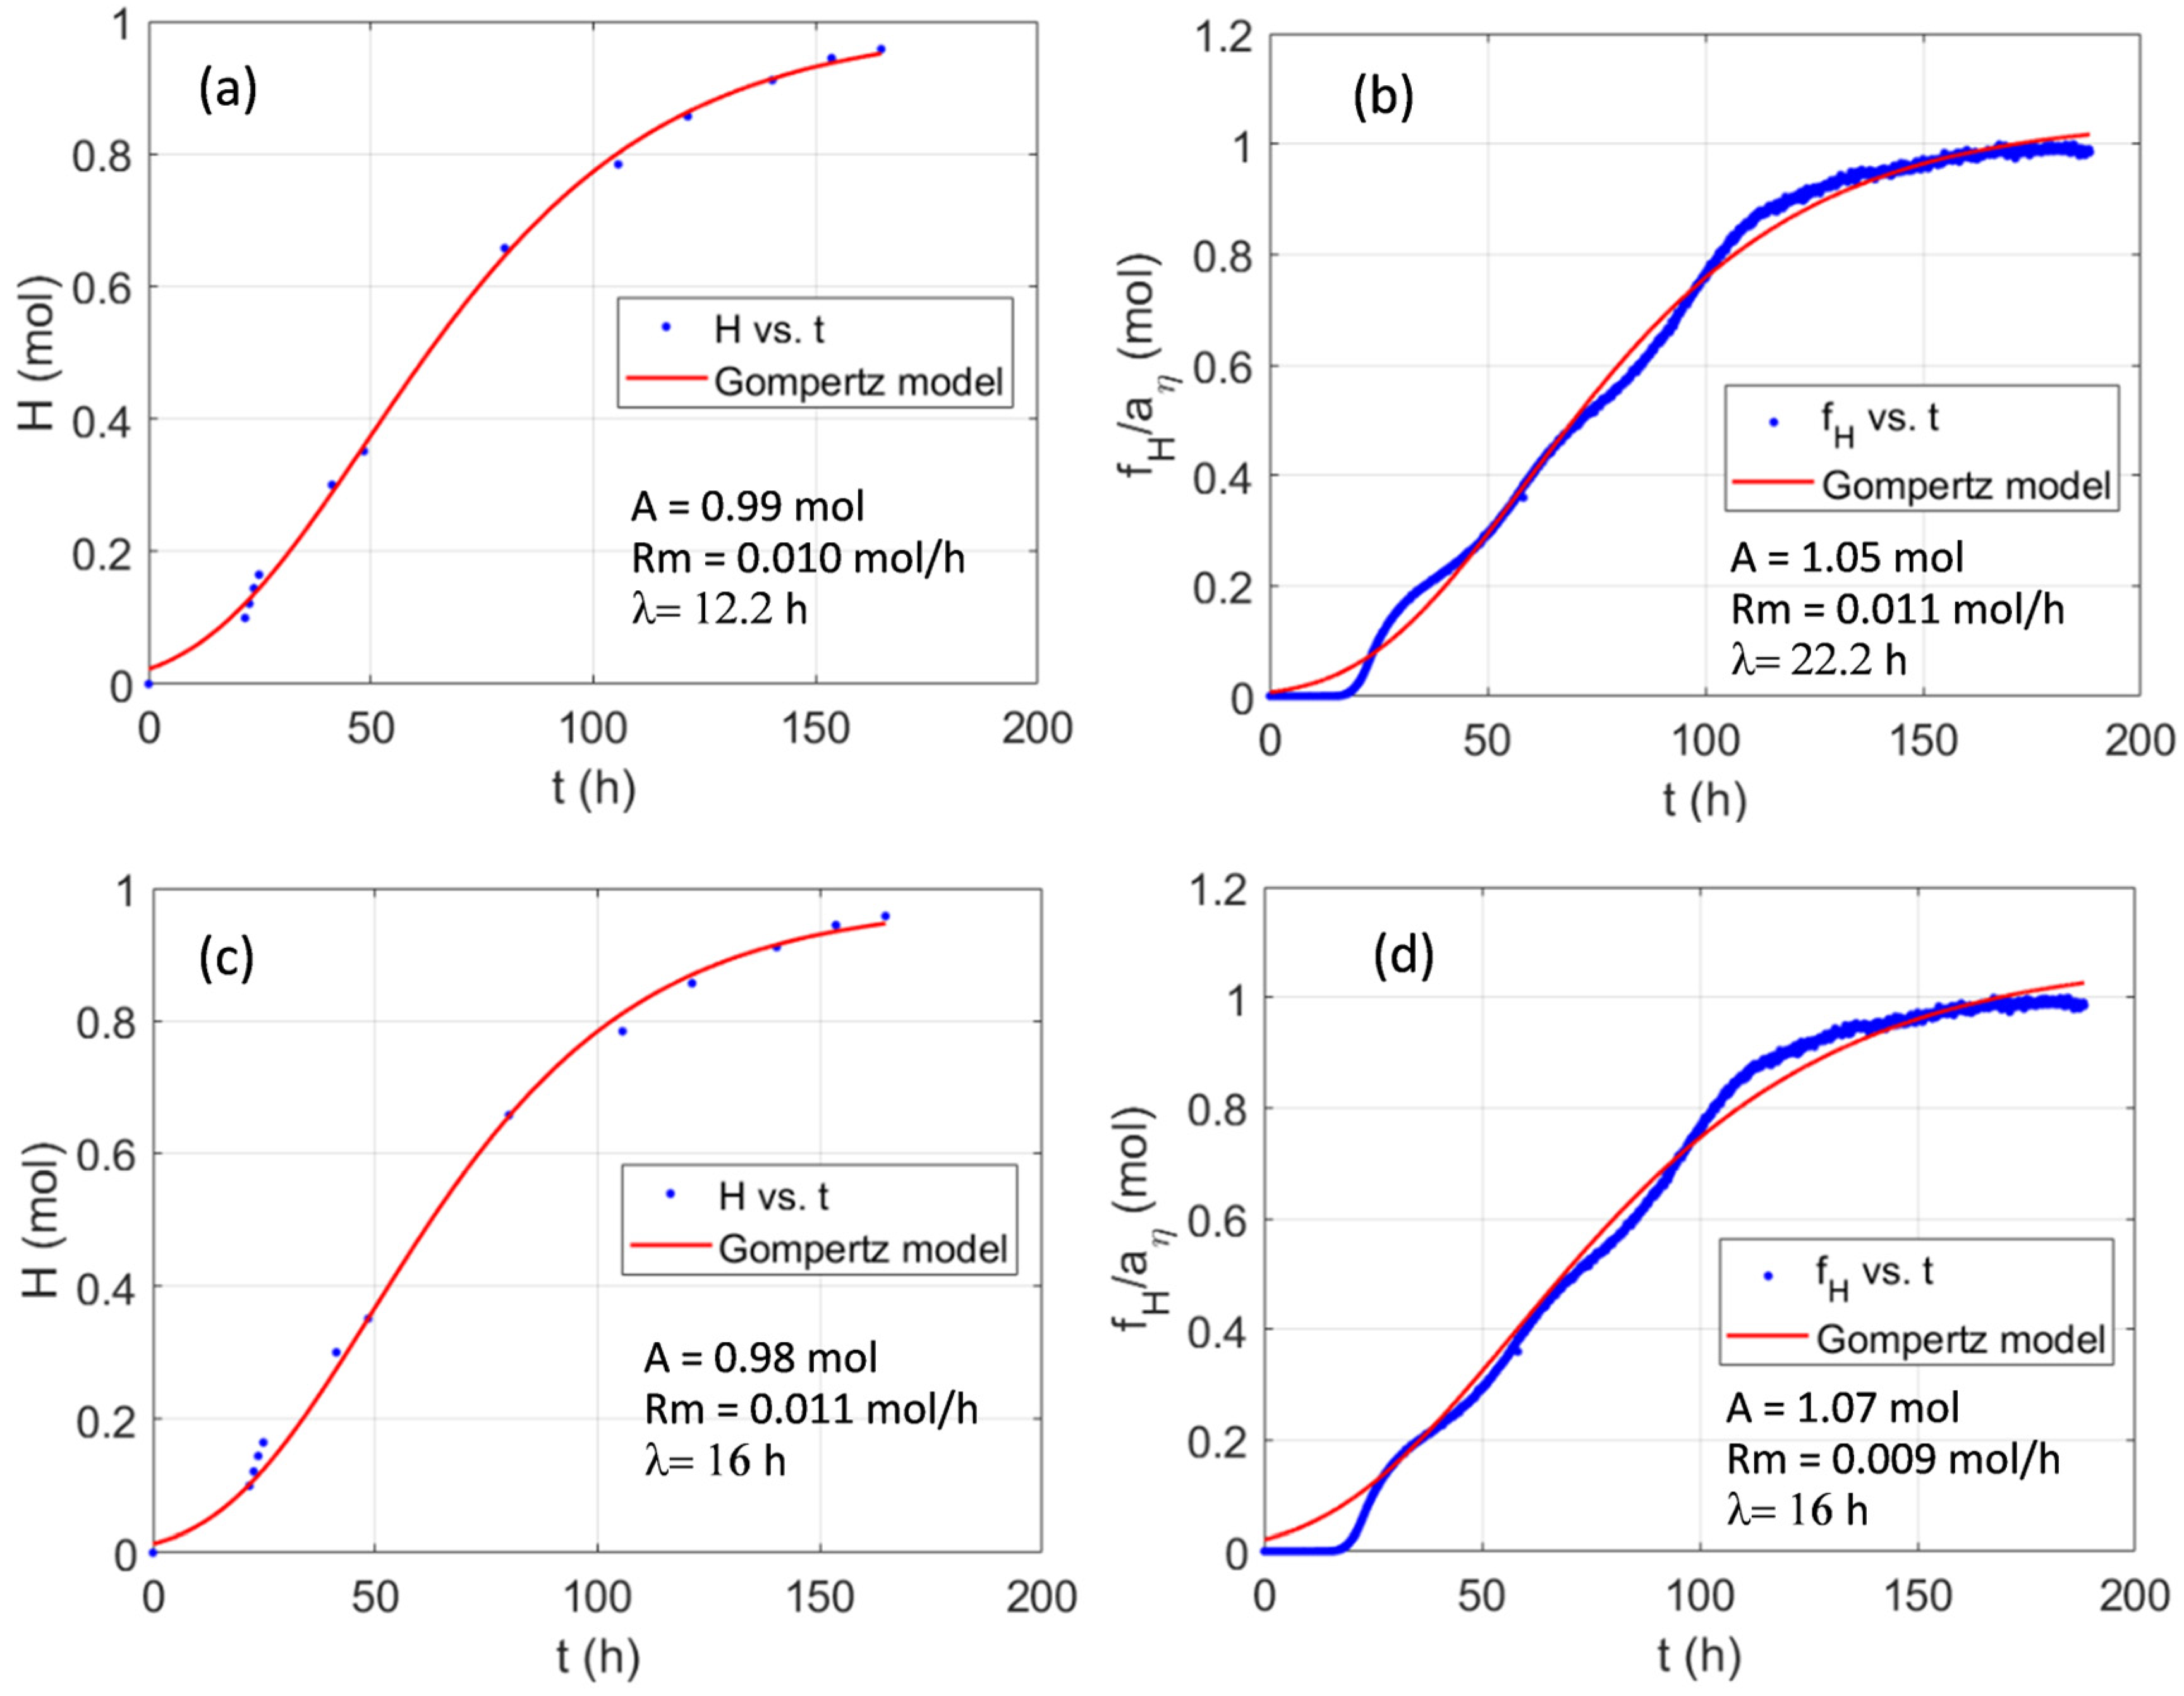
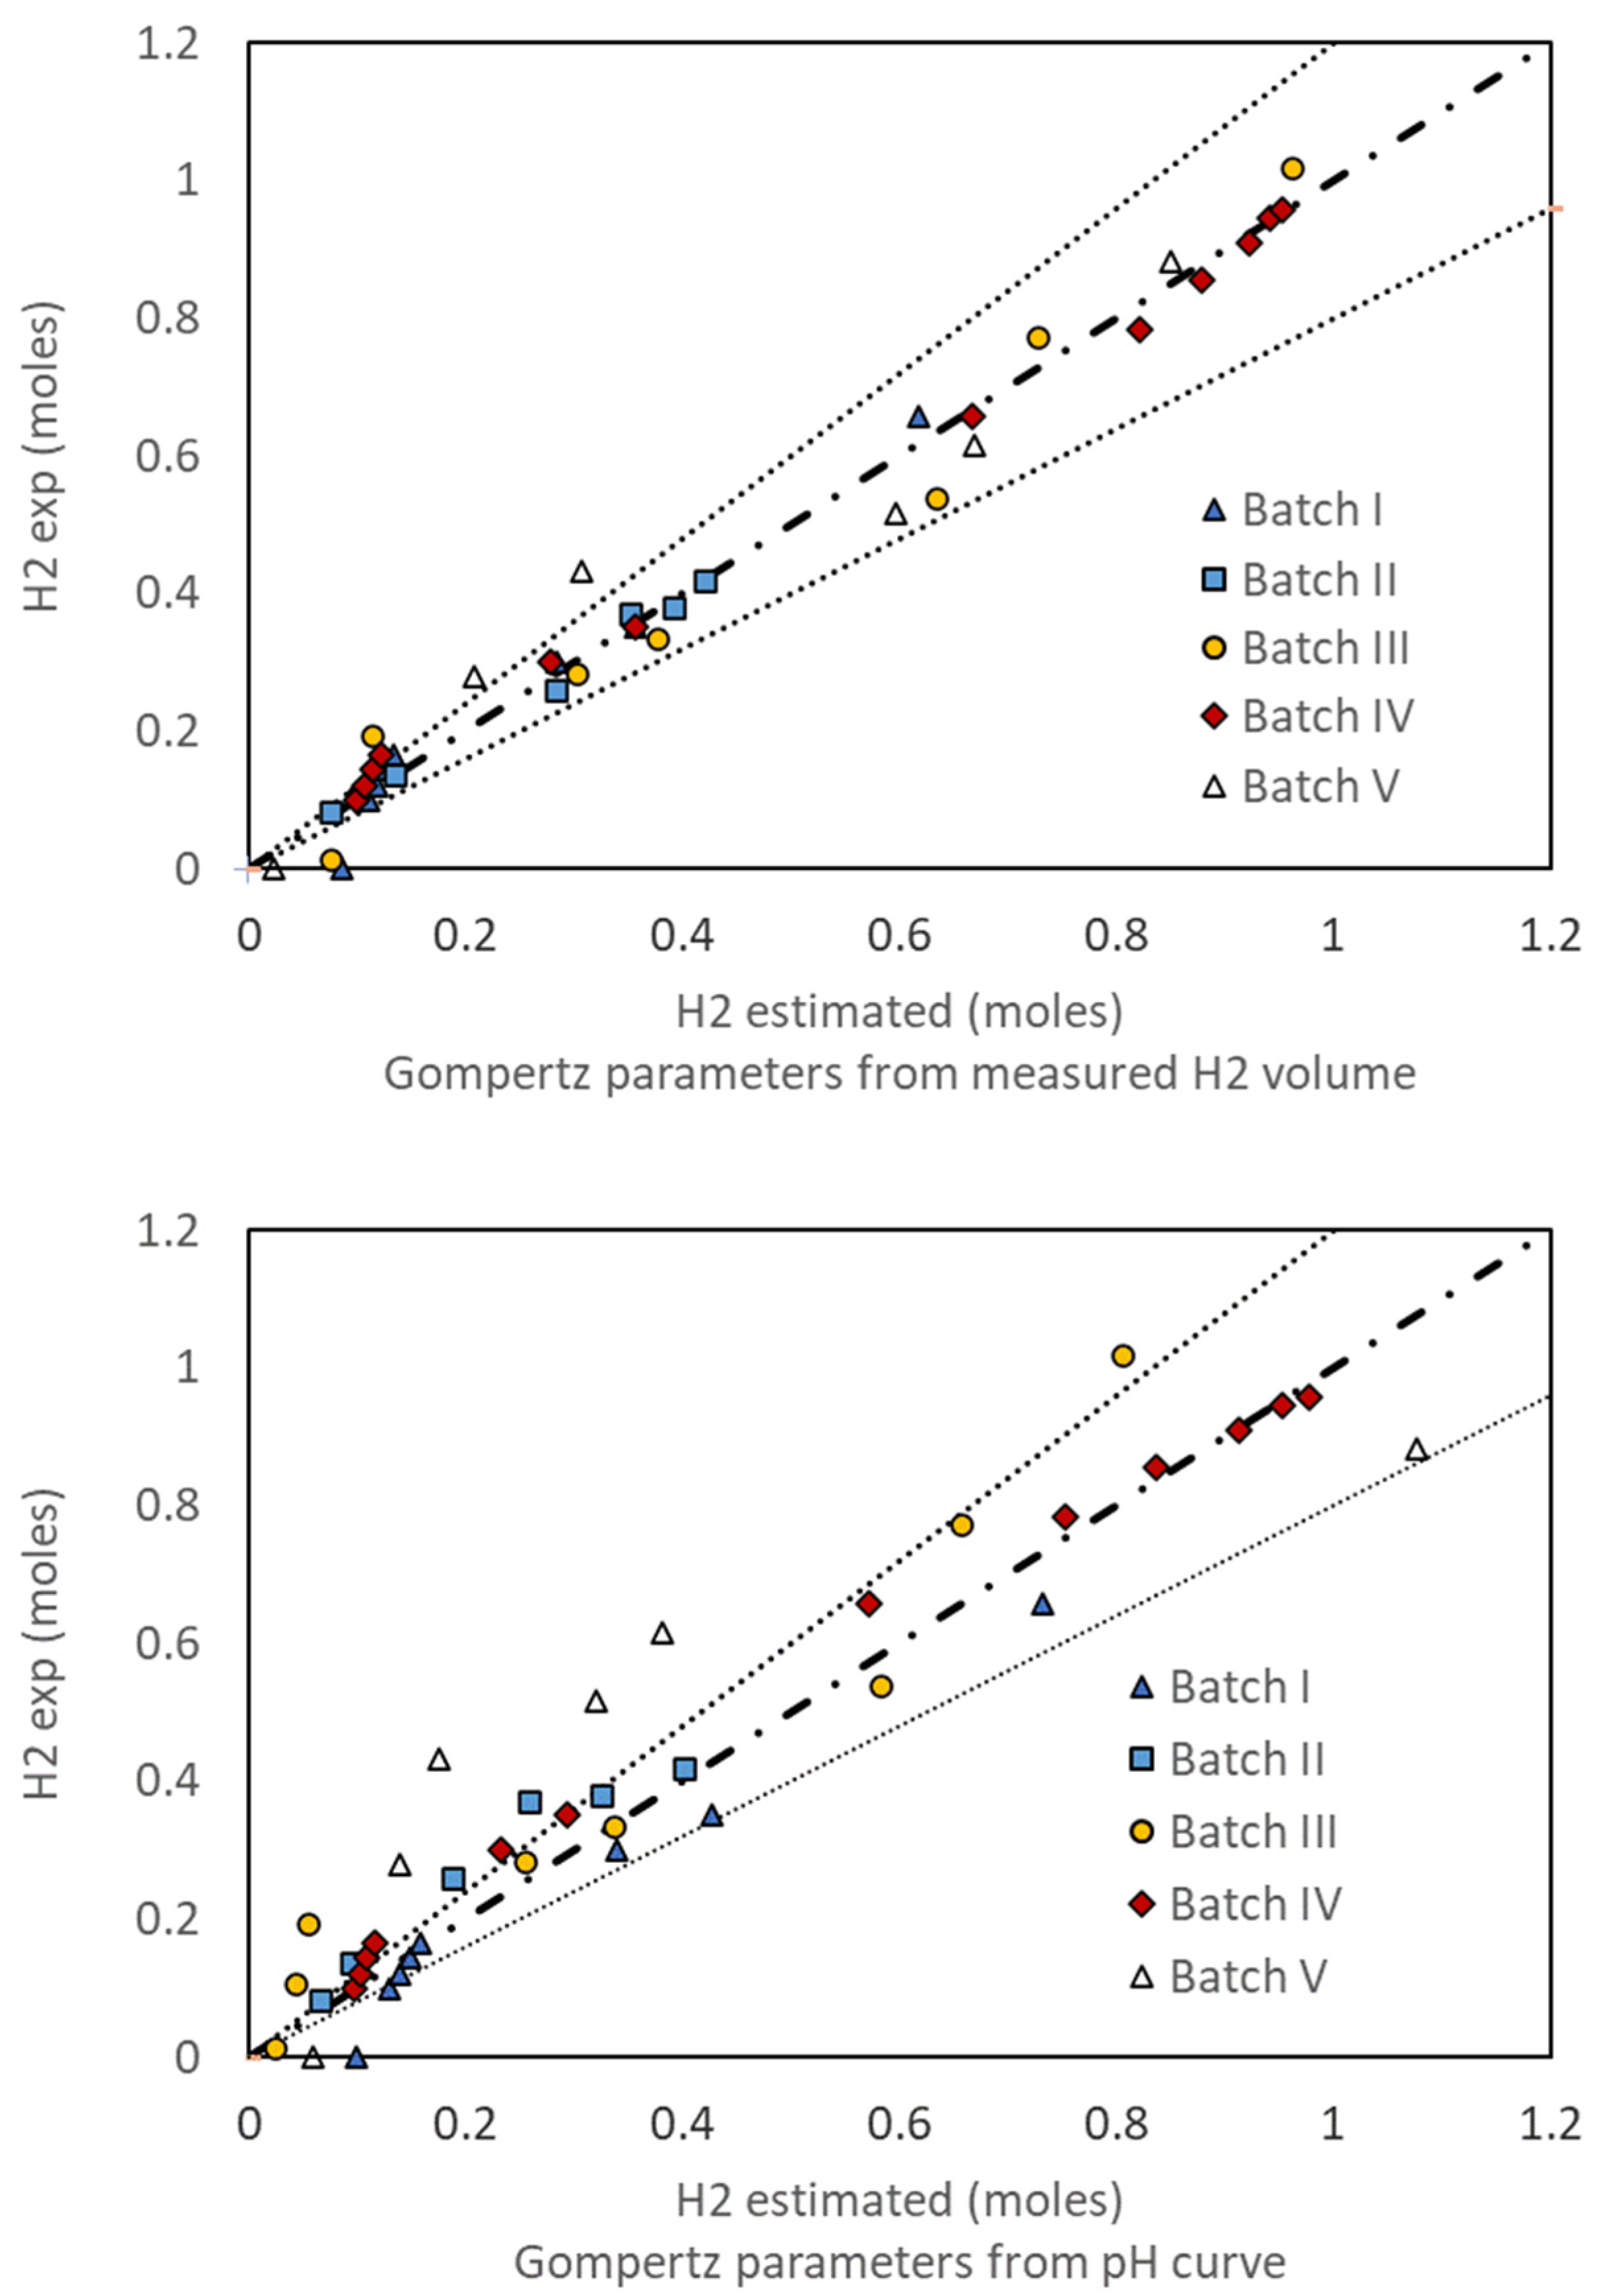
2.6. Kinetic Parameters—Modified Gompertz Model

The biological production of H2 has been largely modeled according to the modified Gompertz model [30,31,32], since it encompasses the bacterial cell growth coupled with a parsimonious parametrization of the hydrogen production with more direct physical meaning [33,34]. The modified Gompertz model has the expression given in Equation (15), where H is the cumulated hydrogen produced, which can be given in moles, liters, or moles per reactor volume [35]. Parameter A has the same units and indicates the maximum amount of hydrogen that can be produced, interpreted as the affinity towards hydrogen production. Rm is the maximum hydrogen production rate, and λ is the lag phase time.
H = A · e e [ R m . e A ( λ t ) + 1 ]
The fitting can be further simplified from three to two parameters if the lag phase time is estimated directly from the pH curve with the procedure described in Section 2.4.
Given the approximately linear relation between the f H function and H highlighted in Section 2.5, it is worth exploring the possibility of estimating the modified Gompertz model parameters from the pH curve. Equation (13) relates the cumulated hydrogen production to the function ( f H ), which is entirely obtained from the pH curve. The parameters can be obtained from a nonlinear fitting or, since the modified Gompertz model is a bi-exponential function, an exponential fitting over a semi-log plot of the f H function vs. time, starting after the lag phase, can be obtained, as indicated in Equation (16).
ln ( f H ) = ln ( ( 3 2 2 η ) H V r ) = e [ R m . e A ( λ t ) + 1 ] + ln ( ( 3 2 2 η ) A V r )
ln ( f H ) = e [ α ( t ) + 1 ] + β
α = R m . e A
β = ln ( A V R [ 3 2 2 η ] )
For comparison, the experimental cumulated hydrogen production was also fitted to the modified Gompertz model, taking the logarithm of Equation (15):
ln ( H ) = e [ R m . e A ( t ) + 1 ] + log ( A )
Table 2 and Table 3 list the parameters fitted from all the experiments under the conditions explored, which were defined based on a previous piece of work [36]. Table 2 reports the values when the parameters A, Rm, and λ are fitted, and Table 3 provides A and Rm obtained while setting the lag phase time as the value obtained from the pH curve with the procedure described before.
Figure 5 and Figure 6 illustrate the goodness of fit of the results of two experiments, the best and the worst fit. The parameters determined both from the experimentally measured moles of hydrogen (Figure 5a,c and Figure 6a,c) and from the moles calculated through the pH curve with Equation (13) (Figure 5b,d and Figure 6b,d) are coincident. Hence, it is inferred that the pH curve can be successfully used to get kinetic information on hydrogen production without measuring the gas evolved if a reasonable estimation of the efficiency coefficient is available.
Figure 5 correspond to Batch IV, the experimental results shown in Figure 1 and Figure 3, and for which the estimated lag phase time method has been shown in Figure 2. This batch experiment, carried out for 180 h led to more than 20 L, around 1 mole, of hydrogen until the generation stopped, due to sucrose consumption. The Gompertz model successfully describes the hydrogen production with three fitted parameters (Figure 5a) and restricting the lag phase time to the one obtained with the procedure given in Section 2.4 (Figure 5c). The figure also illustrates the moles of hydrogen inferred from the pH curve through Equation (13), using the fitted efficiency coefficient given in Table 1 (blue points with 5 min sampling period in Figure 5b,d). Since the method successfully estimates the produced hydrogen, the parameters of the Gompertz model are close to those obtained from the measured gas.
Figure 6 correspond to Batch V, which was also carried out for 180 h, and again led to approximately 20 L, around 0.8 moles, of hydrogen until the generation stopped. The conditions and the media were the same as for Batch IV, but the experimental hydrogen gas was measured less frequently. Nevertheless, the Gompertz model satisfactorily describes the hydrogen production both with three fitted parameters (Figure 6a) and restricting the lag phase time to the one obtained with the procedure given in Section 2.4 (Figure 6c). The pH curve in this experiment crossed through a period of buffered pH, which is reflected in the estimated hydrogen production (blue points with 5 min sampling period in Figure 6b,d). This variation led to a worse fit and the parameters overestimate the produced hydrogen. However, despite the worse fit, the parameters are still in the same order. It is worthwhile mentioning that buffering periods were also reflected in less hydrogen generation, supporting the link between pH and hydrogen gas production.
Figure 7 illustrates the goodness of fit of the model calculated with the results shown in Figure 1, using both the parameters fitted directly from the volume of hydrogen produced, and estimated with the hydron ion mass balance. Although the fitting is better if the experimentally measured moles of hydrogen are used, the estimation arising from the moles of hydrogen calculated through the mass balance from the monitored pH is also good. There is a high correlation between the experimental H values with those predicted with the modified Gompertz model fit over the f H function.
Figure 8 illustrates the plot of estimated vs. measured hydrogen obtained using the fitted parameters given in Table 3. The result indicates that the modified Gompertz model provides a good description of the hydrogen production rate. Comparing the parity plots calculated with parameters fitted from experiments or from the pH curve, the mean absolute error increases from 7% to 12%. It is also worth mentioning that the modified Gompertz parameters can also be obtained from the initial period of the f H function. Hence, it is likely that the pH values in the initial active stages of the dark fermentation could be used to predict the hydrogen productivity of the culture using the mass balance.
Table 4 compares the modified Gompertz model parameters reported in the literature for hydrogen production by dark fermentation from different sources. Results obtained in this work are in the order of those achieved using other sources. Mu et al. [19] working with a mixed culture of anaerobic bacteria obtained from a citrate-producing wastewater achieved similar values of A and higher values of Rm. The sludge was heated at 102 °C for 90 min to eliminate methanogenic hydrogen trophic bacteria, concentrating the spore forming bacteria responsible for hydrogen production. The work was also carried out in a 5 L batch stirred tank but regulating the pH in 5.5. More recently, Turhal et al. [24] found values in the order of the ones obtained in this work, if they are referred to the reactor working volume, using a heat-treated anaerobic sludge fed with a mixture of melon and watermelon with different solid concentration. Additionally, Del Angel Acosta et al. [30] obtained parameters in the same order if they are referred to the reactor working volume when hydrogen was produced with a heat-treated sludge. The authors used corn and brewery wastewater starting with different initial pH values (from 5.8 to 12.3) according to the mixture or setting the initial pH to 6.

3. Materials and Methods

3.1. Bacterial Sludge

The bacterial source for this work has been a sample of residual water from a water treatment chamber on board an Argentine Navy ship, the frigate “Libertad”. The sludge is collected directly from the chamber into a 5 L jerrycan and stored at room temperature. To seed a 5 L rector, 500 mL of this sludge is collected in an Erlenmeyer flask and heated at 75 °C for 50 min to rid the sludge of non-spore-forming species. After this pre-treatment, it is ready to pour into the reactor tank. The performance of this bacterial biomass from the water treatment plant of a ship has been compared to other sources in previous work [12], showing outstanding hydrogen production. Genetic analysis of 16S rRNA on the untreated sludge has shown that it is composed of over 25 different bacterial families, but this is notoriously reduced by the temperature pretreatment. After such pretreatment, it is mostly composed of Clostridium sp., which are well known hydrogen producers [14,21].

3.2. Culture Medium and Fermentation Process

The 500 mL of pre-treated sludge is added to a stirred reactor where a 4.5 L culture medium has been prepared. This culture medium is a variant of the one proposed by Logan et al. [42]. This medium contains distilled water, ammonium bicarbonate (NH4HCO3) in the amount of 2 g/L, potassium phosphate (KH2PO4) at 1.2 g/L, and several other nutrients and micronutrients in the amount of 0.2 g/L, which are magnesium sulfate (MgSO4), manganese sulfate (MnSO4), sodium molybdate (Na2MoO4), calcium chloride (CaCl2), and ferric chloride (FeCl3). The carbon source is sucrose in a 25 g/L concentration.
Clostridium species ferment the carbohydrate while producing carbon dioxide (CO2) and H2 gas released into the reactor’s headspace. They also produce a mix of acids, mostly acetic and butyric acids, that are released into the culture medium. As a result, acidity increases while H2 is being produced. At a certain point, low pH affects bacterial metabolism, and, to avoid this effect, a weak base is initially added to the culture medium. In this case, sodium acetate (NaC2H3O2) in 0.05 M concentration has been chosen (6.8 g/L of the trihydrate salt) as neutralizing agent.
Once the culture medium and the inoculum were introduced into the reactor vessel, the cover was screwed in place, the stirring was set at 50 rpm, and an anaerobic atmosphere was generated by bubbling nitrogen (N2) for 5 min. The temperature was adjusted with a heating jacket at 37 °C. A pH sensor was attached to the lid registering with a sample period of five minutes. The reactor was a Sartorius Biostat A plus in batch mode.
After the N2 had bubbled out, an acrylic container made of three equal cylinders, connected in parallel, was attached to the vent to capture all gases produced in the reactor. The cylinders were full of water. As the gas was produced, the water was removed from the container, passing on to a water reserve. The volume of removed water was the gas volume produced by the bacterial biomass. The gas volume was calculated by measuring the cylinder volume. Each cm of the three cylinders container was equal to 0.72 L (each cylinder height was 20 cm, radius 8.7 cm). The starting time of the reactor was recorded as the point when the gas container was attached.

3.3. Hydrogen Measure and Production

As the fermentation starts, the bacterial spores detect optimal conditions and start budding, ending the lag phase. Once grown, the biomass starts metabolizing sucrose, and cell replication occur. In this phase, pH shows a steep decline while gases accumulate. The gas stored in the container corresponds to all gases produced by the biomass, which means a mix of H2 and CO2. This gas mixture has been evaluated by chromatography and has shown to be composed of only these two gas species, with a 60–70% proportion of H2. The authors developed a new quantitative method to estimate the proportions of these gases in previous work [16]. It has been shown that using a syringe with a known volume of gas mix and consuming the H2 in a highly selective proton-exchange membrane (PEM) fuel cell leaves only the volume of CO2, which can be directly read with the syringe. A simple volume balance results in the amount of H2 present in the sample. This method is simple, cost-effective, and straightforward.

4. Conclusions

Valuable information on hydrogen production efficiency and kinetics can be obtained by analyzing the pH time evolution monitored during dark fermentation by spore-forming bacteria in a batch stirred tank reactor. On the one hand, the pH curve can provide a direct estimation of the lag phase time without assuming any kinetic model. Since the exponential period of culture growth produces short chain acids, it leads to a sharp pH decay. Hence, from the intersection of the initial constant pH value with an exponential fit describing the pH decay, a robust lag phase time estimator can be obtained.
Furthermore, from a model based on the mass balances of the hydron ion, describing the link between the hydrogen produced by dark fermentation and the evolution of pH during the process, a measure of the hydrogen efficiency is proposed. The model is developed, solved, and successfully compared with experiments.
The agreement between the experimentally measured moles of hydrogen and the values estimated from the hydron ion balance indicates that it is a reactor performance descriptor worth being explored. Moreover, it can be used to estimate parameters of models, describing the hydrogen generation kinetics, such as the widely applied modified Gompertz model. The pH values in the initial active stages of the dark fermentation could be used to predict the hydrogen productivity of the culture. There is a high correlation between the experimental H values with those predicted with the modified Gompertz model fit over the f H function. A fair similarity arose in the affinity factor, A, and the estimated Rm parameter predicted independently from both results. Therefore, it can be concluded that hydron-related kinetics is strongly linked to molecular hydrogen production, and the monitored pH when no pH regulation is imposed allows estimating relevant information of the process.

Author Contributions

Data curation, V.L.M. and R.E.G.; Formal analysis, G.L.S. and M.C.C.; Funding acquisition, M.J.L. and M.C.C.; Investigation, V.L.M. and R.E.G.; Methodology, V.L.M. and G.L.S.; Resources, R.E.G. and M.J.L.; Supervision, M.J.L., M.A.G. and M.C.C.; Validation, G.L.S.; Visualization, G.L.S.; Writing—original draft, V.L.M. and G.L.S.; Writing—review and editing, M.A.G. and M.C.C. All authors have read and agreed to the published version of the manuscript.

Funding

This research was funded by the Argentine Ministry of Defense, PIDDEF 23/10 and PIDDEF 20/14, Consejo Nacional de Investigaciones Científicas y Técnicas (CONICET), PIP00902, Agencia Nacional de Promoción Científica y Tecnológica (ANPCyT), PICT2019-00955, and Universidad de Buenos Aires, 20020170100604BA.

Data Availability Statement

The data presented in this study are available on request from the corresponding author.

Acknowledgments

The authors would like to thank the Scientific and Technical Institute for Defense (CITEDEF) and the Ministry of Defense for the funding and physical laboratories, where this research was conducted.

Conflicts of Interest

The authors declare no conflict of interest.

Nomenclature

SymbolNameUnits
a η Ratio of H and fH according to Equation (13)L−1
α Rate parameter of ln(fH) vs. t non-linear fith−1
AAffinity towards hydrogen productionMol
β Independent parameter of ln(fH) vs. t non-linear fit-
e Base of natural logarithm-
f H Cumulated hydron conversion functionmol/L
HCumulated hydrogen productionMol
[ H + ] Hydron concentrationmol/L
K a Acid dissociation equilibrium constant
nNumber of molesMol
niElectric charge of the i-th base anion-
rCorrelation coefficient -
RmMaximum hydrogen production ratemol/h
pHNegative base 10 logarithm of hydron concentration-
P H 2 Hydrogen productionmol/h
[ Phos ] o Analytic phosphate concentrationmol/L
tTimeH
VRReactor working volumeL
Wb Weak base-
η Efficiency towards hydrogen production-
λ Lag phase timeH

References

  1. Ritchie, H.; Roser, M.; Rosado, P. Energy Production and Consumption. Available online: https://ourworldindata.org/energy (accessed on 18 September 2022).
  2. Tranum, S. Powerless: India’s Energy Shortage and Its Impact; SAGE Publications India Pvt Ltd.: Los Angeles, CA, USA, 2013; ISBN 978-81-321-1314-0. [Google Scholar]
  3. Kalvelage, K.; Passe, U.; Rabideau, S.; Takle, E.S. Changing Climate: The Effects on Energy Demand and Human Comfort. Energy Build. 2014, 76, 373–380. [Google Scholar] [CrossRef]
  4. Höök, M.; Tang, X. Depletion of Fossil Fuels and Anthropogenic Climate Change—A Review. Energy Policy 2013, 52, 797–809. [Google Scholar] [CrossRef] [Green Version]
  5. Kartal, M.T. The Role of Consumption of Energy, Fossil Sources, Nuclear Energy, and Renewable Energy on Environmental Degradation in Top-Five Carbon Producing Countries. Renew. Energy 2022, 184, 871–880. [Google Scholar] [CrossRef]
  6. Auzanneau, M.; Reynolds, J.F.; Heinberg, R. Oil, Power, and War: A Dark History; Chelsea Green Publishing: Hartford, VT, USA; Post Carbon Institute: Corvallis, OR, USA, 2018; ISBN 978-1-60358-743-3. [Google Scholar]
  7. Conrad, R.; Reinhardt, T. Hydrogen Strategy: Enabling A Low-Carbon Economy; Office of Fossil Energy, US Department of Energy: Washington, DC, USA, 2020. Available online: https://www.energy.gov/fecm/downloads/hydrogen-strategy-enabling-low-carbon-economy (accessed on 18 September 2022).
  8. Łukajtis, R.; Hołowacz, I.; Kucharska, K.; Glinka, M.; Rybarczyk, P.; Przyjazny, A.; Kamiński, M. Hydrogen Production from Biomass Using Dark Fermentation. Renew. Sustain. Energy Rev. 2018, 91, 665–694. [Google Scholar] [CrossRef]
  9. Jørgensen, S.E.; Fath, B.D. Encyclopedia of Ecology; Elsevier: Amsterdam, The Netherlands, 2008; ISBN 978-0-08-045405-4. [Google Scholar]
  10. Ajanovic, A.; Sayer, M.; Haas, R. The Economics and the Environmental Benignity of Different Colors of Hydrogen. Int. J. Hydrogen Energy 2022, 47, 24136–24154. [Google Scholar] [CrossRef]
  11. Moussa, R.N.; Moussa, N.; Dionisi, D. Hydrogen Production from Biomass and Organic Waste Using Dark Fermentation: An Analysis of Literature Data on the Effect of Operating Parameters on Process Performance. Processes 2022, 10, 156. [Google Scholar] [CrossRef]
  12. García, R.E.; Martínez, V.L.; Franco, J.I.; Curutchet, G. Selection of Natural Bacterial Communities for the Biological Production of Hydrogen. Int. J. Hydrogen Energy 2012, 37, 10095–10100. [Google Scholar] [CrossRef]
  13. Islam, A.K.M.K.; Dunlop, P.S.M.; Hewitt, N.J.; Lenihan, R.; Brandoni, C. Bio-Hydrogen Production from Wastewater: A Comparative Study of Low Energy Intensive Production Processes. Clean Technol. 2021, 3, 156–182. [Google Scholar] [CrossRef]
  14. García, R.E.; Pin Viso, N.; Gerosa, F.A.; Nishinakamasu, V.; Puebla, A.F.; Farber, M.D.; Lavorante, M.J. Argentine Navy Icebreaker Ship “Almirante Irizar” Sludge Microbial Composition Analysis for Biohydrogen Production. Bioenerg. Res. 2022, 1–12. [Google Scholar] [CrossRef]
  15. Wang, J.; Yin, Y. Principle and Application of Different Pretreatment Methods for Enriching Hydrogen-Producing Bacteria from Mixed Cultures. Int. J. Hydrogen Energy 2017, 42, 4804–4823. [Google Scholar] [CrossRef]
  16. Martínez, V.L.; García, R.E.; Curutchet, G.; Sanguinetti, A.; Fasoli, H.J.; Franco, J.I. Demonstration of the Possibility to Power a Fuel Cell with Hydrogen Derived from the Fermentation of Sugar. Int. J. Hydrogen Energy 2012, 37, 14920–14925. [Google Scholar] [CrossRef]
  17. Mona, S.; Kumar, S.S.; Kumar, V.; Parveen, K.; Saini, N.; Deepak, B.; Pugazhendhi, A. Green Technology for Sustainable Biohydrogen Production (Waste to Energy): A Review. Sci. Total Environ. 2020, 728, 138481. [Google Scholar] [CrossRef] [PubMed]
  18. Sekoai, P.T.; Daramola, M.O.; Mogwase, B.; Engelbrecht, N.; Yoro, K.O.; Petrus du Preez, S.; Mhlongo, S.; Ezeokoli, O.T.; Ghimire, A.; Ayeni, A.O.; et al. Revising the Dark Fermentative H2 Research and Development Scenario—An Overview of the Recent Advances and Emerging Technological Approaches. Biomass Bioenergy 2020, 140, 105673. [Google Scholar] [CrossRef]
  19. Wei, X.; Wang, R.-Z.; Zhao, W.; Chen, G.; Chai, M.-R.; Zhang, L.; Zhang, J. Recent Research Progress in PEM Fuel Cell Electrocatalyst Degradation and Mitigation Strategies. EnergyChem 2021, 3, 100061. [Google Scholar] [CrossRef]
  20. Sun, Y.; He, J.; Yang, G.; Sun, G.; Sage, V. A Review of the Enhancement of Bio-Hydrogen Generation by Chemicals Addition. Catalysts 2019, 9, 353. [Google Scholar] [CrossRef] [Green Version]
  21. Lopez-Hidalgo, A.M.; Smoliński, A.; Sanchez, A. A Meta-Analysis of Research Trends on Hydrogen Production via Dark Fermentation. Int. J. Hydrogen Energy 2022, 47, 13300–13339. [Google Scholar] [CrossRef]
  22. Hallenbeck, P.C.; Abo-Hashesh, M.; Ghosh, D. Strategies for Improving Biological Hydrogen Production. Bioresour. Technol. 2012, 110, 1–9. [Google Scholar] [CrossRef]
  23. García-Depraect, O.; Rene, E.R.; Gómez-Romero, J.; López-López, A.; León-Becerril, E. Enhanced Biohydrogen Production from the Dark Co-Fermentation of Tequila Vinasse and Nixtamalization Wastewater: Novel Insights into Ecological Regulation by PH. Fuel 2019, 253, 159–166. [Google Scholar] [CrossRef]
  24. Aghajani Delavar, M.; Wang, J. Numerical Investigation of PH Control on Dark Fermentation and Hydrogen Production in a Microbioreactor. Fuel 2021, 292, 120355. [Google Scholar] [CrossRef]
  25. Chen, Y.; Yin, Y.; Wang, J. Influence of Butyrate on Fermentative Hydrogen Production and Microbial Community Analysis. Int. J. Hydrogen Energy 2021, 46, 26825–26833. [Google Scholar] [CrossRef]
  26. Penniston, J.; Gueguim Kana, E.B. Impact of Medium PH Regulation on Biohydrogen Production in Dark Fermentation Process Using Suspended and Immobilized Microbial Cells. Biotechnol. Biotechnol. Equip. 2018, 32, 204–212. [Google Scholar] [CrossRef] [Green Version]
  27. Zagrodnik, R.; Duber, A.; Seifert, K. Dark-Fermentative Hydrogen Production from Synthetic Lignocellulose Hydrolysate by a Mixed Bacterial Culture: The Relationship between Hydraulic Retention Time and PH Conditions. Bioresour. Technol. 2022, 358, 127309. [Google Scholar] [CrossRef] [PubMed]
  28. Alvarez, A.J.; Fuentes, K.L.; Alberto Arias, C.; Chaparro, T.R. Production of Hydrogen from Beverage Wastewater by Dark Fermentation in an Internal Circulation Reactor: Effect on PH and Hydraulic Retention Time. Energy Convers. Manag. X 2022, 15, 100232. [Google Scholar] [CrossRef]
  29. Wiechmann, A.; Müller, V. Energy Conservation in the Acetogenic Bacterium Clostridium Aceticum. Microorganisms 2021, 9, 258. [Google Scholar] [CrossRef] [PubMed]
  30. Mu, Y.; Yu, H.-Q.; Wang, G. A Kinetic Approach to Anaerobic Hydrogen-Producing Process. Water Res. 2007, 41, 1152–1160. [Google Scholar] [CrossRef] [PubMed]
  31. Nemestóthy, N.; Bakonyi, P.; Rózsenberszki, T.; Kumar, G.; Koók, L.; Kelemen, G.; Kim, S.-H.; Bélafi-Bakó, K. Assessment via the Modified Gompertz-Model Reveals New Insights Concerning the Effects of Ionic Liquids on Biohydrogen Production. Int. J. Hydrogen Energy 2018, 43, 18918–18924. [Google Scholar] [CrossRef]
  32. Wang, J.; Wan, W. Kinetic Models for Fermentative Hydrogen Production: A Review. Int. J. Hydrogen Energy 2009, 34, 3313–3323. [Google Scholar] [CrossRef]
  33. Zhang, Y.; Xiao, L.; Hao, Q.; Li, X.; Liu, F. Ferrihydrite Reduction Exclusively Stimulated Hydrogen Production by Clostridium with Community Metabolic Pathway Bifurcation. ACS Sustain. Chem. Eng. 2020, 8, 7574–7580. [Google Scholar] [CrossRef]
  34. Zwietering, M.H.; Jongenburger, I.; Rombouts, F.M.; van’t Riet, K. Modeling of the Bacterial Growth Curve. Appl. Environ. Microbiol. 1990, 56, 1875–1881. [Google Scholar] [CrossRef] [Green Version]
  35. Turhal, S.; Turanbaev, M.; Argun, H. Hydrogen Production from Melon and Watermelon Mixture by Dark Fermentation. Int. J. Hydrogen Energy 2019, 44, 18811–18817. [Google Scholar] [CrossRef]
  36. Martinez, V.; Alfonso, A.; García, R.; Lavorante, M.; Galvagno, M.; Cassanello, M. Design of Experiments to Optimize Hydrogen Production through Dark Fermentation of Sugars. In Proceedings of the 8th Symposium on Hydrogen, Fuel Cells and Advanced Batteries, Buenos Aires, Argentina, 11–14 July 2022. [Google Scholar]
  37. Lay, J. Influence of Chemical Nature of Organic Wastes on Their Conversion to Hydrogen by Heat-Shock Digested Sludge. Int. J. Hydrogen Energy 2003, 28, 1361–1367. [Google Scholar] [CrossRef]
  38. Lay, J.-J. Biohydrogen Generation by Mesophilic Anaerobic Fermentation of Microcrystalline Cellulose. Biotechnol. Bioeng. 2001, 74, 280–287. [Google Scholar] [CrossRef] [PubMed]
  39. Gadhamshetty, V.; Arudchelvam, Y.; Nirmalakhandan, N.; Johnson, D.C. Modeling Dark Fermentation for Biohydrogen Production: ADM1-Based Model vs. Gompertz Model. Int. J. Hydrogen Energy 2010, 35, 479–490. [Google Scholar] [CrossRef]
  40. Kim, D.-H.; Yoon, J.-J.; Kim, S.-H.; Park, J.-H. Acceleration of Lactate-Utilizing Pathway for Enhancing Biohydrogen Production by Magnetite Supplementation in Clostridium Butyricum. Bioresour. Technol. 2022, 359, 127448. [Google Scholar] [CrossRef]
  41. Del Angel-Acosta, Y.A.; Alvarez, L.H.; Garcia-Reyes, R.B.; Carrillo-Reyes, J.; Garcia-Gonzalez, A.; Meza-Escalante, E.R. Co-Digestion of Corn (Nejayote) and Brewery Wastewater at Different Ratios and PH Conditions for Biohydrogen Production. Int. J. Hydrogen Energy 2021, 46, 27422–27430. [Google Scholar] [CrossRef]
  42. Logan, B.E.; Oh, S.-E.; Kim, I.S.; Van Ginkel, S. Biological Hydrogen Production Measured in Batch Anaerobic Respirometers. Environ. Sci. Technol. 2002, 36, 2530–2535. [Google Scholar] [CrossRef]
Figure 1. The pH (left) and hydrogen production (right) evolution over time.
Catalysts 12 01366 g001
Figure 2. Typical decay of pH and exponential fit of the pH time series during the onset of fermentative activity. Estimation of the lag phase time for the experiment shown in Figure 1.
Catalysts 12 01366 g002
Figure 3. fH function (left) and cumulated hydrogen production (right).
Catalysts 12 01366 g003
Figure 4. Linear fit of fH function vs. cumulative hydrogen production for the experiment shown in Figure 1.
Catalysts 12 01366 g004
Figure 5. Comparison of the measured moles of H2 in Batch IV (a,c) and the moles of hydrogen estimated from the corresponding pH curve using the function fH and the relation given by Equation (13) (b,d) vs. the values predicted by the modified Gompertz model with three fitted parameters (a,b) or two fitted parameters and the lag phase time estimated from the pH curve, as described before (c,d).
Catalysts 12 01366 g005
Figure 6. Comparison of the measured moles of H2 in batch V (a,c) and the moles of hydrogen estimated from the corresponding pH curve using the function fH and the relation given by Equation (13) (b,d) vs. the values predicted by the modified Gompertz model with three fitted parameters (a,b) or two fitted parameters and the lag phase time estimated from the pH curve, as described before (c,d).
Catalysts 12 01366 g006
Figure 7. Comparison of experimentally measured moles of H2 vs. the values predicted by the modified Gompertz model using parameters fitted from the experiments and the pH curve using the function fH and the relation given by Equation (13).
Catalysts 12 01366 g007
Figure 8. Comparison of experimental moles of H2 vs. those predicted by the modified Gompertz model using parameters fitted from the experiments and the pH curve.
Catalysts 12 01366 g008
Table 1. Summary of the lag time estimated directly from the pH curve, and of the efficiency determined from the linear fit of fH vs. H plots.
Batchλ (h)Slope (L−1)r2η (%)
I134.8 × 10−50.94520.041
II137.7 × 10−50.95530.033
III133.8 × 10−50.89340.043
IV165.0 × 10−50.97880.040
V299.4 × 10−50.87280.029
Mean176.1 × 10−50.92910.037
Std. dev.72.3 × 10−50.04430.006
Table 2. Summary of modified Gompertz model parameters.
BatchfitA (mol)Rm (mol/h)λ (h)r2
IH0.85 ± 0.390.011 ± 0.00315.2 ± 6.10.9748
f H 0.84 ± 0.010.018 ± 0.00126.7 ± 0.50.9782
IIH0.44 ± 0.070.011 ± 0.00312.9 ± 5.30.9938
f H 0.52 ± 0.010.011 ± 0.00126.7 ± 0.50.9781
IIIH2.39 ± 1.020.017 ± 0.00230.0 ± 0.10.9771
f H 0.98 ± 0.010.016 ± 0.00119.2 ± 0.40.9886
IVH0.99 ± 0.030.010 ± 0.00112.2 ± 2.50.9986
f H 1.05 ± 0.0010.011 ± 0.00122.2 ± 0.30.9953
VH0.87 ± 0.190.014 ± 0.00820.8 ± 16.70.9713
f H 1.23 ± 0.010.008 ± 0.00123.2 ± 1.00.9685
Table 3. Summary of modified Gompertz model parameters, setting the lag time.
BatchFitA (mol)Rm (mol/h)λ (h)r2
IH0.85 ± 0.400.010 ± 0.002130.9712
f H 0.98 ± 0.040.012 ± 0.001130.9474
IIH0.44 ± 0.020.011 ± 0.001130.9997
f H 0.61 ± 0.020.007 ± 0.001130.9473
IIIH1.97 ± 1.040.015 ± 0.008130.9376
f H 1.05 ± 0.020.014 ± 0.001130.9800
IVH0.98 ± 0.040.011 ± 0.001160.9973
f H 1.07 ± 0.0010.009 ± 0.001160.9922
VH0.85 ± 0.200.018 ± 0.005290.9518
f H 1.20 ± 0.010.009 ± 0.001290.9469
Table 4. Summary of Gompertz model parameters estimated from different works aimed at obtaining hydrogen from effluents and solid wastes.
ConditionsGompertz Parameters *Ref.
InoculumSubstrateVR. (L)T (°C)pHAgitationA (mmol H2/L Reactor)Rm (mmol H2/L.h)λ (h)
Preheated anaerobic sludge from citrate producing wastewaterSucrose530–45Regulated at 5.5120 rpm168 ± 715 ± 19.8 ± 0.3[30]
Heat-shocked digester sludgeMicrocrystalline
Cellulose
0.12377.0
(initial)
1.5 rpm1.63 ± 0.070.29 ± 0.024.6 ± 0.3[30,37,38] **
Clostridium-rich sludge from a pig manure digesterRice organic waste30 ± 20.17 ± 0.0154 ± 2
Potato organic waste25 ± 30.55 ± 0.06110 ± 10
Compost-based and low-pH
inocula
Glucose and sucrose solutions0.15–0.17522–307–8.5
(initial)
Unstirred vs. 160 rpm49–1202.7–13.718–60[39]
Sea sediment clostridia
community
Mineral salt—glucose 0.04303.25–4
(final)
None170.03015.9[33]
Ferrihydrite
amended
200.03315.2
Ferrihydrite
addition
210.03317.9
Heat-treated anaerobic sludgeMelon and watermelon fruit mixture with 0.74 to 37 g/L total Solid concentration, with (wi) and without inoculation (woi)0.08365.5–610037 gTS/L [24]
218 (wi)
176 (woi)
15.7 (wi)
3.6 (woi)
3.65 (wi)
27.3 (woi)
0.74 gTS/L
16 (wi)
6.7 (woi)
0.5 (wi)
0.19 (woi)
4.1 (wi) 76.4 (woi)
Clostridium Butirycum DSM 10,702Mineral salt—glucose0.137N/D60 rpm32.40.49 ± 0.054[40]
Fe3O4 addition40.70.93 ± 0.203.8
Lactate addition38.00.72 ± 0.044.8
Lactate + Fe3O4
addition
51.40.76 ± 0.133.6
Anaerobic sludge blanketBrewery waste and corn waste mixtures0.0835Variable or
6 (initial)
150 rpm106–1670.6–2.11.5–122[41]
Ship wastewater Clostridia,
selected by
thermotolerant evolution
Mineral salt—acetate media5307–8.5
(initial)
4–4.5
(final)
50 rpm204 ± 68 ***2.6 ± 0.6 ***13–29This work
196 ± 44 ****2.2 ± 0.6 ****
* expressed divided by the reactor working volume ** data from references [26,27] analyzed in reference [30]; *** from H, **** from the pH curve.
Publisher’s Note: MDPI stays neutral with regard to jurisdictional claims in published maps and institutional affiliations.

