Article

In-Situ Functionalization of Cotton Fabric by TiO2: The Influence of Application Routes

1
Faculty of Natural Sciences and Engineering, University of Ljubljana, Aškerčeva 12, 1000 Ljubljana, Slovenia
2
National Institute of Chemistry, Hajdrihova 19, 1000 Ljubljana, Slovenia
*
Authors to whom correspondence should be addressed.
Catalysts 2022, 12(11), 1330; https://doi.org/10.3390/catal12111330
Submission received: 7 October 2022 / Revised: 27 October 2022 / Accepted: 28 October 2022 / Published: 31 October 2022
(This article belongs to the Section Photocatalysis)

Abstract

:
The desirable chemical, physical, electronic, and optical properties of TiO2, as well as its high availability, non-toxicity, and low price, make it very popular in the modern functional textile industry. Here, TiO2 from titanium tetraisopropoxide (TTIP) precursors at concentrations of 2, 4, and 6% and commercial TiO2 nanoparticles (NPs) in dispersion form were applied to cotton textiles using low-temperature application methods (i.e., sol–gel pad–dry–cure, pad–hydrothermal, and exhaustion–hydrothermal methods) to provide a systematic study of the influence of low-temperature application processes and TIIP concentration and on the overall properties of TiO2-functionalized textile materials. The treated cotton fabric samples were characterized using scanning electron microscopy (SEM), energy dispersive X-ray analysis (EDS), Fourier transform infrared spectroscopy (FT-IR), and X-ray diffraction spectroscopy (XRD) to determine their surface morphology, chemical composition, and crystal structure, while the optical properties of the synthesized TiO2 were determined using the absorption method and Tauc plotting. Afterwards, corresponding UV protection properties and photocatalytic self-cleaning activity were evaluated. In contrast to commercial TiO2, a relatively thin TiO2 deposition with an amorphous structure and a blue-shifted band gap between 3.18 and 3.28 eV was formed when applied at low temperatures. A sol with a TIIP concentrations of 2 and 4% applied using the exhaustion–hydrothermal and sol–gel dry-cure method, respectively, proved to be optimal. Both applied sol concentrations provided good UV protection and excellent photocatalytic performance, which exceeded that of commercial TiO2, even though the Ti contents in the samples were two- to three-times lower and the synthesized TiO2 exhibited an amorphous structure.

Graphical Abstract

1. Introduction

TiO2 is a promising photocatalyst for surface functionalization due to its advanced electronic properties and worldwide availability. Its global market was estimated at USD 17.12 billion in 2020 [1]. Currently, TiO2—with a band gap energy of 3.2–3.35 eV—is used for various photocatalytic applications, e.g., in water purification [2,3], CO2 reduction [4,5,6], disinfection [7,8,9], agriculture [10,11], food [12,13,14], and energy storage systems [15,16]. In the textile field, TiO2 is known as a multifunctional material that confers various functionalities to textile fibers, such as photocatalytic self-cleaning abilities, antimicrobial activity, UV protection, electrical conductivity, and enhanced thermal stability [17,18,19].
In the functionalization of textiles, TiO2 synthesis can be carried out using various precursors, the most common of which include titanium tetraisopropoxide [15,18,19,20,21,22,23], titanium butoxide [24,25,26], titanium chloride [27,28,29], titanium oxysulfate hydrate [30], ammonium hexafluorotitanate [31], potassium titanium oxalate [32], and tetrabutyl titanate [33]. Both ex-situ and in-situ methods can be used for TiO2 synthesis; however, in-situ synthesis has several advantages. For example, during in-situ synthesis, textile fibers in the TiO2 precursor solution act as stabilizers that prevent the agglomeration of particles, resulting in the uniform distribution of smaller particles. Various synthesis routes have been used; among them, the in-situ sol–gel application technique is frequently utilized for the functionalization of textiles with TiO2 [19,22,24,29]. In addition, in-situ hydrothermal synthesis is also commonly used to produce TiO2 and results in a coating with optimal thickness and the high adhesion of TiO2 to the textile surface [18,20,25,27,32,33]. In addition to surface deposition, TiO2 absorption inside the fibers has also been reported [23]. Moreover, the phase composition, TiO2 particle size, and crystalline homogeneity of the coated cotton fabric can be more precisely controlled with the hydrothermal process. During the hydrothermal process, the nucleation and in-situ growth of TiO2 has been attributed to the strong attraction between the hydroxyl group of cotton and titanium ions, resulting in less particle agglomeration [33]. Aside from TiO2 precursors, commercial TiO2 products in the form of powders or dispersions have also been used for the functionalization of textiles [34,35,36,37]. Commercial TiO2 products have been shown to have some challenges with respect to preparing a stable dispersion and achieving the uniform and thin deposition of TiO2 particles on the fiber surface, as the particles tend to form agglomerates.
The most commonly used technique for obtaining functional textiles involves the immersion of the fabric for a certain time followed by drying, while the pad–dry–cure method has also been investigated due to its simplicity and the ease of particle uptake on the surface [21,22,24,35]. Since TiO2 requires longer contact times due to its rather poor adhesion to the fibers, the exhaustion method is another suitable option for application, despite some disadvantages compared to the pad–dry–cure method, i.e., higher energy consumption, the discontinuity of the process, and the long reaction time of the chemicals with the textile substrate [19,34,35].
Undoubtedly, much research has been conducted on TiO2-functionalized textiles over the last decade. However, to date, this research has mainly focused on improving the adhesion of TiO2 to the textile substrate and enhancing its photocatalytic activity toward visible light through various strategies and approaches, while little attention has been paid to the contribution of TiO2 application routes to the functional properties. Indeed, the morphology, distribution, crystallinity, and Ti concentration on the coated fibers can greatly influence the UV-protective and photocatalytic performance of the functionalized textiles. To the best of our knowledge there is only one research project that investigated the three different process routes, focusing on the influence of precursor concentration and duration of the pad–dry–hydrothermal route on UV protection and self-cleaning properties [38]. However, studied application routes included some limitation of their feasibility on industrial level, i.e., sonication of the samples in the studied sols, which requires the use of specific application equipment and prolonged hydrothermal treatment, which is energy and time consuming. Focusing on the establishment of an in-situ TiO2 application route that would be easily feasible in industry, in this work, the influence of titanium isopropoxide concentration applied via the most common low-temperature application methods, i.e., sol–gel pad–dry–cure, pad–hydrothermal, and exhaustion–hydrothermal, using three different concentrations of the TiO2 precursor, was systematically investigated considering the morphological, chemical, and functional properties of the functionalized cotton fabric in relation to the crystalline and optical properties of the resulting TiO2. For comparison, a commercial TiO2 product applied via a simple pad–dry–cure method was also included.

2. Results and Discussion

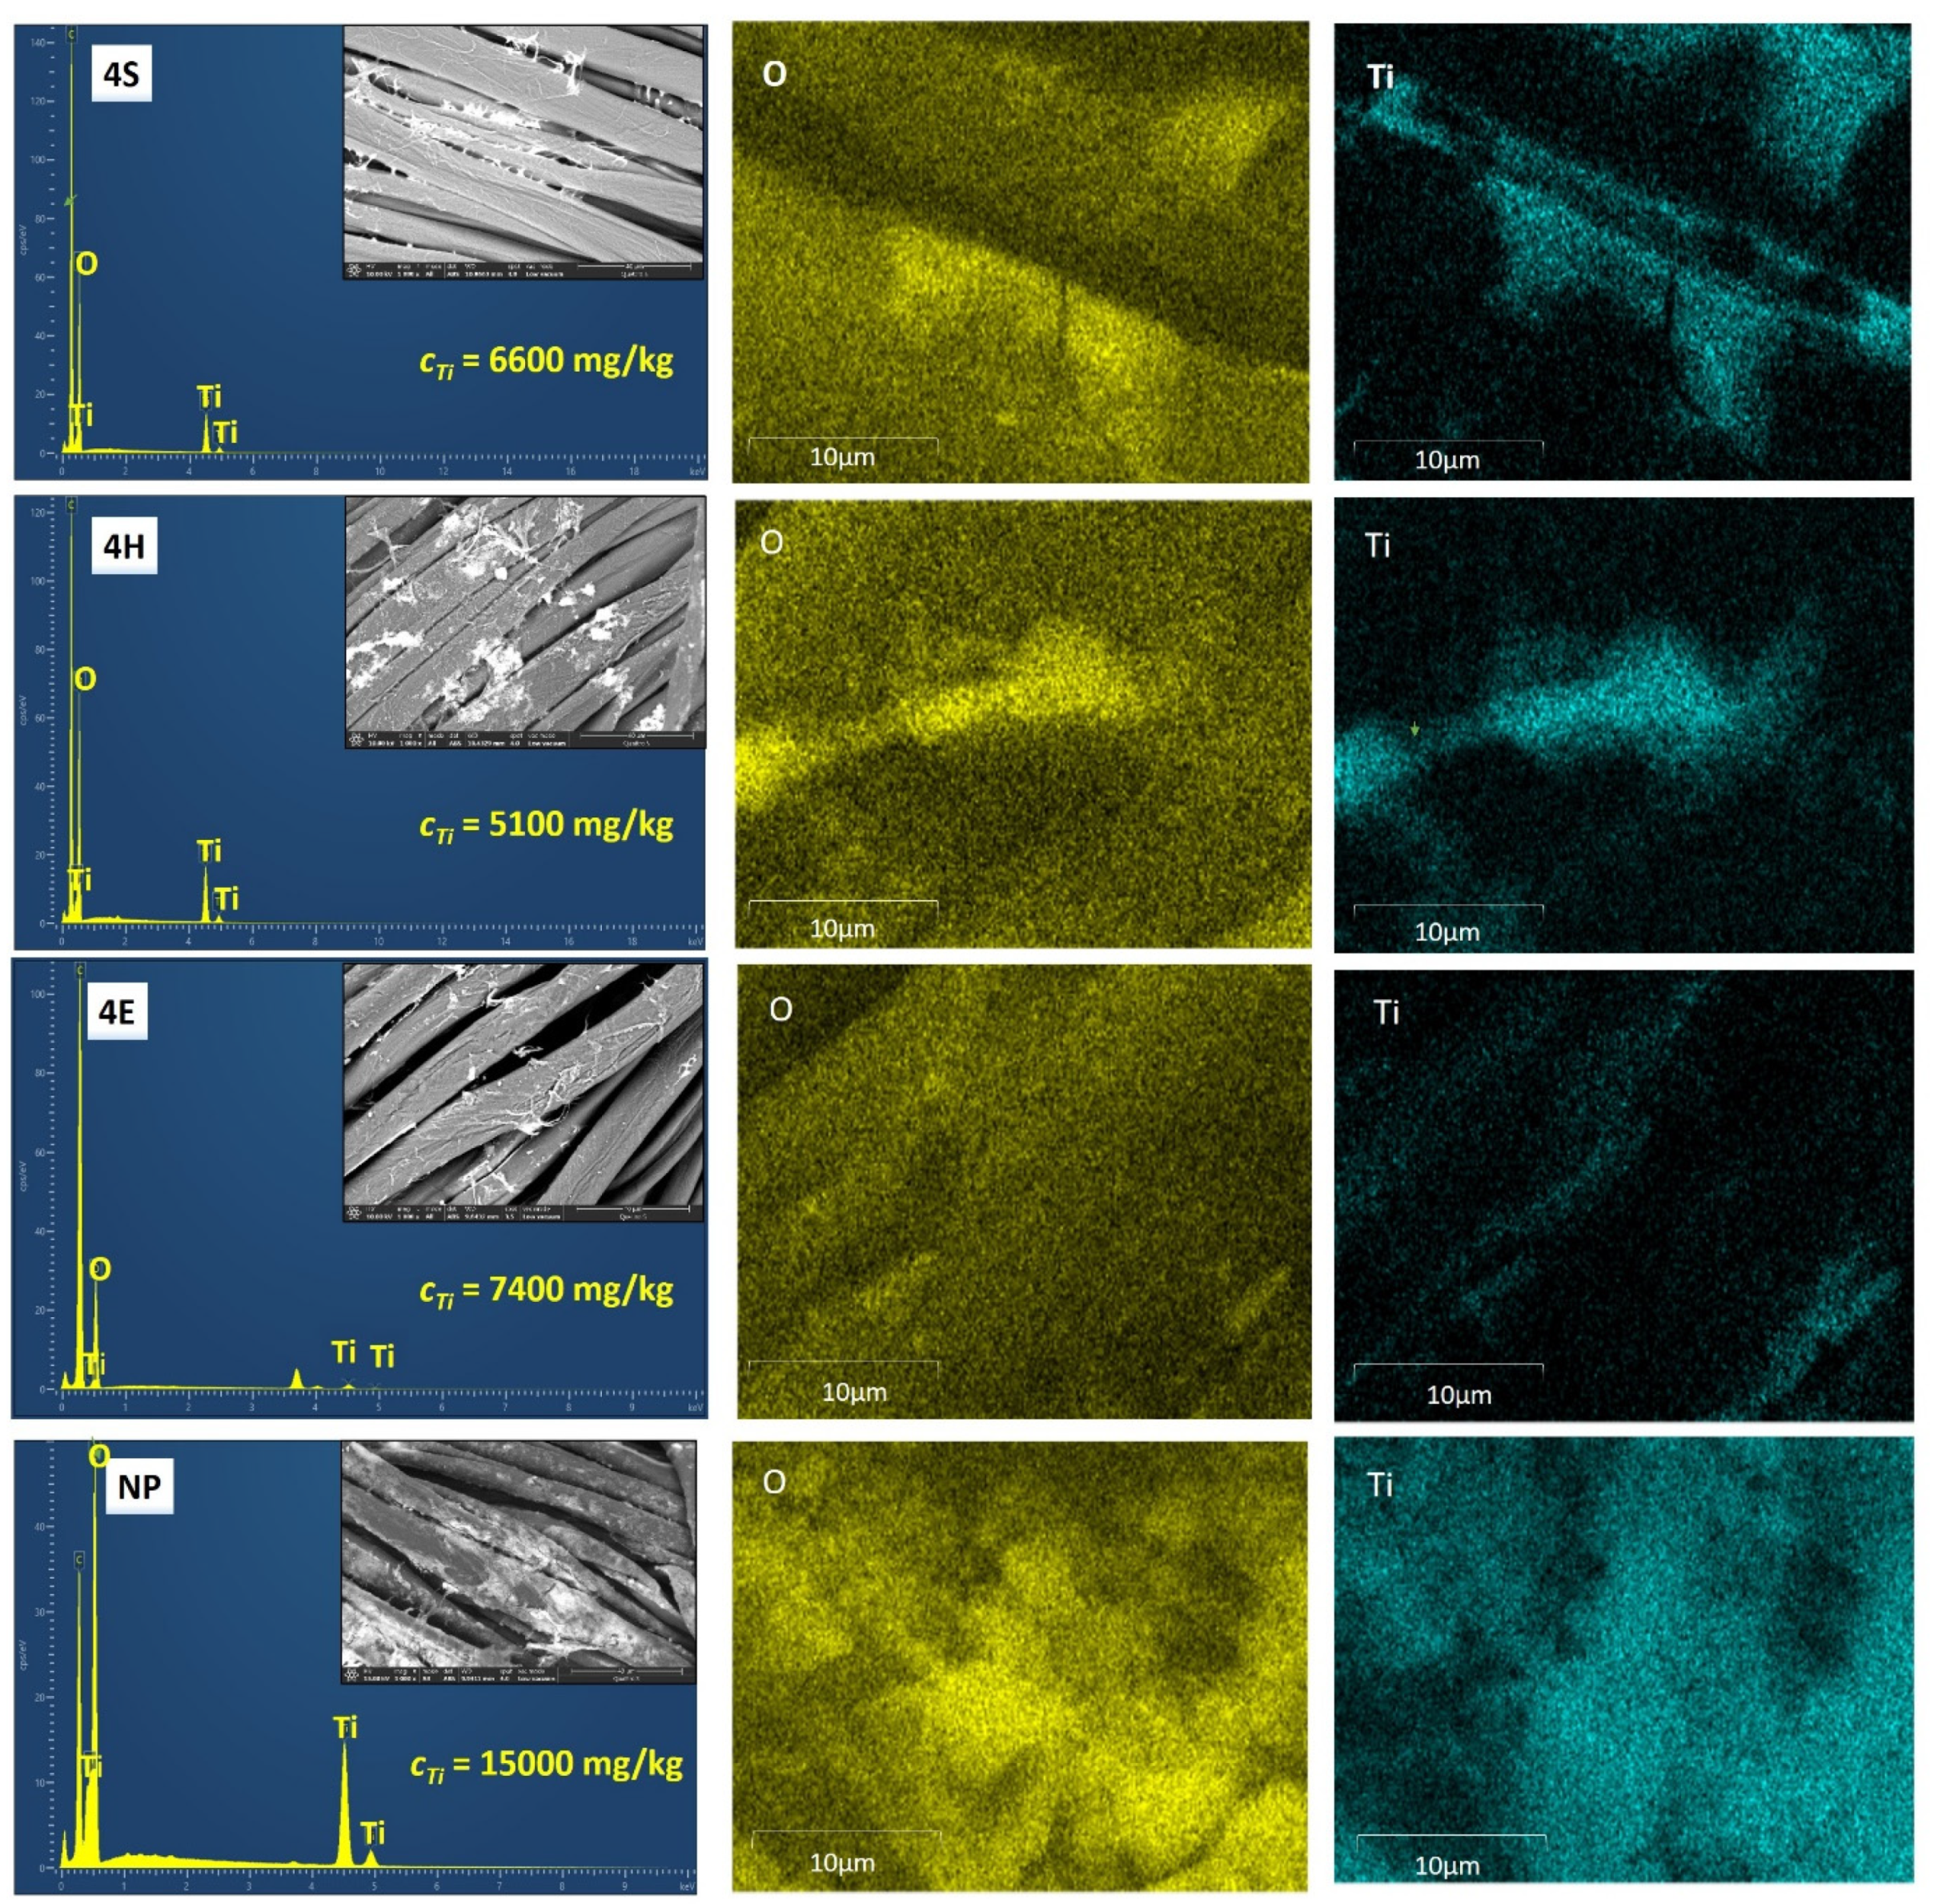
2.1. Morphological and Chemical Properties

The influence of the studied TiO2 nanosols and the methods of their application on the morphological properties of the cotton fibers was studied using SEM and compared to the fibers obtained using commercial TiO2 (Figure 1). While the UN_CO sample exhibited a pristine cotton fabric with a relatively smooth surface, sample NP, which was treated with commercial TiO2, showed a thick film formation with an abundance of agglomerates on the fiber surface. In contrast, the sample treated with studied TiO2 nanosols exhibited a thinner TiO2 deposition. A detailed examination of the corresponding SEM images showed that the TTIP concentration and application method strongly influenced TiO2 uptake and distribution on the fiber surface. Accordingly, the sol–gel pad–dry–cure application route was associated with the formation of a continuous film, while the formation of TiO2 particles was detected on the surface of the fibers of the 2H and 4H samples treated according to the pad–hydrothermal route. In contrast, TiO2 could hardly be perceived on the surface of the xE samples, suggesting that the exhaustion–hydrothermal application route either did not ensure the sufficient uptake of TiO2 on the cotton fibers or that TiO2 penetrated the inner part of the fibers rather than being deposited on their surface.
The results of EDS, shown in Figure 2, confirmed the presence of TiO2, as several peaks for titanium (Ti) were detected in the EDS spectra of the representative samples 4S, 4H, 4E, and NP. The comparatively low peak intensity of the Ti particles was caused by low TiO2 concentration and was thus blurred by the signal of the fabric surface, which was also observed in another study [22]. On the other hand, the high peak intensity of O, which originated from the association of TiO2 nanoparticles, was due to the inherent chemical structure of cellulose; thus, its concentration was comparatively higher on the TiO2-treated samples. EDS elemental mapping also showed that unlike commercial TiO2, which ensures a homogeneous but thick deposition of TiO2, the sol–gel pad–dry–cure and pad–hydrothermal application methods resulted in TiO2 deposition that was mainly concentrated on the perimeter of the fibers (sample 4S and 4H), while on the surface of the fibers of sample 4E, the presence of TiO2 was barely detectable in the EDS analysis.
The presence of TiO2 was further verified by ICP MS analysis which revealed that, of the application routes studied, sample 4E had the highest Ti content, i.e., 7400 mg per kg of fabric, followed by samples 4S and 4H with 6600 and 5100 mg Ti per kg of fabric, respectively. Sample NP contained the highest amount of TiO2, i.e., 15,000 mg Ti per kg of fabric, which is consistent with the SEM images. The high Ti content of sample 4E undoubtedly confirms that exhaustion–hydrothermal application route induces the absorption of TiO2 inside the fibers, since the presence of TiO2 could hardly be detected with EDS, while small particles must have been formed. The lower Ti content of sample 4H compared to sample 4S can be explained by the partial removal of TiO2 during the hydrothermal treatment, as the boiling water became slightly white and turbid after the sample was immersed.
The chemical properties of the untreated and treated samples were studied using FTIR analysis (Figure 3). The IR ATR spectrum of sample UN_CO showed the absorption bands of pure cellulose, i.e., absorption bands in the 3700–3000 cm−1 spectral region ascribed to the –OH vibration of adsorbed water, an absorption band at 2900 cm−1 associated with the CH2 stretching vibrations, and absorption bands in the 1500–800 cm−1 cellulose fingerprint region, indicating C-O-C, C-H, C-O, and O-H vibrations [39]. From the literature, TiO2-related vibrations appear at 700–600 cm−1, 525–460 cm−1, 489 cm−1, and 360–320 cm−1 [26,39]. The IR ATR spectra of the representative samples 4S, 4H, and 4E were not influenced by the TiO2 coating obtained using either the sol–gel curing, hydrothermal, or exhaustion method, as the direct comparison of these spectra with the spectrum of the UN_CO sample did not reveal any significant changes. The reason for this could be small concentration of TiO2, which was blurred by the strong absorption bands of the cellulose. To the contrary, in the IR ATR spectrum of the NP sample, a new absorption band appeared at 430 cm−1, ascribed to Ti-O-Ti stretching. Its occurrence was related to the thick deposition of the TiO2 coating and the highest Ti concentration among the samples studied.
The XRD and Raman spectra of studied cotton fabric samples are shown in Figure 4. From the XRD spectra (Figure 4a), the crystalline cellulosic cotton fabric diffraction peaks can be observed at 2θ =14.9, 16.3, 22.3, and 34.4°, characteristic of the crystallographic planes (110), (110), (200), and (400), respectively, of cellulose [25,40]. The XRD spectrum of the commercial TiO2-treated sample (NP) presented six distinctive diffraction peaks characteristic of TiO2 at 2θ = 37.82, 47.87, 54.3°, 55.2°, 62.43, and 69.0°, corresponding to the (101), (004), (111), (200), (105), (211), (204), and (116) lattice planes, respectively, of anatase crystal [25,40]. No differences were observed between the XRD spectrum of UN_CO and that of samples 4S, 4H, and 4E, suggesting that TiO2 on the surface of these samples existed in the amorphous form. These results were further supported by the analysis of the Raman spectra (Figure 4b). Again, while the anatase-phase TiO2 on the surface of the NP sample was confirmed by the absorption bands at 360, 397, and 518 cm−1 [29,30], the latter was not observed for samples 4S, 4H, and 4E. Accordingly, it was concluded that the commercial TiO2-treated sample (NP) exhibited a crystalline anatase structure, while the synthesis procedures applied for samples 4S, 4H, and 4E resulted in the formation of amorphous TiO2. When conducting a pad–dry–cure application route, the formation of amorphous TiO2 was also confirmed by other researchers [38]. In contrast, the absence of the characteristic anatase TiO2 peaks in the case of sample 4H was a surprise, since in a previous study [23], a few minutes of hydrothermal treatment caused the formation of crystalline TiO2. However, in this case, the XRD analysis was performed on a TiO2 powder synthesized in the same way as for the TiO2 in-situ functionalization of fabric. In many studies, the formation of anatase TiO2 by hydrothermal treatment was confirmed, but a prolonged hydrothermal treatment of at least 1.5 h was required to achieve high crystallinity of TiO2 deposited on the fabric [18,33,38].

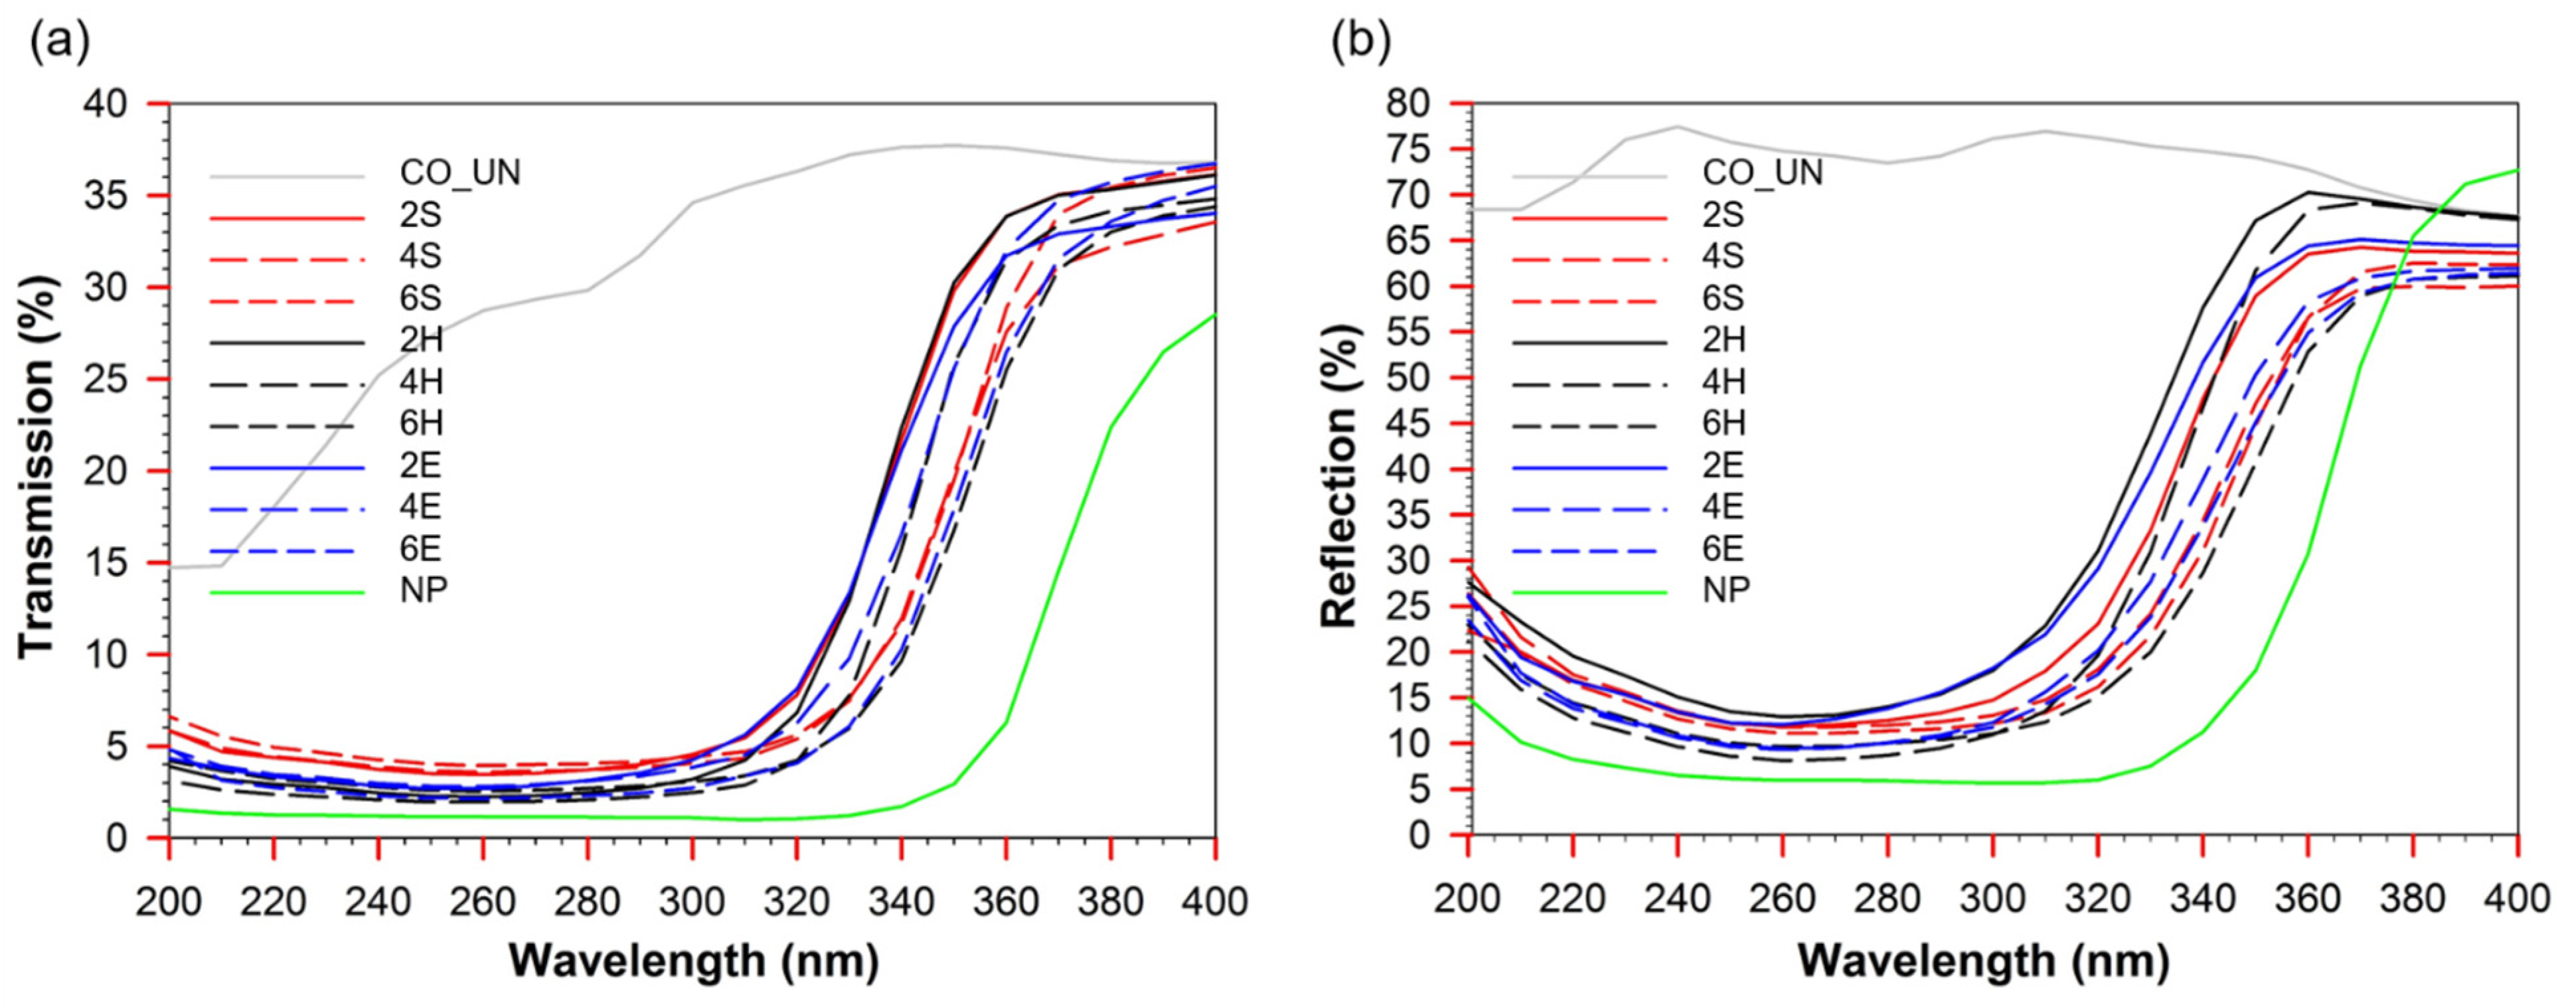
2.2. Optical Properties

The optical properties were studied by analyzing the absorption spectra of the studied samples—NP, 4S, 4H, and 4E—in the spectral range of 200–400 nm (Figure 5). All the studied samples strongly absorbed light in the UV spectral region and showed a broad absorption band with a sharp absorption edge (λg) that varied depending on the TiO2 application route. While the NP sample showed a λg value at 390 nm, samples 4S, 4H, and 4E were blue-shifted to 381, 365, and 376 nm, respectively.
Based on the absorbance values, the energy band gap (Eg) of TiO2 was then determined. According to the literature, Eg can be determined through two methods, either by using the absorption method [41] or by Tauc plotting [42]. In the absorption method, Eg can be acquired using the following relationship:
E g = 1240 λ g ,
where λg is determined from the intercept between the tangent of the absorption curve and the abscissa coordinate.
Using Tauc plotting, Eg can be calculated according to the Tauc and Davis–Mott relationship:
α h ν n = B ( h ν E g ) ,
where B is a constant, α is the absorption coefficient, and is the energy of incident photons. The value of n depends on the nature of the transition, where n = ½ and n = 2 are used for indirect allowed and direct allowed transitions, respectively. Eg can be determined by plotting (αhν)n against (), where the linear portion of the curve is used to extrapolate the value of the Eg.
In the present study, both methods of Eg determination were used; for Tauc plotting, the absorption data were fitted for both indirect (n = ½) and direct (n = 2) transitions. As can be seen from the results in Figure 5 and in Table 1, using the absorption edge method, the commercial TiO2 showed a perfect fit for Eg of 3.2, which corresponds to the band gap of bulk TiO2 with an anatase structure [43]. Due to the blue shift of λg, the synthesized TiO2 samples showed an increasingly wider Eg in the following order: 4S < 4E < 4H. Indirect fitting using a Tauc plot yielded Eg values of 2.91–3.07 eV. Indeed, the Eg of the commercial sample (NP) was comparable to that of P25 TiO2 determined by Yu et al. [44]. The lower Eg value of 2.95 eV for P25, compared to 3.2 eV for the bulk anatase form, can be explained by the presence of very fine particles with about 25% rutile content in P25. In our case, the narrowest Eg of 2.91 eV was determined for sample NP, followed by samples 4E, 4S, and 4H. However, given that the Eg values of samples 4S and 4E were determined to be approximately the same while no crystal structure was detected by XRD, these values are too low and do not seem realistic.
Better agreement with the Eg values determined by the absorption edge method was obtained with Tauc plotting using direct band gap fitting, which is also consistent with previous reports [45,46,47]. In this case, a slightly higher Eg value of 3.28 eV was obtained for sample NP, while sample 4S again had the most comparable Eg to that of commercial TiO2 (i.e., 3.45 eV). Samples 4H and 4E exhibited wider Eg values of 3.55 eV and 3.51 eV, respectively. The increase in the Eg of the synthesized TiO2 suggests differences in the structures of the synthesized TiO2 [48]. While differences in Eg values between the NP sample and those of synthesized TiO2 are most likely due to anatase vs. amorphous TiO2, the differences in Eg between samples treated with synthesized TiO2 imply a certain common structure of TiO2 formed by the pad–hydrothermal and exhaustion–hydrothermal methods, as 4H and 4E demonstrated an almost identical Eg.

2.3. Functional Properties

2.3.1. UV Protection

To evaluate the UV protection properties of the untreated and treated cotton textiles, the ultraviolet protection factor (UPF) values were determined based on the transmittance measurements (Figure 6a) and are presented in Table 2. The untreated cotton sample UN_CO had a UPF of only 4.2. Despite its high reflectance (Figure 6b), due to the bleaching process of the raw cotton, and associated high light emission, a high UV transmittance of 27.7% in the UVA range and 22.0% in the UVB range makes it unsuitable for protection against solar UV light. TiO2 absorbs UV light and thus increased the UPF value of the studied samples. Accordingly, the UPF of the treated samples increased and provided “good” to “very good” UV protection. For the xS and xH samples, a TTIP concentration of 4% in the sol provided the highest UV protection, mainly due to the strong reduction in light transmission and reflection, especially in the UVB range. Accordingly, a high UVB-blocking ability of 97.7% was observed for the 4S sample and 98.3% for the 4H sample, corresponding to UPFs of 29.6 and 30.3, respectively, thus providing “very good” UV protection. Interestingly, further increasing the TTIP concentration in the sol to 6% (samples 6S and 6H) did not further increase the UPF but resulted in a slight deterioration of the UV protection properties. For the xE samples, the UPF gradually increased with increasing TTIP concentration in the sol. However, even at the highest TTIP concentration (6%) in the sol, a UPF of 24.4 was obtained for sample 6E, providing “good” UV protection despite the highest Ti content compared to samples xS and xH. With a UPF value of 55.8, sample NP provided “excellent” UV protection, with a sharp decrease in light transmission from UVA and UVB (Figure 6a). Accordingly, 91.2% UVA- and 98.6% UVB-blocking were determined for this sample. This is a reflection of the crystalline anatase structure of commercial TiO2, which absorbs UV radiation more actively [49] than synthesized amorphous TiO2. Nevertheless, compared to samples 4S, 4H, and 4E, sample NP had 2.3, 2.9 and 2.0 higher Ti content, respectively, and thus a much thicker deposition, which also contributed to its excellent UV protective effect. Nonetheless, “good” to “very good” UV protection provided by the xS and xH samples functionalized according to the sol–gel pad–dry–cure and pad–hydrothermal application routes is in good agreement with results obtained by others [22,23,32,38]. Therefore, despite the low deposition and amorphous structure of TiO2, synthesized TiO2 provided satisfactory UV protection, which exceeded our expectations considering that the TiO2 synthesis was performed at a low temperature compared to the energy-consuming calcination process of commercial TiO2 at high temperatures, which assures the formation of anatase TiO2 with a high UV-absorbing capacity

2.3.2. Self-Cleaning

The photocatalytic self-cleaning efficiency of the studied cotton samples was investigated based on the degradation of MB dye under illumination at different time intervals of 15, 30, 45, 60, and 90 min. The results are shown in Figure 7. In general, the degradation of MB on the surface of the studied samples increased with increasing illumination time. This phenomenon was also observed in the CO_UN sample but could be attributed to the lower light-fastness of the MB dye, since all samples treated with TiO2 showed a much higher intensity of degradation of MB, regardless of the application method and illumination time. Indeed, TiO2 is a strong oxidant for organic contaminants, and reactive oxygen species (ROS, i.e., superoxide, excited oxygen, and hydroxyl radicals) can be formed on the surface of TiO2 particles in the presence of UV light. The generated ROS trigger the oxidation of the MB dye via various intermediates to the final products CO2, H2O, SO42−, NH4+, and NO3, which causes the self-cleaning of the stained surface. As can be seen from the results in Figure 7a, the TTIP concentration and application route affected the generation of ROS and thus self-cleaning activity. The examination of the results after the initial time interval for visible light exposure of 15 min revealed the highest self-cleaning activity for sample NP followed by samples 4S, 4H, and 2E, which degraded 52.3, 51.0, 44.3, and 39.7% of the MB dye, respectively. This agrees well with the results of the band gap energy determination, where the narrowest values, indicating higher photocatalytic activity, were determined for samples NP and 4S. The decreased degradation of the MB dye on the surface of sample xE at the beginning of visible illumination again implied the delayed photocatalytic degradation of the dye as ROS needed to pass from the inner parts to the surface of the fibers. At the end of the illumination period (Figure 7b), samples 2E and 4S showed the highest photocatalytic degradation of the MB dye, at 80.0 and 79.9%, respectively. Such a high photocatalytic activity of sample 2E, despite two times lower concentration of the TTIP precursor than that for sample 4S, can confirm the formation of very small sized TiO2 particles during exhaustion–hydrothermal application route. Namely, it is well known that the photocatalytic activity of TiO2 particles is size-dependent, whereas smaller TiO2 particles reflect greater ROS formation due to a high specific surface area. As for sample 4S, a TiO2 film was formed on the surface of the fibers with a large surface area but a lower surface-to-volume ratio, and thus a higher Ti concentration was required to achieve comparable photocatalytic activity. Due to the highest Ti content and the crystalline anatase form of commercial TiO2, it was expected that sample NP would demonstrate the highest photocatalytic self-cleaning activity among the samples studied. However, this was not the case, as a comparable MB dye degradation activity, i.e., 77.1%, was obtained at the end of the experiment, which was due to the formation of large agglomerates on the surface of the sample NP, as confirmed by SEM. Accordingly, due to the amorphous structure of the synthesized TiO2, the formation of ROS was most likely delayed, which would explain the lower self-cleaning activity of samples xS, xH, and xE at the beginning of illumination. With increasing illumination time, the levels of ROS continued to increase and finally exceeded the photocatalytic activity of the commercial TiO2. Namely, it has been suggested that amorphous TiO2 is an excellent mediator for electron transfer from excited dyes to oxygen, which is attributed to the enhanced light harvesting and high specific surface area, due to a certain disordered structure and isotropic physical and chemical properties [50]. Accordingly, higher visible light induced photosensitized dye degradation of amorphous TiO2 compared to crystallized TiO2 was also obtained by others [51]. Undoubtedly, the obtained results confirm that a simple low-temperature synthesis can result in the formation of TiO2 with better photocatalytic self-cleaning activity than commercial TiO2, despite the amorphous nature of TiO2 and two- to three-times lower Ti content. Among the application routes studied, the simple sol–gel pad–dry–cure and exhaustion methods using TTIP concentrations of 4 or 2% proved to be the best.

3. Materials and Methods

3.1. Materials

Woven 100% cotton fabric was purchased from Tekstina tekstilna industrija d.o.o. (Ajdovščina, Slovenia). The warp thread, weft thread, and fabric density were 51 threads/cm, 31 threads/cm, and 120 g/m2, respectively. Titanium isopropoxide (concentration ≥ 97.0%) with a molecular weight of 284.22 and density of 0.96 g/mL (at 20 °C) was purchased from Sigma Aldrich (St. Louis, MO, USA. Commercial TiO2 NPs in dispersion form with a crystal size of 5 nm and density of 1.2 g/cm3 were purchased from Cinkarna metalurško kemična industrija Celje, dd (Celje, Slovenia). The pH of the dispersion solution was maintained at 7–9. Ethanol (concentration ≥ 99.8 %) and glacial acetic acid were supplied from Honeywell research chemical (Seetze, Germany) and CARLO ERBA reagents S.A.S (Barcelona, Spain), respectively. All chemicals were used without further modification.

3.2. Preparation of TiO2 Nanosols and Their Application to Cotton Fabric

TiO2 nanosols were prepared by mixing TTIP in ethanol to obtain concentrations of 2, 4, and 6%. Immediately, the corresponding amount of glacial acetic acid was added dropwise into the TiO2 nanosols under constant stirring, where the mass ratio between TTIP and glacial acid was set at 7:1. Afterwards, the TiO2 nanosols were vigorously stirred for 120 min.
The TiO2 nanosols were applied to the cotton fabric using different application routes, i.e., sol–gel pad–dry–cure, pad–hydrothermal, and exhaustion–hydrothermal methods. In the sol–gel pad–dry–cure and pad–hydrothermal routes, impregnation was first performed by immersing the cotton samples in the corresponding TiO2 nanosols for 3 min, followed padding on a two-roller padder (Mathis, Switzerland), with a pressure of 0.8 bars to obtain 80 ± 2% wet pick-up. For the pad–dry–cure application route, the samples were dried at 100 °C for 1 min and cured at 140 °C for 5 min in the laboratory dryer (Mathis, Switzerland). These samples were named 2S, 4S, and 6S, corresponding to the concentration of TIIP in the TiO2 nanosol. For the pad–dry–hydrothermal application route, the impregnated samples were firstly dried in the same conditions previously mentioned followed by immersion in boiling water for 30 min using a liquid-to-good ratio of 1:50. Afterwards, the samples were rinsed with deionized water and left to air dry. These samples were named 2H, 4H, and 6H. For the exhaustion–hydrothermal application route, the samples were immersed in the corresponding TiO2 nanosols for 1 h under constant stirring in a Gyrowash (James Heal, Great Britain). The liquid-to-good ratio was set as 1:50. Afterwards, the samples were squeezed on a two-roller padder using the same settings described above; thus, the same wet pick-up of 80 ± 2% was achieved. Finally, the samples were dried and hydrothermally treated, similar to the pad–hydrothermal application. These samples were named 2E, 4E, and 6E.
For the purpose of comparison, commercial TiO2 was also applied to the cotton fabric using the pad–dry–cure method. A commercial TiO2 NP dispersion was diluted to 2.5% with double-distilled water and stirred vigorously for 2h, followed by the impregnation, padding, drying, and curing of the samples in the same conditions as previously described. The sample was designated as NP. The details of the application process, along with the sample codes, are presented in Table 3. The schematic presentation of the studied in-situ low-temperature application routes is shown in Figure 8.

3.3. Characterization of TiO2 Modified Fabric

3.3.1. Scanning Electron Microscopy (SEM)

The surface morphology of the functionalized cotton samples was studied by a scanning electron microscope SEM-6060 LV (JEOL, Tokyo, Japan) operating at a 10 kV acceleration voltage. A thin Au/Pt coating layer was applied for the sufficient electrical conductivity during measurement procedures.

3.3.2. Energy Dispersive Field Emission Scanning Electron Microscopy (EDS)

To investigate the chemical properties of the studied cotton samples, a Thermo Fisher Scientific Quattro S (Thermo Fisher Scientific, Waltham, MA, USA) energy dispersive field emission scanning electron microscope (FEG-SEM) working at an accelerating voltage of 1 kV in high vacuum using a concentric backscattered electron detector (CBS) was used. An energy dispersive X-ray detector (EDS; Oxford Instruments, Santa Barbara, CA, USA) was used to analyze the chemical composition of the observed particles using Aztec software. EDS spectra and elemental mappings of O and Ti were obtained. Prior to analysis, a thin conductive carbon layer was applied to the cotton samples.

3.3.3. Inductively Coupled Plasma-Mass Spectroscopy (ICP MS)

The total Ti content in the studied fabric samples was determined by inductively coupled plasma-mass spectroscopy (ICP MS) using a PerkinElmer SCIED Elan DRC spectrophotometer. A sample of 0.5 g was prepared in a Milestone microwave system by acid decomposition with 65% HNO3 and 30% H2O2. Titanium concentrations values are given as the mean of two measurements made for each sample.

3.3.4. X-ray Diffraction (XRD)

The XRD characterization of the untreated cotton sample and Ag-containing functionalized cotton samples was performed using a PANalytical X’Pert PRO X-ray diffractometer (XRD, Malvern PANalytical Ltd., Almelo, The Netherlands) (CuK∝1 = 1.5406 Å) with a fully open X’Celerator detector (2.122° 2θ). The XRD pattern was measured from 10 to 70° 2θ with a step size of 0.034° 2θ and an integration time of 100 s.

3.3.5. Raman Spectroscopy

The Raman spectra of TiO2 functionalized cotton textile were recorded using a WITec alpha300 RA spectrometer (Ulm, Germany) equipped with a microscope. A laser of 532 nm excitation wavelength, power of 12 mW, and the 50 × objective was considered for the spectral region of 3600–200 cm−1, and the final data were normalized.

3.3.6. Fourier Transform-Infrared (FT-IR) Spectroscopy

The infrared spectra of the studied cotton samples was performed with a Vertex 70V (Bruker, Bremen, Germany), integrated with an attenuated total reflection (ATR) accessory (Bruker, Germany) with a diamond crystal (n = 2.0). The spectra were recorded over the range of 4000–300 cm−1 with a resolution of 4 cm−1 and an average set of 128 spectra per sample.

3.3.7. UV Protection Property

The UV protective properties of the studied TiO2 treated cotton fabric samples were determined according to the according to the AATCC TM 183 standard by measuring the transmission and reflection properties of the samples using a Lambda 800 UV/Vis spectrophotometer (Perkin Elmer, Buckinghamshire, UK). Three measurements of transmittance, T, and reflectance, R, were obtained in the wavelength range of 200–800 nm at different angles of the sample warp alignment. For the determination of the UV protection factor (UPF), average transmittances were calculated at wavelengths of 315–400 nm (UV-A) and 280–315 (UV-B). The UPF was calculated using the following equation:
U P F = λ = 280 400 E λ · S λ · Δ λ λ = 280 400 E λ · S λ · T λ · Δ λ
where Eλ is the relative erythermal spectral effectiveness, Sλ is the solar spectral irradiance, Tλ is the spectral transmittance of the specimen, and ∆λ is the measured wavelength interval in nm.
Based on the obtained UPF values, the UV protection categories were determined according to the Australian/New Zealand Standard Sun protective clothing Evaluation and Classification (AS/NZS, 2017). Accordingly, UPF values of 15–24 correspond to a protection category of “good”; UPF values of 25–39 correspond a protection category of “very good”; UPF values of 40–50 and 50 and above correspond to a protection category of “excellent”.

3.3.8. Self-Cleaning Activity

TiO2-treated cotton fabric samples were stained with 0.05% methylene blue (MB) (Sigma Aldrich, St. Louis, MO, USA) water solution and illuminated by a Xenotest Alpha instrument (Atlas, Mount Prospect, IL, USA) equipped with a visible xenon arc lamp (radiation attitude of 0.8–2.5 kVA and extended radiation range of 300–400 nm). The studied samples were illuminated for 30, 60, 90, 120, and 180 min. After illumination, the degradation of the dye was assessed based on the reflectance, R, of the studied samples, measured with a Datacolor Spectraflash SF 600 spectrophotometer using D 65/10 light. For each sample, ten measurements of the R-value were obtained, and the corresponding K/S values were calculated according to the Kubelka–Munk equation:
K S = ( 1 R ) 2 2 R
where K/S is the ratio of the coefficient of light absorption (K) to the coefficient of light scattering (S) and R is the reflectance at the maximum absorption wavelength determined at 610 nm.
Based on the K/S values, MB dye degradation, D, due to the photocatalytic activity of TiO2 was determined using the following equation:
D = ( 1 K S t K S 0 ) × 100   ( % )
where (K/S)0 is the K/S value of the sample before illumination and (K/S)t is the K/S value of the sample after a certain illumination time.

4. Conclusions

The in-situ low-temperature application routes affected the morphology, optical, and functional properties of the cotton fibers, which were significantly different from those obtained with commercial TiO2. Important conclusions from the results are the following:
-
Commercial anatase TiO2 with a narrow band gap formed a rather thick layer with a high add-on level and the presence of agglomerates on the surface of the cotton fibers, which granted excellent UV protection with a UPF of 50+ but resulted in a slight impairment of the self-cleaning activity.
-
The low-temperature in-situ application routes studied resulted in the formation of amorphous TiO2 with blue-shifted bandgap energies and greatly reduced Ti content, but with different morphology. While the sol–gel pad–dry–cure method resulted in the formation of a TiO2 film on the fiber surface, the pad–hydrothermal method induced a combination of TiO2 particles and continuous film formation, while the TiO2 particles were mainly absorbed inside the fibers in the exhaustion–hydrothermal method.
-
Very good UV protection was obtained with 4% TTIP sol applied via the sol–gel pad–dry–cure or pad–hydrothermal routes, while the samples treated with 2 and 4% TTIP sol applied via the exhaustion–hydrothermal and sol–gel pad–dry–cure methods, respectively, exhibited the highest self-cleaning activity during visible light illumination time, exceeding that of commercial TiO2.
All the investigated in-situ low-temperature application routes showed high practical potential with lower energy and chemical consumption, which brings them in line with sustainable development guidelines.

Author Contributions

Investigation, Formal analysis, Writing—original draft M.M.R.; Conceptualization, Methodology, Supervision, Writing—review & editing B.T.; Conceptualization, Writing—review & editing, Funding acquisition B.S.; Investigation, Conceptualization, Writing—review & editing I.J.; Investigation, Writing—review & editing M.Z. All authors have read and agreed to the published version of the manuscript.

Funding

This work was supported by the Slovenian Research Agency (Programs P2-0213 and P2-0393, Infrastructural Centre RIC UL-NTF).

Data Availability Statement

Not applicable.

Acknowledgments

The Authors thank Aleš Nagode for the support in the EDS analysis and Edi Kranjc for the XRD measurements.

Conflicts of Interest

The authors declare no conflict of interest. The funders had no role in the design of the study; in the collection, analyses, or interpretation of data; in the writing of the manuscript; or in the decision to publish the results.

References

  1. Rahimi, N.; Pax, R.A.; Gray, E.M.A. Review of Functional Titanium Oxides. I: TiO2 and Its Modifications. Prog. Solid State Chem. 2016, 44, 86–105. [Google Scholar] [CrossRef]
  2. Saravanan, N.; Sasikumar, K.S.K. Waste Water Treatment Process Using Nano TiO2. Mater. Today Proc. 2020, 33, 2570–2572. [Google Scholar] [CrossRef]
  3. Perović, K.; dela Rosa, F.M.; Kovačić, M.; Kušić, H.; Štangar, U.L.; Fresno, F.; Dionysiou, D.D.; Loncaric Bozic, A. Recent Achievements in Development of TiO2-Based Composite Photocatalytic Materials for Solar Driven Water Purification and Water Splitting. Materials 2020, 13, 1338. [Google Scholar] [CrossRef] [PubMed] [Green Version]
  4. Wang, L.; Jin, P.; Duan, S.; She, H.; Huang, J.; Wang, Q. In-Situ Incorporation of Copper(II) Porphyrin Functionalized Zirconium MOF and TiO2 for Efficient Photocatalytic CO2 Reduction. Sci. Bull. 2019, 64, 926–933. [Google Scholar] [CrossRef] [Green Version]
  5. Mendieta-Reyes, N.E.; Cheuquepán, W.; Rodes, A.; Gómez, R. Spectroelectrochemical Study of CO2 Reduction on TiO2 Electrodes in Acetonitrile. ACS Catal. 2020, 10, 103–113. [Google Scholar] [CrossRef]
  6. Torres, J.A.; Nogueira, A.E.; Da Silva, G.T.S.T.; Lopes, O.F.; Wang, Y.; He, T.; Ribeiro, C. Enhancing TiO2 Activity for CO2 Photoreduction through MgO Decoration. J. CO2 Util. 2020, 35, 106–114. [Google Scholar] [CrossRef]
  7. Mukherjee, K.; Acharya, K.; Biswas, A.; Jana, N.R. TiO2 Nanoparticles Co-Doped with Nitrogen and Fluorine as Visible-Light-Activated Antifungal Agents. ACS Appl. Nano Mater. 2020, 3, 2016–2025. [Google Scholar] [CrossRef]
  8. Suchea, M.P.; Tudose, I.V.; Koudoumas, E.; Tiganescu, V.; Codita, I. TiO2-Based Nanostructured Materials with Germicidal Properties and Other Applications in Biomedical Fields; Elsevier Inc.: Amsterdam, The Netherlands, 2019; ISBN 9780128144022. [Google Scholar]
  9. Rokicka-Konieczna, P.; Wanag, A.; Sienkiewicz, A.; Kusiak-Nejman, E.; Morawski, A.W. Antibacterial Effect of TiO2 Nanoparticles Modified with APTES. Catal. Commun. 2020, 134, 105862. [Google Scholar] [CrossRef]
  10. Rodríguez-González, V.; Terashima, C.; Fujishima, A. Applications of photocatalytic titanium dioxide-based nanomaterials in sustainable agriculture. J. Photochem. Photobiol. C Photochem. Rev. 2019, 40, 49–67. [Google Scholar] [CrossRef]
  11. Mattiello, A.; Marchiol, L. Application of nanotechnology in agriculture: Assessment of TiO2 nanoparticle effects on barley. In Application of Titanium Dioxide; Janus, M., Ed.; InTech: Rijeka, Croatia, 2017; pp. 23–39. ISBN 9789535134305. [Google Scholar]
  12. Cortes, V.; Sanchez, K.; Gonzalez, R.; Alcoutlabi, M.; Ortega, J.A. The Performance of SiO2 and TiO2 Nanoparticles as Lubricant Additives in Sunflower Oil. Lubricants 2020, 8, 10. [Google Scholar] [CrossRef]
  13. Bachler, G.; von Goetz, N.; Hungerbuhler, K. Using physiologically based pharmacokinetic (PBPK) modeling for dietary risk assessment of titanium dioxide (TiO2) nanoparticles. Nanotoxicology 2015, 9, 373–380. [Google Scholar] [CrossRef] [PubMed]
  14. Weir, A.; Westerhoff, P.; Fabricius, L.; Hristovski, K.; Von Goetz, N. Titanium dioxide nanoparticles in food and personal care products. Environ. Sci. Technol. 2012, 46, 2242–2250. [Google Scholar] [CrossRef] [PubMed] [Green Version]
  15. Sajjad, M.; Shah, M.Z.U.; Javed, M.S.; Shah, M.S.; Shah, A.; Lu, W.; Mao, Z. A novel high-performance all-solid-state asymmetric supercapacitor based on CuSe nanoflakes wrapped on vertically aligned TiO2 nanoplates nanocomposite synthesized via a wet-chemical method. J. Energy Storage 2022, 55, 105304. [Google Scholar] [CrossRef]
  16. Javed, M.S.; Lei, H.; Wang, Z.; Liu, B.; Cai, X.; Mai, W. 2D V2O5 nanosheets as a binder-free high-energy cathode for ultrafast aqueous and flexible Zn-ion batteries. Nano Energy 2020, 70, 104573. [Google Scholar] [CrossRef]
  17. Rashid, M.M.; Simončič, B.; Tomšič, B. Recent Advances in TiO2-Functionalized Textile Surfaces. Surf. Interfaces 2021, 22, 100890. [Google Scholar] [CrossRef]
  18. Rashid, M.M.; Tomšič, B.; Simončič, B.; Jerman, I.; Štular, D.; Zorc, M. Sustainable and Cost-Effective Functionalization of Textile Surfaces with Ag-Doped TiO2/Polysiloxane Hybrid Nanocomposite for UV Protection, Antibacterial and Self-Cleaning Properties. Appl. Surf. Sci. 2022, 595, 153521. [Google Scholar] [CrossRef]
  19. Shaheen, T.I.; Salem, S.S.; Zaghloul, S. A New Facile Strategy for Multifunctional Textiles Development through in Situ Deposition of SiO2/TiO2 Nanosols Hybrid. Ind. Eng. Chem. Res. 2019, 58, 20203–20212. [Google Scholar] [CrossRef]
  20. Hu, J.; Gao, Q.; Xu, L.; Wang, M.; Zhang, M.; Zhang, K.; Liu, W.; Wu, G. Functionalization of Cotton Fabrics with Highly Durable Polysiloxane-TiO2 Hybrid Layers: Potential Applications for Photo-Induced Water-Oil Separation, UV Shielding, and Self-Cleaning. J. Mater. Chem. A 2018, 6, 6085–6095. [Google Scholar] [CrossRef]
  21. Ahmad, I.; Kan, C.W.; Yao, Z. Photoactive Cotton Fabric for UV Protection and Self-Cleaning. RSC Adv. 2019, 9, 18106–18114. [Google Scholar] [CrossRef] [Green Version]
  22. Pakdel, E.; Daoud, W.A.; Afrin, T.; Sun, L.; Wang, X. Enhanced Antimicrobial Coating on Cotton and Its Impact on UV Protection and Physical Characteristics. Cellulose 2017, 24, 4003–4015. [Google Scholar] [CrossRef]
  23. Tomšič, B.; Jovanovski, V.; Orel, B.; Mihelčič, M.; Kovač, J.; Francetič, V.; Simončič, B. Bacteriostatic Photocatalytic Properties of Cotton Modified with TiO2 and TiO2/Aminopropyltriethoxysilane. Cellulose 2015, 22, 3441–3463. [Google Scholar] [CrossRef]
  24. Zheng, C.; Zhou, C.E.; Qi, Z.; Zhou, Q.; Wang, C. Microwave-Assisted Preparation of Pyrite and Its Sensitisation of Titanium Dioxide in Self-Cleaning Aramid Fabrics. Color. Technol. 2018, 134, 284–291. [Google Scholar] [CrossRef]
  25. Ibrahim, M.M.; Mezni, A.; El-Sheshtawy, H.S.; Abu Zaid, A.A.; Alsawat, M.; El-Shafi, N.; Ahmed, S.I.; Shaltout, A.A.; Amin, M.A.; Kumeria, T.; et al. Direct Z-Scheme of Cu2O/TiO2 Enhanced Self-Cleaning, Antibacterial Activity, and UV Protection of Cotton Fiber under Sunlight. Appl. Surf. Sci. 2019, 479, 953–962. [Google Scholar] [CrossRef]
  26. Morshed, M.N.; Shen, X.; Deb, H.; Azad, S.A.; Zhang, X.; Li, R. Sonochemical Fabrication of Nanocryatalline Titanium Dioxide (TiO2) in Cotton Fiber for Durable Ultraviolet Resistance. J. Nat. Fibers 2020, 17, 41–54. [Google Scholar] [CrossRef]
  27. Stan, M.S.; Nica, I.C.; Popa, M.; Chifiriuc, M.C.; Iordache, O.; Dumitrescu, I.; Diamandescu, L.; Dinischiotu, A. Reduced Graphene Oxide/TiO2 Nanocomposites Coating of Cotton Fabrics with Antibacterial and Self-Cleaning Properties. J. Ind. Text. 2019, 49, 277–293. [Google Scholar] [CrossRef]
  28. Stan, M.S.; Badea, M.A.; Pircalabioru, G.G.; Chifiriuc, M.C.; Diamandescu, L.; Dumitrescu, I.; Trica, B.; Lambert, C.; Dinischiotu, A. Designing Cotton Fibers Impregnated with Photocatalytic Graphene Oxide/Fe, N-Doped TiO2 Particles as Prospective Industrial Self-Cleaning and Biocompatible Textiles. Mater. Sci. Eng. C 2019, 94, 318–332. [Google Scholar] [CrossRef] [PubMed]
  29. Acayanka, E.; Tarkwa, J.B.; Nchimi, K.N.; Voufouo, S.A.Y.; Tiya-Djowe, A.; Kamgang, G.Y.; Laminsi, S. Grafting of N-Doped Titania Nanoparticles Synthesized by the Plasma-Assisted Method on Textile Surface for Sunlight Photocatalytic Self-Cleaning Applications. Surf. Interfaces 2019, 17, 100361. [Google Scholar] [CrossRef]
  30. Zahid, M.; Papadopoulou, E.L.; Suarato, G.; Binas, V.D.; Kiriakidis, G.; Gounaki, I.; Moira, O.; Venieri, D.; Bayer, I.S.; Athanassiou, A. Fabrication of Visible Light-Induced Antibacterial and Self-Cleaning Cotton Fabrics Using Manganese Doped TiO2 Nanoparticles. ACS Appl. Bio Mater. 2018, 1, 1154–1164. [Google Scholar] [CrossRef]
  31. Cheng, D.; He, M.; Ran, J.; Cai, G.; Wu, J.; Wang, X. In Situ Reduction of TiO2 Nanoparticles on Cotton Fabrics through Polydopamine Templates for Photocatalysis and UV Protection. Cellulose 2018, 25, 1413–1424. [Google Scholar] [CrossRef]
  32. Li, S.; Zhu, T.; Huang, J.; Guo, Q.; Chen, G.; Lai, Y. Durable Antibacterial and UV-Protective Ag/TiO2@fabrics for Sustainable Biomedical Application. Int. J. Nanomed. 2017, 12, 2593–2606. [Google Scholar] [CrossRef]
  33. Dong, P.; Cheng, X.; Huang, Z.; Chen, Y.; Zhang, Y.; Nie, X.; Zhang, X. In-Situ and Phase Controllable Synthesis of Nanocrystalline TiO2 on Flexible Cellulose Fabrics via a Simple Hydrothermal Method. Mater. Res. Bull. 2018, 97, 89–95. [Google Scholar] [CrossRef]
  34. Li, Z.; Dong, Y.; Li, B.; Wang, P.; Chen, Z.; Bian, L. Creation of Self-Cleaning Polyester Fabric with TiO2 Nanoparticles via a Simple Exhaustion Process: Conditions Optimization and Stain Decomposition Pathway. Mater. Des. 2018, 140, 366–375. [Google Scholar] [CrossRef]
  35. Cheng, X.W.; Guan, J.P.; Yang, X.H.; Tang, R.C. Durable Flame Retardant Wool Fabric Treated by Phytic Acid and TiO2 Using an Exhaustion-Assisted Pad-Dry-Cure Process. Thermochim. Acta 2018, 665, 28–36. [Google Scholar] [CrossRef]
  36. Chen, D.; Mai, Z.; Liu, X.; Ye, D.; Zhang, H.; Yin, X.; Zhou, Y.; Liu, M.; Xu, W. UV-Blocking, Superhydrophobic and Robust Cotton Fabrics Fabricated Using Polyvinylsilsesquioxane and Nano-TiO2. Cellulose 2018, 25, 3635–3647. [Google Scholar] [CrossRef]
  37. Cheng, D.; He, M.; Cai, G.; Wang, X.; Ran, J.; Wu, J. Durable UV-Protective Cotton Fabric by Deposition of Multilayer TiO2 Nanoparticles Films on the Surface. J. Coat. Technol. Res. 2018, 15, 603–610. [Google Scholar] [CrossRef]
  38. Mishra, A.; Butola, B.S. Development of Cotton Fabrics with Durable UV Protective and Self-cleaning Property by Deposition of Low TiO2 Levels through Sol–gel Process. Photochem. Photobiol. 2018, 94, 503–511. [Google Scholar] [CrossRef]
  39. Socrates, G. Infrared Characteristic Group Frequencies. Tables and Charts; John Wiley & Sons Ltd.: Hoboken, NJ, USA, 2001; ISBN 0471852988. [Google Scholar]
  40. Yu, C.; Wu, W.; Gao, M.; Liu, Y. Modified Cellulose with BINAP-Supported Rh as an Efficient Heterogeneous Catalyst for Asymmetric Hydrogenation. Catalysts 2022, 12, 83. [Google Scholar] [CrossRef]
  41. Zhang, Z.G.; Liu, H.; Wang, X.X.; Zhang, J.; Yu, M.; Ramakrishna, S.; Long, Y.Z. One-Step Low Temperature Hydrothermal Synthesis of Flexible TiO2 /PVDF@MoS2 Core-Shell Heterostructured Fibers for Visible-Light-Driven Photocatalysis and Self-Cleaning. Nanomaterials 2019, 9, 431. [Google Scholar] [CrossRef] [Green Version]
  42. Wu, D.; Long, M. Enhancing Visible-Light Activity of the Self-Cleaning TiO2-Coated Cotton Fabrics by Loading AgI Particles. Surf. Coat. Technol. 2011, 206, 1175–1179. [Google Scholar] [CrossRef]
  43. Tang, H.; Berger, H.; Schmid, P.E.; Lévy, F.; Burri, G. Photoluminescence in TiO2 Anatase Single Crystals. Solid State Commun. 1993, 87, 847–850. [Google Scholar] [CrossRef]
  44. Yu, J.C.; Yu, J.; Ho, W.; Jiang, Z.; Zhang, L. Effects of F- Doping on the Photocatalytic Activity and Microstructures of Nanocrystalline TiO2 Powders. Chem. Mater. 2002, 14, 3808–3816. [Google Scholar] [CrossRef]
  45. Karkare, M.M. The Direct Transition and Not Indirect Transition, Is More Favourable for Band Gap Calculation of Anatase TiO2 Nanoparticles. Int. J. Sci. Eng. Res. 2015, 6, 48–53. [Google Scholar]
  46. Zhang, J.; Zhou, P.; Liu, J.; Yu, J. New Understanding of the Difference of Photocatalytic Activity among Anatase, Rutile and Brookite TiO2. Phys. Chem. Chem. Phys. 2014, 16, 20382–20386. [Google Scholar] [CrossRef] [PubMed]
  47. Reddy, K.M.; Manorama, S.V.; Reddy, A.R. Bandgap Studies on Anatase Titanium Dioxide Nanoparticles. Mater. Chem. Phys. 2002, 78, 239–245. [Google Scholar] [CrossRef]
  48. Debeila, M.A.; Raphulu, M.C.; Mokoena, E.; Avalos, M.; Petranovskii, V.; Coville, N.J.; Scurrell, M.S. The Influence of Gold on the Optical Properties of Sol-Gel Derived Titania. Mater. Sci. Eng. A 2005, 396, 70–76. [Google Scholar] [CrossRef]
  49. Radetić, M. Functionalization of Textile Materials with TiO2 Nanoparticles. J. Photochem. Photobiol. C Photochem. Rev. 2013, 16, 62–76. [Google Scholar] [CrossRef]
  50. Sun, S.; Song, P.; Cui, J.; Liang, S. Amorphous TiO2 nanostructures: Synthesis. Fundamental properties and photocatalytic applications. Catal. Sci. Technol. 2019, 9, 4198–4215. [Google Scholar] [CrossRef]
  51. Wang, Q.; Zhao, J.-C.; Cong, Y.-Q.; Zhang, Y. Photo-sensitized Degradation of Dye Pollutants on Amorphous TiO2 under Visible Light Irradiation. Chin. J. Catal. 2011, 32, 1076–1082. [Google Scholar] [CrossRef]
Figure 1. SEM images of the untreated cotton sample (UN_CO), the sample treated with a commercial TiO2 product (NP), and samples treated via in-situ synthesis routes, i.e., sol–gel pad–dry–cure (xS), pad–hydrothermal (xH), and exhaustion hydrothermal (xE), using different concentrations of titanium isopropoxide (x = 2, 4, and 6%) in the nanosol.
Catalysts 12 01330 g001
Figure 2. EDS spectra and EDS mapping of the TiO2 treated cotton samples using 4% titanium isopropoxide in the nanosol applied via the sol–gel pad–dry–cure (4S), pad–hydrothermal (4H), and exhaustion hydrothermal (4E) routes and cotton sample treated with a commercial TiO2 product (NP).
Catalysts 12 01330 g002
Figure 3. IR ATR spectra of untreated and TiO2 functionalized cotton fabric samples.
Catalysts 12 01330 g003
Figure 4. XRD (a) and Raman spectra (b) of untreated and TiO2 treated cotton fabrics.
Catalysts 12 01330 g004
Figure 5. UV-vis absorbance spectra of the studied samples with the determination of Eg by the absorption edge method (a) and Tauc plotting (αhν)n against photon energy () (n = ½ (b) and n = 2 (c)).
Catalysts 12 01330 g005
Figure 6. Transmission (a) and reflection (b) of untreated and TiO2 functionalized cotton fabric samples.
Catalysts 12 01330 g006
Figure 7. Degradation degree, D, of MB after the exposure of the studied samples to light (a) and selected images of MB-stained samples before (top) and after (bottom) 90 min (b) of illumination under a visible xenon arc lamp with a radiation intensity of 1.67 W/cm2.
Catalysts 12 01330 g007
Figure 8. Schematic presentation of the studied in-situ low-temperature application routes.
Catalysts 12 01330 g008
Table 1. Eg of the treated samples determined by the absorption edge method and Tauc plotting.
SampleEg (eV)
Absorption EdgeTauc Plotting
λg (nm)1240/λgn = 1/2n = 2
4S3733.322.943.47
4H3643.413.073.55
4E3703.352.923.51
NP3883.202.913.28
Table 2. UPF values and UVA and UVB blocking % of untreated and TiO2 functionalized cotton fabric samples.
SampleUVA Blocking (%)UVB Blocking (%)UPFUV Protection Category *
UN_CO72.377.24.2I
2S79.796.217.2G
4S86.097.729.6VG
6S84.397.124.2G
2H80.697.320.9G
4H82.798.330.3VG
6H83.096.721.8G
2E79.696.316.8G
4E81.896.820.8G
6E83.297.324.4G
NP91.298.655.8E
* I—insufficient; G—good; VG—very good; E—excellent.
Table 3. Sample details and synthesis approaches.
Sample CodeApplication RouteDetails of the Application
UN_CO/Untreated cotton sample
xSSol–gel pad–dry–cureCotton sample impregnated by x% TTIP sol (x = 2, 4, 6%) followed by sol–gel pad–dry–cure process
xHPad–hydrothermalCotton sample impregnated by x% TTIP sol (x = 2, 4, 6%) followed by pad–dry–hydrothermal process
xEExhaustion–hydrothermalCotton sample immersed in a solution of x% TTIP sol (x = 2, 4, 6%) for 1 h followed by pad–exhaustion process
NPPad–dry–cureCotton sample impregnated by 10% commercial TiO2 sol followed by pad–dry–cure process
Publisher’s Note: MDPI stays neutral with regard to jurisdictional claims in published maps and institutional affiliations.

