Article

Influence of PtCu/C Catalysts Composition on Electrochemical Characteristics of Polymer Electrolyte Fuel Cell and Properties of Proton Exchange Membrane

by
Irina Falina
1,*,
Angelina Pavlets
2,
Anastasia Alekseenko
2,
Ekaterina Titskaya
1 and
Natalia Kononenko
1
1
Physical Chemistry Department, Faculty of Chemistry and High Technologies, Kuban State University, 350040 Krasnodar, Russia
2
Chemistry Faculty, Southern Federal University, 344090 Rostov-on-Don, Russia
*
Author to whom correspondence should be addressed.
Catalysts 2021, 11(9), 1063; https://doi.org/10.3390/catal11091063
Submission received: 15 July 2021 / Revised: 27 August 2021 / Accepted: 31 August 2021 / Published: 31 August 2021
(This article belongs to the Special Issue Pt-M (M = Ni,Co,Cu, etc.)/C Electrocatalysts)

Abstract

:
The present work aimed to investigate the influence of “weakly bound“ copper dissolution from the surface of bimetallic PtCux/C catalysts on the properties of proton exchange membrane and the membrane electrode assembly (MEA) in general. A number of PtCux/C materials have been obtained by the simultaneous reduction in copper and platinum precursors in the course of liquid-phase synthesis with a varying ratio of metals from PtCu2.0/C to PtCu0.3/C. All bimetallic PtCux/C electrocatalysts after the activation stage exhibit high activity in the oxygen electroreduction reaction. The PtCux/C catalysts in “as prepared” state were tested in MEA. The increase in Cu content in PtCux/C catalysts led to a decrease in current density of MEA while its resistance was almost independent of the Cu fraction in the catalyst. The membrane saturation degree by Cu2+-ions after MEA testing did not exceed 40%, even in the case of the PtCu2.0/C material. The main reason for the degradation of membrane electrode assembly with PtCux/C materials is the transport limitation caused by the contamination of Nafion in three catalytic layer by “weakly bound” copper ions.

1. Introduction

Proton exchange membrane fuel cells (PEMFC) are an essential part of intensively developing hydrogen energy [1,2,3]. The electrocatalyst is the key part of such electrochemical systems [1,2,3]. Platinum nanoparticles on carbon support are the optimal catalysts for PEMFC [4]. At the same time, the expensiveness of the platinum catalyst is one of the main reasons limiting the development of hydrogen energy. Pt-free catalysts are cheaper, but have low electrochemical characteristics in comparison with Pt, and therefore they have no prospects of application in PEMFC in the near future [5].
A rise in the functional characteristics of electrocatalysts is an important task of modern alternative power engineering. This task is realized based on the fundamental investigation of the interrelation between the composition and structure of catalysts with their activity and stability [6,7]. Investigations concerning the preparation of Pt catalysts with a reduced content of noble metal and high specific electrochemical characteristics have high topicality [8].
One of the key directions of development in the activity and stability of electrocatalysts for the oxygen reduction reaction (ORR) in PEMFC is obtaining new effective bimetallic materials based on platinum alloyed with transition metals (Ni, Co, Cu, Ag) [9,10,11]. The alloying constituent is capable of increasing the activity of nanoparticles due to a number of effects: the reduction in interatomic distance in lattice; variation in energy of d-orbitals, which facilitates the adsorption of oxygen on the surface; formation of a thin platinum layer on the surface of the alloy particles; a change in the composition of surface oxides; and increase in the corrosion resistance of alloy particles in comparison with unalloyed Pt [9,10,12]. Nørskov et al. have shown that utilization of PtM/C catalysts in ORR allows one to reduce the Pt–O bond energy and enhance the activity of such materials in comparison with Pt ones [13].
Special attention should be paid to the possibility of the selective dissolution of components of bimetallic catalysts. The application of such catalytic materials in PEMFC is becoming more promising. It is known that the contact of bimetallic particles with an electrolyte solution in the cathodic region of the MEA causes the selective dissolution of the alloying metal, mainly from the nanoparticle surface region. Upon the contact of bimetallic nanoparticles with an electrolyte solution in the fuel cell cathode space, selective dissolution of the atoms of the alloying component from the surface layer of nanoparticles occurs. It is known that the polymer ion-exchange materials are highly selective toward the multi-charged cations compared to singly charged ones. The decrease in the proton conductivity of a polymer membrane due to the replacement of protons by multi-charged cations is usually considered as the main reason for the degradation of the characteristics of fuel cells with bimetallic catalysts [14]. The reduction in impurity cations by the hydrogen in membrane could cause the formation of metal nanoparticles in its bulk [15,16]. In the case of Pt nanoparticles, the existence of Pt dispersion inside the membrane results in an increase in its conductivity due to the reaction between oxygen and hydrogen in the membrane bulk and the formation of the self-humidifying system [17,18], while the catalyst characteristics reduce. At the same time, poisoning of various components of the membrane electrode assembly (MEA) with ions of transition elements can occur. For example, the presence of d-element cations can cause a decrease in the hydrophobicity of the gas diffusion layer and subsequent flooding of the cathode [19]. The main reasons for the decrease in the characteristics of PEMFC are still not completely clear.
This work discusses the reasons for the decrease in the characteristics of PEMFC with PtCux/C electrocatalysts. The present work aimed to investigate this problem on a new level, accounting for the individual characteristics of the bimetallic catalysts and proton exchange membrane saturated with copper ions, and the properties of MEA in general. Therefore, the objects of research were the PtCux/C catalysts in the “as prepared” state and after electrochemical activation; MEA with PtCux/C catalysts; and proton exchange membrane after MEA operation. The PtCux/C catalysts characteristics were evaluated by X-ray fluorescence analysis (XRF), X-ray diffraction (XRD) and cycle voltammetry; membrane saturation degree by Cu2+-ions after MEA operation was determined from the conductivity data; MEA with PtCux/C catalysts in the “as prepared” state was tested by potentiostatic voltammetry and AC resistance measurements.

2. Results and Discussion

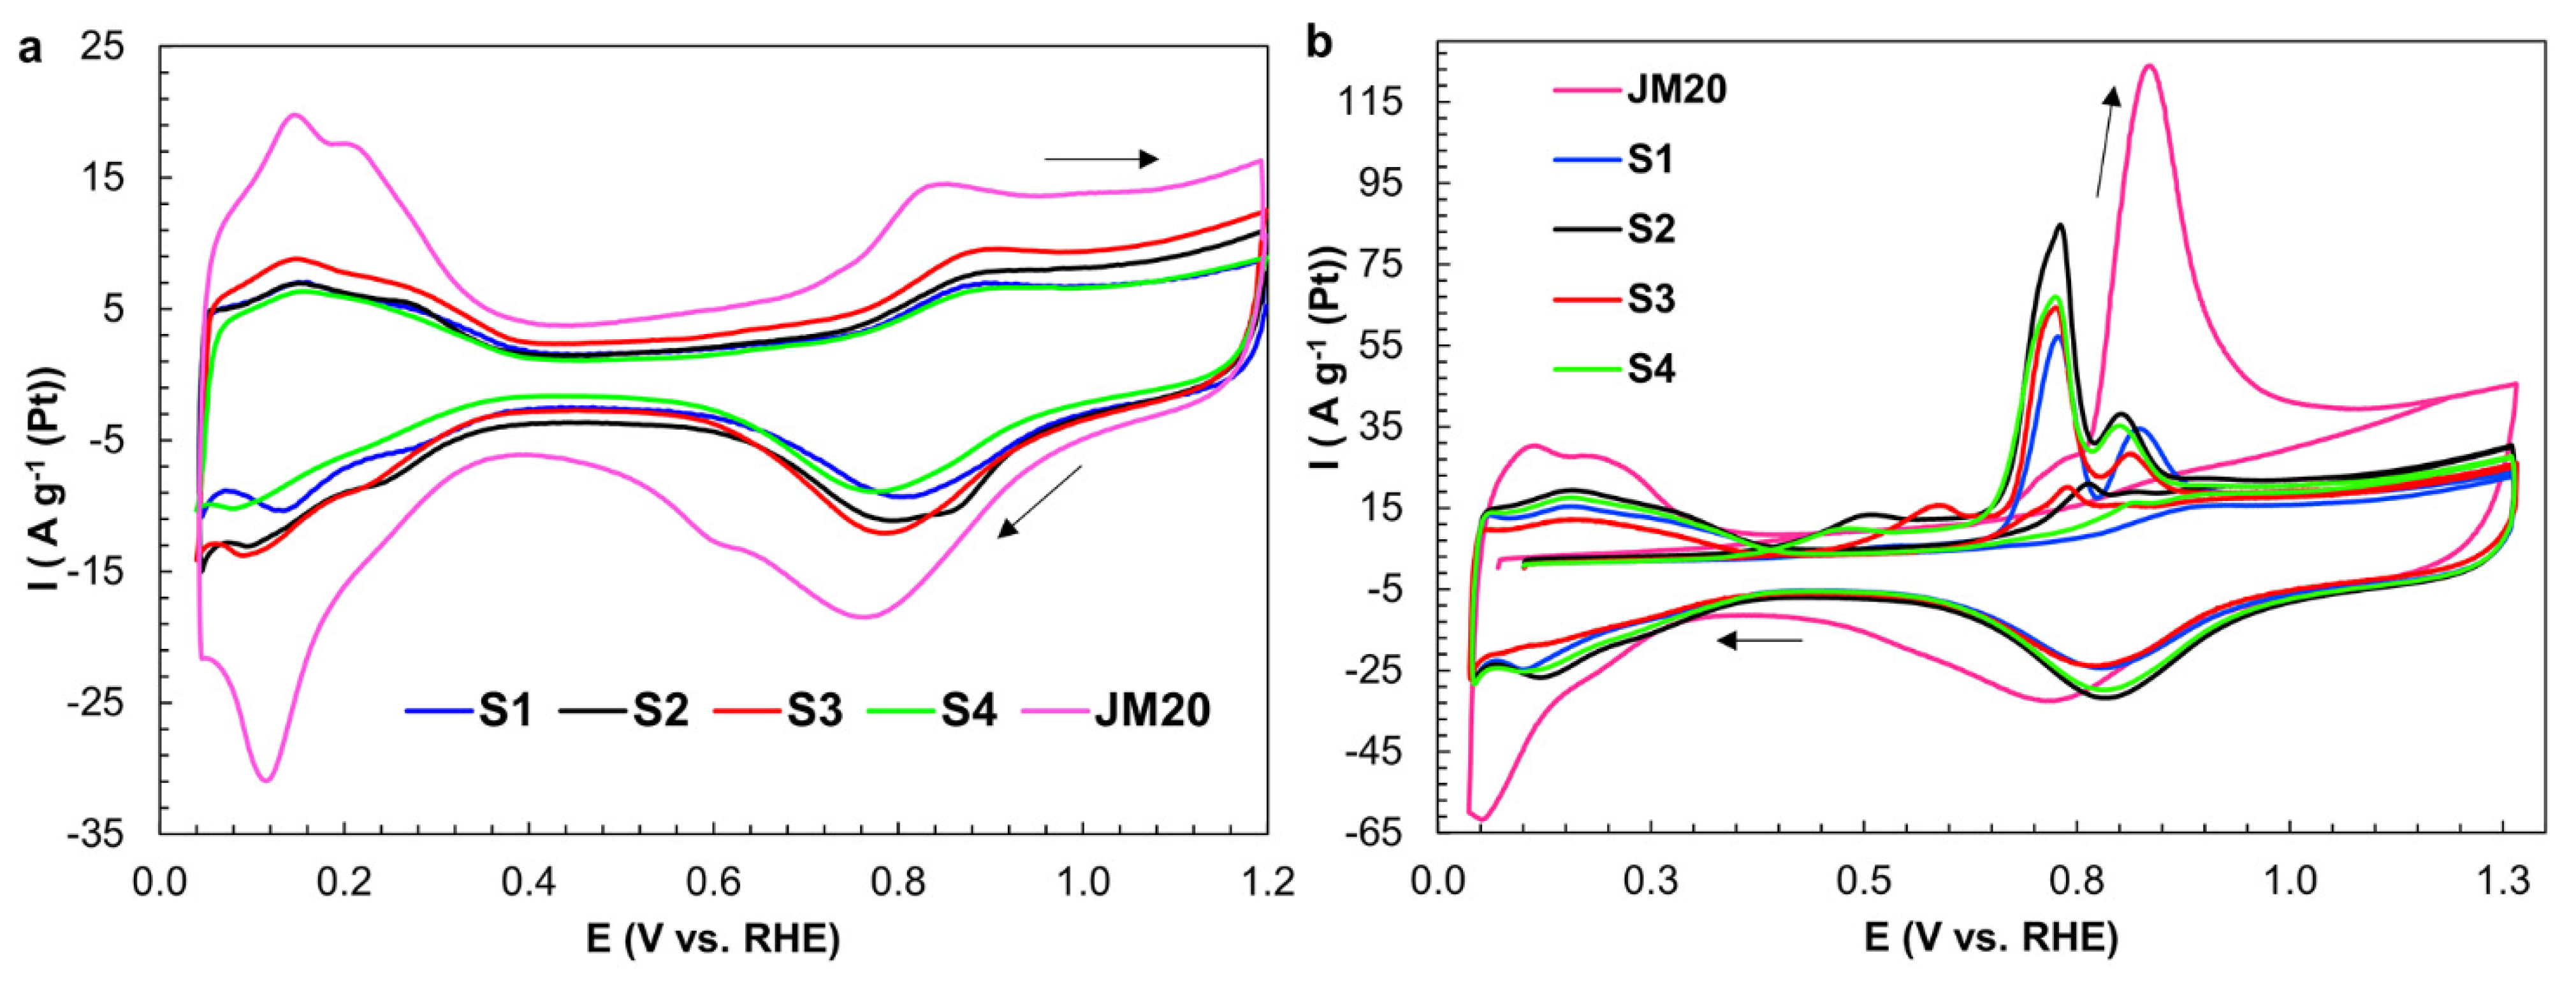
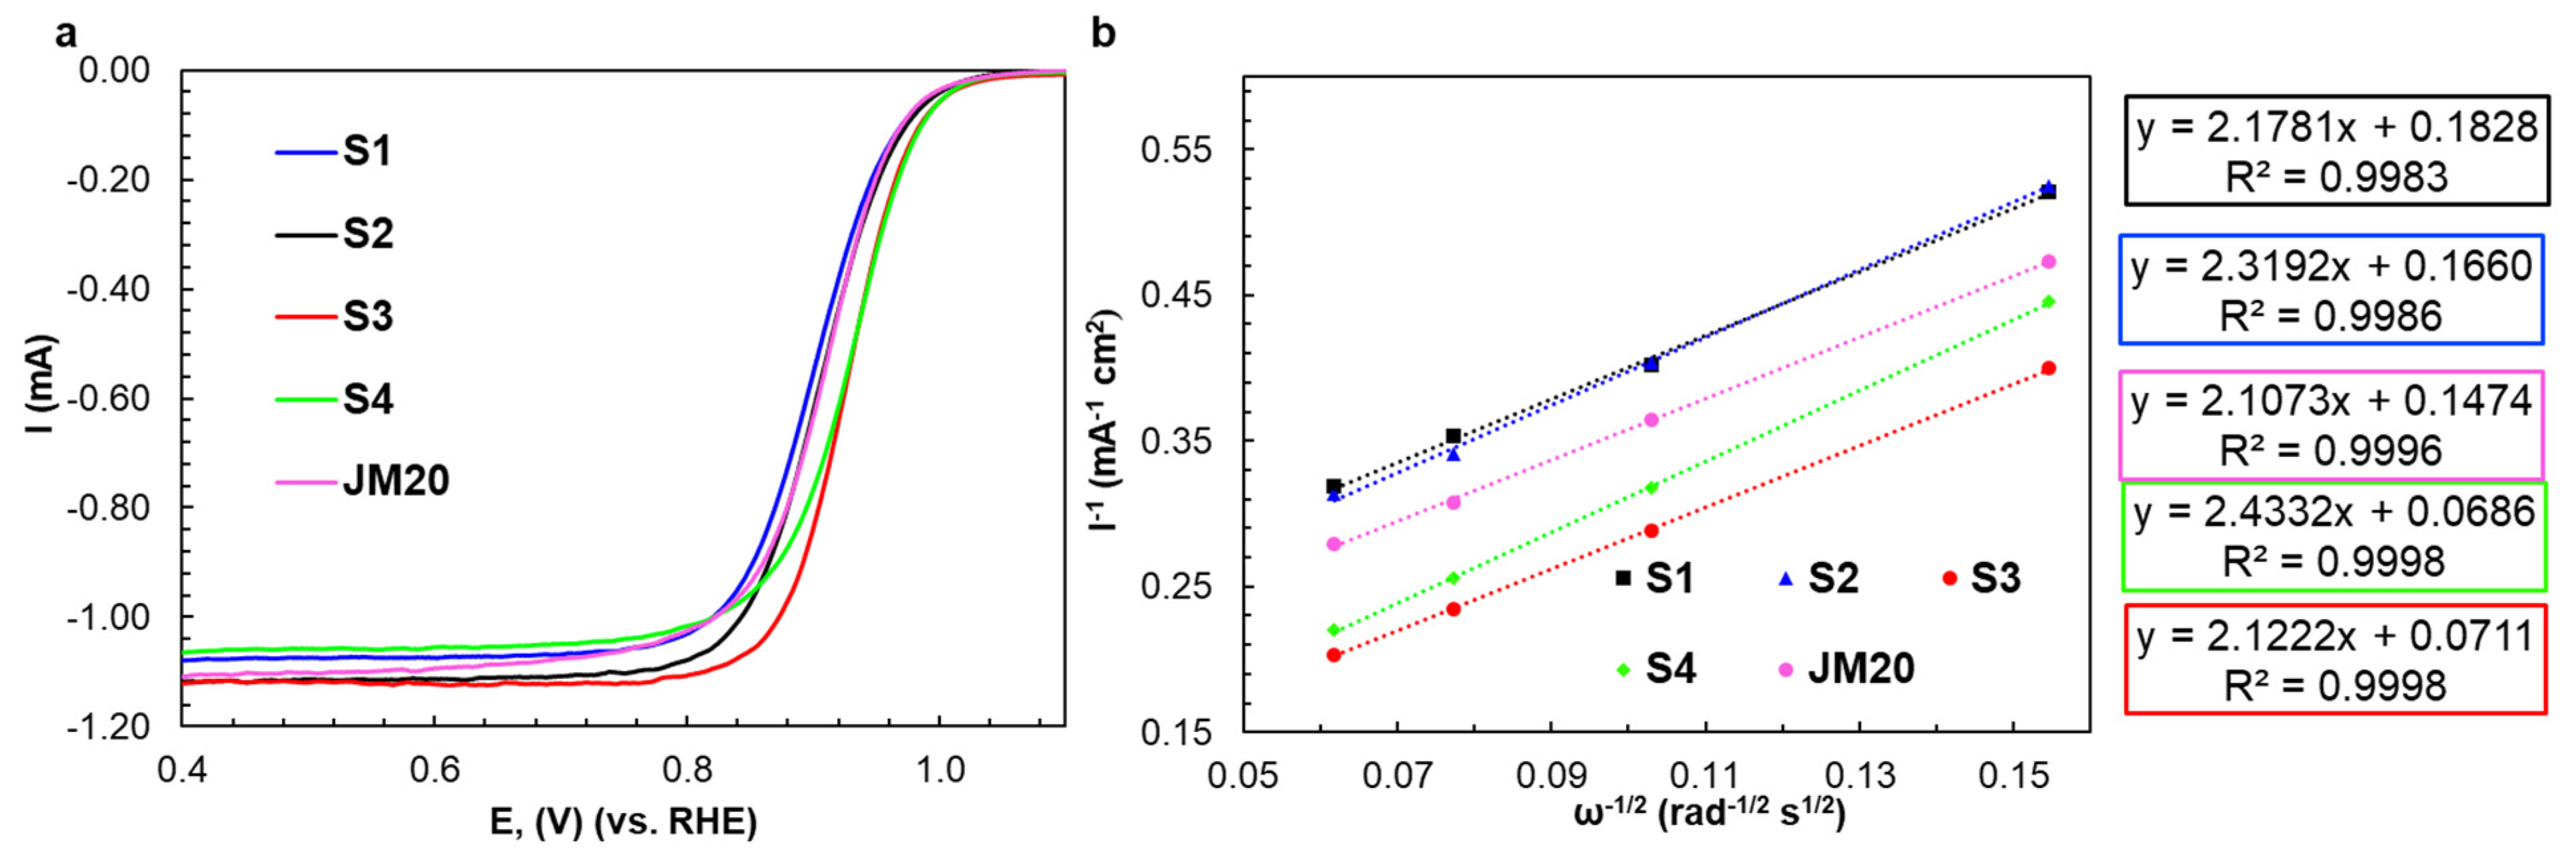
2.1. Characteristics of Bimetallic Catalysts

The obtained PtCux/C catalysts had different Pt:Cu ratios (Table 1). The mass fraction of metals varied from 21.4 to 41.1 wt%, and the mass fraction of platinum from 17.3 to 25.0%, respectively. The copper content in sample S5, determined by thermogravimetric method, equaled 30 wt%. The composition of the metal component, determined by XRF, corresponded to the theoretical one.
The X-ray diffraction (XRD) patterns of the PtCux/C samples show that the characteristic reflections of platinum shifted toward larger values of the 2θ angles (Table 1—Position of 111 maximum, Figure 1) due to the formation of a Pt–Cu solid solution. It is explained by the compression of the crystal lattice of bimetallic PtCu nanoparticles. One can see that an increase in the copper content in materials is accompanied by a decrease in the average size of crystallites (Table 1). At the same time, the peaks corresponding to the pure copper phases were not observed in the X-ray diffraction patterns of bimetallic catalysts. When trying to increase the copper content in the catalyst to obtain a sample with the composition PtCu2.0, the formation of copper (II) oxide with the (002), (111), and (−202) phases was observed in the XRD pattern (Figure 1) [20]. Sample Cu/C was also characterized by the presence of a copper oxide phase (I). The X-ray diffraction patterns of the PtCu0.3/C–PtCu1.3/C samples also contained no peaks of the copper oxide phase. However, this is not evidence of their absence since the XRD method does not take into account the presence of the amorphized structure [21]. TEM examination of the microstructure of the samples is presented in [22].
Cyclic voltammograms of PtCux/C samples were recorded after the activation of the catalyst surface. The curves had a typical form for platinum nanoparticles or its alloys supported on Vulcan XC-72. It was found by XRF that the content of copper in the catalysts after electrochemical activation decreased in all materials and corresponded to the average composition PtCu0.2–0.32 (Table 2). A significant mismatch between the composition of bimetallic catalysts in the “as prepared“ state and after the electrochemical activation stage is a common event for two-component systems, although this fact has been sparsely analyzed in scientific publications [23]. During the activation stage, the alloying component is leached out, and a so-called de-alloyed structure is formed.
The platinum–copper samples S1, S2, and S4 had similar ESAs determined by the hydrogen adsorption/desorption method (Figure 2, Table 2). The highest ESA values were observed for sample S3 with the initial metal composition PtCu1.3 and for the commercial Pt/C catalyst (Table 2).
It is known that the determination of the ESA value by hydrogen adsorption/desorption may be less accurate for bimetallic electrocatalysts than for Pt/C one [24,25,26,27]. Generally, an additional technique is used to determine the active surface area by the carbon monoxide stripping method [28]. The ESA values determined by these two methods correlate with each other for both the PtCux/C and Pt/C catalysts (Table 2). Despite the fact that the electrolyte in the cell changed after the activation stage, it appears that samples S2, S3 and S4 retained some amount of copper ions in the near-electrode space, which were then reduced (Underpotential Deposition of Copper), as shown in the subsequent cycle (Figure 2b). Previously, Gatalo et al. discovered this effect during experiments with various additions of copper cations [29]. Additionally, Durst et al. in [30] showed that the presence of cations of less noble metals (such as Cu2+ and Co2+) in the double layer led to an easier formation of hydroxide on the Pt surface. Hydrated cations are located between the inner and outer Helmholtz planes, where they partially lose their hydration shell and approach the Pt surface providing an increased coverage by adsorbed OH groups (OHad), which can cause a shift in the onset of CO electrooxidation to lower potentials [24]. Thus, the presence of a peak in CV–curve at potentials of 0.5–0.6 V can be attributed to the onset of oxidation caused by the presence of copper. This peak was absent for the sample with the lowest initial copper content—S1. For the commercial Pt/C material, CO oxidation starts at higher potentials (Figure 2b).
The activity of the obtained bimetallic catalysts in the ORR was estimated on the basis of the normalized linear sweep voltammetry (LSV) curves (Figure 3a). For all investigated samples, the ORR proceeded according to a four-electron mechanism typical for platinum (Table 2). A half-wave potential for platinum–copper catalysts S3 and S4 was higher than for other samples and amounted to 0.93 and 0.94 V, respectively. Analysis of the straight lines plotted in the Koutetsky–Levich coordinates (Figure 3b) makes it possible to calculate the activities of the studied samples in the ORR, as described in Section 3.1 [28,31]. Despite the close ratio of metals in the samples after the stage of electrochemical activation and close ESA values, there was a significant difference in the values of activity in ORR (Table 2, Figure 3b). The mass activity in ORR in the order of the studied catalysts is: S1 < S2 ≈ JM20 << S4 <S3 (Table 2). According to the estimation results obtained on the basis of the Koutetsky–Levich equation [31,32], at the potential of 0.90 V, the mass activity values for the samples S1, S2, and JM20 were 140, 169, and 181 A/g (Pt), respectively. At the same time, catalysts S3 and S4, with the higher initial content of the copper, had high values of mass activity equal to 417 and 329 A/g (Pt), respectively (Table 2, Figure 3b). The samples S3 and S4 also exhibited the highest values of specific activity in ORR (Table 2).
According to Figure 3b, the Kautetsky–Levich plot of sample S4 had a greater slope than for S3. Despite this fact, the mass activity of sample S3 was higher than that of S4 (Table 2) due to the higher mass of platinum in sample S4 (Table 1).
Obviously, the reason for the differences in the ORR activities between materials S1–S4 was the mismatch in the composition/structure of the “as prepared“ platinum–copper catalysts and the ones that formed after selective dissolution of copper during the electrochemical treatment of the initial materials. Based on the data obtained, it can be assumed there is an optimal content of the copper component in the “as prepared” Pt–Cu/C catalyst, at which the samples can be characterized by an increased ESA value and exhibit a higher activity in ORR.

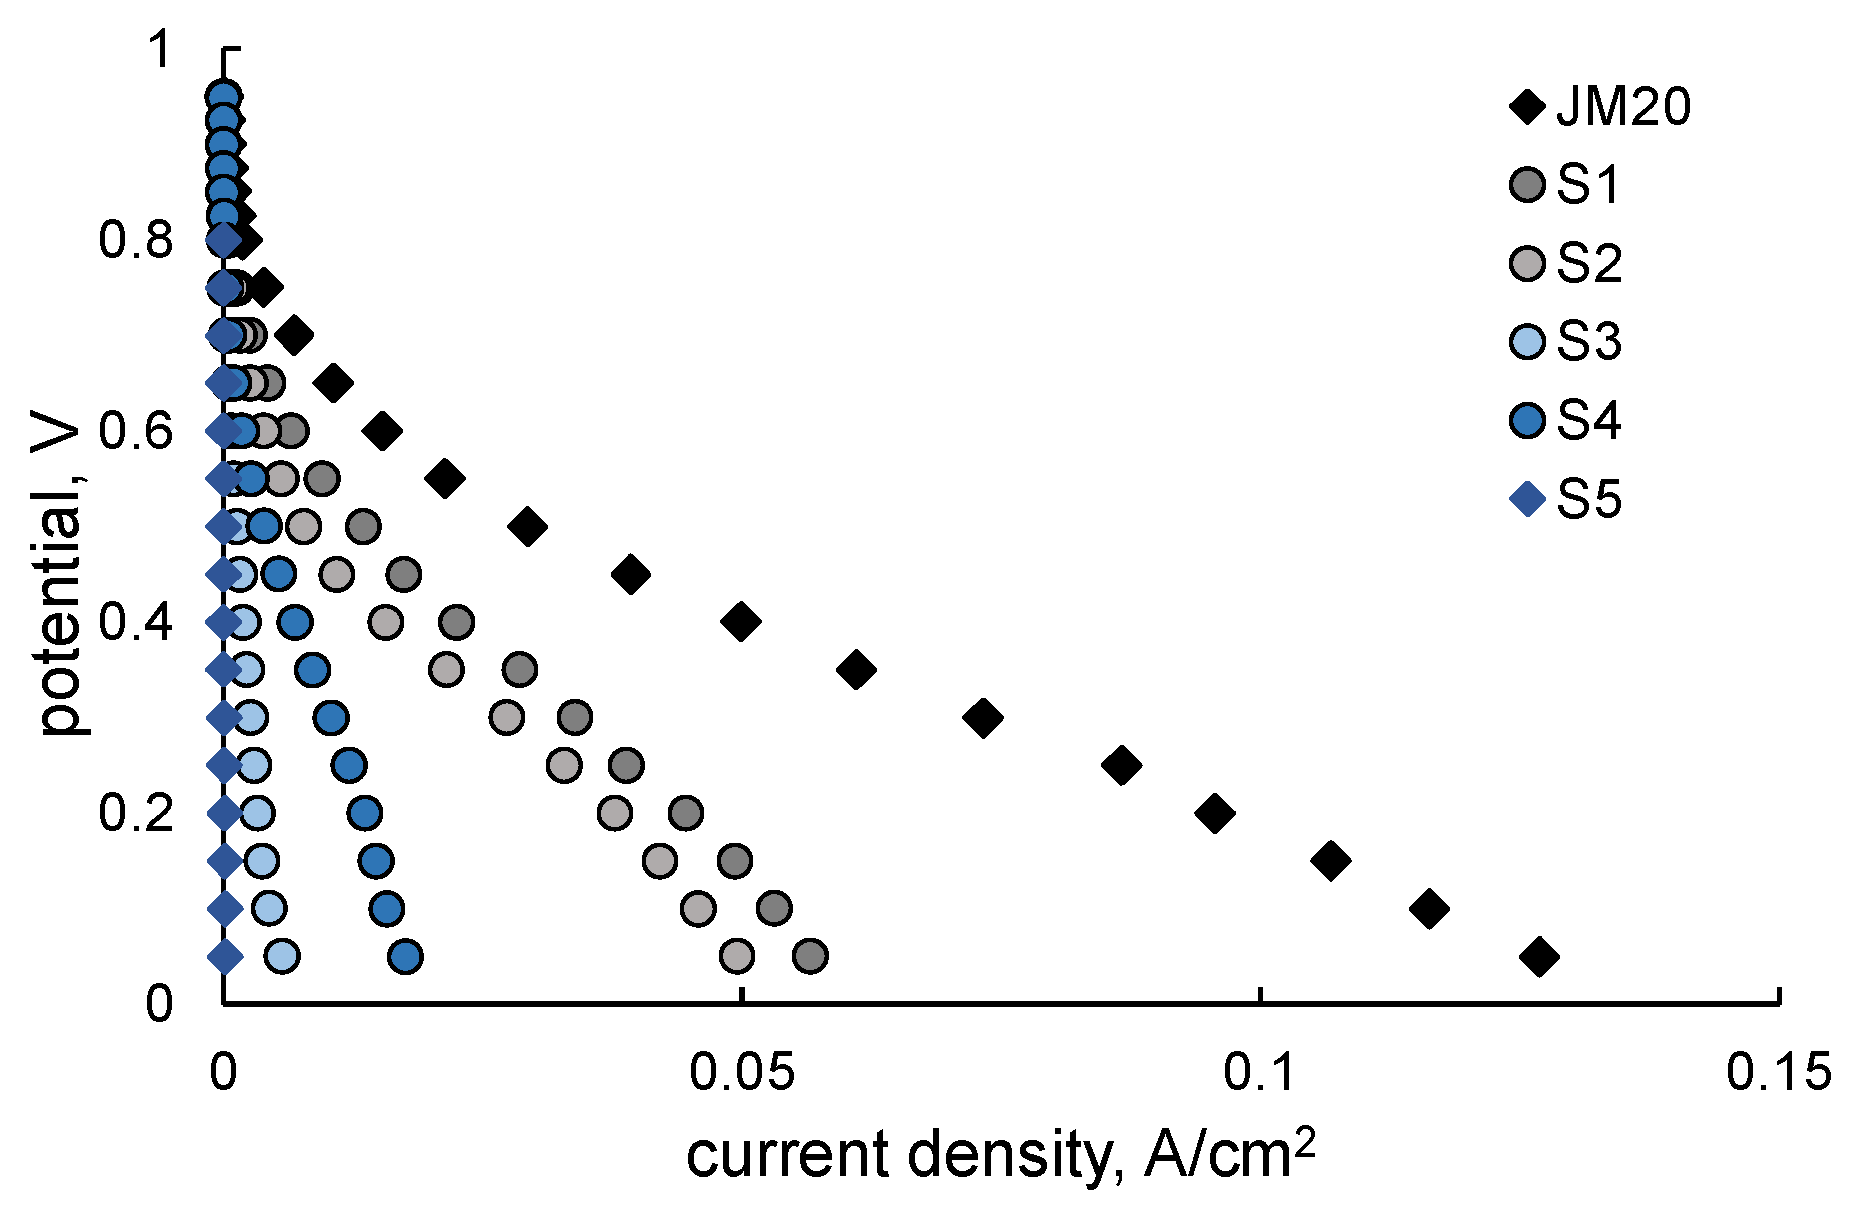
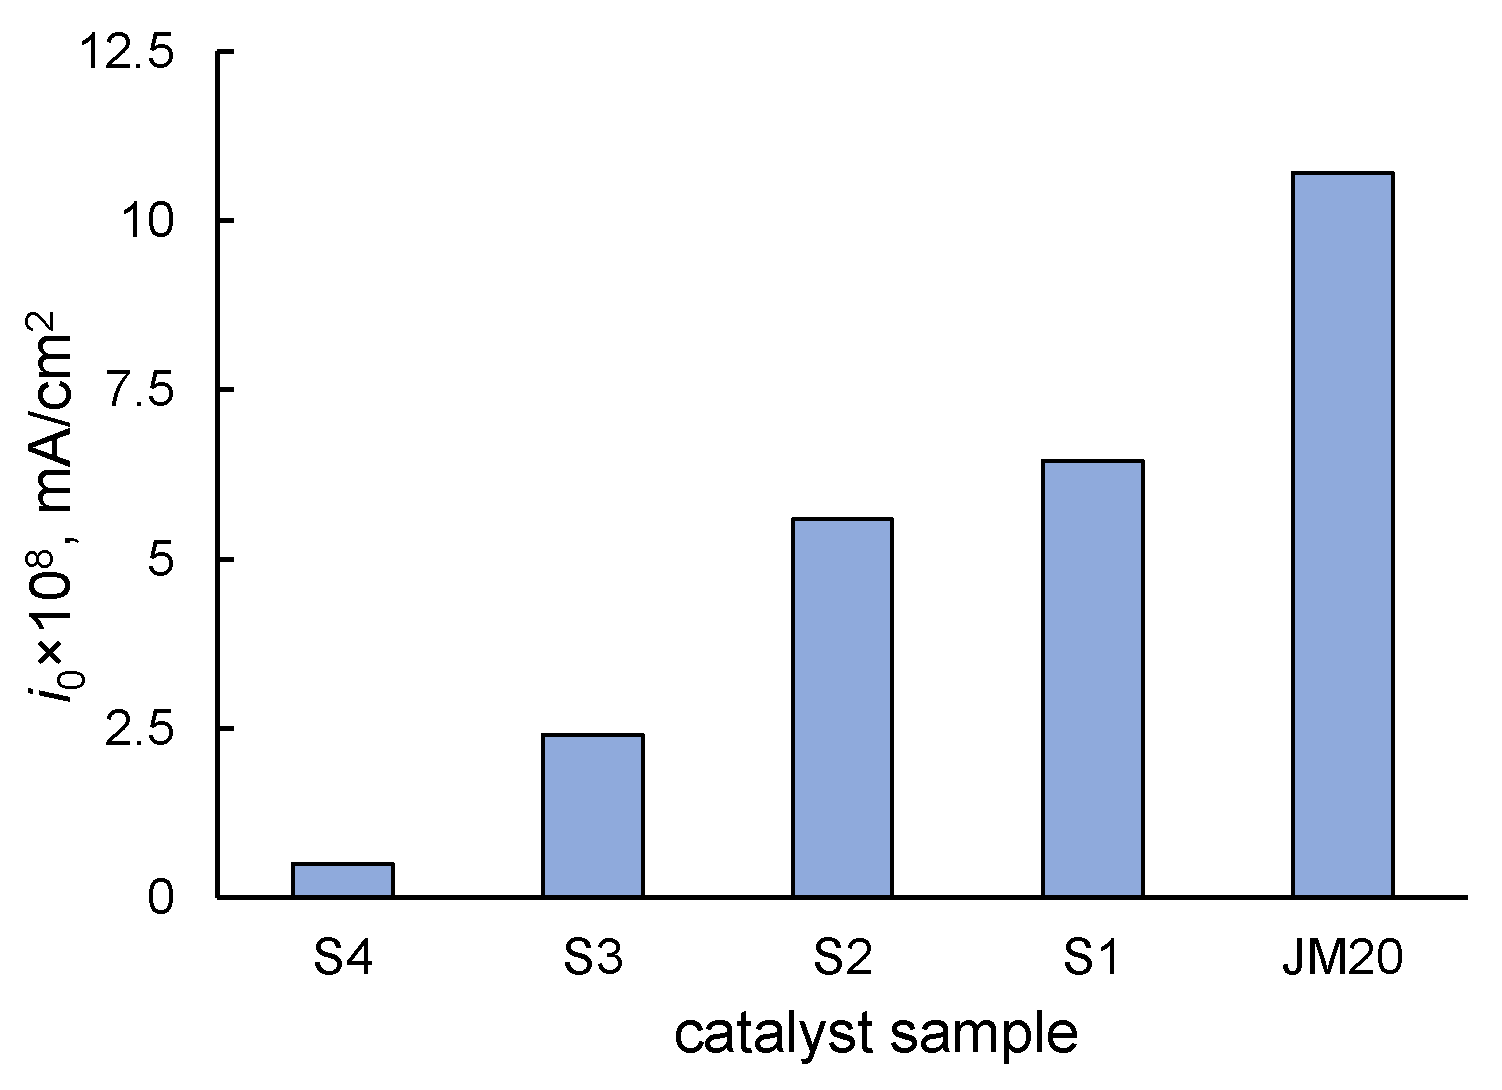
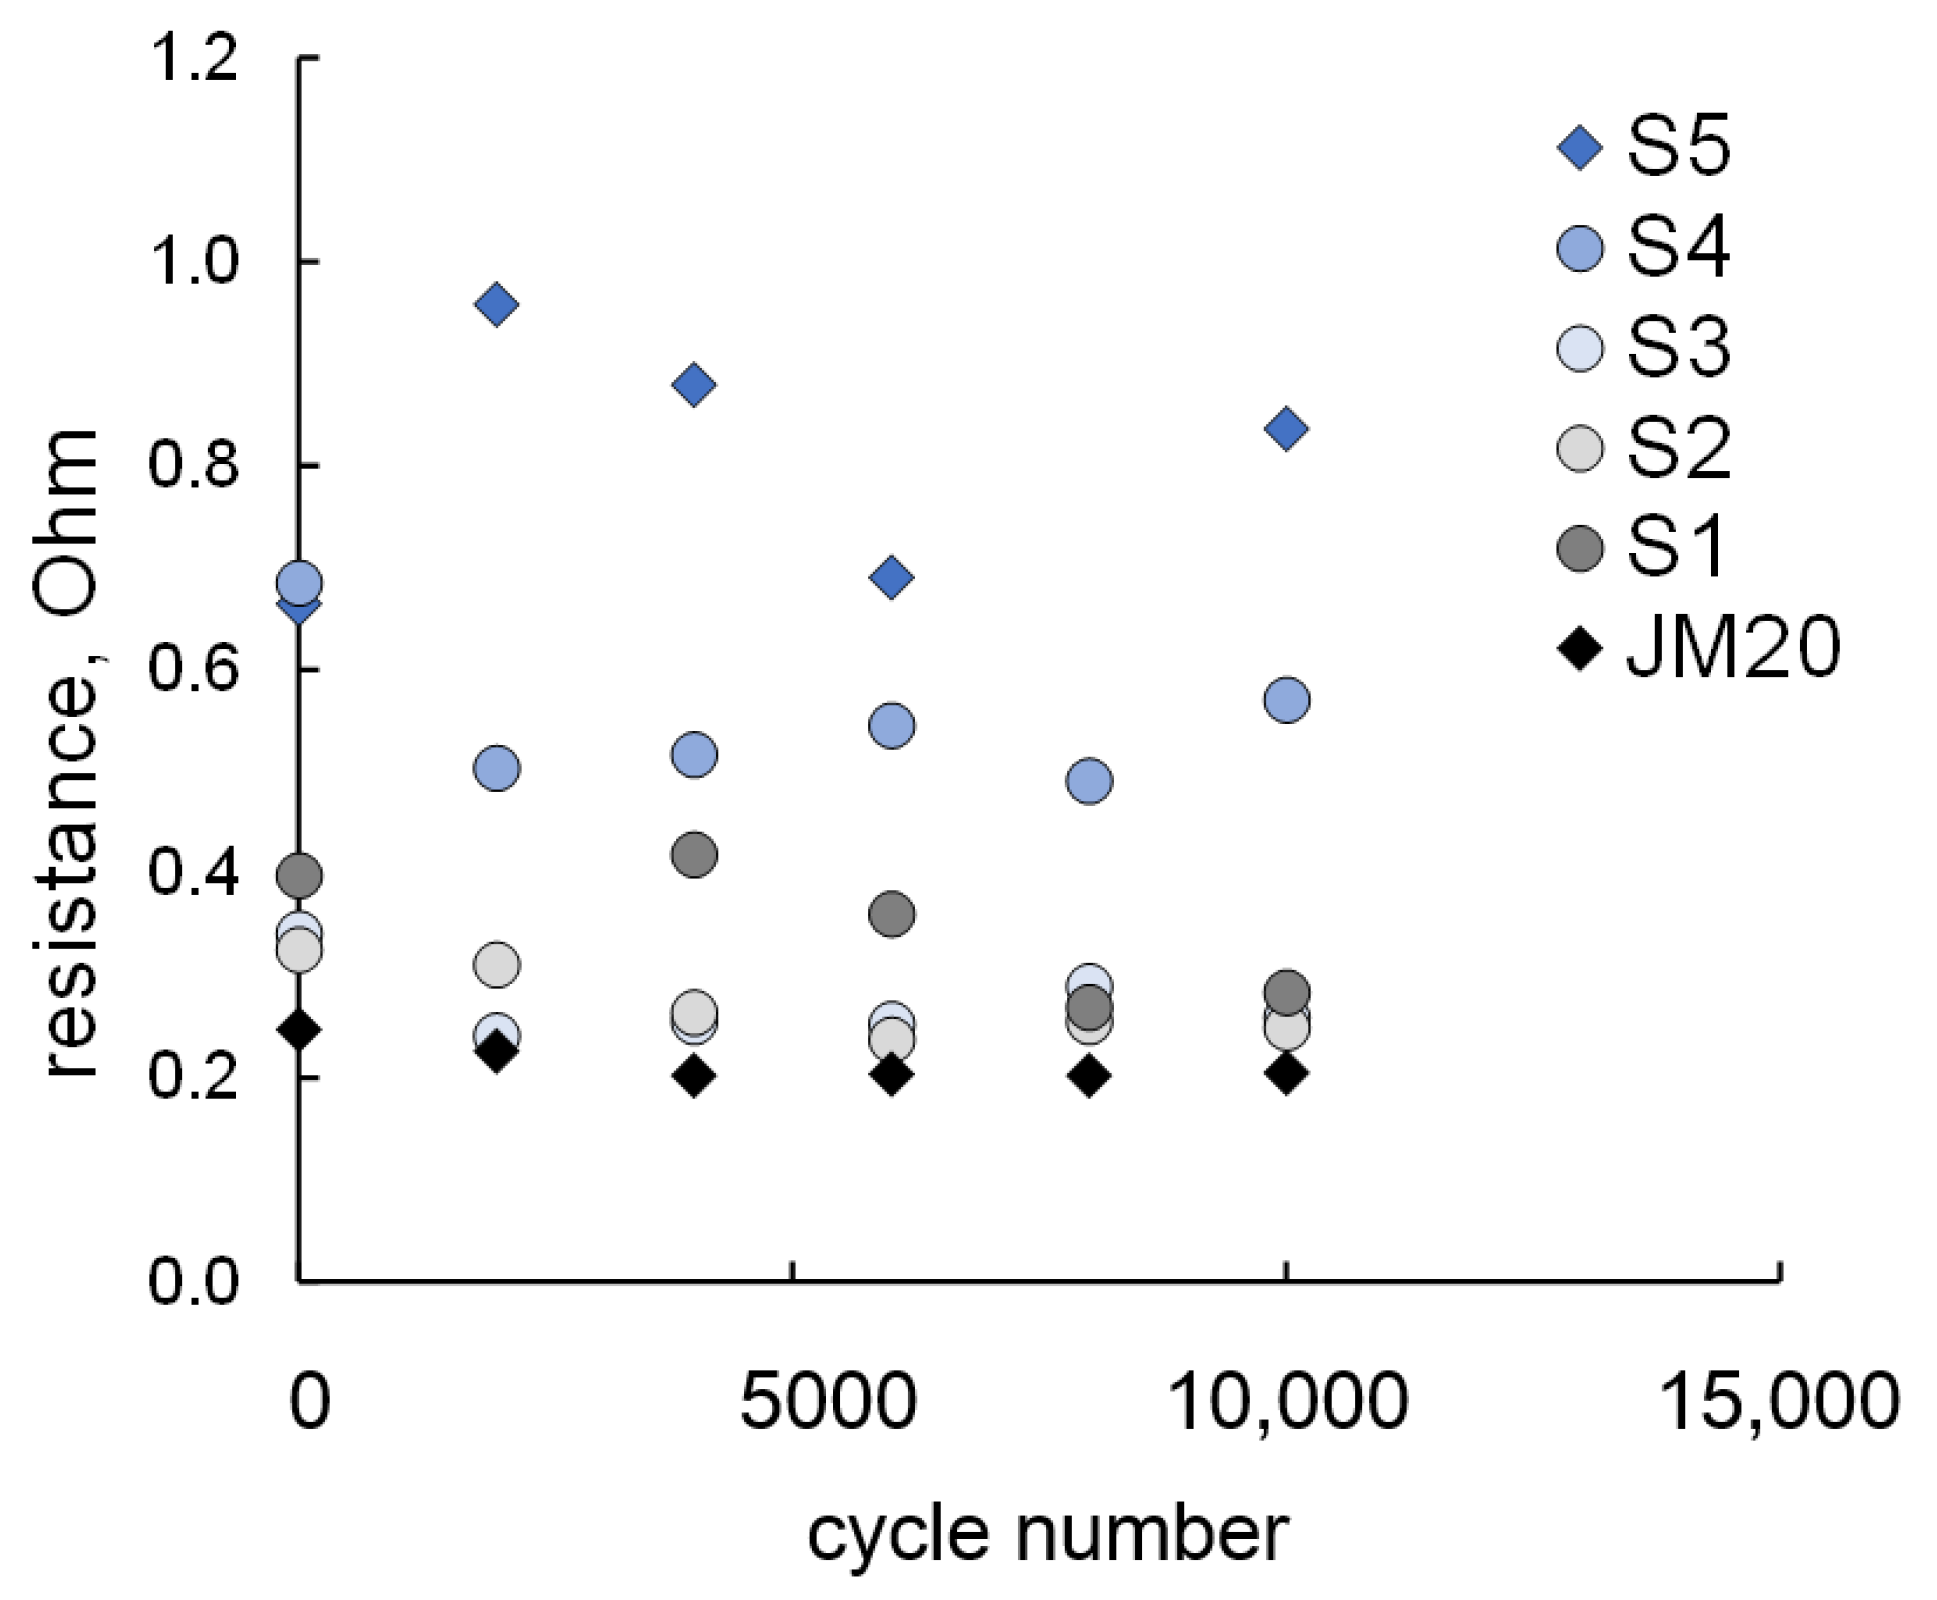
2.2. Stress-Testing of MEA

The investigation of the MEA electrochemical characteristics was performed using the S1–S5 samples in the “as prepared” state in order to study the effect of the selective dissolution of copper on MEA and the membrane characteristics. The commercial catalyst JM20 (Pt 20% wt.) with a similar mass fraction of platinum was chosen as a reference sample. Figure 4 presents the resistance of MEA during the stress-testing. The measured resistance includes the active resistance of all MEA components, but resistance of the polymer membrane comprises the most considerable part. Nevertheless, MEA resistance should not be completely referred to the proton exchange membrane, while it may be used for estimation of the MEA components degradation. Several different processes occur during the operation of MEA with PtCux/C electrocatalysts: (i) contamination of polymer membrane by Cu2+ ions; (ii) contamination of perfluoropolymer, which is part of the catalytic layer, by Cu2+ ions; and (iii) sorption of Cu2+ ions on the surface of the gas diffusion layer (GDL).
As can be seen in Figure 4, the resistance of MEA with the Pt/C catalyst was constant during the stress-tests. The significant increase in MEA resistance (2–2.5 times) was observed only for the S4 and S5 samples from the first moment of the MEA operation. The resistance of MEA with other samples of bimetallic catalysts was 20–30% higher in comparison with the Pt/C one. Thus, the membrane saturation degree by Cu2+ ions is not very substantial as well as the ohmic losses.
To estimate the contributions of different losses into the MEA sufficiency it is necessary to obtain the information on the theoretical value of the electro motive force (EMF). The theoretical EMF value (UTheor) can be calculated according to the Nernst equation
U Theor = E c 0 E a 0 + R T 4 F ln [ p O 2 ( p H 2 ) 2 ( a H 2 O ) 2 ] ,
where E c 0 and E a 0 are the standard cathode and anode potentials; p O 2 and p H 2 are the partial pressures of oxygen and hydrogen; a H 2 O is the water activity; R is the gas constant; T is the temperature; and F is the Faraday constant. Assuming that p O 2 = 0.2 atm, p H 2 = 1 atm under current experimental conditions, and water activity equals 1, the theoretical value of EMF (UTheor) is 1.219 B. The deviation of experimental EMF value from the theoretical one is conditioned by the contributions of kinetic (Uk), ohmic (UOhm) and diffusion (Udiff) losses. Thus the experimental EMF can be calculated as follows
U = U Theor U k U Ohm U diff .
The ohmic losses could be considered as the product of MEA resistance and current intensity. The kinetic and diffusion losses could be estimated from the potentiostatic CVCs of MEA after the stress-testing during 10,000 cycles, presented in Figure 5. One can see that the current density value depends on the Cu fraction in catalysts. It should also be noted that the decrease in current density passing through MEA significantly exceeded the growth of MEA resistance associated with the Cu content in the bimetallic catalyst, which agrees with the results in [33].
The kinetic losses are concerned with ORR. The initial regions of potentiostatic CVCs are used to estimate the exchange currents of cathodic reaction. For this, the CVCs after subtraction of the ohmic losses are presented in semi-logarithmic coordinates according to the Tafel equation and extrapolated to the value of theoretical EMF (UTheor). The Tafel dependencies are shown in Figure S1. The values of the exchange current densities of ORR are presented in Figure 6; the obtained values were close to the data presented in [34]. One can see that the exchange current value depends on the catalyst composition. The exchange current density increases with the growth in Pt content in the catalyst, despite the fact that all the MEAs have equal Pt loading. S1 and S2 catalysts have close and sufficiently high values of exchange current densities, but their magnitudes were lower by 40% in comparison with the Pt/C one. Obviously, the reduction in exchange current with the increase in Cu content in PtCux/C catalysts with equal Pt loading of electrodes is caused by the transport limitations in the catalytic layer, not in the membrane bulk. In fact, probably due to the selective dissolution of “weakly bound” copper, the perfluoropolymer in the catalytic layer is saturated by Cu2+ ions, which reduces the mobility of protons in it. Therefore, the apparent exchange current is determined.
The analysis of the initial regions of CVCs in Tafel coordinates (Figure S1) has shown that the kinetic losses amount to 95–125 mV per decade. Extrapolation of the Tafel curves to the low potential region permits the estimation the kinetic losses in all potential range. Considering the kinetic losses and individual characteristics of the catalysts after the activation stage (Figure 3, Table 2), it can be concluded that low current densities in CVCs (Figure 5) are caused by transport limitations.

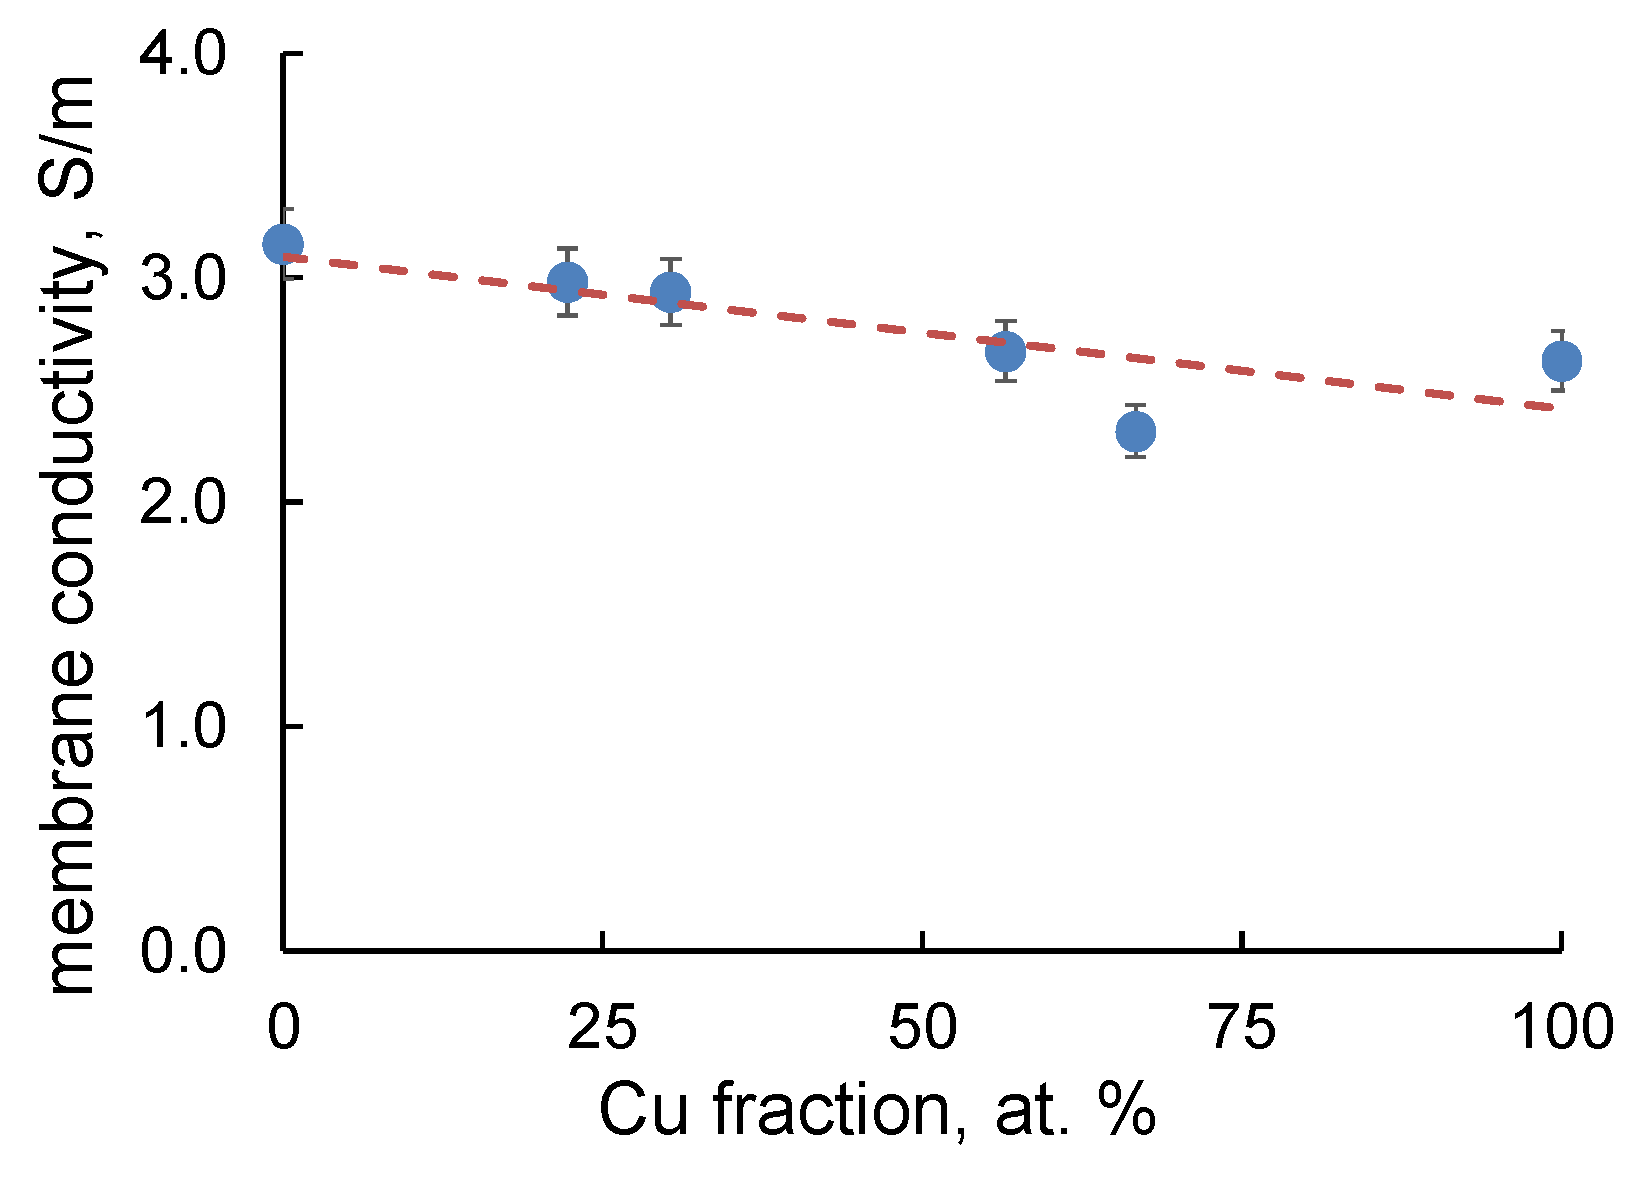
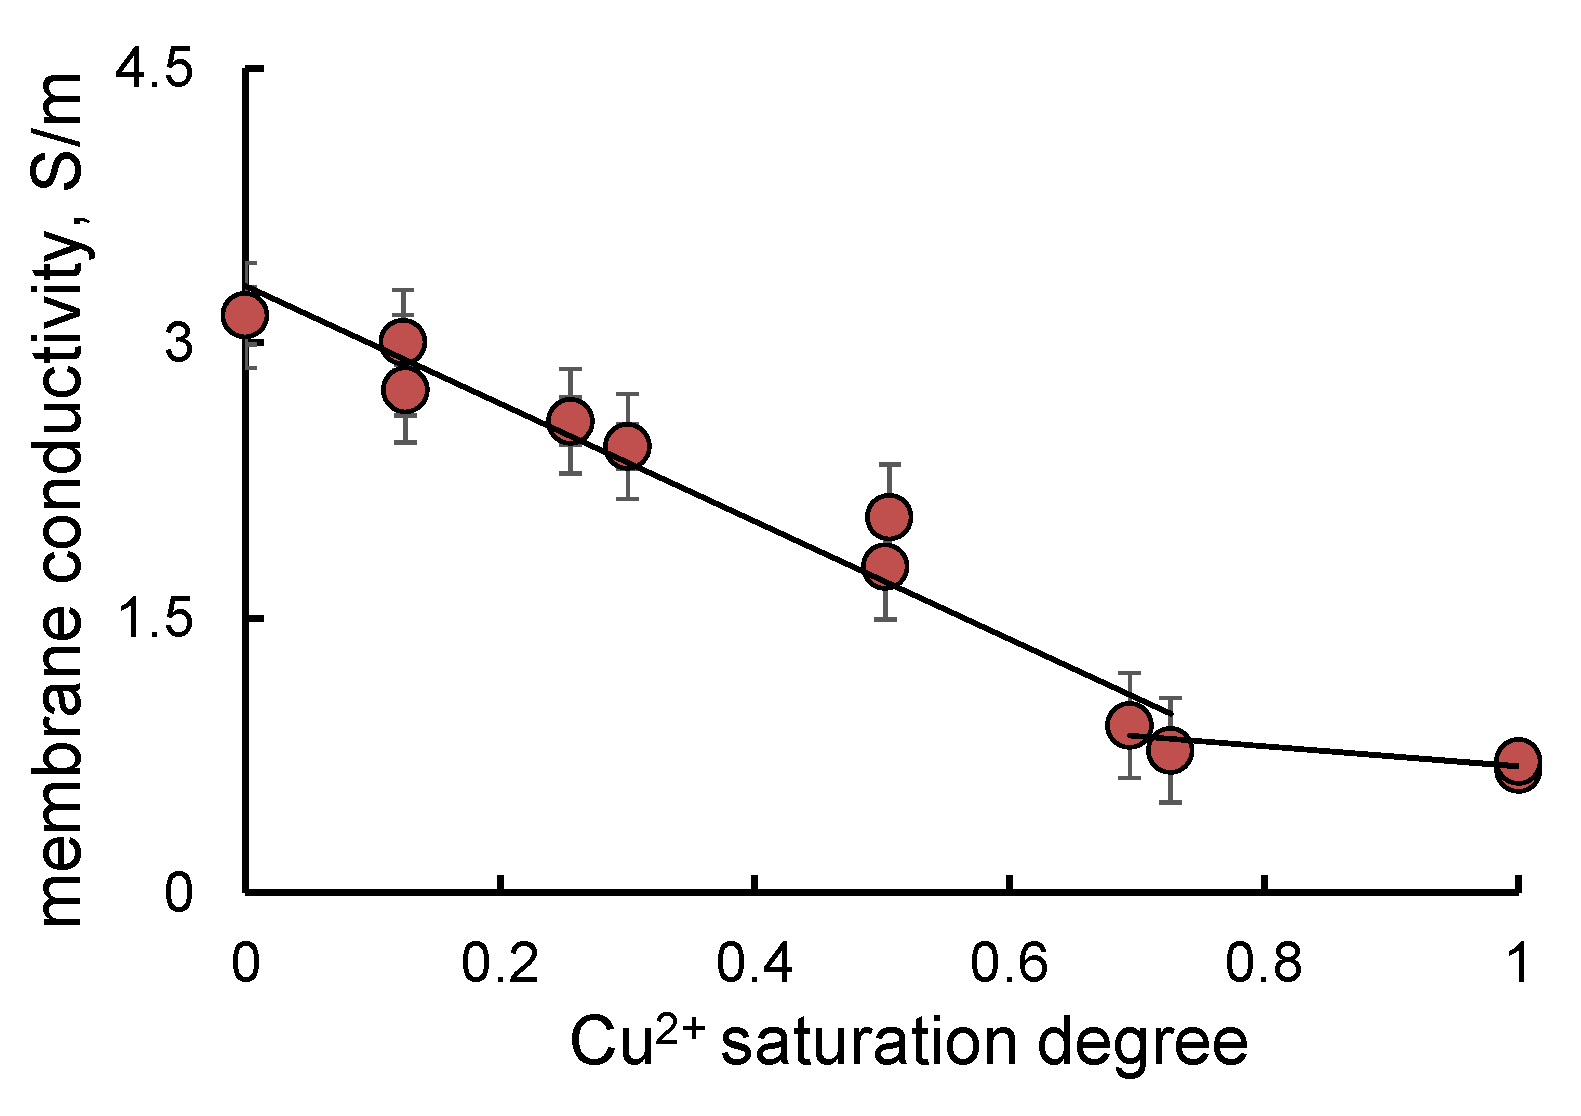
2.3. Membrane Properties in Mixed H+/Cu2+ Ion Form

The membrane saturation degree by Cu2+-ions after operation of MEA with S1–S5 catalysts is determined from the membrane conductivity data. Figure 7 presents the dependency of membrane conductivity on the fraction of Cu in PtCux/C catalysts. As can be seen in Figure 7, the increase in Cu content in the catalyst led to a decrease in membrane conductivity.
The membranes in mixed H+/Cu2+ form with known saturation degree by Cu2+-ions were obtained as described in Section 3.3. The conductivity of the membranes in mixed H+/Cu2+ ionic form as dependence on Cu2+ saturation degree is shown in Figure 8. One can see that the conductivity of the membrane decreased from 3.15 to 0.77 S/m as the Cu2+ fraction in the membrane rose from 0 to 100. The observed effect was caused by the higher mobility of H+-ions due to its relay-race transport mechanism in comparison with the Cu2+ ones. The presented dependence had two linear regions and could be used to estimate the Cu2+ content inside the membrane. It is well known that the cation exchange membranes possess high selectivity toward multi-charged ions in comparison with singly charged ones [35,36].
The joint analysis of Figure 7 and Figure 8 shows that the saturation degree of the membrane by Cu2+-ions after the operation of MEA with PtCux/C catalysts did not exceed 40%. The contamination of the membrane by Cu2+ ions led not only to an increase in its resistance, but also to the restriction of proton transport from the anode to cathode. The last effect influences the rate of the cathode reaction. The conventional diffusion limitations in PEMFC are associated with the restriction of oxygen transport to Pt nanoparticles due to the flooding of cathode space. In the case of bimetallic catalyst with high Cu content the reduced proton transport makes the major contribution to the diffusion limitations. A similar assumption was proposed in [37] from the results of investigating the characteristics of MEA with PtCo bimetallic catalysts.
The most probable mechanism of MEA efficiency decrease when using bimetallic catalysts in the “as prepared” state is the contamination of the perfluoropolymer in the catalytic layer by Cu2+-cations, rather than the proton exchange membrane. This effect could be eliminated by the preliminary chemical activation of catalysts to remove the “weakly bound” copper.

3. Materials and Methods

3.1. Materials

Vulcan XC-72 (Cabot Corp., Schaffhausen, Switzerland) was used as a carbon support to obtain the PtCux/C catalyst. Solutions of platinum (H2PtCl6·6H2O, Aurat) and copper (CuSO4·5H2O, extra pure grade, Vecton JSC, St. Petersburg, Russia) precursors were prepared using bidistilled water. An aqueous solution of sodium borohydride (NaBH4, Vecton JSC, St. Petersburg, Russia) was used as the reducing agent.
The MF-4SK perfluorinated membrane with sulfonic acid groups (thickness 220 μm) was purchased from JSC Plastpolymer (St.-Petersburg, Russia).

3.2. Catalyst Preparation

The method for the synthesis of PtCux/C electrocatalysts containing bimetallic nanoparticles with an alloy structure (solid solution) is based on the simultaneous reduction in copper precursors from a CuSO4·5H2O solution and platinum from H2PtCl6·6H2O in an aqueous organic medium with sodium borohydride at pH 9–11. The reaction mixture was kept under constant stirring for 60 minutes at a temperature of 23–25 °C. The resulting materials were separated by filtration, washed repeatedly with ethyl alcohol and bidistilled water, and then dried over P2O5. PtCux/C (S1–S4 in Table 1) samples with different metal ratios were obtained by the described method. The Cu/C material (S5 in Table 1), which was copper (copper oxide) nanoparticles distributed on the surface of a carbon support, was obtained by a similar method of reduction in an aqueous-organic medium (Table 1).
The commercial Pt/C (HiSPEC3000, Johnson Mattew, London, UK) analogue with a mass fraction of platinum equal to 20%, marked JM20 was used as a benchmark catalyst.
The content of metals (wt%) in the samples was determined by the weight of the incombustible residue obtained after the calcination of the materials at 800 °C for 40 min. It was assumed that it consisted of Pt and CuO. The ratio of Pt: Cu metals in PtCux/C was determined by X-ray fluorescence analysis (XRF) on a spectrometer with total external reflection of the X-ray radiation RFS-001 (Scientific Research Institute of Physics, Southern Federal University, Rostov-on-Don, Russia). Sample exposure time was 300 s.
To study the structural characteristics of the obtained Pt/C materials, we used the powder diffraction method. An ARL X`TRA powder diffractometer with a Bragg–Brentano geometry (θ-θ), CuKα radiation (λ = 0.154056 nm) at room temperature, was used to record X-ray diffraction patterns. X-ray diffraction patterns of the samples under study were recorded in the range of angles 20 ≤ 2θ ≤ 55 degrees by the step-by-step scanning method with a detector movement step of 0.02 degree. The X-ray diffraction patterns were processed with SciDavis software to properly extract the parameters of the peaks, this being of particular significance when they overlapped in the case of the small size particles. The average platinum crystallite size Dav was calculated using the Scherrer equation.
The method of catalytic ink preparation is described elsewhere [22]. The electrochemical behavior of the catalysts in a standard three-electrode cell was studied by cyclic voltammetry at 23 °C on a VersaSTAT 3 potentiostat (Princeton Applied Research, Oak Ridge, TN, USA). All potentials in this work are given with respect to the reversible hydrogen electrode (RHE). Each catalyst was electrochemically activated prior to electrochemical measurements. This procedure includes 100 cycles voltammetry (CV) in the potential range of 0.04–1.20 V with a scanning rate of 200 mV/s in a 0.1 M HClO4 solution in an argon atmosphere. After the activation stage, the electrolyte in the cell was replaced. Then, two CVs were recorded in the potential range of 0.04–1.20 V or 0.04–1.0 V, respectively, with a scanning rate of 20 mV/s for further calculation of the electrochemically active surface area (ESA) value. The amount of electricity consumed for the electrochemical adsorption Qad and desorption Qd of hydrogen was determined (using the sweep of the voltammogram in the Current—Time coordinates). The calculation took into account the charge spent on charging/discharging the electric double layer. The ESA was calculated using the standard method described in detail in [23].
The measurement of the catalytic activity in the ORR was carried out on the basis of the analysis of normalized voltammograms for a rotating disk electrode (RDE) in an electrolyte. To this end, the electrolyte was saturated with oxygen for one hour. The calculation of the kinetic current at a potential of 0.90 V (RHE) was carried out according to the Koutetsky–Levich equation [27,30]. The mass (Imass) and specific (Isp) activities were calculated by dividing the kinetic current by the mass of platinum on the electrode and by the determined ESA, respectively.

3.3. Membrane Transport Properties

The MF-4SK polymer electrolyte membrane with a thickness of 220 μm was used for this investigation (ion exchange capacity 0.92 mmol-eq/g for dry membrane). Using the unusually thick membrane permits study of its properties both before and after stress-testing of MEA. Preparing the membranes with certain saturation degree by Cu2+-ions was performed by soaking the membrane sample in H+-form in CuSO4 solution, whose concentration varied in the range 0.002–0.03 mol-eq/L. The membrane was held in solution until equilibrium and washed with distilled water before measurements. The fraction of Cu2+-ions inside the membrane (membrane saturation degree) was defined from the solution composition before and after sorption.
To measure the resistance of the membranes after MEA testing, the catalytic layer was removed from the membrane surface by cleaning with isopropyl alcohol, and the membrane sample was immersed in distilled water for 24 h.
Specific conductivity of the membrane was calculated from its AC resistance, measured in mercury-contact cell as described in [38].

3.4. MEA Formation and Testing

Catalytic ink consisted of catalyst (PtCux/C material in “as prepared” state), Nafion water dispersion and water–isopropanol solvent. This mixture was sonicated for 1 h and brushed on the GDL Toray (190 μm). The MEA active area was 5 cm2, and both electrodes had similar composition. The MEAs were pressed at 120 °C and 800 N·cm−2. Electrodes loading by Pt had close values for all catalyst samples and varied in the range 0.35–0.4 mg Pt/cm2. Cu loading for the Cu/C catalyst was 0.25 mg Cu/cm2, which corresponded to Cu loading in the PtCu2.0/C catalyst. The cell was tested at 25 °C with air (300 L/h) and H2 (20 L/h) supplied to the cathode and anode correspondingly. MEA stress-testing was performed by applying triangular pulses in the potential range 0.6–1.2 V for 10,000 cycles (potential scan rate was 100 mV/s [34,39]). The impedance spectra of MEA were measured in a frequency range 0.5 Hz–500 kHz immediately after the formation the MEA and after every 2000 cycles of stress-testing and used to determine the active resistance. The load current–voltage curves (CVCs) of MEA were measured in potentiostatic mode in a potential range 0.05–0.9 V after 10,000 cycles of stress-testing. AC resistance and CVCs were measured at least three times, and the results were averaged. All electrochemical characteristics of MEA were measured with a potentiostat-galvanostat Autolab 302N equipped with a FRA32 impedance unit (Metrohm Autolab B.V., Utrecht, The Netherlands).

4. Conclusions

The set of PtCux/C materials were obtained by the simultaneous reduction in copper and platinum precursors in the course of liquid-phase synthesis; ratio of metals varied from PtCu2.0/C to PtCu0.3/C; total mass fraction of metals changed from 20 to 40%. The composition, average crystallite diameter, electrochemically active surface area and activity in the oxygen reduction reaction were determined for the obtained electrocatalytic materials.
It was noted that the selective dissolution of copper during the activation stage was observed for all obtained PtCux/C materials. All investigated bimetallic electrocatalysts exhibited high activity in the reaction of oxygen electroreduction; however, the highest values of mass activity were demonstrated by samples PtCu1.3 and PtCu2.0, which contained a greater amount of the copper component in the “as prepared” state.
The electrochemical characteristics (current–voltage curves, active resistance during stress-testing) of the membrane electrode membrane assembled with bimetallic PtCux/C catalysts in the “as prepared” state were investigated. The increase in Cu content in PtCux/C materials led to a decrease in the current density of the membrane electrode assembly while its resistance was almost independent of the Cu fraction in the catalyst.
The estimation of the membrane saturation degree by Cu2+ ions after its operation as the polymer electrolyte in the fuel cell showed that the membrane saturation degree by Cu2+ did not exceed 40% even in the case of the Cu/C material. It was discovered that the main reason for the reduction in membrane electrode assembly characteristics when using PtCux/C materials is transport limitation caused by contamination of Nafion in the catalytic layer by copper ions.
The preliminary acid treatment of PtCux/C materials with a high initial copper content would make it possible to obtain highly efficient catalysts with a reduced selective dissolution of copper in the MEA. Such de-alloyed materials will not have negative effects on the MEA. The investigation of electrochemical impedance spectra of MEA with PtCux/C catalysts could supplement the obtained results concerning the MEA contamination mechanisms.

Supplementary Materials

The following are available online at https://www.mdpi.com/article/10.3390/catal11091063/s1, Figure S1: Potentiostatic CVCs of MEA with PtCux/C catalysts in Tafel coordinates.

Author Contributions

Conceptualization, I.F. and A.A.; Methodology, I.F. and A.A.; Investigation, E.T. and A.P.; Data curation, E.T. and A.P.; Writing—original draft preparation, I.F. and A.A.; Writing—review and editing, I.F. and A.A.; Supervision, N.K.; Project administration, I.F. All authors have read and agreed to the published version of the manuscript.

Funding

This research was funded by the Russian Foundation for Basic Research (grant number 20-08-00637).

Data Availability Statement

The data presented in this study are available on request from the corresponding author.

Conflicts of Interest

The authors declare no conflict of interest.

Abbreviations

CVCyclic voltammetry
CVCCurrent-voltage curve
EMFElectromotive force
ESAElectrometrically active surface area
GDLGas diffusion layer
LSVLinear sweep voltammetry
MEAMembrane electrode assembly
ORROxygen reduction reaction
PEMFCProton exchange membrane fuel cell
RDERotating disk electrode
RHEReversible hydrogen electrode
XRDX-ray diffraction
XRFX-ray fluorescence analysis

References

  1. Daud, W.R.W.; Rosli, R.E.; Majlan, E.H.; Hamid, S.A.A.; Mohamed, R.; Husaini, T. PEM fuel cell system control: A review. Renew. Energy 2017, 113, 620–638. [Google Scholar] [CrossRef]
  2. Gröger, O.; Gasteiger, H.A.; Suchsland, J.P. Review—Electromobility: Batteries or Fuel Cells? J. Electrochem. Soc. 2015, 162, A2605–A2622. [Google Scholar] [CrossRef]
  3. Banham, D.W.H.; Ye, S. Current Status and Future Development of Catalyst Materials and Catalyst Layers for Proton Exchange Membrane Fuel Cells: An Industrial Perspective. ACS Energy Lett. 2017, 2, 629–638. [Google Scholar] [CrossRef]
  4. Kongkanand, A.; Mathias, M.F. The Priority and Challenge of High-Power Performance of Low-Platinum Proton-Exchange Membrane Fuel Cells. J. Phys. Chem. Lett. 2016, 7, 1127–1137. [Google Scholar] [CrossRef] [PubMed]
  5. Chandran, P.; Ghosh, A.; Ramaprabhu, S. High-performance Platinum-free oxygen reduction reaction and hydrogen oxidation reaction catalyst in polymer electrolyte membrane fuel cell. Sci. Rep. 2018, 8, 3591–3606. [Google Scholar] [CrossRef]
  6. Prokop, M.; Drakselova, M.; Bouzek, K. A Review of the experimental study and prediction of Pt-based catalyst degradation during PEM fuel cell operation. Curr. Opin. Electrochem. 2020, 20, 204–207. [Google Scholar] [CrossRef]
  7. Auer, A.A.; Cap, S.; Antonietti, M.; Cherevko, S.; Deng, X.; Papakonstantinou, G.; Sundmacher, K.; Brüller, S.; Antonyshyn, I.; Dimitratos, N.; et al. MAXNET energy—Focusing research in chemical energy conversion on the electrocatlytic oxygen evolution. Green 2015, 5, 7–21. [Google Scholar] [CrossRef]
  8. Mahata, A.; Nair, A.S.; Pathak, B. Recent advancements in Pt-nanostructure-based electrocatalysts for the oxygen reduction reaction. Catal. Sci. Technol. 2019, 9, 4835–4863. [Google Scholar] [CrossRef]
  9. Jung, N.; Chung, D.Y.; Ryu, J.; Yoo, S.J.; Sung, Y.E. Pt-based nanoarchitecture and catalyst design for fuel cell applications. Nano Today 2014, 9, 433–442. [Google Scholar] [CrossRef]
  10. Chen, S.; Ferreira, P.J.; Sheng, W.; Yabuuchi, N.; Allard, L.F.; Shao-Horn, Y. Enhanced activity for oxygen reduction reaction on “Pt3Co” nanoparticles: Direct evidence of percolated and sandwich-segregation structures. J. Am. Chem. Soc. 2008, 130, 13818–13819. [Google Scholar] [CrossRef] [PubMed]
  11. Bele, M.; Gatalo, M.; Jovanovič, P.; Ruiz-Zepeda, F.; Šala, M.; Šest, E.; Hodnik, N.; Hočevar, S.; Gatto, I.; Saccà, A.; et al. Insight on Single Cell Proton Exchange Membrane Fuel Cell Performance of Pt-Cu/C Cathode. Catalysts 2019, 9, 544. [Google Scholar] [CrossRef] [Green Version]
  12. Sung, Y.; Hwang, J.; Chung, J.S. Characterization and activity correlations of Pt bimetallic catalysts for low temperature fuel cells. Int. J. Hydrogen Energy 2011, 36, 4007–4014. [Google Scholar] [CrossRef]
  13. Nørskov, J.K.; Rossmeisl, J.; Logadottir, A.; Lindqvist, L.; Kitchin, J.R.; Bligaard, T.; Jónsson, H. Origin of the overpotential for oxygen reduction at a fuel-cell cathode. J. Phys. Chem. B 2004, 108, 17886–17892. [Google Scholar] [CrossRef]
  14. Zhao, Y.; Mao, Y.; Zhang, W.; Tang, Y.; Wang, P. Reviews on the effects of contaminations and research methodologies for PEMFC. Int. J. Hydrogen Energy 2020, 45, 23174–23200. [Google Scholar] [CrossRef]
  15. Ferreira-Aparicio, P.; Gallardo-López, B.; Chaparro, A.M.; Daza, L. Physico-chemical study of the degradation of membrane-electrode assemblies in a proton exchange membrane fuel cell stack. J. Power Sources 2011, 196, 4242–4250. [Google Scholar] [CrossRef]
  16. Okonkwo, P.C.; Ige, O.O.; Barhoumi, E.M.; Uzoma, P.C.; Emori, W.; Benamor, A.; Abdullah, A.M. Platinum degradation mechanisms in proton exchange membrane fuel cell (PEMFC) system: A review. Int. J. Hydrogen Energy 2021, 46, 15850–15865. [Google Scholar] [CrossRef]
  17. Yang, H.N.; Lee, D.C.; Park, S.H.; Kim, W.J. Preparation of Nafion/various Pt-containing SiO2 composite membranes sulfonated via different sources of sulfonic group and their application in self-humidifying PEMFC. J. Membr. Sci. 2013, 443, 210–218. [Google Scholar] [CrossRef]
  18. Filippov, A.; Petrova, D.; Falina, I.; Kononenko, N.; Ivanov, E.; Lvov, Y.; Vinokurov, V. Transport asymmetry of novel bi-layer hybrid perfluorinated membranes on the base of MF-4SC modified by halloysite nanotubes with platinum. Polymers 2018, 10, 366. [Google Scholar] [CrossRef] [PubMed] [Green Version]
  19. Uddin, M.A.; Wang, X.; Ozdemir, M.O.; Qi, J.; Bonville, L.J.; Pasaogullari, U.; Molter, T. Distributed PEFC performance during cationic contamination. ECS Trans. 2014, 61, 49–55. [Google Scholar] [CrossRef]
  20. Zhu, D.; Wang, L.; Yu, W.; Xie, H. Intriguingly high thermal conductivity increment for CuO nanowires contained nanofluids with low viscosity. Sci. Rep. 2018, 8, 5258. [Google Scholar] [CrossRef] [Green Version]
  21. Pryadchenko, V.V.; Srabionyan, V.V.; Kurzin, A.A.; Bulat, N.V.; Shemet, D.D.; Avakyan, L.A.; Belenov, S.V.; Volochaev, V.A.; Zizak, I.; Guterman, V.F.; et al. Bimetallic PtCu nanoparticles in PtCu/C electrocatalysts: Structural and electrochemical characterization. Appl. Catal. A 2016, 525, 226–236. [Google Scholar] [CrossRef]
  22. Pavlets, A.; Alekseenko, A.; Menshchikov, V.; Belenov, S.; Volochaev, V.; Pankov, I.; Safronenko, O.; Guterman, V. Influence of Electrochemical Pretreatment Conditions of PtCu/C Alloy Electrocatalyst on Its Activity. Nanomaterials 2021, 11, 1499. [Google Scholar] [CrossRef]
  23. Pavlets, A.S.; Alekseenko, A.A.; Tabachkova, N.Y.; Safronenko, O.I.; Nikulin, A.Y.; Alekseenko, D.V.; Guterman, V.E. A novel strategy for the synthesis of Pt–Cu uneven nanoparticles as an efficient electrocatalyst toward oxygen reduction. Int. J. Hydrogen Energy 2021, 46, 5355–5368. [Google Scholar] [CrossRef]
  24. Rudi, S.; Cui, C.; Gan, L.; Strasser, P. Comparative Study of the Electrocatalytically Active Surface Areas (ECSAs) of Pt Alloy Nanoparticles Evaluated by Hupd and CO-stripping voltammetry. Electrocatalysis 2014, 5, 408–418. [Google Scholar] [CrossRef]
  25. Hong, Y.; Kim, H.J.; Lee, H.J.; Kim, J.; Choi, S.-I. Ni(OH)2 Decorated Pt-Cu octahedra for ethanol electrooxidation reaction. Front. Chem. 2019, 7, 608. [Google Scholar] [CrossRef] [PubMed]
  26. Ciapina, E.G.; Santos, S.F.; Gonzalez, E.R. Electrochemical CO stripping on nanosized Pt surfaces in acid media: A review on the issue of peak multiplicity. J. Electroanal. Chem. 2018, 815, 47–60. [Google Scholar] [CrossRef] [Green Version]
  27. Caballero-Manrique, G.; Garcia-Cardona, J.; Brillas, E.; Jaén, J.A.; Sánchez, J.M.; Cabot, P.L. Synthesis and Evaluation of PtNi Electrocatalysts for CO and Methanol Oxidation in Low Temperature Fuel Cells. Catalysts 2020, 10, 563. [Google Scholar] [CrossRef]
  28. Mayrhofer, K.J.J.; Strmcnik, D.; Blizanac, B.B.; Stamenkovic, V.; Arenz, M.; Markovic, N.M. Measurement of oxygen reduction activities via the rotating disc electrode method: From Pt model surfaces to carbon-supported high surface area catalysts. Electrochim. Acta 2008, 53, 3181–3188. [Google Scholar] [CrossRef]
  29. Gatalo, M.; Jovanovič, P.; Petek, U.; Šala, M.; Šelih, V.S.; Ruiz-Zepeda, F.; Gaberscek, M. Comparison of Pt-Cu/C with Benchmark Pt-Co/C: Metal Dissolution and Their Surface Interactions. ACS Appl. Energy Mater. 2019, 2, 3131–3141. [Google Scholar] [CrossRef] [Green Version]
  30. Durst, J.; Chatenet, M.; Maillard, F. Impact of metal cations on the electrocatalytic properties of Pt/C nanoparticles at multiple phase interfaces. Phys. Chem. Chem. Phys. 2012, 14, 13000–13009. [Google Scholar] [CrossRef]
  31. Garsany, Y.; Ge, J.; St-Pierre, J.; Rocheleau, R.; Swider-Lyons, K.E. Analytical procedure for accurate comparison of rotating disk electrode results for the oxygen reduction activity of Pt/C. J. Electrochem. Soc. 2014, 161, F628–F640. [Google Scholar] [CrossRef]
  32. Wei, C.; Rao, R.R.; Peng, J.; Huang, B.; Stephens, I.E.L.; Risch, M.; Xu, Z.J.; Shao-Horn, Y. Recommended practices and benchmark activity for hydrogen and oxygen electrocatalysis in water splitting and fuel cells. Adv. Mater. 2019, 31, 1806296. [Google Scholar] [CrossRef] [PubMed]
  33. Sulek, M.; Adams, J.; Kaberline, S.; Ricketts, M.; Waldecker, J.R. In situ metal ion contamination and the effects on proton exchange membrane fuel cell performance. J. Power Sources 2011, 196, 8967–8972. [Google Scholar] [CrossRef]
  34. Aliev, A.D.; Beketaeva, L.A.; Bogdanovskaya, V.A.; Burkovskii, E.V.; Kazanskii, L.P.; Korchagin, O.V.; Ivanitskii, A.A.; Kazanskii, L.P.; Kapustin, A.V.; Korchagin, O.V.; et al. Study of degradation of membrane-electrode assemblies of hydrogen-oxygen (air) fuel cell under the conditions of life tests and voltage cycling. Russ. J. Electrochem. 2014, 50, 773–788. [Google Scholar] [CrossRef]
  35. Falina, I.; Loza, N.; Loza, S.; Titskaya, E.; Romanyuk, N. Permselectivity of cation exchange membranes modified by polyaniline. Membranes 2021, 11, 227. [Google Scholar] [CrossRef]
  36. Luo, T.; Abdu, S.; Wessling, M. Selectivity of ion exchange membranes: A review. J. Membr. Sci. 2018, 555, 429–454. [Google Scholar] [CrossRef]
  37. Cai, Y.; Kongkanand, A.; Gu, W.; Moylan, T.M. Effects of Cobalt Cation on Low Pt-loaded PEM Fuel Cell Performance. ECS Trans. 2015, 69, 1047–1061. [Google Scholar] [CrossRef]
  38. Berezina, N.P.; Kononenko, N.A.; Dyomina, O.A.; Gnusin, N.P. Characterization of ion-exchange membrane materials: Properties vs. structure. Adv. Colloid Interface Sci. 2008, 139, 3–28. [Google Scholar] [CrossRef]
  39. Stariha, S.; Macauley, N.; Brian, T.S.; Lang, D. Recent Advances in Catalyst Accelerated Stress Tests for Polymer Electrolyte Membrane Fuel Cells. J. Electrochem. Soc. 2018, 165, F492–F501. [Google Scholar] [CrossRef]
Figure 1. XRD patterns of PtCux/C and Cu/C samples.
Catalysts 11 01063 g001
Figure 2. (a) Cycling voltammograms of PtCux/C and Pt/C samples (the 2nd cycle). Potential scan rate was 20 mV/s. The electrolyte was an argon-saturated 0.1 M HClO4 solution. (b) CO stripping and subsequent cyclic voltamperograms of PtCux/C and Pt/C samples. Potential scan rate was 40 mV/s. The electrolyte was an argon-saturated 0.1 M HClO4 solution.
Catalysts 11 01063 g002
Figure 3. LSV curves for ORR (a) and the corresponding dependences 1/Ik vs. ω−1/2 at the potential of 0.90 V (b). Rotation speed of 1600 rpm, potential sweep rate was 20 mV/s. Electrolyte oxygen-saturated 0.1 M HClO4 solution.
Catalysts 11 01063 g003
Figure 4. MEA resistance during the stress-testing.
Catalysts 11 01063 g004
Figure 5. Potentiostatic CVCs of MEAs with different catalysts.
Catalysts 11 01063 g005
Figure 6. Apparent exchange current of ORR in MEA.
Catalysts 11 01063 g006
Figure 7. Conductivity of the MF-4SK membrane after stress-testing as a function of Cu fraction in the PtCu catalysts.
Catalysts 11 01063 g007
Figure 8. Conductivity of MF-4SK in mixed H+/Cu2+-form as dependence on Cu2+ fraction inside the membrane.
Catalysts 11 01063 g008
Table 1. Composition and structural characteristics of the PtCux/C and Cu/C samples.
Sampleω(M), %ω(Pt), %Dav, nm
(XRD)
Position of 111
Maximum, 2θ,
Degrees
Atomic Ratio Pt:Cu
(XRF)
S123.621.63.140.7PtCu0.3
S221.418.82.641.0PtCu0.4
S325.717.92.641.1PtCu1.3
S441.025.02.341.1PtCu2.0
S530---Cu
Table 2. Electrochemical behavior and composition of PtCux/C catalysts after electrochemical cycling (activation stage).
SamplePt:Cu Atomic Ratio after Activation
(XRF)
ESA, m2/g (Pt) on Hads/HdesESA, m2/g (Pt) on COImass, A·g−1 (Pt)Isp, A·m−2 (Pt)Number of ēE1/2
S1PtCu0.2232281404.44.10.89
S2PtCu0.3233331695.13.90.91
S3PtCu0.2541454177.24.30.93
S4PtCu0.24333232910.03.70.94
JM20Pt80 1812.24.20.92
Publisher’s Note: MDPI stays neutral with regard to jurisdictional claims in published maps and institutional affiliations.

