Article

Testing PtCu Nanoparticles Supported on Highly Ordered Mesoporous Carbons CMK3 and CMK8 as Catalysts for Low-Temperature Fuel Cells

Laboratori d’Electroquímica dels Materials i del Medi Ambient, Secció de Química Física, Facultat de Química, Universitat de Barcelona, Martí i Franquès 1-11, 08028 Barcelona, Spain
*
Author to whom correspondence should be addressed.
Catalysts 2021, 11(6), 724; https://doi.org/10.3390/catal11060724
Submission received: 18 May 2021 / Revised: 5 June 2021 / Accepted: 8 June 2021 / Published: 10 June 2021
(This article belongs to the Special Issue Pt-M (M = Ni,Co,Cu, etc.)/C Electrocatalysts)

Abstract

:
Pt(Cu) nanoparticles supported on CMK3 and CMK8 ordered mesoporous carbons (OMCs) have been synthesized by electroless deposition of Cu followed by galvanic exchange with Pt. The structural characterization by high-resolution transmission electron microscopy and X-ray diffraction showed the formation of Pt(Cu) nanoparticles of 4–5 nm, in which PtCu alloys with contracted fcc Pt lattice and 70–80 at.% Pt was identified. The X-ray photoelectron spectroscopy analyses indicated that the Pt(Cu) nanoparticles were mainly composed of a PtCu alloy core covered by a Pt-rich shell, in agreement with the steady cyclic voltammograms, which did not show any Cu oxidation peaks. Electroactive surface areas up to about 70 m2 gPt−1 were obtained. The onset potentials for CO oxidation and the oxygen reduction reaction were more negative and positive, respectively, as compared to Pt/C, thus indicating higher activity of these Pt(Cu) catalysts with respect to the latter. Based on the corresponding binding energies, these better activities were attributed to the favorable geometric and ligand effects of Cu on Pt, which were able to reduce the adsorption energy of the intermediates on Pt. Pt(Cu)/CMK3 showed competitive mass and specific activities, as well as better stability than Pt/C.

Graphical Abstract

1. Introduction

The present energy demand is still mostly satisfied by fossil fuels that have a huge negative impact on the environment. For this reason, the development of cleaner energy sources to avoid the emission of hazardous substances is needed [1,2,3,4,5]. Considering that a great percentage of CO2 emissions is directly linked to transportation based on combustion engines, electric vehicles moved by proton exchange membrane fuel cells (PEMFCs) appear to be a greener alternative. PEMFCs can operate with an unlimited source of reactants (H2 and O2, which can be obtained by water splitting using renewable energies), near zero carbon emissions (only water is produced by the H2 cold combustion) and efficiencies (not limited by the Second Law of Thermodynamics) significantly higher than those of combustion engines [6,7,8,9,10,11,12,13].
The catalysts currently used in PEMFCs are based on Pt or Pt alloys, since this metal is at present the best for the hydrogen oxidation reaction (HOR) and the oxygen reduction reaction (ORR). However, the main drawbacks of Pt are that it is scarce and expensive, which has a big impact on the PEMFCs cost. Pt is also easily poisoned by CO impurities present in the H2 gas obtained from hydrocarbon reforming. The use of PtRu catalysts reduces this problem [14,15,16,17,18,19,20], but Ru is also scarce and expensive. For this reason, Pt is usually supported as nanoparticles on porous carbonaceous materials, aiming to reduce the total amount of metal used and maximize its surface area. The cost of the catalyst, which is a great obstacle for PEMFCs commercialization [18], is considerably reduced by following this strategy.
A more recent approach to cutting expenses is to synthesize carbon-supported multi-metallic catalysts, which can further reduce the Pt content. The use of sacrificial metals such as Cu or Ni that are cheaper and much more abundant than Pt, is particularly interesting because of their additional electronic effect on Pt. It has been proved that the structural properties of the noble catalyst present significant changes due to its interactions with other metals, leading to a remarkable improvement in its catalytic activity [14,15,16,17,18,19,20,21]. Pt-based catalysts alloyed with Ni, Co, Fe, Pd, and others showed specific activities for the ORR at 0.9 V vs. the reversible hydrogen electrode (RHE) 1.5–3 times higher than commercial Pt/C [22,23,24,25], due mainly to the electronic modification of the 5d orbitals of Pt [23] and/or the Pt lattice contraction [24]. Thus, dealloyed Pt25Co75 showed a specific activity of 0.55 mA cmPt−2 in front of 0.18 mA cmPt−2 for 30 wt.% Pt/C [25].
The PtCu bimetallic system has attracted interest in recent years [26,27,28,29,30,31,32,33,34], with several studies focused on PtCu alloys, Pt(Cu) core-shell structures and Cu-dealloyed PtCu nanoparticles supported on carbon blacks, mainly Vulcan® XC72 and XC72R. In most cases, Cu was first deposited and afterwards, it was partially displaced by galvanic exchange with Pt(IV). Copper nanoparticles were generated either by: (i) constant-potential deposition [26,35,36] or (ii) electroless deposition using reducing agents such as NaBH4 [37,38], formaldehyde [39], and NaBH4 or ascorbic acid in water-ethylene glycol mixtures [40,41,42,43,44]. These catalysts were studied to determine their CO tolerance and activity toward the methanol and ethanol oxidation reactions [26,38,39,42,44,45] and the ORR [33,34,40,41,46,47,48,49]. The PtCu/C catalysts provided ORR specific activities 2–3 times higher than those of Pt/C [47]. Thus, Guterman et al. [49] reported kinetic currents of 0.49 mA cmPt−2 at 0.9 vs. RHE for the ORR on Pt65Cu35, whereas it was of 0.19 mA cmPt−2 on Pt/C. The results were promising regarding the reduction of the amount of Pt used and the increase in the activity of the catalysts in such reactions.
The role of the catalyst support on the catalyst performance also needs to be studied. Most of the catalysts assessed for PEMFCs were supported on porous carbonaceous materials. They have high specific surface area, can present many different structures with tailorable surface chemistry, and facilitate the catalyst recovery [50,51,52,53,54]. This allowed the obtaining of high dispersion and narrow size distribution of Pt nanoparticles, the use of the noble metal then being more efficient. Carbon blacks such as XC72R have been the most used supports for energy conversion applications. They are cheap materials with a high surface area, electrical conductivity, and porosity [55,56,57,58,59]. However, the presence of organo-sulphur impurities (which can poison the metal catalyst) and deep micropores (which can trap the metal nanoparticles, making them inaccessible to the ionomer and reactants) can limit the catalyst performance. In addition, carbon blacks are unstable at high temperatures, so they can suffer corrosion while the cell is working [60,61,62,63]. For all these reasons, carbon blacks may not be the best supports and therefore, novel alternatives have been tested.
Different papers on the use of graphene [64,65], carbon nanotubes (CNTs) [66,67,68,69], and carbon nanofibers (CNFs) [54,70,71,72,73,74] have reported some of their advantages as supports because these highly graphitic carbons exhibit high specific surface areas, a wide potential window, and high chemical stability. Both CNTs and CNFs improved the durability of the catalysts when compared to Vulcan XC72 [67,68,69,70,71,72,73,74]. Promising results have also been reported for PtCu alloy structures when supported on CNTs and CNFs [48,75,76].
More recently, optimum properties for energy storage and conversion applications have been described for ordered mesoporous carbons (OMCs) synthesized by replication from silica templates [77,78,79,80,81]. It was reported that they presented monodispersed three-dimensionally attached mesospheres with large surface areas, thus facilitating the diffusion of reactants and by-products [51,53]. OMCs such as CMK3 yielded uniform distribution of small Pt clusters with high specific surface area and improved catalytic activities [82,83,84,85,86,87]. Gupta et al. [86] reported a high stability of PtCu catalysts supported on mesoporous carbon, with electrochemical active surface area (ECSA) and catalytic activity losses <2% after 1000 cycles, in contrast to the 70% loss determined for commercial carbon. The interaction between the carbon support and Pt plays a decisive role in its electrocatalytic activity when applied to PEMFCs. Thus, Liu et al. described the assembly of small Pt nanoclusters of about 1.4 nm on OMCs to 10 wt.% load, thus gaining in specific activity with respect to Pt(20 wt.%)-Vulcan, from 0.19 mA cm−2 at 0.9 V vs. RHE of the latter to 0.216 mA cm−2 [88]. Phan et al. [81] showed the excellent properties of mesoporous CMK3 and CMK8 for application in non-aqueous electrochemical double layer capacitors, in which the mesopores and the mesopore structures played the main role. Other strategies consisted of doping mesoporous carbons with other elements such as nitrogen [89,90], which was shown to favor the ORR through shifting the half-wave potential E1/2 toward the positive direction by about 40 mV and an increase by 2.5 times in the specific activity, from 0.29 to 0.71 mA cm−2 at 0.9 V vs. RHE with respect to commercial Pt/C. In this case, this ORR enhancement was assigned to the favorable interaction between Pt and N.
To gain better knowledge of the application of mesoporous carbon supports to PEMFCs, we present in this study the preparation of Pt(Cu) nanoparticles on CMK3 and CMK8 carbons, as received and also submitted to an activation process, with respective specific surface areas over 900 and 500 m2 g−1 [91], by direct Cu electroless deposition and further galvanic displacement with Pt. The structure and composition of the obtained catalysts have been characterized by means of X-ray diffraction (XRD), scanning electron microscopy (SEM), transmission electron microscopy (TEM), high-resolution TEM (HRTEM), energy-dispersive spectroscopy (EDS) and X-ray photoelectron spectroscopy (XPS). The ECSA of the catalysts was determined using cyclic voltammetry (CV) and CO stripping measurements. The ORR catalytic activity was tested by linear sweep voltammetry (LSV) using the rotating-disk electrode (RDE) technique. It is shown that the synthesized Pt(Cu)/OMCs presented better activity and stability than commercial Pt/C.

2. Results and Discussion

2.1. Structural Characterization

The XRD analyses of the supports and catalysts studied in this paper led to the diffractograms depicted in Figure 1a–c. Those corresponding to the carbon supports (Figure 1a) show wide peaks related to a short-range graphitic structure, with diffraction angles of the (002) and (100) planes at about 26° and 43°, respectively [92].
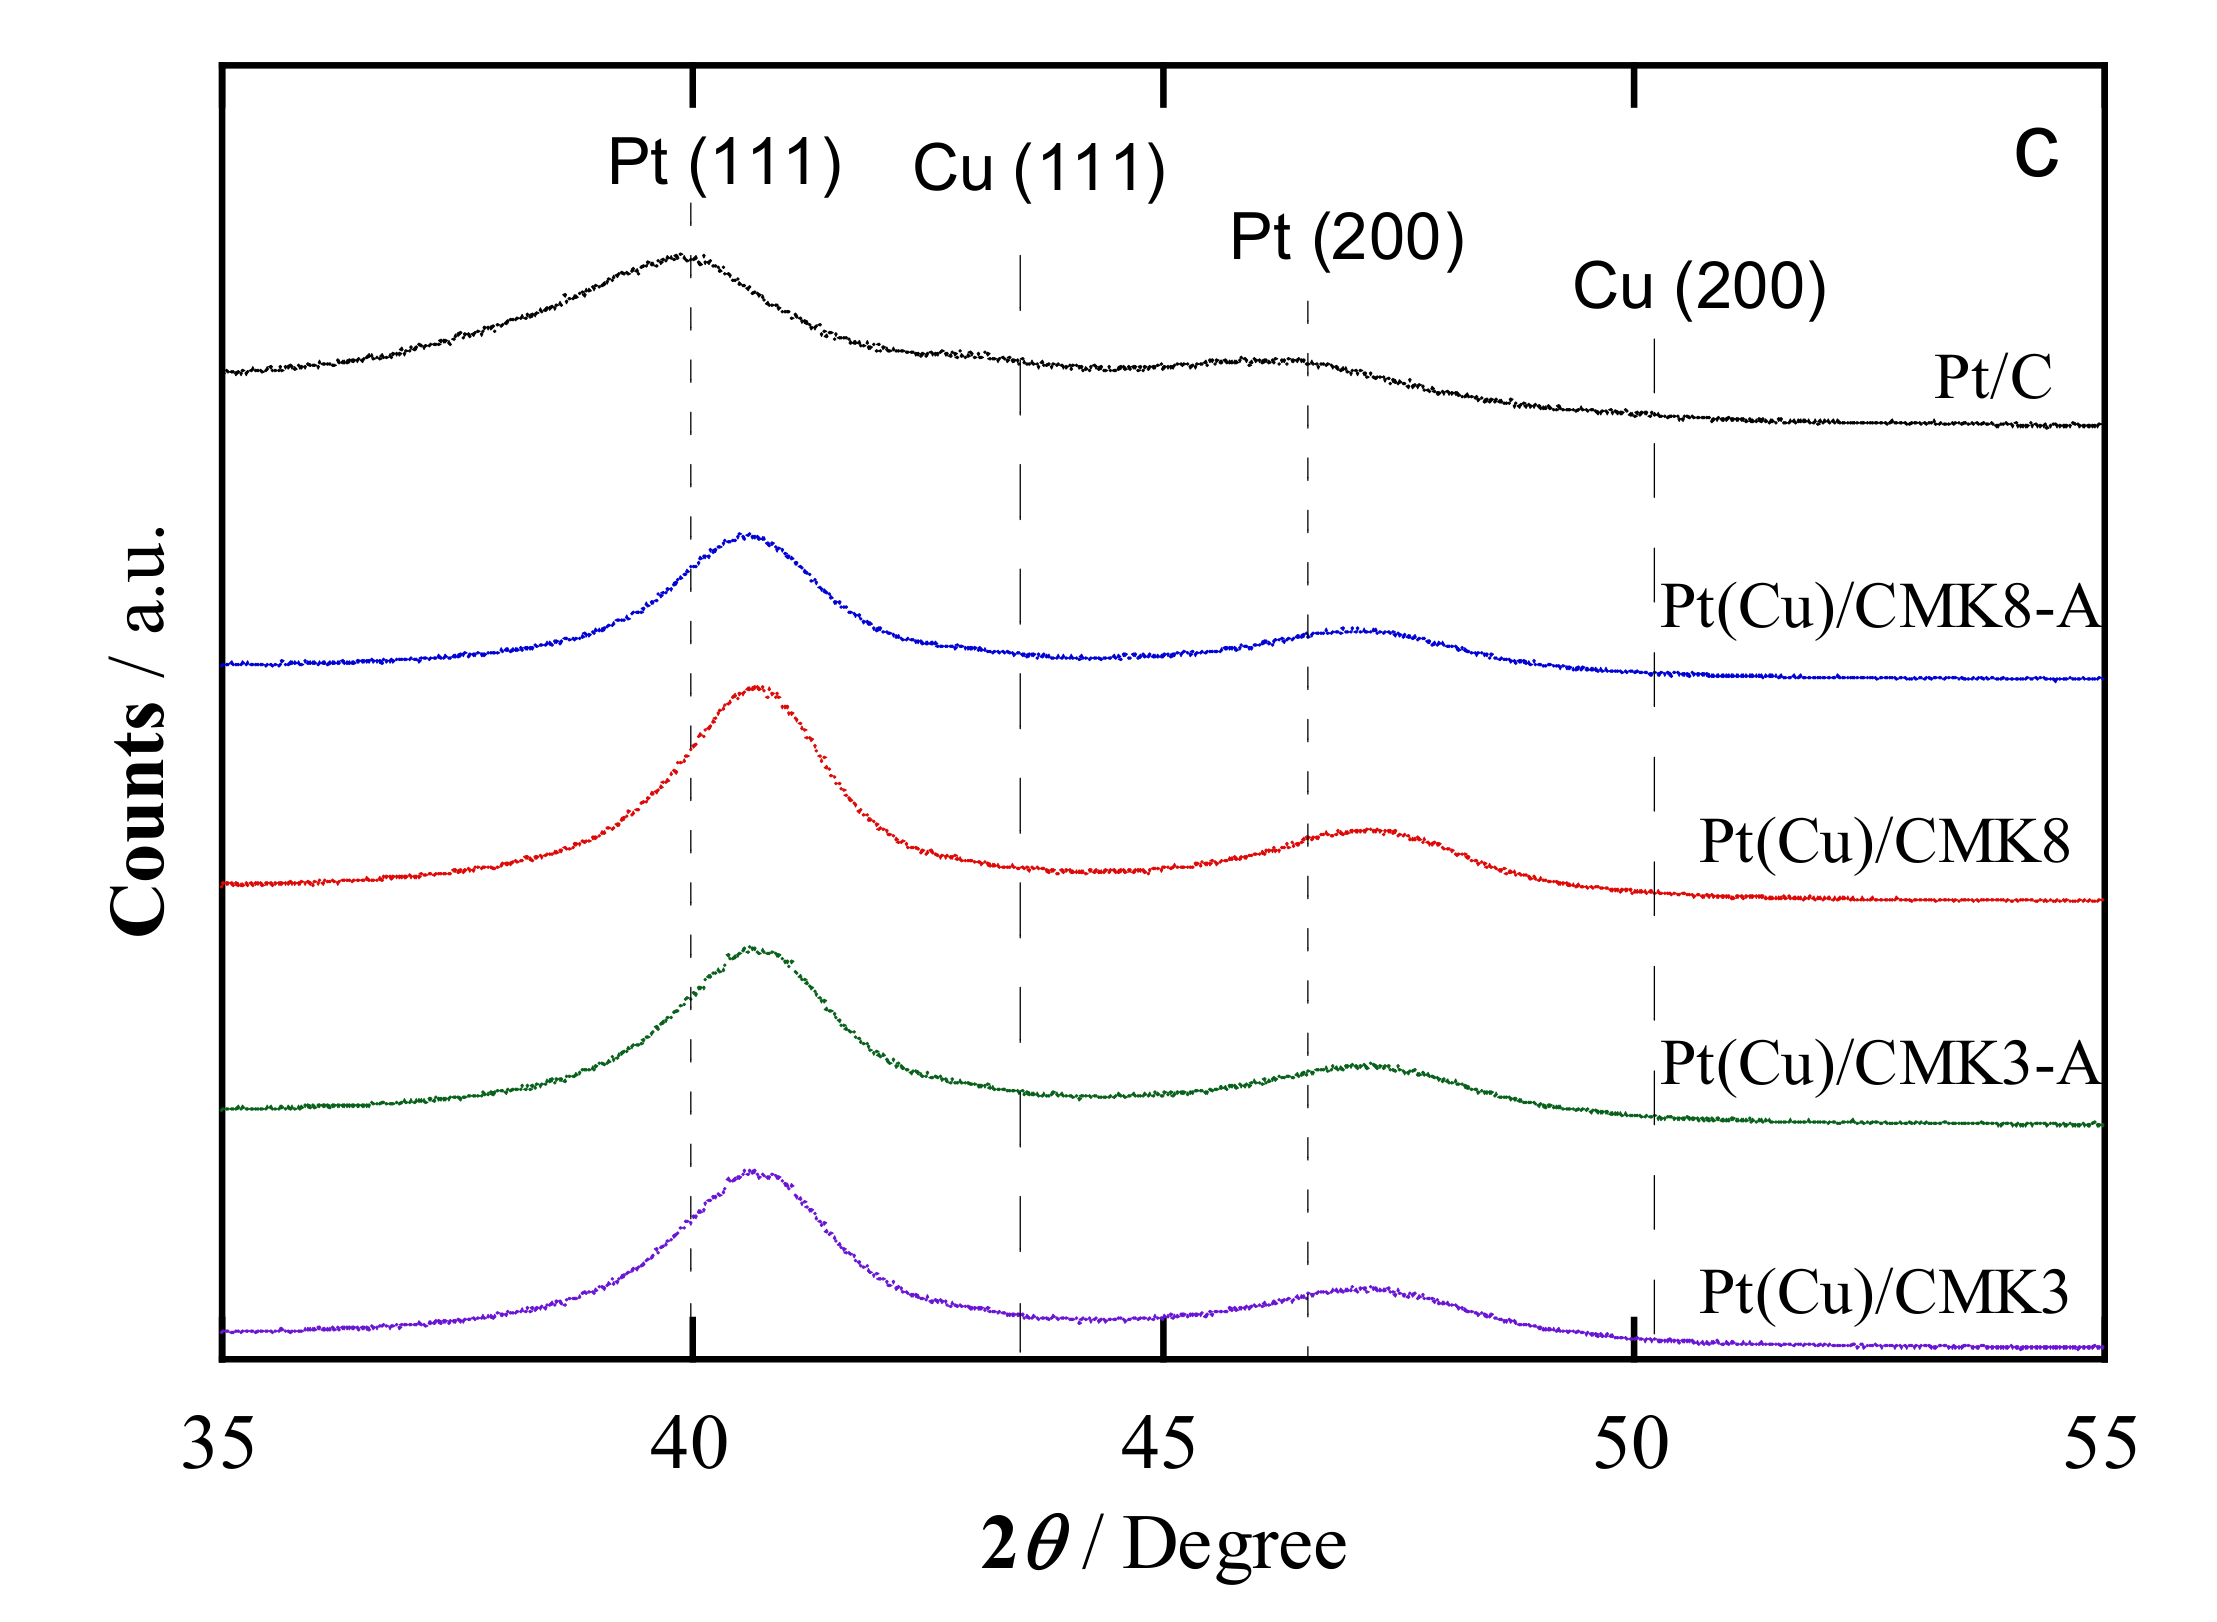
The XRD diffractograms of the Pt(Cu) catalysts supported on CMK3 and CMK8 and on the activated carbons CMK3-A and CMK8-A are shown in Figure 1b, where they are compared to commercial Pt/C. All these diffractograms have a similar profile, revealing the predominance of the Pt fcc structure. However, the Pt peaks in Pt(Cu) were slightly shifted with respect to those of Pt/C. Figure 1c is a magnification of Figure 1b to better highlight the shift of the Pt peaks in the Pt(Cu) catalysts. No XRD peaks corresponding to Cu species could be found, thus meaning that, if present, pure Cu and Cu oxides should be very small crystallites or in amorphous form. The Pt peaks of Pt/C at 2θ values of 40.0°, 46.3°, and 67.5° corresponded to fcc Pt (111), (200), and (220) planes, respectively [92]. The fcc peaks of Cu (111) and (200), which corresponded to 2θ angles of 43.3° and 50.5°, have also been marked in Figure 1c, whereas those of Pt(Cu) fell between those of pure Pt and pure Cu. The small shift in the Pt peaks of the Pt(Cu) samples with respect to the pure Pt can then be related to the Pt lattice contraction because of the formation of a PtCu alloy [22,93]. The atomic radius of Cu (145 pm) is smaller than that of Pt (177 pm), resulting in a decrease in the lattice parameter, which can be estimated using Vegard’s law [92]:
aPtCu = (1 − x) aPt + x aCu
where (aPtCu) is the lattice parameter of the PtCu alloy with a Cu atomic fraction x, and aPt and aCu the lattice parameters of pure Pt (0.3916 nm) and Cu (0.3608 nm), respectively.
The results obtained are summarized in Table 1, where the amount of Pt in the PtCu alloy is 2.7–4.5 times higher than that of Cu. This indicates that in the galvanic replacement, Pt oxidizes and replaces Cu with some lattice reordering that results in a PtCu alloy, which is in agreement with previous literature [44,94]. However, the Pt:Cu ratio in Pt(Cu) by EDS is lower than that in the PtCu alloy. This means that there was some amount of pure and/or oxidized Cu species in the catalysts, either amorphous or at least as nanocrystals too small to provide any signals.
The broadness of the peaks can be associated with the small size of the crystallites as well as to their possible non-uniform composition, which could result from the superposition of peaks corresponding to different phases [42]. Despite not being pure metals, Scherrer’s Equation (2) allowed the estimation of the crystallite size of the PtCu nanoparticles:
d = K λ B   cos   θ
where λ is the X-ray wavelength used, B is the width (in radians) of the diffraction peak at half the maximum, and K = 0.9. As shown in Table 1, the mean crystallite sizes were in the range of 4–5 nm, somewhat greater than that of Pt nanoparticles in the commercial Pt/C used as the reference, which was 2.6 nm. The synthesis of the catalysts could probably be tuned to further reduce the particle size. It is also shown in Table 1 that the nanoparticle size was slightly decreased by about 0.5 nm when the OMCs were previously activated. This agrees with the formation of more active centers for nanoparticle nucleation when activating [87].
The HRTEM images given in Figure S1a,b of the Supporting Information (SI) show the textural properties of the carbon supports. As can be seen in Figure S1a, CMK3 presented long ordered parallel channels, in agreement with the 2D hexagonal structure of the mesoporous SBA-15 template. In contrast, CMK8 presented the cubic channels typical of the mesoporous KIT-6 template. These observations agree with previous work in the literature [81,87,95].
The TEM micrographs of the different carbon-supported Pt(Cu) catalysts are collected in Figure S1c–f (SI). The black spots shown in this figure can be related to the Pt(Cu) nanoparticles, which appear to be successfully attached onto the OMCs either when these were used as received or upon activation. The nanoparticles appear to be rather spherical on CMK3, whereas they have a more elongated and zigzag shape on CMK8. This can be explained by the different form of the channels, 2D in CMK3 and cubic in CMK8, respectively [81]. The corresponding size distribution histograms obtained after counting more than 100 nanoparticles are shown as insets in the corresponding TEM micrographs. The mean values were about 4–5 nm (see Table 1) and presented a good agreement with those obtained from XRD.
The HRTEM micrographs of all the samples and their corresponding FFT analyses are presented in Figure S2 (SI). The representative spots are also included, with the corresponding d-spacings. It is interesting to observe that there were d-spacing values close to pure Pt of 0.227 and 0.140 nm [96], related to the Pt (111) and (220) planes, respectively, as shown in Figure S2a (SI). However, there were also smaller values, such as 0.223 and 0.220 nm, as depicted in Figure S2d,f (SI), respectively, which are consistent with a Pt lattice contraction due to Cu incorporation in the formation of the PtCu alloy, in agreement with the XRD analyses. This would also suggest that there was a surface Pt-rich structure on the nanoparticles.
The average compositions of the Pt(Cu) catalysts supported on the OMCs measured by EDS are also summarized in Table 1. The values are strongly dependent on the support since there is a significant difference between the amount of Pt and Cu in CMK3 and CMK8. The overall metal contents in the catalysts were in the range 35–44 wt.%. However, the amount of Pt in CMK8 was about 30 wt.%, higher than that of CMK3, which was about 20 wt.%. Conversely, the amount of Cu was only 6 wt.% in CMK8, whereas it was about 10 wt.% in CMK3. Converted to at.%, the Pt:Cu atomic ratios were about 2:1 on CMK8, although the at.% Cu exceeded that of Pt on CMK3. These differences may arise from the different availability of the active centers for the nucleation of the Cu nanoparticles and also by their availability by the Pt(IV) species when they have been formed. This is not surprising because CMK3 and CMK8 have different channel textures and thus, can condition the transport of the reactants [14,53,63,81].
If one looks at the at.% composition corresponding to the PtCu alloy as measured by XRD, the Pt:Cu ratios were in the range 3:1 to 5:1, values very different from those measured by EDS. A possible explanation could be that there was a significant amount of Cu occluded in a Pt-rich shell, higher in CMK3 than in CMK8. However, this does not seem very probable because the mean particle sizes estimated from XRD and TEM measurements are very similar, all around 4–5 nm, regardless of the support and, in addition, the PtCu alloy composition obtained from XRD was not so different in all the catalysts. Therefore, apart from the possibility of the nanoparticles having an inner, Cu-rich core, Cu was probably present in oxidized form outside the PtCu alloy structure, i.e., not bonded to Pt. For this reason, the EDS line profile of the section of the nanoparticles was attempted. Unfortunately, their size was too small, and the resolution was insufficient to determine the Pt and Cu distribution. Additional information about this point is discussed below from XPS analyses, which are able to provide compositional information of the most external part of the nanoparticles [44,48].
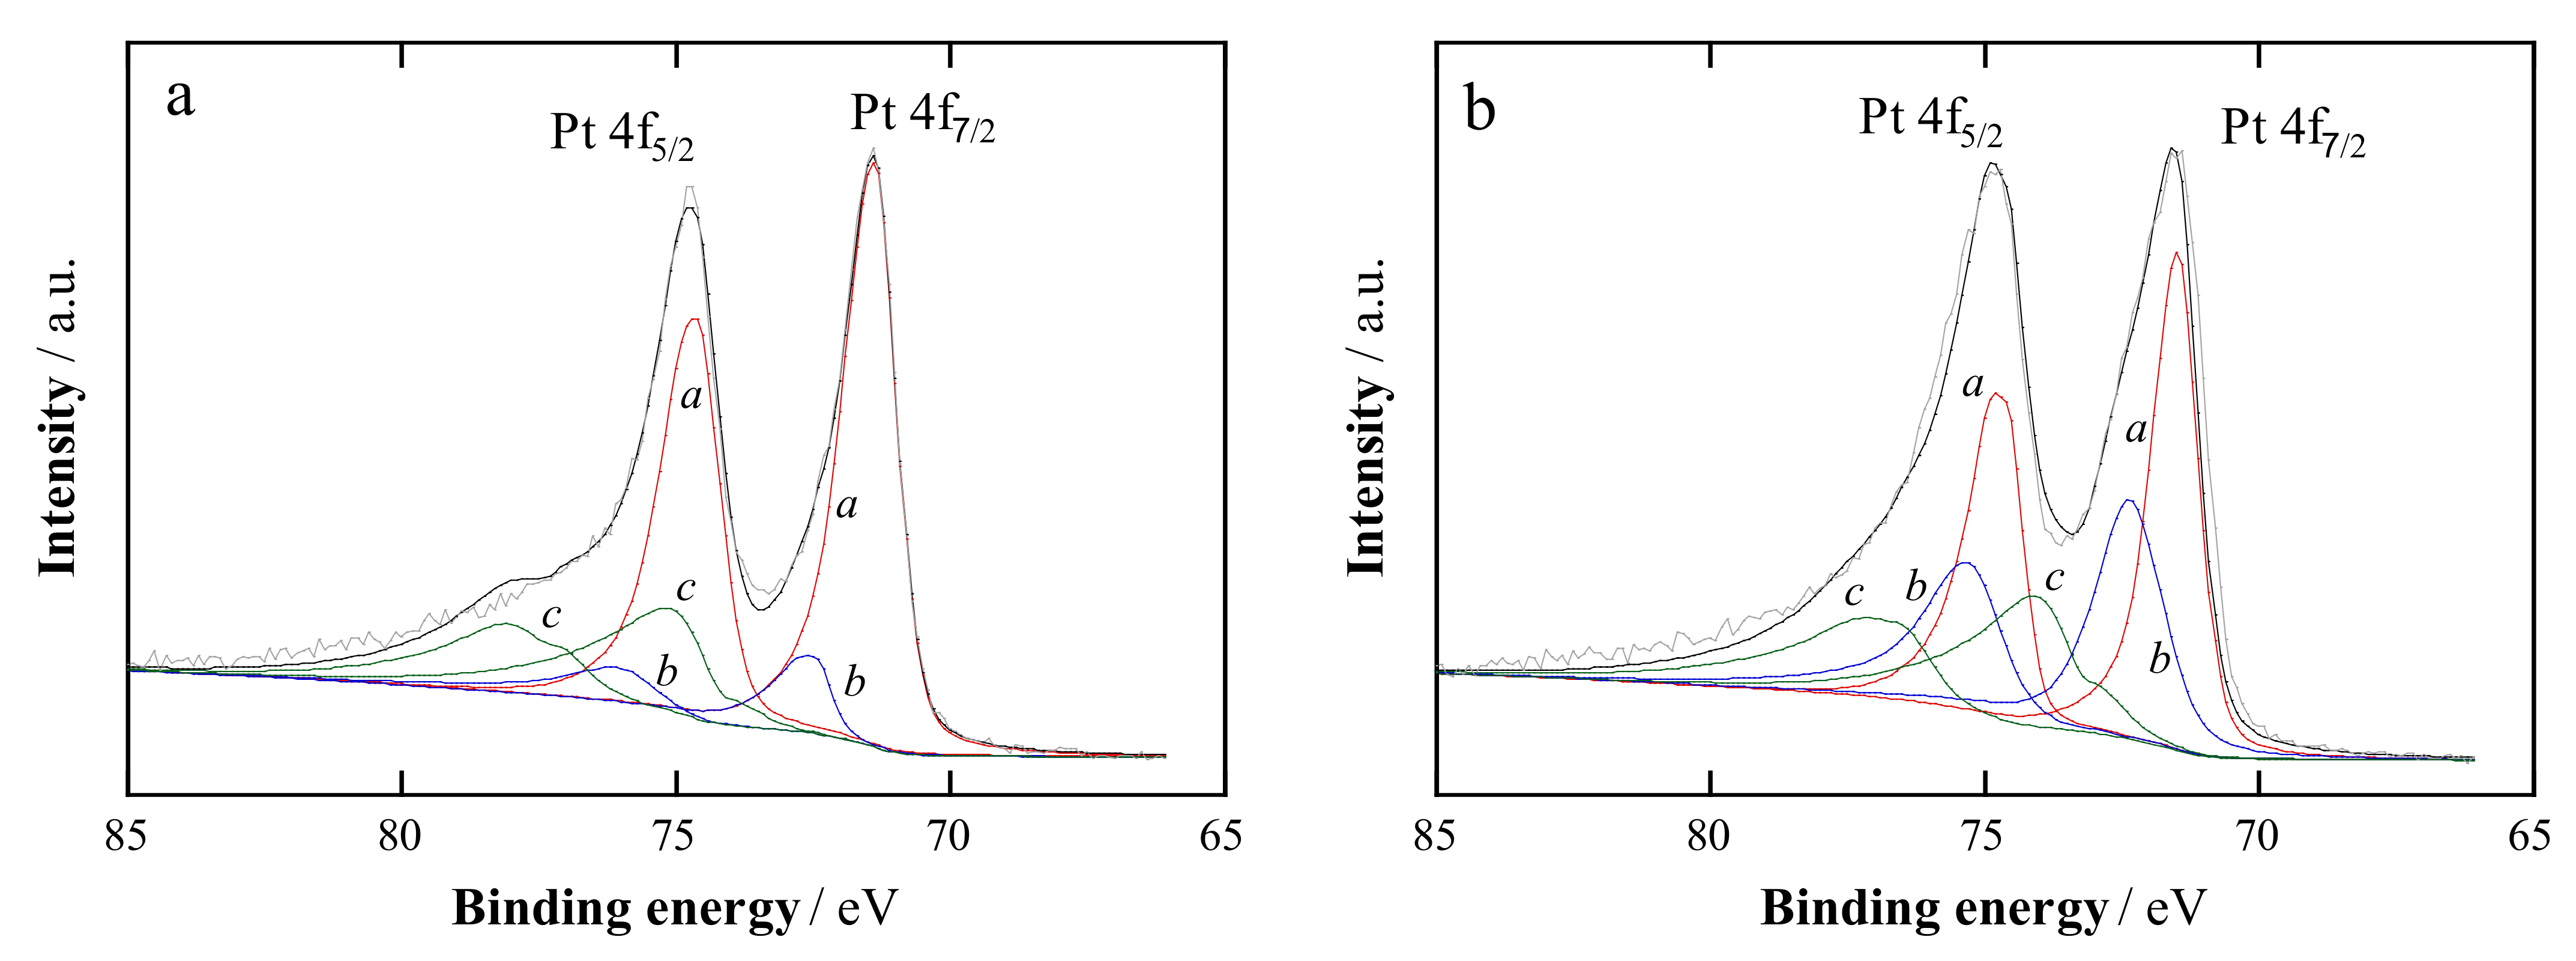
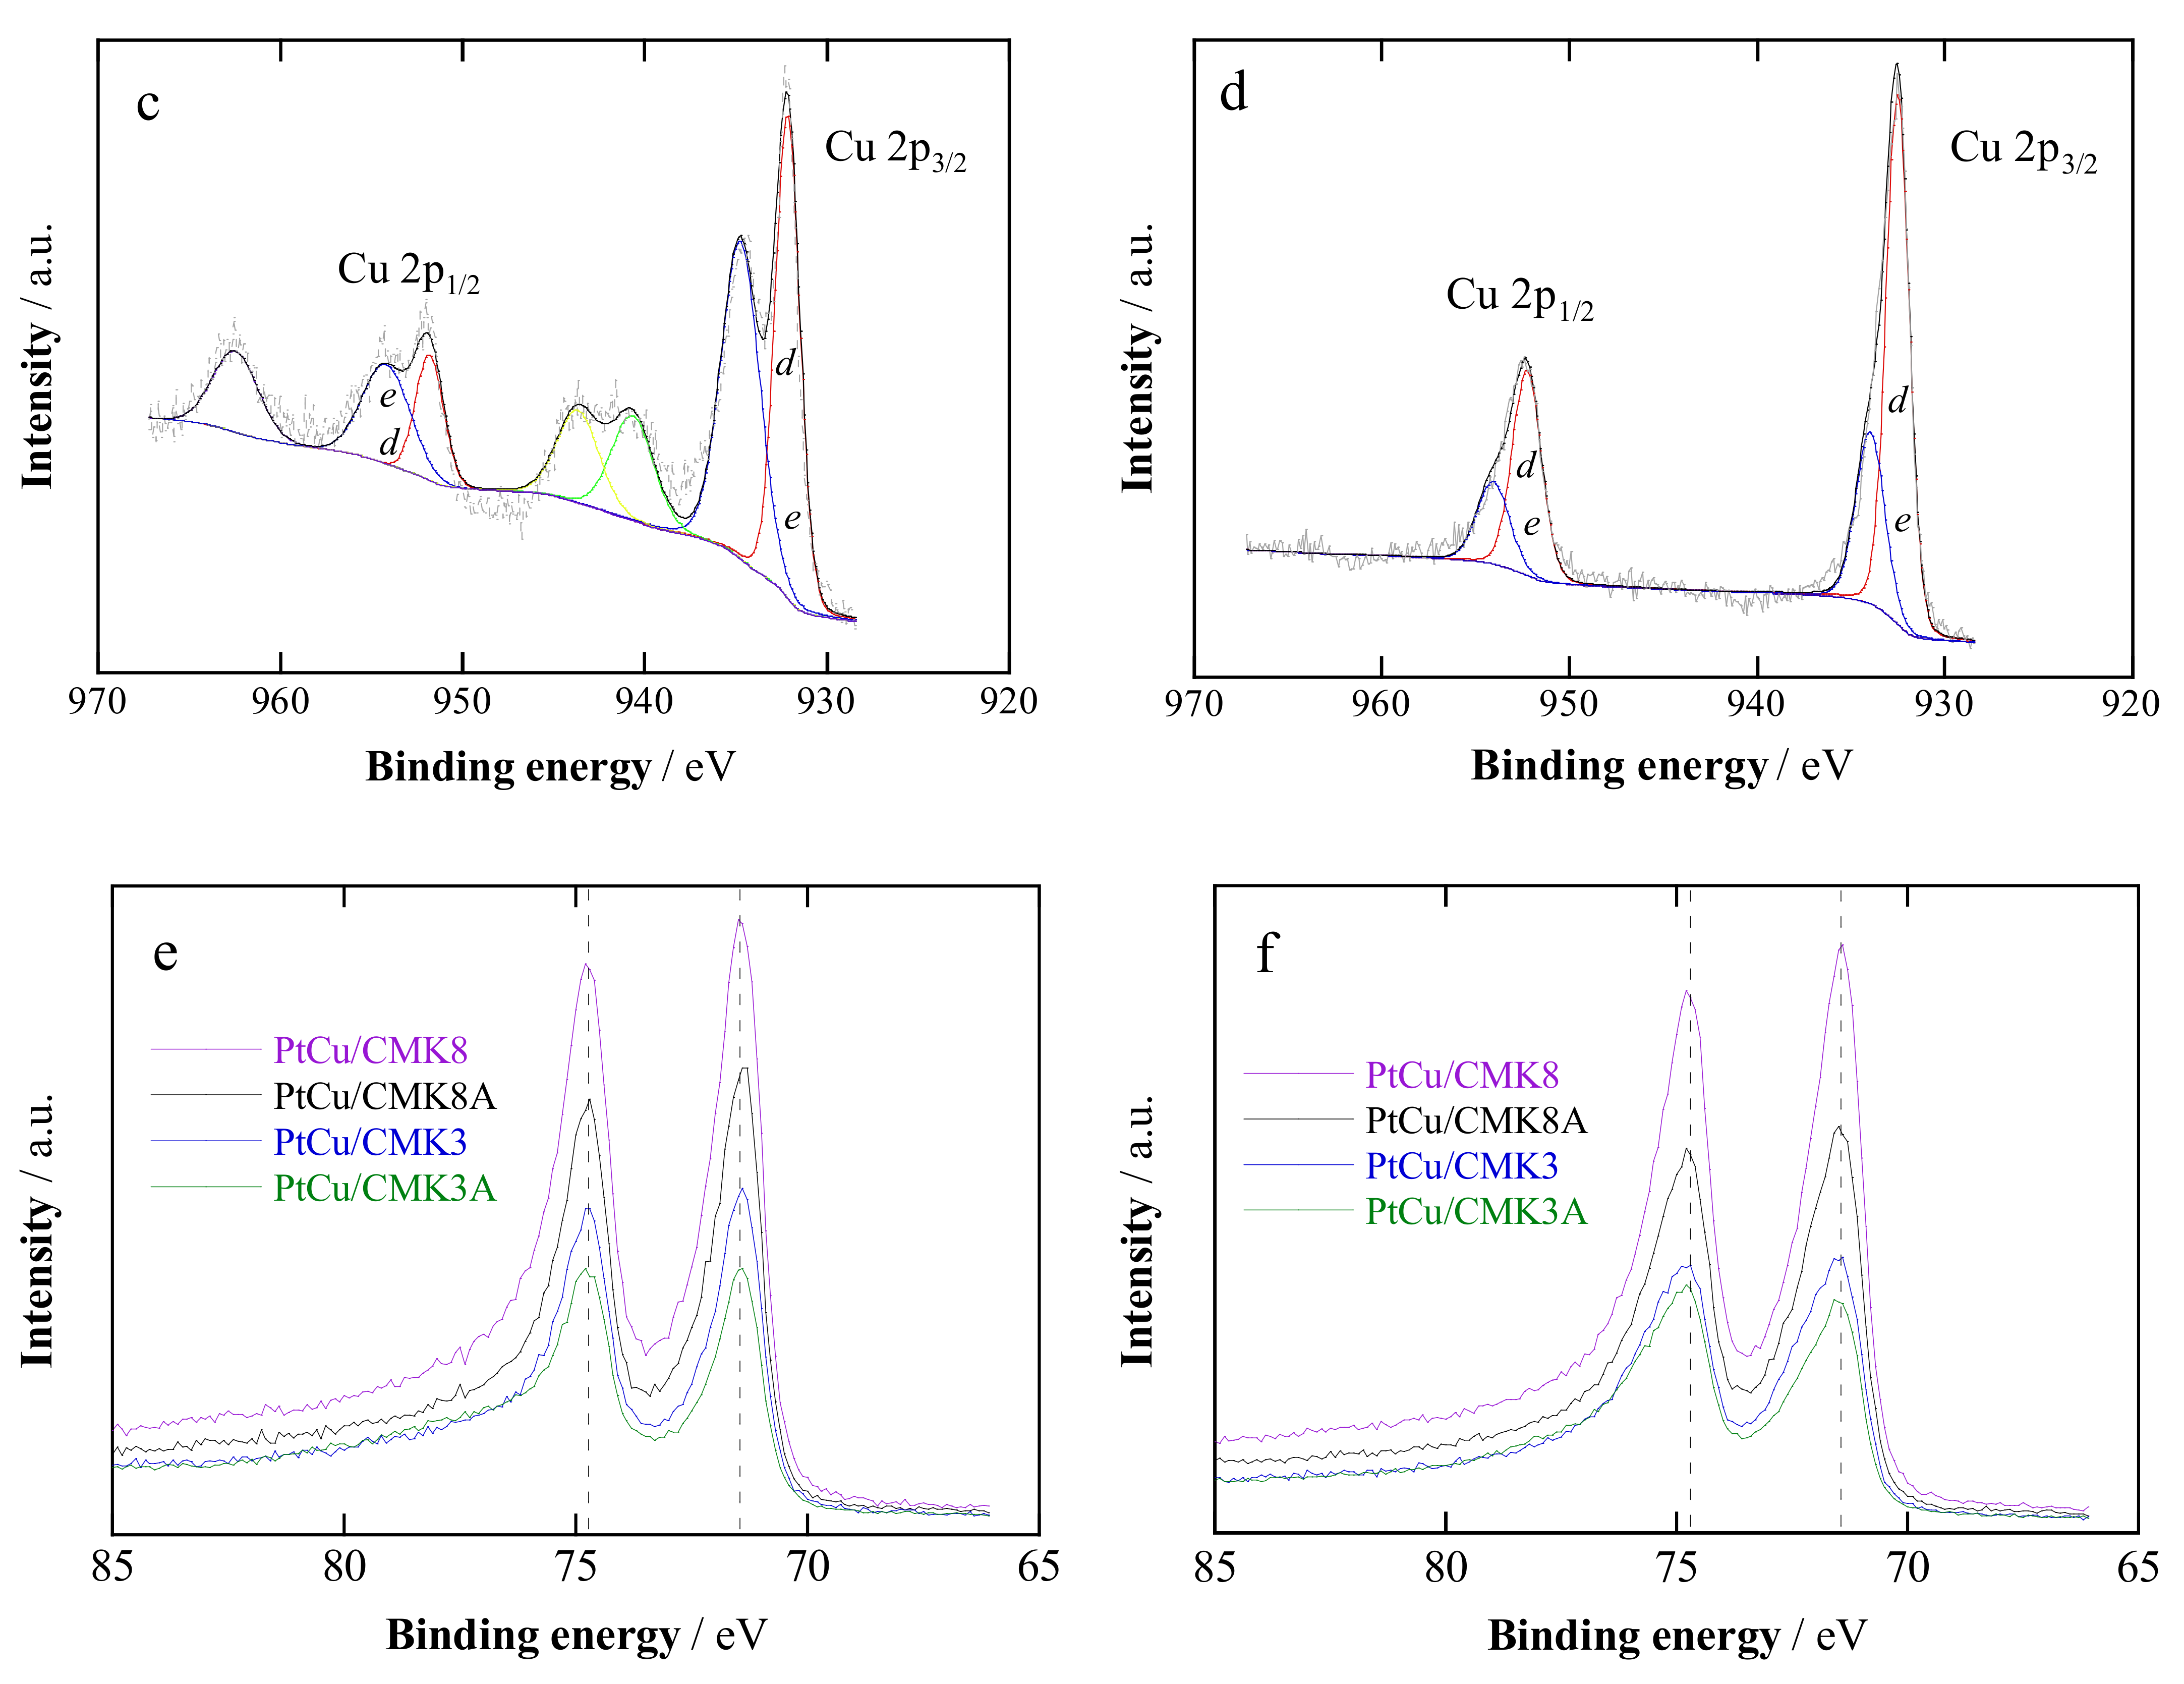
As described in the experimental part, the XPS spectra were acquired at 20° with respect to the plane on which the samples were deposited, thus aiming to better ascertain the composition of their most external layers. Compositional differences before any sputtering and after an Ar+ sputtering for 60 s were expected. It is worth mentioning that the mild initial sputtering normally performed to clean the surface from adventitious carbon was not carried out to avoid the Pt and Cu surface species removal. Figure 2a–d shows the Pt and Cu high-resolution spectra of Pt(Cu)/CMK3, measured before and after sputtering, together with the corresponding deconvolution considering the different possible oxidation states. The XPS spectra of all the samples obtained in this work were similar, thus indicating that the catalyst nanoparticles had similar compositional properties. It is worth mentioning that the measured Pt 4f7/2 and Pt 4f5/2 binding energies (BEs) before sputtering were 71.4 and 74.7 eV, respectively (see Figure 2a), and 71.5 and 74.8 after sputtering (Figure 2b). The Pt high-resolution spectra of all the specimens are depicted together in Figure 2e,f, where it is clearly shown that the BEs of the peaks are coincident, thus indicating the same Pt 4f7/2 and Pt 4f5/2 BE values for all the catalysts studied, which is confirmed by the corresponding peak deconvolution. They approach very well those reported previously for PtCu alloys also obtained from galvanic displacement (71.4 and 74.8 eV [44]), and for PtCu alloys obtained from the one-pot hydrothermal method (71.5 and 74.8 eV [97]). These values also strongly agree with those obtained for pure Pt supported on graphene nanosheets (71.4 and 74.8 eV [93]), pure Pt electrodeposited on a microporous carbon layer (71.5 and 74.8 eV [98]), and pure Pt on XC72 carbon (71.47 and 74.77 eV [99]). Values of 71.2 and 74.8 eV were reported for platinized carbon electrodes [100]. The higher Pt 4f7/2 binding energy could be due to the interaction with the support and the particle size [93].
It is worth mentioning here that the shift of the Pt peaks found in the XRD analyses of Figure 1b,c when forming the PtCu alloy as compared to pure Pt is in contrast with the absence of any peak shifts in the XPS Pt 4f peaks. Cu in Pt(Cu) in fact produces a Pt lattice contraction, and if the compressive strain were the only effect of Cu on Pt, a shift of the Pt 4f BEs to higher values would be expected [93,101]. As this was not observed in the Pt high-resolution spectra of Pt(Cu), we can also appreciate here the effect of charge transfer from Cu to Pt (ligand effect), which would produce a shift in the Pt BEs toward the opposite direction. In fact, the electronegativity of Cu (1.90) is smaller than that of Pt (2.28). The combination of both effects, compressive strain of the Pt l68attice together with charge transfer from Cu to Pt, could explain that the BEs of Pt 4f peaks did not significantly move from the values corresponding to pure Pt.
The BE values corresponding to the Pt(II) species were 72.6 and 76.2 eV before sputtering (Figure 2a) and 72.4 and 75.3 eV after sputtering (see Figure 2b), which reasonably matched with those reported previously for PtCu (72.7 and 76.0 eV [44], or 72.3 and 75.7 eV [97]), and pure Pt (72.4 and 75.7 eV [99]). The BEs of the Pt(IV) species were probably less accurate due to its amount and to the deconvolution approach, with values of 75.2 and 78.1 eV before sputtering and 74.1 and 77.1 eV after sputtering. However, the latter reasonably matched with those reported for PtCu (73.9 and 77.2 eV [44]) and for pure Pt (73.6 and 76.9 eV [99]).
It is also worth mentioning the BEs of metallic Cu 2p3/2 and 2p1/2, with respective values of 932.1 and 951.8 eV before sputtering (see Figure 2c) and 932.5 and 952.3 eV after sputtering (see Figure 2d). They reasonably agreed with 932.0 and 951.9 eV [44] and 932.1 and 951.8 eV [97] given for PtCu. A BE value of 932.6 eV has been reported for metallic Cu 2p3/2 measured in pure Cu [102]. The values corresponding to Cu(II) species were 934.8 and 954.3 eV before sputtering (see Figure 2c) and 934.0 and 954.1 eV after sputtering (see Figure 2d). In addition, satellite peaks of Cu oxide for BEs in the range 938–948 eV and over 959 eV are shown in Figure 2c, which did not appear after sputtering (see Figure 2d) due to the significant amount of Cu oxide [44,97].
The relative atomic composition of the Pt(Cu) nanoparticles was obtained from these analyses and the corresponding results are collected in Table 2. As shown, the relative Pt:Cu overall surface composition was dominated by Pt, in amounts in the range of 58–90 at.% without sputtering, which slightly decreased to 50–83 at.% after sputtering. These values were higher than the relative Pt:Cu overall composition obtained from EDS (see Table 1), in which Pt is in the range of 30–68 at.%. Note that XPS is a surface technique and Ar+ sputtering removes the external layers of the catalyst surface, whereas the EDS analyses showed the overall composition of the nanoparticles. Pt, if mainly present in the external part of the nanoparticles, should be the first to be removed and therefore, its relative amount should be reduced by sputtering, as found here. This is then a strong indication that the external part of the nanoparticles was Pt-rich, with its relative amount being smaller in their internal part.
The Pt and Cu high-resolution spectra of the different specimens studied, exemplified in Figure 2, show a significant contribution of Pt and Cu oxidized species. Thus, 43–68 at.% of Pt was in the form of Pt(0) before sputtering and varied to 43–74 at.% after sputtering. Although there was some increase in the oxidized Pt species in CMK3 and CMK3-A after sputtering, this cannot be considered relevant in front of the nanoparticle composition. Conversely, 38–52 at.% of Cu was in the form of Cu(0) before sputtering and 70–78 at.% after sputtering. This means that the Cu(II) species were mainly located on surface positions, later being removed in great part by Ar+ sputtering. Perhaps oxidized Cu was produced during the galvanic replacement by the Pt(IV) species. In any case, the oxidized Pt and Cu forms did not appear to be in crystalline form (or they were too small), or was in such small amounts as to be undetectable by XRD (see Figure 1) or HRTEM (see Figure S2 of SI).
The most indicative result is the Pt(0):Cu(0) relative ratio because it is considered to be the responsible for the catalyst activity. According to its relative composition before sputtering, the amount of Pt(0) was in the range of 65–94 at.%, whereas it was in the range of 40–83 at.% after sputtering. The clear decrease of the relative Pt content after sputtering strongly indicates that the surface of the PtCu alloy nanoparticles was rich in Pt and that the Pt relative amount was smaller in the core.
On the other hand, the PtCu alloy compositions resulting from the XRD spectra yielded 72–83 at.% Pt (see Table 1). This should be considered a mean alloy composition value, being reasonably comparable with those of the Pt(0):Cu(0) ratio from XPS analysis before sputtering (see Table 2), in the 65–94 at.% range. Apart from this, no evidence about a significant amount of pure crystalline Cu was obtained in the XRD spectra of Figure 1c and therefore, the structure of the Pt(Cu) nanoparticles could be described as mainly composed of a PtCu alloy core covered by a Pt-rich shell.

2.2. Electrochemical Characterization

Quasistationary cyclic voltammograms of the Pt(Cu) samples supported on CMK3 (curves a and b) and CMK8 (curves d and e) in deaerated 0.5 mol dm−3 H2SO4 solution at 20 mV s−1 are shown in Figure 3a,b, respectively, where they are compared to commercial Pt/C (curve c).
These curves represent the mass activities (jm), currents referred to the Pt load on the glassy carbon electrode (GCE) modified with the catalyst (see Table 3). As can be observed in this figure, the cyclic voltammograms of Pt(Cu) supported on the OMCs have a similar shape to those of Pt/C. The adsorption and desorption peaks of atomic H were displayed in the cathodic and anodic sweep in the range from 0.0 to 0.3 V, the Pt oxidation started at about 0.7 V in the anodic sweep, and the Pt oxide reduction was initiated at about 0.9 V in the cathodic sweep, in agreement with previous results in the literature [103]. Using our Pt(Cu) catalysts, the hydrogen adsorption/desorption peaks were not as well defined as those found for a perfect crystal faceting of Pt, thus suggesting that the Pt structure was conditioned by Cu alloying, as previously suggested for similar catalysts [26,48]. It is also apparent that Cu is not being dissolved from the Pt(Cu) nanoparticles because no additional peaks were displayed and the consecutive cyclic voltammograms achieved a steady state, thus indicating that a Pt-rich shell avoided the oxidation of the internal Cu.
The ECSAs of the different catalysts studied were estimated from Equation (3):
ECSA = Q H des 210   m Pt  
where QH-des is the charge of hydrogen desorption (µC), mPt is the Pt load (g) on the GCE and 210 (µC cm−2) is the charge associated with the stripping (or formation) of a monolayer of atomic hydrogen [104]. The ECSA values are summarized in Table 3.
As shown in this table, the ECSA values were about 70 m2 gPt−1 for the non-activated supports, which are somewhat smaller values than in the case of Pt/C, whereas they were about 50 m2 gPt−1 for the activated supports. With activation, we expected an increase in the number of active centers for the nucleation of the nanoparticles. In fact, the particle sizes on the activated supports, according to the XRD results, were about 0.5 nm smaller than for the non-activated ones (see Table 1). However, this did not lead to the expected ECSA increase. The ECSA decrease for the activated supports could then be explained by a larger agglomeration of the deposited Pt(Cu) nanoparticles, which would result in a reduction of accessible Pt active centers [53,55,62].
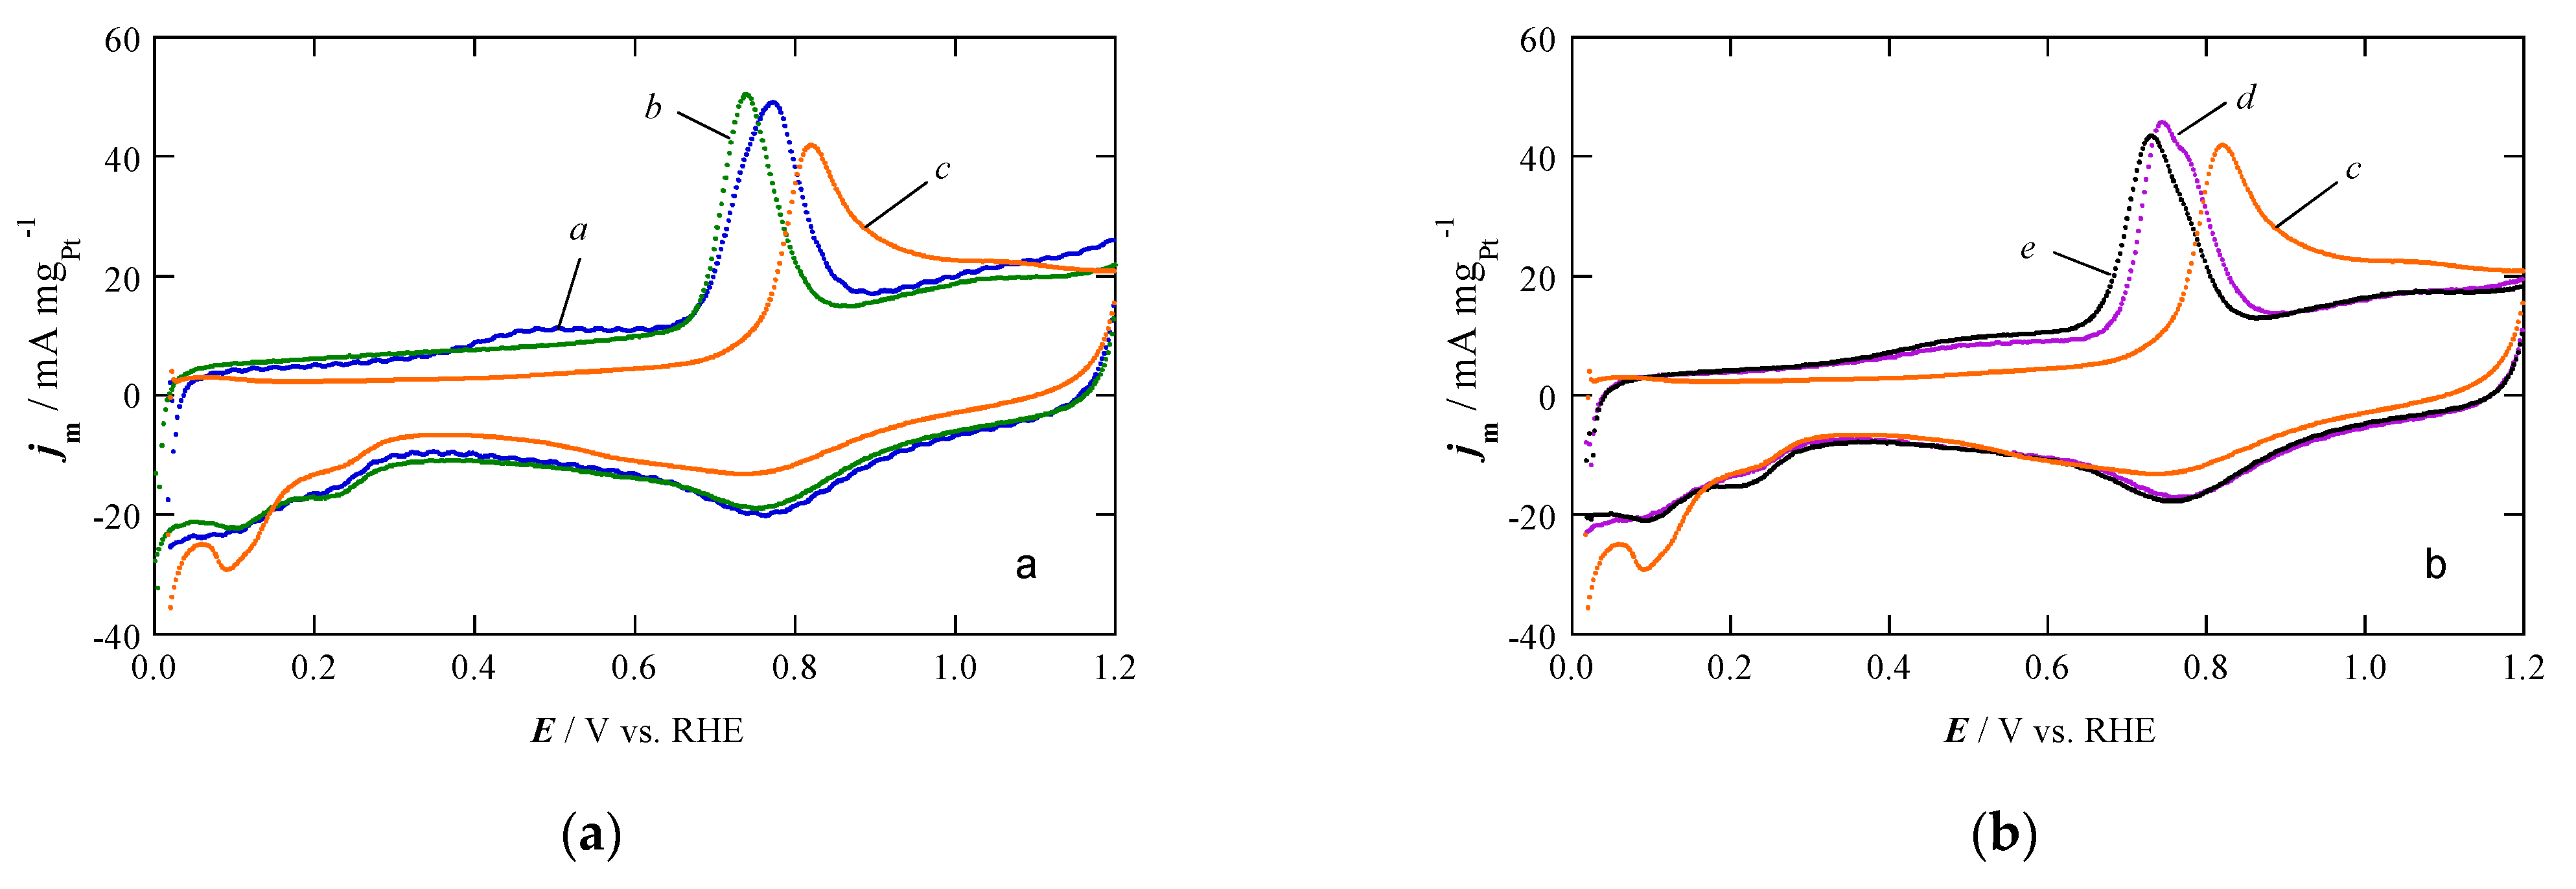
The CO stripping voltammograms as jm vs. potential are depicted in Figure 4a,b for the CMK3-type (curves a and b) and CMK8-type (curves d and e) supports, respectively, being compared to Pt/C (curve c in both plots). The peak observed in the anodic sweep, between 0.6 and 1.0 V, corresponded to the oxidative stripping of the previously adsorbed CO monolayer. It is worth mentioning the more negative onset potential for CO oxidation ECO of the Pt(Cu)/OMC catalysts as compared to that of Pt (see Table 3). The ECO values were about 0.65 V for all the Pt(Cu) catalysts, which were about 50 mV more negative than that of Pt/C. This negative shift with respect to Pt/C has also been found for other Pt(Cu) catalysts synthesized by potentiostatic [26] and electroless deposition of Cu [48], thus indicating that the Pt(Cu) catalysts were more tolerant to CO.
The CO stripping curves also allowed the obtaining of the ECSAs of the studied Pt(Cu) catalysts. These were determined from the CO desorption charge (QCO-des), taking the value of 420 µC cm−2 as the charge needed for the removal of a CO monolayer [104]. The corresponding results match very well with those measured from the hydrogen adsorption profile (see Table 3).
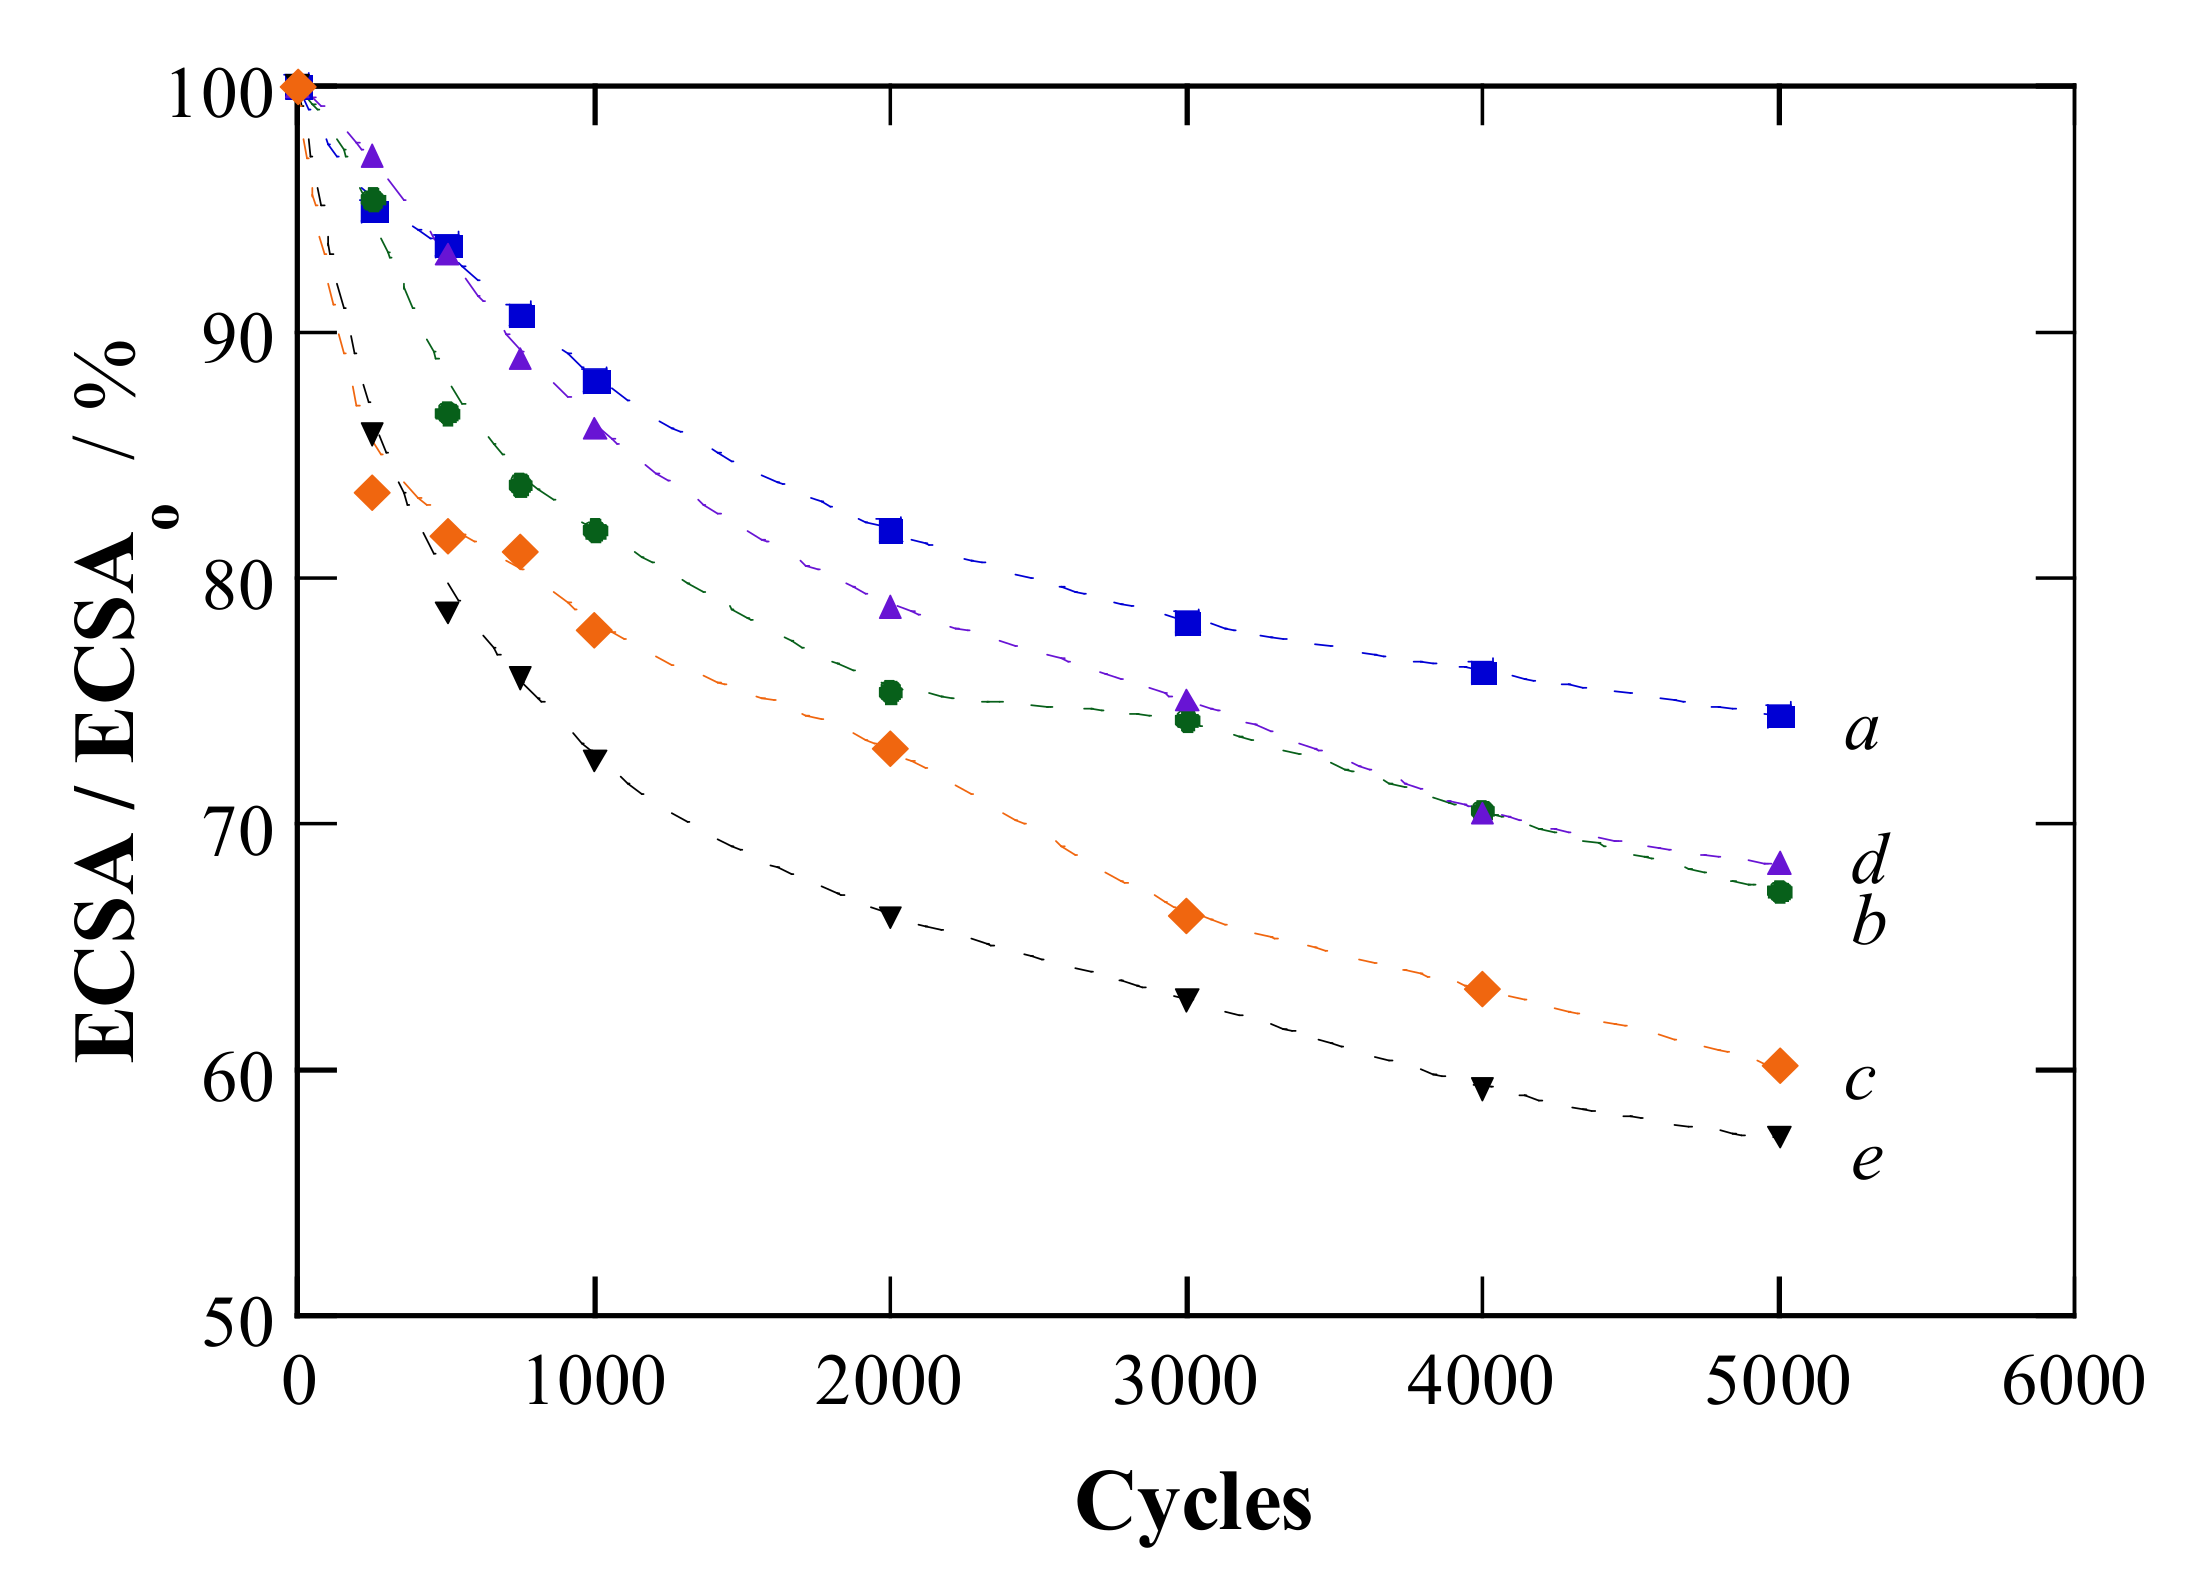
The relative stability of the catalysts was also studied since there is evidence that it can be improved when OMCs are used as supports [5,105]. This can be done by means of the accelerated degradation tests, consisting of continuously cycling the test samples up to a large number of cycles, taking an anodic limit in which the carbon support and Pt oxidation may occur, which may result in some atomic restructuration on the catalyst surface and possible aggregation of the nanoparticles [48]. In this case, the cyclic voltammograms were recorded between 0.6 and 1.0 V in deaerated 0.5 mol dm−3 H2SO4 solution at a scanning rate of 100 mV s−1. The decrease of the ECSA after the indicated number of cycles is represented in Figure 5, where the ECSA/ECSAo is the ratio between the ECSA at the given cycle and that obtained in the initial cycle, both measured using the QH-des of the cyclic voltammograms performed at 20 mV s−1 from 0.0 to 1.2 V.
Figure 5 highlights that Pt(Cu)/CMK3 and Pt(Cu)/CMK8 presented the smallest ECSA loss of 25% and 32%, respectively, after 5000 cycles, whereas the reference Pt/C showed a value of 40%. The ECSA losses of Pt(Cu)/CMK3-A and Pt(Cu)/CMK8-A, corresponding to 33% and 43%, respectively, were worse than those of non-activated supports. These values can be compared to previous results given in the literature for Pt(Cu)/CNF, Pt(Cu)/MWCNT, Pt(Cu)/XC72 [48] and Pt/C [68], with corresponding ECSA losses of 25%, 11%, 42%, and 46%. Non-activated CMK3 and CMK8 then appeared to be more resistant to degradation than XC72. This could be due to the particular structure of the OMCs being more resistant to structural change than the spherical carbonaceous particles in XC72. In fact, when the OMCs are activated, some structural changes should occur, thus leading to a less resistant support and therefore, to higher ECSA losses.
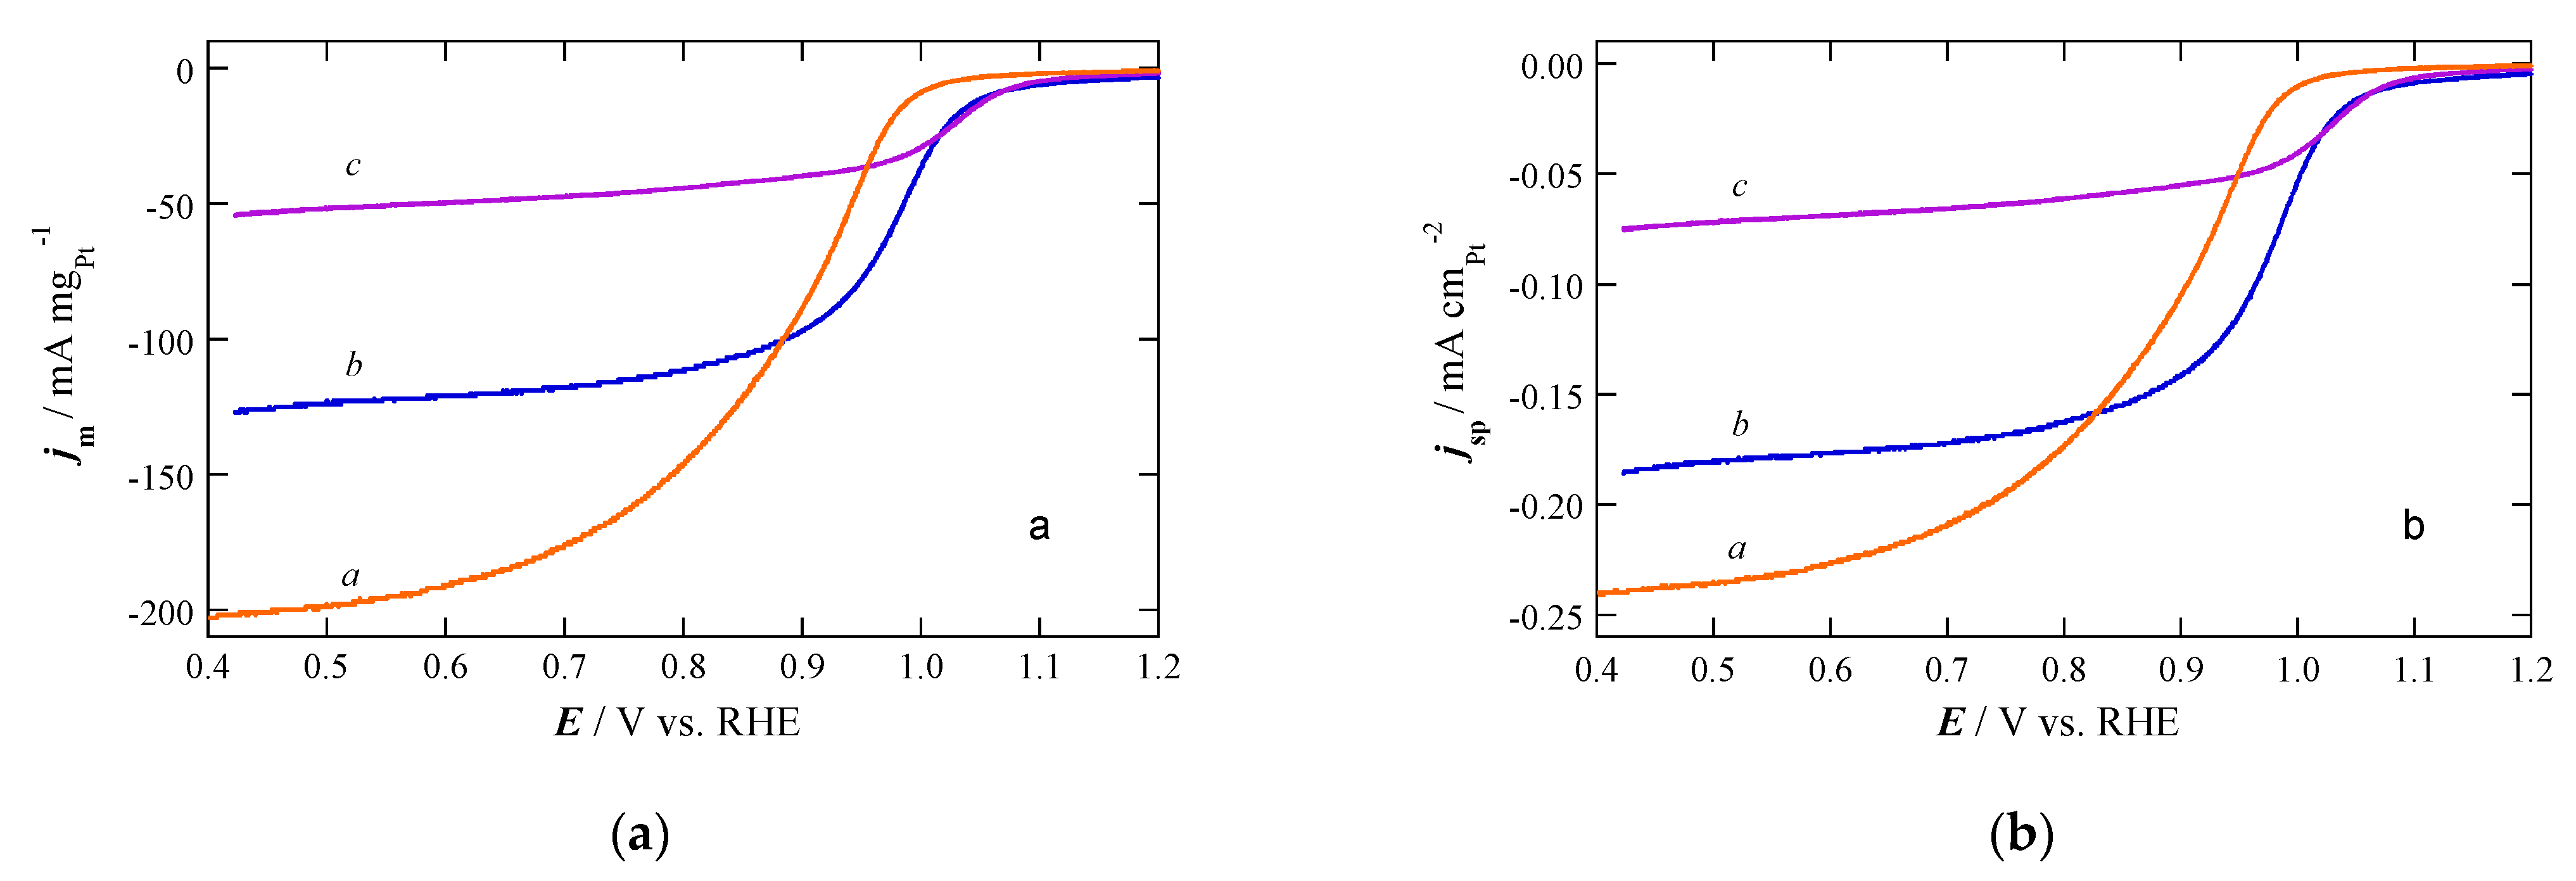
Considering the previous results of ECSA and stability, the activity of Pt(Cu)/CMK3 and Pt(Cu)/CMK8 in front of the ORR was studied by LSV using the RDE in O2-saturated 0.5 mol dm−3 H2SO4 solution at 1500 rpm by scanning the potential at 5 mV s−1 from 1.2 to 0.2 V. The linear sweep voltammograms are plotted in Figure 6a,b, using the jm values, which are a measure of the efficiency of the catalyst and the specific activities (jsp, currents referred to the ECSAs), indicating the activity of the corresponding catalyst surface. The same trend can be observed in both plots since the catalysts presented similar Pt loads and ECSAs. An exponential current density increase appeared at the beginning with limiting values at large overpotentials.
Figure 6a,b shows that the ORR started at about the same potential for Pt(Cu)/CMK3 and Pt(Cu)/CMK8 and that this potential was more positive than that of Pt/C. As the onset potential of the former moved in the positive direction toward Eo(O2/H2O), the reaction overpotential decreased, thus indicating that the supported Pt(Cu) catalysts were more active than Pt/C [49,106]. The catalytic activity is generally given by the specific current densities measured at a given potential in the kinetic region [106]. However, the limiting current densities cannot be directly compared because they depend on the catalyst loading, the nanoparticle size, the carbon support, and the thickness of the prepared thin-film electrode. Thus, limiting jm values of about 270 mA mgPt−1 were obtained for Pt(Cu)/CNF, in which the Pt(Cu) catalyst was prepared according to the same procedure employed here, with mean particle size and ECSA values of 2.9 nm and 71 m2 gPt−1, respectively [48]. In the same paper, we reported jm values of 180 mA mgPt−1 for Pt(Cu)/XC72 with mean particle size and ECSA values of 2.0 nm and 78 m2 gPt−1, respectively. They compare to the jm values in the range of 190–220 mA mgPt−1 measured using a disk rotating speed of 1600 rpm reported by Guterman et al. for different PtCu/XC72 catalysts synthesized by stepped borohydride reduction of copper and platinum precursors [49]. The textural properties of the carbons could also play a role, since a great specific surface area of the carbons such as those used here could lead to rather isolated particles with limited connectivity. In addition, the low graphitization degree of these carbons, as shown in Figure 1a, can limit their carbon conductivity and even their stability [107], thus affecting the ORR activity. The different morphology of the mesoporous channels of CMK3 and CMK8, long ordered parallel and cubic, respectively, could also have a role in the limiting current densities. This would be in agreement with the previous work of Phan et al. [81], who explained the better performance of organic supercapacitors based on CMK3 with respect to those based on CMK8 due to their different mesoporous structure, more suitable in CMK3 to improve the transport of the involved species in the charge-discharge cycles. This merits a detailed study when the mechanistic study of the reaction is pursued. However, this point is outside the scope of the present paper.
From these electrochemical tests, it is clear that the Pt(Cu) catalysts are more active in front of the CO oxidation and the ORR. The explanation should be found in the change of the electronic environment due to the charge transfer between the transition metal and Pt and the compressive strain in the Pt lattice caused by the alloy formation [93,108,109,110]. As obtained by our XRD results (Figure 1), there is an evident lattice strain when forming the PtCu alloy and, in addition, a charge transfer component from Cu to Pt can be suggested from the XPS results (Figure 2), as discussed above. Both effects can account for the greater activity of Pt(Cu) with respect to Pt/C in front of such reactions because they are able to reduce the adsorption energy of the intermediates on Pt [108]. In the case of the ORR, there is also an important effect of the Pt-Pt bonding length, in this case modulated by the compressive strain due to Cu alloying since it is a structure sensitive reaction [110].
The above results allow inferring the good performance of Pt(Cu)/CMK3 as catalyst, which merits further work to tune the nanoparticle deposition to increase the catalytic performance in front of the ORR and testing in real PEMFCs.

3. Materials and Methods

3.1. Reagents

Analytical-grade reagents and high-purity water (resistivity > 18.2 MΩ cm at 25 °C) obtained from a Milli-Q water purification system (Merck KGaA, Darmstadt, Germany) have been used along this paper to prepare all the solutions. The carbon supports for the catalysts were CMK3 and CMK8 ordered mesoporous carbons purchased from ACS Chemical Inc., Pleasant, MJ, USA, and obtained from mesoporous SBA-15 and cubic Ia3d KIT-6 silica templates, respectively [91]. CMK3 was type B, with pore diameters of about 3.8–4.0 nm, total pore volumes of 1.2–1.5 cm3 g−1, and a specific surface area of over 900 m2 g−1. CMK8 presented pore diameters in the range of 3.2–6.6 nm, total pore volumes of 0.7–1.1 cm3 g−1, and a specific surface area of over 500 m2 g−1. For the electroless deposition of copper, CuSO4·5H2O supplied by Panreac AppliChem GmbH, Darmstadt, Germany and NaBH4 supplied by Merck KGaA were used. The solution pH was adjusted using pure NaOH pellets purchased from Panreac AppliChem GmbH. Cleaning of the catalysts was performed with ethanol (96 wt.%) purchased from Panreac AppliChem GmbH. The galvanic exchange of Cu by Pt was made with Merck KGaA 10 wt.% aqueous solution of H2PtCl6. For the electrochemical tests, Nafion® (5 wt.%) supplied by Merck KGaA was used as an agglomerating agent. The catalyst ink was prepared with dry 2-propanol purchased from Merck KGaA. The corresponding results were compared to those obtained for the commercial 20 wt.% Pt/C from Premetek, Cherry Hill, NJ, USA (in which XC72 was the carbon support). N2 (≥ 99.9995%) and CO (≥ 99.9%) gases supplied by Linde, Dublin, Ireland, were employed for deaeration and the CO stripping experiments.

3.2. Synthesis of the Catalysts

The catalysts were synthesized by a two-step synthesis, by an initial electroless deposition of Cu and a further partial galvanic displacement by Pt [48]. The PtCu catalysts thus obtained were denoted as Pt(Cu) because of the two-step deposition procedure. The carbonaceous supports, CMK3 and CMK8, were used either as received or after a mild activation in 2.0 mol dm−3 HNO3 solution for 30 min at boiling temperature [87]. With activation, an increase in the number of active centers for the nucleation of the nanoparticles (through the surface carbon oxidation) was attempted. The resulting activated supports are identified as CMK3-A and CMK8-A, respectively.
For the preparation of the catalysts, the carbon support and CuSO4·5H2O were both introduced in 1.0 mol dm−3 NaOH and submitted to bath sonication (2000 W, Julabo GmbH, Seelbach, Germany), at room temperature. Once the carbon was dispersed, NaBH4 powder was slowly added for 10 min until reaching a CuSO4·5H2O:NaBH4 weight ratio of 1:2. After 30 min of stirring, the dispersion was filtered and cleaned. The resulting carbon-supported Cu powder was resuspended by bath sonication at room temperature in 0.1 mol dm−3 HClO4 + 5 mmol dm−3 H2PtCl6 solution for 45 min, to promote the following galvanic exchange reaction:
2Cu + PtCl62− → 2Cu2+ + Pt + 6Cl
which has a standard potential of E° = 0.404 V vs. SHE. Finally, the suspension was vacuum-filtered through 0.2 µm-porosity paper (Sartorius, Göttingen, Germany), and the collected powder was cleaned with ethanol and dried at 80 °C in an oven. The catalysts thus synthesized were identified as Pt(Cu)/CMK3, Pt(Cu)/CMK3-A, Pt(Cu)/CMK8, and Pt(Cu)/CMK8-A.

3.3. Structural Characterization

The structural analysis was performed by XRD with a PANalytical X’Pert PRO MPD θ/θ powder diffractometer from Malvern Panalytical Ltd., Malvern, UK, using the conditions described elsewhere [48] and sandwiching the powders between polyester films.
The mass and atomic compositions of the catalysts were determined from SEM observations using a scanning electron JSM5910-LV JEOL microscope furnished with an INCA-300 EDS analyzer (JEOL Ltd., Akishima, Tokyo, Japan). The corresponding measurements were taken from at least five different representative areas, the mean values and the error estimation being thus obtained. The nanoparticle morphology, size distribution, and composition were studied by means of TEM and HRTEM using a 200 kV JEOL JEM 2100 high-resolution transmission electron microscope from JEOL Ltd., Akishima, Tokyo, Japan. The samples were prepared from the powder dispersion, which was obtained by sonication in ethanol, placing a drop of it on a holey nickel grid and evaporating the solvent under the heat of a lamp. The HRTEM images were recorded with a Gatan MultiScan 794 CCD camera (Pleasanton, CA, USA). For the digital treatment of the images and analysis of selected areas of interest by Fast Fourier Transform (FFT), Gatan Digital Micrograph 3.7.0 software was used.
The samples were disposed on a carbon tape in order to perform the XPS analyses, which were conducted in a Physical Electronics PHI 5500 Multitechnique System spectrometer (Chanhassen, MN, USA) using the conditions described elsewhere [48], placing the analyzer 20° with respect to the plane of the samples to better appreciate the composition of the surface layers of the catalyst. The data acquisition was performed without sputtering and after Ar+ sputtering for 60 s. The XPS spectra were analyzed by means of a MultiPak V8.2B software from Physical Electronics.

3.4. Electrochemical Characterization

The working electrode was a modified 5 mm-diameter GCE tip coupled with an RDE purchased from Metrohm Autolab B.V., Utrecht, The Netherlands. The GCE tip was polished with deagglomerated alumina of 0.3 and 0.05 µm supplied by Buehler on a polishing cloth, using ethanol and water to remove the smut and cleaning by bath sonication. For the electrode modification, a catalyst ink was prepared with the suspension of the catalyst powder in 500 µL of a H2O-isopropanol (1:1) mixture, which was sonicated for 30 min. About 20 µL of this ink was dropped onto the GCE tip to achieve Pt loadings of about 20 µgPt cm−2, dried at room temperature, and coated with 2.5 µL of 1 wt.% Nafion® solution.
The experiments were performed in a three-electrode cell purchased from Metrohm Autolab B.V., equipped with a double wall to maintain a constant temperature of 25.0 ± 0.1 °C using a MP-5 thermostat from Julabo GmbH, Seelbach, Germany. The reference electrode was an RHE from Gaskatel GmbH, Kassel, Germany and the auxiliary electrode was a Pt wire (Incometal, Madrid, Spain). All the potentials have been referred to the RHE.
The experiments were performed in deaerated 0.5 M H2SO4 as electrolyte and using an Autolab PGSTAT100 potentiostat-galvanostat commanded by a NOVA 2.10 software, both from Metrohm Autolab B.V., Utrecht, The Netherlands. The solutions were deaerated by N2 bubbling. To clean the catalysts surface, the electrode was continuously cycled at 100 mV s−1 between 0.0 and 1.2 V until reaching a steady profile. Afterwards, the cyclic voltammograms at 20 mV s−1 in the same potential range were obtained. The steady profile was already reached after the second cycle.
The CO stripping tests were performed by bubbling CO for 15 min while a potential of 0.1 V was applied. Then, N2 was bubbled to remove the CO excess of the solution and the CO monolayer adsorbed on the catalysts was oxidized by CV at 20 mV s−1 between 0.0 and 1.2 V.
The activity in front of the ORR was determined by LSV in O2-saturated (pure O2 at 1 atm) 0.5 mol dm−3 H2SO4 by scanning the potential from 1.2 to 0.2 V at a sweep rate of 5 mV s−1 and 1500 rpm. Ohmic drop correction was not applied to these curves.
To test the stability of the catalysts, an accelerated degradation test, consisting of continuous cycling of the prepared electrodes between 0.6 and 1.0 V at 100 mV s−1 in deaerated 0.5 M H2SO4 for a large number of cycles was performed. The potential range was selected because in these conditions some oxidation of carbon and Pt is expected, resulting in possible atomic restructuration of the catalyst and aggregation of the nanoparticles. The ECSA decay after a given number of cycles is represented as ECSA/ECSAo, which is the ratio between the ECSA measured after such number of cycles and the initial value (ECSAo), versus the number of cycles. These ECSA values were obtained from the atomic hydrogen desorption charges in the voltammograms performed at 20 mV s−1 from 0.0 to 1.2 V.

4. Conclusions

Pt(Cu) nanoparticles with a diameter of about 4–5 nm were successfully deposited on highly ordered CMK3 and CMK8 mesoporous carbons via electroless deposition of Cu followed by galvanic exchange with Pt. XRD showed that PtCu alloys with about 70–80 at.% Pt were formed, being identified as contracted fcc Pt lattice, with the absence of other crystalline structures. According to the HRTEM observations, the nanoparticles were well dispersed, being spherical on CMK3 and more elongated with a zigzag shape on CMK8. This was related to the different form of the mesoporous channels, long ordered parallel in the former and cubic in the latter. The FFT analysis of the high-resolution images showed d-spacings corresponding to pure Pt and contracted Pt lattices, in agreement with the PtCu alloy formation. The XPS analyses of Pt in the Pt(Cu) nanoparticles before and after argon sputtering indicated that the Pt(Cu) nanoparticles were mainly composed of a PtCu alloy core covered by a Pt-rich shell. The profiles of the steady cyclic voltammograms of the Pt(Cu)/OMCs catalysts were coincident with that of pure Pt, without Cu oxidation signal due to the protective Pt-rich shell. The quality of the hydrogen adsorption/desorption peaks was lower in the case of the Pt(Cu)/OMCs, which was explained by their poorer crystal faceting. Good ECSAs of about 70 m2 gPt−1 for the Pt(Cu) catalysts supported on the non-activated CMK3 and CMK8 were achieved, whereas they were significantly smaller for the activated ones, as a result of nanoparticle aggregation. The onset potentials for CO oxidation and the ORR in the Pt(Cu) catalysts were shifted to more negative and to more positive potentials, respectively, with respect to Pt/C, thus indicating the higher catalytic activity of the former. The increased CO tolerance and the higher activity in front of the ORR of the Pt(Cu) alloys with respect to Pt/C were assigned to the geometric and ligand effects of Cu on Pt, arising from the Pt lattice compressive strain and the charge transfer from Cu to Pt when alloying Cu with Pt, which modified the electronic environment of Pt to reduce the adsorption energy of the adsorbed intermediates. Pt(Cu)/CMK3 showed competitive results regarding the CO oxidation and the ORR. This material presented reasonably good mass and specific activities and exhibited much better stability than Pt/C in the accelerated degradation tests. The activation of CMK3 and CMK8 reduced the stability of the catalysts, probably due to a textural modification of the mesoporous channels.

Supplementary Materials

The following are available online at https://www.mdpi.com/article/10.3390/catal11060724/s1, Figure S1: TEM micrographs of (a) the CMK3 carbon support, (b) CMK8 carbon support, (c) Pt(Cu)/CMK3, (d) Pt(Cu)/CMK3-A, (e) Pt(Cu)/CMK8 and (f) Pt(Cu)/CMK8-A. The insets of micrographs (c)–(f) show the corresponding size distribution of the nanoparticles. Figure S2: High-resolution TEM images of (a) Pt(Cu)/CMK3, (c) Pt(Cu)/CMK3-A, (e) Pt(Cu)/CMK8 and (g) Pt(Cu)/CMK8-A. Their respective FFT analysis is shown in figures (b), (d), (f) and (h), where the d-spacings corresponding to the selected spots are indicated. These results have to be compared with the d-spacings of pure Pt, which are 0.227 and 0.140 nm for (111) and (220) planes, respectively [96].

Author Contributions

Conceptualization, F.A.; methodology, P.L.C.; validation, J.G.-C.; formal analysis, P.L.C.; investigation, J.G.-C.; resources, I.S.; data curation, E.B.; writing–original draft preparation, J.G.-C.; writing–review and editing, E.B., I.S., and P.L.C.; supervision, P.L.C.; project administration, I.S.; funding acquisition, E.B. and I.S. F.A.’s contribution to this work has been made exclusively within the framework of his relationship as an external collaborator with LEMMA’s group of the UB. All authors have read and agreed to the published version of the manuscript.

Funding

This research was funded by the Agencia Estatal de Investigación (AEI, Spain) under project number PID2019-109291RB-I00 and the Generalitat de Catalunya (AGAUR, Spain) through the FI-SDUR PhD scholarship received by J.G.-C. (2020 FISDU 00005).

Acknowledgments

The authors are grateful to the CCiT-UB (Scientific and Technological Centers of the Universitat de Barcelona) for their support with the surface analysis techniques.

Conflicts of Interest

The authors declare no conflict of interest. The funders had no role in the design of the study; in the collection, analyses, or interpretation of data; in the writing of the manuscript; or in the decision to publish the results.

References

  1. Onat, N.; Bayar, H. The sustainability indicators of power production systems. Renew. Sustain. Energy Rev. 2010, 14, 3108–3115. [Google Scholar] [CrossRef]
  2. Tie, S.F.; Tan, C.W. A review of energy sources and energy management system in electric vehicles. Renew. Sustain. Energy Rev. 2013, 20, 82–102. [Google Scholar] [CrossRef]
  3. Larcher, D.; Tarascon, J.M. Towards greener and more sustainable batteries for electrical energy storage. Nat. Chem. 2015, 7, 19–29. [Google Scholar] [CrossRef] [PubMed]
  4. Chu, S.; Majumdar, A. Opportunities and challenges for a sustainable energy future. Nature 2012, 488, 294–303. [Google Scholar] [CrossRef] [PubMed]
  5. Li, W.; Liu, J.; Zhao, D. Mesoporous materials for energy conversion and storage devices. Nat. Rev. Mater. 2016, 1, 16023. [Google Scholar] [CrossRef]
  6. Stambouli, A.B.; Traversa, E. Fuel cells, an alternative to standard sources of energy. Renew. Sustain. Energy Rev. 2002, 6, 295–304. [Google Scholar] [CrossRef]
  7. Jouin, M.; Gouriveau, R.; Hissel, D.; Péra, M.C.; Zerhouni, N. Prognostics and health management of PEMFC-State of the art and remaining challenges. Int. J. Hydrog. Energy 2013, 38, 15307–15317. [Google Scholar] [CrossRef] [Green Version]
  8. Alves, H.J.; Bley, C., Jr.; Niklevicz, R.R.; Frigo, E.P.; Frigo, M.S.; Coimbra-Araújo, C.H. Overview of hydrogen production technologies from biogas and the applications in fuel cells. Int. J. Hydrog. Energy 2013, 38, 5215–5225. [Google Scholar] [CrossRef]
  9. Sulaiman, N.; Hannan, M.A.; Mohamed, A.; Majlan, E.H.; Wan Daud, W.R. A review on energy management system for fuel cell hybrid electric vehicle: Issues and challenges. Renew. Sustain. Energy Rev. 2015, 52, 802–814. [Google Scholar] [CrossRef]
  10. Daud, W.R.W.; Rosli, R.E.; Majlan, E.H.; Hamid, S.A.A.; Mohamed, R.; Husaini, T. PEM fuel cell system control: A review. Renew. Energy 2017, 113, 620–638. [Google Scholar] [CrossRef]
  11. Kamat, P.V. Meeting the clean energy demand: Nanostructure architectures for solar energy conversion. J. Phys. Chem. C 2007, 111, 2834–2860. [Google Scholar] [CrossRef]
  12. Wang, Y.; Chen, K.S.; Mishler, J.; Cho, S.C.; Adroher, X.C. A review of polymer electrolyte membrane fuel cells: Technology, applications, and needs on fundamental research. Appl. Energy 2011, 88, 981–1007. [Google Scholar] [CrossRef] [Green Version]
  13. Alcaide, F.; Cabot, P.L.; Brillas, E. Fuel cells for chemicals and energy cogeneration. J. Power Sources 2006, 153, 47–60. [Google Scholar] [CrossRef]
  14. Antolini, E. Formation of carbon-supported PtM alloys for low temperature fuel cells: A review. Mater. Chem. Phys. 2003, 78, 563–573. [Google Scholar] [CrossRef]
  15. Liu, Z.; Ling, X.Y.; Su, X.; Lee, J.Y. Carbon-supported Pt and PtRu nanoparticles as catalysts for a direct methanol fuel cell. J. Phys. Chem. B 2004, 108, 8234–8240. [Google Scholar] [CrossRef]
  16. Ruth, K.; Vogt, M.; Zuber, R. Development of CO-tolerant catalysts. In Handbook of Fuel Cells–Fundamentals, Technology and Applications; Vielstich, W., Gasteiger, H.A., Lamm, A., Eds.; John Wiley & Sons: New York, NY, USA, 2010; Volume 3, pp. 489–496. [Google Scholar] [CrossRef]
  17. Velázquez-Palenzuela, A.; Brillas, E.; Arias, C.; Centellas, F.; Garrido, J.A.; Rodríguez, R.M.; Cabot, P.L. Structural analysis of carbon-supported Ru-decorated Pt nanoparticles synthesized using forced deposition and catalytic performance toward CO, methanol, and ethanol electro-oxidation. J. Catal. 2013, 298, 112–121. [Google Scholar] [CrossRef]
  18. Acres, G.J.K.; Hards, G.A. Electrocatalysts for fuel cells. Catal. Today 1997, 38, 393–400. [Google Scholar] [CrossRef]
  19. Li, F.; Chan, K.Y.; Yung, H.; Yang, C.; Ting, S.W. Uniform dispersion of 1:1 PtRu nanoparticles in ordered mesoporous carbon for improved methanol oxidation. Phys. Chem. Chem. Phys. 2013, 15, 13570–13577. [Google Scholar] [CrossRef]
  20. Nilekar, A.U.; Alayoglu, S.; Eichhorn, B.; Mavrikakis, M. Preferential CO oxidation in hydrogen: Reactivity of core-shell nanoparticles. J. Am. Chem. Soc. 2010, 132, 7418–7428. [Google Scholar] [CrossRef] [PubMed]
  21. Sung, Y.; Hwang, J.; Chung, J.S. Characterization and activity correlations of Pt bimetallic catalysts for low temperature fuel cells. Int. J. Hydrog. Energy 2011, 36, 4007–4014. [Google Scholar] [CrossRef]
  22. Ignaszak, A.; Teo, C.; Ye, S.; Gyenge, E. Pt-SnO2-Pd/C electrocatalyst with enhanced activity and durability for the oxygen reduction reaction at low Pt loading: The effect of carbon support type and activation. J. Phys. Chem. C 2010, 114, 16488–16504. [Google Scholar] [CrossRef]
  23. Stamenkovic, V.; Mun, B.S.; Mayrhofer, K.J.J.; Ross, P.N.; Markovic, N.M.; Rossmeisl, J.; Greeley, J.; Norskov, K. Changing the activity of electrocatalysts for oxygen reduction by tuning the surface electronic structure. Angew. Chem. Int. Ed. 2006, 45, 2897–2901. [Google Scholar] [CrossRef] [PubMed]
  24. Mukerjee, S.; Srinivasan, S.J. Enhanced electrocatalysis of oxygen reduction on platinum alloys in proton exchange membrane fuel cells. J. Electroanal. Chem. 1993, 357, 201–224. [Google Scholar] [CrossRef]
  25. Srivastava, R.; Mani, P.; Hahn; Strasser, P. Efficient oxygen reduction fuel cell electrocatalysis on voltammetrically dealloyed Pt–Cu–Co nanoparticles. Angew. Chem. Int. Ed. 2007, 46, 8988–8991. [Google Scholar] [CrossRef]
  26. Caballero-Manrique, G.; Velázquez-Palenzuela, A.; Brillas, E.; Centellas, F.; Garrido, J.A.; Rodríguez, R.M.; Cabot, P.L. Electrochemical synthesis and characterization of carbon-supported Pt and Pt-Ru nanoparticles with Cu cores for CO and methanol oxidation in polymer electrolyte fuel cells. Int. J. Hydrog. Energy 2014, 39, 12859–12869. [Google Scholar] [CrossRef]
  27. Xiong, L.; Kannan, A.M.; Manthiram, A. Pt-M (M = Fe, Co, Ni and Cu) electrocatalysts synthesized by an aqueous route for proton exchange membrane fuel cells. Electrochem. Commun. 2002, 4, 898–903. [Google Scholar] [CrossRef]
  28. Xiong, L.; Manthiram, A. Effect of atomic ordering on the catalytic activity of carbon supported PtM (M = Fe, Co, Ni, and Cu) alloys for oxygen reduction in PEMFCs. J. Electrochem. Soc. 2005, 152, A697–A703. [Google Scholar] [CrossRef]
  29. Podlovchenko, B.I.; Krivchenko, V.A.; Maksimov, Y.M.; Gladysheva, T.D.; Yashina, L.V.; Evlashin, S.A.; Pilevsky, A.A. Specific features of the formation of Pt(Cu) catalysts by galvanic displacement with carbon nanowalls used as support. Electrochim. Acta 2012, 76, 137–144. [Google Scholar] [CrossRef]
  30. Mohl, M.; Dobo, D.; Kukovecz, A.; Konya, Z.; Kordas, K.; Wei, J.; Vajtai, R.; Ajayan, P.M. Formation of CuPd and CuPt bimetallic nanotubes by galvanic replacement reaction. J. Phys. Chem. C 2011, 115, 9403–9409. [Google Scholar] [CrossRef]
  31. Mani, P.; Srivastava, R.; Strasser, P. Dealloyed binary PtM3(M = Cu, Co, Ni) and ternary PtNi3M (M = Cu, Co, Fe, Cr) electrocatalysts for the oxygen reduction reaction: Performance in polymer electrolyte membrane fuel cells. J. Power Sources 2011, 196, 666–673. [Google Scholar] [CrossRef]
  32. Ding, L.X.; Wang, A.L.; Li, G.R.; Liu, Z.Q.; Zhao, W.X.; Su, C.Y.; Tong, Y.X. Porous Pt-Ni-P composite nanotube arrays: Highly electroactive and durable catalysts for methanol electrooxidation. J. Am. Chem. Soc. 2012, 134, 5730–5733. [Google Scholar] [CrossRef]
  33. Oezaslan, M.; Strasser, P. Activity of dealloyed PtCo3 and PtCu3 nanoparticle electrocatalyst for oxygen reduction reaction in polymer electrolyte membrane fuel cell. J. Power Sources 2011, 196, 5240–5249. [Google Scholar] [CrossRef]
  34. Jayasayee, K.; Van Veen, J.A.R.; Manivasagam, T.G.; Celebi, S.; Hensen, E.J.M.; de Bruijn, F.A. Oxygen reduction reaction (ORR) activity and durability of carbon supported PtM (Co, Ni, Cu) alloys: Influence of particle size and non-noble metals. Appl. Catal. B Environ. 2012, 111–112, 515–526. [Google Scholar] [CrossRef]
  35. Caballero-Manrique, G.; Nadeem, I.; Brillas, E.; Centellas, F.; Garrido, J.A.; Rodríguez, R.M.; Cabot, P.L. Effects of the electrodeposition time in the synthesis of carbon-supported Pt(Cu) and Pt-Ru(Cu) core-shell electrocatalysts for polymer electrolye fuel cells. Catalysts 2016, 6, 125. [Google Scholar] [CrossRef] [Green Version]
  36. Caballero-Manrique, G.; Brillas, E.; Centellas, F.; Garrido, J.A.; Rodríguez, R.M.; Cabot, P.L. Electrochemical oxidation of the carbon support to synthesize Pt(Cu) and Pt-Ru(Cu) core-shell electrocatalysts for low-temperature fuel cells. Catalysts 2015, 5, 815–837. [Google Scholar] [CrossRef] [Green Version]
  37. Geboes, B.; Mintsouli, I.; Wouters, B.; Georgieva, J.; Kakaroglou, A.; Sotiropoulos, S.; Valova, E.; Armyanov, S.; Hubin, A.; Breugelmans, T. Surface and electrochemical characterisation of a Pt-Cu/C nano-structured electrocatalyst, prepared by galvanic displacement. Appl. Catal. B Environ. 2014, 150–151, 249–256. [Google Scholar] [CrossRef]
  38. Mintsouli, I.; Georgieva, J.; Armyanov, S.; Valova, E.; Avdeev, G.; Hubin, A.; Steenhaut, O.; Dille, J.; Tsiplakides, D.; Balomenou, S.; et al. Pt-Cu electrocatalysts for methanol oxidation prepared by partial galvanic replacement of Cu/carbon powder precursors. Appl. Catal. B Environ. 2013, 136–137, 160–167. [Google Scholar] [CrossRef]
  39. Georgieva, J.; Valova, E.; Mintsouli, I.; Sotiropoulos, S.; Armyanov, S.; Kakaroglou, A.; Hubin, A.; Steenhaut, O.; Dille, J. Carbon-supported Pt(Cu) electrocatalysts for methanol oxidation prepared by Cu electroless deposition and its galvanic replacement by Pt. J. Appl. Electrochem. 2014, 44, 215–224. [Google Scholar] [CrossRef]
  40. Guterman, V.E.; Belenov, S.V.; Alekseenko, A.A.; Lin, R.; Tabachkova, N.Y.; Safronenko, O.I. Activity and stability of Pt/C and Pt-Cu/C electrocatalysts. Electrocatalysis 2018, 9, 550–562. [Google Scholar] [CrossRef]
  41. Pryadchenko, V.V.; Srabionyan, V.V.; Kurzin, A.A.; Bulat, N.V.; Shemet, D.B.; Avakyan, L.A.; Belenov, S.V.; Volochaev, V.A.; Zizak, I.; Guterman, V.E.; et al. Bimetallic PtCu core-shell nanoparticles in PtCu/C electrocatalysts: Structural and electrochemical characterization. Appl. Catal. A Gen. 2016, 525, 226–236. [Google Scholar] [CrossRef]
  42. Alekseenko, A.A.; Belenov, S.V.; Menshikov, V.S.; Guterman, V.E. Pt(Cu)/C electrocatalysts with low platinum content. Russ. J. Electrochem. 2018, 54, 415–425. [Google Scholar] [CrossRef]
  43. Alekseenko, A.A.; Guterman, V.E.; Belenov, S.V.; Menshikov, V.S.; Tabachkova, N.Y.; Safronenko, O.I.; Moguchikh, E.A. Pt/C electrocatalysts based on the nanoparticles with the gradient structure. Int. J. Hydrog. Energy 2018, 43, 3676–3687. [Google Scholar] [CrossRef]
  44. Maya-Cornejo, J.; Carrera-Cerritos, R.; Sebastián, D.; Ledesma-García, J.; Arriaga, L.G.; Aricò, A.S.; Baglio, V. PtCu catalyst for the electro-oxidation of ethanol in an alkaline direct alcohol fuel cell. Int. J. Hydrog. Energy 2017, 42, 27919–27928. [Google Scholar] [CrossRef]
  45. Hoseini, S.J.; Bahrami, M.; Fard, Z.S.; Fard, S.F.H.; Roushani, M.; Agahi, B.H.; Fath, R.H.; Sarmoor, S.S. Designing of some platinum or palladium-based nanoalloys as effective electrocatalysts for methanol oxidation reaction. Int. J. Hydrog. Energy 2018, 43, 15095–15111. [Google Scholar] [CrossRef]
  46. Sarkar, A.; Manthiram, A. Synthesis of Pt@Cu Core-shell nanoparticles by galvanic displacement of Cu by Pt4+ ions and their application as electrocatalysts for oxygen reduction reaction in fuel cells. J. Phys. Chem. C 2010, 114, 4725–4732. [Google Scholar] [CrossRef]
  47. Coleman, E.J.; Chowdhury, M.H.; Co, A.C. Insights into the oxygen reduction reaction activity of Pt/C and PtCu/C catalysts. ACS Catal. 2015, 5, 1245–1253. [Google Scholar] [CrossRef]
  48. Garcia-Cardona, J.; Sirés, I.; Alcaide, F.; Brillas, E.; Centellas, F.; Cabot, P.L. Electrochemical performance of carbon-supported Pt(Cu) electrocatalysts for low-temperature fuel cells. Int. J. Hydrog. Energy 2020, 45, 20582–20593. [Google Scholar] [CrossRef]
  49. Menshchikov, V.; Alekseenko, A.; Guterman, V.E.; Nechitailov, A.; Glebova, N.; Tomasov, A.; Spiridonova, O.; Belenov, S.; Zelenina, N.; Safronenko, O. Effective platinum-copper catalysts for methanol oxidation and oxygen reduction in proton-exchange membrane fuel cell. Nanomaterials 2020, 10, 742. [Google Scholar] [CrossRef] [Green Version]
  50. Samad, S.; Loh, K.S.; Wong, W.Y.; Lee, T.K.; Sunarso, J.; Chong, S.T.; Daud, V.R.W. Carbon and non-carbon support materials for platinum-based catalysts in fuel cells. Int. J. Hydrog. Energy 2018, 43, 7823–7854. [Google Scholar] [CrossRef]
  51. Antolini, E. Carbon supports for low-temperature fuel cell catalysts. Appl. Catal. B Environ. 2009, 88, 1–24. [Google Scholar] [CrossRef]
  52. Rodríguez-Reinoso, F. The role of carbon materials in heterogeneous catalysis. Carbon 1998, 36, 159–175. [Google Scholar] [CrossRef]
  53. Sharma, S.; Pollet, B.G. Support materials for PEMFC and DMFC electrocatalysts-A review. J. Power Sources 2012, 208, 96–119. [Google Scholar] [CrossRef]
  54. Elangovan, A.; Xu, J.; Brown, E.; Liu, B.; Li, J. Fundamental electrochemical insights of vertically aligned carbon nanofiber architecture as a catalyst support for ORR. J. Electrochem. Soc. 2020, 167, 066523. [Google Scholar] [CrossRef]
  55. Majlan, E.H.; Rohendi, D.; Daud, W.R.W.; Husaini, T.; Haque, M.A. Electrode for proton exchange membrane fuel cells: A review. Renew. Sustain. Energy Rev. 2018, 89, 117–134. [Google Scholar] [CrossRef]
  56. Shao, Y.; Liu, J.; Wang, Y.; Lin, Y. Novel catalyst support materials for PEM fuel cells: Current status and future prospects. J. Mater. Chem. 2009, 19, 46–59. [Google Scholar] [CrossRef]
  57. Dicks, A.L. The role of carbon in fuel cells. J. Power Sources 2006, 156, 128–141. [Google Scholar] [CrossRef]
  58. Yu, X.; Ye, S. Recent advances in activity and durability enhancement of Pt/C catalytic cathode in PEMFC. Part I. Physico-chemical and electronic interaction between Pt and carbon support, and activity enhancement of Pt/C catalyst. J. Power Sources 2007, 172, 133–144. [Google Scholar] [CrossRef]
  59. Yu, X.; Ye, S. Recent advances in activity and durability enhancement of Pt/C catalytic cathode in PEMFC. Part II: Degradation mechanism and durability enhancement of carbon supported platinum catalyst. J. Power Sources 2007, 172, 145–154. [Google Scholar] [CrossRef]
  60. Roen, L.M.; Paik, C.H.; Jarvi, T.D. Electrocatalytic corrosion of carbon support in PEMFC cathodes. Electrochem. Solid State Lett. 2004, 7, 8–12. [Google Scholar] [CrossRef]
  61. Shao, Y.; Yin, G.; Gao, Y. Understanding and approaches for the durability issues of Pt-based catalysts for PEM fuel cell. J. Power Sources 2007, 171, 558–566. [Google Scholar] [CrossRef]
  62. Zhang, S.; Yuan, X.Z.; Hin, J.N.C.; Wang, H.; Friedrich, K.A.; Schulze, M. A review of platinum-based catalyst layer degradation in proton exchange membrane fuel cells. J. Power Sources 2009, 194, 588–600. [Google Scholar] [CrossRef]
  63. Shahgaldi, S.; Hamelin, J. Improved carbon nanostructures as a novel catalyst support in the cathode side of PEMFC: A critical review. Carbon 2015, 94, 705–728. [Google Scholar] [CrossRef]
  64. Seo, M.H.; Choi, S.M.; Kim, H.J.; Kim, W.B. The graphene-supported Pd and Pt catalysts for highly active oxygen reduction reaction in an alkaline condition. Electrochem. Commun. 2011, 13, 182–185. [Google Scholar] [CrossRef]
  65. Zhu, C.; Dong, S. Recent progress in graphene-based nanomaterials as advanced electrocatalysts towards oxygen reduction reaction. Nanoscale 2013, 5, 1753–1767. [Google Scholar] [CrossRef] [PubMed]
  66. Jha, N.; Reddy, A.L.M.; Shaijumon, M.M.; Rajalakshmi, N.; Ramaprabhu, S. Pt-Ru/multi-walled carbon nanotubes as electrocatalysts for direct methanol fuel cell. Int. J. Hydrog. Energy 2008, 33, 427–433. [Google Scholar] [CrossRef]
  67. Shao, Y.; Yin, G.; Gao, Y.; Shi, P. Durability study of PtC and PtCNTs catalysts under simulated PEM fuel cell conditions. J. Electrochem. Soc. 2006, 153, 1093–1097. [Google Scholar] [CrossRef]
  68. Devrim, Y.; Arica, E.D. Multi-walled carbon nanotubes decorated by platinum catalyst for high temperature PEM fuel cell. Int. J. Hydrog. Energy 2019, 44, 18951–18966. [Google Scholar] [CrossRef]
  69. Alexeyeva, N.; Tammeveski, K.T.; López-Cudero, A.; Solla-Gullón, J.; Feliu, J.M. Electroreduction of oxygen on Pt nanoparticle/carbon nanotube nanocomposites in acid and alkaline solutions. Electrochim. Acta 2010, 55, 794–803. [Google Scholar] [CrossRef]
  70. Álvarez, G.; Alcaide, F.; Miguel, O.; Cabot, P.L.; Martínez-Huerta, M.V.; Fierro, J.L.G. Electrochemical stability of carbon nanofibers in proton exchange membrane fuel cells. Electrochim. Acta 2011, 56, 9370–9377. [Google Scholar] [CrossRef]
  71. Sebastián, D.; Ruíz, A.G.; Suelves, I.; Moliner, R.; Lázaro, M.J.; Baglio, V.; Stassi, A.; Aricò, A.S. Enhanced oxygen reduction activity and durability of Pt catalysts supported on carbon nanofibers. Appl. Catal. B Environ. 2012, 115–116, 269–275. [Google Scholar] [CrossRef]
  72. Jung, J.H.; Park, B.I.; Kim, J. Durability test with fuel starvation using a Pt/CNF catalyst in PEMFC. Nanoscale Res. Lett. 2012, 7, 21–25. [Google Scholar] [CrossRef] [Green Version]
  73. Zaragoza-Martín, F.; Sopeña-Escario, D.; Morallón, E.; de Lecea, C.S.M. Pt/carbon nanofibers electrocatalysts for fuel cells. Effect of the support oxidizing treatment. J. Power Sources 2007, 171, 302–309. [Google Scholar] [CrossRef] [Green Version]
  74. Guo, J.; Sun, G.; Wang, Q.; Wang, G.; Zhou, Z.; Tang, S.; Jiang, L.; Zhou, B.; Xin, Q. Carbon nanofibers supported Pt-Ru electrocatalysts for direct methanol fuel cells. Carbon 2006, 44, 152–157. [Google Scholar] [CrossRef]
  75. El-Deeb, H.; Bron, M. Microwave-assisted polyol synthesis of PtCu/carbon nanotube catalysts for electrocatalytic oxygen reduction. J. Power Sources 2015, 275, 893–900. [Google Scholar] [CrossRef]
  76. El-Deeb, H.; Bron, M. Electrochemical dealloying of PtCu/CNT electrocatalysts synthesized by NaBH4-assisted polyol-reduction: Influence of preparation parameters on oxygen reduction activity. Electrochim. Acta 2015, 164, 315–322. [Google Scholar] [CrossRef]
  77. Xia, K.; Gao, Q.; Wu, C.; Song, S.; Ruan, M. Activation, characterization and hydrogen storage properties of the mesoporous carbon CMK-3. Carbon 2007, 45, 1989–1996. [Google Scholar] [CrossRef]
  78. Ma, T.Y.; Liu, L.; Yuan, Z.Y. Direct synthesis of ordered mesoporous carbons. Chem. Soc. Rev. 2013, 42, 3977–4003. [Google Scholar] [CrossRef] [PubMed]
  79. Eftekhari, A.; Fan, Z. Ordered mesoporous carbon and its applications for electrochemical energy storage and conversion. Mater. Chem. Front. 2017, 1, 1001–1027. [Google Scholar] [CrossRef]
  80. Ambrosio, E.P.; Dumitrescu, M.A.; Francia, C.; Gerbaldi, C.; Spinelli, P. Ordered mesoporous carbons as catalyst support for PEM fuel cells. Fuel Cells 2009, 9, 197–200. [Google Scholar] [CrossRef]
  81. Phan, T.N.; Gong, M.K.; Thangavel, R.; Lee, Y.S.; Ko, C.H. Enhanced electrochemical performance for EDLC using ordered mesoporous carbons (CMK-3 and CMK-8): Role of mesopores and mesopore structures. J. Alloy Compd. 2019, 780, 90–97. [Google Scholar] [CrossRef]
  82. Güneş, S.; Güldür, F.Ç. Synthesis of OMC supported Pt catalysts and the effect of the metal loading technique on their PEM fuel cell performances. Chem. Eng. Commun. 2020, 207, 961–971. [Google Scholar] [CrossRef]
  83. Álvarez, G.; Alcaide, F.; Miguel, O.; Calvillo, L.; Lázaro, M.J.; Quintana, J.J.; Calderón, J.C.; Pastor, E. Technical electrodes catalyzed with PtRu on mesoporous ordered carbons for liquid direct methanol fuel cells. J. Solid State Electrochem. 2010, 14, 1027–1034. [Google Scholar] [CrossRef]
  84. Calvillo, L.; Gangeri, M.; Perathoner, S.; Centi, G.; Moliner, R.; Lázaro, M.J. Synthesis and performance of platinum supported on ordered mesoporous carbons as catalyst for PEM fuel cells: Effect of the surface chemistry of the support. Int. J. Hydrog. Energy 2011, 36, 9805–9814. [Google Scholar] [CrossRef]
  85. Salgado, J.R.C.; Alcaide, F.; Álvarez, G.; Calvillo, L.; Lázaro, M.J.; Pastor, E. Pt-Ru electrocatalysts supported on ordered mesoporous carbon for direct methanol fuel cell. J. Power Sources 2010, 195, 4022–4029. [Google Scholar] [CrossRef]
  86. Gupta, G.; Slanac, D.A.; Kumar, P.; Wiggins-Camacho, J.D.; Wang, X.; Swinnea, S.; More, K.L.; Dai, S.; Stevenson, K.J.; Johnston, K.P. Highly stable and active Pt-Cu oxygen reduction electrocatalysts based on mesoporous graphitic carbon supports. Chem. Mater. 2009, 21, 4515–4526. [Google Scholar] [CrossRef]
  87. Calvillo, L.; Lázaro, M.J.; García-Bordejé, E.; Moliner, R.; Cabot, P.L.; Esparbé, I.; Pastor, E.; Quintana, J.J. Platinum supported on functionalized ordered mesoporous carbon as electrocatalyst for direct methanol fuel cells. J. Power Sources 2007, 169, 59–64. [Google Scholar] [CrossRef]
  88. Liu, J.; Wu, X.; Yang, L.; Wang, F.; Yin, J. Unprotected Pt nanoclusters anchored on ordered mesoporous carbon as an efficient and stable catalyst for oxygen reduction reaction. Electrochim. Acta 2019, 297, 539–544. [Google Scholar] [CrossRef]
  89. Brandiele, R.; Durante, C.; Zerbetto, M.; Vicentini, N.; Kosmala, T.; Badocco, D.; Pastore, P.; Rizzi, G.A.; Isse, A.A.; Gennaro, A. Probing the correlation between Pt-support interaction and oxygen reduction reaction activity in mesoporous carbon materials modified with Pt-N active sites. Electrochim. Acta 2018, 277, 287–300. [Google Scholar] [CrossRef]
  90. Perini, L.; Durante, C.; Favaro, M.; Perazzolo, V.; Agnoli, S.; Schneider, O.; Granozzi, G.; Gennaro, A. Metal-support interaction in platinum and palladium nanoparticles loaded on nitrogen-doped mesoporous carbon for oxygen reduction reaction. ACS Appl. Mater. Interfaces 2015, 7, 1170–1179. [Google Scholar] [CrossRef] [PubMed]
  91. Available online: https://www.acsmaterial.com/materials/carbon-series.html (accessed on 22 February 2021).
  92. Powder Diffraction File, International Centre for Diffraction Data (ICDD), 12 Campus Boulevard Newton Square, Pennsylvania, 19073-3273, USA. 2018. Available online: http://www.icdd.com (accessed on 22 February 2021).
  93. Shen, Y.; Zhang, Z.; Xiao, K.; Xi, J. Synthesis of Pt, PtRh, and PtRhNi alloys supported by pristine graphene nanosheets for ethanol electrooxidation. ChemCatChem 2014, 6, 3254–3261. [Google Scholar] [CrossRef]
  94. Pryadchenko, V.V.; Belenov, S.V.; Shemet, D.B.; Srabionyan, V.V.; Avakyan, L.A.; Volochaev, V.A.; Mikheykin, A.S.; Bdoyan, K.E.; Zizak, I.; Guterman, V.E.; et al. Effect of thermal treatment on the atomic structure and electrochemical characteristics of bimetallic PtCu core-shell nanoparticles in PtCu/C electrocatalysts. J. Phys. Chem. C 2018, 122, 17199–17210. [Google Scholar] [CrossRef]
  95. Calvillo, L.; Celorrio, V.; Moliner, R.; Cabot, P.L.; Esparbé, I.; Lázaro, M.J. Control of textural properties of ordered mesoporous materials. Micropor. Mesopor. Mater. 2008, 116, 292–298. [Google Scholar] [CrossRef]
  96. Available online: http://database.iem.ac.ru/mincryst/ (accessed on 22 February 2021).
  97. Du, X.; Luo, S.; Du, H.; Tang, M.; Huang, X.; Shen, P.K. Monodisperse and self-assembled Pt-Cu nanoparticles as an efficient electrocatalyst for the methanol oxidation reaction. J. Mater. Chem. A 2016, 4, 1579–1586. [Google Scholar] [CrossRef]
  98. Alcaide, F.; Álvarez, G.; Cabot, P.L.; Genova-Koleva, R.V.; Grande, H.J.; Martínez-Huerta, M.V.; Miguel, O. Supporting PtRh alloy nanoparticle catalysts by electrodeposition on carbon paper for the ethanol electrooxidation in acidic medium. J. Electroanal. Chem. 2020, 861, 113960. [Google Scholar] [CrossRef]
  99. Long, G.; Li, X.; Wan, K.; Liang, A.; Piao, J.; Tsiakaras, P. Pt/CN-doped electrocatalysts: Superior electrocatalytic activity for methanol oxidation reaction and mechanistic insight into interfacial enhancement. Appl. Catal. B Environ. 2017, 203, 541–548. [Google Scholar] [CrossRef]
  100. Goodenough, J.B.; Hamnett, A.; Kennedy, B.J.; Weeks, S.A. XPS investigation of platinized carbon electrodes for the direct methanol air fuel cell. Electrochim. Acta 1987, 32, 1233–1238. [Google Scholar] [CrossRef]
  101. Rigsby, M.A.; Zhou, W.P.; Lewera, A.; Duong, H.T.; Bagus, P.S.; Jaegermann, W.; Hunger, R.; Wieckowski, A. Experiment and theory of fuel cell catalysis: Methanol and formic acid decomposition on nanoparticle Pt/Ru. J. Phys. Chem. C 2008, 112, 15595–15601. [Google Scholar] [CrossRef]
  102. Biesinger, M.C. Advanced analysis of copper X-ray photoelectron spectra. Surf. Interface Anal. 2017, 49, 1325–1334. [Google Scholar] [CrossRef]
  103. Serrano-Ruiz, J.C.; López-Cudero, A.; Solla-Gullón, J.; Sepúlveda-Escribano, A.; Aldaz, A. Hydrogenation of α, β unsaturated aldehydes over polycrystalline, (111) and (100) preferentially oriented Pt nanoparticles supported on carbon. J. Catal. 2008, 253, 159–166. [Google Scholar] [CrossRef]
  104. Ioroi, T.; Fujiwara, N.; Siroma, Z.; Yasuda, K.; Miyazaki, Y. Platinum and molybdenum oxide deposited carbon electrocatalyst for oxidation of hydrogen containing carbon monoxide. Electrochem. Commun. 2002, 4, 442–446. [Google Scholar] [CrossRef]
  105. Enterría, M.; Figueiredo, J.L. Nanostructured mesoporous carbons: Tuning texture and surface chemistry. Carbon 2016, 108, 79–102. [Google Scholar] [CrossRef]
  106. Mayrhofer, K.J.J.; Strmcnik, D.; Blizanac, B.B.; Stamenkovic, V.; Arenz, M.; Markovic, N.M. Measurement of oxygen reduction activities via the rotating disc electrode method: From Pt model surfaces to carbon-supported high surface area catalysts. Electrochim. Acta 2008, 53, 3181–3188. [Google Scholar] [CrossRef]
  107. Shanahan, P.V.; Xu, L.; Liang, C.; Waje, M.; Dai, S.; Yan, Y.S. Graphitic mesoporous carbon as a durable fuel cell catalyst support. J. Power Sources 2008, 185, 423–427. [Google Scholar] [CrossRef]
  108. Kitchin, J.R.; Nørskov, J.K.; Barteau, M.A.; Chen, J.G. Modification of the surface electronic and chemical properties of Pt(111) by subsurface 3d transition metals. J. Chem. Phys. 2004, 120, 10240–10246. [Google Scholar] [CrossRef] [Green Version]
  109. Corona, B.; Howard, M.; Zhang, L.; Henkelman, G. Computational screening of core@shell nanoparticles for the hydrogen evolution and oxygen reduction reactions. J. Chem. Phys. 2016, 145, 244708. [Google Scholar] [CrossRef] [PubMed] [Green Version]
  110. Beermann, V.; Gocyla, M.; Willinger, E.; Rudi, S.; Heggen, M.; Dunin-Borkowski, R.E.; Willinger, M.G.; Strasser, P. Rh-doped Pt-Ni octahedral nanoparticles: Understanding the correlation between elemental distribution, oxygen reduction reaction, and shape stability. Nano Lett. 2016, 16, 1719–1725. [Google Scholar] [CrossRef]
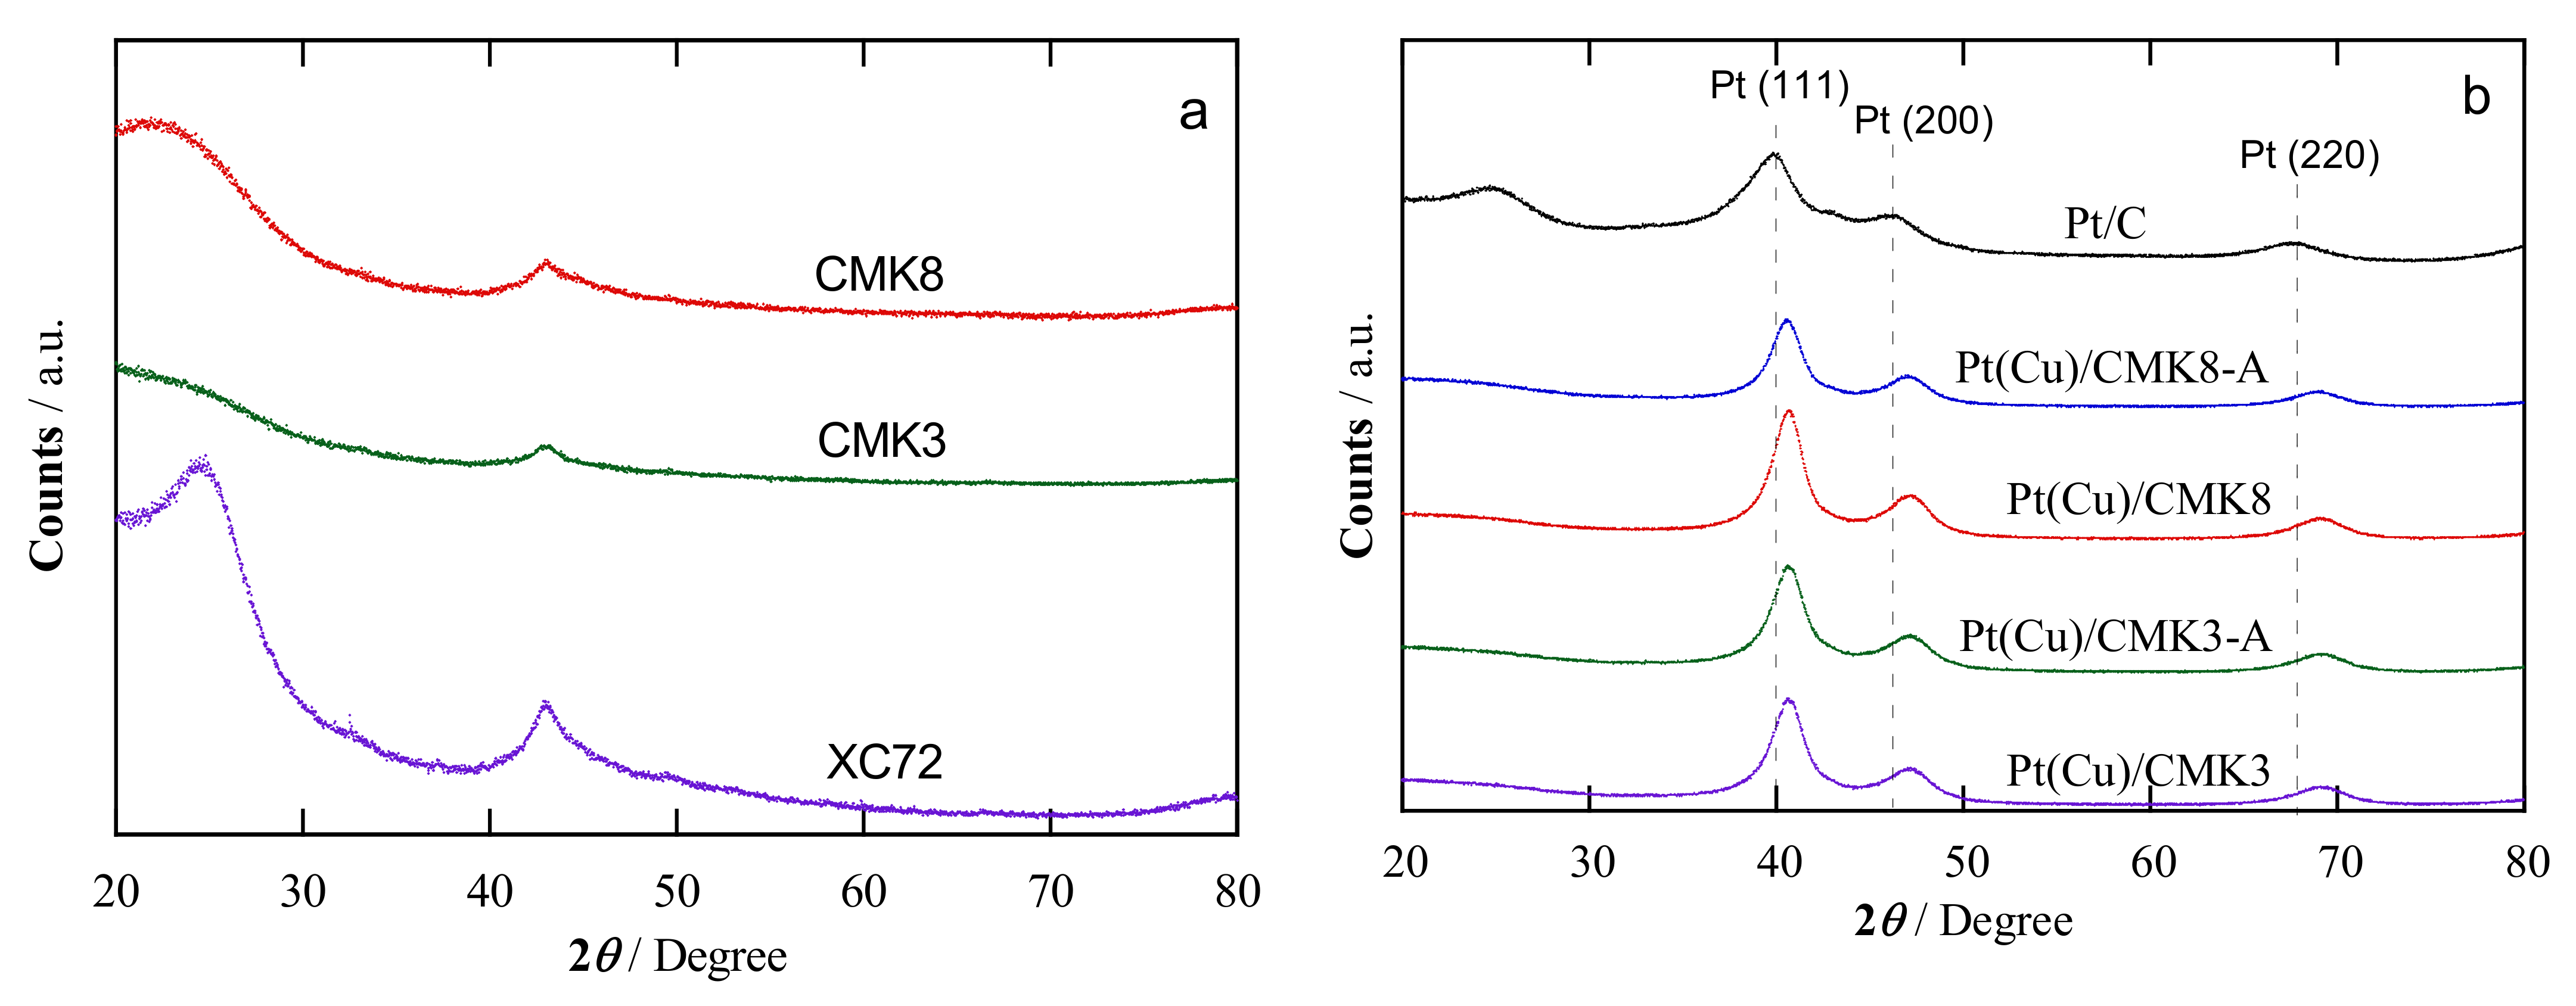
Figure 1. (a) XRD analyses of the supports and (b) of the supported Pt(Cu) catalysts. The region corresponding to Pt and Cu peaks (111) and (200) shown in plot (b) has been magnified in (c) to better show the peak location. The acronyms indicated refer to carbon black XC72, mesoporous carbons CMK3 and CMK8, and the activated mesoporous carbons CMK3-A and CMK8-A.
Catalysts 11 00724 g001aCatalysts 11 00724 g001b
Figure 2. High-resolution XPS spectra of Pt(Cu)/CMK3 in the (a) Pt 4f BE region before and (b) after sputtering; and in the (c) Cu 2p BE region before and (d) after sputtering. The Pt 4f peaks in all the specimens are compared (e) before and (f) after sputtering. Curves a, b and c in (a,b) correspond to the doublets of Pt(0), Pt(II), and Pt(IV) species, respectively, whereas d and e in (c,d) account for the doublets of Cu(0) and Cu(II), respectively.
Catalysts 11 00724 g002aCatalysts 11 00724 g002b
Figure 3. Cyclic voltammograms in deaerated 0.5 mol dm−3 H2SO4 solution at a scan rate of 20 mV s−1: (a) Pt(Cu)/CMK3 (curve a), Pt(Cu)/CMK3-A (b), and Pt/C (c); (b) Pt(Cu)CMK8 (curve d), Pt(Cu)/CMK8-A (e), and Pt/C (c).
Catalysts 11 00724 g003
Figure 4. CO stripping curves in deaerated 0.5 mol dm−3 H2SO4 solution at a scan rate of 20 mV s−1. (a) Pt(Cu)/CMK3 (curve a), Pt(Cu)/CMK3-A (b), and Pt/C (c); (b) Pt(Cu)CMK8 (curve d), Pt(Cu)/CMK8-A (e), and Pt/C (c).
Catalysts 11 00724 g004
Figure 5. ECSA loss for each catalyst after cycling within the potential range between 0.6 and 1.0 V at 100 mV s−1 in 0.5 mol dm−3 H2SO4 solution. Curves ae correspond to the same catalysts indicated in Figure 3 and Figure 4.
Catalysts 11 00724 g005
Figure 6. Linear sweep voltammograms for the ORR in O2-saturated 0.5 mol dm−3 H2SO4 solution at 5 mV s−1 and an RDE rotation rate of 1500 rpm. (a) Current per mass (jm) and (b) specific current (jsp) vs. potential. In both plots, the catalysts are: Pt/C (a), Pt(Cu)/CMK3 (b), and Pt(Cu)/CMK8 (c).
Catalysts 11 00724 g006
Table 1. Particle size and compositional characteristics of the supported Pt(Cu) catalysts obtained from XRD and EDS analyses and TEM observations.
CatalystCrystallite
Size a/nm
Pt:Cu
Ratio b/at.%
Metal Content c/wt.%Pt:Cu
Ratio d/at.%
Particle Size e/nm
PtCu
Pt(Cu)/CMK34.483:1726948:524.8
Pt(Cu)/CMK3-A4.072:28191430:704.8
Pt(Cu)/CMK85.180:2032664:365.1
Pt(Cu)/CMK8-A4.583:1738668:324.9
Pt/C2.6100:0190100:02.5
a Mean crystallite size from XRD. b Atomic composition of the PtCu alloy by XRD. c Overall metal loading from EDS (standard deviation of 1.5 wt.%). d Pt to Cu atomic ratio by EDS. e Mean particle size from TEM measurements (standard deviation of 0.8).
Table 2. Overall Pt:Cu:C and Pt:Cu composition (at.%) for the different catalysts, before (N) and after (Y) Ar+ sputtering.
SpeciesAr+Pt(Cu)
/CMK3
Pt(Cu)
/CMK3-A
Pt(Cu)
/CMK8
Pt(Cu)
/CMK8-A
Pt:Cu:CN5:1:944:3:9314:2:849:1:90
Pt:Cu:CY6:3:916:6:8817:3:8013:2:85
Pt:CuN77:2358:4286:1490:10
Pt:CuY70:3050:5083:1783:17
Pt(0):Pt(II):Pt(IV) aN66:10:2460:3:3743:45:1268:10:22
Pt(0):Pt(II):Pt(IV) aY43:32:2546:30:2474:10:1663:13:24
Cu(0):Cu(II) bN48:5244:5652:6438:62
Cu(0):Cu(II) bY71:2973:2778:2270:30
Pt(0):Cu(0) cN82:1865:3584:1694:6
Pt(0):Cu(0) cY64:3640:6083:1781:19
a Relative composition of the Pt oxidation states. b Relative composition of the Cu oxidation states. c Pt(0):Cu(0) ratio of the metallic forms.
Table 3. Pt loadings for electrochemical testing, ECSAs measured from hydrogen desorption (H-des) and CO stripping (CO-des) and onset potentials for CO oxidation (ECO) in the corresponding cyclic voltammograms.
CatalystPt Loading
/µg cm−2
ECSAH-des
/m2 gPt−1
ECSACO-des
/m2 gPt−1
ECO
/V
Pt(Cu)/CMK326.568.568.70.65
Pt(Cu)/CMK3-A19.456.357.70.65
Pt(Cu)/CMK819.672.873.20.66
Pt(Cu)/CMK8-A23.344.645.20.64
Pt/C (commercial)20.484.385.20.70
Publisher’s Note: MDPI stays neutral with regard to jurisdictional claims in published maps and institutional affiliations.