Article

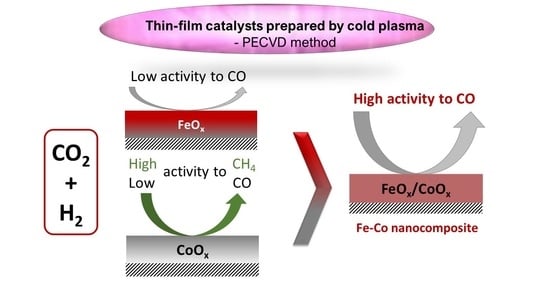
Enhancing CO2 Conversion to CO over Plasma-Deposited Composites Based on Mixed Co and Fe Oxides

1
Department of Molecular Engineering, Faculty of Process and Environmental Engineering, Lodz University of Technology, Wolczanska 213, 90-924 Lodz, Poland
2
Department of Silicates and Macromolecular Compounds, Faculty of Materials Science and Ceramics, AGH University of Science and Technology, 30-059 Kraków, Poland
*
Author to whom correspondence should be addressed.
Catalysts 2021, 11(8), 883; https://doi.org/10.3390/catal11080883
Submission received: 25 June 2021 / Revised: 20 July 2021 / Accepted: 21 July 2021 / Published: 22 July 2021
(This article belongs to the Special Issue Towards Catalysts Prepared by Cold Plasma)

Abstract

:
The hydrogenation of CO2 to produce CO and H2O, known as reverse-water-gas shift reaction (RWGS) is considered to be an important CO2 valorization pathway. This work is aimed at proposing the thin-film catalysts based on iron and cobalt oxides for this purpose. A series of Fe–Co nanocomposites were prepared by the plasma-enhanced chemical vapor deposition (PECVD) from organic cobalt and iron precursors on a wire-mesh support. The catalysts were characterized by SEM/EDX, XPS, XRD, and Raman spectroscopy and studied for hydrogenation of CO2 in a tubular reactor operating in the temperature range of 250–400 °C and atmospheric pressure. The Co-based catalyst, containing crystalline CoO phase, exhibited high activity toward CH4, while the Fe-based catalyst, containing crystalline Fe2O3/Fe3O4 phases, was less active and converted CO2 mainly into CO. Regarding the Fe–Co nanocomposites (incl. Fe2O3/Fe3O4 and CoO), even a small fraction of iron dramatically inhibited the production of methane. With increasing the atomic fraction of iron in the Fe–Co systems, the efficiency of the RWGS reaction at 400 °C increased up to 95% selectivity to CO and 30% conversion of CO2, which significantly exceeded the conversion for pure iron–based films (approx. 9%). The superior performance of the Fe–Co nanocomposites compared to “pure” Co and Fe–based films was proposed to be explained by assuming changes in the electronic structure of the catalyst resulting from the formation of pn junctions between nanoparticles of cobalt and iron oxides.

Graphical Abstract

1. Introduction

The capture of CO2 from large industrial sources followed by storage (CCS) or use (CCU) is considered an efficient way of mitigating tons of emitted CO2. The CCU approach involves the use of CO2 and co-reactants to create new products [1]. There are different paths of CO2 transformation into synthetic fuels and valuable chemicals by means of biological or chemical processes. Since CO2 is a very stable and relatively inert molecule, it is often combined with hydrogen over a catalyst to drive the desired reaction [2]. Using “renewable” hydrogen obtained from carbon-free energy sources, new products of commercial interest can be obtained. Using this approach, CO2 should be no longer considered to be a pollutant but an attractive carbon source acting as a feedstock for the subsequent synthesis [3,4].
Among the methods being explored, CO2 hydrogenation to methane, also known as the Sabatier reaction, represents a significant example of CO2 valorization into energy carriers. The main chemical reactions can be summarized as follows [5]:
CO2 + 4 H2 ↔ CH4 + 2 H2O   ∆H = −164.7 kJ/mol
CO2 + H2 ↔ CO + H2O   ∆H = 41.3 kJ/mol
CO + 3 H2 ↔ CH4 + H2O   ∆H = −206 kJ/mol
In the conversion of CO2 into methane, the reverse-water-gas shift (RWGS) is an endothermic side reaction (Equation (2)), favored at high temperatures which results in a decreased CH4 yield. The catalysts based on Ru, Co, Ni and Rh are mostly reported be effective toward CO2 methanation; although a few studies also focused on optimization of Fe-based systems for this process [5,6,7,8]. Since CO and CO2 methanation (Equations (1) and (3)) are highly exothermic reactions, another problem arises from thermal deactivation of the catalyst due to insufficient heat transport in the traditional fixed-bed reactors consisting of powder or pellet catalysts.
Considering a different route of converting CO2 to liquid fuels, the conversion of CO2 to CO by RWGS gives versatility in end products that can then be subsequently obtained from CO conversion. The resulting synthesis gas with various H2/CO ratios can be used in the Fisher–Tropsh synthesis to produce a wide range of liquid fuels [9]. However, RWGS competes with the highly exothermic CO2 methanation reaction, resulting in reduced CO yield. Therefore, the improvement in the low temperature performance and enhanced selectivity of the RWGS reaction is a key challenge when designing efficient catalysts for this purpose [10,11,12]. The active phase of RWGS catalysts includes primary iron compounds in the form of oxides and carbides, metallic platinum and copper [13].
Recently, a new class of catalysts in the form of a thin film, which uniformly covers the surface of the structured support, deserves considerable attention [14,15]. The thin-film form opens the way to new designs of structured reactors and microreactors that are more effective in terms of mass and heat transport than traditional packed-bed ones [16,17,18]. However, the challenge is to produce such coatings with high catalytic activity while maintaining the original geometry of the structured support. The most promising technique for this purpose is the cold plasma deposition (PECVD). The use of plasma has attracted special attention due to the high chemical reactivity that can be achieved in the plasma environment, which allows fabricating thin films with a unique structure that cannot be obtained by any other method [19,20,21]. Such plasma-prepared structures often exhibit a different activity than their conventionally synthesized counterparts. Moreover, the PECVD enables precise control over the molecular structure and nanostructure of such films by selecting appropriate precursors of the active phases and operational conditions of the fabrication process [22,23].
Addressing the challenge of designing thin-film catalysts for CO2 conversion, our recent work described the advancements in plasma-produced CoOX–based nanocatalysts for CO2 methanation [24]. The reported results showed that the specific structure of CoO in the carbon matrix is responsible for its high activity and selectivity in CO2 hydrogenation to methane. Herein, we continue our research in order to design new plasma nanocomposites based on mixed FeOX and CoOX structures. Our approach of combining both oxides is due to the reported activity of iron-based catalysts both in CO2 methanation and RWGS reaction [5,13]. On the other hand, it is often observed that combining two active metals, either in the metallic or oxidized state, does not always give the additive properties expected from the individual compounds, but reveals a synergistic effect resulting in the increased performance toward specific products [25,26]. Therefore, in the present work, we aim at fabricating the series of iron-cobalt nanocomposites in the form of thin films at different Fe/Co atomic ratios. The films will be deposited on a wire-mesh structured support. The influence of the plasma deposition parameters on the structure of Fe-Co nanocomposites and the catalytic activity in CO2 hydrogenation will be investigated.

2. Results and Discussion

In this section, characteristics including the chemical structure and morphology of the plasma-deposited thin-film catalysts with different Fe/Co atomic ratio are reported and discussed. In addition, the activity of the new Fe–Co composites was evaluated in the CO2 hydrogenation in the temperature range of 250–400 °C. The interpretation and explanation of the enhanced CO2 conversion to CO over plasma-deposited Fe–Co composites in comparison to the “pure” Fe–based catalyst is also provided.

2.1. Characteristics of Plasma-Deposited Composites Based on Mixed Co and Fe Oxides

Plasma-prepared nanocomposites give several thin-film catalysts deposited on a wire-mesh support with different ratios of iron to cobalt. For simplification, the relative content of iron and cobalt will be made by referring to the individual metal loading in the atomic fractions calculated as Fe/(Fe + Co) and Co/(Fe + Co). Using this notation, a “0.9Fe0.1Co” catalyst will indicate 90 at.% Fe and 10 at.% Co in the plasma Fe–Co nanocomposite. Consequently, the “pure” cobalt catalyst, i.e., prepared without the flow of iron precursor, is designated as 1.0Co, while the “pure” iron catalyst is designated as 1.0Fe. The relative contents of Fe and Co determined by EDX analysis for the samples prepared at different partial pressures of iron precursor (corresponding to its different flow rates) are listed in Table 1. The mean deviation in the composition analysis for Co and Fe does not exceed 3% in most cases indicating the in-plane homogeneity of the plasma-deposited thin films. It can be seen that the trend of change in iron content is as it could be predicted from the plasma deposition parameters. As the pressure of iron precursor increases, which is equivalent to its higher flow rate, the atomic fraction of iron also increases in relation to the total content of (Fe + Co). These results are clearly illustrated in Figure 1 showing the dependence of iron fraction versus the relative pressures of iron precursor to the sum of (Fe + Co) precursors. Consequently, as expected, by increasing the pressure of Fe precursor, we can obtain the material with decreasing the Co/Fe ratio. Using the pressure of 0.2 Pa for both iron and cobalt precursors in the co-deposition process, the 0.61Fe0.39Co catalyst containing a higher amount of iron than cobalt was obtained.
The SEM micrographs of the calcined support and the plasma-prepared films are shown in Figure 2. Characterization of the surface morphology showed that the 1.0Co system exhibited the pattern that accurately reflects the morphology of the calcined kanthal steel support. A thin layer of the plasma–deposited material covered the sharp lamellae of the α–Al2O3 structure that was evolved during the calcination of the kanthal steel [24]. In contrast, the 1.0 Fe thin-film looks thicker than the 1.0Co one, and the surface has a structure of loose, large globules with a finely folded surface. Mixing of two precursors reveals different pictures than the “pure” iron and the cobalt catalysts, depending on the Fe/Co ratio. For the Fe–Co composite with a small fraction of Fe, a tight globular pattern similar to that of cauliflower is formed (0.13Fe0.87Co). As the Fe fraction increased to 0.6, the size of the globules increased, and their surface appeared slightly wavy. In general, as the iron content increased, we can see a systematic increase in surface roughness and ripple. A further increase in the Fe fraction resulted in a different, finer pattern and interestingly the surface looked like a surface of the “pure” 1.0Fe. For 0.8Fe0.2Co, the globules were smaller than for 0.61Fe0.39Co. Overall, it is apparent that in all samples the presence of cobalt in the Fe–Co nanocomposite caused an increase in the size of globules in comparison to the 1.0Fe catalyst. It can be therefore expected that the active, outer surface of the thin films is higher for the 1.0Fe catalyst (finer structure) than for the Fe–Co nanocomposites.
To determine the bulk phase composition of the plasma-prepared thin films X-ray diffraction was used. Example results for the Fe–Co nanocomposite (0.61Fe0.39Co) and the individual Fe– and Co–based films are presented in Figure 3. As can be seen, the XRD patterns exhibit low intensity, and importantly, the dominant reflections originate from aluminum oxide [27]. As reported previously, this compound evolved from the calcination of the kanthal steel support prior to the plasma deposition process [24]. Thus, despite the application of GID mode, the support disturbs the analysis. All the samples comprise metallic iron, confirmed by the presence of three reflections at 44.5° (110), 64.6° (200), and 81.9° (211) [28]. Moreover, the samples contain also crystallites of hematite (Fe2O3) found by the reflections at 33.0° (104), and 35.7° (210) [29]. Since iron and iron oxides are ingredients of the kanthal steel support, there is no confidence whether these phases originate either from the support or the deposited thin films. Nevertheless, XRD analysis identified the crystalline CoO phase in 1.0Co and Fe–Co samples, which was confirmed by the presence of (200) reflection at 42.5° [30]. Importantly, the presence of a magnetite (Fe3O4) phase was confirmed by a weak reflection at 62.1° (440) [31], clearly visible for the 1.0Fe sample. It is also a proof that Fe3O4 phase origins from the thin-film since it was not observed for the 1.0Co catalyst. The main reflection for magnetite at 35.3° (311) [31], unfortunately is covered by the (104) reflection characteristic for Al2O3 [27]. The XRD patterns of all Fe–Co composites were qualitatively similar to each other and identified the crystalline phases of CoO, Fe2O3 and Fe3O4.
The phase composition is also illustrated by the Raman spectra, which are shown in Figure 4 for the 1.0Fe and 1.0Co films and as an example of the composite for the 0.61Fe0.39Co film. As can be seen, for the 1.0Fe catalyst, six distinct bands occurring at 231, 294 (the most characteristic), 416, 502, 612 and 1345 cm−1 can be attributed to Fe2O3 [32,33], and the last one at around 670 cm−1 can be assigned to Fe3O4 [33]. It is important to recognize that similar six bands were also observed for the calcined kanthal support. However, for the pure substrate, no band occurred at around 670 cm−1, indicating that the Fe3O4 phase comes only from the Fe-based thin-film. Moreover, it can be observed that for the Fe–based thin-film, bands originating from Fe2O3 are shifted towards higher wavenumbers in comparison to the calcined kanthal support, which may indicate the presence of this phase also in the film.
For the 1.0Co thin-film, the most crucial information concerns the presence of bands at approx. 474, 561 and 677 cm−1 that can be attributed to CoO phase [34]. Other bands at 249, 378, 417, 649 and 747 cm−1 are characteristic for alumina phases in the support [35,36,37,38].
The red spectrum represents the typical phase structure of the Fe-Co composite. First and foremost, bands visible at 475, 515, 568 and 677 cm−1 strongly suggest the presence of CoO phase [34]. Moreover, the broad band with maximum at 677 cm−1 (compared to the corresponding band for the Co-based film) can be attributed, in addition to CoO, to the considerable fraction of Fe3O4 in the film [33]. In turn, the bands at 295 and 1312 cm−1 indicate the existence of Fe2O3 in this composite film [32]. Thus, it can be concluded that individual oxide structures such as CoO, Fe2O3, and Fe3O4 are present in the Fe–Co composites. As in the previous samples, numerous bands for different forms of alumina from the support (251, 381, 415, 649, 460 and 747 cm−1) [35,36,37,38] and elemental carbon (1372, 1595 cm−1) [39] were also recorded.
The XPS investigations revealed the presence of carbon and oxygen in each plasma-deposited thin film as previously reported [24]. Importantly, the analysis did not detect any aluminum ensuring that the films homogeneously cover the support.
The spectrum characteristic for cobalt is a spin-orbit split into a doublet: Co 2p3/2 and Co 2p1/2 bands, which reveal the same chemical states of cobalt atoms [24]. Therefore, only the more intense Co 2p3/2 band was analyzed (Figure 5a). The XPS spectrum was deconvoluted by symmetric peaks for the metallic cobalt and the satellite components, and asymmetric peak for the oxidation states of cobalt. The 1.0Co sample contains mainly Co2+, consequently cobalt(II) oxide (CoO). This result is confirmed by the presence of the band centered at 781.3 eV [40]. The presence of a broad satellite centered at 786.2 eV [40] is another evidence for cobalt(II) oxide. This finding is in good agreement with XRD and Raman spectroscopy results. The fraction of Co2+ is 86.6 at.%. Cobalt in the 1.0Co sample exists also in the metallic form (Co0) (13.4 at.%) linked to the band at 779.8 eV [40].
The Fe 3p3/2 spectrum, presented for 1.0Fe sample in Figure 5b, consists of two asymmetric and one symmetric component originated from Fe3+, Fe2+, and metallic iron (Fe0), respectively. Thus, the 1.0Fe catalyst contains a mixture of these forms. The content of Fe3+, revealed by a peak centered at 55.4 eV [41], was found to be 83.4 at.%. The peak at 53.8 eV is characteristic for Fe2+ [41], and this component accounts for 13.5 at.%. The metallic iron, the peak of which is centered at 52.8 eV [41], constitutes 3.1 at.%. Based on the results of XPS analysis, it can be concluded that the 1.0Fe catalyst contains a mixture of hematite (Fe2O3) and magnetite (Fe3O4). Noteworthy, these investigations confirmed that the hematite phase seen by XRD and Raman spectroscopy origins not only from the support but also from the deposited thin film since it was identified in the surface structure of this film.
The co-deposited Fe–Co thin films consist of both iron and cobalt in different oxidation states and the particular interest was paid for these elements as the components of the active phase. Unfortunately, the Fe 2p spectra are overlapped by the Auger signal originated from cobalt (Co LM1, Co LM2, and Co LM3), while the Co 2p spectra are intersected by Auger signal originated from iron (Fe LM1, Fe LM2, and Fe LM3). Additionally, Fe 3p spectra are disturbed by Co 3p spectra (Figure 5c). Moreover, the other narrow regions characteristic of iron and cobalt affects each other. These features are related to the similarity of the electronic structure of iron and cobalt and do not allow to carry out precise identification of individual states of Fe and Co.
XPS analysis in the C 1s region for all catalysts brought similar findings in terms of the band structure. Therefore, Figure 5d presents the C 1s spectrum only for the selected 0.37Fe0.63Co sample. The spectrum consists of four symmetrical bands centered at 284.4 eV typical for sp2 carbon, 285.6 eV originated from sp3 carbon, 286.8 eV assigned to C–O bonds and 288.2 eV characteristic for C=O moieties [42,43].
Since the XPS analysis did not allow the quantification of separate for cobalt and iron in the Fe–Co nanocomposites, the relative iron content (Fe/(Fe + Co)) was further taken only from the EDX analysis. To gain a deeper insight into the chemical structure of the plasma-deposited thin films, XPS can be used to determine the relative carbon content in relation to the sum of (Fe + Co) for each sample with different iron content (from zero for a 1.0Co catalyst to unity for a 1.0Fe catalyst) (Figure 6a). As can be seen, the ratio C/(Fe + Co) was found to decrease with increasing iron fraction in the Co–Fe composite. Moreover, to link the molecular structure of the investigated films with their catalytic properties, the particular bands of carbon were deeper analyzed. The detailed quantitative analysis revealed that carbon exists mainly in sp2 form with some contribution of sp3 form and low concentration of oxidized carbon. As shown in Figure 6b, the content of sp2 and sp3 forms (C sp2/C, C sp3/C, sp3/sp2) do not change with Fe/(Fe + Co) and is similar for all samples. This finding suggests that the catalytic performance of the thin films should be related to the interactions of iron oxides and cobalt oxide structures, which are embedded in the carbon matrix, and not to the forms of carbon that do not change with the composition of Fe–Co thin films.
To sum up, based on detailed studies of the structure of the “pure” Fe and Co-based catalysts and different Fe–Co nanocomposites using XPS, XRD and Raman spectroscopy it can be concluded that the composites contain the phases of CoO and Fe2O3/Fe3O4, which are characteristic of the thin films based only on Co or Fe, respectively. Noteworthy, XRD patterns for all Fe-Co composites did not identify any mixed FeCoYOX structures and were similar to each other. The average crystalline sizes roughly estimated by applying the Debye-Scherrer equation were in the range of 4–6 nm for CoO and 17–25 nm for Fe2O3/Fe3O4, indicating that the oxides were nanostructured. The estimated sizes correspond to the crystalline sizes in the “pure” Fe and Co–based catalysts suggesting that during the plasma co-deposition from iron and cobalt precursors, the additive mixed nanostructure of particular cobalt and iron oxides is obtained.

2.2. Catalytic Performance

The activity of the Fe-Co nanocomposites was evaluated in a flow, tubular reactor as a function of CO2 conversion (XCO2), selectivity to CH4 (SCH4) and CO (SCO), and the yield of CH4 and CO production (YCH4 = XCO2SCH4; YCO = XCO2SCO). To understand the catalytic behavior of the plasma nanocomposites after the addition of iron to the cobalt catalyst, the performance of the “pure” cobalt and iron thin films was also investigated. All the films demonstrated stable catalytic performance within the studied temperature range of 250–400 °C. As shown in Figure 7, the cobalt catalyst (1.0Co), containing the crystalline CoO phase, becomes active at 250 °C with a methane selectivity of 84%. The catalyst exhibits increasing CO2 conversion with increasing temperature, reaching XCO2 = 72% conversion at 400 °C. In the range of 250–400 °C, selectivity to methane slightly increases from 84% to 96%, which is very close to the equilibrium value. The observed activity of the 1.0Co catalyst is similar to that reported in our previous work for the cobalt catalyst prepared at comparable fabrication parameters [24]. This is also in line with the literature findings stating that Co–based systems are not active in WGS(water-gas-shift)/RWGS reactions and mostly favor methane production [13]. However, the observed trend of selectivity as a function of temperature differs from that presented in our previous paper [24], where the catalytic tests were carried out in a continuous stirred tank reactor (CSTR) with longer contact times. In the CSTR, the selectivity to methane was 100% at lower temperatures and slightly decreased with increasing temperature, to 94% at 400 °C, due to the formation of CO at higher temperatures. In the tubular reactor used in this study that is operated at shorter contact times, CO is produced at lower temperatures. Moreover, by increasing the space velocity, we always observed a shift toward higher SCO and lower SCH4. This is the evidence that CO2 methanation over plasma-deposited cobalt catalysts goes through the CO intermediate. By increasing the space velocity (shorter contact times) the CO intermediate is not further hydrogenated to CH4 and the production of methane is less efficient.
On the contrary, our iron catalyst (1.0Fe), containing the crystalline Fe2O3 and Fe3O4 phases, shows much lower selectivity to methane and generally, much lower activity in comparison to the cobalt-based thin-film. It mainly drives the conversion of CO2 toward CO. As can be seen, up to 300 °C, a small amount of reaction products was observed in the outlet gas stream (XCO2 = 2.2% at 300 °C). At higher temperatures, more CO was produced and the selectivity to methane further decreased with temperature. Since the reverse-water-gas shift reaction (RWGS) is favored at higher temperatures, due to its endothermic character, the formation of CO is increased with increasing temperature.
Iron-cobalt nanocomposites of different compositions, but all of them containing the crystalline Fe2O3, Fe3O4 and CoO phases, showed the CO2 conversion much smaller than 1.0Co, but always higher than the 1.0Fe film; however, the character of observed changes in CO2 conversion and selectivity is not additive. A significant difference in the performance of Fe–Co nanocomposites can be seen by assessing the selectivity to a given reaction product: CH4 and CO (Figure 8a). Interestingly, when a small amount of iron is added to the cobalt-based thin films, the selectivity of the resulting nanocomposite dramatically changes toward the dominant production of CO. Even a small addition of iron (e.g., 10% at.) causes that although the films contained the majority of Co, stop working toward CO2 methanation. The plasma-deposited nanocomposites containing both Fe and Co, regardless of the Fe/Co ratio, exhibit a very low selectivity to CH4 in the entire temperature range. On the other hand, from the point of view of the application of the new nanocomposites in the RWGS reaction, their efficiency is always higher than that of the “pure” iron catalyst.
Further analysis of the catalytic activity of plasma composites concerns the upper temperature range due to their potential application in the conversion of CO2 to CO, where higher temperatures are preferred. The dependence of CO production efficiency (YCO = XCO2SCO) over the Fe-Co nanocomposites as a function of iron content at 350 and 400 °C is presented in Figure 8b. It shows that in both temperatures, the “pure” Co-based film (1.0Co) exhibited the lowest CO production efficiency, which results from the high selectivity to CH4 (SCH4 = 84% at 250 °C, SCH4 = 96% at 400 °C). On the other hand, the “pure” Fe-based film (1.0Fe), despite the high selectivity to CO, also showed a low CO yield due to the low CO2 conversion. In turn, each composite containing mixed oxides specific for the “pure” Fe– and Co–based catalysts (e.g., Fe2O3/Fe3O4 and CoO), showed a higher CO2 conversion and CO production than the “pure” Fe-based film. The highest efficiency of CO production (YCO) at 400 °C was achieved over the composites with the dominating content of iron, i.e., 0.61Fe0.39Co, 0.74Fe0.26Co, 0.82Fe0.18Co and these values were 30%, 28% and 26%, respectively. This is much higher than YCO = 8% for the “pure” Fe–based catalyst at 400 °C. Similar relationships were obtained at the process temperature of 350 °C, but the observed yield of CO2 production was lower than 20%.
To sum up, our results show that in all cases, increasing the Fe fraction in Fe–Co catalysts not only suppresses the conversion of CO2 in comparison to the “pure” Co–based catalyst, but also controls the selectivity by inhibiting the formation of methane while favoring the formation of CO (Figure 8a). It is apparent that the presence of even a small amount of iron in Fe–Co composite governs its performance. By introducing about 0.1 fraction of Fe into Fe–Co system, the selectivity to CO increased sharply, and at the same time, the selectivity to CH4 dropped violently. When analyzing the behavior of the Fe–Co composites, which contain at least 0.6 atomic fraction of iron, a significant improvement in catalytic properties relative to the 1.0Fe was observed: both the conversion of CO2 was at least two times greater than that of the 1.0Fe and a slightly better selectivity to CO (Figure 8a). As a result, at 400 °C the efficiency of CO production is three times higher than that of the 1.0Fe catalyst. Analyzing the catalytic tests from the perspective of the efficiency of RWGS reaction, it is evident that introducing cobalt into the Fe–Co composites, has a beneficial effect on their behavior in terms of the yield of CO production. It should be also noted that the higher activity of Fe–Co catalysts in comparison to the “pure” Fe-based system cannot be attributed by the higher surface area of the Fe–Co composites according to the SEM measurements.

2.3. Explaining the Mechanism of Catalytic Activity

Our plasma-deposited Co-based catalysts revealed negligible activity in RWGS reaction and methane was the main product in CO2 hydrogenation. On the other hand, Fe-Co nanocomposites shift the selectivity to the RWGS regime that is encountered for the “pure” Fe–based catalysts. Furthermore, Fe–Co nanocomposites outperformed the “pure” Fe-based catalyst in terms of the selectivity to CO and the CO2 conversion. A combination of better conversion and slightly higher selectivity to CO contributed to the observed higher yield of CO production.
When trying to explain the mechanism of the observed effect, one should take into account the significant complexity of the studied Fe–Co composite, which as we have shown, contains CoO, Fe2O3 and Fe3O4 nanoparticles embedded in a carbon matrix. At this stage of research, we can only suggest a presumed explanation based on the key fact that the oxides mentioned above are semiconducting in nature and, interestingly that they are different types of semiconductors. It has already been established that cobalt oxide CoO without intentional doping is a p–type semiconductor [44,45], with a band gap of 2.2–2.8 eV [46,47]. On the other hand, iron oxide Fe2O3 [48,49,50,51], including that produced by plasma deposition from Fe(CO)5 [52], as we prepare it, as well as Fe3O4 [53,54,55], are n–type semiconductors, with a band gap of 2.1–2.2 eV for Fe2O3 and very narrow in the range of 0.1–0.2 eV for Fe3O4, often classified as a half-metal.
If there are nanoparticles of p–type and n–type semiconductors in the catalyst layer, it is easy to predict that pn heterojunctions will appear there, e.g., CoO/Fe2O3. In our composite, the creation of such heterojunctions does not necessarily take place through direct contact of nanoparticles. They can also contact through the carbon matrix interlayer, which due to the high concentration of sp2 carbon, is graphite-like, and therefore highly conductive. As a model, it can be referred as a system of p–type semiconductor–metal—n–type semiconductor [56]. If a pn heterojunction is formed, charge transfer between the p and n regions will occur, as a result of which the concentration of electrons and holes will rearrange, the density of electrons in CoO and holes in Fe2O3 will increase. There is no doubt that such a change in the electronic structure of a given oxide has a significant impact on its catalytic properties. A similar concept, based on heterojunction and charge transfer, has already been used to attempt to clarify the effect of an oxide support on changes in the activity and selectivity of oxide or metal catalyst placed on this support [57,58].
Referring to Figure 8, it can be assumed that even a small presence of iron oxides in the composite (about 0.1 of Fe/(Fe + Co)) causes a clear change in the electronic structure of CoO and iron oxides as a result of heterojunctions formation and charge transfer. It manifested in a rapid inhibition of CH4 synthesis on the p–type CoO and an increase in the yield of CO synthesis on the n–type iron oxides. It is worth noting that already at this point the CO yield is higher than for the “pure” Fe–based catalyst. A further increase in the iron oxides content increases the concentration of heterojunctions, and thus increases the activity in the production of CO by these oxides. The yield of CO grows, reaching a maximum for Fe content in the composite of about 0.6–0.7 Fe/(Fe + Co). The continued increase in the content of iron oxide nanoparticles (for Fe/(Fe + Co) > 0.7) is faced with a deficiency of CoO, so that not all of them are involved in charge transfer and therefore show much less activity. The CO yield of the composite begins to decrease toward the value characteristic for the “pure” Fe–based catalyst.

3. Materials and Methods

3.1. Preparation of Thin-Film Catalysts

Thin films containing cobalt oxides (CoOx), iron oxides (FeOx) and the mixed oxides of FeOx/CoOx were produced by the cold plasma deposition method (PECVD) in a parallel-plate radio-frequency (RF 13.56 MHz) reactor. The films were deposited on precalcined wire-mesh support shown in Figure 2. The wire of 0.11 mm diameter is made from FeArCr alloy containing Fe: 73.7%, Cr: 21%, Al: 5.3% and trace amounts of Mn, Ni, and Cu (TermTech, Warsaw, Poland). Prior to the plasma deposition, the circle disks of 2.3 cm diameter were cut and a hole of 10 mm was made in the center to be then placed evenly in the tubular reactor for the catalytic tests. The disks were calcined at 900 °C in the air for 48 h to obtain a segregated layer of highly dispersed α-Al2O3 on the support surface. As reported in our previous papers [23,24], the high surface area of alumina ensures adequate dispersion of the plasma-deposited films on the support.
Since details of the design of the flow plasma reactor, as well as the PECVD process, are described elsewhere [23], only a brief description of the catalyst fabrication process will be given here. We used two precursors: cobalt (I) cyclopentadiene dicarbonyl (CpCo(CO)2, Stream Chemicals, Newburyport, MA, USA) and iron pentacarbonyl (Fe(CO)5, Stream Chemicals, Newburyport, MA, USA). Their vapors were supplied to the reactor chamber by a carrier gas (Ar, 99.999%, Linde Gas Poland) at a constant flow rate of 1.0 sccm. The films were deposited with a glow discharge of 60 W for 30 min on each side of the support. In our experiments, the key parameters that influenced the film properties were the flow rates of the precursors, which were controlled by measuring the pressure inside the reactor chamber. The main parameters of the deposition process are shown in Table 2. The Fe–Co composites were obtained by simultaneous co-deposition of the two precursors. In this case, a varied flow rate of iron precursor in the range of 0.002–0.137 sccm was used while keeping the flow rates of the carrier gas (1.0 sccm) and the cobalt precursor (0.083 sccm) constant. This allowed to fabricate Fe–Co composites with different Fe/Co atomic ratios. In all deposition experiments, the total pressure of argon and vapors of the precursors was less than 4.5 Pa.
Then, as-deposited films were thermally activated (heating rate 10 °C/min) at 400 °C for 30 min under a continuous flow of argon at the flow rate of 2 L/min. The aim of this step was to stabilize the as-deposited materials and to get the active form of the metal oxides.

3.2. Characterization of Plasma-Deposited Thin Films

The morphology of the films and their elemental bulk composition was determined by a scanning electron microscope Quanta 200 F (FEI, Hillsboro, OR, USA) equipped with an energy-dispersive X-ray spectrometer (EDX Oxford INCA 250, Oxford Instruments, Abingdon, UK). The EDX measurements were taken at ten spots for a given sample using electron energy of 20 keV. Based on the calculated average atomic percentage concentration, the relative ratio of iron to cobalt in Fe–Co nanocomposites was determined.
The phase composition of the catalysts was investigated via X-ray diffraction (XRD). The patterns were measured with a PANalytical X’Pert Pro MD diffractometer with a Cu Kα X-ray source (1.5406 Å) (Malvern Panalytical Ltd, Malvern, UK). The measurements were performed with GID (Grazing Incidence Diffraction) mode at a 1.5° angle. The scanning range was 20–90° with a step of 0.02°.
The phase composition of the thin films was also investigated with Raman spectroscopy (alpha 300 M+, WITec GmbH, Ulm, Germany). Air-cooled solid–state 488 nm laser was used along with ZEISS Epiplan-Neofluar objective (100×/0.9 NA), UHTS 300 spectrograph, 600 grooves/mm grating and Andor CCD detector. The Raman spectra were evaluated by WITec Control FIVE software using 10 accumulations with 20 s acquisition time per each accumulation within 120–1800 cm−1 spectral ranges. Subsequently, data pre-processing analysis was executed with WITec Project FIVE 5.3 PLUS software. First, according to the standard protocol baseline correction (3rd polynomial order) was made and then cosmic spikes removal (CRR filter) was executed. The final result for each specimen is an average from five spectra recorded in the representative areas.
The elemental composition and molecular structure of the surface of the catalytic films were investigated by X-ray photoelectron spectroscopy (XPS), using the same procedure as described previously [24]. The measurements were conducted using a Kratos AXIS Ultra spectrometer (Kratos Analytical Ltd., Manchester, UK) with a monochromatic Al-Kα X-ray source (1486.6 eV). The spectra were obtained using an analysis area of 300 µm × 700 µm. The power of the anode was set at 180 W, and the hemispherical electron energy analyzer was operated at a pass energy of 20 eV for all high-resolution measurements. The measurements were performed with a charge neutralizer. XPS spectra were analyzed using Kratos Vision 2 software, calibrating them by setting the main C1s carbon peak (which was assigned to sp2 carbon) at 284.4 eV. The background subtraction was performed with Shirley’s function.

3.3. Catalytic Performance

Catalytic tests were carried out in a tubular fixed-bed quartz reactor (inner diameter of 2.3 cm, total length of 30 cm) under atmospheric pressure. The reactor working in a continuous flow mode was placed in the horizontal electric furnace with a temperature programmable controller (Figure 9).
To obtain a fair catalytic comparison of different samples, the same amount of catalyst was always placed in the same stacking manner in the reactor. The catalyst bed consisted of six wire-mesh disks (I. D = 1 cm, O. D = 2.3 cm) and was packed uniformly in the middle of the reactor with a distance of 2 cm between them. The overall geometric surface area of the catalyst bed was 38 cm2 and the length of the catalytic bed was 10 cm. Its mass was ~0.7 g and it concerns the total mass of the catalyst including the thin-film (active phase) and the support. The support weight before and after catalyst deposition showed a mass of the catalyst from 5 to 12 mg depending on its type, so the loading can be estimated as 0.7–1.7%.
The location of the isothermal zone of the tubular reactor was identified by running experiments under the flow of helium prior to the catalytic tests. Then, to verify the actual temperature in the reaction zone, a movable thermocouple was placed at different locations along the structured catalytic bed. The measurements showed that for the geometry of the catalytic reactor and the applied flow rate of the H2/CO2 mixture, the isothermal conditions were maintained.
The temperature of the reactor was adjusted to the starting reaction temperature of 250 °C under continuous flow of helium. The kinetic tests were carried out in the range of 250–400 °C under atmospheric pressure with a temperature span of 50 °C at a heating rate of 5 °C/min. An inlet gas mixture consisting of CO2 (99.99%) and H2 (99.999%), both provided by Linde Gas (Kraków, Poland), was passed through the catalytic bed at a total flow rate of 25 sccm with a feed composition of H2/CO2 = 4 controlled by the mass flow controllers (SLA5850, Brooks Instrument, Hatfield, PA, USA). The outlet gases passed through the cold trap and the dry gas composition was further analyzed using an online gas chromatograph (SRI 8610 C, SRI Instruments, Torrance, CA, USA) equipped with a thermal conductivity detector (TCD). Carbon-containing components including CO2, CO and CH4 were separated and analyzed on a HayeSep D column (Agilent, Santa Clara, CA, USA).
Under the applied experimental conditions, the steady state in the catalytic reactor was achieved after 10 min from reaching the set temperature Then the GC analysis was performed three times every 10 min, and the measurement confirmed the stable operation of the catalyst. It follows that the catalyst was operated for 30 min at a given temperature. An average of the three points from the GC analysis was taken for subsequent calculations. Based on the previously prepared CO2, CO and CH4 calibration curves and the carbon mass balance, the CO2 conversion (XCO2), selectivity to CO and CH4 (SCO and SCH4) and the product yield (YCO and YCH4) were determined according to the formulas described previously [24].

4. Conclusions

The series of thin-film catalysts based on cobalt and iron oxides were prepared by the PECVD technique on a wire-mesh structured support. By controlling the relative flow rates of iron and cobalt precursors, various thin films with different Fe/(Fe + Co) atomic fractions were fabricated and tested in the CO2 hydrogenation process.
The films containing the crystalline structures of CoO and Fe2O3/Fe3O4, as well as the nanocomposite series composed of mixtures of these oxides (CoO, Fe2O3 and Fe3O4) revealed different activity in hydrogenation of CO2. The CoO–based catalyst exhibited high activity toward methane, while the Fe2O3/Fe3O4 system was much less active and converted CO2 mainly into CO. Even a small fraction of iron in the Fe-Co nanocomposite inhibited the production of methane. However, with the increase in Fe fraction in the nanocomposite, the efficiency of the RWGS reaction increased compared to the Fe2O3/Fe3O4–based system. The Fe-Co nanocomposites with Fe/(Fe + Co) atomic fractions in the range of 0.6–0.7, showed enhanced activity toward CO formation achieving 95% selectivity to CO and approx. 30% conversion of CO2 at 400 °C. The superior performance of nanocomposites compared to “pure” Co and Fe–based films was tentatively explained by assuming changes in the electronic structure of the catalyst resulting from the formation of p-n heterojunctions between nanoparticles of cobalt and iron oxides.
Due to the enhanced catalytic performance, the new Fe–Co nanocomposites can be considered to be promising systems for CO2 conversion pathways. The present findings have shown that the rational design of the molecular and electronic structure of the catalysts by controlling the parameters of the deposition process may contribute to the advancement of thin-film catalysts prepared by plasma.
In addition to increased catalytic performance, the new Fe–Co composites are stable in short-term kinetic runs, which is a necessary prerequisite for their deeper investigations in long-term stability tests, including a detailed characterization of the surface of the spent catalyst. For more comprehensive explanation of the mechanism of the catalytic behavior of the plasma-prepared composites and elucidation of the nature of active sites, more research is needed to confirm that the coexistence of different phases exhibiting different electronic properties play the key role in the catalytic activity of the Fe–Co composites.

Author Contributions

Conceptualization and methodology, H.K.-P. and J.T.; XPS analysis, J.T. and M.F.; XRD and Raman spectroscopy, M.S., P.Z., K.Ł., M.F., R.K. and J.T.; catalytic investigation, M.R. and R.K.; SEM/EDX analysis, J.S., H.K.-P. and J.T.; data curation, M.R., M.F., M.S., P.Z., K.Ł.; formal analysis, H.K.-P., M.F. and J.T.; writing—original draft preparation, H.K.-P., M.F. and J.T.; writing—review and editing, H.K.-P. and J.T.; visualization, H.K.-P., M.F. and M.R.; supervision, H.K.-P. and J.T. All authors have read and agreed to the published version of the manuscript.

Funding

This work was financially supported by the National Science Centre (NCN) of Poland (Dec. 2017/25/B/ST8/00969 and Dec. 2018/29/N/ST8/02403).

Conflicts of Interest

The authors declare no conflict of interest.

References

  1. Gabrielli, P.; Gazzani, M.; Mazzotti, M. The Role of Carbon Capture and Utilization, Carbon Capture and Storage, and Biomass to Enable a Net-Zero-CO2 Emissions Chemical Industry. Ind. Eng. Chem. Res. 2020, 59, 7033–7045. [Google Scholar] [CrossRef] [Green Version]
  2. Roy, S.; Cherevotan, A.; Peter, S.C. Thermochemical CO2 hydrogenation to single carbon products: Scientific and technological challenges. ACS Energy Lett. 2018, 3, 1938–1966. [Google Scholar] [CrossRef] [Green Version]
  3. Liu, M.; Yi, Y.; Wang, L.; Guo, H.; Bogaerts, A. Hydrogenation of carbon dioxide to value-added chemicals by heterogeneous catalysis and plasma catalysis. Catalysts 2019, 9, 275. [Google Scholar] [CrossRef] [Green Version]
  4. Chauvy, R.; Meunier, N.; Thomas, D.; De Weireld, G. Selecting emerging CO2 utilization products for short-to mid-term deployment. Appl. Energy 2019, 236, 662–680. [Google Scholar] [CrossRef]
  5. Kirchner, J.; Baysal, Z.; Kureti, S. Activity and Structural Changes of Fe-based Catalysts during CO2 Hydrogenation towards CH4–A Mini Review. ChemCatChem 2020, 12, 981–988. [Google Scholar] [CrossRef] [Green Version]
  6. Sreedhar, I.; Varun, Y.; Singh, S.A.; Venugopal, A.; Reddy, B.M. Developmental trends in CO2 methanation using various catalysts. Catal. Sci. Technol. 2019, 9, 4478–4504. [Google Scholar] [CrossRef]
  7. Lee, W.J.; Li, C.; Prajitno, H.; Yoo, J.; Patel, J.; Yang, Y.; Lim, S. Recent trend in thermal catalytic low temperature CO2 methanation: A critical review. Catal. Today 2020, 368, 2–19. [Google Scholar] [CrossRef]
  8. Thema, M.; Bauer, F.; Sterner, M. Power-to-Gas: Electrolysis and methanation status review. Renew. Sustain. Energy Rev. 2019, 112, 775–787. [Google Scholar] [CrossRef]
  9. Daza, Y.A.; Kuhn, J.N. CO2 conversion by reverse water gas shift catalysis: Comparison of catalysts, mechanisms and their consequences for CO2 conversion to liquid fuels. RSC Adv. 2016, 6, 49675–49691. [Google Scholar] [CrossRef]
  10. Jurković, D.L.; Pohar, A.; Dasireddy, V.D.; Likozar, B. Effect of Copper-based Catalyst Support on Reverse Water-Gas Shift Reaction (RWGS) Activity for CO2 Reduction. Chem. Eng. Technol. 2017, 40, 973–980. [Google Scholar] [CrossRef]
  11. Pastor-Pérez, L.; Shah, M.; Le Saché, E.; Ramirez Reina, T. Improving Fe/Al2O3 Catalysts for the Reverse Water-Gas Shift Reaction: On the Effect of Cs as Activity/Selectivity Promoter. Catalysts 2018, 8, 608. [Google Scholar] [CrossRef] [Green Version]
  12. Zhu, M.; Ge, Q.; Zhu, X. Catalytic Reduction of CO2 to CO via Reverse Water Gas Shift Reaction: Recent Advances in the Design of Active and Selective Supported Metal Catalysts. Trans. Tianjin Univ. 2020, 26, 172–187. [Google Scholar] [CrossRef] [Green Version]
  13. Puga, A.V. On the nature of active phases and sites in CO and CO2 hydrogenation catalysts. Catal. Sci. Technol. 2018, 8, 5681–5707. [Google Scholar] [CrossRef]
  14. Mehla, S.; Das, J.; Jampaiah, D.; Periasamy, S.; Nafady, A.; Bhargava, S.K. Recent advances in preparation methods for catalytic thin films and coatings. Catal. Sci. Technol. 2019, 9, 3582–3602. [Google Scholar] [CrossRef]
  15. Brault, P. Plasma deposition of catalytic thin films: Experiments, applications, molecular modeling. Surf. Coat. Technol. 2011, 205, S15–S23. [Google Scholar] [CrossRef] [Green Version]
  16. Gascon, J.; Van Ommen, J.R.; Moulijn, J.A.; Kapteijn, F. Structuring catalyst and reactor–an inviting avenue to process intensification. Catal. Sci. Technol. 2015, 5, 807–817. [Google Scholar] [CrossRef]
  17. Keil, F.J. Process intensification. Rev. Chem. Eng. 2018, 34, 135–200. [Google Scholar] [CrossRef] [Green Version]
  18. Pérez, S.; Aragón, J.J.; Peciña, I.; Garcia-Suarez, E.J. Enhanced CO2 Methanation by New Microstructured Reactor Concept and Design. Top. Catal. 2019, 62, 518–523. [Google Scholar] [CrossRef] [Green Version]
  19. Liang, H.; Ming, F.; Alshareef, H.N. Applications of plasma in energy conversion and storage materials. Adv. Energy Mater. 2018, 8, 1801804. [Google Scholar] [CrossRef]
  20. Dos Santos, A.M.; Catapan, R.C.; Duarte, D.A. The potential of non-thermal plasmas in the preparation of supported metal catalysts for fuel conversion in automotive systems: A literature overview. Front. Mech. Eng. 2020, 6, 42. [Google Scholar] [CrossRef]
  21. Wang, Z.; Zhang, Y.; Neyts, E.C.; Cao, X.; Zhang, X.; Jang, B.W.L.; Liu, C.J. Catalyst preparation with plasmas: How does it work? ACS Catal. 2018, 8, 2093–2110. [Google Scholar] [CrossRef]
  22. Tyczkowski, J. Cold plasma produced catalytic materials. In Plasma Science and Technology—Progress in Physical States and Chemical Reactions; Mieno, T., Ed.; InTech: Rijeka, Croatia, 2016. [Google Scholar] [CrossRef]
  23. Tyczkowski, J.; Kierzkowska-Pawlak, H.; Kapica, R.; Balcerzak, J.; Sielski, J. Cold plasma−A promising tool for the production of thin-film nanocatalysts. Catal. Today 2019, 337, 44–54. [Google Scholar] [CrossRef]
  24. Kierzkowska-Pawlak, H.; Tyczkowski, J.; Balcerzak, J.; Tracz, P. Advances in plasma produced CoOx-based nanocatalysts for CO2 methanation. Catal. Today 2019, 337, 162–170. [Google Scholar] [CrossRef]
  25. Jiang, F.; Liu, B.; Geng, S.; Xu, Y.; Liu, X. Hydrogenation of CO2 into hydrocarbons: Enhanced catalytic activity over Fe-based Fischer–Tropsch catalysts. Catal. Sci. Technol. 2018, 8, 4097–4107. [Google Scholar] [CrossRef]
  26. Gnanamani, M.K.; Jacobs, G.; Hamdeh, H.H.; Shafer, W.D.; Liu, F.; Hopps, S.D.; Thomas, G.A.; Davis, B.H. Hydrogenation of carbon dioxide over Co–Fe bimetallic catalysts. ACS Catal. 2016, 6, 913–927. [Google Scholar] [CrossRef]
  27. Tsirelson, V.G.; Antipin, M.Y.; Gerr, R.G.; Ozerov, R.P.; Struchkov, Y.T. Ruby structure peculiarities derived from X-ray diffraction data. Localization of chromium atoms and electron deformation density. Phys. Status Solidi (a) 1985, 87, 425–433. [Google Scholar] [CrossRef]
  28. Li, Y.; Hu, Y.; Huang, G.; Li, C. Metallic Iron Nanoparticles: Flame Synthesis, Characterization and Magnetic Properties. Particuology 2013, 11, 460–467. [Google Scholar] [CrossRef]
  29. Cursaru, L.M.; Piticescu, R.M.; Dragut, D.V.; Tudor, I.A.; Kuncser, V.; Iacob, N.; Stoiciu, F. The Influence of Synthesis Parameters on Structural and Magnetic Properties of Iron Oxide Nanomaterials. Nanomaterials 2020, 10, 85. [Google Scholar] [CrossRef] [Green Version]
  30. Deori, K.; Deka, S. Morphology Oriented Surfactant Dependent CoO and Reaction Time Dependent Co3O4 Nanocrystals from Single Synthesis Method and Their Optical and Magnetic Properties. CrystEngComm 2013, 15, 8465. [Google Scholar] [CrossRef]
  31. Compeán-Jasso, M.E.; Ruiz, F.; Martínez, J.R.; Herrera-Gómez, A. Magnetic Properties of Magnetite Nanoparticles Synthesized by Forced Hydrolysis. Mat. Lett. 2008, 62, 4248–4250. [Google Scholar] [CrossRef]
  32. De Faria, D.L.A.; Venâncio Silva, S.; De Oliveira, M.T. Raman microspectroscopy of some iron oxides and oxyhydroxides. J. Raman Spectrosc. 1997, 28, 873–878. [Google Scholar] [CrossRef]
  33. Lu, J.; Tsai, C.-J. Hydrothermal phase transformation of hematite to magnetite. Nanoscale Res. Lett. 2014, 9, 230. [Google Scholar] [CrossRef] [Green Version]
  34. Ravindra, V.; Behera, B.C.; Padhan, P. Laser induced structural phase transformation of cobalt oxides nanostructures. J. Nanosci. Nanotechnol. 2014, 14, 5591–5595. [Google Scholar] [CrossRef] [PubMed]
  35. Magg, N.; Immaraporn, B.; Giorgi, J.B.; Schroeder, T.; Bäumer, M.; Döbler, J.; Wu, Z.; Kondratenko, E.; Cherian, M.; Baerns, M.; et al. Vibrational spectra of alumina- and silica-supported vanadia revisited: An experimental and theoretical model catalyst study. J. Catal. 2004, 226, 88–100. [Google Scholar] [CrossRef]
  36. Gangwar, J.; Gupta, B.K.; Tripathi, S.K.; Srivastava, A.K. Phase dependent thermal and spectroscopic responses of Al2O3 nanostructures with different morphogenesis. Nanoscale 2015, 7, 13313–13344. [Google Scholar] [CrossRef]
  37. Porto, S.P.S.; Krishnan, R.S. Raman Effect of Corundum. J. Chem. Phys. 1967, 47, 1009–1012. [Google Scholar] [CrossRef]
  38. Cebulski, J.; Pasek, D.; Bik, M.; Świerczek, K.; Jeleń, P.; Mroczka, K.; Dąbrowa, J.; Zajusz, M.; Wyrwa, J.; Sitarz, M. In-situ XRD investigations of FeAl intermetallic phase-based alloy oxidation. Corros. Sci. 2020, 164, 108344. [Google Scholar] [CrossRef]
  39. Ferrari, A.C.; Roberston, J. Interpretation of Raman spectra of disordered and amorphous carbon. Phys. Rev. B 2000, 61, 14095–14107. [Google Scholar] [CrossRef] [Green Version]
  40. Petitto, S.C.; Marsh, E.M.; Carson, G.A.; Langell, M.A. Cobalt oxide surface chemistry: The interaction of CoO(100), Co3O4(110), and Co3O4(1 1 1) with oxygen and water. J. Mol. Catal. A Chem. 2008, 281, 49–58. [Google Scholar] [CrossRef] [Green Version]
  41. Yamashita, T.; Hayes, P. Analysis of XPS spectra of Fe2+ and Fe3+ ions in oxide materials. Appl. Surf. Sci. 2008, 254, 2441–2449. [Google Scholar] [CrossRef]
  42. Lesiak, B.; Kövér, L.; Tóth, J.; Zemek, J.; Jiricek, P.; Kromka, A.; Rangam, N. C sp 2/sp 3 hybridisations in carbon nanomaterials—XPS and (X)AES study. Appl. Surf. Sci. 2018, 452, 223–231. [Google Scholar] [CrossRef]
  43. Gardner, S.D.; Singamsetty, C.S.K.; Booth, G.L.; He, G.-R.; Pittman, C.U. Surface characterization of carbon fibers using angle-resolved XPS and ISS. Carbon 1995, 33, 587–595. [Google Scholar] [CrossRef]
  44. Drasovean, R.; Condurache-Bota, S.; Tigau, N. Structural and electrical characterization of cobalt oxide semiconductors. J. Sci. Arts. 2010, 2, 379–384. [Google Scholar]
  45. Wang, Y.; Ge, H.X.; Chen, Y.P.; Meng, X.Y.; Ghanbaja, J.; Horwat, D.; Pierson, J.F. Wurtzite CoO: A direct band gap oxide suitable for a photovoltaic absorber. Chem. Commun. 2018, 54, 13949–13952. [Google Scholar] [CrossRef]
  46. Van Elp, J.; Wieland, J.L.; Eskes, H.; Kuiper, P.; Sawatzky, G.A.; De Groot, F.M.F.; Turner, T.S. Electronic structure of CoO, Li-doped CoO, and LiCoO2. Phys. Rev. B 1991, 44, 6090. [Google Scholar] [CrossRef] [PubMed]
  47. Alidoust, N.; Lessio, M.; Carter, E.A. Cobalt (II) oxide and nickel (II) oxide alloys as potential intermediate-band semiconductors: A theoretical study. J. Appl. Phys. 2016, 119, 025102. [Google Scholar] [CrossRef]
  48. Barreca, D.; Carraro, G.; Gasparotto, A.; Maccato, C.; Sada, C.; Singh, A.P.; Mathur, S.; Mettenbörger, A.; Bontempi, E.; Depero, L.E. Columnar Fe2O3 arrays via plasma-enhanced growth: Interplay of fluorine substitution and photoelectrochemical properties. Int. J. Hydrog. Energy 2013, 38, 14189–14199. [Google Scholar] [CrossRef]
  49. Carraro, G.; Gasparotto, A.; Maccato, C.; Bontempi, E.; Bilo, F.; Peeters, D.; Sada, C.; Barreca, D. A plasma-assisted approach for the controlled dispersion of CuO aggregates into β iron (III) oxide matrices. CrystEngComm 2014, 16, 8710–8716. [Google Scholar] [CrossRef]
  50. Seki, M. Bandgap-Engineered Iron Oxides for Solar Energy Harvesting. In Iron Ores and Iron Oxide Materials; Intech: London, UK, 2018. [Google Scholar] [CrossRef] [Green Version]
  51. Zong, X.; Li, C. Photocatalytic water splitting on metal oxide-based semiconductor photocatalysts. In Metal Oxides in Heterogeneous Catalysis; Elsevier: Amsterdam, The Netherlands, 2018; pp. 355–399. [Google Scholar] [CrossRef]
  52. Singh, A.P.; Mettenbörger, A.; Golus, P.; Mathur, S. Photoelectrochemical properties of hematite films grown by plasma enhanced chemical vapor deposition. Int. J. Hydrog. Energy 2012, 37, 13983–13988. [Google Scholar] [CrossRef]
  53. Jordan, K.; Cazacu, A.; Manai, G.; Ceballos, S.F.; Murphy, S.; Shvets, I.V. Scanning tunneling spectroscopy study of the electronic structure of Fe3O4 surfaces. Phys. Rev. B 2006, 74, 085416. [Google Scholar] [CrossRef]
  54. Cao, X.; Chen, Y.; Jiao, S.; Fang, Z.; Xu, M.; Liu, X.; Li, L.; Pang, G.; Feng, S. Magnetic photocatalysts with a p–n junction: Fe3O4 nanoparticle and FeWO4 nanowire heterostructures. Nanoscale 2014, 6, 12366–12370. [Google Scholar] [CrossRef] [PubMed]
  55. Liu, H.; Di Valentin, C. Band gap in magnetite above Verwey temperature induced by symmetry breaking. J. Phys. Chem. C 2017, 121, 25736–25742. [Google Scholar] [CrossRef]
  56. Nakamura, K.; Oshikiri, T.; Ueno, K.; Wang, Y.; Kamata, Y.; Kotake, Y.; Misawa, H. Properties of plasmon-induced photoelectric conversion on a TiO2/NiO p–n junction with Au nanoparticles. J. Phys. Chem. Lett. 2016, 7, 1004–1009. [Google Scholar] [CrossRef] [PubMed]
  57. Strayer, M.E.; Senftle, T.P.; Winterstein, J.P.; Vargas-Barbosa, N.M.; Sharma, R.; Rioux, R.M.; Janik, M.J.; Mallouk, T.E. Charge transfer stabilization of late transition metal oxide nanoparticles on a layered niobate support. J. Am. Chem. Soc. 2015, 137, 16216–16224. [Google Scholar] [CrossRef] [Green Version]
  58. Jia, J.; Qian, C.; Dong, Y.; Li, Y.; Wang, H.; Ghoussoub, M.; Butler, K.T.; Walsh, A.; Ozin, G.A. Heterogeneous catalytic hydrogenation of CO2 by metal oxides: Defect engineering–perfecting imperfection. Chem. Soc. Rev. 2017, 46, 4631–4644. [Google Scholar] [CrossRef] [PubMed]
Figure 1. Composition of Fe–Co thin films as a function of the ratio of precursor pressures PFe/(PFe + PCo). The pressure of iron precursor was varied in the range (0–0.4) Pa while keeping the pressure of cobalt precursor constant at 0.2 Pa.
Catalysts 11 00883 g001
Figure 2. SEM images of the surface of the calcined wire-mesh support and different thin-film catalysts with the increasing fraction of iron.
Catalysts 11 00883 g002
Figure 3. XRD patterns for 1.0Co (black), 1.0Fe (blue) and 0.61Fe0.39Co (red) thin films.
Catalysts 11 00883 g003
Figure 4. Raman spectra for 1.0Co (black), 1.0Fe (blue) and 0.61Fe0.39Co (red) thin films.
Catalysts 11 00883 g004
Figure 5. XPS results. (a) Co 2p3/2 spectrum for 1.0Co sample. (b) Fe 3p3/2 spectrum for 1.0Fe sample. (c) Co 2p and Fe 3p spectra for 0.61Fe0.39Co sample. (d) C 1s spectrum for 0.37Fe0.63Co sample.
Catalysts 11 00883 g005aCatalysts 11 00883 g005b
Figure 6. The chemical structure of the plasma-deposited Fe-Co nanocomposites based on XPS and EDX analysis: (a) the atomic fraction of carbon calculated as C/(Fe + Co) and (b) relative contents of particular carbon species based on C 1s spectrum bands as functions of Fe/(Fe + Co) fractions.
Catalysts 11 00883 g006
Figure 7. Catalytic performance of the “pure” cobalt-based and the “pure” iron-based thin films in CO2 hydrogenation in terms of CO2 conversion and dominating selectivity. Reaction conditions: H2/CO2 = 4/1; 25 sccm, amount of catalyst 0.7 g (38 cm2). (a) 1.0Co catalyst; (b) 1.0Fe catalysts.
Catalysts 11 00883 g007
Figure 8. Catalytic performance of Fe–Co thin films in CO2 hydrogenation a function of Fe/(Fe + Co) atomic fraction in terms of: (a) selectivity to CO and CH4, CO2 conversion; (b) yield of CO and CH4 production. Reaction conditions: H2/CO2 = 4/1; 25 sccm, amount of catalyst 0.7 g (38 cm2).
Catalysts 11 00883 g008
Figure 9. The scheme of the experimental set-up for the catalytic tests. The thin-film catalyst supported on the wire-meshes is placed uniformly in the quartz double-wall tubular reactor.
Catalysts 11 00883 g009
Table 1. The atomic fraction of iron and cobalt in the Fe–Co composites prepared by plasma at different pressures of iron precursor while keeping the pressure of cobalt precursor constant at 0.2 Pa. The composition is based on the EDX elemental analysis.
Precursor Pressure
Fe(CO)5
Fe/(Fe + Co)
Atomic Fraction
Name of Catalyst
(Pa)(at.%)-
001.0Co
0.31001.0Fe
0.482.4 ± 0.50.82Fe0.18Co
0.374.2 ± 0.40.74Fe0.26Co
0.260.6 ± 1.30.61Fe0.39Co
0.136.9 ± 0.30.37Fe0.63Co
0.0524.0 ± 0.40.24Fe0.76Co
0.0113.4 ± 0.50.13Fe0.87Co
0.00510.0 ± 0.80.10Fe0.90Co
Table 2. Preparation conditions of the thin-film catalysts on the structured support. The Fe-Co composites were prepared at a fixed flow rate of CpCo(CO)2 and varied Fe(CO)5 flow rates.
Type
of Catalyst
Precursor Carrier Gas—Ar
CompoundFlow Rate
(sccm)
Pressure
(Pa)
Flow Rate
(sccm)
Pressure
(Pa)
1.0Co
(CoOX)
CpCo(CO)20.0830.21.04
1.0Fe
(FeOX)
Fe(CO)50.1030.31.04
Fe–Co composite
(FeOX/CoOX)
CpCo(CO)20.083 (const.)0.21.04
Fe(CO)50.1370.41.04
0.1030.31.04
0.0690.21.04
0.0340.11.04
0.017approx.0.05 *1.04
0.003approx. 0.01 *1.04
0.002approx. 0.005 *1.04
* estimated values based on the applied flow rate of the precursor.
Publisher’s Note: MDPI stays neutral with regard to jurisdictional claims in published maps and institutional affiliations.

