2.1. Catalyst Performance
The O
2 sweep experiment is carried out to determine the concentration of O
2 at the stoichiometric condition based on a sudden increase in NO concentration between stoichiometric and fuel-lean conditions.
Figure 1 shows the effect of O
2 concentration on the concentration of NO for NA-, ZDDP1-, ZDDP2-, IL+ZDDP1-, and IL+ZDDP2-aged TWC samples at the inlet gas temperature of 500 °C. As seen in the figure, the NO concentration for all TWC samples begins to increase rapidly at an O
2 concentration of 0.73%, and thus this concentration of O
2 is taken to be the experimentally determined concentration at the stoichiometric condition for all subsequent evaluations.
The temperature sweep experiment is conducted to determine T
50 and T
90 of all engine-aged TWC samples at inlet gas temperatures between 100 and 640 °C using the O
2 concentration of 0.73% O
2 obtained previously. The light-off curves of NO, CO, C
3H
6, and C
3H
8 for NA-, ZDDP1-, ZDDP2-, IL+ZDDP1-, and IL+ZDDP2-aged TWC samples are shown in
Figure 2a–d, respectively. In addition, the formation of NH
3 and N
2O for all engine-aged TWC samples is shown in
Figure 2e–f, respectively. As seen in
Figure 2b–d, at a given conversion, the conversion of CO, C
3H
6, and C
3H
8 for all TWC samples exposed to lubricant additives, i.e., ZDDP1, ZDDP2, IL+ZDDP1, and IL+ZDDP2, always occurs at a slightly higher temperature as compared to the NA-aged TWC sample, indicating a higher T
50 and T
90 (see
Figure 3a,b). Such results unequivocally indicate the additional impact of lubricant additives (poisoning) on the performance of TWC in addition to thermal aging.
Figure 2e shows that the ZDDP2- and IL+ZDDP2-aged TWC samples produce more NH
3 compared to NA-, ZDDP1-and IL+ZDDP1-aged TWC samples at inlet gas temperatures between 150 and 280 °C, during which the conversion of NO for ZDDP2- and IL+ZDDP2-aged TWC samples is better than for NA-, ZDDP1-, and IL+ZDDP1-aged TWC samples (
Figure 2a). This results in a higher T
50 for NO for NA-, ZDDP1-, and IL+ZDDP1-aged TWC samples, as seen in
Figure 3a. Because there is a lack of NO reductants such as H
2, CO, and C
3H
6 in the temperature range between 270 and 320 °C, the conversion of NO decreases, resulting in an increase in T
90 for NO for all engine-aged TWC samples. Due to the complexity of the NO light-off curves, it is difficult to characterize the effects of lubricant additives on TWC performance using T
50 and T
90 of NO. However, based on the light-off curves of CO and C
3H
6 (
Figure 2b,c), ZDDP2- and IL+ZDDP2-aged TWC samples appear to experience more performance degradation of TWC than ZDDP1- and IL+ZDDP1-aged TWC samples. As mentioned before, this can be attributed to higher P, Zn, and S contents in ZDDP2 than those in ZDDP1.
Figure 3a,b show the temperature of 50% (T
50) and 90% (T
90) conversion of NO, CO, C
3H
6, and C
3H
8 for NA-, ZDDP1-, ZDDP2-, IL+ZDDP1-, and IL+ZDDP2- samples obtained from the light-off curves given in
Figure 2. As mentioned before, the T
50 of NO for ZDDP2- and IL+ZDDP2-aged TWC samples is lower than ZDDP1-, and IL+ZDDP1-aged TWC samples, which can be attributed to the higher formation of NH
3 at temperatures between 150 and 280 °C (see
Figure 2a,e). Except for the T
50 of NO, all TWC samples exposed to lubricant additives have higher T
50 and T
90 for CO, C
3H
6, and C
3H
8 than the NA-aged TWC sample, indicating further degradation of the TWC performance due to lubricant additives poisoning in addition to thermal aging. The reduction in CO and THC conversion of TWCs due to phosphorus-containing lubricant additives has also been found in previous studies [
4,
5,
6,
7,
10,
22]. With the exception of C
3H
8, it is not surprising that T
50 and T
90 of CO and C
3H
6 for ZDDP2- and IL+ZDDP2-aged TWC samples are higher than for ZDDP1- and IL+ZDDP1-aged TWC samples, since the ZDDP2 lubricant additive contains more P, S, and Zn by weight than ZDDP1. Thus, in general, the higher the amount of P, Zn, and S in the lubricant additive, the larger the impact on the TWC performance.
One of the major objectives of the present study is to compare the impact on the performance of the TWC by either a single ZDDP lubricant additive or a mixed lubricant additive containing both ZDDP and IL (IL+ZDDP). One way to determine the impact is to compare the T
50 and T
90 obtained from a single ZDDP lubricant additive and a mixed additive of IL and ZDDP, i.e., ZDDP1 vs. IL+ZDDP1 and ZDDP2 vs. IL+ZDDP2. As shown in
Figure 3, the T
50 for the ZDDP1-aged TWC sample increases by 15, 10, 16, and 26 °C for NO, CO, C
3H
6, and C
3H
8, respectively, as compared with the NA-aged TWC sample. Moreover, the T
50 for the IL+ZDDP1-aged TWC sample increases by a similar amount to the ZDDP1-aged TWC sample. For the ZDDP2-aged TWC sample, the T
50 for CO, C
3H
6, and C
3H
8 increases by 17, 28, and 31 °C, respectively, but decreases by 20 °C for NO compared with the NA-aged TWC sample. As in the case of ZDDP1 and IL+ZDDP1, the T
50 for NO, CO, C
3H
6, and C
3H
8 for the IL+ZDDP2-aged TWC sample is similar to that for the ZDDP2-aged TWC sample. A similar trend is observed for the T
90 for these samples. Based on these results, it is apparent that the impact of the mixed lubricant additives, either IL+ZDDP1 or IL+ZDDP2, on the TWC performance is similar to that of the ZDDP constituent rather than the IL. As will be shown later, the results obtained from surface characterization studies such as electron probe microanalysis (EPMA), powder X-ray diffraction (XRD), N
2 physisorption, and inductively coupled plasma-optical emission spectroscopy (ICP-OES) can be used to explain the effects of the lubricant additives on the T
50 and T
90 of NO, CO, C
3H
6, and C
3H
8 of accelerated engine-aged TWCs.
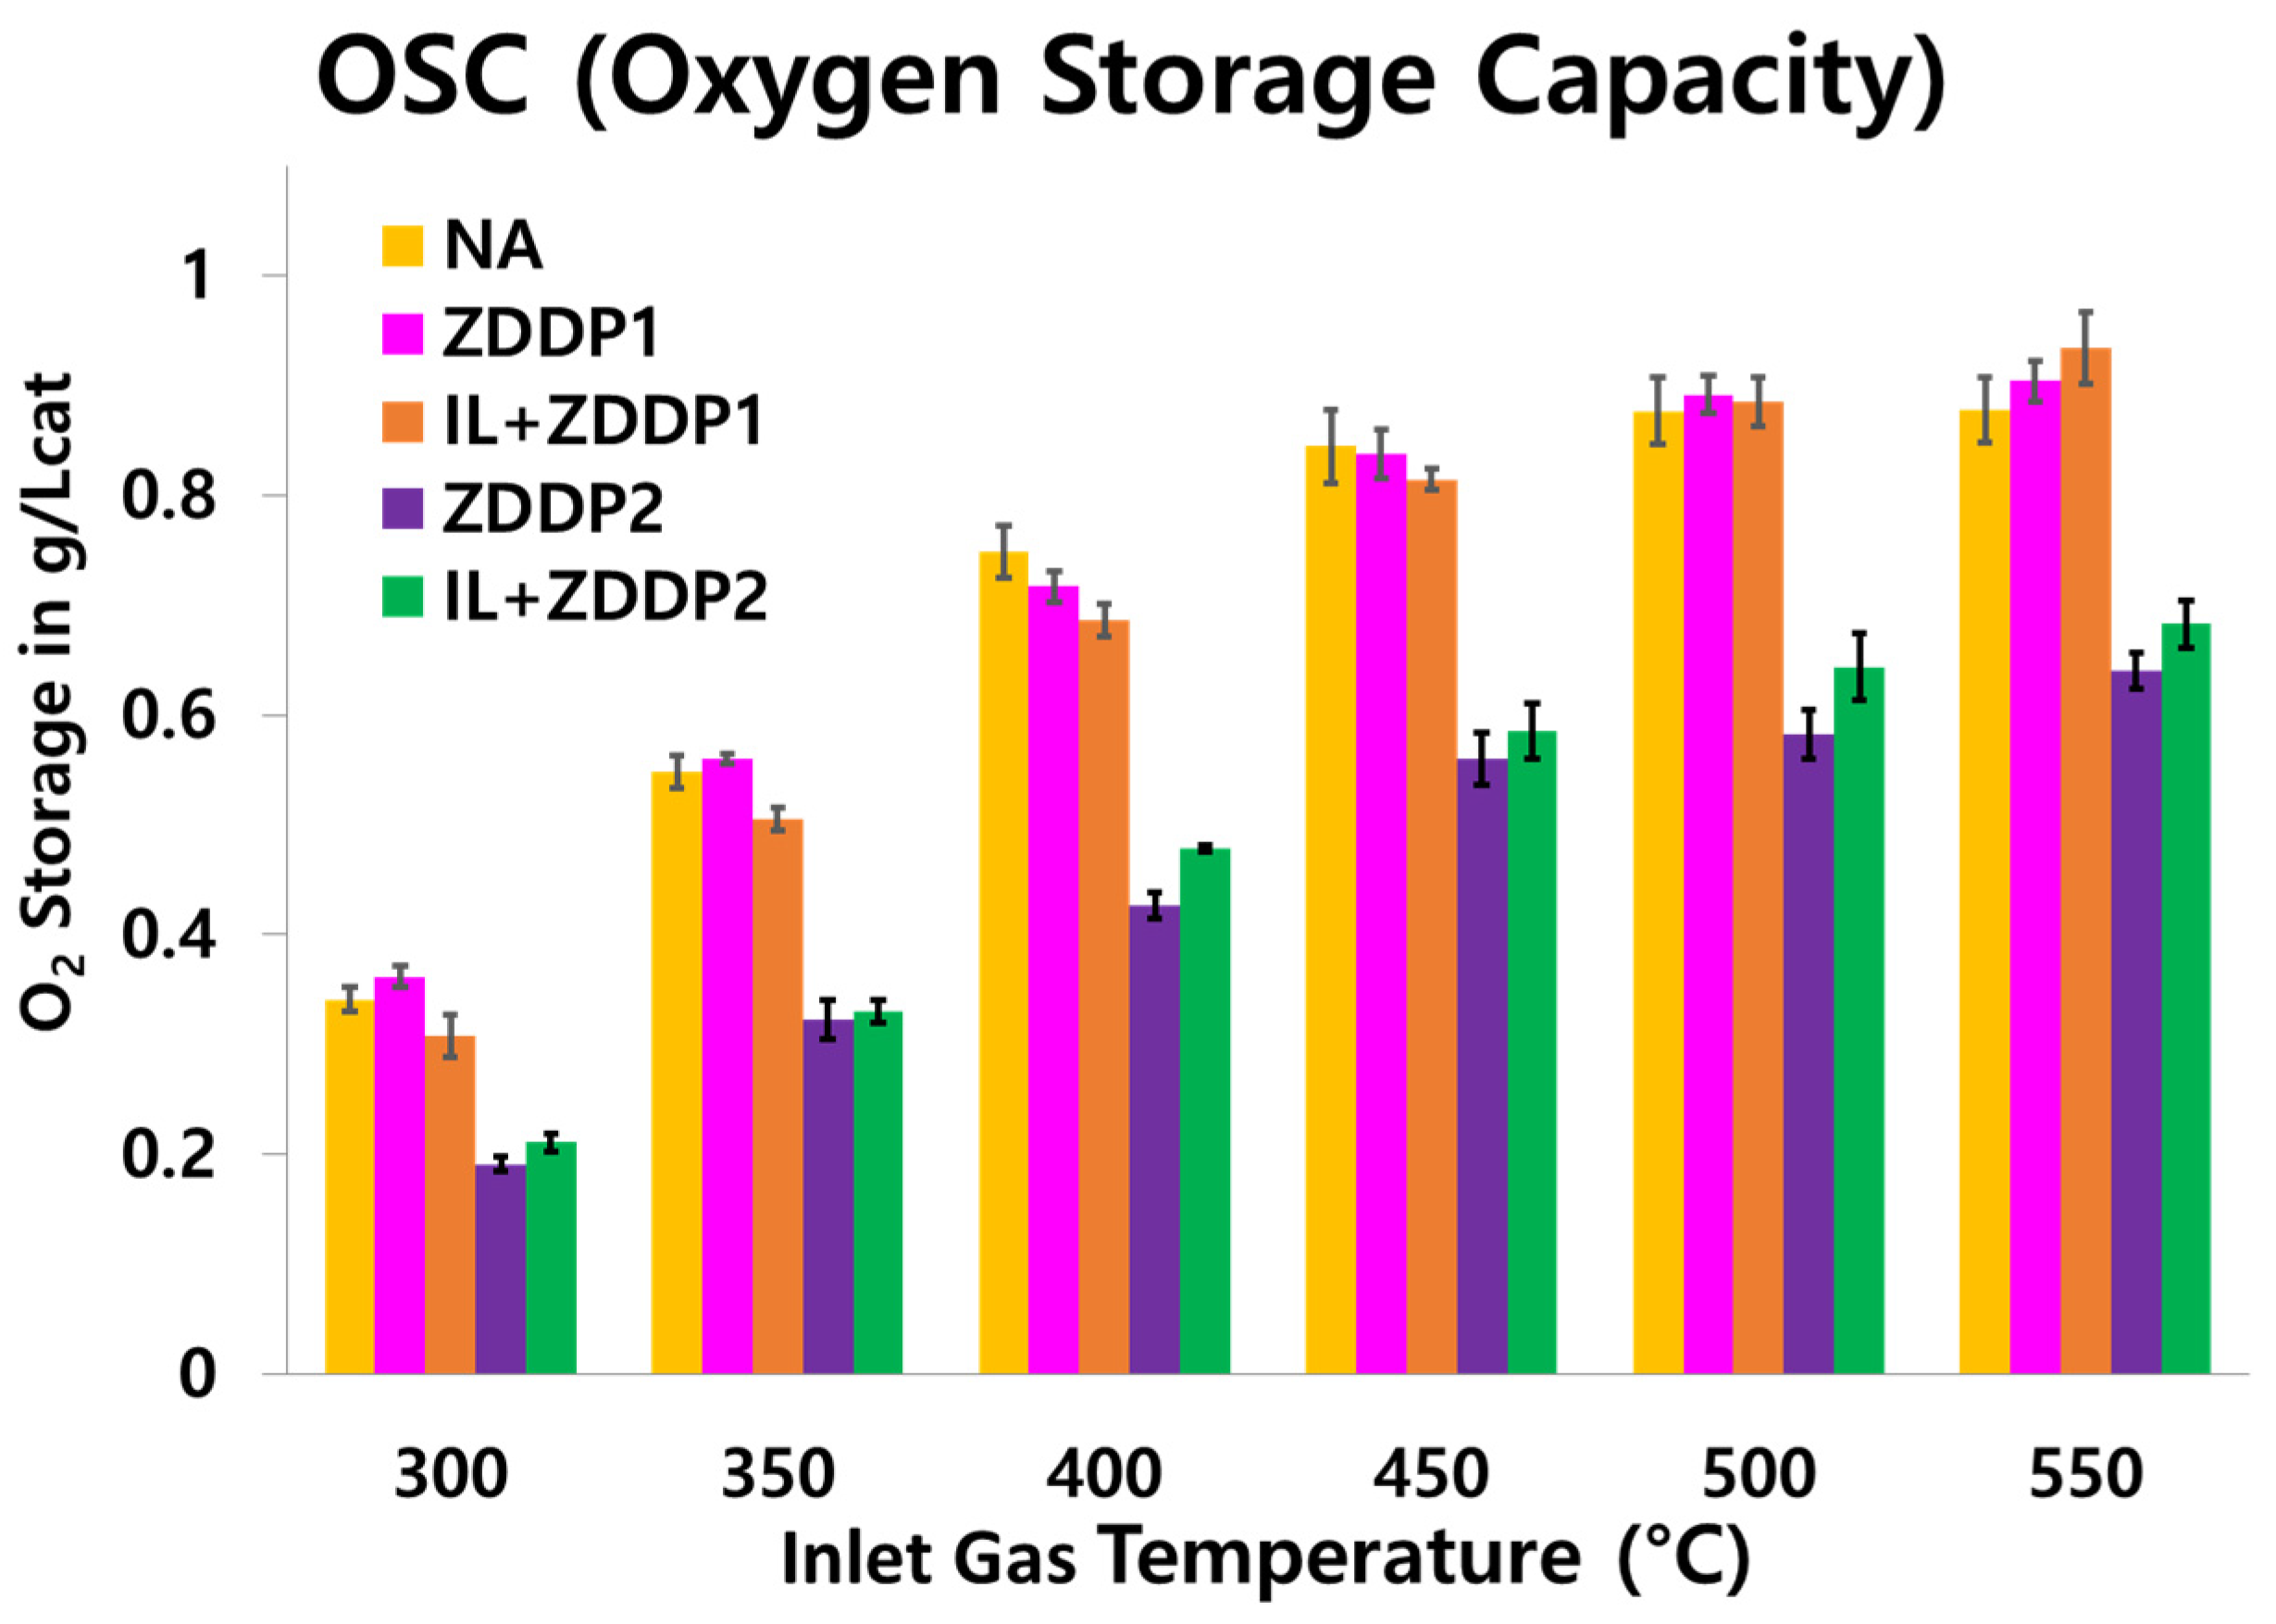
The oxygen storage capacity (OSC) experiment is also performed to investigate the effect of lubricant additives on CeO
2, the oxygen storage material, in a temperature range between 300 and 550 °C at 50 °C increments.
Figure 4 shows the OSC for NA-, ZDDP1-, ZDDP2-, IL+ZDDP1-, and IL+ZDDP2-aged TWC samples. The OSC performance of the ZDDP2- and IL+ZDDP2-aged TWC samples is more degraded than that of ZDDP1- and IL+ZDDP1-aged TWC samples due to the higher content of P, Zn, and S in ZDDP2 than ZDDP1. On the other hand, the OSC performance of the ZDDP1-aged TWC sample is comparable to the NA-aged TWC sample at all temperatures investigated in the present study. This result is the most surprising, despite the fact that the ZDDP1-aged TWC sample was exposed to more P, Zn, and S poisoning than the NA-aged TWC sample during the accelerated engine aging. The reasons for such similarity in the OSC performance of ZDDP1 and NA-aged TWC samples can be explained by the results of surface characterization studies such as XRD, EPMA, BET, and ICP-OES. As in the case of T
50 and T
90, the OSC performance of the mixed lubricant additives (IL+ZDDP1 and IL+ZDDP2) is similar to that of the single ZDDP lubricant additives (ZDDP1 and ZDDP2).
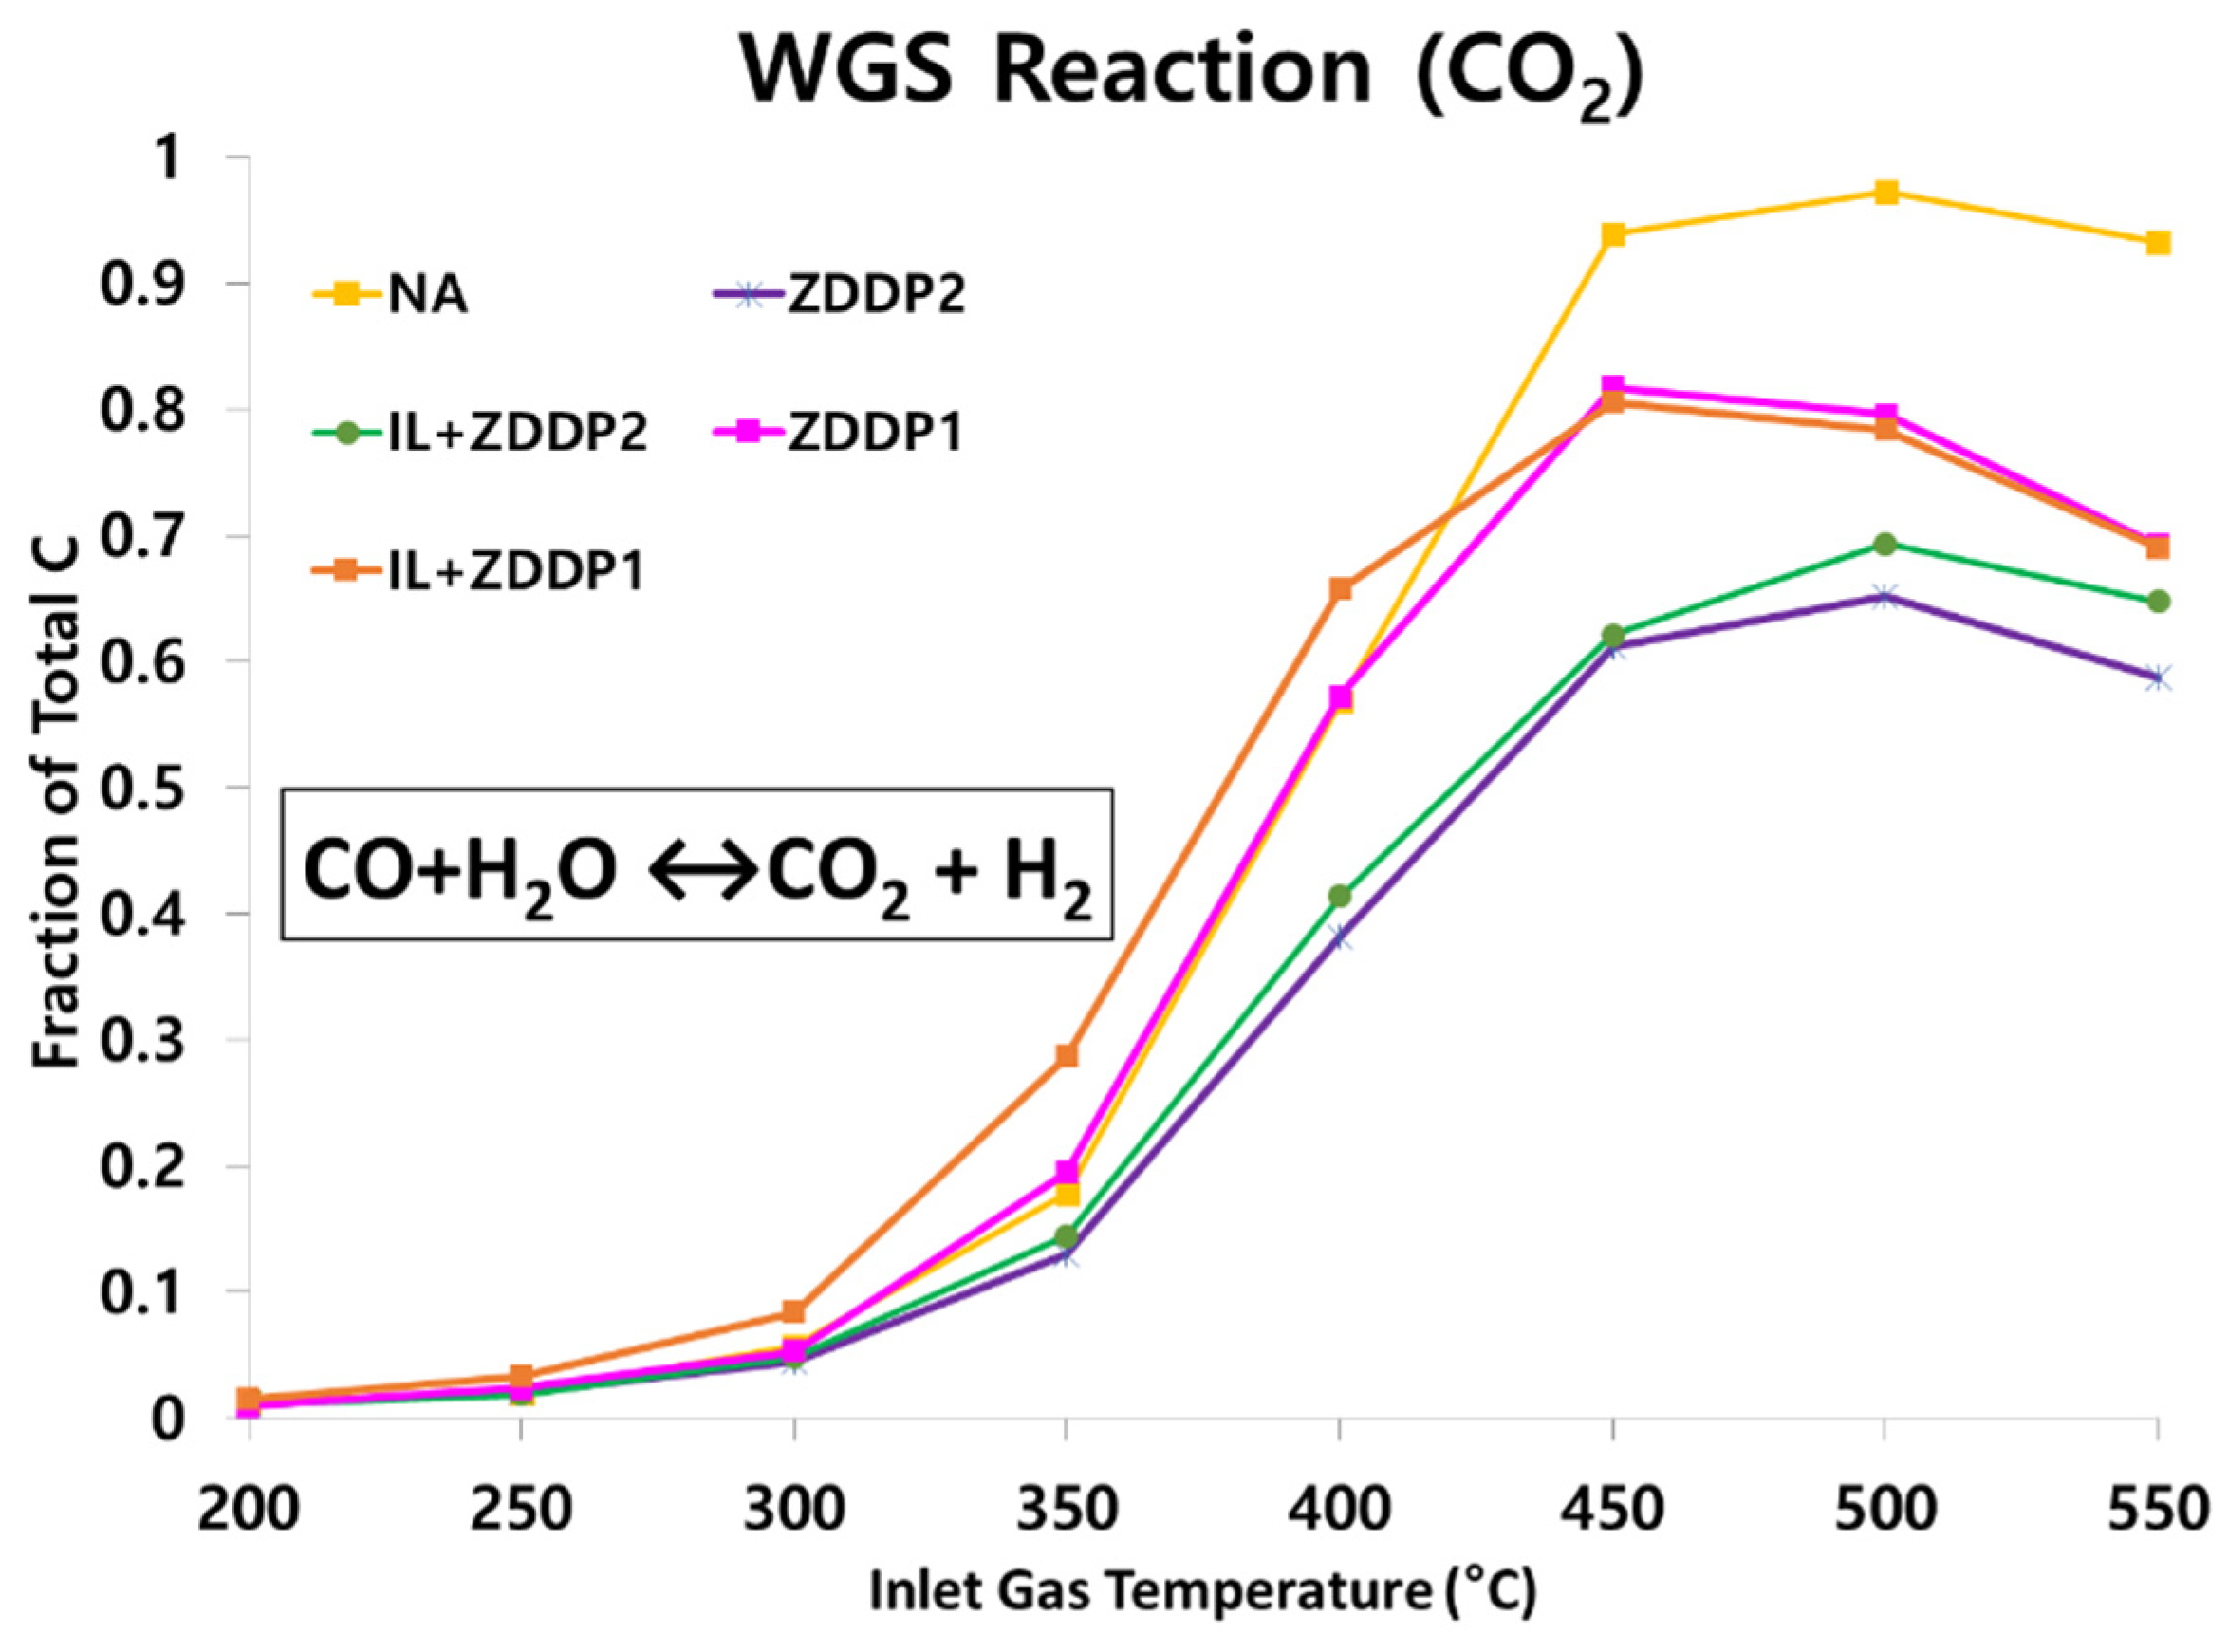
The water–gas shift (WGS) reaction, which is one of the important reactions in TWCs under fuel-rich condition, is performed to investigate the impact of lubricant additives on the performance of TWC at inlet gas temperatures between 200 and 550 °C at a 50 °C increment. The concentration of CO
2 produced from the WGS reaction as a function of temperature for NA-, ZDDP1-, ZDDP2-, IL+ZDDP1-, and IL+ZDDP2-aged TWC samples is shown in
Figure 5. The WGS reaction results indicate that the reduction in the WGS reaction for all TWC samples exposed to lubricant additives, i.e., ZDDP1, ZDDP2, IL+ZDDP1, and IL+ZDDP2, is greater than the NA-aged TWC sample, indicating that in addition to thermal aging, P, S, and Zn poisoning from lubricant additives is also significant. As expected, the WGS reaction for the ZDDP2- and IL+ZDDP2-aged TWC samples is significantly more degraded than that for ZDDP1- and IL+ZDDP1-aged TWC samples at all temperatures investigated in the present study. Again, the main difference between ZDDP1 and ZDDP2 lubricant additives is that the ZDDP2 additive not only contains more P, S, and Zn, but also has different P volatility [
21,
22]. According to a previous study by Wang et al. [
21], secondary ZDDP exhibited higher P retention (~96%) than mixed primary and secondary ZDDPs (~88%) because of different P volatility. Thus, it can be inferred from Wang’s study that during the accelerated engine aging, more P is retained on the TWC due to the higher P volatility of ZDDP1 lubricant additive than the lower-P volatility ZDDP2 lubricant; this inference is later confirmed in ICP-OES results from the present study. As in the case of OSC performance, the impact on the WGS reaction of the TWC of the mixed lubricant additives is similar to that of single ZDDP lubricant additives.
2.2. Catalyst Characterization
To investigate the effect of lubricant additives on TWC, the N
2 physisorption is performed on washcoat powder of all engine-aged TWC samples, from which the Brunauer–Emmett–Teller (BET) surface area, pore-volume, and pore size distribution are obtained.
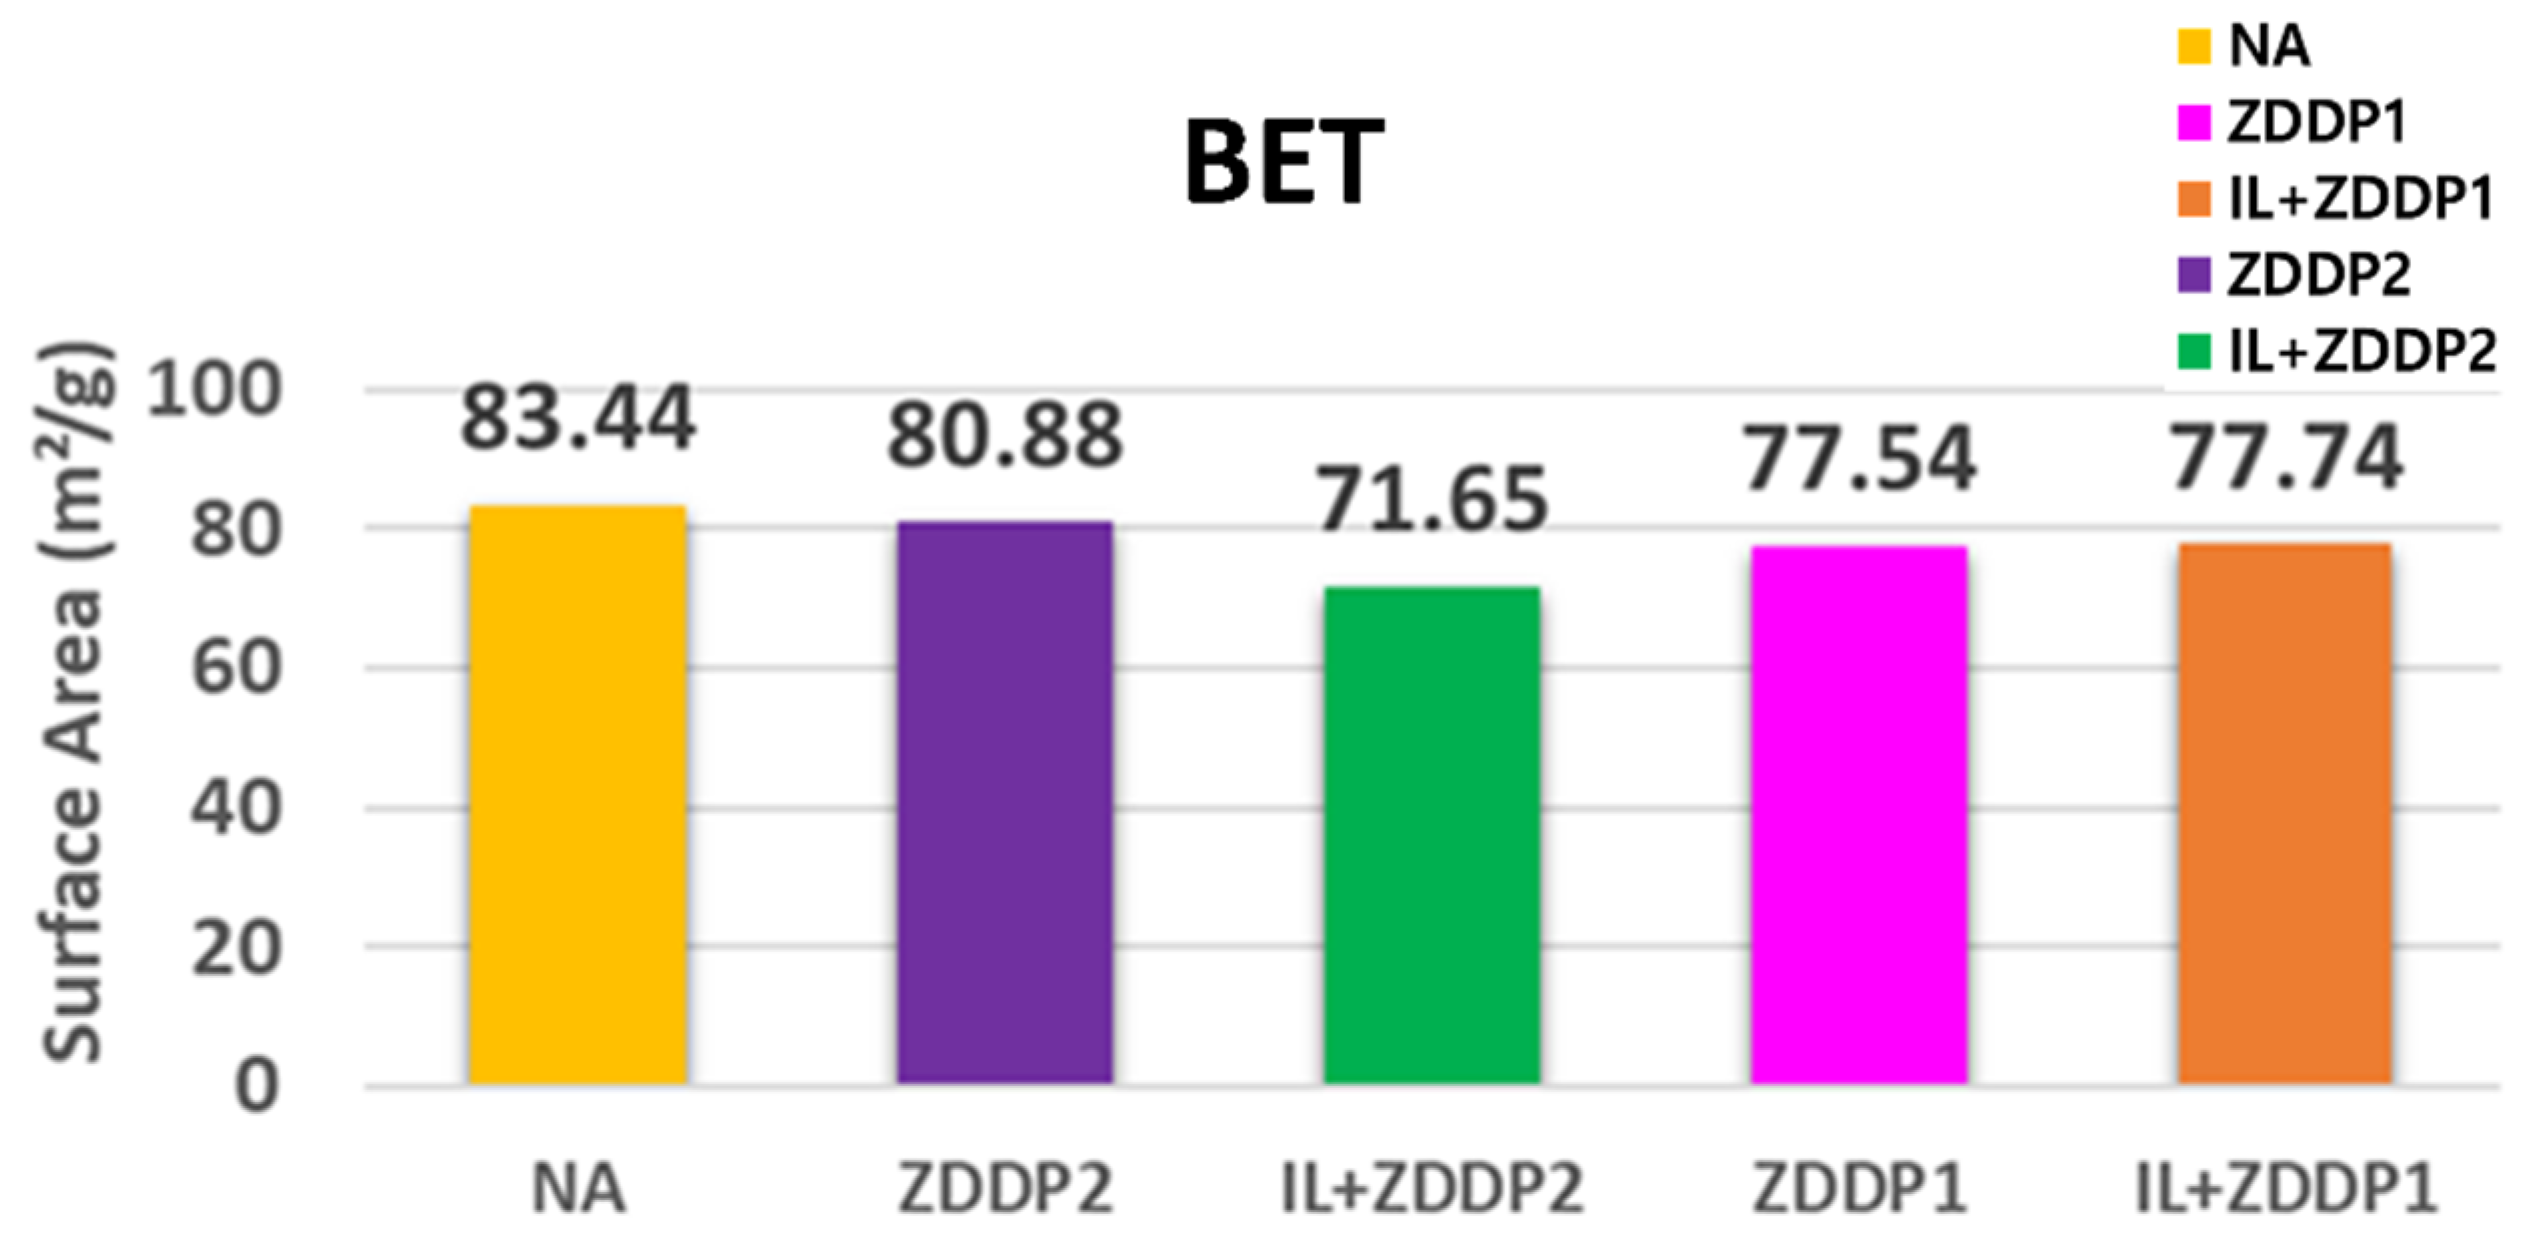
Figure 6 shows the BET surface area in m
2/g of NA-, ZDDP1-, ZDDP2-, IL+ZDDP1-, and IL+ZDDP2-aged TWC samples. In the previous study [
19], the BET surface area of the NA-aged TWC sample is reduced by about 16% compared with the fresh TWC sample, mainly due to thermal aging. All TWC samples exposed to lubricant additives (ZDDP1, ZDDP2, IL+ZDDP1, and IL+ZDDP2) have a lower BET surface area than the NA-aged TWC sample, with the IL+ZDDP2-aged TWC sample having the smallest surface area of 71.6 m
2/g. The BET surface area of the IL+ZDDP2-aged TWC sample is approximately 11.4% lower than that of the ZDDP2-aged TWC sample. This is possibly due to the presence of more cordierite in that sample, which has a much lower BET surface area than that of γ-Al
2O
3 washcoat (100~200 m
2/g). On the other hand, the BET surface area of the ZDDP1- and IL+ZDDP1-aged TWC samples is similar to (77.54 vs. 77.74 m
2/g), but still 7% lower than the NA-aged sample. Even though the effect of loss of the BET surface due to the poisoning of the lubricant additives alone is not significant, varying between 3 and 11.4%, this loss would result in a lower dispersion of the Pd particles, which in turn affects the reactivity of the reactions occurring on the Pd active sites. Thus, the performance of TWC exposed to lubricant additives would be adversely impacted, as seen in the BFR experiment results.
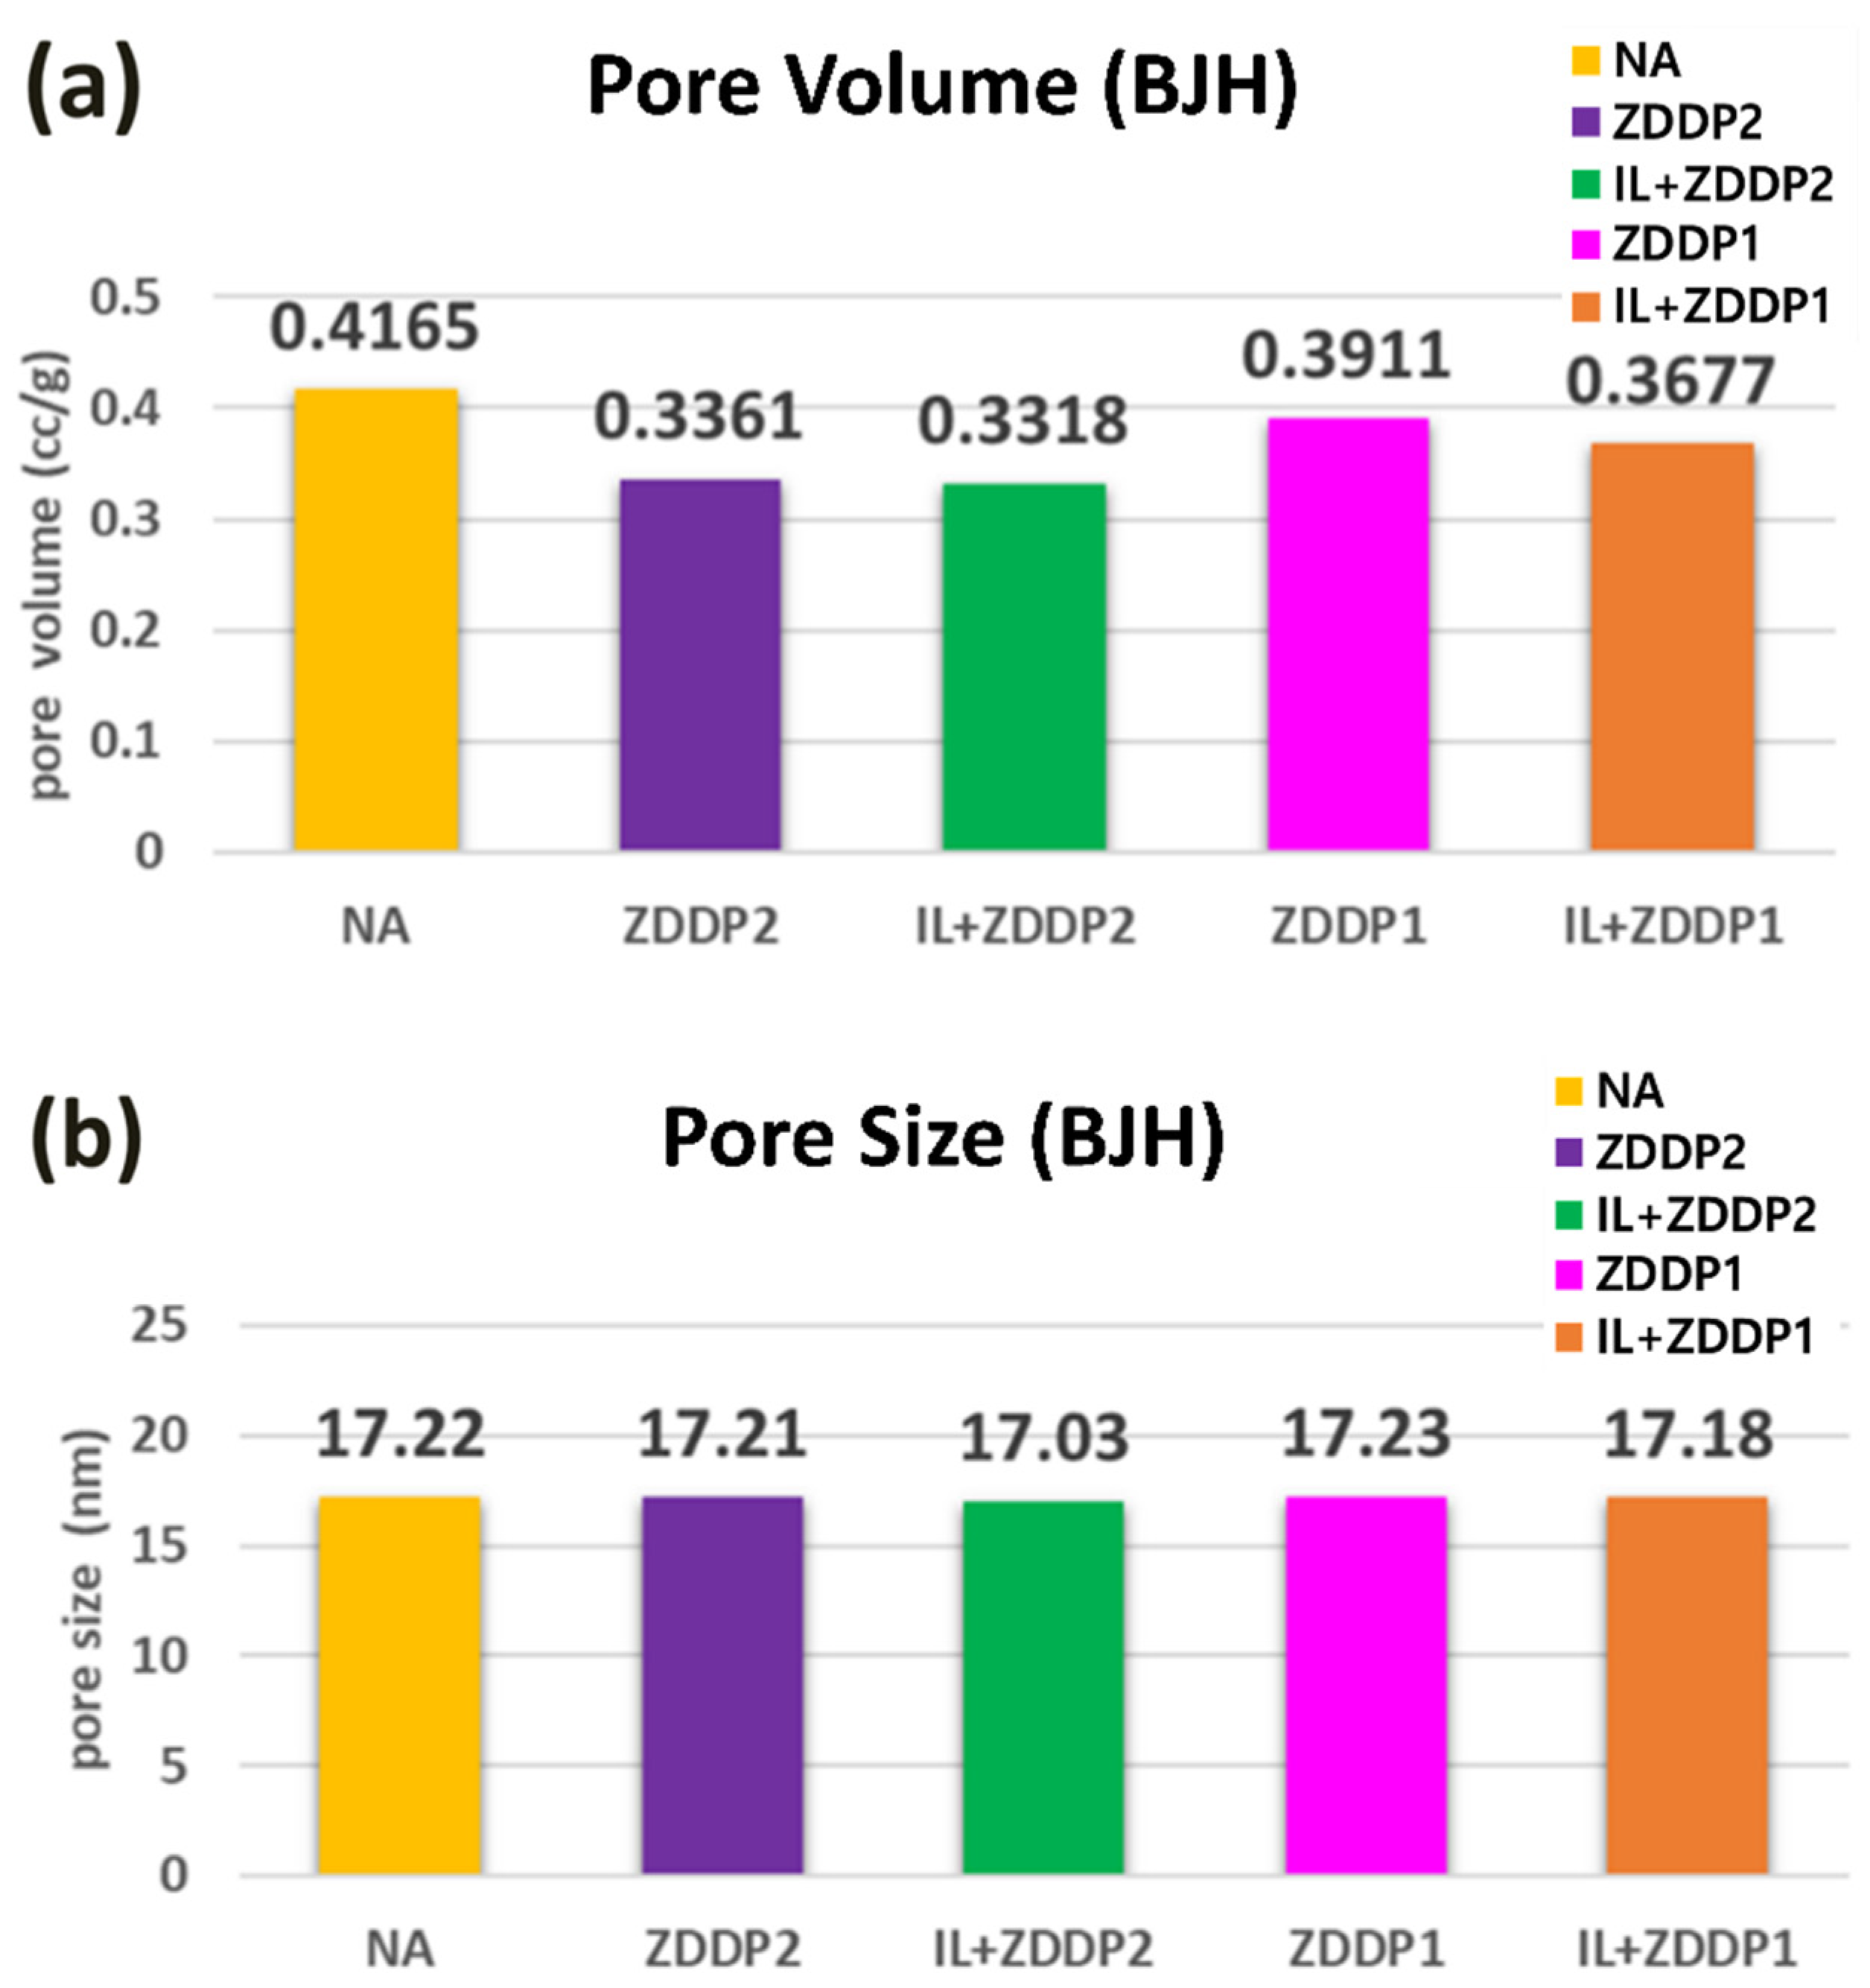
The Barrett, Joyner, and Halenda (BJH) pore volumes and pore sizes of NA-, ZDDP1-, ZDDP2-, IL+ZDDP1-, and IL+ZDDP2-aged TWC samples are shown in
Figure 7a,b, respectively. With regard to the pore volume shown in
Figure 7a, the pore volume of all the TWC samples exposed to the lubricant additives is reduced compared with the NA-aged TWC sample. The ZDDP2- and IL+ZDDP2-aged TWC samples have the highest pore volume reduction of 20%, while ZDDP1- and IL+ZDDP1-aged TWC samples experience a lower reduction in pore volume (6.5%). In contrast to the pore volume, the pore size of all engine-aged TWC samples is relatively similar, as shown in
Figure 7b. Such results indicate that P compounds accumulate in the pores without blocking the pores, thereby decreasing the pore volume but not leading to a decrease in pore size. This is in agreement with the results obtained by Väliheikki et al. [
23], who investigated the effects of P on Pt/Pd-based diesel oxidation catalysts (DOCs) consisting of a γ-Al
2O
3 support with Ce-Zr mixed oxides.
The weight percentage of P and Zn in the washcoat of the TWC samples is determined using ICP-OES analysis and is given in
Figure 8a,b for NA-, ZDDP1-, ZDDP2-, IL+ZDDP1-, and IL+ZDDP2-aged TWC samples. As seen in
Figure 8a, the presence of P of 0.3% by weight detected in the NA-aged TWC sample is solely due to the P originally from the ZDDP additive in the Genset engine lubricant, since no lubricant additives are added to the fuel for the accelerated thermal aging. Although the amount of lubricant additives added to the fuel is calculated based on the same amount of P exposed to the catalyst during accelerated engine aging, the amount of P detected in ZDDP2- and IL+ZDDP2-aged TWC samples is at least double the amount of P found in the ZDDP1- and IL+ZDDP1-aged TWC samples (see
Figure 8a). Interestingly, the amount of P detected either in ZDDP- and IL+ZDDP-aged TWC samples, i.e., ZDDP1 vs. IL+ZDDP1 and ZDDP2 vs. IL+ZDDP2, are similar. It is apparent that the amount of P accumulated on the TWC is more affected by the type of ZDDP than IL, due to the difference in the phosphorus volatility of ZDDP1 and ZDDP2 [
20,
21]. As explained earlier, because the P volatility of the ZDDP2 lubricant additive is lower than that of the ZDDP1 lubricant, more P is retained in the TWC, which is confirmed in the ICP results. On the other hand, as seen in
Figure 8b, more Zn is detected in the ZDDP1- and IL+ZDDP1-aged TWC samples than the ZDDP2- and IL+ZDDP2-aged TWC samples. The variation in the amount of Zn detected in the TWC samples exposed to the lubricant additives is mainly due to the detection limit of the ICP instrument and should not be interpreted as an indication of strong differences across the samples. Regardless of the resolution of the instrument, the results from the ICP clearly indicate a low-level presence of Zn in these samples.
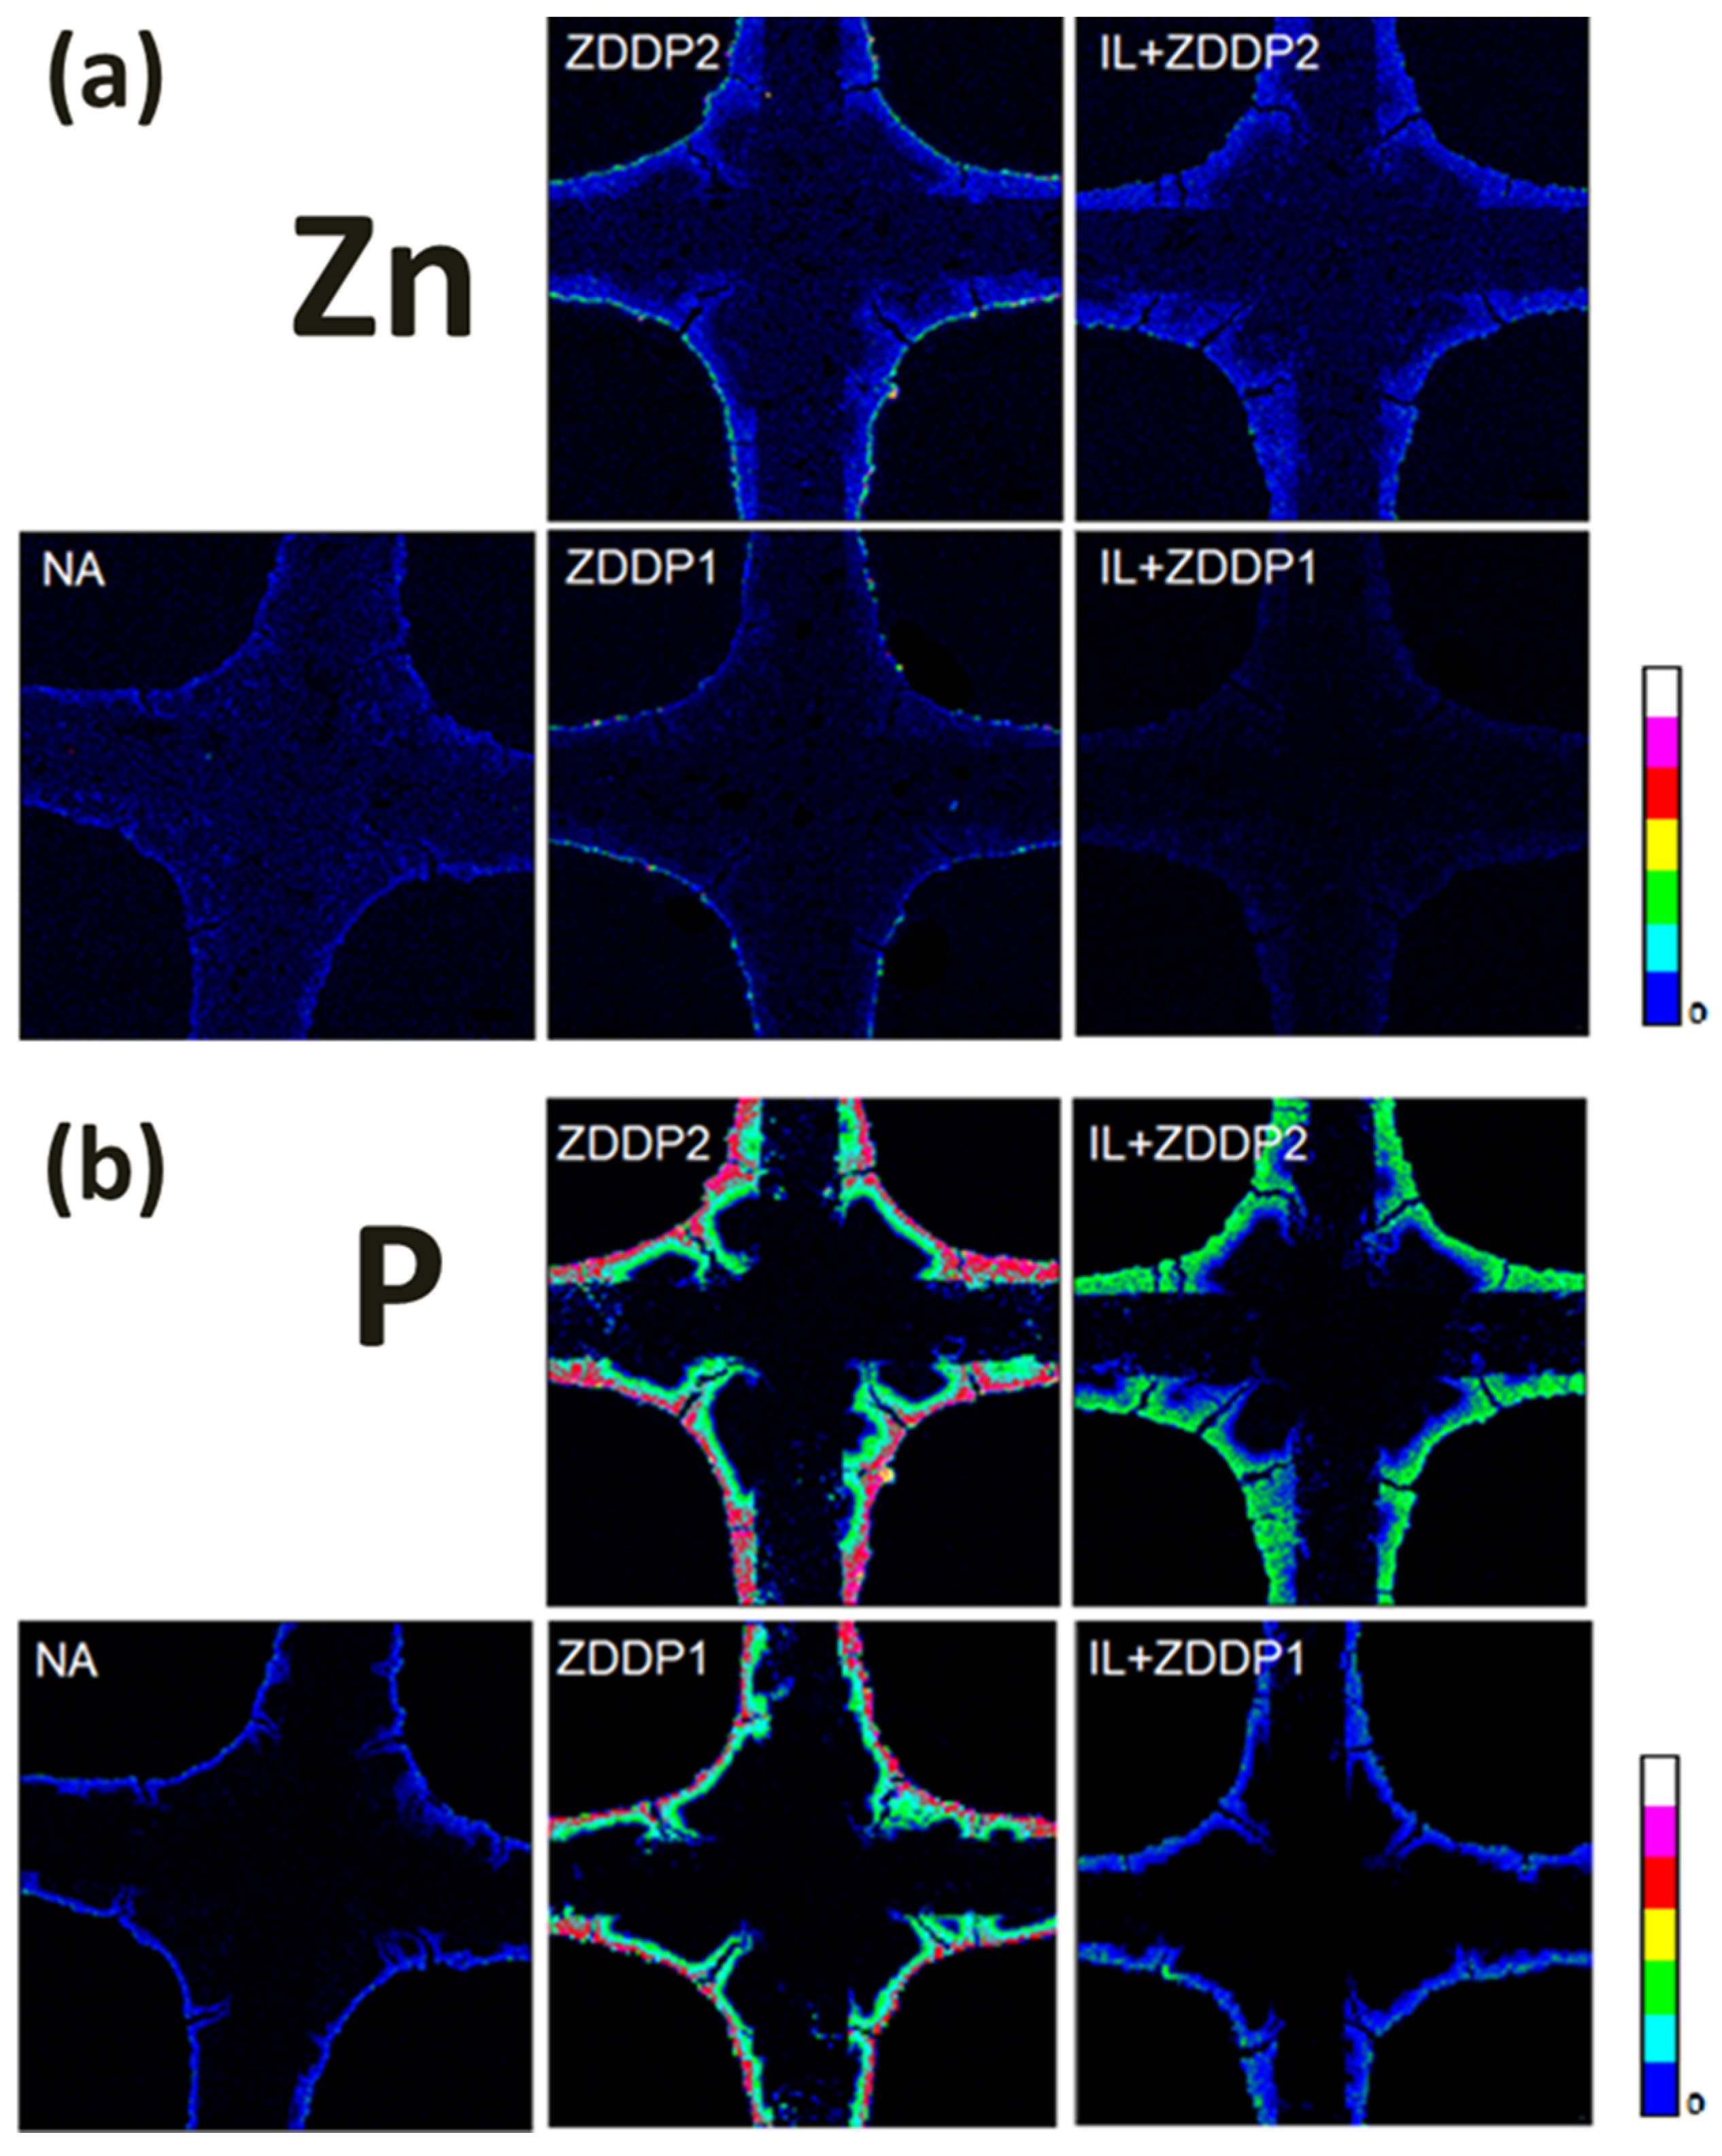
Figure 9a shows EPMA elemental maps of Zn for NA-, ZDDP1-, ZDDP2-, IL+ZDDP1-, and IL+ZDDP2-aged TWC samples. As seen in
Figure 9a, a thin Zn layer is observed on the surface for ZDDP1- and ZDDP2-aged TWC samples, whereas only a trace amount of Zn is found on the washcoat surface of the IL+ZDDP1- and IL+ZDDP2-aged TWC samples. Since IL lubricant additive does not contain Zn, the concentration of Zn in the mixed additives of IL and ZDDP (IL+ZDDP1 and IL+ZDDP2) is lower than that in the ZDDP-only lubricant additive (ZDDP1 and ZDDP2), thus reducing the amount of Zn exposed. In addition, the Zn concentration in ZDDP2 is higher than that in ZDDP1, and more importantly, the ZDDP2-aged TWC sample shows a more contiguous Zn layer on the washcoat surface than the ZDDP1-aged TWC sample, where the layer is more incongruous. Furthermore, no evidence of penetration of Zn deep inside the washcoat is observed for all accelerated engine-aged TWC samples. On the other hand, the presence of Zn in the mixed IL and additives is much lower, and especially for IL+ZDDP1, it is barely visible. The results obtained from EPMA micrographs for Zn are in contrast to those obtained from ICP-OES analysis, in which the amount of Zn found in ZDDP1- and IL+ZDDP1-aged TWC samples is higher than in ZDDP2- and IL+ZDDP2-aged TWC samples. The discrepancy between the two results, as explained previously, is due to the limit of Zn detection of less than 0.08 wt% of the ICP-OES instrument.
Figure 9b shows EPMA micrographs of P in the washcoat of NA-, ZDDP1-, ZDDP2-, IL+ZDDP1- and IL+ZDDP2-aged TWC samples. With the exception of the IL+ZDDP1-aged TWC sample, the TWCs exposed to the lubricant additives (ZDDP1, ZDDP2, and IL+ZDDP2) show a much higher level of P than the NA-aged TWC. The EPMA micrographs of P for TWCs exposed to ZDDP1 and ZDDP2 lubricant additives show an overlayer of P on the washcoat surface and the penetration of P deep inside the washcoat is much more significant than Zn. The P overlayer for the ZDDP2-aged TWC sample is more contiguous and contains more P, as reflected by the red color code, than the P overlayer of the ZDDP1-aged TWC sample. On the other hand, as in the case of P EPMA micrographs, the presence of P in the overlayer for the mixed IL and ZDDP additives is much lower, and in particular the IL+ZDDP1-aged TWC sample is indiscernible and similar to that of the NA-aged TWC sample. The results obtained from EPMA are in contrast to the ICP-OES results, in which the concentration of P is highest (1.74 wt%) in the IL+ZDDP2-aged TWC sample and similar in ZDDP1 and IL+ZDDP1-aged TWC samples (≈0.74 wt%). Regardless, the EMPA results clearly show that the presence of P on the catalyst surface and the penetration of P deep into the washcoat are the most dominant deactivation mechanisms that likely cause the reduction in TWC performance.
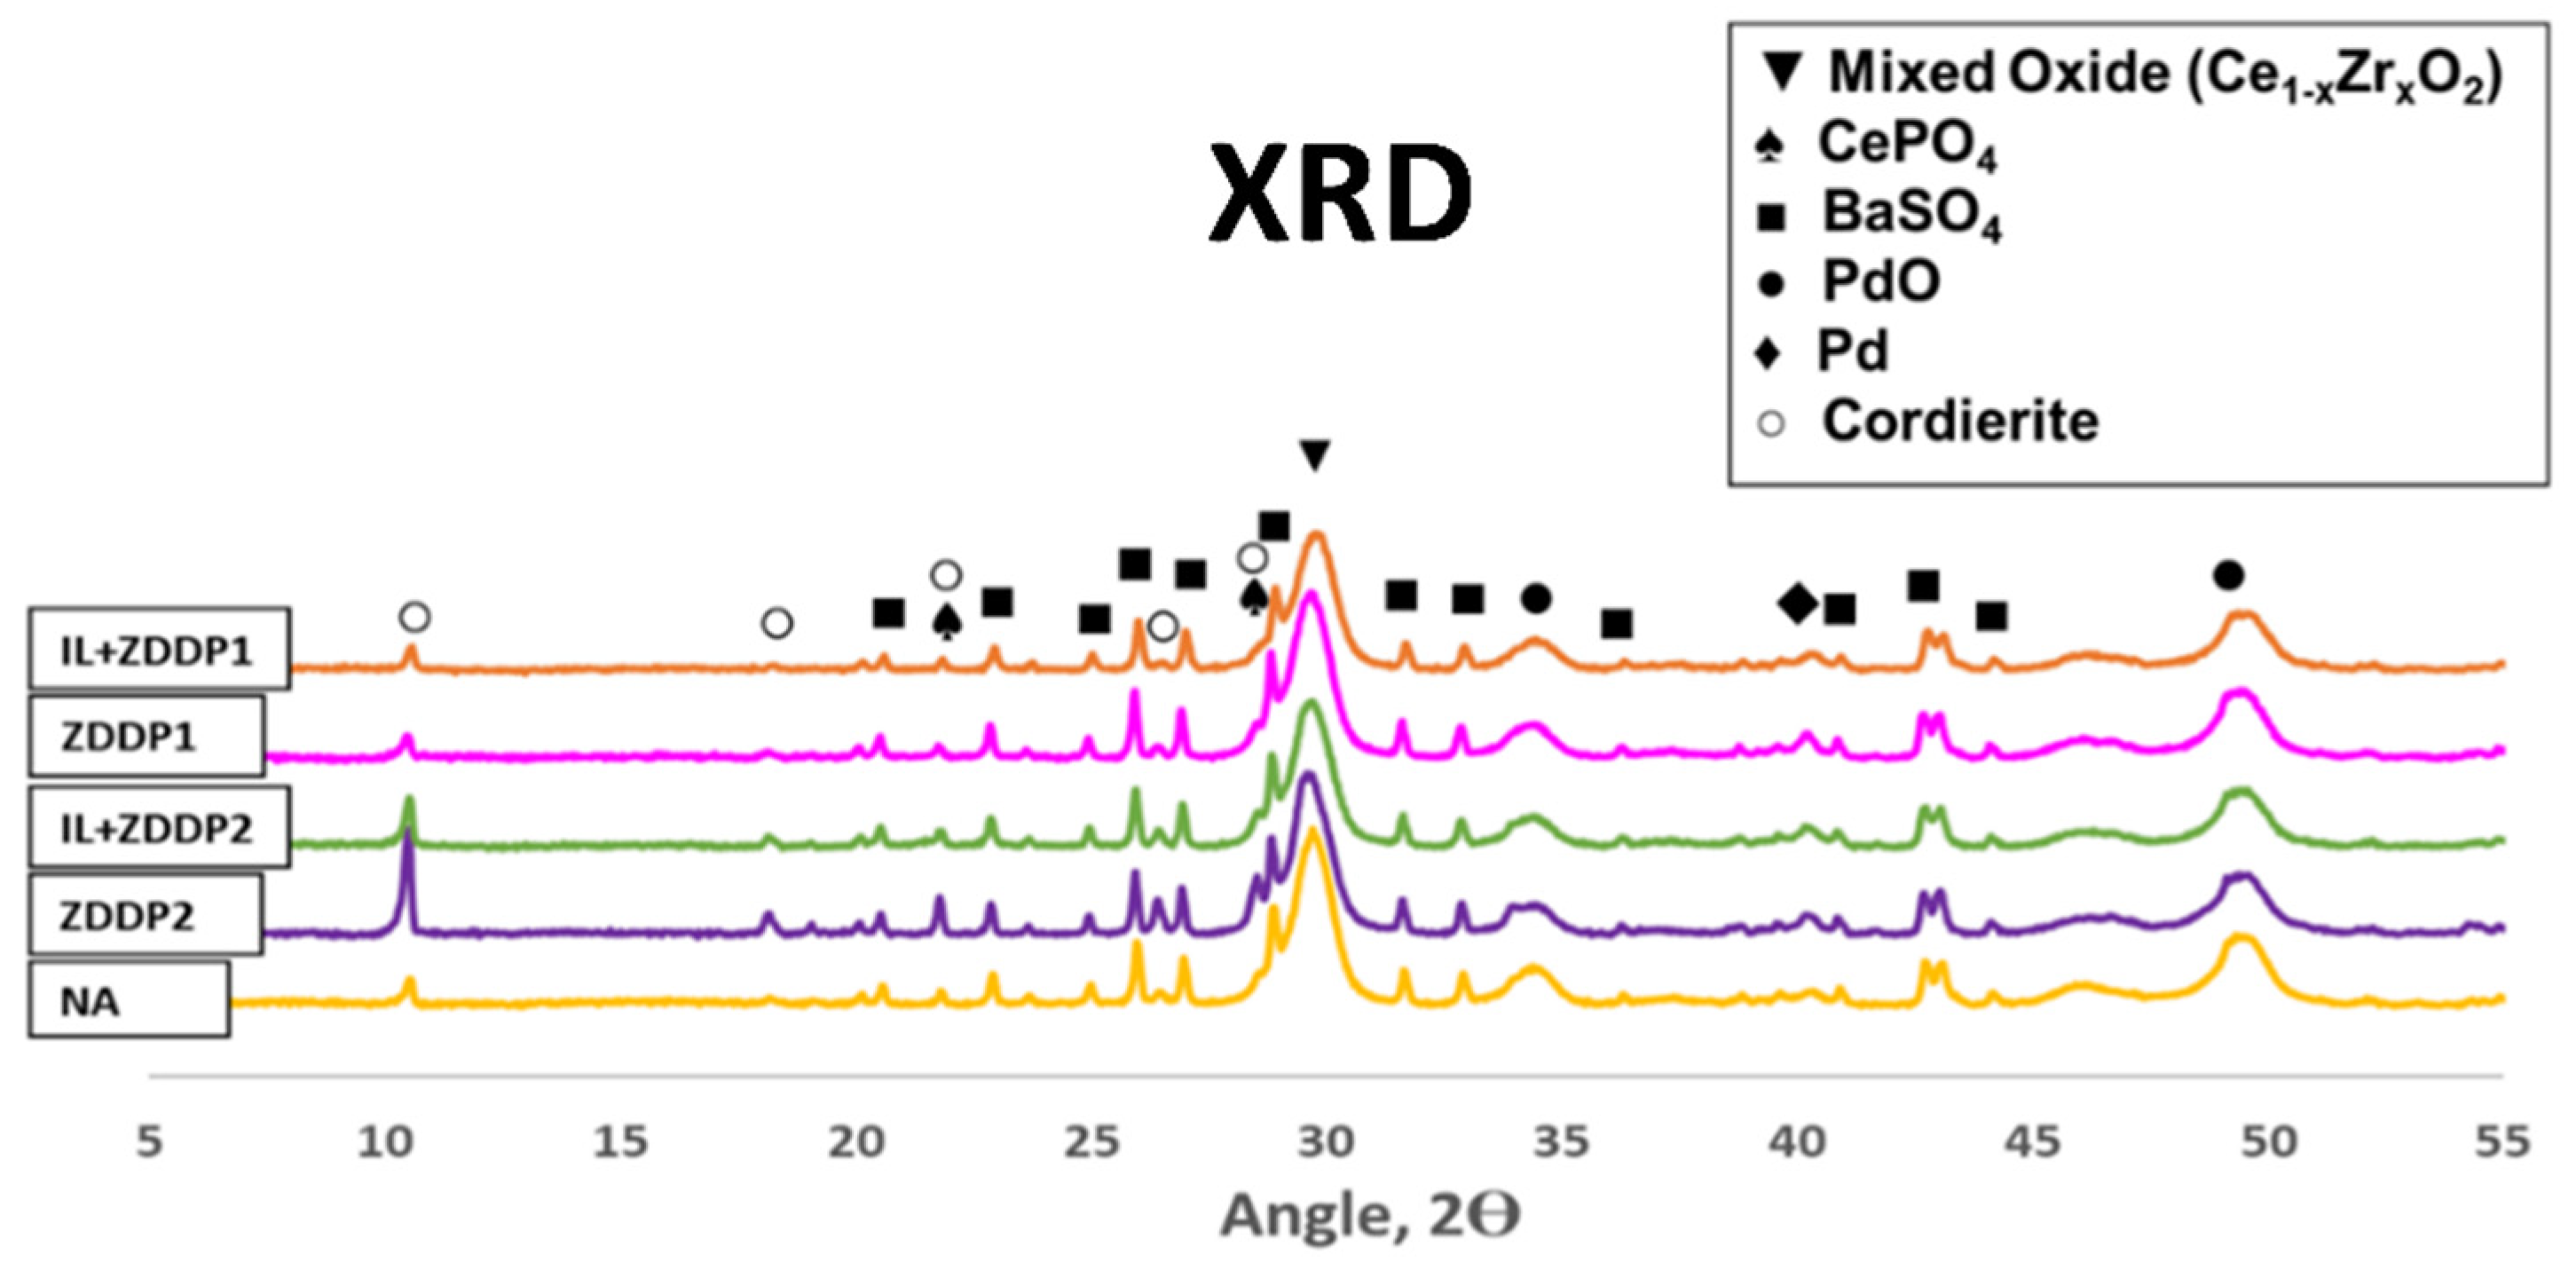
The XRD patterns of the NA-, ZDDP1, ZDDP2-, IL+ZDDP1- and IL+ZDDP2-aged TWC samples are presented in
Figure 10. The peaks denoted by (▼), (♠), (◆), and (●) are assigned to Ce
1-xZr
xO
2, BaSO
4, Pd, and PdO, respectively. For the NA-aged TWC sample, due to interferences from the peaks of cordierite, much smaller CePO
4 peaks are detected at 2θ = 21.7, 26.4, and 28.5°. Despite considerable effort, it is still impossible to completely remove the cordierite substrate from the washcoat, and thus all TWC samples did contain a small amount of cordierite. The peaks for cordierite are denoted by (○). The intensity of CePO
4 peaks (♠) at 2θ = 21.7 and 28.5° for the ZDDP2-aged TWC sample is stronger than that for the ZDDP1-, IL+ZDDP1-, and IL+ZDDP2-aged TWC samples. The results of EPMA show that the ZDDP2-aged TWC sample has the highest P on the washcoat, which is similar to the result of the XRD patterns. Peaks for AlPO
4 are not observed in the XRD patterns for all TWC samples in the present study. According to previous studies [
10,
22], the AlPO
4 peaks were only detected by nuclear magnetic resonance (NMR), but not by XRD due to the amorphous nature of AlPO
4, which is in agreement with the XRD results of this study. Furthermore, to minimize contamination from cordierite, only the washcoat is used for XRD analysis, thus no peaks for AlPO
4 may be discernible in the XRD patterns. Although Zn is a major component of ZDDP1 and ZDDP2 lubricant additives, no peaks associated with Zn, such as Zn
2P
2O
4, are observed in the XRD patterns of all TWC samples exposed to lubricant additives in the present study, which is in contrast to previous studies in which Zn
2P
2O
4 was observed [
3,
10]. The intensity of the Pd peak at 2θ = 39.6° for TWC samples exposed to lubricant additives appears to be stronger than that for the NA-aged TWC sample, indicating the additional impact of additives on the sintering of Pd particles, which is in agreement with the XRD results obtained by Xie et al. [
10].


