Article

Characterization of an Immobilized Amino Acid Racemase for Potential Application in Enantioselective Chromatographic Resolution Processes

by
Isabel Harriehausen
1,*,
Jonas Bollmann
1,
Thiane Carneiro
1,
Katja Bettenbrock
1 and
Andreas Seidel-Morgenstern
1,2,*
1
Department of Physical and Chemical Foundations of Process Engineering, Max Planck Institute for Dynamics of Complex Technical Systems, Sandtorstraße 1, 39106 Magdeburg, Germany
2
Institute of Chemical Engineering, Otto von Guericke University, 39106 Magdeburg, Germany
*
Authors to whom correspondence should be addressed.
Catalysts 2021, 11(6), 726; https://doi.org/10.3390/catal11060726
Submission received: 19 May 2021 / Revised: 5 June 2021 / Accepted: 6 June 2021 / Published: 11 June 2021
(This article belongs to the Special Issue Enzyme Immobilization and Biocatalysis)

Abstract

:
Enantioselective resolution processes can be improved by integration of racemization. Applying environmentally friendly enzymatic racemization under mild conditions is in particular attractive. Owing to the variety of enzymes and the progress in enzyme engineering, suitable racemases can be found for many chiral systems. An amino acid racemase (AAR) from P. putida KT2440 is capable of processing a broad spectrum of amino acids at fast conversion rates. The focus of this study is the evaluation of the potential of integrating AAR immobilized on Purolite ECR 8309 to racemize L- or D-methionine (Met) within an enantioselective chromatographic resolution process. Racemization rates were studied for different temperatures, pH values, and fractions of organic co-solvents. The long-term stability of the immobilized enzyme at operating and storage conditions was found to be excellent and recyclability using water with up to 5 vol% ethanol at 20 °C could be demonstrated. Packed as an enzymatic fixed bed reactor, the immobilized AAR can be coupled with different resolution processes; for instance, with chromatography or with preferential crystallization. The performance of coupling it with enantioselective chromatography is estimated quantitatively, exploiting parametrized sub-models. To indicate the large potential of the AAR, racemization rates are finally given for lysine, arginine, serine, glutamine, and asparagine.

1. Introduction

Enantiomers have identical physicochemical properties, but interact differently in living organisms owing to their distinctive spatial arrangement. Their specificity requires the food and pharmaceutical industries to focus on the production of pure chiral drugs [1]. One approach is the production of a racemic mixture, followed by a resolution step that can be, for instance, chiral chromatography or crystallization [2,3,4]. To avoid the loss of 50% of the initial material, recycling of the by-product enantiomer (distomer or counter enantiomer) by racemization can be integrated into the process (Figure 1) [5,6,7,8]. Such coupled processes have the potential to reduce waste while increasing the process productivity and yield.
For some compounds, racemization can be achieved by changes in pH or temperature or by the use of chemo-catalysts. However, this often results in substance degradation or requires the use of toxic compounds, which are unfavorable for pharmaceutical applications. An alternative is the use of enzymes as biocatalysts, which perform under mild reaction conditions [9,10,11,12] and can be separated from the product by membrane filtration or by the use of immobilized enzymes [13]. In the past decades, a variety of immobilization protocols have been developed for several carriers [14,15,16]. Because of this variety, which is still growing, a matching carrier can be identified for many enzymes. When selecting the right carrier, not only the recyclability is provided, but also often the enzymes stability improves without significantly inhibiting catalytic activity. These advantages compensate the enzymes’ relatively high production costs and make them attractive for industrial applications [17].
In this work, the applicability of the amino acid racemase (AAR) (EC 5.1.1.10) from Pseudomonas putida KT2440 [18,19], which uses pyridoxalphosphat (PLP) as a cofactor, is evaluated in free form and immobilized on the carrier Purolite ECR 8309F. The wide substrate specificity of this enzyme makes it particularly valuable, because the availability of racemases fulfilling the requirements for the process shown in Figure 1 is currently still limited. The performance of the free racemase has already been studied with regard to pH in a phosphate buffer and in the presence of alcohols [18,20]. The investigation of immobilization conditions for the valuable AAR was reported in our previous work [21]. High enzymatic activity and effective recyclability were achieved with the immobilized preparation on Lifetech™ ECR8309 (Purolite, South Wales, UK). The carrier is a methacrylate polymer, functionalized with amino groups on an ethylene spacer. It is pre-activated with glutaraldehyde before forming a strong linkage with the AAR. The covalent immobilization occurs by the formation of a Schiff base between the aldehyde and the amino groups of the enzyme. Exploiting this strong binding, the immobilized AAR has already successfully been integrated into a temperature cycling induced deracemization [22].
An essential challenge for a successful integration of separation and reaction is the identification of a solvent suitable for both processes to operate productively [23]. Many chiral stationary phases (CSPs), on which the enantiomers can be separated owing to enantioselective adsorption, operate in a low pH range and require co-solvents that are toxic for the enzymes [2]. Hereby, the eluent composition influences the specific retention behavior. The ratio of the two adsorption equilibrium constants determines the separation factor, which allows estimating the productivity of the resolution [24]. Astec Chirobiotic T (Sigma–Aldrich, St. Louis, MO, USA) is based on the macrocyclic glycopeptide Teicoplanin. This CSP has been shown to resolve many pairs of enantiomers under conditions that are compatible for enzymatic reactions [25]. Chirobiotic T columns can separate racemic mixtures of enantiomers of numerous chiral molecules, including enantiomers of amino acids, in water-based eluents. Successful applications of macrocyclic glycopeptide based CSP (with unfavorable eluents) were shown for the resolution of the methionine enantiomers using multicolumn simulated moving bed processes [26,27].
In this paper, we describe results of evaluating the potential of the AAR immobilized in an enzymatic fixed bed reactor (EFBR) coupled with enantioselective chromatography. The principle of the process considered is shown in Figure 1.
Racemization kinetics of the conversion of L-Met were studied experimentally and theoretically in dependence of temperature and in different aqueous solvents varying in pH and alcohol concentration. The racemization rates of the methionine enantiomers were compared with the racemization rates of other AAs. Furthermore, the long-time stability of the AAR was tested. Based on estimated kinetic parameters, the productivity of racemization was quantified. The chromatographic resolution of D-/L-Met on a Chirobiotic T column was evaluated experimentally using the same solvents as for racemization. Standard chromatography parameters were estimated to characterize the performance of the separation. Finally, the results obtained during the chromatographic separations and the racemization kinetics were jointly considered, evaluating the performance of the coupled process concept.

2. Theory

In this section, we (a) provide a rate equation that quantifies the racemization kinetics catalyzed by the racemase and considers the aspect of deactivation and (b) present the mass balance of a tubular fixed-bed reactor that contains the immobilized enzyme.

2.1. Kinetics of Racemization

Following established concepts, the kinetics of racemization using the free amino acid racemase can be described by a reversible Michaelis–Menten (MM) approach [28]. Hereby, the substrate–enzyme complex formation and the L- to D-conversion (or opposite) is summarized in one step.
In the case of similar reaction rates for both enantiomers, and thus identical MM coefficients (as assumed below), the model can be simplified:
r 0 = r m a x   ( c L c D ) K M + c L , 0 + c D , 0 = r m a x   ( c L c D ) K M + c t o t
Hereby, cL and cD are the L- and D-enantiomer concentrations and r0 is the initial rate of depleting the excess of the L-enantiomer owing to the racemization reaction in U/mg of enzyme or U/g of wet carrier in the case of immobilized enzymes (1 U = 1 µmol converted substrate per 1 min). The loading of AAR on the carrier, qAAR, is the amount of AAR per amount of carrier onto which it was loaded. The two temperature-dependent MM coefficients are the maximum reaction rates rmax and the Michaelis coefficients KM.
The constant total concentration, ctot = cL,0 + cD,0 = cL + cD, is the sum of both enantiomers.
During process optimization, reaction temperature is an important parameter, which can be exploited to improve performance. The effect of the temperature, T, on the maximum racemization rate, rmax, can be expressed using a classical Arrhenius equation:
r max ( T ) = A   e E A R T
with a pre-exponential factor A, an activation energy EA, and the universal gas constant R. The temperature dependence of the Michaelis coefficient, KM, can be well described empirically with Equation (3) using three parameters A0, A1, and A2:
K M ( T ) = A 0 + A 1 exp ( T A 2 )
When operating catalysts over a longer time (days or weeks), typically, deactivation needs to be taken into account in rate models. For immobilized enzymes, the deactivation can be caused by various factors; for instance, protein denaturation, fouling, poisoning, or breaking of the covalent linkage to the resin [29].
A simple expression capable of describing drops in rates over the time of operation is the following:
r ( t ) = exp ( k D e a c t ( t t 0 ) ) · r 0 ( t = 0 )
where r0 is the initial reaction rate at t = t0, valid for the fresh enzyme, and the activity loss is described empirically by an exponential decay function using a deactivation rate constant kDeact:
The final racemization rate expression including possible enzyme deactivation is as follows:
r ( c L ,   c D ,   t ) = exp ( k D e a c t ( t t 0 ) ) · r m a x   ( c L c D ) K M + c L + c D

2.2. Mass Balance and Productivity of the Enzymatic Fixed Bed Reactor

For further characterization and productivity assessment of racemization using an immobilized racemase, the reactor configuration needs to be specified. In this work, we packed the immobilized enzyme in a tubular fixed-bed reactor (EFBR). The behavior of such a reactor can be described in simplified manner neglecting axial dispersion and radial dispersion. Assuming ideal plug-flow conditions (PFTR behavior), the following mass balance holds for the two enantiomers, D and L, respectively:
c i t = w F c i z + ν i   D c a r r i e r   r ( t )    i = D , L
where z is the space coordinate, wF is the fluid phase velocity, νi is the stoichiometric coefficient of the specific enantiomer, and r is the racemization rate (Equation (5)).
The carrier dosage, Dcarrier, is the relative amount of enzyme present in the reactor of volume V R and fluid phase porosity ϵ F :
D c a r r i e r = m c a r r i e r / ( ϵ F   V R )
where mcarrier is the mass of the enzyme loaded carrier, ϵF is the column porosity, and VR is the reactor volume.
When considering D-AA to be the target enantiomer and the excess of L-AA should be racemized in the enzymatic fixed-bed reactor (EFBR), the conversion of the L-enantiomers, XL, can be defined as follows:
X L ( τ ) = 2 c L , 0 c L ( τ ) c L , 0 c D , 0
with the initial concentrations ci,0 (i = D-AA or L-AA). This conversion reaches its maximum of XL,max = 1 for complete racemization ( τ ). Then, the enantiomeric excess eeL = (cLcD)/(cL + cD) becomes zero.
Applying the integration result of Equation (6) under the assumption of steady state while considering the expression for the initial reaction rate (Equation (1)) results in an expression for predicting the conversion at the reactor outlet:
X L ( τ ) = 1 exp ( 2 τ   D c a r r i e r   r m a x K M + c t o t )
Exploiting Equation (9), the residence time, τ = (ϵF VR)/ V L ˙ , required (which is proportional to the reactor dimension and the flow rate V L ˙ ) can be estimated as a function of a certain target value for XL,target as follows:
τ ( X L , t a r g e t ) = l n ( 1 X L , t a r g e t ) K M + c t o t 2   D c a r r i e r   r m a x
The productivity of the EFBR, PR, is a function of the initial concentrations cL,0 and cD,0, the targeted conversion in the effluent XL, and the residence time τ, which is required for the targeted conversion.
P R ( X L , t a r g e t ) = 0.5   X L , t a r g e t ( c L , 0 c D , 0 ) D c a r r i e r   τ ( X L , t a r g e t )
After specifying the volumetric feed flow rate, the conditions regarding inlet and outlet compositions (expressed as conversion), and the total feed concentration, Equations (7) and (10) provide estimates for the amounts of carrier and enzyme required:
m c a r r i e r = m A A R q A A R = l n ( 1 X L ( τ ) )   V ˙   ( K M + c t o t ) 2     r m a x

3. Results

In this chapter, we describe and discuss the results of the experiments for the characterization of AAR and the chromatographic separation of D-/L-Met with compatible solvents. The focus lies on the immobilized AAR and the effect of pH, temperature, and alcohol concentration on the activity and stability.

3.1. Kinetics of the AAR

The immobilized amino acid racemase was studied for its usage as a process intensification tool to expand chiral resolution processes and enhance their yield and productivity. Therefore, the influence of temperature, pH, and alcohol on the racemization rate was characterized, as well as the AARs’ storability and stability under possible operating conditions.

3.1.1. Activity of the Free and Immobilized AAR

The activity of the purified free AAR for methionine was measured twice with 20 g/L L-Met at 30 °C with an enzyme dosage of 39 mg/L using the method described in Section 5.3.1. Within the first 3 min, an average initial activity for L-Met of 139 U/mgAAR was measured. The activity of the immobilized racemase was tested with the same substrate concentration in an EFBR as described in Section 5.3.2, but with different dosages. For the immobilized enzyme, the dosage was 732 mg/mL and thus 660-fold higher for B1 and 690-fold higher for B2 than the dosage of the free enzyme (Table 1). The initial activity at 30 °C was 48 U/mgAAR, and thus almost three times lower.
We see several reasons for the observed difference in activities. A possible reason for a lower activity of immobilized AAR is its decreased flexibility due to its binding to the carrier. Moreover, the binding pocket for the substrate could be partially blocked by the resin. Another reason could be that the AAR partially decayed during the immobilization step, which was performed for 18 h at room temperature. In addition, the accessibility of the immobilized enzyme in deeper pores might be limited. It had been shown before that the pore size played a role in the overall activity [21]. Furthermore, the moisture content in the carrier resin might fluctuate, which adds uncertainty about the density and dosage of the carrier. It is likely that many of these aspects accumulated and caused this lower activity. However, a deeper understanding of the deactivation rate would require a range of further experiments, which are out of the scope of this work.

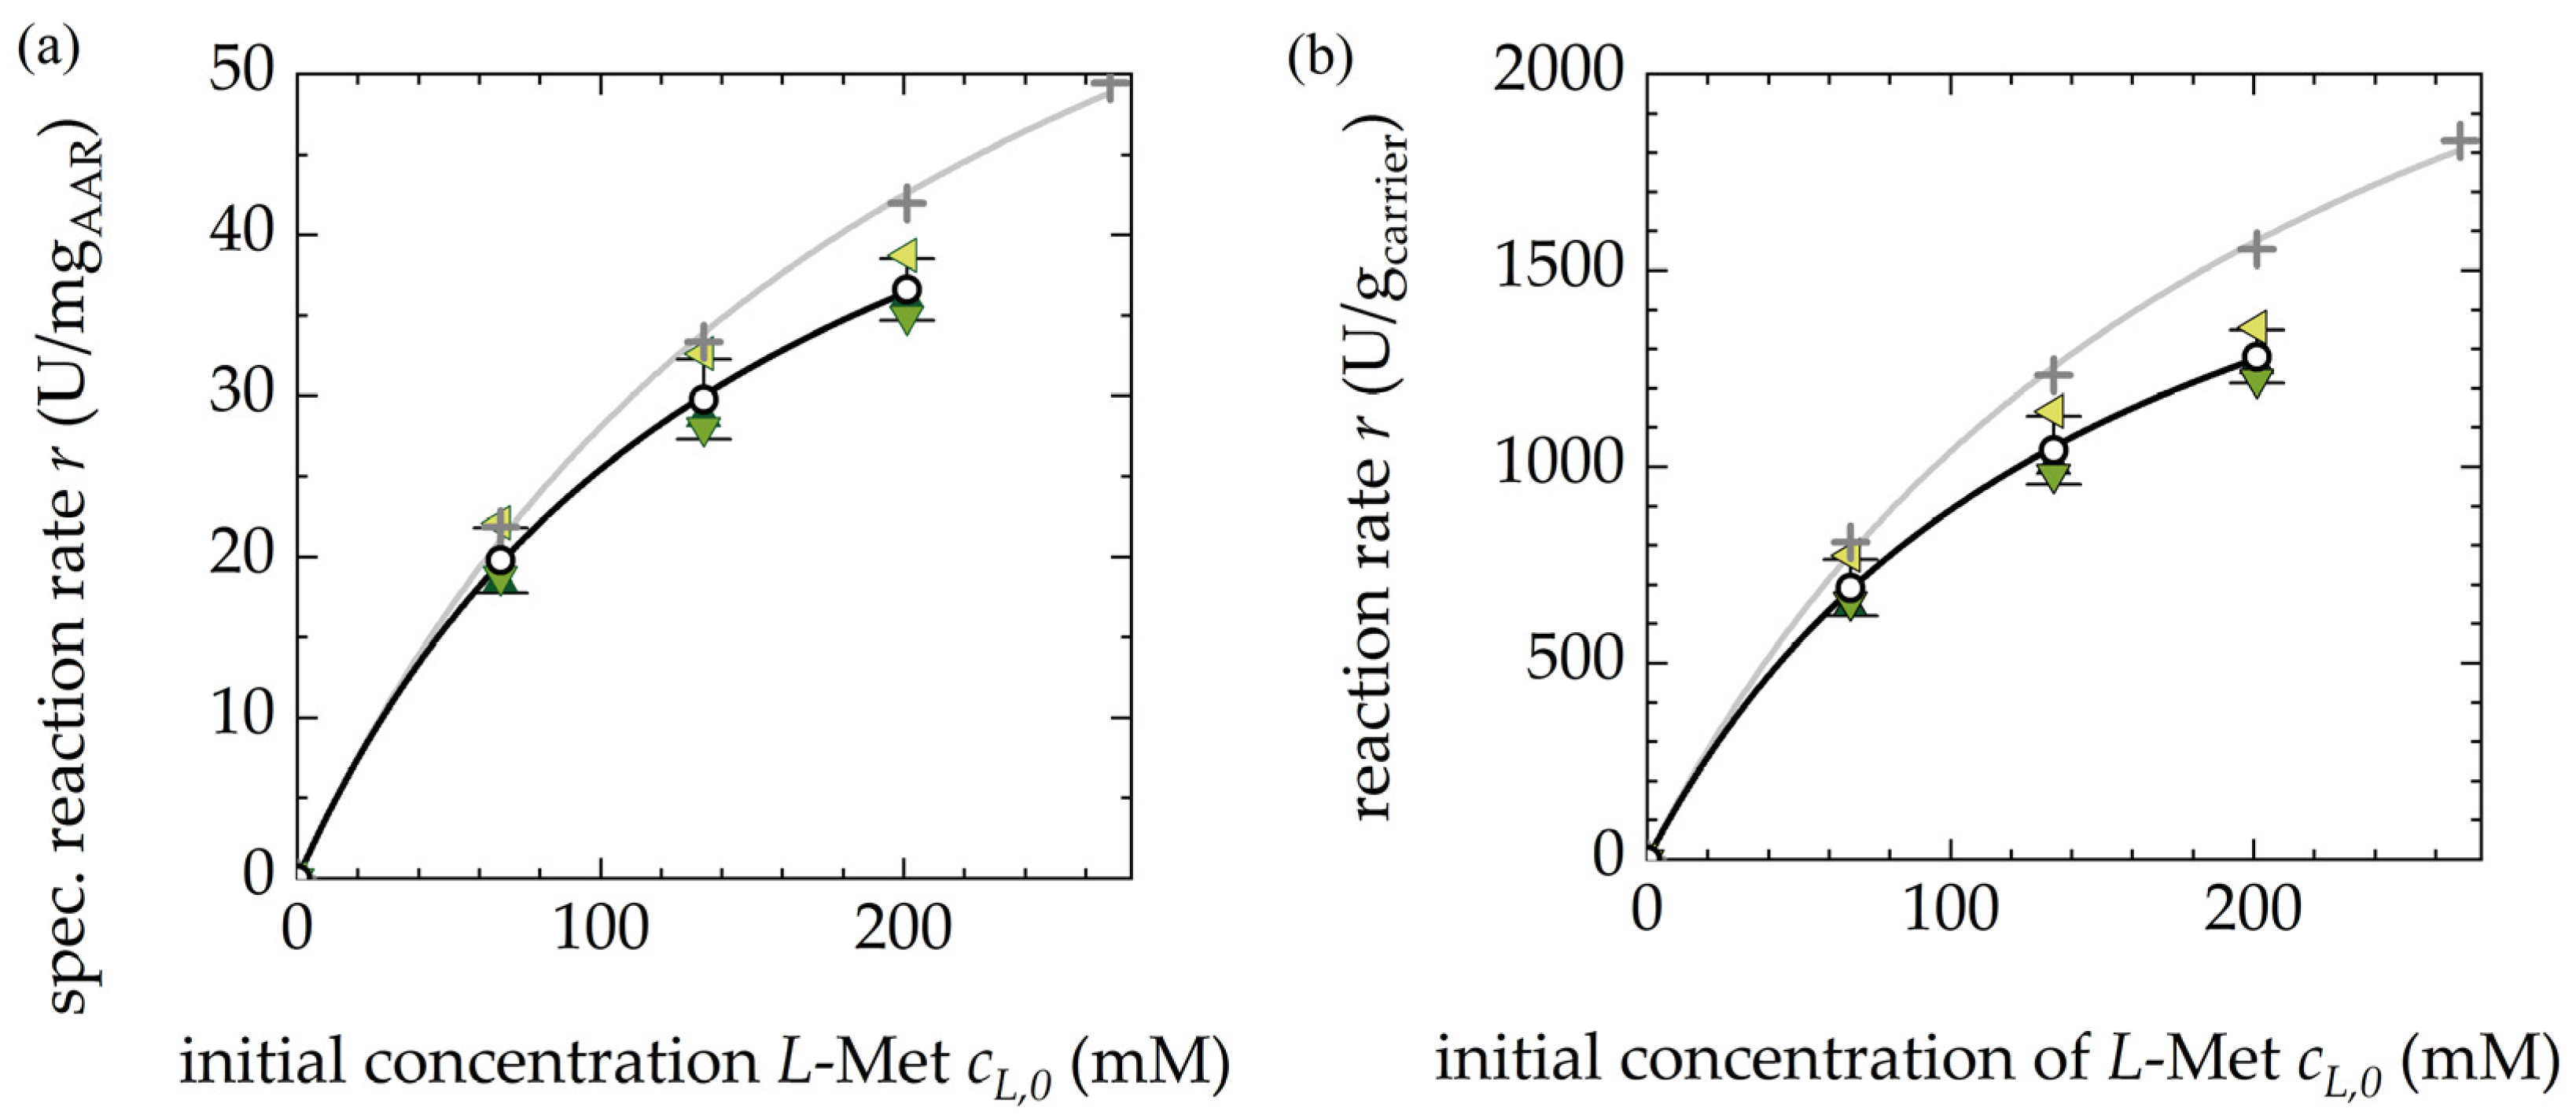
3.1.2. Reproducibility of Different Fermentation Batches of AAR

The presented experiments were performed with EFBR using the two mentioned batches of racemase: B1 and B2. Batch B1 was immobilized with qAAR = 37 mgAAR/gcarrier and batch B2 with 35 mgAAR/gcarrier. The enzymatic activity of the EFBR was tested for different L-Met concentrations at 20 °C. The measured reaction rates and the respective method used are summarized in the Supplementary Materials. For batch B2, the experiments have been repeated three times with fresh beds. Based on the initial reaction rates for the tested substrate concentrations, kinetic parameters were normalized with regard to the amount of racemase (Figure 2a) and carrier (Figure 2b) for L-Met in pure water (Table 2).
According to the fit, batch B1 would have a 44% higher rmax than batch B2. On the other hand, the Michaelis constant of B2 is 40% lower than that of B1. These contradictory results can be explained by the gradient of the reaction rate, which remains steep until the solubility limit of methionine. This makes an accurate parameter estimation of rmax difficult. Therefore, a more reliable comparison between the two sets of kinetic parameters is the ratio rmax/KM. Here, the difference of the two batches is only 4%. Another evaluation is a comparison of the initial activities at each initial substrate concentration. Here, the activity of B1 is 14 ± 2% higher than for B2.
The reason for the activity difference between the batches is partly due to their different loadings. When comparing the activity with respect to the amount of enzyme, the difference between the batches decreases to 11 ± 2% and the difference in their rmax/KM drops to 2%. The remaining difference can result from variances in the bacterial fermentation and enzyme purification processes. The purification of B2 was done about a month after storing the cell pellet at −20 °C. Thus, it is possible that AAR denaturation occurred during this storage time or at subsequent preparation steps. However, while the purity of the AAR was confirmed with SDS-PAGE, it was not possible to determine the fraction of correctly folded and deformed AAR. In summary, the amounts of active AAR could vary slightly between batches B1 and B2.

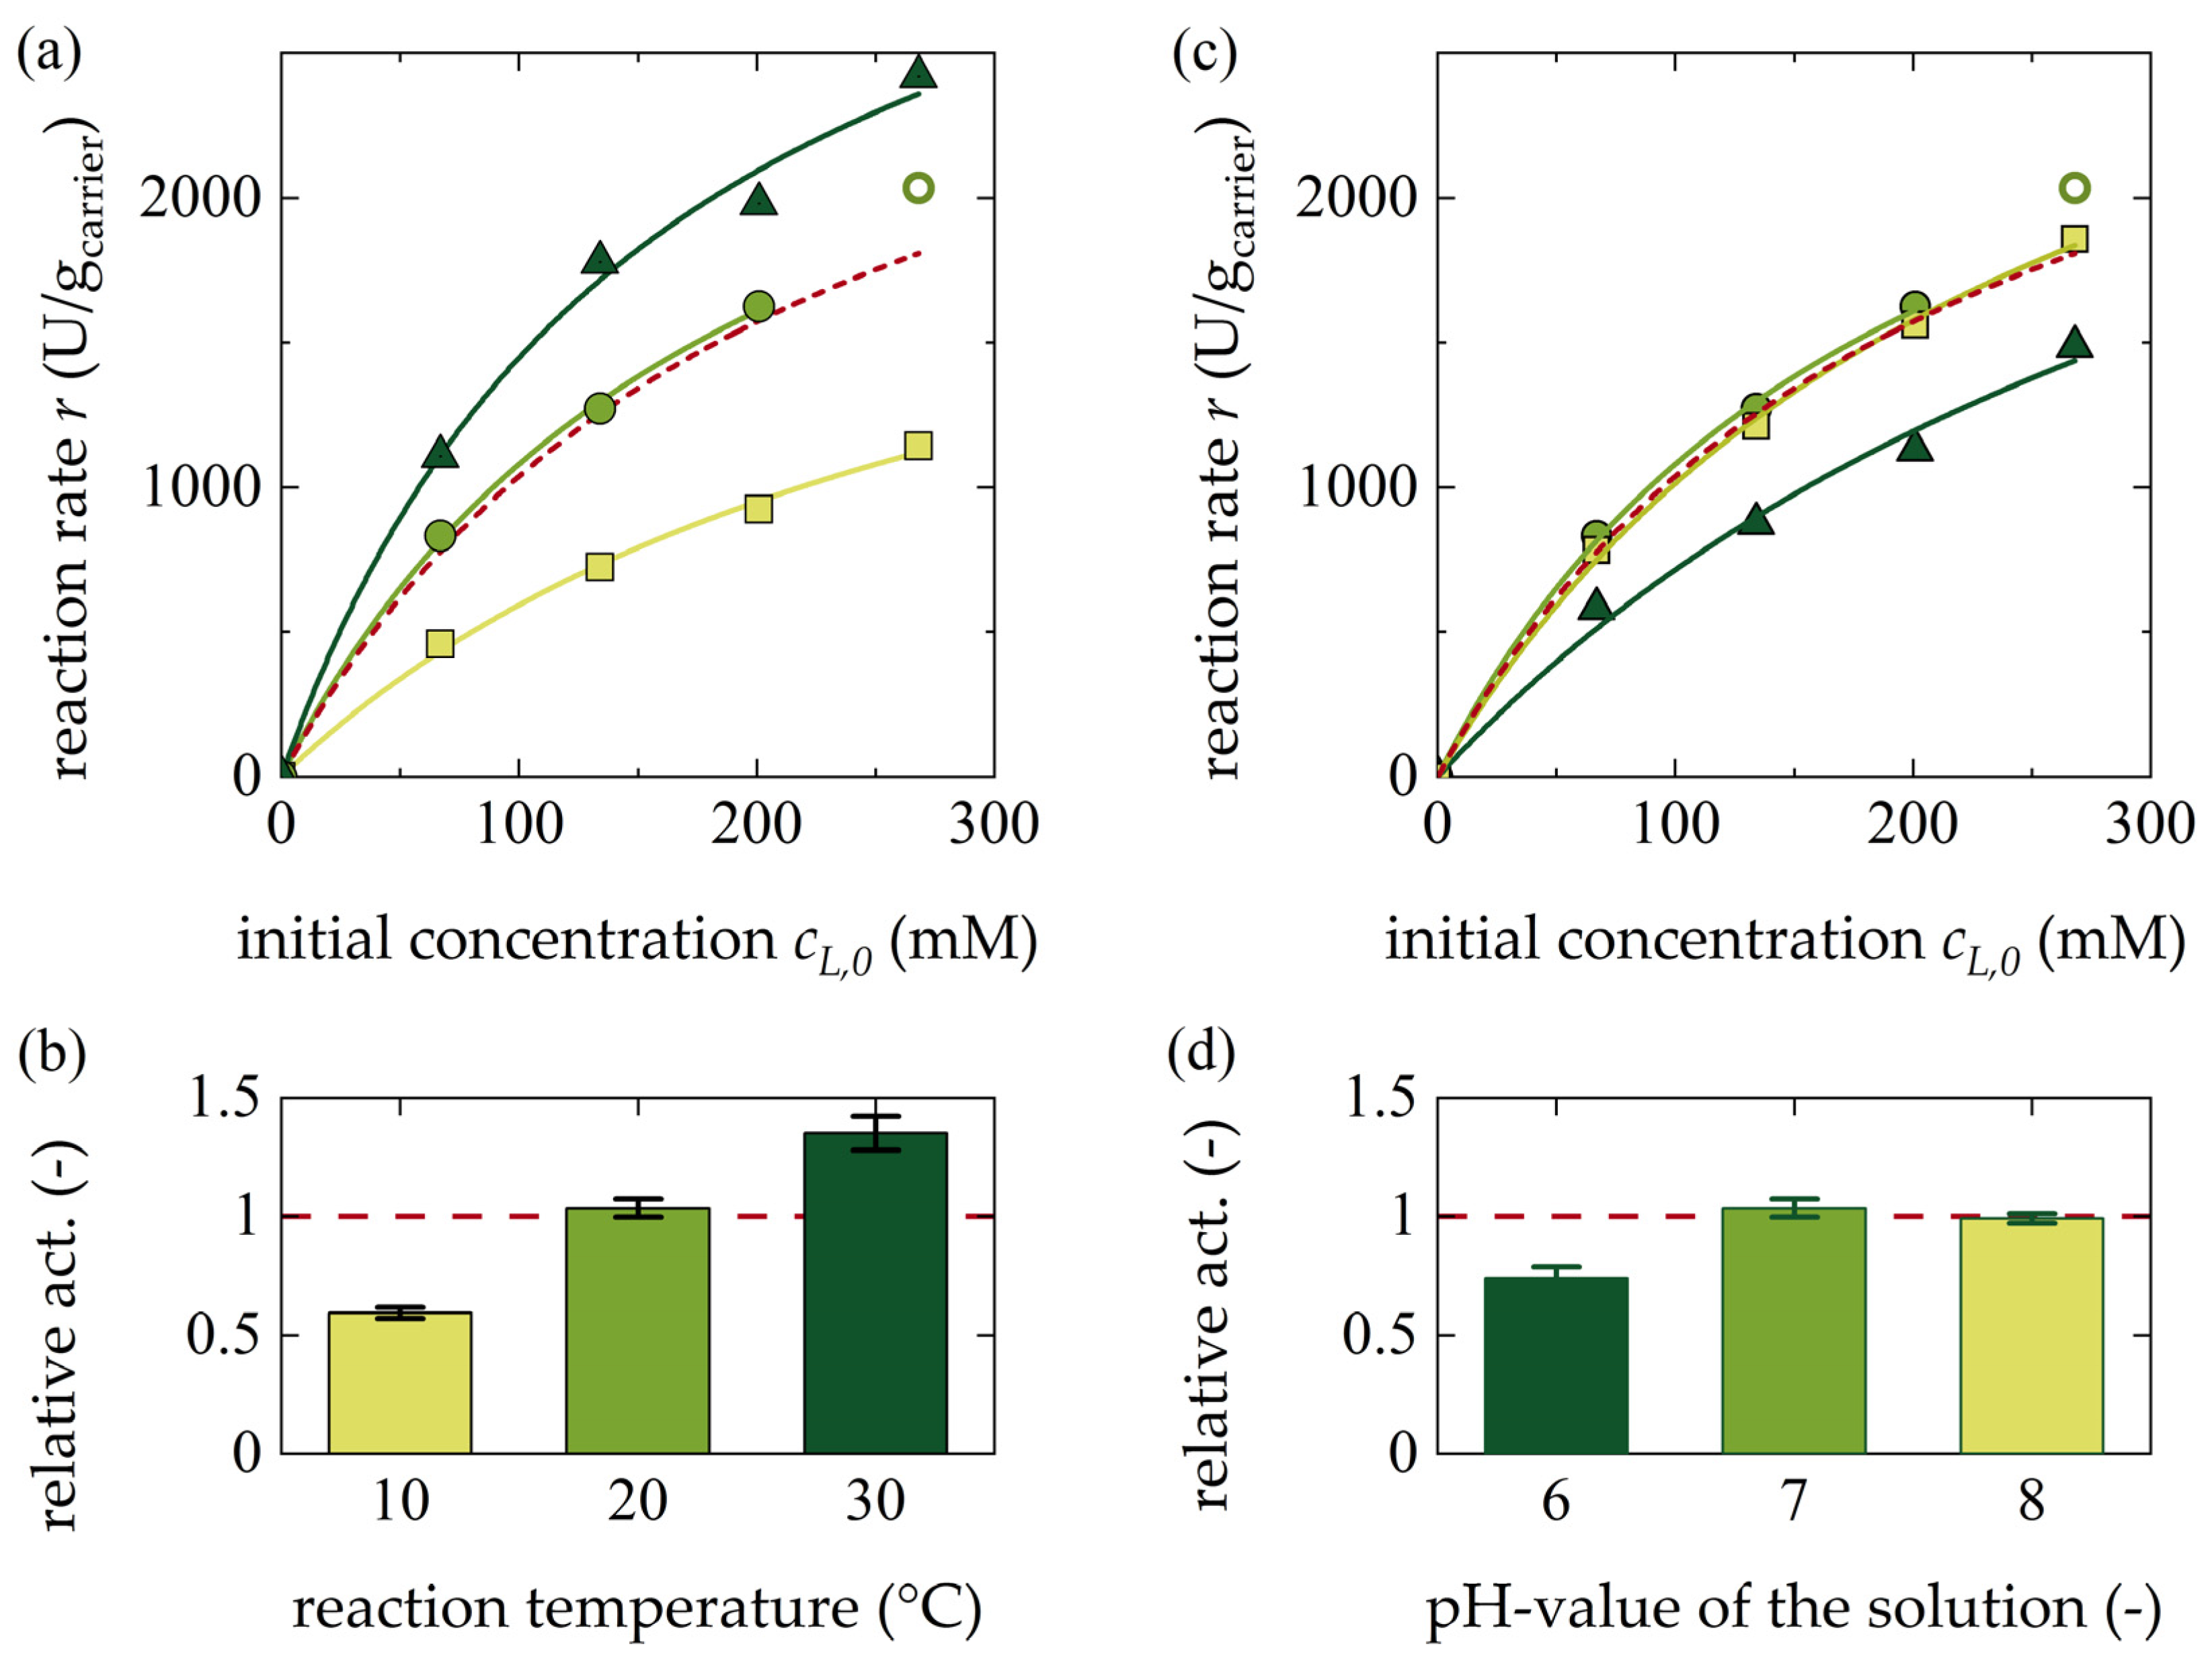
3.1.3. Influence of Temperature and pH Value

Based on the studies of Würges et al. 2009 [20], the characteristics of the AAR were studied for L-Met in a phosphate buffered system. The impact of temperature on the reaction rates is displayed in Figure 3a,b. The resulting kinetic parameters are summarized in Table 3. The results showed a clear temperature dependence. In coherence with the van’t Hoff law, the reaction rate doubles when increasing the reaction temperature from 10 °C to 20 °C, and triples when it is increased to 30 °C. This is also represented by the increasing ratios rmax/KM from 7.92 to 16.5 and 23.5 U/mM/gcarrier. The temperature dependency was described with Equations (3) and (4) and the resulting parameters are summarized in Table 4. More information regarding the quality of the fits is given in the Supplementary Materials.
It should be mentioned that, in contrast to operation at 10 °C and 20 °C, an activity drop was observed after two days of operation at 30 °C.
The impact of pH is displayed in Figure 3c,d). In a phosphate buffered system, the AAR performs best in a range of pH 7–8, while a pH of 6 decreased the reaction rate. At the same time, the activity of the AAR in an unbuffered methionine solution (pH = 5.8) is similar to that of pH 7–8.

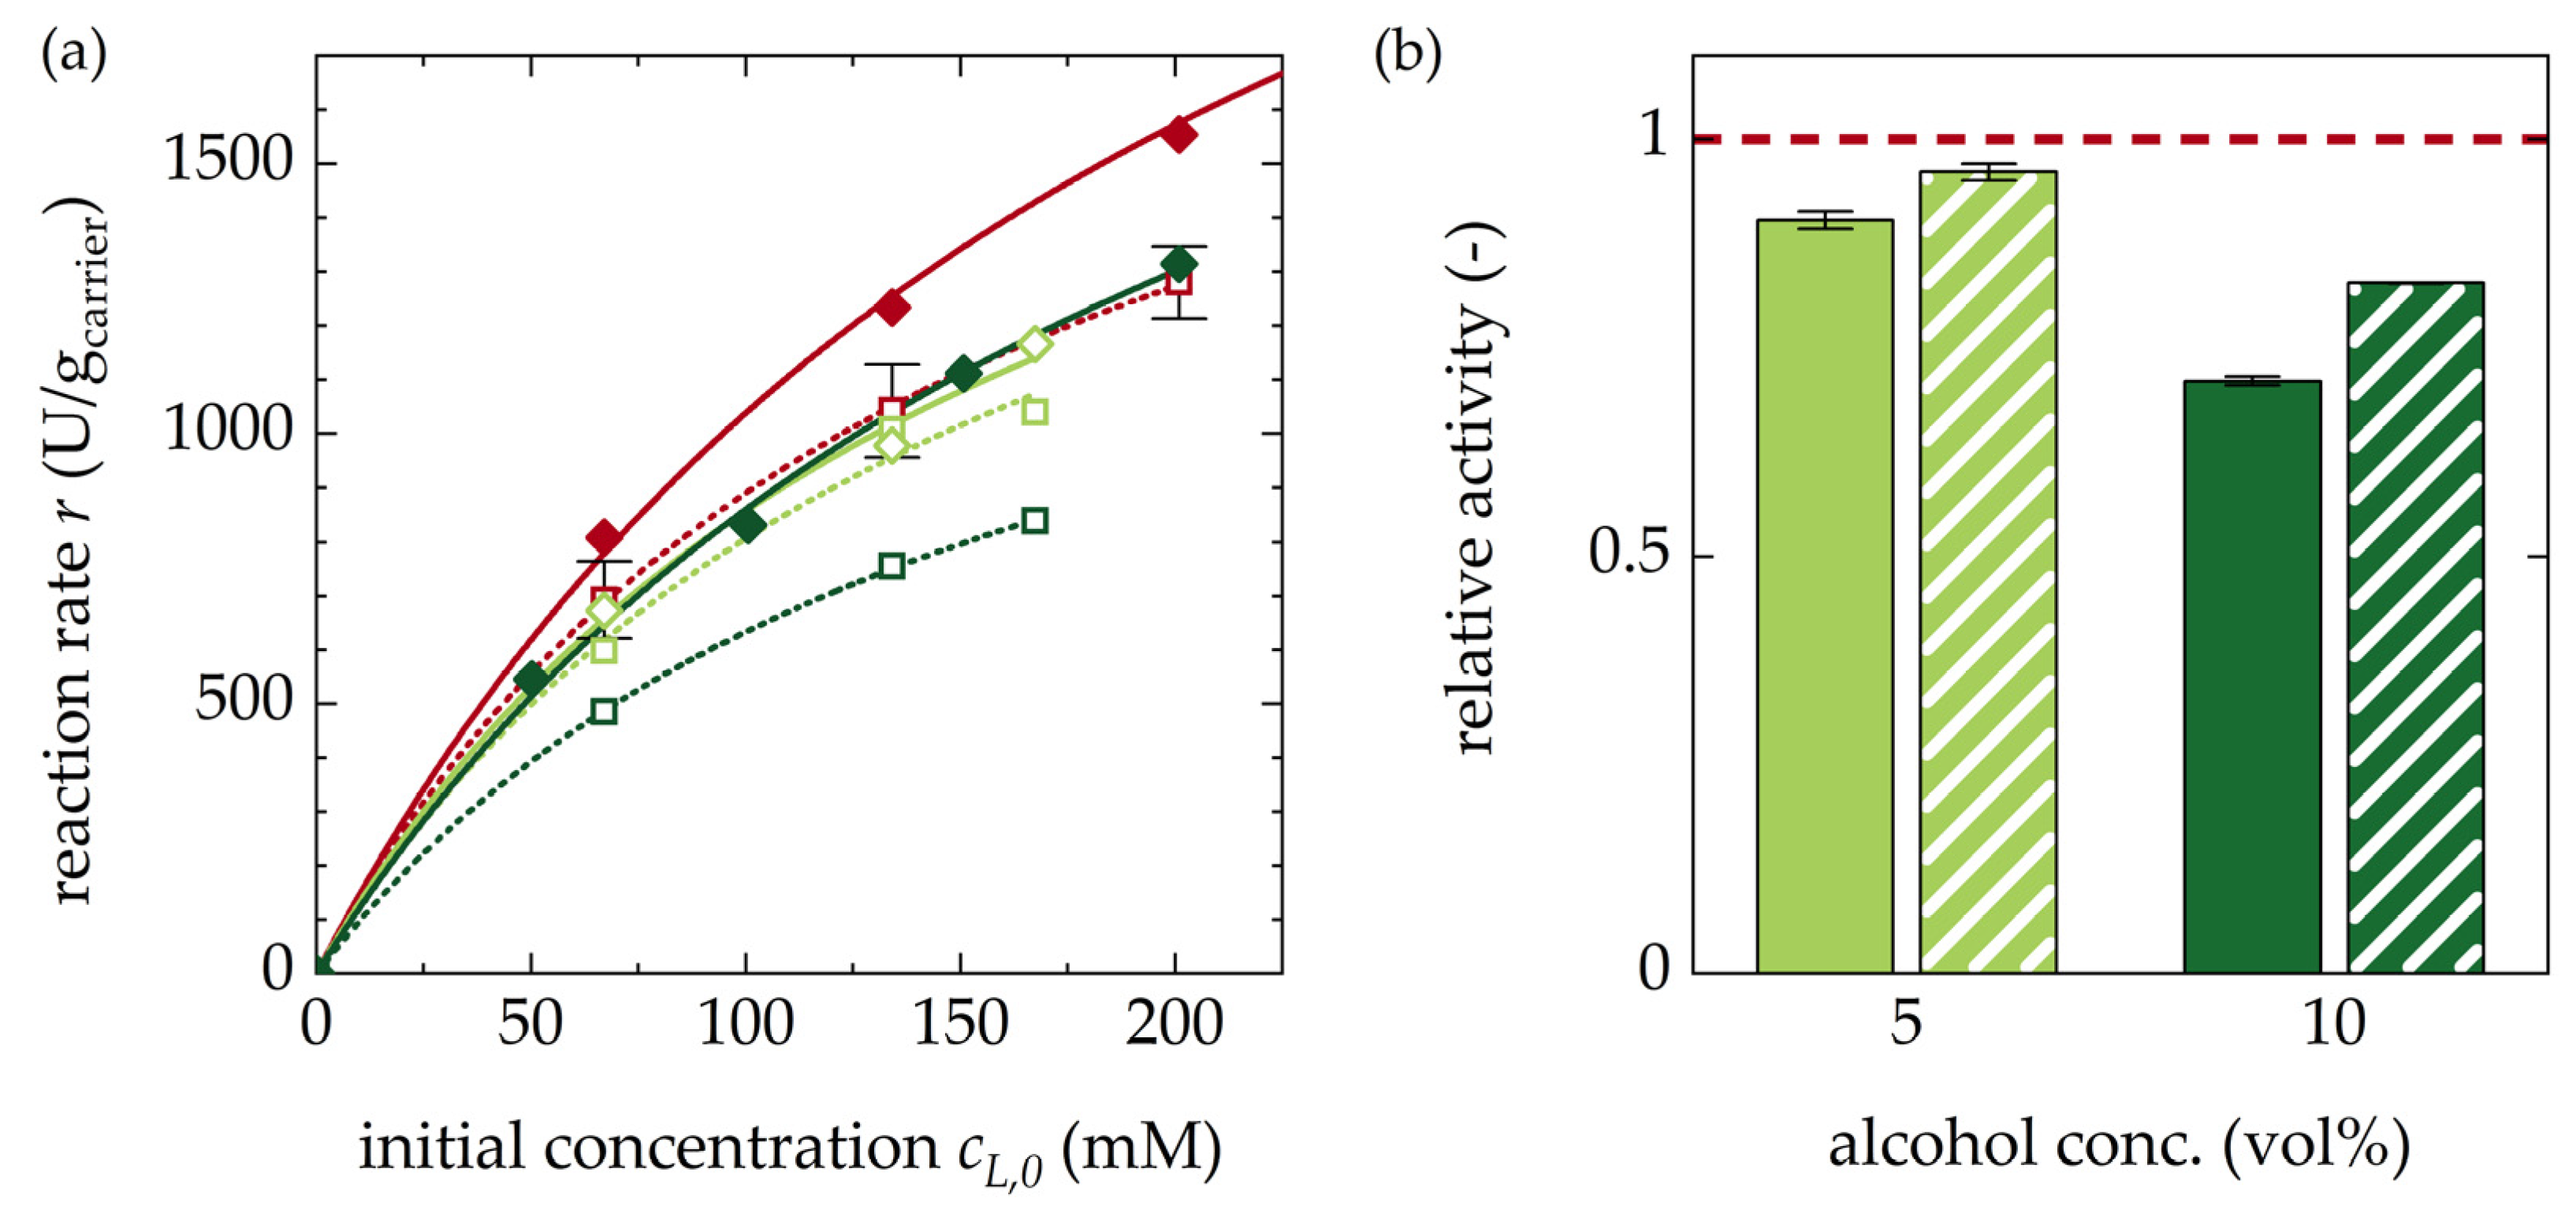
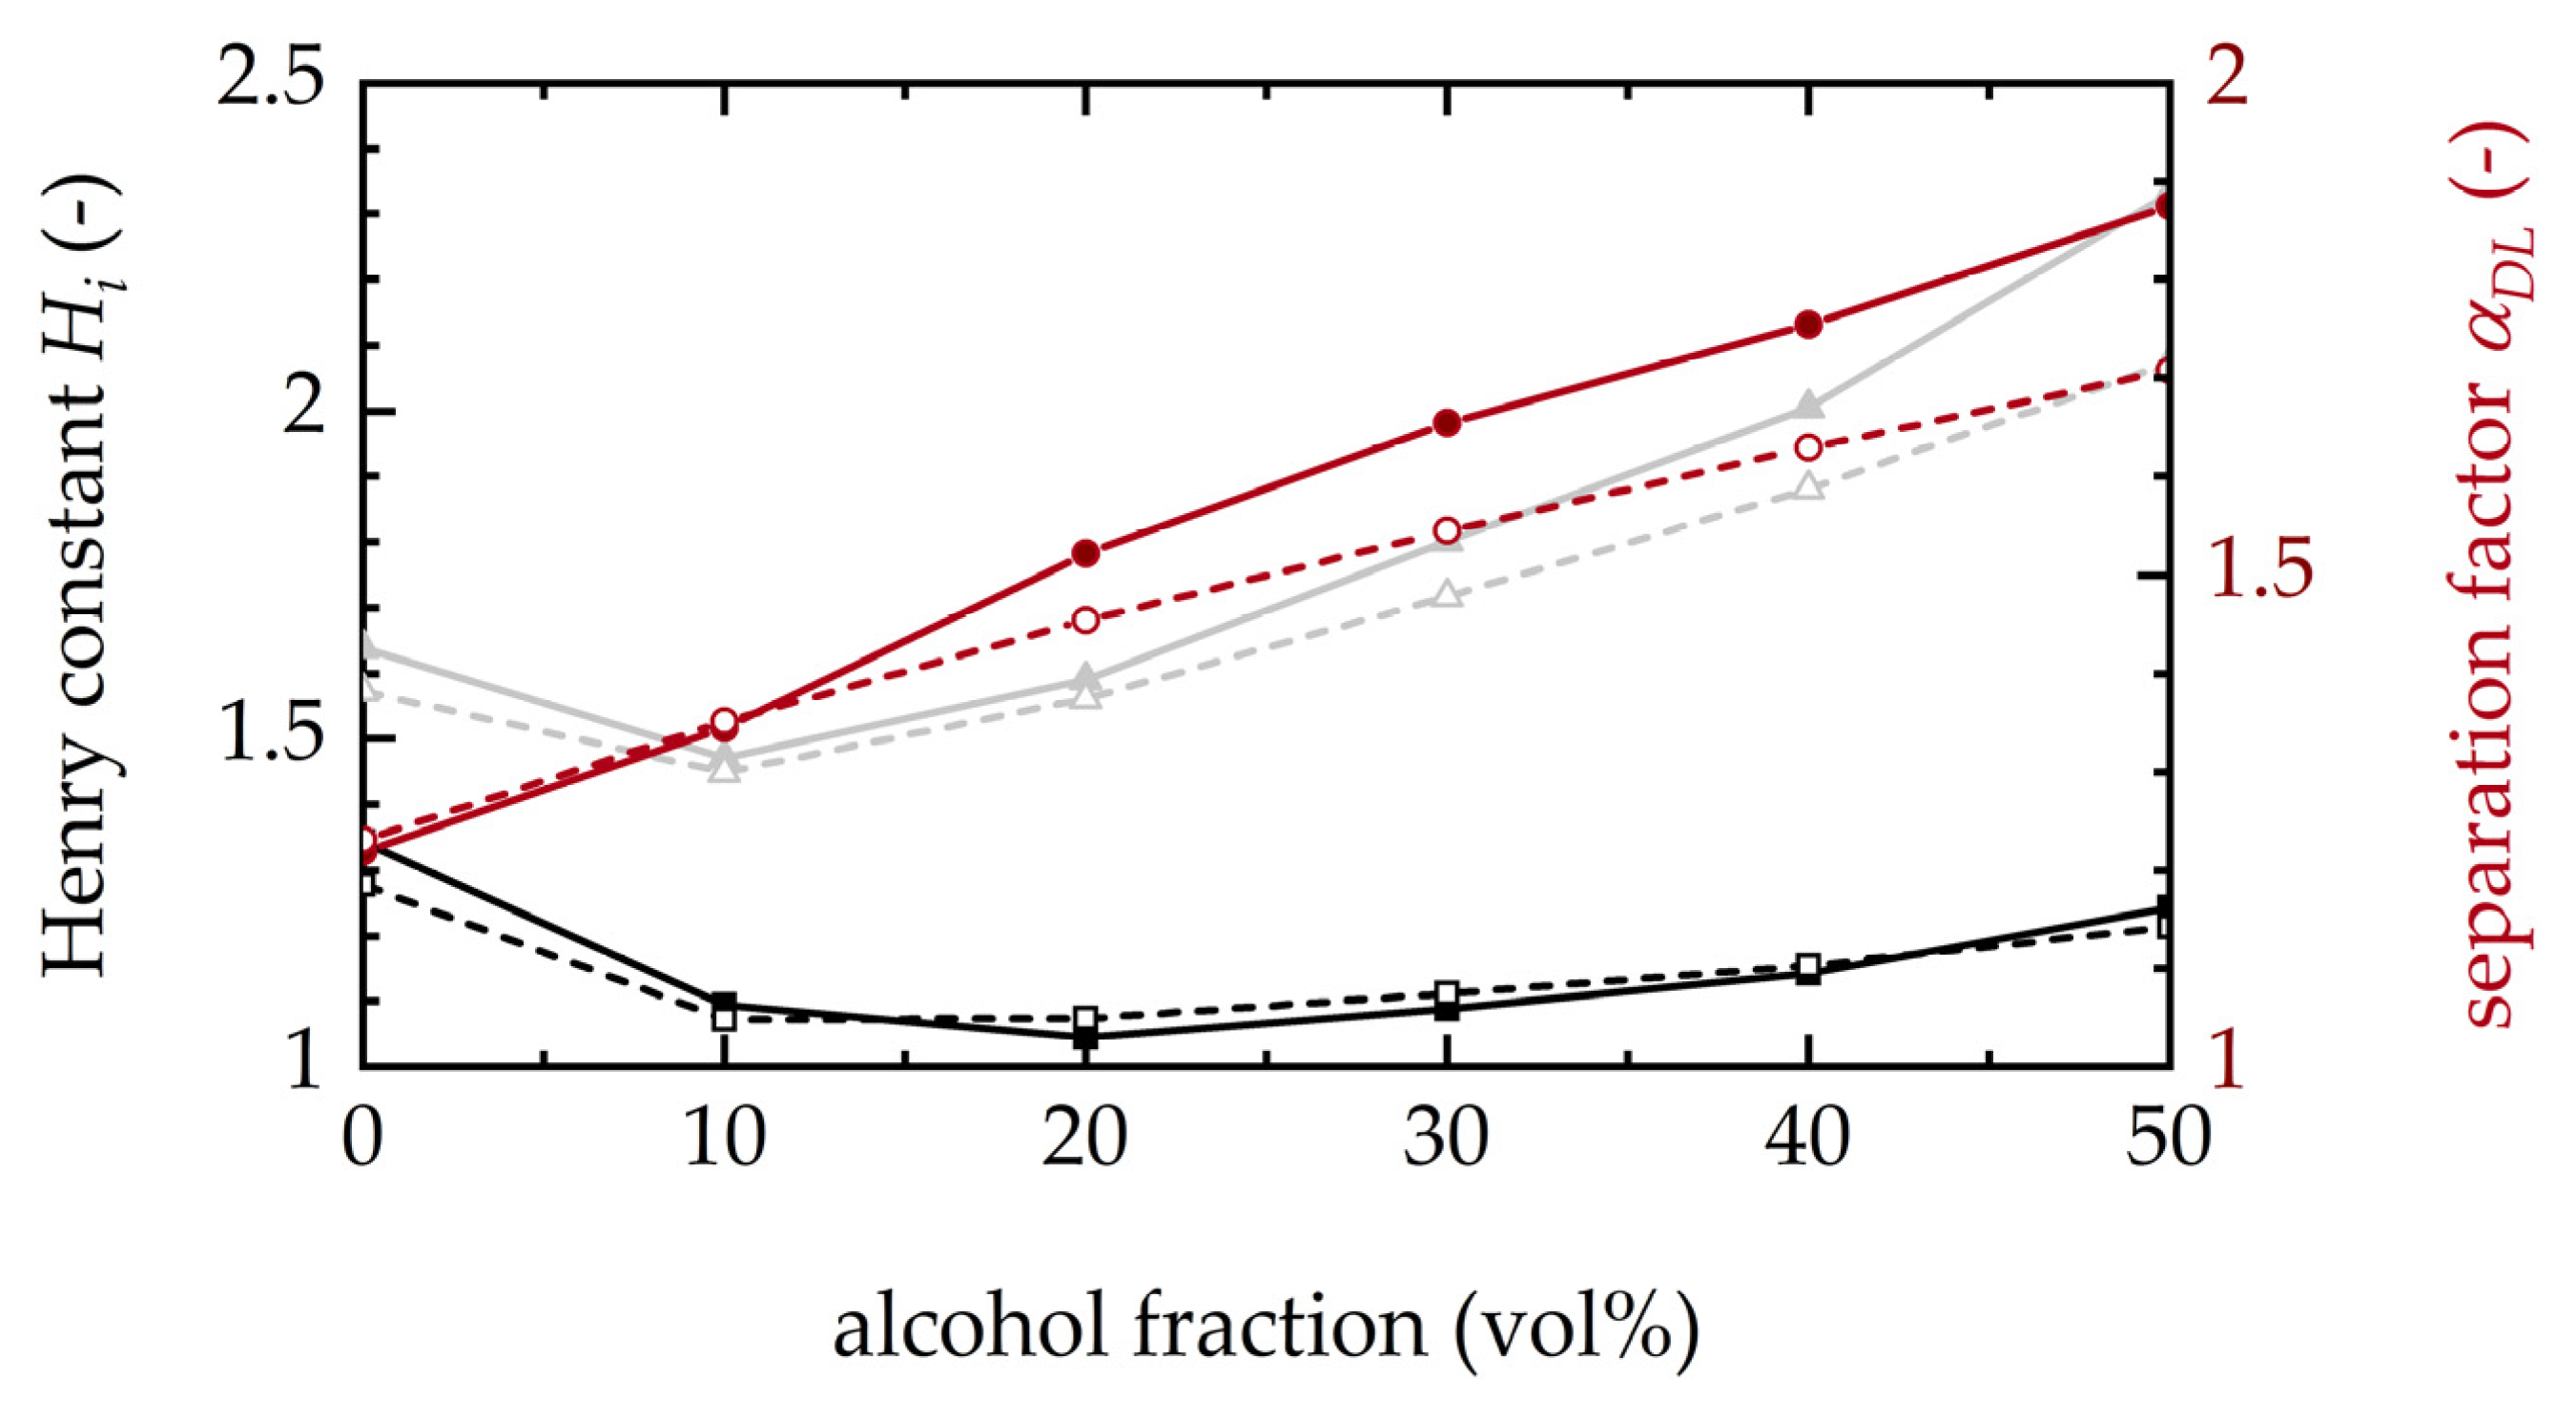
3.1.4. Impact of Alcohols on Racemization Rates

The separation of D-/L-methionine by chromatography is significantly improved for aqueous solutions containing organic solvents like methanol or ethanol. Therefore, the AAR was tested with 5 vol% and 10 vol% of both mentioned solvents. Here, 10 vol% methanol was tested with AAR from batch B1, whereas the other three conditions were tested with AAR from batch B2. The resulting reaction rates are displayed in Figure 4a. Owing to the different activity values in pure water, the reaction rates were normalized to the maximal reaction rates of the corresponding rate in pure water. Figure 4b shows the normalized reaction rates. It can be seen that the presence of 5 vol% only had a small effect on the reaction rates. However, when increasing the organic solvent fraction to 10 vol%, the reaction rate decreases by 17% for methanol and 29% for ethanol.

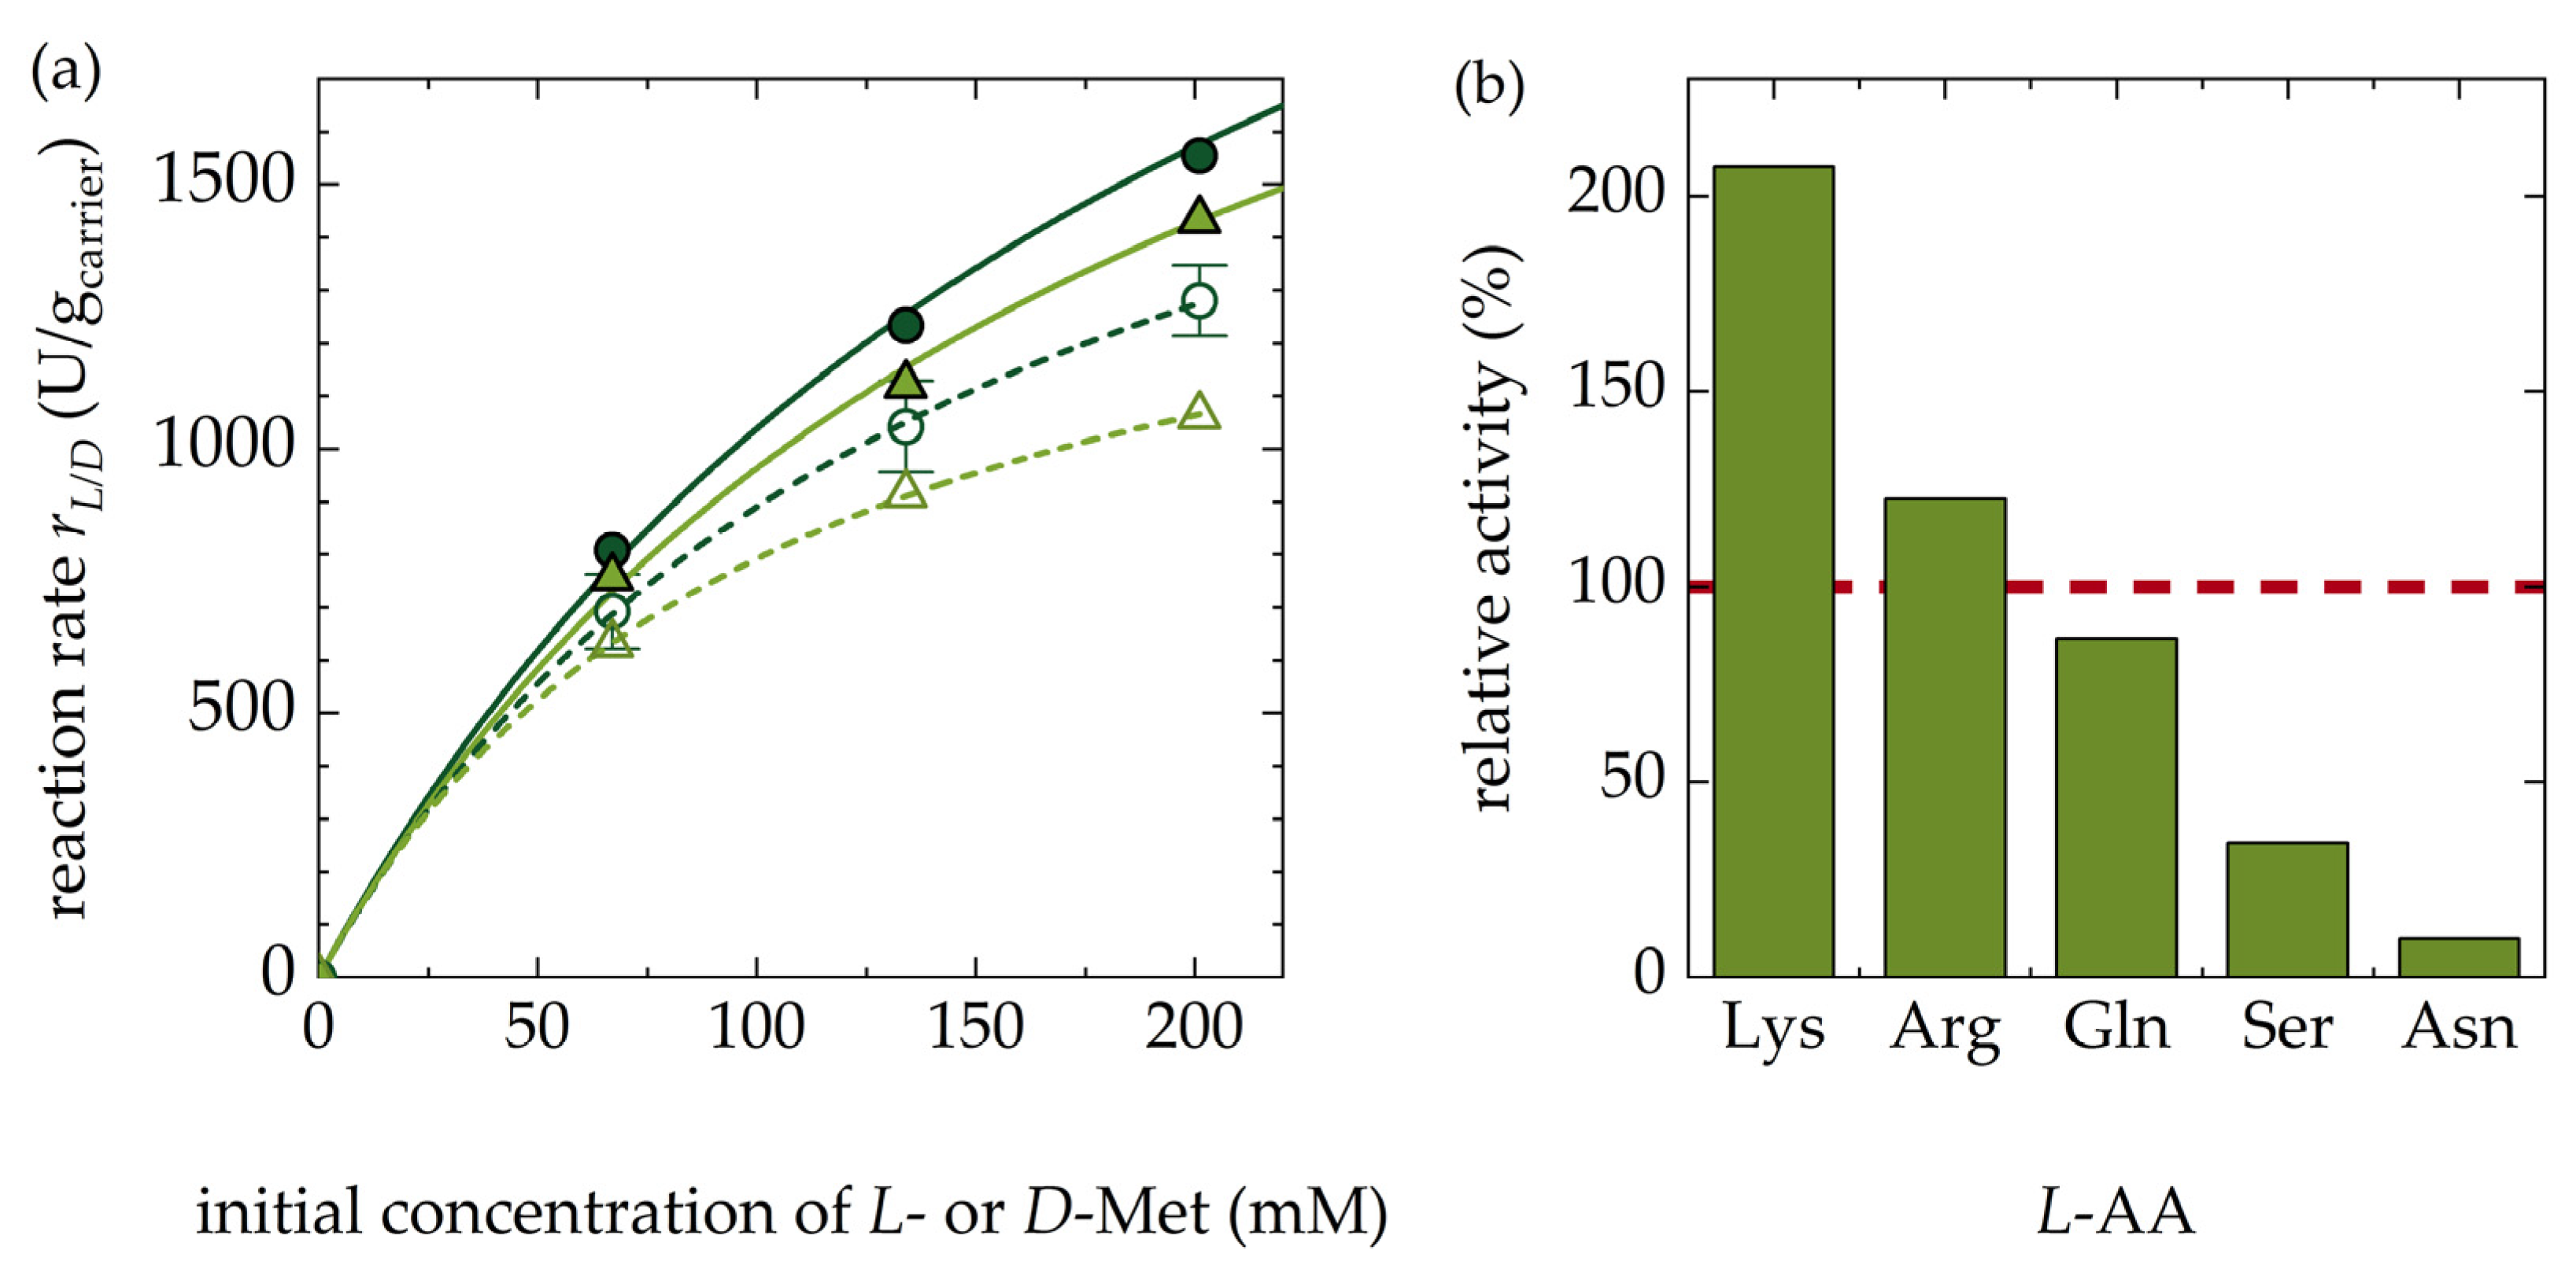
3.1.5. Kinetics of Racemization for D-Met and Other Amino Acids (AA)

The reaction rate for D-Met was repeated with the AAR from both batches at 20 °C with D-Met in water. In Figure 5a, the reaction rates for L-Met and D-Met are displayed and the MM coefficients are summarized in Table 5. In a direct comparison between the initial reaction rates at different concentrations, the AAR activity for D-Met is about 10% lower than for L-Met. This is reflected by the maximal reaction rate estimations, which are 16% smaller for B1-D-Met compared with B1-L-Met and, even more drastically, 38% smaller for B2-D-Met compared with B2-L-Met. Only the activity at the lowest concentration of 10 g/L is similar for both enantiomers. This affects the estimated values of KM for D-Met (186 mM and 104 mM for AAR batches B1 and B2, respectively), which are lower in comparison with those calculated for L-Met (211 and 151 mM for AAR batches B1 and B2, respectively). However, owing to the contrary trends of rmax and KM, the ratio rmax/KM is almost identical for D- and L-Met, and even when comparing the two batches.
Finally, the enzyme was tested for other L-AA substrates with an initial concentration of 0.134 M at 20 °C and flow rates between 4.0 mL/min and 0.1 mL/min. The measured conversion rates at the different retention times are shown in Figure 6. The racemization conversion obtained with the AAR was normalized for each AA in comparison with the activity for L-Met. The activity at a conversion rate of 10% normalized to the rate for L-methionine is presented in Figure 5b. The activity for L-Arg and L-Lys exceeded that for L-Met by 22% and 107%, respectively, while the other AA had a lower racemization rate. L-Asn showed the lowest activity, with only 10% compared with L-Met. However, it needs to be mentioned that the activities for L-Lys and L-Arg were measured in a solution where the pH was decreased to pH 7.5 with 1 M HCl. An operation in a pure aqueous solution was not possible as the AAR was instantly deactivated after being exposed to aqueous solutions of 134 mM Lys and Arg, which had a pH > 10. Even though the exact relation between the activity for different AA varies, they are comparable to the results presented by [19] for the free AAR. The results obtained confirm the wide application range of the immobilized AAR.

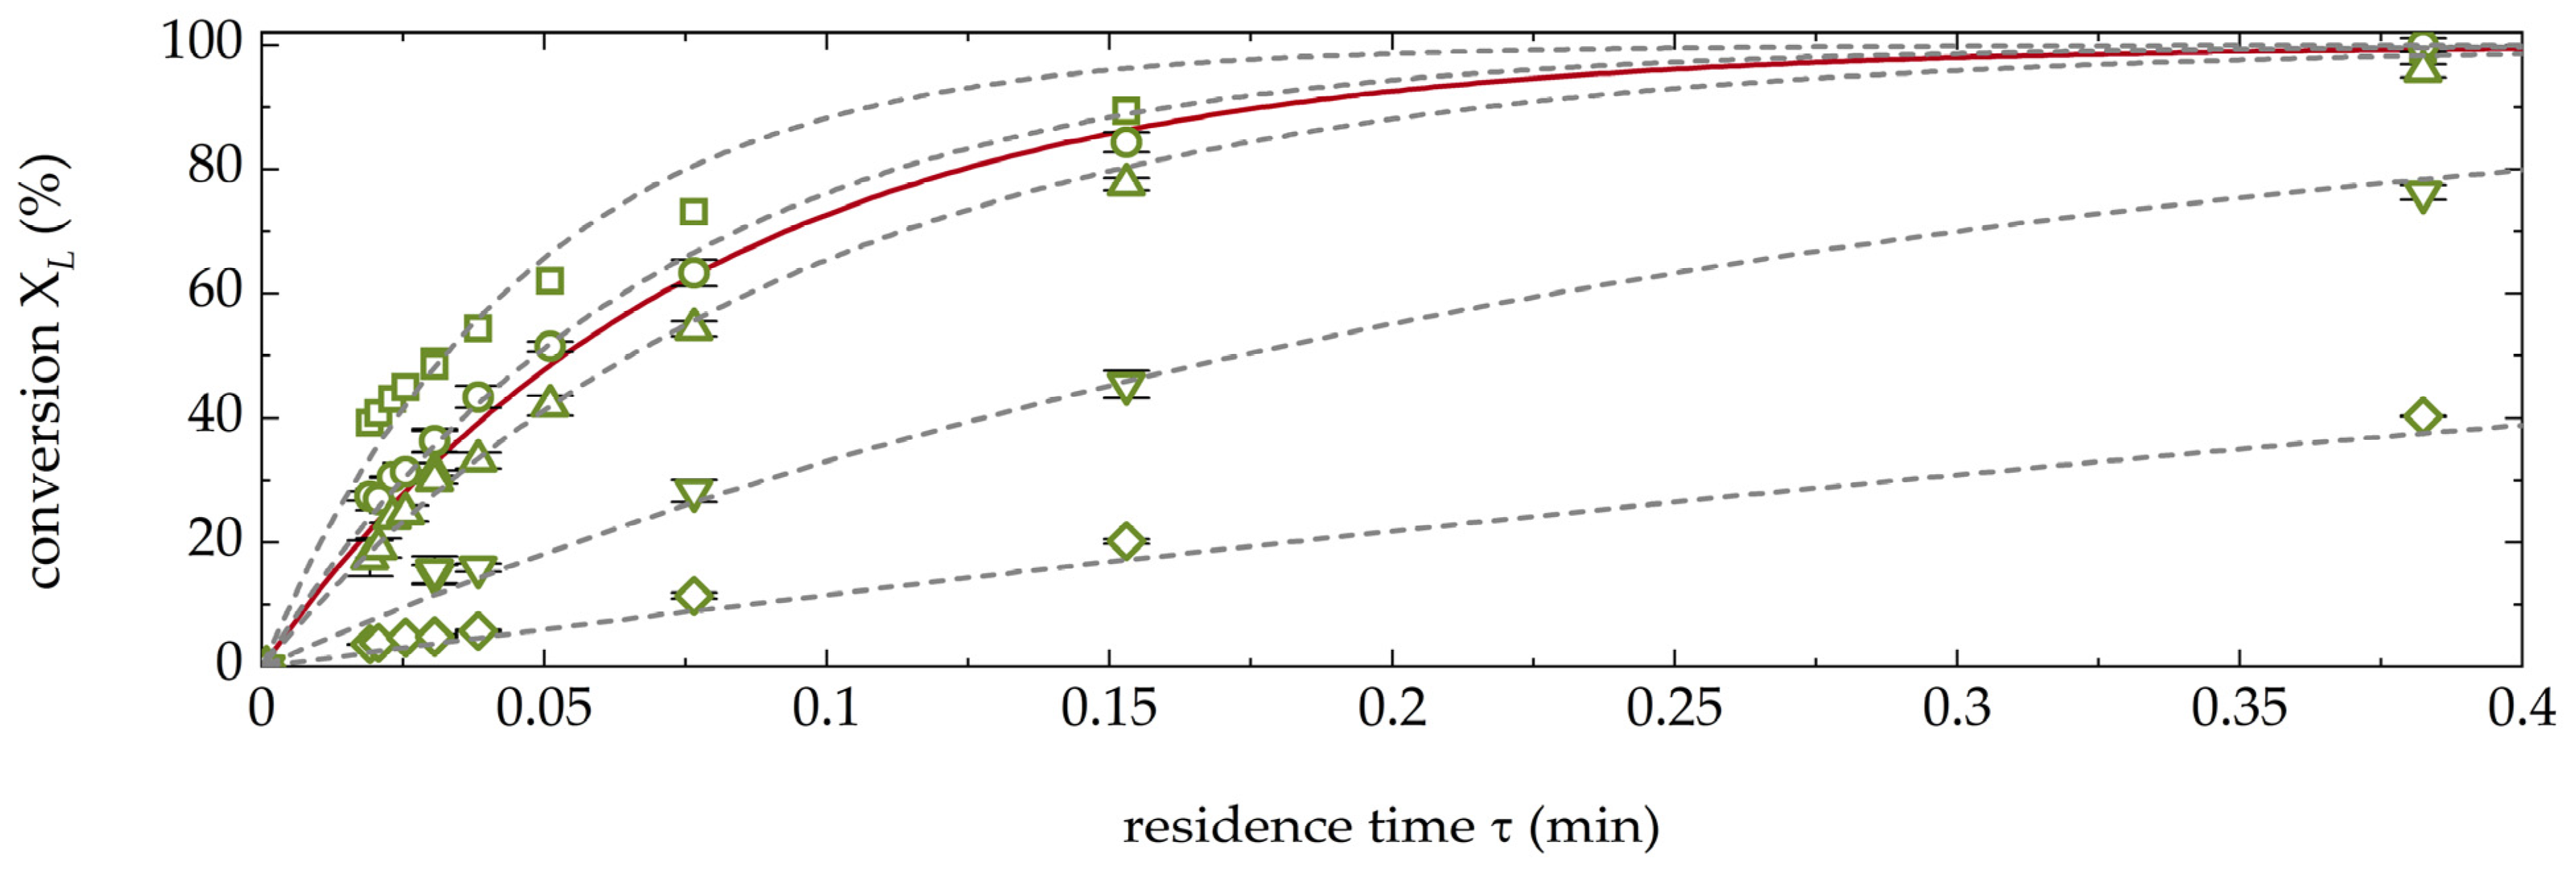
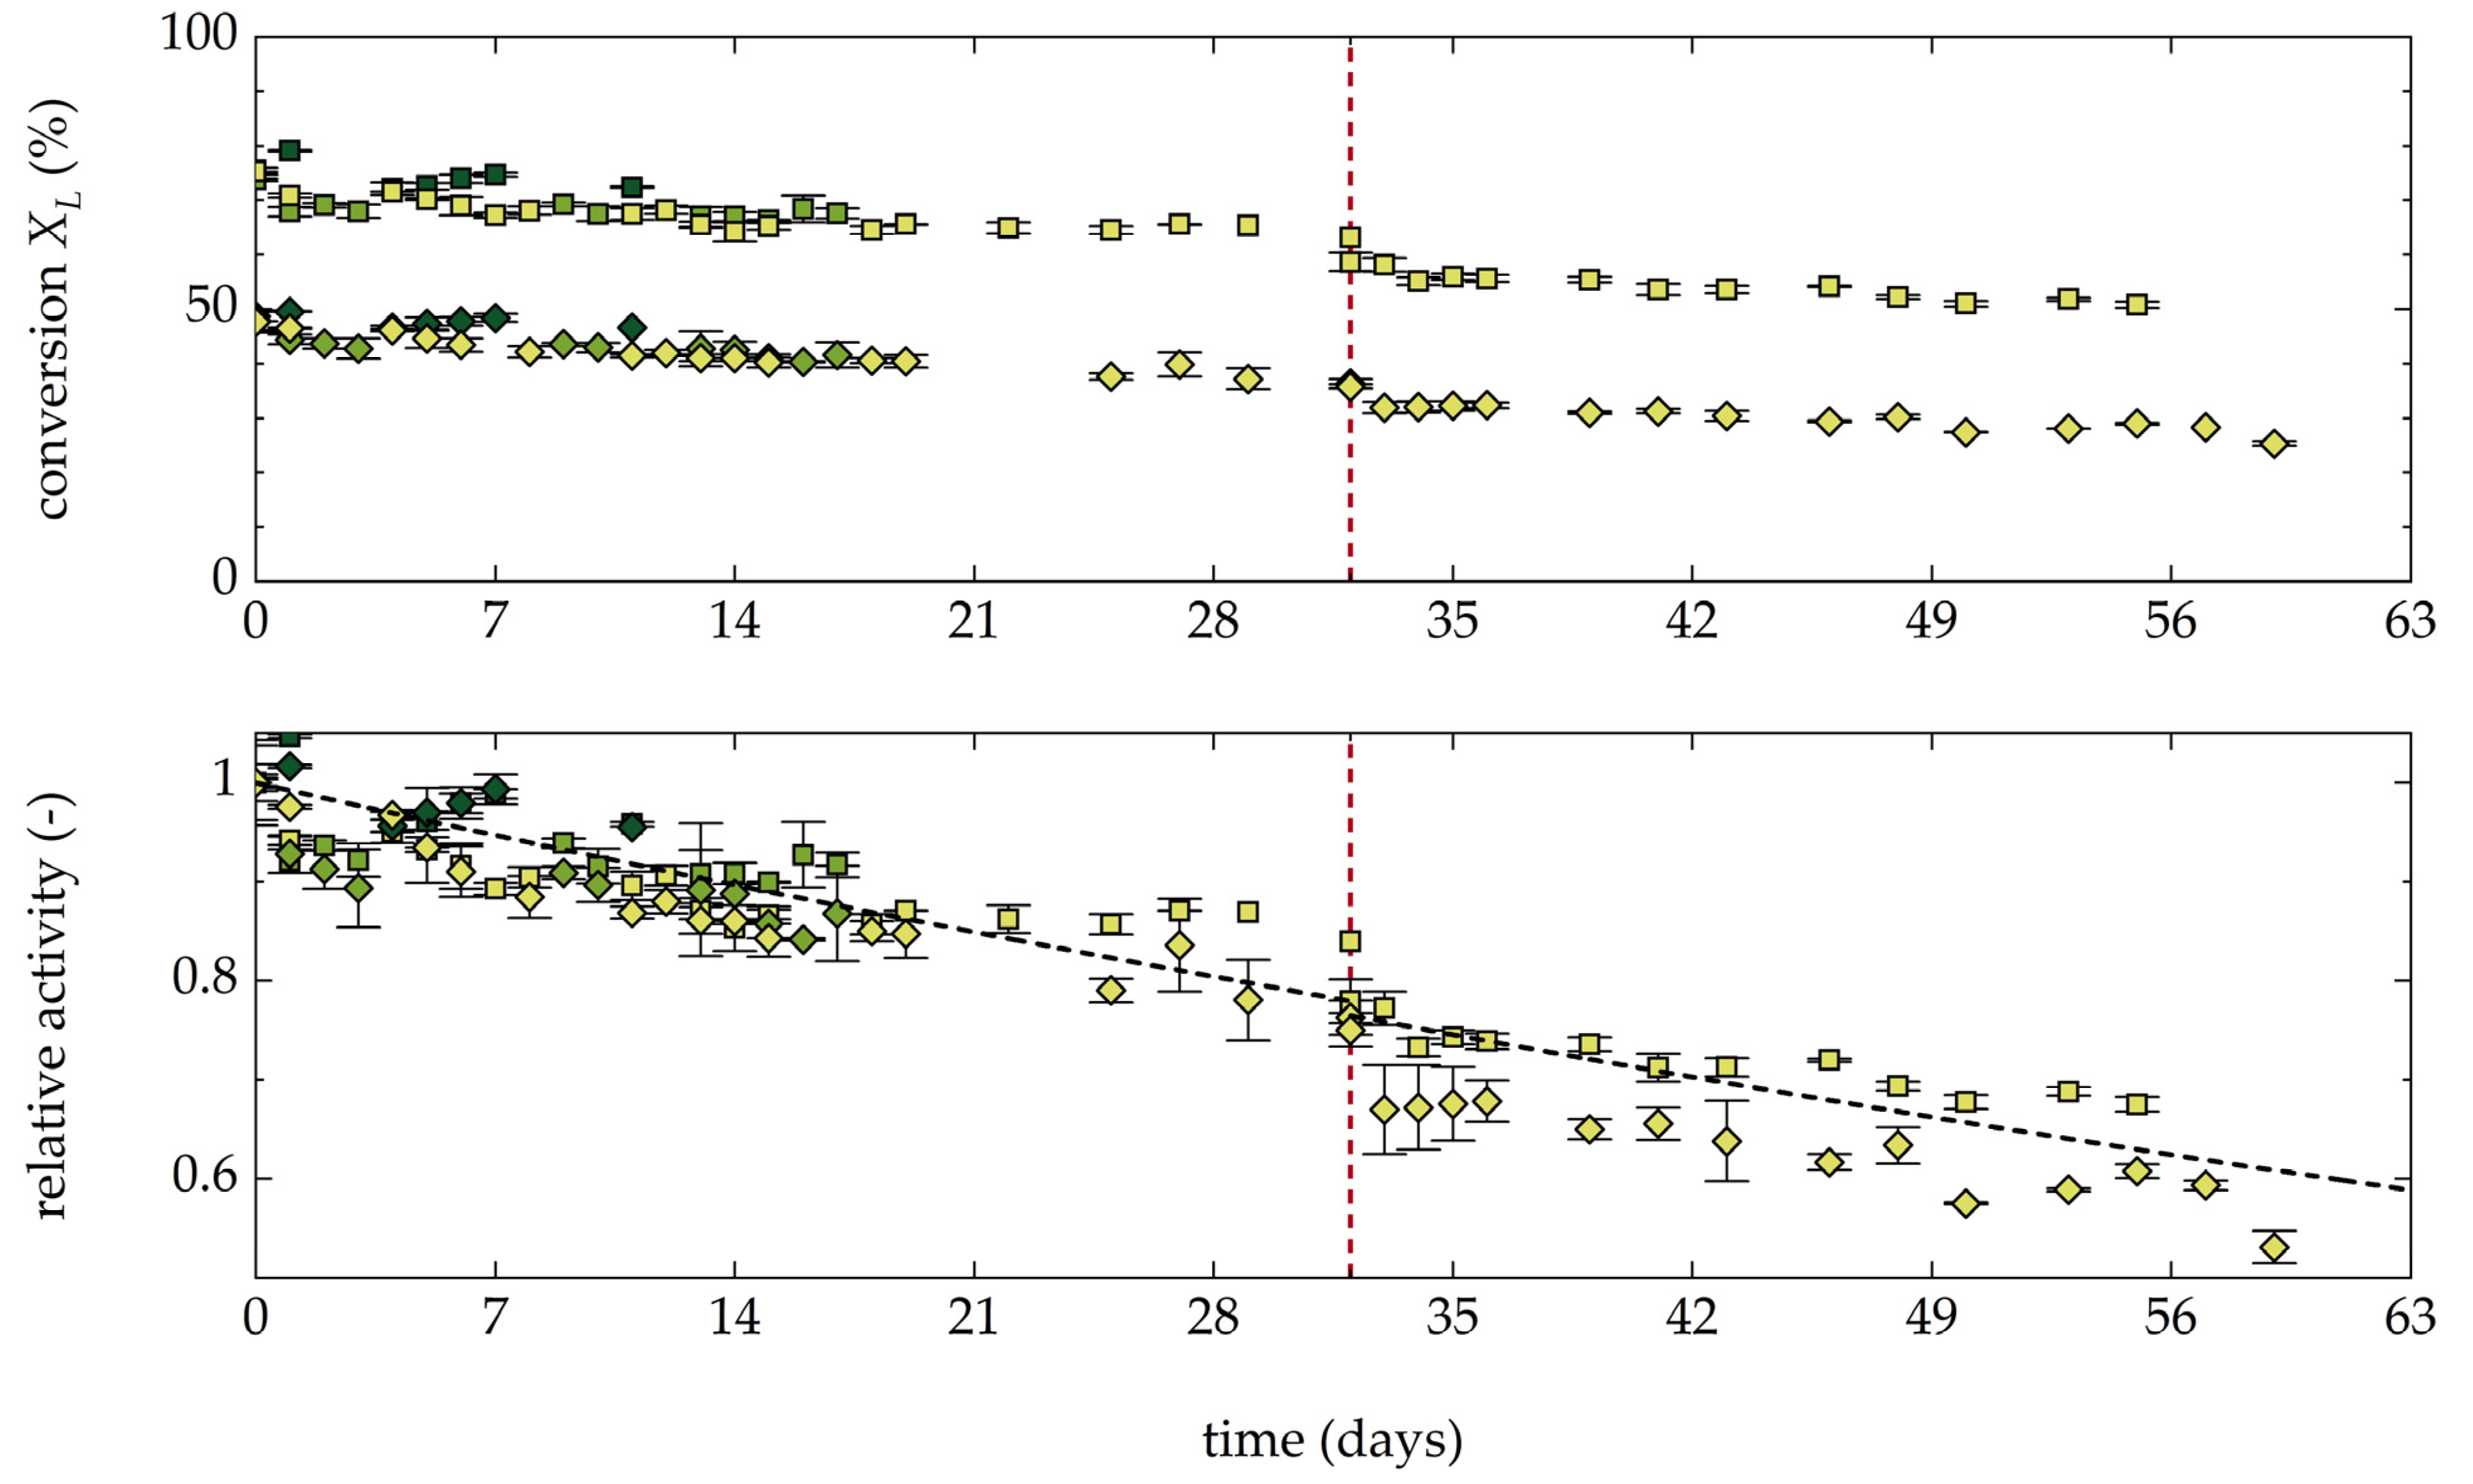
3.1.6. Stability and Productivity of the AAR under Operating Conditions

To test the storage stability of the AAR, the activity of B1 was tested after the immobilization procedure and then again after storing the packed reactor at 4 °C for almost six months. The AAR presented circa 78% of its initial activity (shown in Supplementary Materials). For an indication of the AAR performance under operating conditions, the stability of AAR in continuous flow was tested in the setup described in Section 5.4 at room temperature (RT). The experiment was repeated three times with fresh AAR and an increasing duration of the testing period (11, 17 and 59 days). In the third run, the solvent was switched from pure water to 5 vol% ethanol on day 32.
In Figure 7, the measured conversion rates of L-Met and the relative activity loss over time are shown. After an initial drop in the first 24 h, the AAR lost about 3.5% of its initial activity per week under continuous flow of pure water, resulting in a deactivation constant of kDeact = 7.8 × 10⁻³ day−1 (Equation (5)) and a remaining activity of 76% after 32 days. When switching to 5 vol% EtOH, the activity dropped by 4%, but in the following 42 days, the average activity decline remained almost the same as before (kDeact = 8.2 × 10⁻³ day−1, Equation (5)). Furthermore, after 2 weeks, the measured activity for the highest flow rate (2.5 mL/min) started to drop faster than for 1 mL/min. One explanation would be that some fouling could have occurred, which might have blocked pores of the carrier.
This experiment adds additional stability data to the observations made by Carneiro et al. 2020 [21], where the immobilized AAR was operating for two days at 40 °C, and Würges et al. 2009 [20], where the free AAR lost 90% of its activity at 35 °C within less than seven days. The observed good stability of the AAR encourages the application of the AAR in continuous production processes. Assuming that the setup used in our stability test would be used in a continuous production process with a flow rate of 1 mL/min, the substrate would elute with an average conversion of XL = 0.35. It can be estimated that, under this condition, the productivity would be approximately PR = 90 gD-Met/gcarrier/day.

3.2. Preliminary Experiments for the Chromatographic Resolution of D-/L-Met

For the design of a coupled process, the separation of aqueous solutions of D-/L-Met was realized under various operating conditions on the same CSP Chirobiotic T used for the analytics described in Section 5.6. For evaluation of the separation quality, the focus was set on the variation of the separation factor under different operating conditions. In contrast to other parameters, such as the flow rate and the operating temperature, the eluent composition strongly affects the racemization step. Therefore, the influence of a phosphate buffer and the fraction of alcohol in the eluent were tested. While the impact of the buffer was rather low (shown in the Supplementary Materials), the effect of ethanol and methanol on the separation factor was significant (Figure 8). The increasing fraction of both alcohols had similar effects. The lowest retention time of both compounds is reached at 10–20 vol% EtOH and 20 vol% MeOH, which corresponds to the Henry constants of around HL = 1.1 and HD = 1.5 for both EtOH and MeOH. For higher alcohol concentrations, the Henry constants increase again with a stronger effect on D-Met. This resulted in an overall increase of the separation factor for EtOH and MeOH from 1.2 without alcohol to 1.9 for 50 vol% EtOH and 1.7 for 50 vol% MeOH. A detailed interpretation of the observed retention times, as well as of the effect of other parameters on the process of chromatographic separation, is outside the scope of this paper. Essential results are summarized in the Supplementary Materials together with demonstrations of the effects of temperature and of the phosphate buffer on the separation.

4. Discussion: Potential Process Configurations

The high performance rate of the racemase confirms the advantage of its immobilization on Lifetech™ ECR8309. Compared with the activity of AAR as crude lyophilizate with 5 vol% MeOH reported by Würges et al. 2009 [20], the purified and immobilized AAR had an over 20 times higher conversion rate. Based on the results of kinetic study and the successful stability experiments, we discuss below the design and the racemization performance of the enzymatic fixed-bed reactor (EFBR) as a stand-alone unit or in an integrated setup.

4.1. Selection of Eluent and Reaction Temperature for the EFBR

The reaction rates at different pH values (Section 3.1.3) indicate that the racemase performs best at pH 7–8 with 20 mM NaH2PO4/Na2HPO4. The reaction rate in an unbuffered aqueous solution had almost the same reaction rate, even though the pH of a 30 g/L L-Met solution at 20 °C is 5.8. While more detailed studies would be necessary for a precise final conclusion, this indicates that the phosphate buffer itself might have a negative effect on the racemase. Similar negative effects have been reported for other enzymes [30]. However, more experiments would be necessary to closer identify this possible negative effect. Furthermore, when exposed to solutions of the basic AAs arginine and lysine with pH ≥10, the AAR was immediately destroyed (data not shown). When the pH of the AA solutions was lowered to pH 7.5, the AAR performed well and showed no signs of activity decline. These results open the option of using an unbuffered system in a range of pH 6–8.
The results from Section 3.1.3 showed that, in comparison with 10 °C, a reaction temperature of 20 °C doubled the reaction rate. A further increase to 30 °C increases the reaction rate by another 50%, but reduces the stability of the racemase. Thus, a reaction temperature of 20 °C is a good compromise, by being sufficiently high while being stable enough for the initial operating temperature in long-term operations. Later on, in contrast to the eluent composition, the reaction temperature can easily be increased during the run. Correct temperature adjustment based on the estimated temperature dependencies of the AAR in Table 1 could then be used to compensate for the deactivation (see Section 3.1.3). This way, a constant enantiomeric excess at the reactor outlet, as well as constant product quality, can be achieved. However, it needs to be accepted that this action will further increase the deactivation rate of the racemase.
Furthermore, as shown by Würges et al. 2009 [20], the AAR performs well in 5% MeOH (Section 3.1.4). The effect of 5% EtOH seems to be equally negligible. A further increase of the alcohol fraction to 10 vol% negatively impacts the reaction kinetics. This indicates that the operating solvent in the case of applying the EFBR within a process combination including enantioselective chromatography should preferably have an alcohol fraction below 10 vol% and, if possible, as low as 5 vol%.

4.2. Design Aspects for Scaling the EFBR

Similar to other processes, the objectives of productivity and purity have opposite trends. When measuring process purity as the remaining enantiomeric excess of the counter enantiomer at the exiting port, the latter one symbolizes a key parameter for this trade-off. As the enantiomeric excess is also the main driving force of the AAR, this parameter should be taken into consideration during the process design, and is thus further evaluated below.
Based on the kinetic data from batch B1 in pure water (Table 2) and the carrier dosage (Table 1), the productivity of a fresh EFBR was simulated. Its productivity is shown in Figure 9 for different scenarios. In the following, we want to discuss the different options of a total concentration of ctot = 20 g/L. When targeting a moderate conversion rate of XL = 90% for an inlet stream of cL,0 = 20 g/L (100%eeL,0), the reactor reaches a productivity of PRD-Met = 106 gD-Met/gcarrier/day. The productivity of the EFBR is proportional to the remaining enantiomeric excess at the outlet, and there is a loss in productivity when the by-product stream is contaminated with the product enantiomer. With the increasing extent of conversion at the column exit, the influence of the concentration is lowered in comparison with the impact of the outlet conversion. Moreover, in comparison with a pure by-product stream, a contamination with the target enantiomer of, e.g., cD,0 = 2 g/L (cL,0 = 18 g/L, 80%eeL) at the inlet stream only reduces the productivity by 20%. In contrast, to increase the conversion of a reactor with 100%eeL,0 from, e.g., XL = 90% to 99.8%, results in a productivity drop of 59% from PR = 106 gD-Met/gcarrier/day to 43gD-Met/gcarrier/day. This shows that the productivity of the EFBR benefits more from relaxed conversion requirements at its outlet than from higher enantiomeric excess of the by-product at the inlet of the EFBR. Yet, in a stand-alone process, a remaining enantiomeric excess lowers the process yield. However, when integrating the EFBR into a coupled process with a feedback loop, the overall process yield is no longer lowered by incomplete conversion at the reactor outlet.

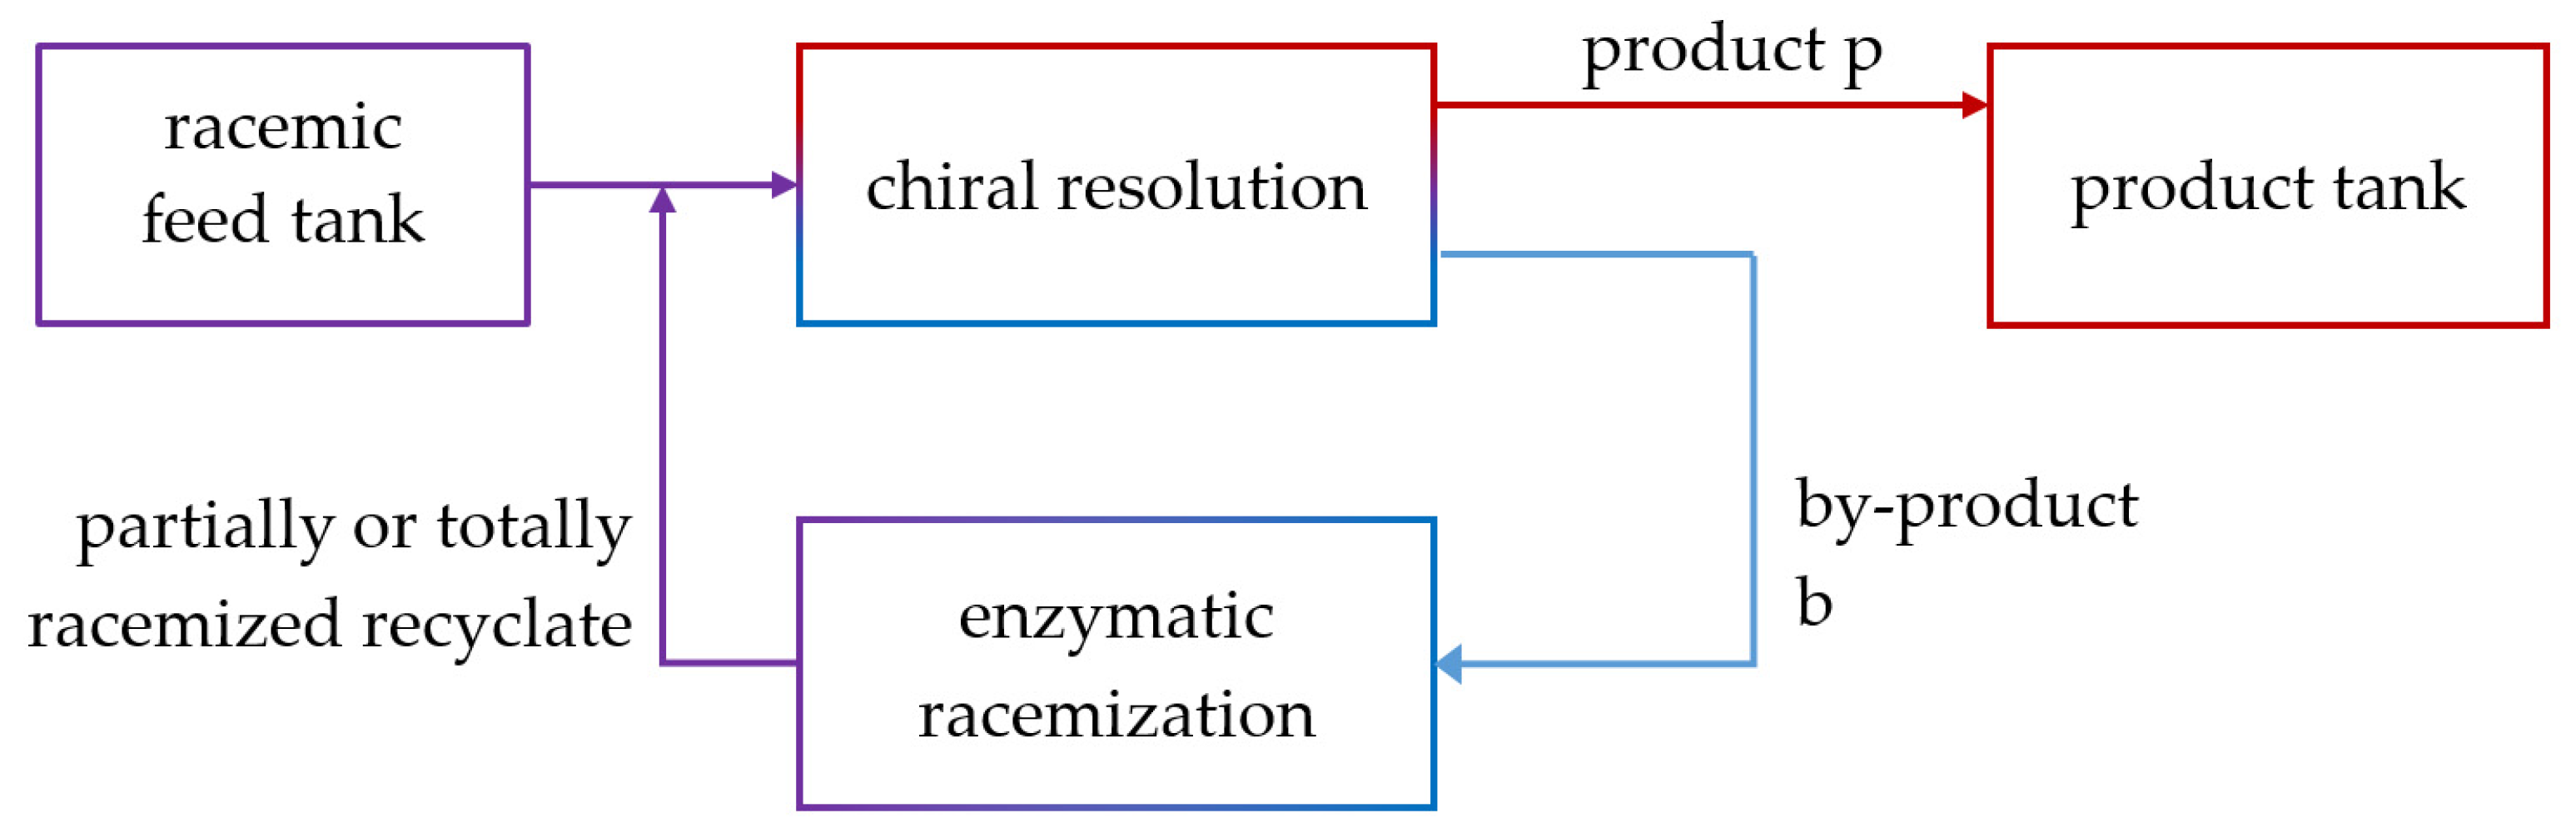
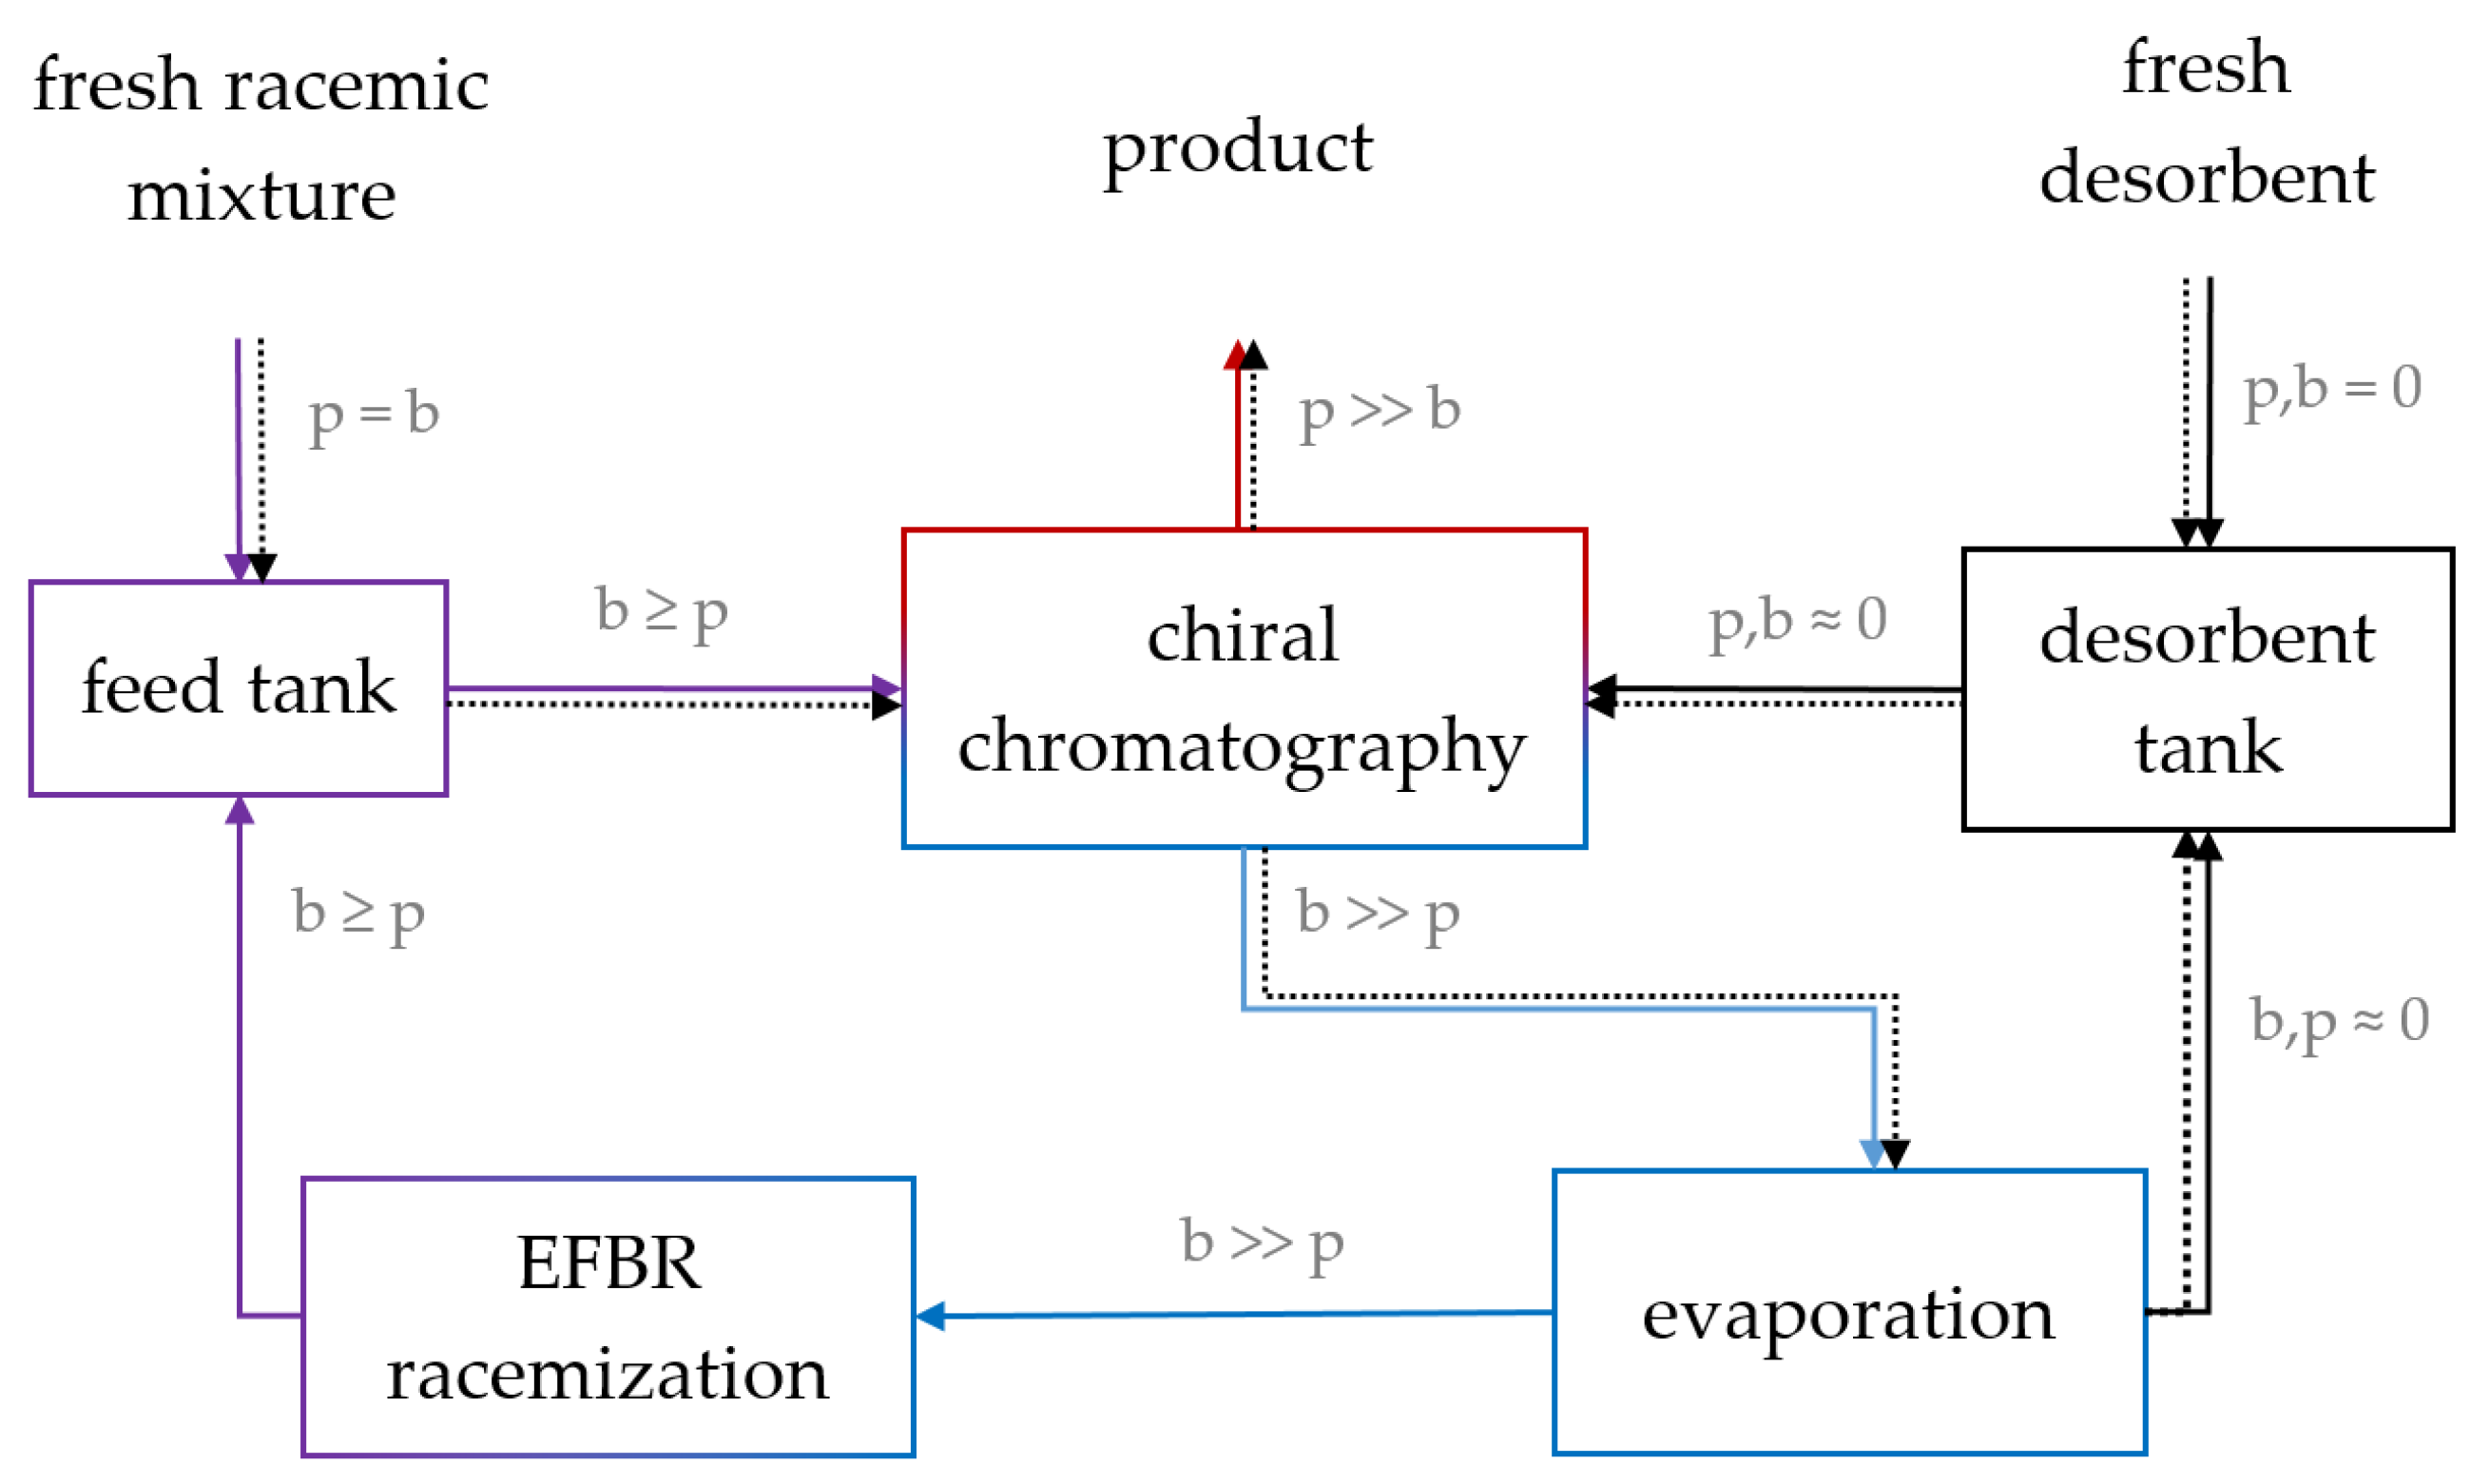
4.3. Integrated Process: Enantioselective Chromatography and Racemization

Coupling chromatographic resolution, subsequent racemization, and recycling removes limitations of both key steps and offers two significant advantages. First, the resolution step can operate with relaxed purity constraint regarding the by-product stream, which allows higher productivities. At the same time, because racemization does not need to be complete, the AAR is not required to operate at slow rates caused by low enantiomeric excesses.

4.3.1. Constraints for Process Coupling

For D-/L-Met, the conclusions from the previous section and the results from the chromatographic resolution study can now be combined to lay out the basis of an integrated process. The first requirement for an integrated process is a suitable solvent. The separation step requires an eluent with pH < 6.8. At lower pH values, the AAR seemed to perform better without phosphate buffer. Thus, the coupled system can be operated using water as solvent, which simplifies the process and, at the same time, relaxes the pH constraints.
An issue is the specification of the alcohol fraction. Section 3.2 demonstrated that the separation benefits from an alcoholic enriched eluent while the racemases activity drops. This conflict can be solved in two ways. The first option would be the coupling of the two process steps with an aqueous solvent containing, e.g., 10 vol% EtOH or MeOH [31]. In this relatively simple setup, both steps would make concessions regarding the eluent for the benefit of a relatively simple feedback loop. Furthermore, such a process requires a highly concentrated stock feed, as chromatography is strongly diluting the outlet streams, and the enzyme cannot use its full potential owing to the reduced substrate concentration.
The issue could be tackled, for example, by concentrating the recycled stream with membrane filtration and evaporation. While membrane filtration is often considered as being the more energy efficient solution, evaporation can change the solvent composition. A subsequent evaporation step at the outlet of the by-product stream would remove most of the excess alcohol because the boiling points of ethanol and methanol are below that of water (EtOH: 78.4 °C, 58.7 hPa (20 °C); MeOH: 65 °C, 129 hPa (20 °C)). In addition, the evaporation of alcohols is more energy efficient than the concentration of a solvent without alcohol. This provides the opportunity to design a process in which the chromatographic separation operates with ≥20 vol% alcohol where the separation factor is larger (Section 3.2). The recycling stream can then be sent to an evaporation unit in which the alcohol (and some water) is withdrawn, before the then concentrated stream with ≤5 vol% alcohol is injected onto the EFBR. The result would significantly enhance the performance of both units. The complete process scheme is shown in Figure 10.

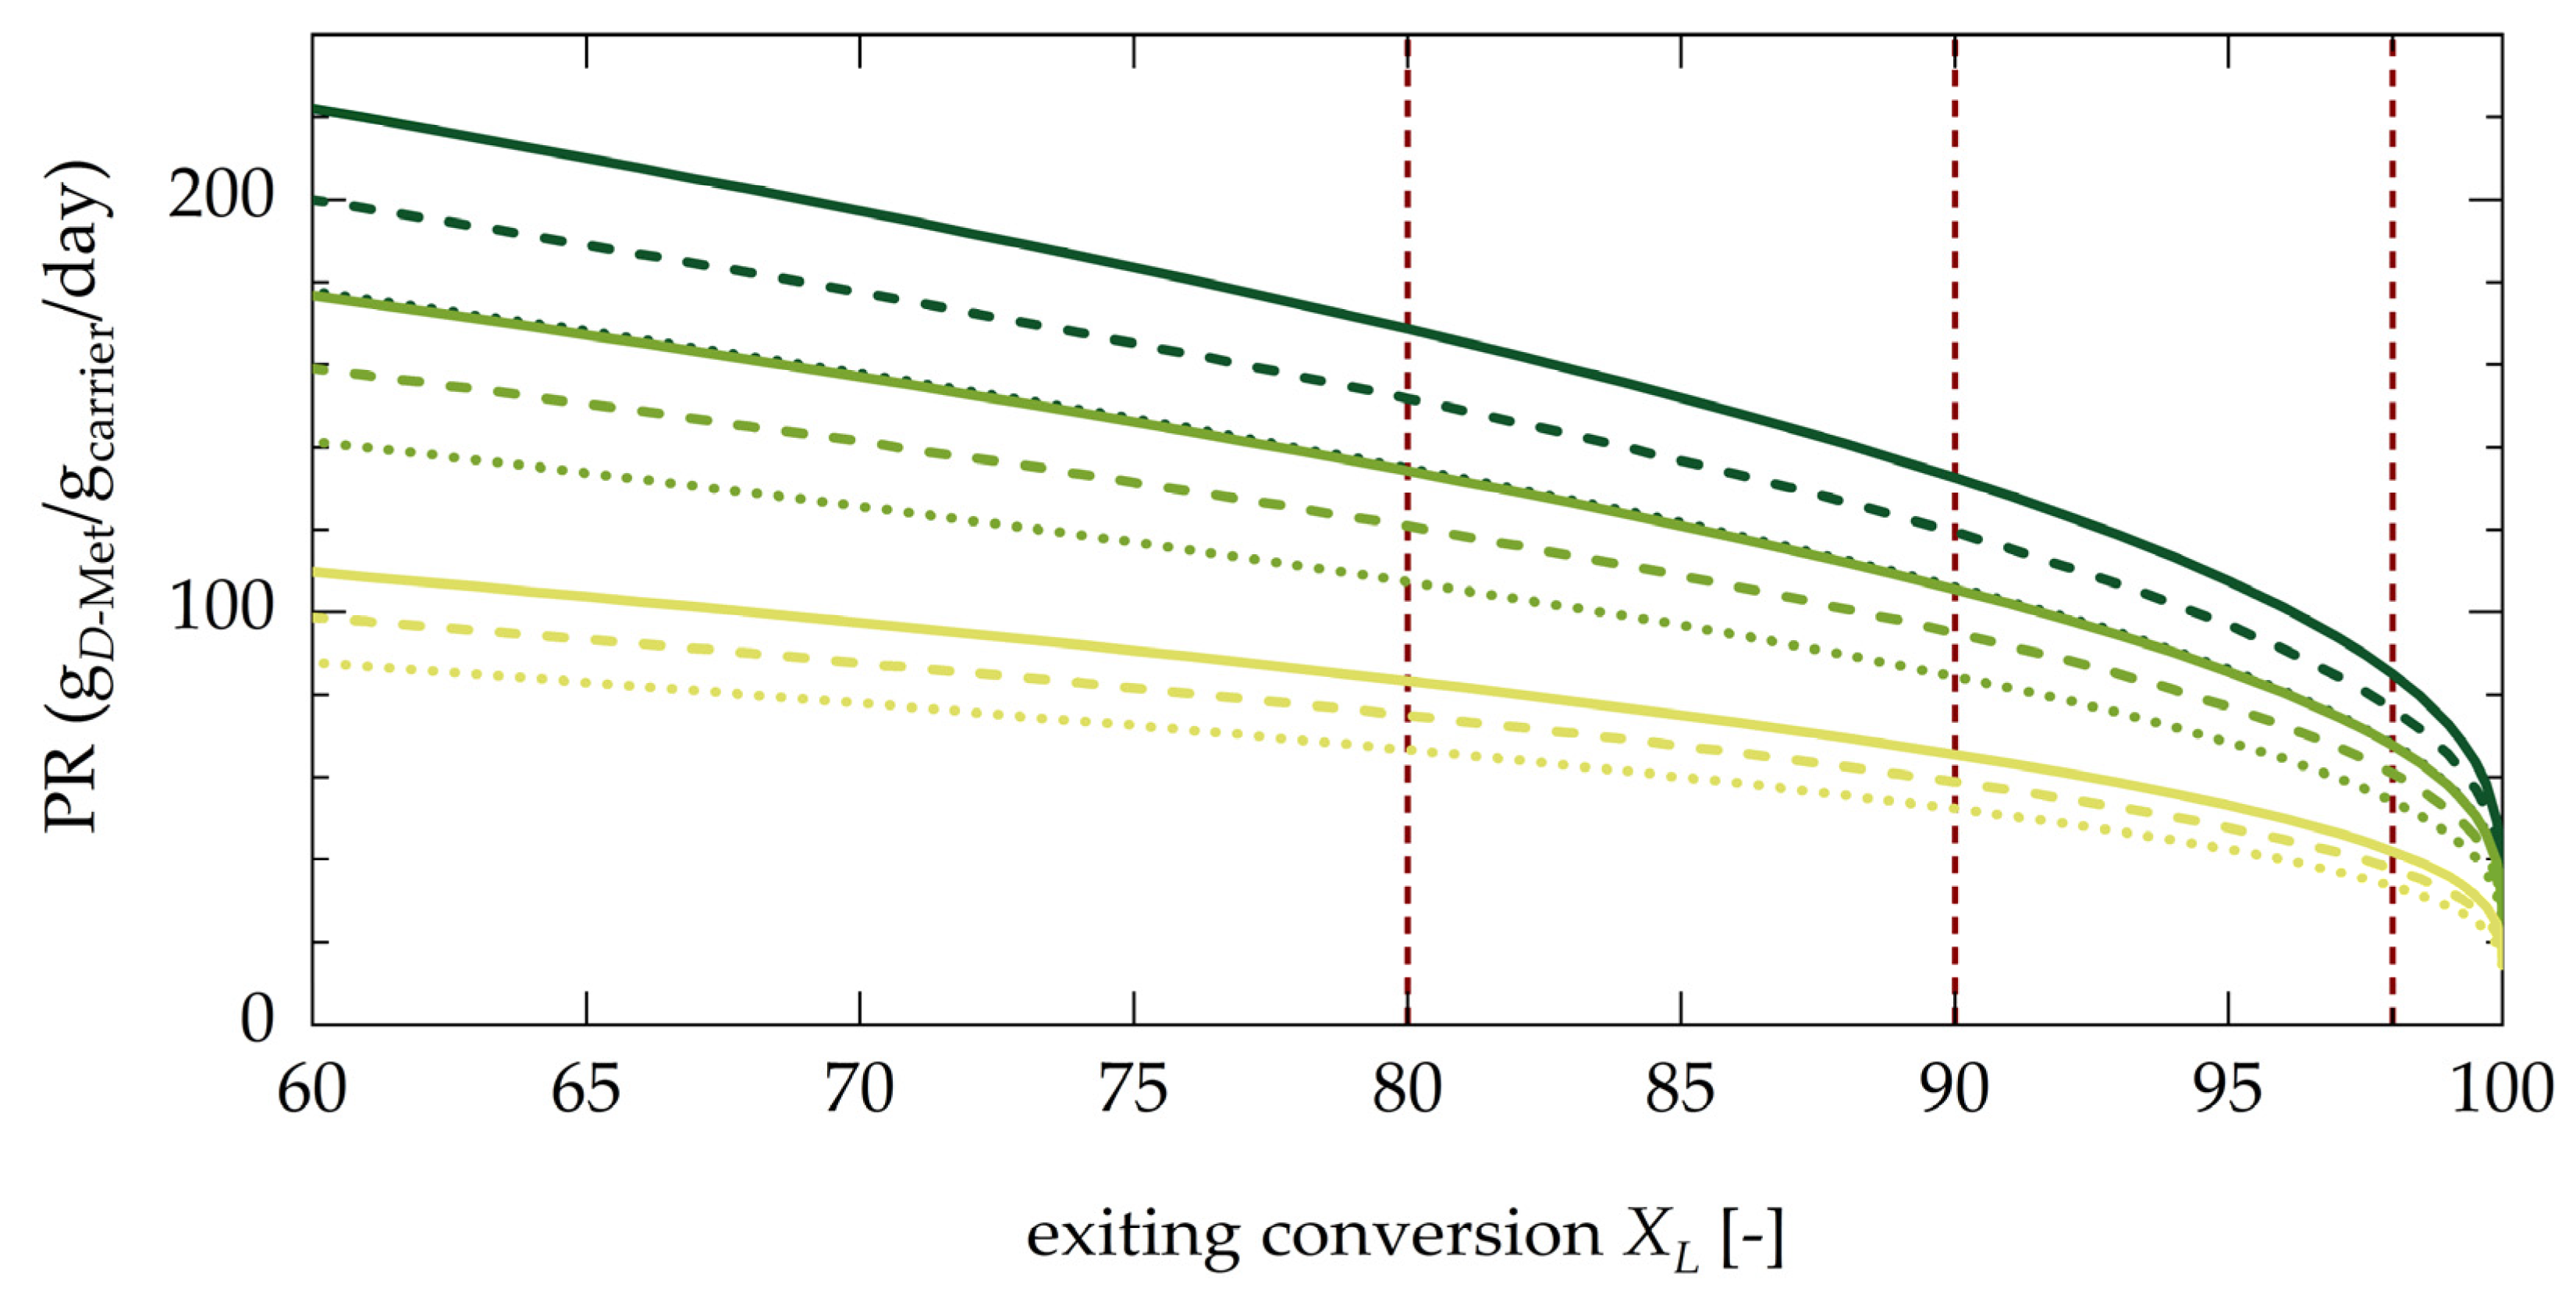
4.3.2. Evaluation of Productivity of the Coupled Process

An optimal overall process configuration cannot be developed without a detailed study of the adsorption behaviour in the chromatographic step. The optimal flow rates, concentrations, purities, %ee, and more parameters are interdependent and should be optimized for both steps simultaneously. However, a more detailed investigation of the chromatographic step is beyond the scope of this paper. Nevertheless, the productivity estimation of the EFBR presented above is useful to estimate the potential in the coupled process. In the scenario considered for illustration, the production of D-Met with a purity of 99% is evaluated, analysing the setup shown in Figure 10. It is known that, in the chromatographic step, 20 g/L DL-Met could be separated with an eeD = 99% in the product stream and an eeL = 90% in the by-product stream [8,25], which is ready to be recycled. The recycling stream can be first concentrated in a distillation column to lower the alcohol fraction to ≤5 vol% while increasing the total concentration again to ctot ≃ 20 g/L DL-Met. The solution then enters the racemization column with 90%eeL,0 and exits with a remaining eeL = 10% (XL = 88.9%). Finally, the racemized by-product stream is mixed in the feed tank with fresh racemic feed, resulting in an inlet for the chromatographic step with a concentration of 20 g/L and only 5%eeL. The flow rate of the process can be even further increased up to a maximum caused by the pressure limit in the chromatographic column step. Such a process configuration would result in a short residence time in the EFBR of τ = 0.16 min (Equation (10), Table 2) and in a productivity of the EFBR of about PREFBR = 98 gD-Met/gcarrier/day. The mass of enzyme carrier required in the case of an eluting stream of 10 mL/min would be mcarrier = 1.17 g (Equation (12)), corresponding to an enzyme amount of mAAR = 43 mgAAR. In a comparable conventional setup in which the EFBR is used as a stand-alone unit and a conversion of 99% is required, the productivity would be 58 gD-Met/gcarrier/day.
Productivity values, which have been reported in the literature for the enantioselective chromatographic resolution of DL-Met by stand-alone SMB chromatography, are PRSMB = 0.23 g/gstat.phase/day and 0.7 g/gstat.phase/day for the production of D-Met and PRSMB = 0.32 g/gstat.phase/day and 0.8 g/gstat.phase/day for L-Met by [26,27], respectively. A comparison with the value given above regarding the productivity of the EBFR shows the potential of the immobilized AAR applied and characterized in the presented work. The ratio between the masses of the carrier with immobilized AAR and the chiral stationary phase required for a successful process coupling is less than 0.01. This investment of 1% dedicated additional mass can double the overall process yield and has the potential to improve the productivity of providing the pure target enantiomer. Further, not discussed here, potential improvement can be achieved if the purity constraints of the chromatographic step are relaxed [8,25].

5. Materials and Methods

The immobilized racemase was prepared based on a protocol described by Carneiro et al. 2020 [21]. Under varying process conditions, the reaction kinetics, stability, and reproducibility were tested in a small EFBR. The analytics as well as the separation of the model enantiomers were performed on suitable chiral stationary phases.

5.1. Racemase, Immobilization Supports, and Substrates

The AAR, originating from P. putida KT 2440 DSM 6125 [32], was modified to include a His-tag to facilitate its purification [21]. The enzyme carrier was Lifetech™ ECR 8309 from Purolite®. The AAs were obtained from Sigma-Aldrich; ethanol, NaH2PO4.H2O, and Na2HPO4.2H2O from Merck; and methanol from VWR.

5.2. Enzymatic Fixed Bed Reactor (EFBR)

The racemase was produced, purified, and immobilized based on a previously described protocol [21]. All kinetic studies of the immobilized racemase were carried out in an EFBR, a 25 mm × 3 mm glass column, filled with 56 ± 2 mg carrier with immobilized racemase.

5.2.1. AAR Production, Purification, and Immobilization

The AAR (45 kDa, pI = 7.03) was produced by overexpression in E. coli BL21 (DE3) in two fermentations (batches B1 and B2). For protein purification, the cells were disrupted by high-pressure homogenization (EmulsiFlex-C5, Avestin Inc., Ottawa, Canada), followed by centrifugation (25,000× g, 4 °C, 25 min, Sartorius Sigma 3K30, Osterode, Germany). The cofactor PLP was added to a final concentration of 100 µM [33]. The His-tagged AAR was purified using a HisTrap FF crude 5 mL (GE Healthcare, Upsala, Sweden) in an Äkta system (Purifier 25, GE Healthcare, 4 °C). Afterwards, the purity of the relevant fractions was checked by SDS-gelelectrophoresis. The concentration of the purified AAR cAAR was determined at 280 nm with NanoDrop UV-Vis spectrophotometry. The pure fractions were combined and covalently immobilized onto the carrier ECR 8309F (Purolite, pore size 600–1200 A, 150–300 µm, stable pH range: 3–10) to a final loading of 37 mgAAR/gcarrier for B1 and 35 mgAAR/gcarrier for B2. The immobilized enzyme was filtrated with a crucible filter (Schott) and then stored at 4 °C. An analysis of the filtrates showed that an immobilization yield of 97% was achieved for B1 and 96% for B2. More production details are given in the Supplementary Materials.

5.2.2. Packing of the EFBR

A BenchMark Microbore column (Omnifit Labware) was packed with 56 mg loaded carrier and 25 mg of glass wool to fill the remaining column volume. A compression of the bed was achieved by gradually increasing the flow rate through the column up to 80 bar. More details are summarized in Table 6.

5.3. Determining the Rate of Racemization for the AAR

The racemase was produced, purified, and immobilized based on a previously described protocol.

5.3.1. Free AAR Activity Assay

For measuring the free enzyme activity, the solution obtained from the buffer exchange was applied onto a solution of 20 g/L L-Met with a catalyst dosage of about 0.04 mgAAR/mL. The mixture was injected into a polarimetric cell (MCP 500 Modular Circular Polarimeter, Anton Paar) and the racemization was monitored as a function of the decreasing optical rotation at 365 nm.

5.3.2. Setup for the Characterization of Immobilized AAR in an EFBR

All experiments were carried out by connecting the EFBR to a HPLC system (Agilent Technologies 1200 and 1260, Santa Clara, CA, USA). The substrate concentration was tested in the range of 10–40 g/L. For each inlet substrate solution, 4–6 residence times were investigated by a stepwise change of the flow rate in the range of 0.5–3.7 mL/min (pressure ≤ 80 bar). The highest investigated concentration was decreased for later experiments to 30 g/L to avoid crystallization in the tubing at the EFBR outlet [34]. For each rate, a sample was taken once steady state was reached. To verify the steady state, a PDR-chiral Advanced Laser Polarimeter (PDR-Separations LLC) was connected to the HPLC-System and provided online information about the racemization rate. The samples were analyzed in duplicate using HPLC (see Section 5.5). The initial reaction rates were determined by linear regression of the obtained conversion rates at each condition over their respective residence time until 10% conversion. The corresponding MM parameters were obtained from a non-linear fit to the MM equation (Equation (1)). The impact of reaction temperature, pH value, and presence of organic solvents were studied (Table 7).
Furthermore, racemization kinetics were investigated for D-Met, L-Lys, L-Arg, L-Ser, L-Gln, and L-Asn with an AA concentration of 134 mM, which is equivalent to 20 g/L D-/L-Met. Owing to their extreme basicity, the pH values of L-Lys and L-Arg solutions were lowered with HCl to pH 7.5.

5.4. Storage and Stability Tests of the AAR

The stability of the enzyme under operating conditions was tested by exposing the EFBR at room temperature, constant flow of 1.0 mL/min water, and later 5 vol% EtOH over a time of 10–60 days. The remaining activity was tested every 1–3 days by measuring the conversion rate of 10 g/L L-Met at flow rates of 1.0 and 2.5 mL/min (which correspond to residence times of 1.8 and 4.5 s) with the method described in Section 5.3.2.

5.5. Enantioselective Analytical HPLC Method

All amino acid samples but D-/L-Lys were analyzed by analytical chiral chromatography on an HPLC-system (Agilent Technologies 1260) with chiral columns. The separation conditions are summarized in Table 8. For D-/L-Lys, the progress of racemization was observed online from the change of the optical activity at 245 nm using a laser polarimeter (PDR-Chiral, Inc. Advanced Laser Polarimeter Conquer Scientific, San Diego, CA, USA).

5.6. Methods and Parameters to Quantify Enantioselective Chromatographic Resolution

For the evaluation of enantioselective chromatographic resolution in the later part of this work, standard models were used [24], which are shortly introduced here. The simplest form to describe for a component i the loading in a chromatic column (CC), qiCC, as a function of the fluid phase concentration ci, is the linear adsorption isotherm model:
q i C C = H i · c i
The Henry constants, Hi, can be determined from the retention times of the specific component, tR,i; the column dead time, t0; and the porosity of the chromatographic column, ϵFCC:
H i = t R , i / t 0 1 ( 1 ϵ F C C ) / ϵ F C C
A key parameter to quantify the quality of the separation is the separation factor for two components, αDL (Equation (15)). It can be defined as the ratio of the two Henry constants, or as the ratio of their retention times reduced by t0.
α D L = H D H L = t R , D t 0 t R , L t 0
Chromatographic systems applied for enantioseparation processes typically have a pulsed or constant inlet stream of racemic mixture from a feed tank. When correctly configured, systems have two outlet streams: one is enriched with the target enantiomer, which is in our study the D-AA, and the other one with the counter enantiomer, here the L-AA. The purities of these streams can be expressed by the enantiomeric excesses (ee) of the dominant enantiomers.
For the purpose of this work, we considered mainly the chromatographic resolution of D-/L-Met using an analytical scale Chirobiotic T column (Astec, 250 × 4.6 mm, ϵFCC = 0.6, Vtotal = 4.2 mL) applied within a standard HPLC-system (Agilent Technologies 1260). The mobile phase was an aqueous solution with varying compositions of methanol, ethanol, and phosphate buffer. The effect for the co-solvents was studied for small injection masses (minj = 10 µg) for which the adsorption was in the linear range. The retention times of both enantiomers, tR,i, were determined and the separation quality was evaluated based on the separation factor (Equation (15)).

6. Conclusions

The application of racemases to improve enantioselective separation processes is still an overlooked option. In this work, the wide applicability and high stability of an immobilized amino acid racemase is shown. Immobilized AAR was studied regarding its activity for racemizing L- and D-Met. The highest activity at 20 °C was achieved in a solvent with 20 mM phosphate buffer at pH 7 and 8 as well as in an unbuffered eluent of pure water and methionine at pH 5.8. While 5 vol% had no significant effect on the activity, an addition of 10 vol% alcohol resulted in an activity loss of almost 20–30%. Furthermore, significant AAR activities were confirmed for L-Lys and L-Arg in a solution of pH 7.5 and for L-Gln, L-Ser, and L-Asn in 100% water.
An encouraging result for further application of enzymatic fixed-bed reactors (EFBRs) as a process intensification tool in coupled processes is the observed high stability of immobilized racemase in comparison with free enzymes. After operating for one month in water with a flow rate of 1 mL/min and room temperature, the AAR had a remaining activity of 80%. Therefore, corresponding EFBR can easily be integrated into an enantio-separation process of a range of different amino acids, when the separation is performed in a water-based non-toxic solvent. By integrating an evaporation step, the coupling with alcohol-containing solvents is also possible. Then, the process can be operated with higher substrate concentrations.
It can finally be concluded that an integration of immobilized AAR into chiral resolution processes has large potential to increase the overall performance of providing enantiopure amino acids. The conceptional findings can be extended to other chiral target molecules and other racemases.

Supplementary Materials

The following are available online at https://www.mdpi.com/article/10.3390/catal11060726/s1, Figure S1: Conversion rates of the AAR for pure L-Met from Batch B1. Figure S2: The MM coefficients rmax and KM at different reaction. Figure S3: Activity of the immob. AAR directly after immobilization (dark green) and after 178 days of storage of the moist immob. carrier at 4 °C. Figure S4: Effect of MeOH content, pH, and temperature on the separation factor.

Author Contributions

Data curation, I.H.; Formal analysis, I.H. and J.B.; Investigation, I.H. and J.B.; Methodology, I.H., T.C. and K.B.; Project administration, I.H. and A.S.-M.; Resources, K.B. and A.S.-M.; Software, I.H.; Supervision, K.B. and A.S.-M.; Validation, I.H. and A.S.-M.; Visualization, I.H.; Writing—original draft, I.H. and J.B.; Writing—review & editing, T.C., K.B. and A.S.-M. All authors have read and agreed to the published version of the manuscript.

Funding

This research received no external funding.

Data Availability Statement

The data presented in this study are available in the manuscript and Supplementary Material.

Acknowledgments

The authors thank Andrea Schütze, Claudia Bednarz, and Jacqueline Kaufmann for the technical assistance and Heike Lorenz and Katarzyna Wrzosek for fruitful discussions. The provision of enzyme carrier Lifetech™ ECR 8309 from Purolite® is gratefully acknowledged.

Conflicts of Interest

The authors declare no conflict of interest.

References

  1. Jacques, J.; Collet, A.; Wilen, S.H. Enantiomers, Racemates, and Resolutions; Wiley: Hoboken, NJ, USA, 1981. [Google Scholar]
  2. Lorenz, H.; Seidel-Morgenstern, A. Processes to separate enantiomers. Angew. Chem. Int. Ed. 2014, 53, 1218–1250. [Google Scholar] [CrossRef]
  3. Kaspereit, M.; Sainio, T. Simplified design of steady-state recycling chromatography under ideal and nonideal conditions. Chem. Eng. Sci. 2011, 66, 5428–5438. [Google Scholar] [CrossRef]
  4. Swernath, S.; Kaspereit, M.; Kienle, A. Coupled continuous chromatography and racemization processes for the production of pure enantiomers. Chem. Eng. Technol. 2014, 37, 643–651. [Google Scholar] [CrossRef]
  5. Huerta, F.F.; Minidis, A.B.E.; Bäckvall, J.-E. Racemisation in asymmetric synthesis. Dynamic kinetic resolution and related processes in enzyme and metal catalysis. Chem. Soc. Rev. 2001, 30, 321–331. [Google Scholar] [CrossRef]
  6. Martín-Matute, B.; Bäckvall, J.-E. Dynamic kinetic resolution catalyzed by enzymes and metals. Curr. Opin. Chem. Biol. 2007, 11, 226–232. [Google Scholar] [CrossRef] [PubMed]
  7. Von Langermann, J.; Kaspereit, M.; Shakeri, M.; Lorenz, H.; Hedberg, M.; Jones, M.J.; Larson, K.; Herschend, B.; Arnell, R.; Temmel, E.; et al. Design of an integrated process of chromatography, crystallization and racemization for the resolution of 2, 6-pipecoloxylidide (PPX). Org. Process Res. Dev. 2012, 16, 343–352. [Google Scholar] [CrossRef]
  8. Fuereder, M.; Femmer, C.; Storti, G.; Panke, S.; Bechtold, M. Integration of simulated moving bed chromatography and enzymatic racemization for the production of single enantiomers. Chem. Eng. Sci. 2016, 152, 649–662. [Google Scholar] [CrossRef] [Green Version]
  9. Femmer, C.; Bechtold, M.; Roberts, T.M.; Panke, S. Exploiting racemases. Appl. Microbiol. Biotechnol. 2016, 100, 7423–7436. [Google Scholar] [CrossRef]
  10. Hashimoto, K.; Adachi, S.; Noujima, H.; Ueda, Y. A new process combining adsorption and enzyme reaction for producing higher-fructose syrup. Biotechnol. Bioeng. 1983, 25, 2371–2393. [Google Scholar] [CrossRef]
  11. Panke, S.; Held, M.; Wubbolts, M. Trends and innovations in industrial biocatalysis for the production of fine chemicals. Curr. Opin. Biotechnol. 2004, 15, 272–279. [Google Scholar] [CrossRef]
  12. Schmid, A.; Dordick, J.S.; Hauer, B.; Kiener, A. Industrial biocatalysis today and tomorrow. Nature 2001, 409, 258. [Google Scholar] [CrossRef]
  13. Xu, X.; Balchen, S.; Høy, C.-E.; Adler-Nissen, J. Production of specific-structured lipids by enzymatic interesterification in a pilot continuous enzyme bed reactor. J. Am. Oil Chem. Soc. 1998, 75, 1573–1579. [Google Scholar] [CrossRef]
  14. Klibanov, A.M. Enzyme stabilization by immobilization. Anal. Biochem. 1979, 93, 1–25. [Google Scholar] [CrossRef]
  15. Sheldon, R.A. Enzyme immobilization: The quest for optimum performance. Adv. Synth. Catal. 2007, 349, 1289–1307. [Google Scholar] [CrossRef]
  16. Zdarta, J.; Meyer, A.S.; Jesionowski, T.; Pinelo, M. A general overview of support materials for enzyme immobilization: Characteristics, properties, practical utility. Catalysts 2018, 8, 92. [Google Scholar] [CrossRef] [Green Version]
  17. Mateo, C.; Palomo, J.M.; Fernandez-Lorente, G.; Guisan, J.M.; Fernandez-Lafuente, R. Improvement of enzyme activity, stability and selectivity via immobilization techniques. Enzym. Microb. Technol. 2007, 40, 1451–1463. [Google Scholar] [CrossRef]
  18. Bechtold, M.; Makart, S.; Reiss, R.; Alder, P.; Panke, S. Model-based characterization of an amino acid racemase from Pseudomonas putida DSM 3263 for application in medium-constrained continuous processes. Biotechnol. Bioeng. 2007, 98, 812–824. [Google Scholar] [CrossRef] [PubMed]
  19. Radkov, A.D.; Moe, L.A. Amino acid racemization in Pseudomonas putida KT2440. J. Bacteriol. 2013, 195, 5016–5024. [Google Scholar] [CrossRef] [Green Version]
  20. Würges, K.; Petrusevska, K.; Serci, S.; Wilhelm, S.; Wandrey, C.; Seidel-Morgenstern, A.; Elsner, M.P.; Lütz, S. Enzyme-assisted physicochemical enantioseparation processes: Part I. Production and characterization of a recombinant amino acid racemase. J. Mol. Catal. B Enzym. 2009, 58, 10–16. [Google Scholar] [CrossRef]
  21. Carneiro, T.; Wrzosek, K.; Bettenbrock, K.; Lorenz, H.; Seidel-Morgenstern, A. Immobilization of an amino acid racemase for application in crystallization-based chiral resolutions of asparagine monohydrate. Eng. Life Sci. 2020, 20, 550–561. [Google Scholar] [CrossRef] [PubMed]
  22. Intaraboonrod, K.; Harriehausen, I.; Carneiro, T.; Seidel-Morgenstern, A.; Lorenz, H.; Flood, A. Temperature Cycling Induced Deracemization of DL-Asparagine with Immobilized Amino Acid Racemase. Cryst. Growth Des. 2020, 2020. [Google Scholar] [CrossRef]
  23. Palacios, J.G.; Kaspereit, M.; Kienle, A. Conceptual Design of Integrated Chromatographic Processes for the Production of Single (Stereo-) Isomers. Chem. Eng. Technol. Ind. Chem. Plant Equip. Process Eng. Biotechnol. 2009, 32, 1392–1402. [Google Scholar] [CrossRef]
  24. Schmidt-Traub, H.; Schulte, M.; Seidel-Morgenstern, A. Preparative Chromatography: Of Fine Chemicals and Pharmaceutical Agents, 3rd ed.; Wiley-VCH Verlag GmbH & Co. KGaA: Weinheim, Germany, 2020. [Google Scholar]
  25. Harriehausen, I.; Wrzosek, K.; Lorenz, H.; Seidel-Morgenstern, A. Assessment of process configurations to combine enantioselective chromatography with enzymatic racemization. Adsorption 2020, 26, 1199–1213. [Google Scholar] [CrossRef]
  26. Zhang, L.; Gedicke, K.; Kuznetsov, M.A.; Staroverov, S.M.; Seidel-Morgenstern, A. Application of an eremomycin-chiral stationary phase for the separation of dl-methionine using simulated moving bed technology. J. Chromatogr. A 2007, 1162, 90–96. [Google Scholar] [CrossRef]
  27. Fuereder, M.; Panke, S.; Bechtold, M. Simulated moving bed enantioseparation of amino acids employing memory effect-constrained chromatography columns. J. Chromatogr. A 2012, 1236, 123–131. [Google Scholar] [CrossRef] [PubMed]
  28. Briggs, G.E.; Haldane, J.B.S. A Note on the Kinetics of Enzyme Action. Biochem. J. 1925, 19, 338–339. [Google Scholar] [CrossRef] [Green Version]
  29. Moulijn, J.A.; van Diepen, A.E.; Kapteijn, F. Catalyst deactivation: Is it predictable?: What to do? Appl. Catal. General 2001, 212, 3–16. [Google Scholar] [CrossRef]
  30. Zaak, H.; Fernandez-Lopez, L.; Velasco-Lozano, S.; Alcaraz-Fructuoso, M.T.; Sassi, M.; Lopez-Gallego, F.; Fernandez-Lafuente, R. Effect of high salt concentrations on the stability of immobilized lipases: Dramatic deleterious effects of phosphate anions. Process Biochem. 2017, 62, 128–134. [Google Scholar] [CrossRef]
  31. Wrzosek, K.; Harriehausen, I.; Seidel-Morgenstern, A. Combination of Enantioselective Preparative Chromatography and Racemization: Experimental Demonstration and Model-Based Process Optimization. Org. Process Res. Dev. 2018, 22, 1761–1771. [Google Scholar] [CrossRef]
  32. Nelson, K.E. The complete genome sequence of Pseudomonas putida KT2440 is finally available. Environ. Microbiol. 2002, 4, 777–778. [Google Scholar] [CrossRef]
  33. Eliot, A.C.; Kirsch, J.F. Pyridoxal phosphate enzymes: Mechanistic, structural, and evolutionary considerations. Annu. Rev. Biochem. 2004, 73, 383–415. [Google Scholar] [CrossRef] [PubMed] [Green Version]
  34. Polenske, D.; Lorenz, H. Solubility and metastable zone width of the methionine enantiomers and their mixtures in water. J. Chem. Eng. Data 2009, 54, 2277–2280. [Google Scholar] [CrossRef]
Figure 1. Principle of an integrated process including a chiral resolution step to provide the target enantiomer (product p) and enzymatic racemization of the by-product b followed by recycling the reactor effluent back to the chiral resolution step (recycling into the feed tank is also an option).
Catalysts 11 00726 g001
Figure 2. Initial reaction rates (determined after 10% conversion) with respect to the amount of (a) the AAR and (b) the immobilization carrier for both batches B1 (grey cross) and B2 (black circle) for L-Met in pure water at 20 °C. The three green triangles represent the values of three individual column with carrier from B2, which were packed within a time span of three weeks (day 1: dark green, day 9: medium green, day 24: light green).
Catalysts 11 00726 g002
Figure 3. (a) Reaction rates at three reaction temperatures (10 °C: light green; 20 °C: medium green; 30 °C: dark green) for L-Met at pH 7 (reference in pure water without buffer at 20 °C: --). (b) Average activity in dependence of reaction temperature normalized to the reaction rate without buffer at 20 °C (--). (c) Reaction rates for different pH values of the solution (pH 6: dark green; pH 7: medium green; pH 8: light green) for L-Met (reference without buffer at 20 °C: --). (d) Average activity in dependence of the pH value normalized to the reaction rate without buffer at 20 °C (--).
Catalysts 11 00726 g003
Figure 4. (a) Reaction rates for L-Met with 5 and 10 vol% ethanol or methanol in the solvent in reference to the reaction rates without alcohol. Batch 1: solid dots, batch 2: hollow dots. Ethanol: solid lines, methanol: dotted lines. 0 vol%: red, 5 vol%: light green, 10 vol%: dark green. (b) Average activities for 5 and 10 vol% EtOH (solid) and MeOH (hatched) normalized to the activity of the respective batch without alcohol.
Catalysts 11 00726 g004
Figure 5. (a) Reaction rates for D-Met (light green) in comparison with L-Met (dark green) from batch B1 (solid line) and B2 (dashed line) in pure water at 20 °C. (b) Relative activity of other L-amino acids normalized to the activity of L-Met (red dotted line).
Catalysts 11 00726 g005
Figure 6. Conversion rates for different L-amino acids at 0.134 M in comparison with L-Met (solid red line): L-Lys (square), L-Arg (circle), L- Gln (upwards triangle), L-Ser (downwards triangle), and L-Asn (diamond).
Catalysts 11 00726 g006
Figure 7. Activity decline of the AAR in an EFBR at room temperature with a constant throughput of 1 mL/min water. The experiment was repeated three times (run 1: 11 days (dark green), run 2: 17 days (medium green); run 3: 59 days (light green)). For the third run, 5 vol% EtOH was added to the eluent from day 32 onwards. The activity was measured with 10 g/L L-Met pumped through the column with a residence time of 0.076 min (1 mL/min, squares) and 0.03 min (2.5 mL/min, diamonds) and the conversions were determined at the column outlet.
Catalysts 11 00726 g007
Figure 8. Effect of EtOH (solid line) and MeOH (dashed line) on the Henry constants of the adsorption isotherms on the chiral stationary phase (CSP) for the two methionine enantiomers (HL = black, HD = grey) and the separation factor as the ratio of the Henry constants (red) at 20 °C.
Catalysts 11 00726 g008
Figure 9. Productivity PRD-Met of racemization reaction with the AAR for different total concentrations ctot: 30 g/L (dark green), 20 g/L (medium green), and 10 g/L (light green)), and varying initial (entering) enantiomeric excess at the EFBR inlet eeL,0 (100% (−), 90% (- -), 80% (∙∙∙)) as a function of the conversion exiting the reactor XL,target.
Catalysts 11 00726 g009
Figure 10. Process scheme of an integrated process including the chiral separation by chromatography, enzymatic racemization of the counter enantiomer in the EFBR, and solvent removal (SR) by evaporation for a concentration of the by-product stream. The solvents containing EtOH or MeOH are presented by additional dashed arrows.
Catalysts 11 00726 g010
Table 1. Experimental data of enzyme activity tests for free and immobilized amino acid racemase (AAR) on ECF 8309F (56 mgcarrier filled in the enzymatic fixed-bed reactor (EFBR)). All reactions were performed at 30 °C and with feed solutions of 20 g/L of L-Met.
CharacteristicsFree AARImmob. AARImmob. AAR
BatchB2B2B1
Loading qAAR [mgAAR/gcarrier]-3537
Dosage [mgAAR/mL]0.03925.627.1
Reactor volume [mL]30.0920.092
Temperature [°C]302030
Reaction rate [U/mgAAR]13929.848
Table 2. Kinetic parameters of immobilized amino acid racemase (AAR) from two batches in pure water for L-Met, Equation (1).
BatchKM
[mM]
rmax
[U/gcarrier]
rmax
[U/mgAAR]
rmax/KM
[U/mM/gcarrier]
rmax/KM
[U/mM/mgAAR]
B1211 ± 223236 ± 18187 ± 515.30.41
B2151 ± 72235 ± 5464 ± 214.80.42
Table 3. Immobilized AAR kinetics in dependence of pH and temperature.
BufferpH
[-]
Temp.
[°C]
KM
[mM]
rmax
[U/gcarrier]
rmax/KM
[U/mM/gcarrier]
-5.8 220211 ± 223236 ± 19015.30
20 mM 1710300 ± 562376 ± 2707.92
20 mM 1720190 ± 223140 ± 20016.50
20 mM 1730161 ± 373775 ± 40023.50
20 mM 1620402 ± 1653599 ± 9808.95
20 mM 1820250 ± 303553 ± 24014.20
1 Buffer: NaH2PO4/Na2HPO4; 2 for 30 g/L L-Met.
Table 4. Parameters of Equations (3) and (4) modelling the temperature dependence of the Michaelis–Menten (MM) coefficients given in Table 3.
rmax (T)KM (T)
A [U/gcarrier]EA [kJ/mol]A0 [mM]A1 [mM]A2 [1/K]
2.72 × 10616.6150.63.7 × 10187.5
Table 5. Kinetic parameters of immobilized AAR for D-Met of B1 and B2 at 20 °C in pure water, Equation (1).
BatchKM
[mM]
rmax
[U/gcarrier]
rmax
[U/mgAAR]
rmax/KM
[U/mM/gcarrier]
rmax/KM
[U/mM/mgAAR]
B1186 ± 192757 ± 14075 ± 414.80.40
B2104 ± 31617 ± 2046 ± 115.50.44
Table 6. Properties of fixed-beds (from two batches of immobilized AAR, B1 and B2).
PropertySymbolSize
Bed height L R 13.0 ± 0.5 mm
Column diameter d R 3 mm
Bed volume V R 0.092 ± 0.004 mL
Mass of carrier m c 56 ± 2 mg
Loading q A A R B1: 37 mgAAR/gcarrier; B2: 35 mgAAR/gcarrier
Porosity ϵ F 0.83 ± 0.05
Dosage D c a r r i e r 732 ± 25 mgcarrier/mL
Table 7. Experimental conditions for testing the immobilized AAR.
Operating ParameterRange
Flow rate0.5–3.7 mL/min
Temperature10–30 °C
pH range6–8
Buffer and salt20 mM NaH2PO4/Na2HPO4
Ethanol+20 mM NaCl
Methanol0–10 vol%
Table 8. Separation conditions of the tested AAs for the analysis of the racemization samples.
DL-AAColumnEluentTemp.
[°C]
Wavelength
[nm]
ArgChirob. T 120 mM AAc 3, pH 4.1: MeOH (50:50)23205
AsnChirex 2Perchloric acid, pH 14210
GlnChirob. T 10.1 mM NaH2PO4: H2O (60:40)25220
MetChirob. T 1MeOH:H2O (60:40)25220
SerChirob. T 1EtOH:H2O (70:30)20210
1 Chirobiotic T, Astec, 250 mm × 4.6 mm, 5 µm, 2 Phenomenex, 250 mm × 4.6 mm, 5 µm, 3 Ammonium acetate.
Publisher’s Note: MDPI stays neutral with regard to jurisdictional claims in published maps and institutional affiliations.

