Article

Bio-DEE Synthesis and Dehydrogenation Coupling of Bio-Ethanol to Bio-Butanol over Multicomponent Mixed Metal Oxide Catalysts

1
Institute of Physical Chemistry Polish Academy of Science, 01-224 Warsaw, Poland
2
Jerzy Haber Institute of Catalysis and Surface Chemistry PAS, Niezapominajek 8, 30-239 Krakow, Poland
3
Leibniz-Institut für Katalyse e.V. (LIKAT Rostock), Albert-Einstein-Str. 29a, 18059 Rostock, Germany
4
Department of Biopharmacy, Medical University of Lublin, Chodzki 4a, 20-093 Lublin, Poland
5
Department of Genetics and Microbiology, Maria Curie-Skłodowska University, Akademicka 19, 20-033 Lublin, Poland
6
Chemeko-System SP. z o.o, 54-519 Wroclaw, Poland
*
Author to whom correspondence should be addressed.
Catalysts 2021, 11(6), 660; https://doi.org/10.3390/catal11060660
Submission received: 30 April 2021 / Revised: 19 May 2021 / Accepted: 19 May 2021 / Published: 22 May 2021
(This article belongs to the Special Issue Catalysis in Biomass Valorization)

Abstract

:
Within the Waste2Fuel project, innovative, high-performance, and cost-effective fuel production methods from municipal solid wastes (MSWs) are sought for application as energy carriers or direct drop-in fuels/chemicals in the near-future low-carbon power generation systems and internal combustion engines. Among the studied energy vectors, C1-C2 alcohols and ethers are mainly addressed. This study presents a potential bio-derived ethanol oxidative coupling in the gas phase in multicomponent systems derived from hydrotalcite-containing precursors. The reaction of alcohol coupling to ethers has great importance due to their uses in different fields. The samples have been synthesized by the co-precipitation method via layered double hydroxide (LDH) material synthesis, with a controlled pH, where the M(II)/M(III) ≈ 0.35. The chemical composition and topology of the sample surface play essential roles in catalyst activity and product distribution. The multiple redox couples Ni2+/Ni3+, Cr2+/Cr3+, Mn2+/Mn3+, and the oxygen-vacant sites were considered as the main active sites. The introduction of Cr (Cr3+/Cr4+) and Mn (Mn3+/Mn4+) into the crystal lattice could enhance the number of oxygen vacancies and affect the acid/base properties of derived mixed oxides, which are considered as crucial parameters for process selectivity towards bio-DEE and bio-butanol, preventing long CH chain formation and coke deposition at the same time.

Graphical Abstract

1. Introduction

Thirty years ago, in 1990, the first report of the Intergovernmental Panel on Climate Change (IPCC) was released, aiming to (1) summarize existing scientific knowledge on anthropogenic climate change, (2) assess the impact of climate change on humanity, and (3) identify solutions to the problem [1]. The world’s energy resources and consumption have been determined in terms of greenhouse gas (GHG) emissions by applying predictive models. Currently, it is expected that advanced biofuels and alternative fuels will play an increasingly pivotal role in the gradual substitution of fossil fuels with fuels of renewable origins, transport decarbonization, and the diversification of energy sources, according to European Union legislation on sustainable growth [2,3,4,5,6]. Fuel demand and GHG challenges will most likely require the use of fuel mixtures, which can be derived from a large variety of primary energy sources, with renewable ones taking priority [7,8,9,10]. The advantages of biomass-derived fuels, such as biogas, bio-methanol, and bio-ethanol, as alternatives have been highlighted [6,11]. There is a broad agreement that all sustainable fuels will need to eliminate the carbon footprint [12] and fully meet the expected demand to also be used among others as feedstocks in various chemical processes and fine chemical synthesis to valuable products [13,14]. Among versatile and vital resources, biomass and wastes (i.e., municipal solid wastes, MSWs) receive continuously increasing attention as a promising feedstock (carbon source) for chemical and fuel production [12,15,16,17].
Bio-ethanol, obtained from polysaccharide biomass, is an attractive product for use as chemicals and biofuels [18,19,20]. It is used as an alternative energy source for substituting gasoline. Bio-ethanol is critical as an intermediate product in the new chemical industry based on renewables [21]. Current bio-ethanol production is predominantly based on corn and sugarcane [17]. During the last decade, ethanol production from abundant and inexpensive lignocellulose gained increasing attention. Moreover, several technical improvements extend the possibilities for commercial ethanol production, e.g., improved enzymes to convert starch to sugars (hydrolysis), enhanced bacteria (fermentation), and water separation methods. From this perspective, ethanol can be considered one of the most promising biobased chemicals, mainly due to its broad potential as a feedstock for multiple processes and its established high-volume production [12,15,16]. Bio-ethanol has an advantage compared to other biomass feedstocks, such as lignin, cellulose, hemicellulose, and fatty acids: it can be directly converted, in one-pot processes, into “drop-in” chemicals [22]. Apart from that, bio-ethanol can be used to obtain some of the same building block chemicals currently obtained from petroleum (e.g., ethylene, 1,3-butadiene, propylene, and higher hydrocarbons) as well as for the production of oxygenated molecules (e.g., 1-butanol, ethyl acetate, acetaldehyde, and acetic acid) [23].
Chemicals from ethanol reactions can be broadly grouped into two types. Those that do not form C-C bonds (non-C-C coupling products, e.g., formaldehyde, methyl acetate, etc.) and those that form C-C bonds (C-C coupling products, e.g., C3+ alcohols, aldehydes, esters, etc.) [24,25,26]. The C-C coupling products are of particular interest as they possess higher energy contents than ethanol and can be hydrogenated to C3+ alcohols. These products (e.g., n-propanol, butanols) are considered as more desirable drop-in additives compared to ethanol due to their superior chemical (e.g., less hygroscopic, higher energy content) and fuel characteristics (e.g., higher octane numbers) [27,28]. Moreover, it has been shown that ethanol coupling offers an economical and sustainable route for n-butanol production [29]. In addition to the drop-in chemicals, other commodity chemicals can be industrially produced from ethanol [17,22]. For example, Davy Technologies has developed a one-pot process for the partial dehydrogenation of bio-ethanol into ethyl acetate [30], using, i.e., copper supported on silica catalyst, with a production of 50,000 tons per year in South Africa plant [31].
The hydrotalcite-based materials have been reported to show good catalytic activity in various reactions, such as biogas [32], coke, or methane reforming, as well as sorption capacity, stability, and easy regeneration by temperature or pressure swing [33,34,35,36,37,38,39,40,41,42,43,44,45,46,47]. Hydrotalcites (HTs) are naturally occurring layered double hydroxides (LDHs). The mineral hydrotalcite itself is a magnesium-aluminum hydroxycarbonate with the general formula [Mg6Al2(OH)16]CO3*4H2O [38,40,48]. The HT family includes many isost××ructural and polytype forms [38,39,40,48,49]. Their properties can be tailored through cation and anion exchange in the precursor framework [49,50,51]. The possibility of modifying the cations or their ratios and the interlaminar anion makes these materials a very versatile system with desirable catalytic properties. The adjustment of the acidic or basic properties of LDHs or mixed oxides that are generated by calcination at high temperatures has recently been studied [38,39,40,41,42,43,44,45,46,47,48,49,50,51].
Acid–base properties in Mg-Al mixed oxides, generally known to be crucial for catalytic activity and selectivity, strongly depend on their chemical compositions and preparation procedures [48,52]. Although much is now known about the properties of hydrotalcite-based materials, the composition and structure of the active sites and reaction mechanism of ethanol coupling to butanol have not been clearly defined.
In this work, the development of heterogeneous catalysts for the conversion of ethanol into commodity chemicals is discussed. Ni-based catalysts obtained from hydrotalcite-containing precursors were synthesized and studied. The effect of different divalent and tri- and four-valent cations (Ca2+, Mg2+, Ni2+/Ni3+, Cr2+/Cr3+/Cr4+, Mn2+/Mn3+/Mn4+, Al3+, Zr4+) presence in the HTs precursor-containing framework on the performance of the mixed oxide catalysts was investigated. This work aims to elucidate the site requirements for ethanol coupling to butanol and diethyl ether (DEE) over the hydrotalcite-based materials and the mechanism by which this process occurs.

2. Results

2.1. Catalyst Characterization

The chemical compositions of the mixed oxide active phases are shown in Table 1. These data confirm that the obtained compositions of all WP samples are close to the intended ones based on the ratios of the key elements of the Al component.
Figure 1 shows the XRD patterns of active phase precursors obtained by the standard co-precipitation method (Figure 1A) as well as calcined and spent catalyst samples (Figure 1B,C, respectively).
Pristine (only dried) WP1 hydrotalcite-like materials showed broad reflections attributable to a crystalline hydrotalcite phase, with indexing following the previously reported data (reflections at 2θ equal to 11°, 23°, and 35°; JCPDS 22-0452) [53,54]. These data suggest the isomorphic substitution of Mg2+ by Ni2+ in hydrotalcite brucite-like layers, which is in agreement with similarity in the effective ionic radius of those two components (Table 2) [55,56]. However, it is worth noting that the peaks related to the hydrotalcite phase are broad, and their intensity decreased with increasing content of the different divalent and tri- and four-valent cations (Ca2+, Mg2+, Ni2+/Ni3+, Cr2+/Cr3+/Cr4+, Mn2+/Mn3+/Mn4+, Al3+, Zr4+). This can indicate indicating a more disordered structure, changes in layer-spacing or a decrease in crystallinity [55,56,57,58]. Additionally, for Mg-containing samples, traces of crystalline Al(OH)3 (bayerite, JCPDS: 21-1307) phase were evident. The phase was present due to the excess of aluminum ions in relation to the hydrotalcite structure requirement (in the natural hydrotalcite M2+/M3+ = 3, and in the formulations M2+/M3+ ≈ 0.35).
The formation of bimetallic solids between Ni and Al can be explained by the insertion of Al3+ ions (69 pm) in the NiO crystal lattice, which, due to the lower ionic radius of Al3+, leads to the decrease in the dimensions of NiO cubic cells. This insertion is allowed as the size of the Al3+ does not differ by more than 15% from that of the Ni2+ (72 pm), and it crystallizes in the cubic system in the form of transition alumina that can be formed by calcination. Moreover, it has an electronegativity close to that of nickel, which complies with three of the Hume-Rothery rules. For Ca-containing samples, the presence of CaCO3 (vaterite modification) was observed, consistent with the previously reported data for calcium carbonate samples [57,58]. Additionally, intensity decrease and broadening of XRD pattern reflexes were observed (Figure 1A), suggesting incompatibility between the charge (Cr4+, Mn4+, Zr4+) and the ionic radius of selected elements (Table 2) of the dopant and the crystal structure of the brucite layer in HT-like material [51]. The HT-like phase structure collapsed for samples calcined at 823 K, and different phases were detected in the XRD diffraction patterns (Figure 1B). The reflections characteristic of the periclase-like structure of mixed oxides (reflections at 2θ equal to 37°, 43.5°, 63°) were the most intense [55]. Some overlapping signals related to NiO (JCPDS 65-5745) and Al2O3 (JCPDS 04-0880) were also observed. In the samples containing calcium, CaCO3 phase transformation to calcite was evidenced with sharp reflections located at 2θ equal to 37°, 43.5°, 63°. This result shows that the calcination performed at 823 K was sufficient to transform the hydrotalcite and bayerite phases into the corresponding oxide forms but was too low to cause the CaCO3 decomposition. All detected phases in calcined samples were present in samples after reaction (Figure 1C), suggesting good structure stability of the samples. The BET area (ABET) measured for the calcined samples stayed roughly constant at around 210 m2/g in both types of samples (Mg-containing WP-1, WP-2, and WP-3) or Ca-containing ones (WP-4, WP-5).
Figure 2 shows SEM and TEM images of the calcined (WP-1–WP-5) and after reaction (WP-1AR–WP-5AR) samples. All catalysts obtained from hydrotalcite-like precursors were composed of plate-like particles (Figure 2, WP-1–WP-5). The sample morphology was not changed, comparing both Mg-containing or Ca-containing samples to the pristine WP-1 sample. Moreover, this morphology has been preserved in all samples after reaction (Figure 2, WP-1AR–WP-5AR). TEM images of calcined samples (WP-1′–WP-5’), shown in Figure 2, reveal some differences in the microstructures of prepared catalysts. In all samples, the active mixed oxide phase particles are visible as black and/or dark grey grains, dispersed among the amorphous phase. In all Cr-, Mn-, and Zr-doped catalysts obtained from HT-like precursors, the calcined, mostly Ni-metal-based active phase forms oxide particles stayed in the range 5–6 nm.
The DRIFT spectra of calcined samples are shown in Figure 3.
The spectrum recorded for WP-1 shows three broad complex absorptions with maxima located at 700–1200, 1250–1750, and ca. 3500 cm−1, in accordance with previous studies [33,55,59,60]. The broad band at 3470 cm−1 was ascribed to the OH stretching mode ν(OH)- of structural hydroxyl groups. The corresponding H–O–H bending mode of physisorbed water was evidenced at 1632 cm−1. The band at 1763 cm−1 corresponds to the presence of some interlayer water. The appearance of this vibration in the spectra is most likely explained by the “memory effect” of the calcined powder sample or incomplete decomposition of the layered structure during calcination [55,59,60]. The bands in the 700–1200 and 1250–1750 cm−1 spectral regions are characteristic of carbonate vibrations. For all HT-derived samples (WP-1–WP-5), the recorded spectra were similar and presented the most intense band, located at 1034 cm−1. According to the previous research, this peak can be ascribed to the ν1 mode of carbonate [61]. Usually, this mode stays IR-inactive due to the symmetry rules. However, in the interlayer, the D3h symmetry of free carbonate is lowered to C3v or C2v, and it becomes activated. For WP-4 and WP-5 samples, displacement and splitting of this band were observed, which can be related to the calcite presence, where the local symmetry of carbonate was D3 [61]. These results are in good agreement with the XRD measurement, where the presence of calcite has been evidenced for Ca-containing samples (WP-4 and -5). The bands recorded below 1000 cm−1 can be due to the carbonate (ca. 850 cm−1) and M-OH modes. Moreover, these features are also typical of the spinel structure and can be related mainly to the formation of γ-Al2O3 and (Mg/Mn/Cr/Zr)Al2O4, as the bands at low wavenumbers (usually at 700 and 570 cm−1) are assigned to the so-called ν1 and ν2 vibrational mode of isolated tetrahedra, i.e., [AlO4] and octahedra, i.e., [AlO6], respectively [55,60].
The Raman spectra of the calcined WP-1–WP-5 samples before and after the reaction are presented in Figure 4. A broad signal around 551 cm−1 was also observed for all the materials. This signal was related to octahedral Ni2+ species. Usually, the Raman spectra of nickel oxide are reported to possess five bands that originate from the optical vibrations produced by one phonon (1P) of the transverse optical (TO-440 cm−1) and longitudinal optical (LO-560 cm−1) and by two phonons (2P). As a result of the TO+TO TO+LO and LO+LO coupling, three scatterings were further observed at 730, 930, and 1080 cm−1 [62,63,64]. The Raman spectra of all the calcined WP samples mainly displayed the band originating from the 1P scattering at 551 cm−1, whereas bands related to the 2P coupling were not identified. This band is considered as characteristic of nickel oxide with alterations in its crystalline structure, which may be due to vacancies created by the non-stoichiometric Ni1-xO oxide or the Ni3+ presence in the structure [64]. The presence of smaller Al3+ ions in the NiO lattice may cause the formation of crystalline defects and vacancies, favoring the 1P interaction. It is noteworthy that, when traces of Mn, Cr, and Zr are present in the structure, the band at 551 cm−1 is wider, and blue shifted. This can be explained by the formation of more defects and vacancies by dopant ions and/or by the band coincidence with the lattice vibration of the hydroxyl layers of these metals [62,63,64]. In Figure 4B, the Raman spectra of the WP-X samples after the reaction are shown. It was noticed that signals associated with the carbon are intense, shielding the metal signals. The Raman spectra showed two characteristic peaks at 1585 and 1350 cm−1 related to the G and D bands. The G band corresponds to the stretching vibration between the C-C bonds along the longitudinal axis of the graphite plane. In contrast, the D band refers to association with the presence of amorphous carbon, disordered crystal structure, or crystal defects [65,66]. The bands were deconvoluted as described previously; however, other bands (D2, D3, D4) were not detected [67]. The graphitic index (IG) of the samples was calculated from the deconvolution of the signals, and the value for all the materials was around 25%. The collected spectra revealed that the carbon formation during the carried reaction was the highest for the WP-1 sample. In general, the Mg-containing catalysts contained more coke after the coupling reaction, and they were more active than Ca-containing catalysts (Table 3).

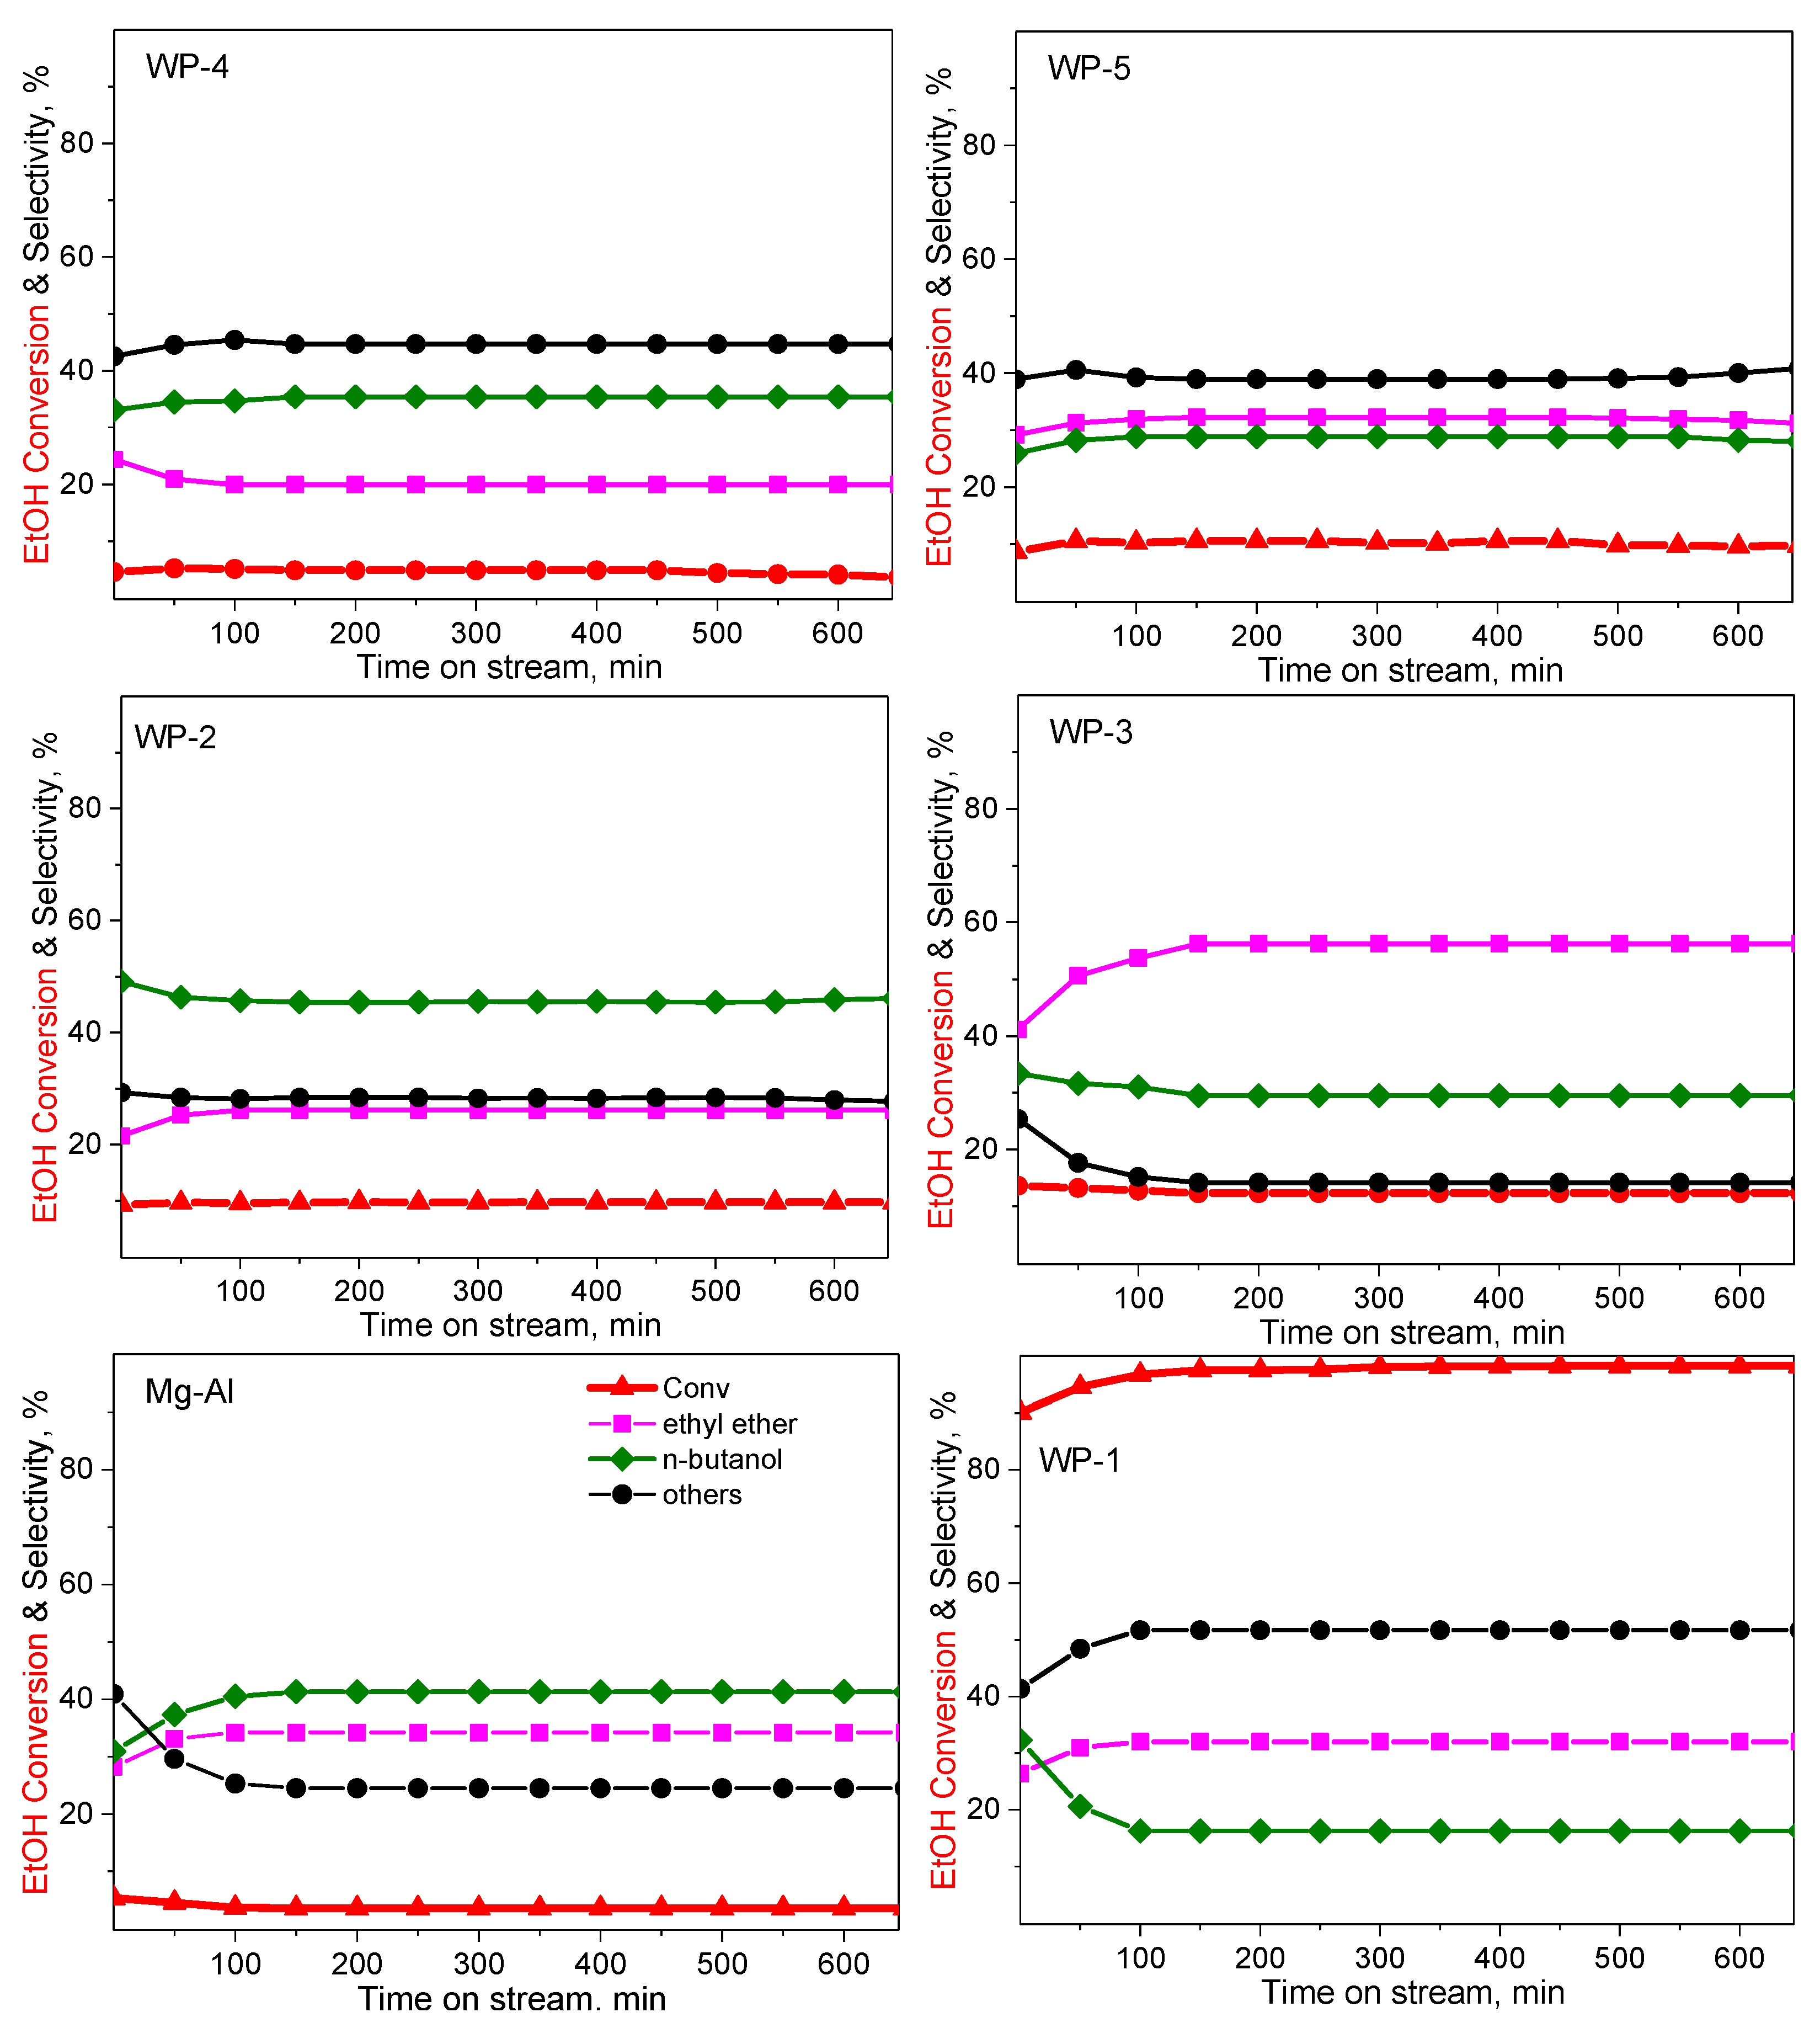
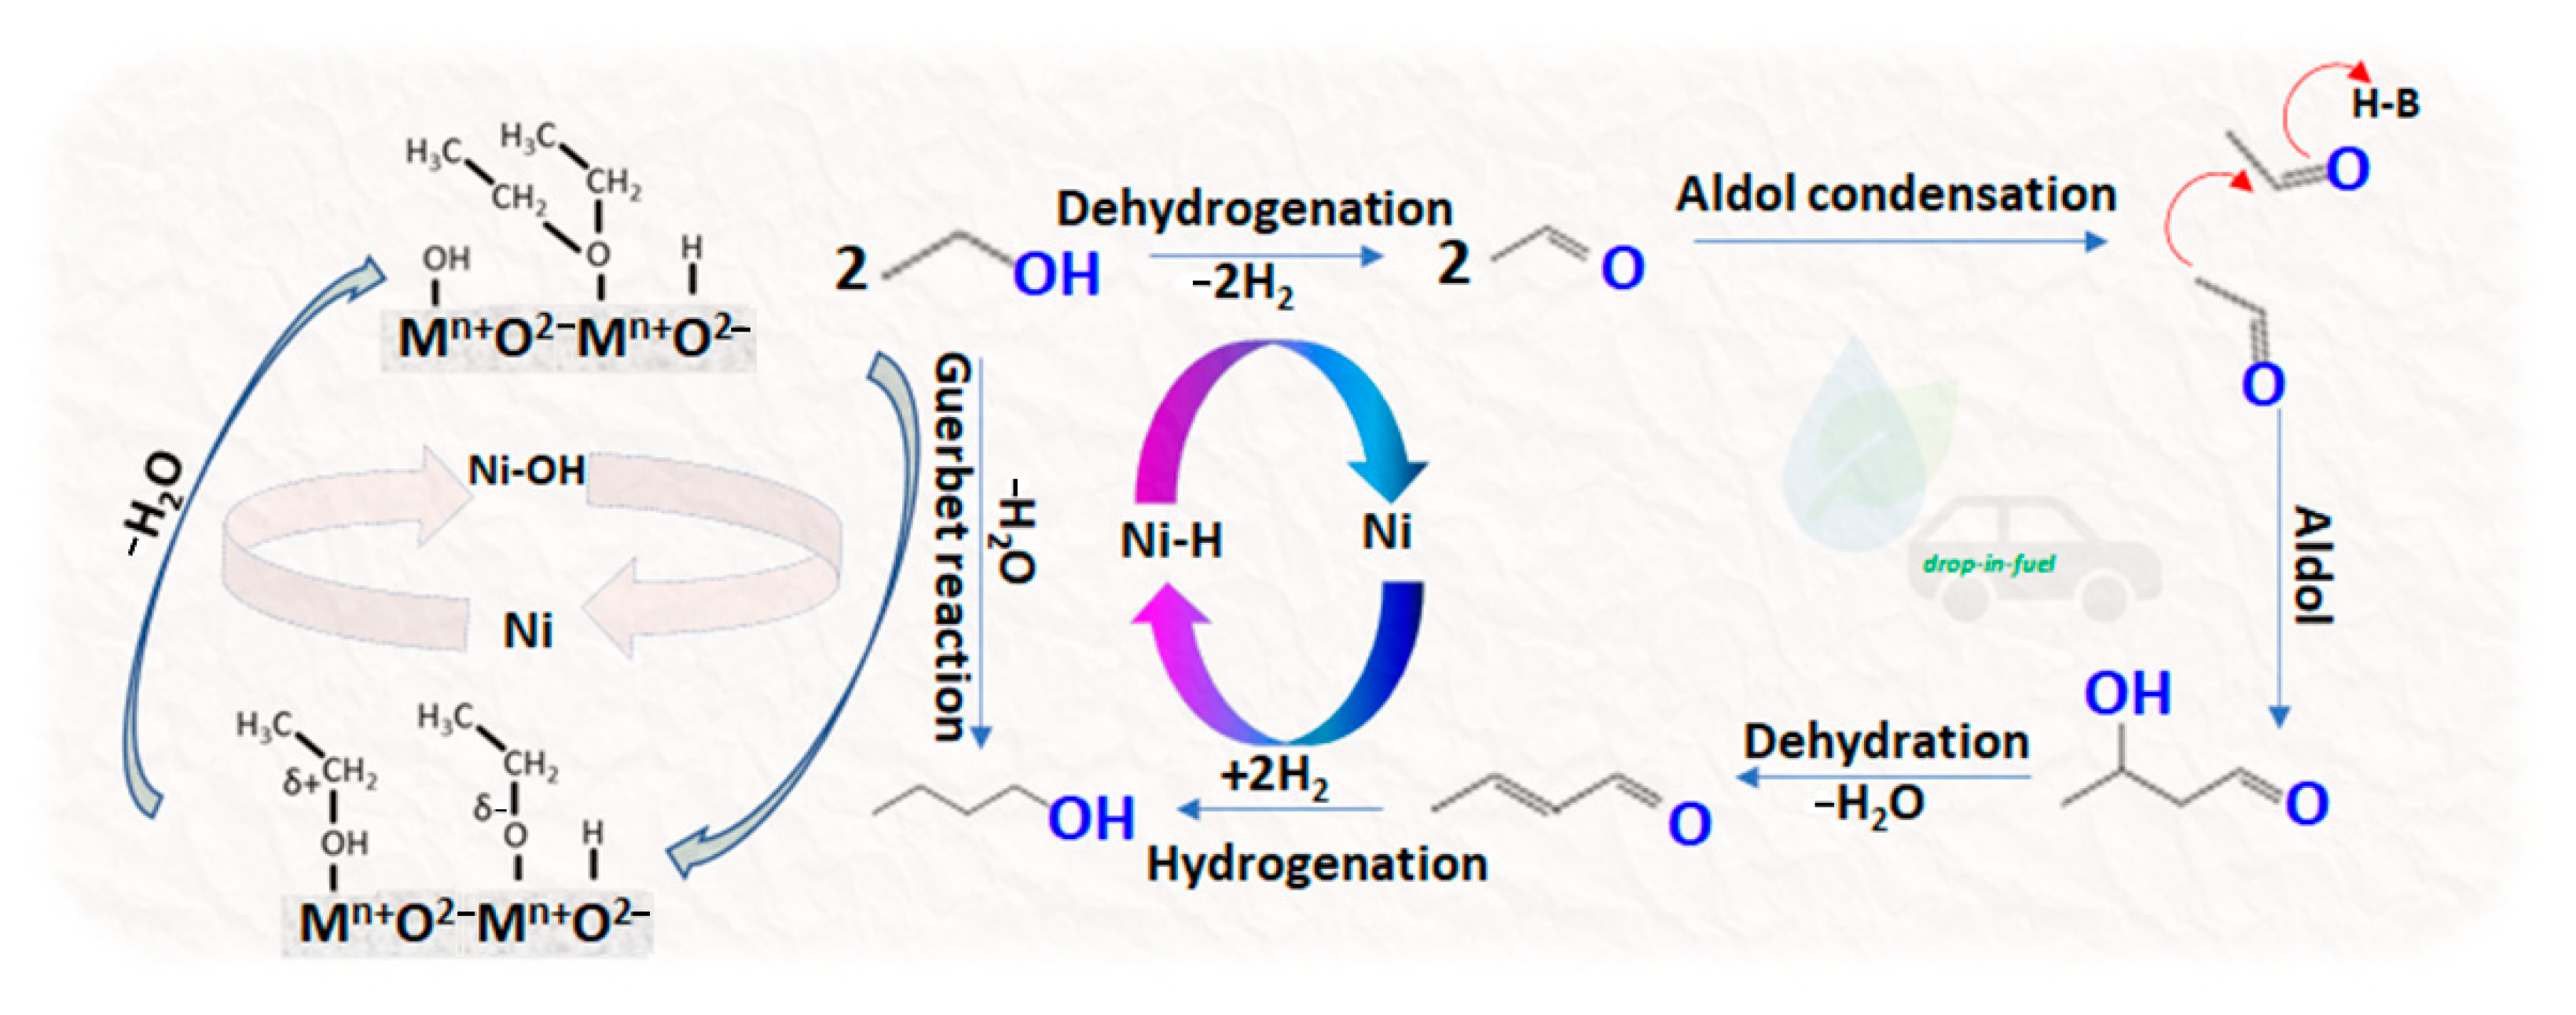
2.2. Catalytic Performance

Figure 5 presents the effect of metal type content on the catalytic performance during EtOH coupling reactions. At the investigated reaction conditions (350 °C, ambient pressure; GHSV= 1.19 × 10⁵ h−1), the MgAl catalyst had a very low alcohol conversion (EtOH conv. ∼10%) but high C-selectivity to n-butanol and ethyl ether (>40%). Ethanol coupling occurred in the same temperature range for all the catalysts. There are several differences in terms of activity, defined as conversion after 100 min and selectivity towards DEE and n-butanol (Table 3). Incorporation of Ni in MgAlO (WP-2) afforded a selectivity of 46% to n-butanol with an ethanol conversion of 15%. However, the NiAlCO3 sample (WP-1) showed high ethanol conversion (97%), but the selectivity of n-butanol and ethyl ether decreased. Indeed, for the NiAlCO3 sample, apart from the product decomposition, the products’ distribution changed, suggesting C-C coupling omittance, as was given previously [11]. This is due to the well-known ability of Ni in the form of NiO to activate C-H and O-H bonds in alcohols to form the corresponding aldehydes and also due to the more acidic nature of the surface composition determining the reaction pathway [11].
For the WP-3 catalyst (Mn, Cr, and Zr- modified Ni-Mg-Al mixed oxide), the highest activity was observed in terms of ethanol conversion with selectivity toward DEE approaching 60% (Figure 5). This behavior is most likely due to the introduction of Mn4+ species in the Mg-based structure, and Mg2+ species are more active for the aldol condensation reaction. Thus, n-butanol formation was inhibited [39]. Other studies have also reported that enhanced dehydration can be promoted instead. This is due to the interaction between Mg2+ and Al3+ that weakens the metal–support interaction as well as due to the decrease in Mg/Al ratio [40,41]. The data presented in Figure 5 demonstrate that the promotor of ethanol’s coupling reaction is the Mg-Al hydrotalcite precursor, which is in agreement with the literature [24,26,32,39,61,68].
Mechanistic studies of alcohol (methanol+n-propanol, ethanol) coupling reactions on mixed metal oxides (MgAlOx) have revealed that an optimum population of weak Lewis acid and strong Brønsted base-pair sites resulting from intimate contact of Mg and Al oxide phases is required for maximizing the C-C coupling reaction rates that are not achieved with either monometallic oxides MgO (mostly basic), or Al2O3, (mostly acidic) [24,68,69]. DiCosimo et al. have shown that on MgAlOx mixed metal oxides (atomic Mg/Al = 1), the maximum ethanol coupling formation rate to n-butanol coincides with the maximum density of basic sites in the catalyst [68,69]. In the present work, we report vapor-phase coupling reactions of ethanol on mixed metal oxides at varying metal contents aimed at maximizing the C-C coupling product for ethanol.
In the vapor phase, the main reported reaction pathways for the C-C coupling of lower alcohols to higher alcohols on multimetallic mixed oxides include several reactions, as proposed by J.J. Bravo-Suárez et al. [24].
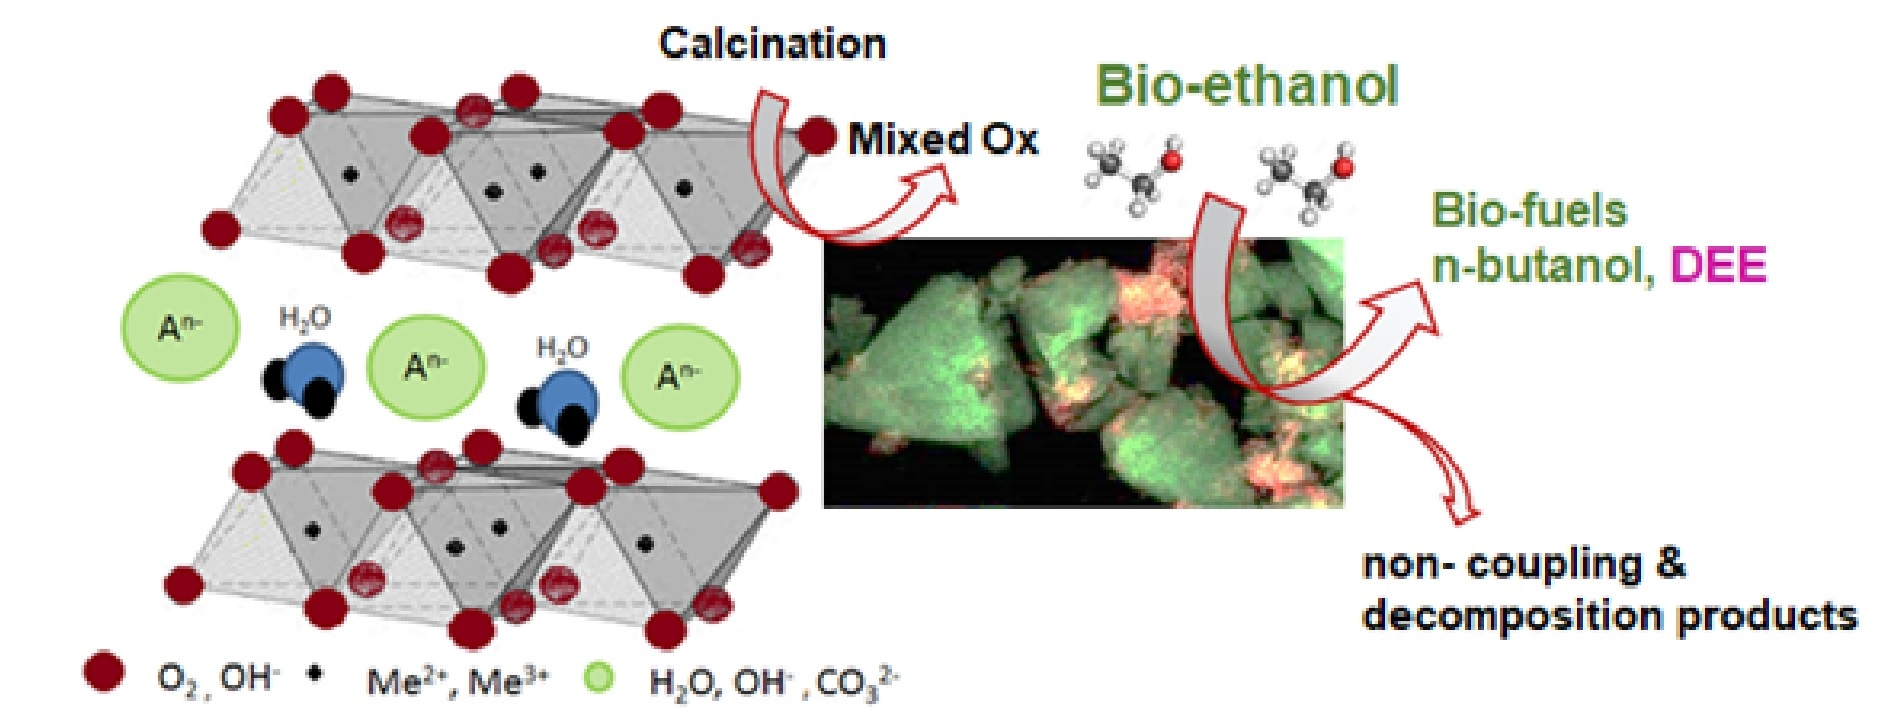
  • Alcohol oxidation (dehydrogenation) to aldehyde:
    2RCH2CH2OH ↔ 2RCH2CHO + 2H2
  • Aldol condensation of aldehydes with the elimination of water (C-C bond-forming) to an aldehyde:
    2RCH2CHO ↔ RCH2CH = CRCHO + H2O
  • Additionally, allylic aldehyde reduction (hydrogenation) to alcohol:
    RCH2CH = CRCHO + 2H2 ↔ RCH2CH2CHRCH2OH
Other reactions that have been proposed include direct alcohol and aldehyde condensation (to C-C coupled intermediate species), hydroxy aldehyde keto-aldol interconversion, reverse aldol coupling (to keto form), esterification reactions from aldehydes and surface alkoxides, and ethanol decarbonylating (decomposition).
At the reaction conditions of our study, a wide range of different EtOH reaction products were observed that can be broadly grouped as: (1) C-C coupling (butanol) and dehydration (ethyl ether); (2) non-C-C coupling (e.g., H2CO, HAc, HCOOCH3, MeOAc); and (3) decomposition (e.g., COx) products.
During the coupling reaction, the water was formed, but the water’s presence does not harm the catalysts’ structures and morphologies, evidenced by XRD (Figure 1c) and SEM (Figure 2). All catalysts preserve a mixed oxide structure. The water could remove the coke by gasification; however, for these catalysts, this route apparently did not occur with a high conversion level at the temperatures used [42].
The direct transformation of ethanol into 1-butanol is described as being catalyzed by solid bases [70]. For such catalysts, mechanistic studies have shown that ethanol dimerization is the preferred mechanism, which is usually supported by the fact that expected reaction intermediates are detected [71,72]. In general, two alternative mechanisms have been proposed for alcohol coupling, namely, a Guerbet reaction or a direct condensation mechanism (Figure 6) [71,72]. In the Guerbet reaction, the C-C formation occurs via aldol condensation. This reaction includes dehydrogenation of ethanol to an aldehyde (often identified as the rate-limiting step), followed by aldol-type condensation of aldehyde and transfer hydrogenation (TH) of polarized substrates [73,74]. Most likely, for studied WP-X catalysts, both H2 and produced H2O can act as hydrogen donors, as suggested earlier [73]. In the second mechanism, i.e., direct condensation, the first activation of the β-H of ethanol molecule is followed by the condensation with another ethanol via dehydration [74]. Thus, dual functionality of catalytic systems is required to provide desirable Guerbet conversion and selectivity, where one component is active in ethanol dehydrogenation and support or/and the second component shapes the acetaldehyde aldolization selectivity.
Until now, various transition metals have been reported to enhance ethanol dehydrogenation, aiming to improve ethanol conversion under mild conditions [72,74]. Incorporation of Ni to LDH-derived catalysts showed promising activity with high selectivities related to the acid–base site modification of WP-X catalysts’ surfaces. In the Ag-supported MgAl-LDO catalyst, the basic sites promote the adsorption and subsequent dehydrogenation of ethanol on uniformly dispersed Ag particles [74]. Thus, the acid–base cooperation was ascribed to promote the C-C bond formation of dehydrogenated intermediate via aldol condensation. In the case of investigated WP-X, Ni most likely acts as a hydrogen-transfer component. Simultaneously, the presence of the multiple redox couples Ni2+/Ni3+, Cr2+/Cr3+, Mn2+/Mn3+, and the oxygen-vacant sites affect the acid/base properties of derived mixed oxides. This dual functionality is of crucial importance for the process selectivity towards bio-DEE and bio-butanol. This complex issue is currently under detailed investigation by our group.

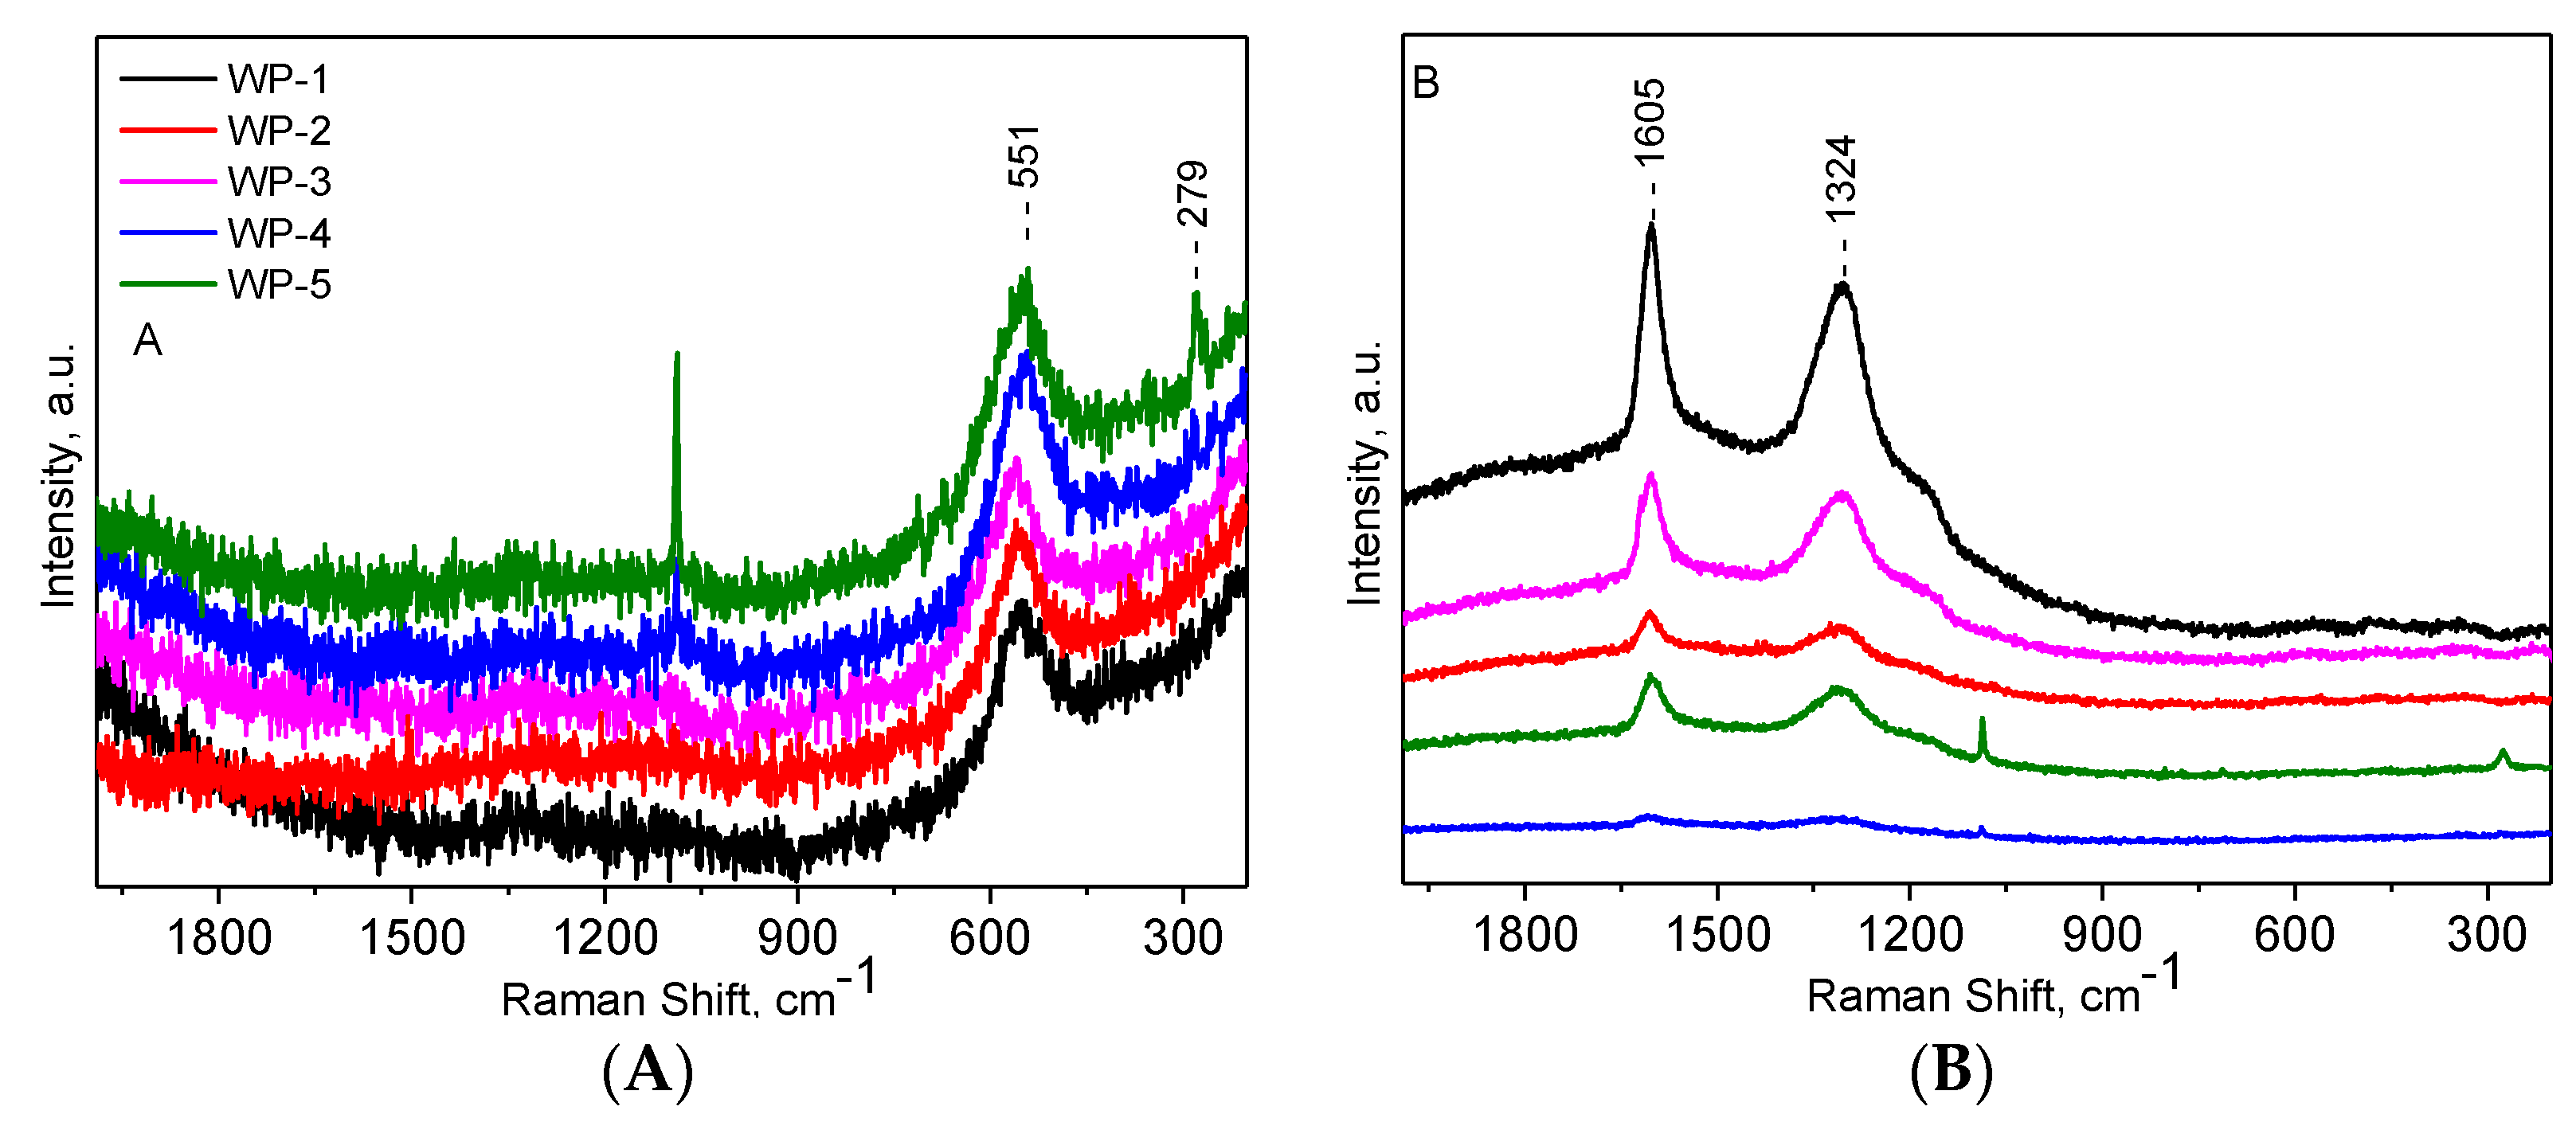
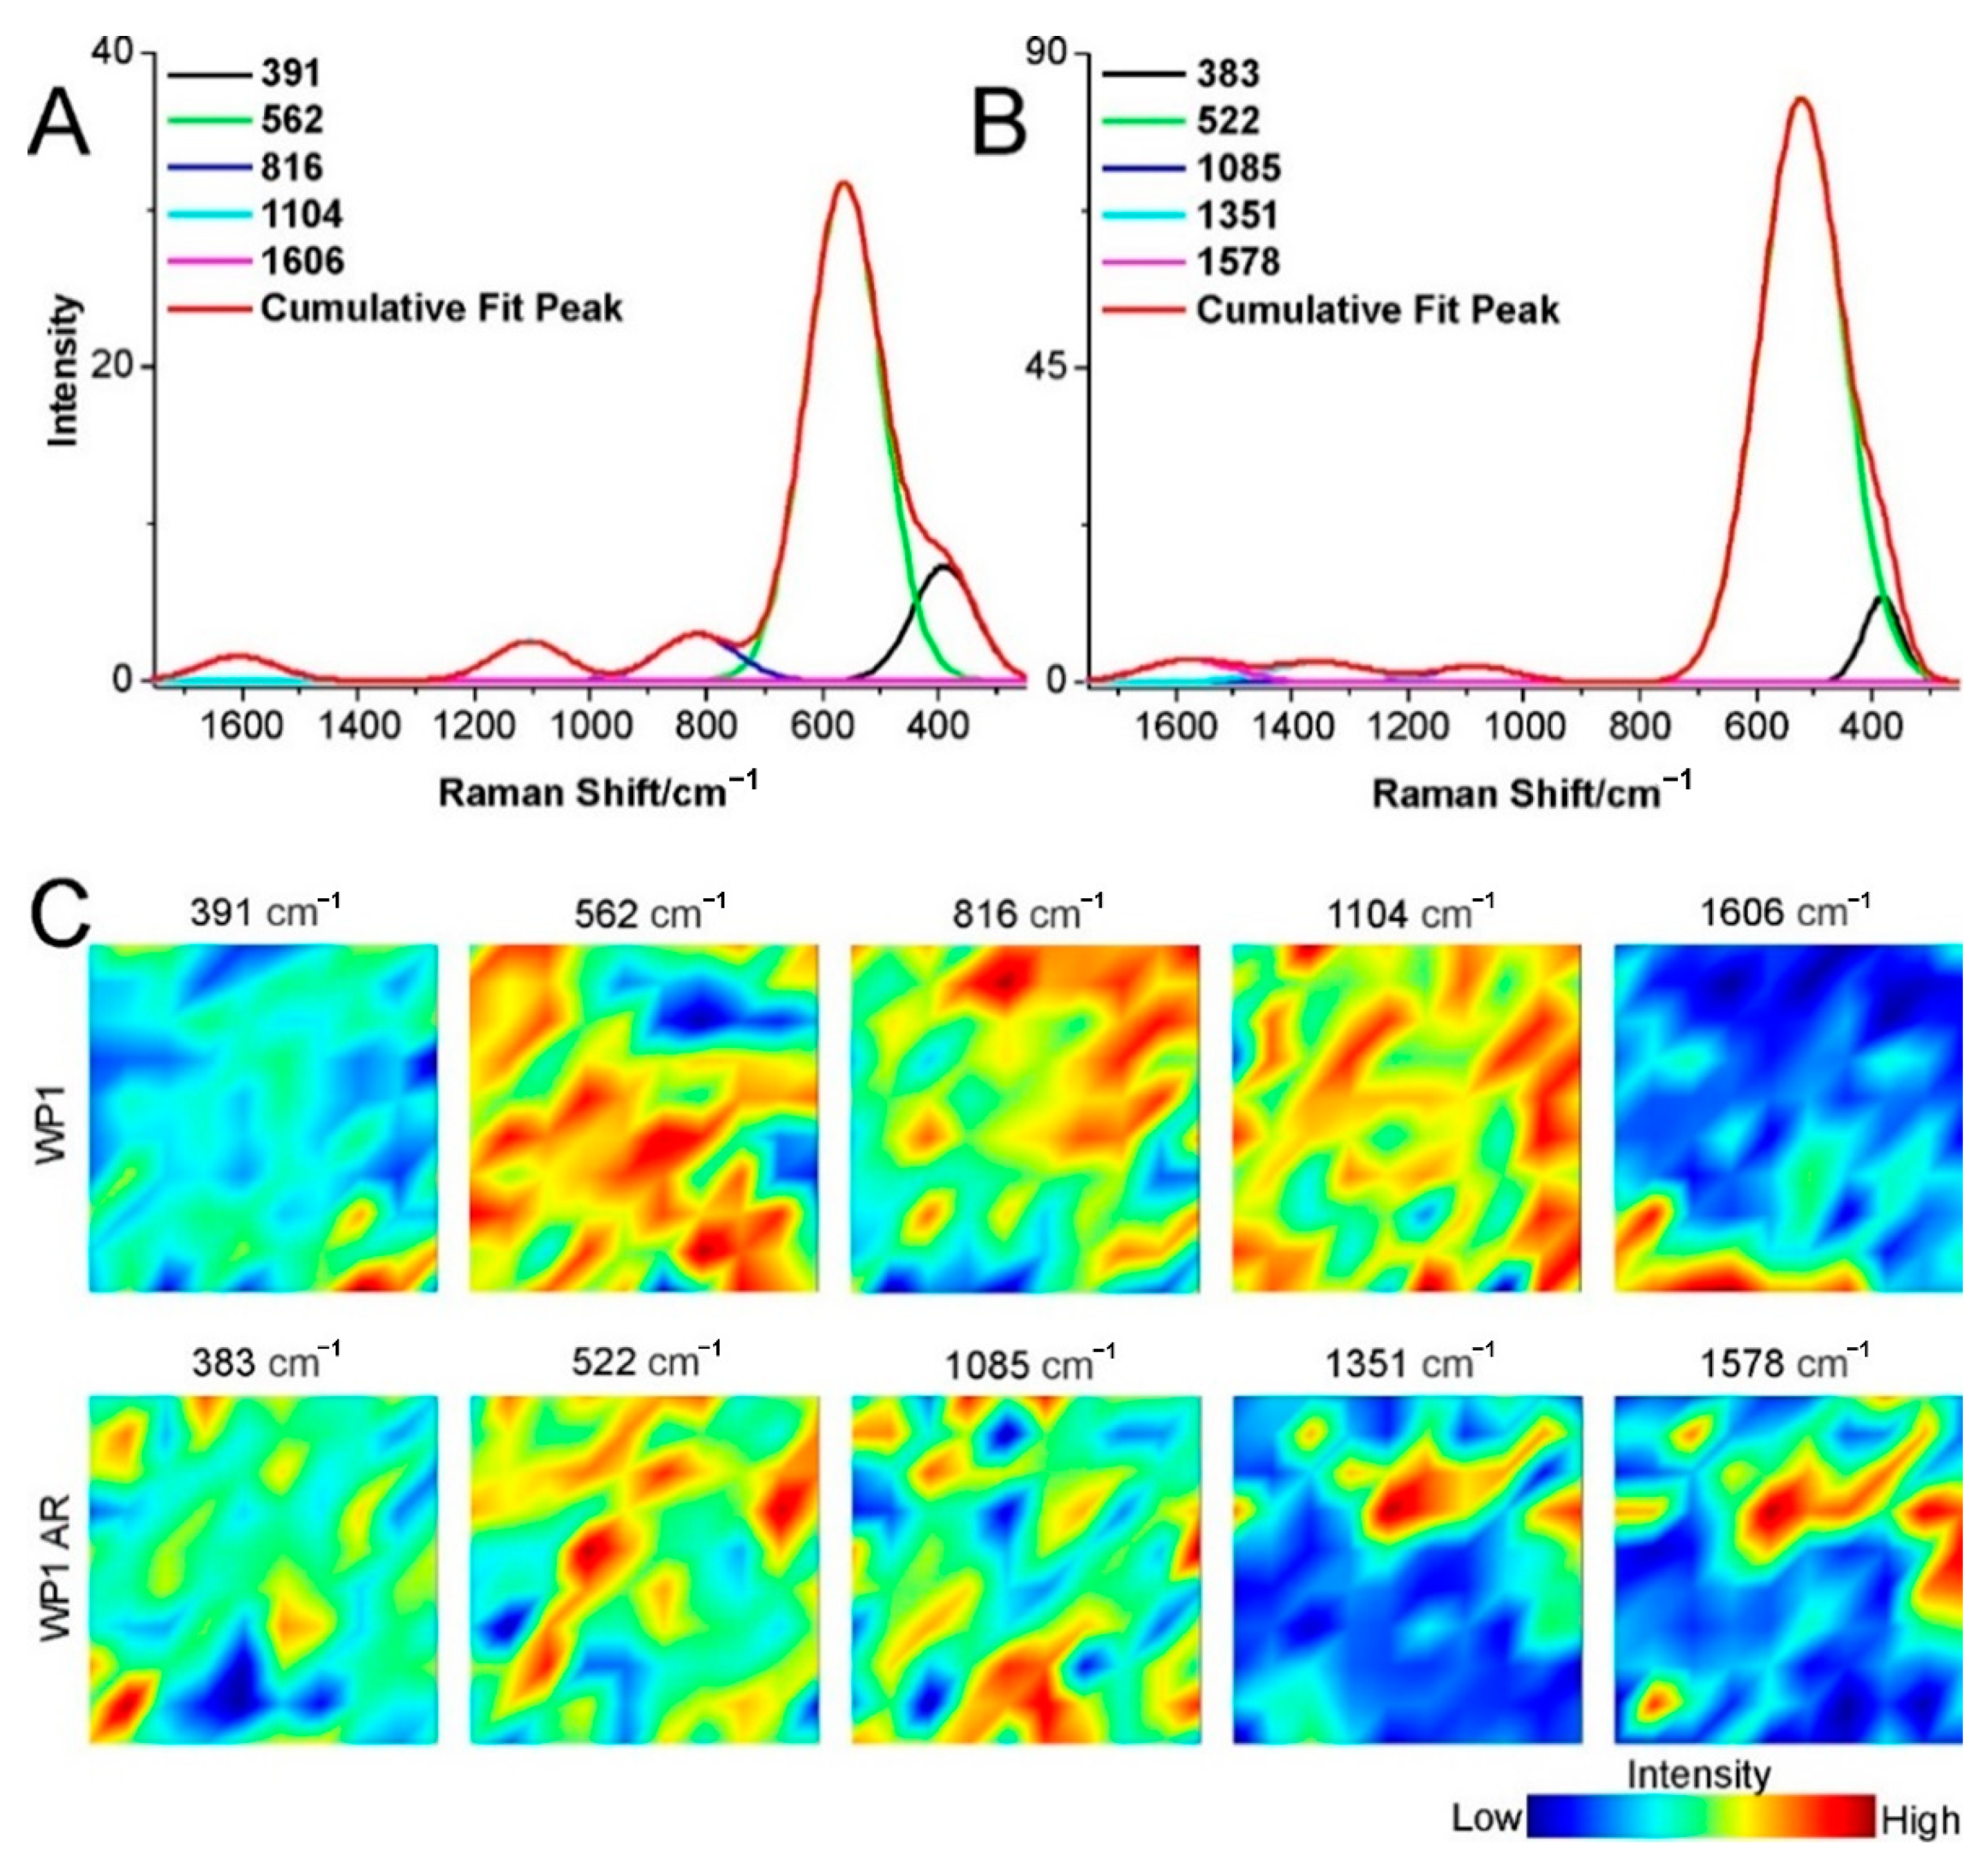
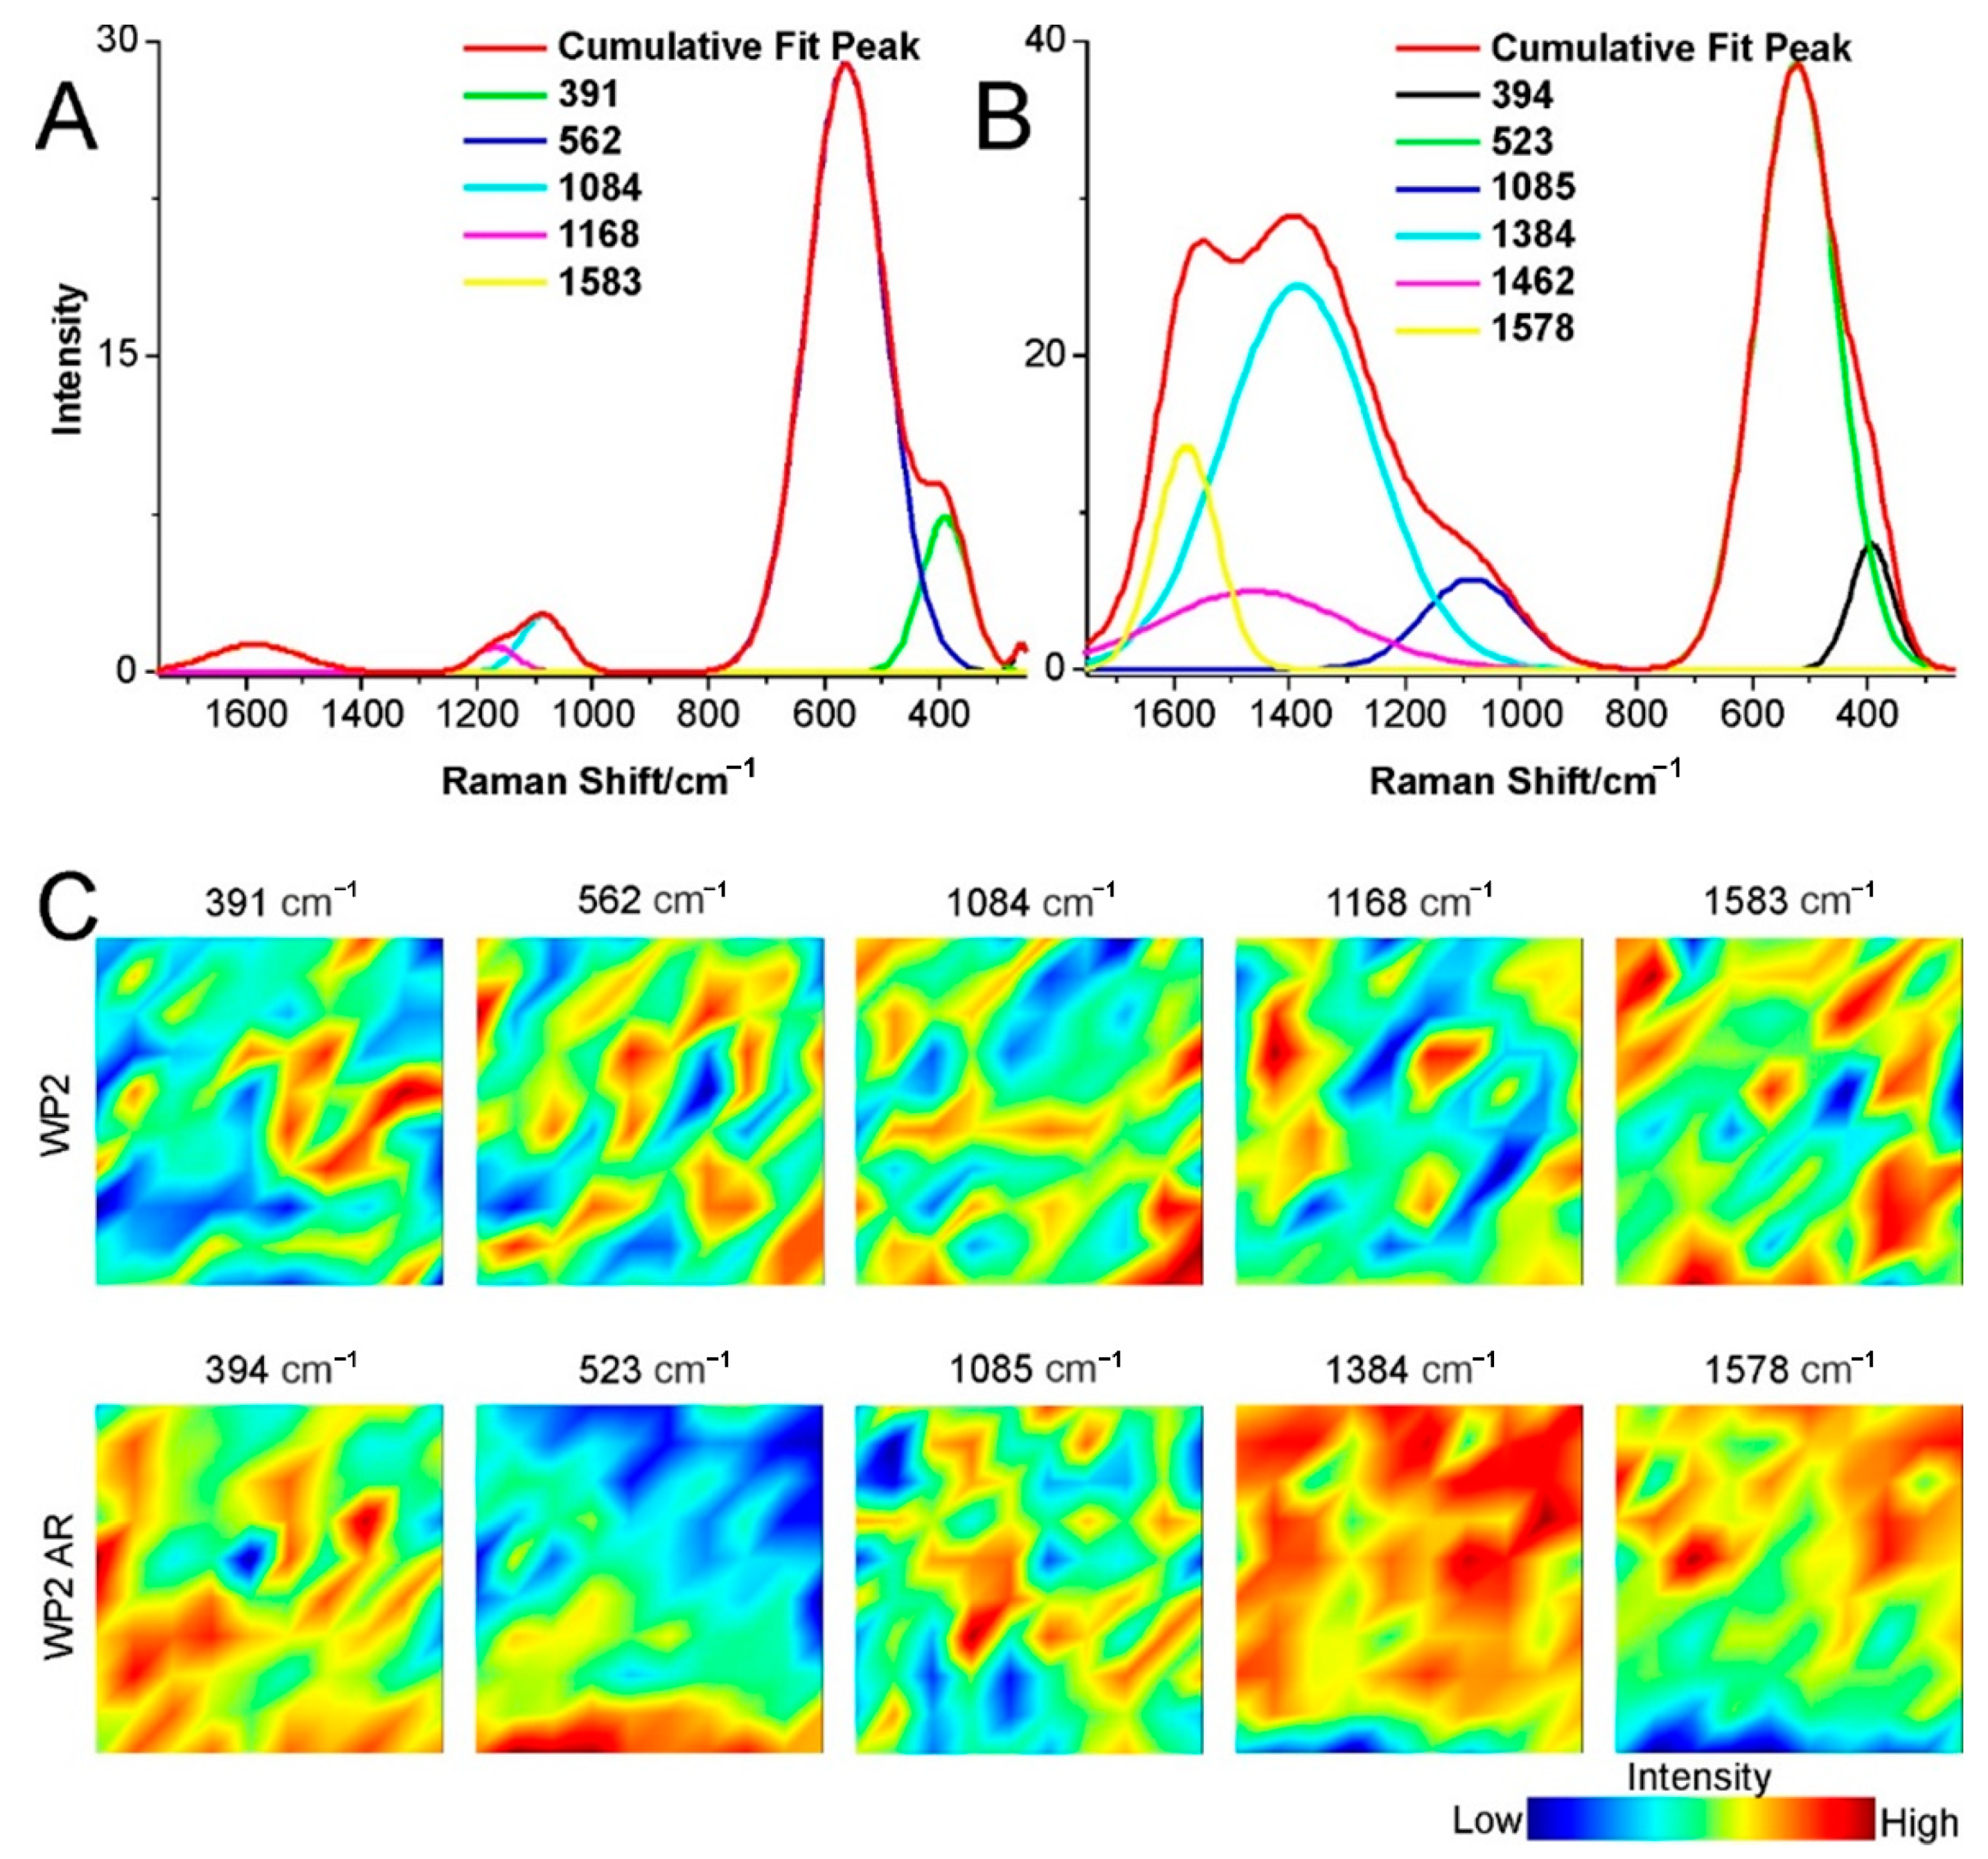
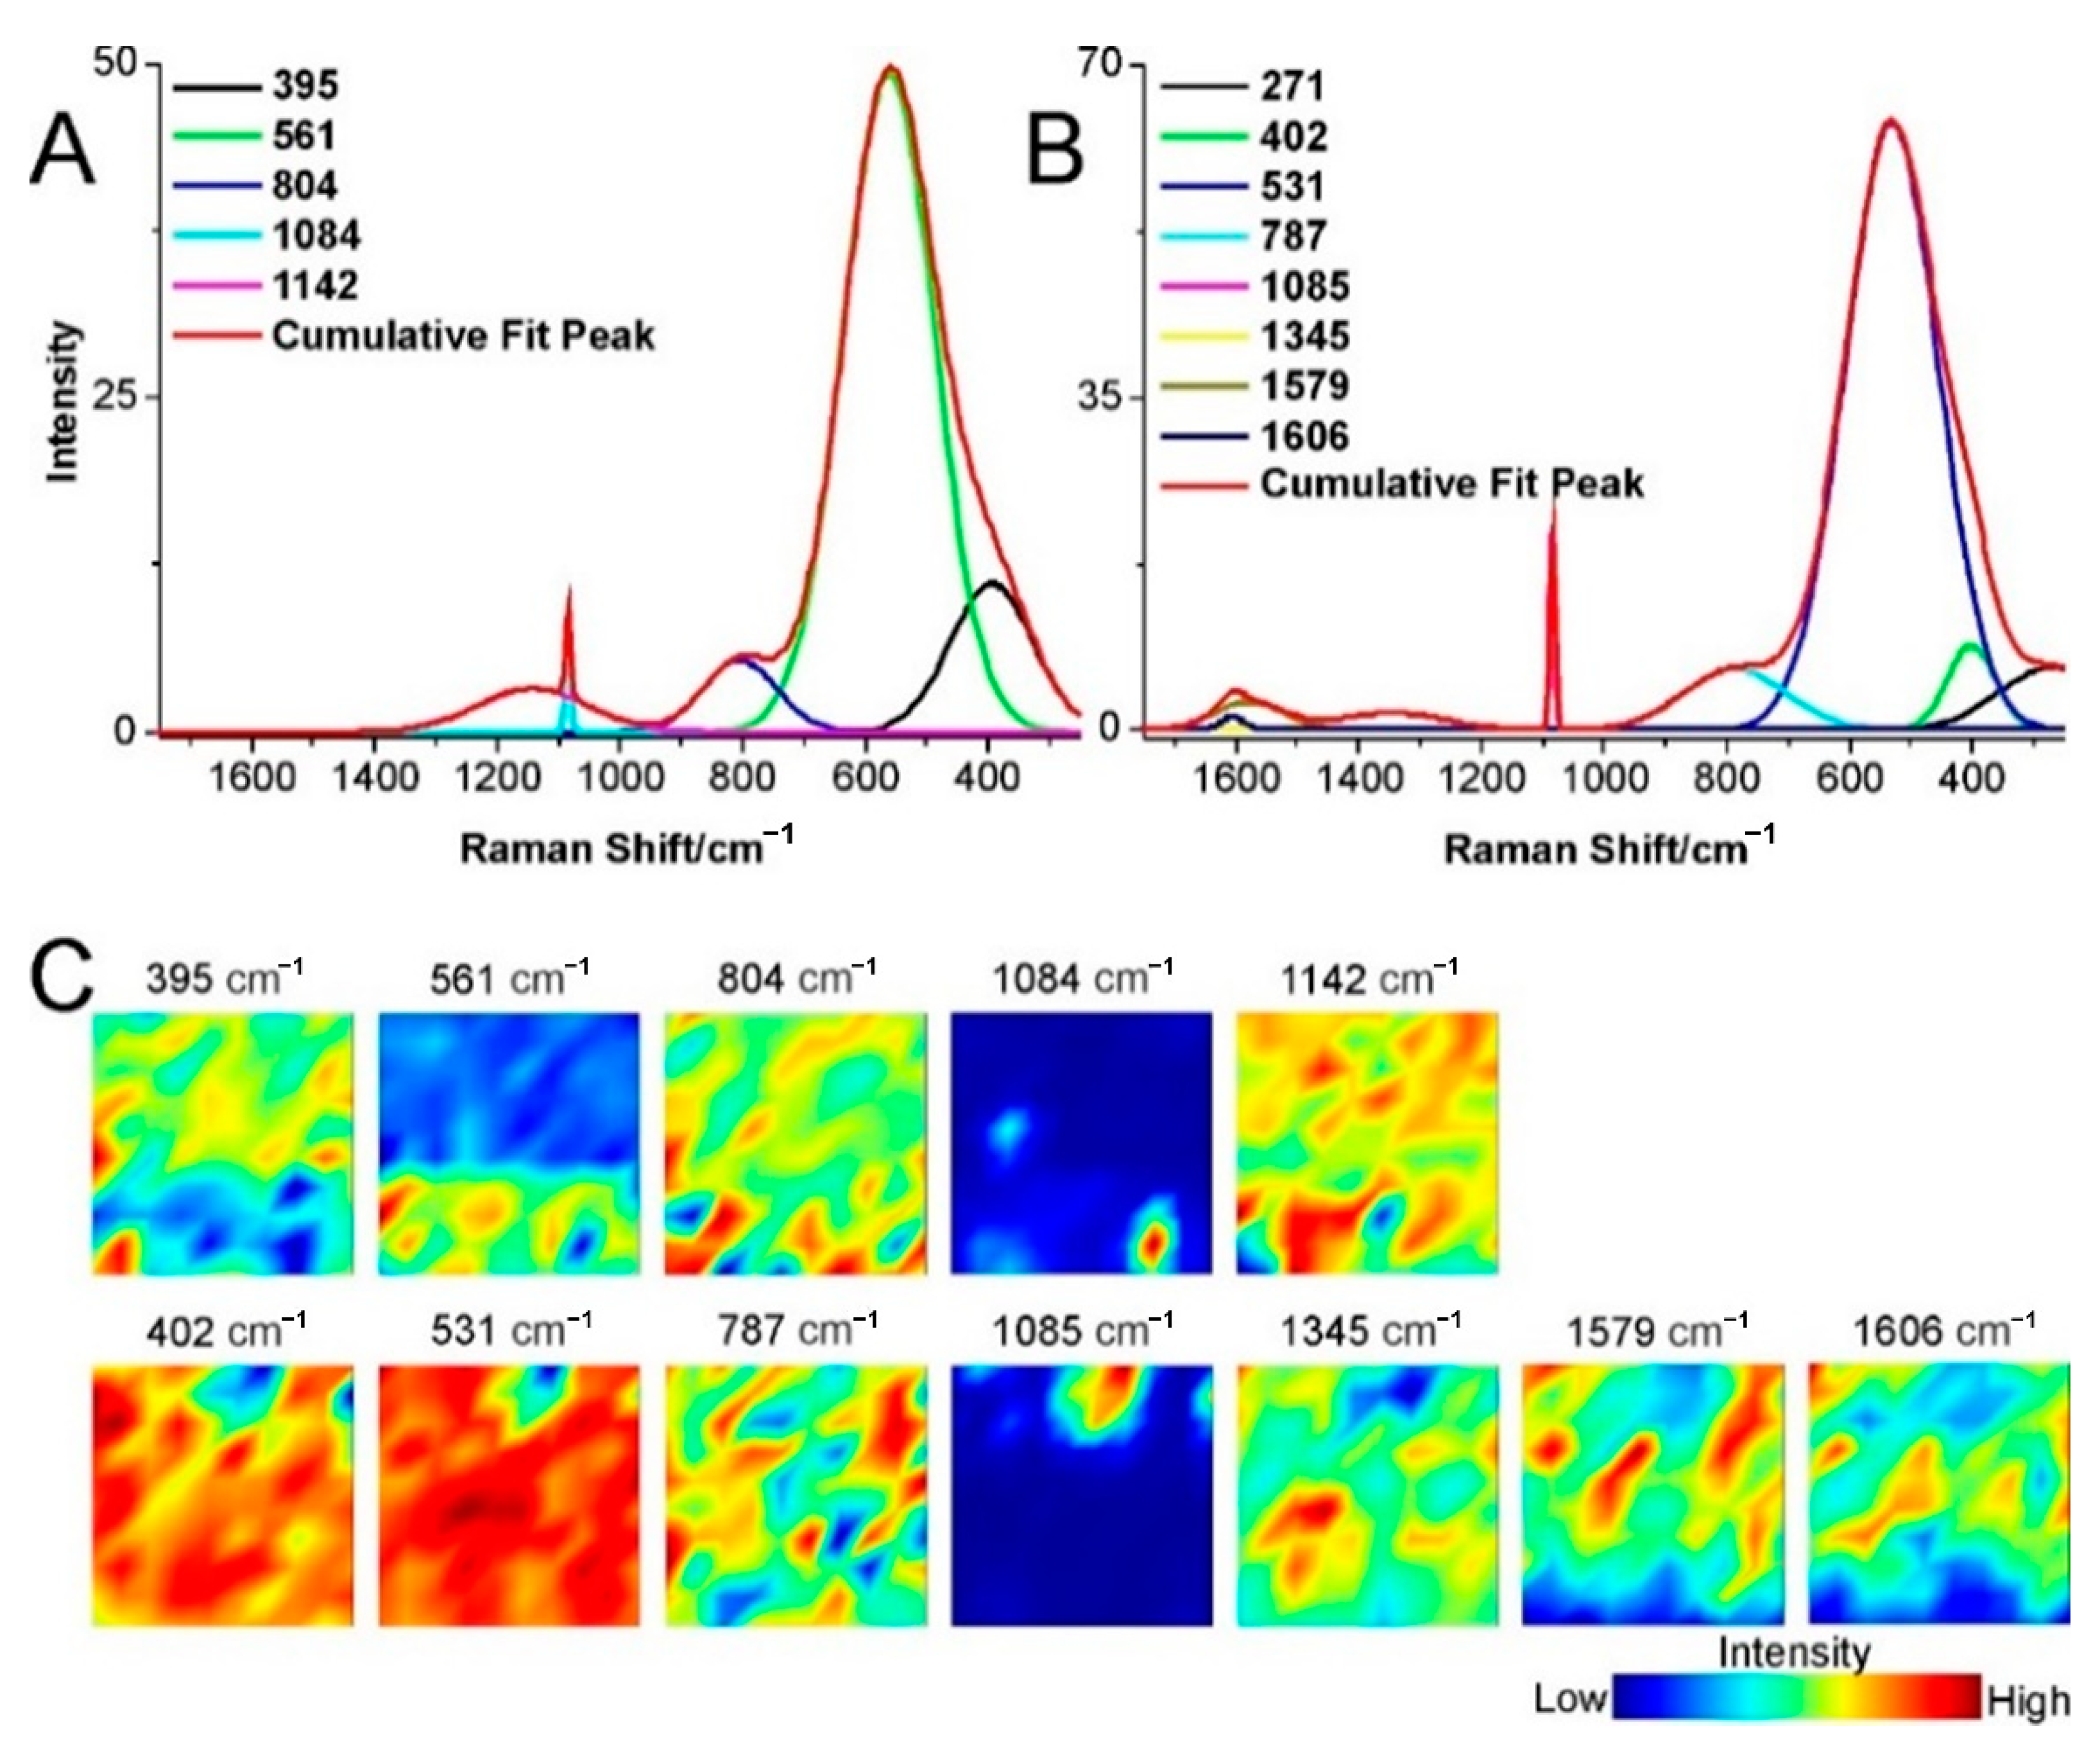
2.3. Structural Changes of Catalyst

The average Raman spectra of WP1 before and after the reaction are present in Figure 7A,B, respectively. The spectrum of the sample before the reaction displays bands at 391 cm−1, originating from the A1 phonon mode of Al3+ or Ni2+ species, at 562 cm−1, ascribed to phonon mode of Ni2+ species, at 816 cm−1, corresponding to the condensed tetrahedral AlO4, at 1104 cm−1, assigned to νCO32− ion, and at 1605 cm−1, from an unknown source [1,2,3,4].
The spectrum of the after-reaction sample contains bands at 383 cm−1, corresponding to the A1 phonon mode of Al3+ or Ni2+ species, and at 522 cm−1, ascribed to the phonon mode of Ni2+ species. The band at 816 cm−1, corresponding to condensed tetrahedral AlO4, was present in the sample’s spectrum before but not after the reaction. Moreover, the band at 1085 cm−1 appeared in the after-reaction sample. This band is ascribed to either two phonon modes of Ni2+ species or νCO32− ion [3]. The latter is more probable as a similar band was present in the sample’s spectrum before reaction (at 1104 cm−1). Two additional bands, located at 1351 and 1578 cm−1, are present in the sample’s spectrum after the reaction. They are assigned to imperfect graphite (D band) and perfect graphite or graphene (G band), respectively [5]. Bands at ~385 and ~540 cm−1 are present in both samples’ spectra. However, both bands are significantly shifted toward lower Raman shift values in the after-reaction sample’s spectrum compared to that of the before-reaction sample. This result suggests a change in the catalyst structure. The band at ~385 cm−1 has a comparable area under the curve in both samples. However, in the after-reaction sample’s spectrum, the band at ~540 cm−1 has a three-fold higher area compared to that before the reaction. This result might indicate the condensed tetrahedral AlO4 (the band that disappeared in the after-reaction sample) transformation to octahedral AlO6, which might be found in the lower Raman Shift values [1]. The G and D bands were present in the after-reaction sample’s spectrum, suggesting that the reaction product was a coke.
In the chemical maps of the before-reaction sample, all bands, except for the one at 1605 cm−1, were evenly distributed throughout the sample. The band at 1605 cm−1 was observed on the sample surface, whereas the band at 816 cm−1 was absent. This result might indicate an incomplete reaction while creating the catalyst or uneven reaction throughout the sample. In the after-reaction sample’s chemical maps, the bands corresponding to the catalyst were evenly distributed throughout the sample. The D and G bands were located in the specific sample areas. They were not correlated with the catalyst band occurrence, which proves that the reaction was complete and the catalyst did not degrade during the catalytic reaction (which was also proven when taking into account the averaged spectra). Moreover, D and G bands were distributed in the same sample locations, proving that the production of imperfect and perfect graphite or graphene needs the same conditions.
The average Raman spectra of WP2 before and after the reaction are present in Figure 8A,B, respectively.
The WP2 spectrum displays bands at 391 cm−1, originating from the A1 phonon mode of Al3+ or Ni2+ species, at 562 cm−1, ascribed to the phonon mode of Ni2+ species, at 1084 cm−1, corresponding to either the two phonon modes of Ni2+ species or νCO32− ion, at 1168 cm−1, from an unknown source, and at 1583 cm−1, assigned to the MgO crystal G band [2,3,4,6].
In the after-reaction sample, the spectrum contains bands at 394 cm−1, corresponding to the A1 phonon mode of Al3+ or Ni2+ species, at 523 cm−1, ascribed to the phonon mode of Ni2+ species, at 1085 cm−1, assigned to either the two phonon modes of Ni2+ species or νCO32− ion, at 1384 cm−1, ascribed to the imperfect graphite (D band), and at 1578 cm−1 correspond to perfect graphite or graphene (G band) [5]. In the after-reaction sample, the band corresponding to the phonon mode of Ni2+ species was significantly shifted toward a lower Raman shift value. It is probably due to the slight change in the catalyst structure. The band at 1168 cm−1 was not detected in the after-reaction sample; however, it might be overlapped by D and G bands. Moreover, in the after-reaction sample’s spectrum, D and G bands were present. Although the G band was also present in the before-reaction sample’s spectrum, the G band area in the after-reaction sample’s spectrum was almost 7.5 times higher than that in the sample’s spectrum before the reaction (1899 vs. 254), as visible in Figure 8A,B. This result shows that the sample induced coke production with very high abundance (higher than WP1).
Before the reaction, the chemical maps of the sample show that all catalyst bands were evenly distributed throughout the sample, proving the catalyst’s chemical homogeneity. In the after-reaction sample, the chemical maps indicate that the intensity of the highest catalyst band (at 523 cm−1) was reversely proportional to the D and G bands. This result might suggest that the reaction was not complete and that the catalyst degraded as the reaction progressed. However, the latter is not true. The area of the band at 523 cm−1 in the after-reaction sample’s spectrum was higher compared to that in the before-reaction sample’s spectrum. The arguments mentioned above prove that the WP2 catalyst induced the coke production reaction with very high abundance and was stable in the used reaction conditions.
The average Raman spectra of WP4 before and after the reaction are present in Figure 9A,B, respectively.
The average spectrum of the sample before the reaction contains bands at 395 cm−1, corresponding to the A1 phonon mode of Al3+ or Ni2+ species, at 561 cm−1, ascribed to the phonon mode of Ni2+ species, at 804 cm−1, corresponding to the condensed tetrahedral AlO4, at 1084 cm−1, ascribed to either two phonon modes of Ni2+ species or νCO32− ion, and at 1142 cm−1, from an unknown source [1,2,3,4].
The average spectrum of the after-reaction sample contains bands at 402 cm−1, corresponding to the A1 phonon mode of Al3+ or Ni2+ species, at 531 cm−1, ascribed to the phonon mode of Ni2+ species, at 787 cm−1, corresponding to the condensed tetrahedral AlO4, at1084 cm−1, ascribed to either the two phonon modes of Ni2+ species or νCO32− ion, and at 1345, 1579, and 1606 cm−1, corresponding to the imperfect graphite (D band), perfect graphite or graphene (G band), and imperfect graphite or disordered carbon (D’ band), respectively [5]. In the after-reaction sample’s spectrum, the band at 531 cm−1 was significantly shifted towards lower Raman Shift values compared to that in the before-reaction sample’s spectrum. This result could indicate slight changes in the catalyst structure. The band at 1142 cm−1, present in the before-reaction sample, was not present in the after-reaction sample, probably due to the degradation or structural change in the substance corresponding to that band. Moreover, in the after-reaction sample, the D, G, and D’ bands’ presence proves that this catalyst induced coke production but with very low efficiency (based on the bands’ area analysis).
The before-reactions sample’s chemical maps consist of bands at 395, 804, and 1142 cm−1 that were evenly distributed throughout the sample. However, the band at 561 cm−1, the main band of the catalyst, and the band at 1084 cm−1 were distributed in specific sample regions, proving that the sample was not homogenous. In the after-reaction sample’s chemical maps, all bands of the catalyst and its products were evenly distributed, except for the band at 1085 cm−1. This band’s intensity was the highest in a specific sample spot. Moreover, the intensity of all other bands was low in the same spot (except for the band at 787 cm−1). These results indicate that the sample was not homogenous, and the spot with high intensity of 1085 cm−1 band had low catalytic efficiency.

3. Materials and Methods

3.1. Materials and Reagents

High purity Avantor Performance Materials (POCH, Avantor Performance Materials Poland S.A., ul. Sowińskiego 11, Gliwice) nickel nitrate (Ni(NO3)2·6H2O), magnesium nitrate (Mg(NO3)2∙6H2O), calcium nitrate (Ca(NO3)2·4H2O), manganese nitrate (Mn(NO3)2·4H2O), chromium nitrate (Cr(NO3)3·9H2O), zirconium nitrate (ZrO(NO3)3·xH2O), aluminum nitrate (Al(NO3)3∙9H2O), sodium hydroxide (NaOH), sodium carbonate (Na2CO3) and nitric acid (HNO3) were used for the synthesis of the LDH.

3.2. Synthesis and Characterization

The Ni-containing hydrotalcite-like precursors were synthesized by a co-precipitation method from an aqueous solution of appropriate nitrate salts. During the synthesis, the samples were prepared and denoted as WP1-WP5, respectively, with full composition given in Table 1. An identical synthetic procedure was applied in all cases, e.g., the WP1 sample was synthesized as follows: Ni(NO3)2·6H2O, and Al(NO3)3∙9H2O were dissolved in deionized water (135 mL) at a molar ratio of M2+/M3+ of 0.35. The metallic salt solution was added dropwise into 370 mL of 0.2 M Na2CO3 solution under vigorous stirring. During the synthesis process, the temperature was maintained at 328 K, and pH was kept at 10 by simultaneous addition of 1 M NaOH. The obtained products were collected by centrifugation, washed several times with distilled water, and dried at 323 K in air. Then, the dried solids were ground using an agate mortar. A similar procedure was used to obtain WP2–WP5 precursors. Finally, to prepare the mixed oxide materials, the hydrotalcite precursors were calcined in a muffle furnace at 823 K for 4 h.
The crystalline phases of all the synthesized hydrotalcite-like materials and the calcined products were determined from their XRD patterns, recorded using an X’Pert PRO PANalytical B.V. The X-ray diffractometer used Cu Kα radiation (40 kV, 30 mA) of 0.154 nm. The XRD data were collected between 2θ = 2° and 72°.
Raman spectra were collected in a Thermo Scientific DXR Raman Microscope, working at an exciter line of 532 nm and incorporating a Charge Couple Device (CCD) detector. Spectra were recorded in the 200–2000 cm−1 Raman shift range with an accumulation time of nearly 5 s, 10 mW of power, and 64 scans.
IR spectra of calcined samples were collected in a Nicolet iS50 FT-IR spectrometer. A built-in all reflective, mid- and far-IR diamond attenuated total reflectance (ATR) and diffuse reflectance (DRIFT) modules were used to record the IR spectra. Typically, 100 scans were collected at a resolution of 1 cm−1 and 2 mW of power.
SEM images were obtained using the field-emission scanning electron microscope (FE-SEM) FEI Nova NanoSEM 450 Series under vacuum ca. 10−6 mbar. The WP catalyst sample powders were deposited onto the standard SEM specimen stub for precise positioning under the electron column for imaging. SEM images were collected using the Through Lens Detector (TLD) of secondary electrons at the primary beam energy of 10 keV and 4.8 mm working distance from the pole piece. All images were obtained at a long scan acquisition time (20 μσ) of typically 30 s per image after choosing the inspection region. HRTEM TITAN 60-300 instrument with an X-FEG-type emission gun operating at 80 kV was used to record TEM images. The microscope was equipped with a Cs image corrector and a STEM high-angle annular dark-field detector (HAADF); its point resolution is 0.06 nm in TEM mode.

3.3. Catalytic Tests

The ethanol coupling tests were performed in a tubular fixed-bed reactor (5 mm external diameter) equipped with an online mass spectrometer (MS). Typically, 40 mg of sieved catalyst (20–40 mesh) was loaded into the reactor, and the remaining was filled with quartz sand (20–40 mesh). Before the reaction, the catalyst was pre-treated in situ with He (50 mL min−1) at 773 K with a rate of 10 K s−1 for 3 h. Ethanol vapor and He were mixed into the reaction system after the reactor was cooled to 523 K. The gas flow was set to 60 mL min−1. Before the ethanol admission into the reaction system, ethanol was vaporized at 423 K in a vaporizing chamber. The chromatographically pure ethanol was pumped into the vaporizing chamber at 50 μL min−1 using a high-performance liquid chromatography pump. The pipeline behind the reactor was heated to keep it at 473 K. The products were identified and analyzed by online MS (Hiden, HPR 60). The ethanol conversion and product selectivity were calculated as follows:
X % = n in n unreacted n in ×   100 %
S % = C mol   of   specific   product C mol   of   products ×   100 %
C balance % = C mol   of   products C mol   of   conversed   ethanol ×   100 %
S dehydrogenation % = 100 %     S DEE %
S C - C   coupling % = S C 4 - C 4 + products %
where nin and nunreacted are the moles of initial and unreacted ethanol; Cmol is the mole number of carbon in the products and conversed ethanol; S is the selectivity for DEE (M/z = 59, 74), and C4-C4+ products, such as n-butanol (M/z = 56), ethyl acetate (M/z = 61), butanal (M/z = 72), butyl acetate (M/z = 73), ethyl butyrate (M/z = 101), 2-ethyl-butanal (M/z = 100), hexanal (M/z= 82), n-hexanol (M/z = 69), butyl butyrate (M/z = 89), ethyl caproate (M/z = 99).

3.4. Raman Spectroscopy

The Raman spectra were collected using a confocal Thermo DXR Raman Microscope. The magnification of the objective was 50×, and the laser with 532 nm wavelength and 8 mW of power was used. The parameters were optimized before the analysis. The aperture was 50 µm pinhole, the exposure time was 4 s, and the number of exposures for one spectrum was 20. All the samples were measured in the range 250–2700 cm−1; however, only the 250–1750 cm−1 spectral region is shown. The whole map was 15 × 15 µm, and it was made with a step size of 1.5 µm/1.5 µm in the x/y axis direction. The spectra analysis (baseline correction, deconvolution) was performed using Origin Pro Software (v. 9.1, OriginLab Corporation, Northampton, MA, USA, 2013). The band frequencies, used for spectral deconvolution, were determined from the second derivative spectra. The chemical map analysis was carried out in CytoSpec (v. 2.00.01). Maps were normalized and baseline-corrected before the analysis.

4. Conclusions

The catalysts obtained from hydrotalcite-containing precursors have demonstrated a moderate activity in the dehydrogenation coupling of bio-ethanol to produce more caloric bio-fuels, namely, DEE and n-butanol. It was shown that, at given reaction conditions (623 K and 0.1 MPa), the highest conversion was obtained for the bare Ni0.35Al-CO3 (WP-1) sample. Most likely, the basic sites highly influence catalyst activity. For the Ni and Mg-containing catalyst (Ni0.35Mg0.13 Al-CO3, WP2), the ethanol dehydrogenation was carried out with the highest efficiency with the participation of Ni sites and aldol condensation promoted by acid–base cooperation. Further material modification with Cr, Zr, and Mn increased the redox and oxygen storage capacity (OSC), increasing the number of oxygen vacancies in the corresponding mixed oxide lattice. Thus, in the final WP-3 catalysts (Ni0.35Mg0.13 Mn0.0018 Cr0.0017 Zr0.0054 Al-CO3), the aldol condensation was limited as the acidity increased, and the reaction seemed to be preferential towards DEE formation. Mg exchange on Ca during the catalyst precursor synthesis resulted in derived mixed oxides, with different basicities and/or different basic strength distributions, affecting the overall bio-ethanol conversion and selectivity towards DEE and n-butanol. The effect of promoters on the Ni particles’ stability and the electronic effect on Ni in the dehydrogenation coupling of C1-C2 bio-alcohols towards ethers and n-butanol is currently under detailed investigation under the Waste2Fuel project.
All studied catalysts demonstrated the ability to synthesize coke. The Ni0.35Mg0.13 Al-CO3, catalyst (WP2) demonstrated the highest efficiency, while the Ni- and Ca-containing catalyst (WP4) sample’s efficiency was the lowest. All samples’ structures changed during the reaction; however, WP1 and WP2 probably did not degrade under the reaction conditions used. The WP4 sample’ structure was inhomogeneous.

Author Contributions

Conceptualization and project management, I.S.P.; methodology and software, A.M., A.S.-B., P.P., D.M., R.N., I.S.P., and E.M.S.; formal analysis, A.S.-B., P.P., D.M., R.N., I.S.P., A.L., and E.M.S.; investigation, I.S.P., A.L.G, M.K., A.S.-B., P.P, D.M., A.S., E.W., R.N., and E.M.S.; writing—original draft preparation, I.S.P., D.M., A.L.-G., and E.K.; writing—review and editing, I.S.P., A.L.-G., M.K., A.S.-B., P.P., D.M., R.N., and E.M.S.; visualization, I.S.P., A.L.-G., D.M., P.P., A.S.-B., and M.K.; funding acquisition, I.S.P. All authors have read and agreed to the published version of the manuscript.

Funding

The present research was financially supported by the Foundation for Polish Science, co-financed by the European Regional Development Fund under the Smart Growth Operational Programme PO IR, project no. REINTEGRATION/2016-1/5 Waste into fuel-catalyst and process development for waste biomass valorization, www.waste2fuel.edu.pl. I.S.P. and P.P. extend their sincere appreciation to NAWA The Polish National Agency for Academic Exchange through Bekker grants PPN/BEK/2019/1/00348 “C1-C4 alkanes to oxygenated fuel electrochemical transformation” and PPN/BEK/2019/1/00345 “Nanostructured carbon-based materials doped with metal nanoparticles as catalytic electrode materials for CO2 electroreduction with the use of surface-plasmon enhancement”. The research activity of D.M. was supported by funds from the European Union’s Horizon 2020 research and innovation program under the Marie Skłodowska-Curie grant agreement No. 711859 and by financial resources for science in the years 2017–2021 awarded by the Polish Ministry of Science and Higher Education for the implementation of an international co-financed project.

Conflicts of Interest

The authors declare no conflict of interest.

References

  1. Houghton, J.T.; Jenkins, G.J.; Ephraums, J.J. Intergovernmental Panel on Climate Change; Cambridge University Press: Cambridge, UK, 1990; ISBN 978-0-521-40360-3. [Google Scholar]
  2. Colmenares, J.C.; Colmenares Quintero, R.F.; Pieta, I.S. Catalytic Dry Reforming for Biomass-Based Fuels Processing: Progress and Future Perspectives. Energy Technol. 2016, 4, 881–890. [Google Scholar] [CrossRef] [Green Version]
  3. Gawande, M.B.; Goswami, A.; Felpin, F.X.; Asefa, T.; Huang, X.; Silva, R.; Zou, X.; Zboril, R.; Varma, R.S. Cu and Cu-Based Nanoparticles: Synthesis and Applications in Catalysi. Chem. Rev. 2016, 116, 3722–3811. [Google Scholar] [CrossRef] [PubMed] [Green Version]
  4. Goswami, A.; Rathi, A.K.; Aparicio, C.; Tomanec, O.; Petr, M.; Pocklanova, R.; Gawande, M.B.; Varma, R.S.; Zboril, R. In situ generation of Pd–Pt core–shell nanoparticles on reduced graphene oxide (Pd@ Pt/rGO) using microwaves: Applications in dehalogenation reactions and reduction of olefins. ACS Appl. Mater. Interfaces 2017, 9, 2815–2824. [Google Scholar] [CrossRef] [PubMed]
  5. Lin, X.-X.; Wang, A.-J.; Fang, K.-M.; Yuan, J.; Feng, J.-J. One-Pot Seedless Aqueous Synthesis of Reduced Graphene Oxide (rGO)-Supported Core–Shell Pt@Pd Nanoflowers as Advanced Catalysts for Oxygen Reduction and Hydrogen Evolution. ACS Sustain. Chem. Eng. 2017, 5, 8675–8683. [Google Scholar] [CrossRef]
  6. Gibson, G.; Winne, S.; Levin, S.; Skinner, I.; Tsamis, A.; Twisse, F.; Biedka, M.; Brannigan, C. Transport. State of the Art onAlternative FuelsTransport Systemsin the European Union; Update 2020; European Commission: Brussels, Belgium, 2020. [Google Scholar]
  7. Aresta, M.; Dibenedetto, A.; Quaranta, E. State of the art and perspectives in catalytic processes for CO2 conversion into chemicals and fuels: The distinctive contribution of chemical catalysis and biotechnology. J. Catal. 2016, 343, 2–45. [Google Scholar] [CrossRef]
  8. European Environment Agency. “Energy”. Available online: https://www.eea.europa.eu/themes/energy/intro (accessed on 15 November 2020).
  9. EU Agency, Transport Environment. Roadmap to De-Carbonising European Shipping. Available online: https://www.transportenvironment.org/sites/te/files/publications/2018_11_Roadmap_decarbonising_European_shipping.pdf (accessed on 15 November 2020).
  10. Kowalik, P.; Antoniak-Jurak, K.; Błesznowski, M.; Herrera, M.C.; Larrubia, M.A.; Alemany, L.J.; Pieta, I.S. Biofuel steam reforming catalyst for fuel cell application. Catal. Today 2015, 254, 129. [Google Scholar] [CrossRef]
  11. Zinoviev, S.; Müller-Langer, F.; Das, P.; Bertero, N.; Fornasiero, P.; Kaltschmitt, M.; Centi, G.; Miertus, S. Next-generation biofuels: Survey of emerging technologies and sustainability issues. ChemSusChem 2010, 3, 1106–1133. [Google Scholar] [CrossRef]
  12. Pieta, I.S.; Epling, W.S.; Kazmierczuk, A.; Lisowski, P.; Nowakowski, R.; Serwicka, E. Waste into Fuel-Catalyst and Process Development for MSW Valorisation. Catalysts 2018, 8, 113–128. [Google Scholar] [CrossRef] [Green Version]
  13. Agrafiotis, C.; Roeb, M.; Sattler, C. A review on solar thermal syngas production via redox pair-based water/carbon dioxide splitting thermochemical cycles. Renew. Sustain. Energy Rev. 2015, 42, 254–285. [Google Scholar] [CrossRef]
  14. Rostrup-Nielsen, J. Syngas in Perspective. Catal. Today 2002, 71, 243–247. [Google Scholar] [CrossRef]
  15. EU. Status Review of Renewable Support. Schemes in Europe for 2016 and 2017; Ref: C18-SD-63-0314; Council of European Energy Regulators: Brussels, Belgium, 2018. [Google Scholar]
  16. Matsakas, L.; Gao, Q.; Jansson, S.; Rova, U.; Christakopoulos, P. Green conversion of municipal solid wastes into fuels and chemicals. Electron. J. Biotechnol. 2017, 26, 69–83. [Google Scholar] [CrossRef]
  17. Chum, H.L.; Warner, E.; Seabra, J.E.A.; Macedo, I.C. A comparison of commercial ethanol production systems from Brazilian sugarcane and US corn. Biofuels Bioprod. Biorefining 2014, 8, 205–223. [Google Scholar] [CrossRef]
  18. Susmozas, A.; Martin-Sampedro, R.; Ibarra, D.; Eugenio, M.E.; Iglesias, R.; Manzanares, P.; Moreno, A.D. Process Strategies for the Transition of 1G to Advanced Bioethanol Production. Processes 2020, 8, 1310. [Google Scholar] [CrossRef]
  19. Kraleva, E.; Rodrigues, C.P.; Pohl, M.M.; Ehrich, H.; Noronh, F.B. Syngas production by partial oxidation of ethanol on PtNi/SiO2–CeO2 catalysts. Catal. Sci. Technol. 2019, 9, 634. [Google Scholar] [CrossRef]
  20. Kraleva, E.; Sokolov, S.; Schneider, M.; Ehrich, H. Support effects on the properties of Co and Ni catalysts for the hydrogen production from bio-ethanol partial oxidation. Int. J. Hydr. Energy 2013, 38, 4380–4388. [Google Scholar] [CrossRef]
  21. Busic, A.; Mardetko, N.; Kundas, S.; Morzak, G.; Belskaya, H.; Ivancic Santek, M.; Komes, D.; Novak, S.; Santek, B. Bioethanol Production from Renewable Raw Materials and Its Separation and Purification: A Review. Food Technol Biotechnol. 2018, 56, 289–311. [Google Scholar] [CrossRef] [PubMed]
  22. Karatzos, S.; McMillan, J.; Saddler, J. The Potential and Challenges of “Drop in” Biofuels International Energy Agency Bioenergy. Available online: http://www.ieabioenergy.com/wp-content/uploads/2014/05/P02-The-potential-and-challenges-of-drop-in-biofuels-Karatzos.pdf (accessed on 15 November 2020).
  23. León, M.; Díaz, E.; Ordónez, S. Ethanol catalytic condensation over Mg-Al mixed oxides derived from hydrotalcites. Catal. Today 2011, 164, 436–442. [Google Scholar] [CrossRef]
  24. Bravo-Suárez, J.J.; Subramaniam, B.; Chaudhari, V.R. Vapor-phase methanol and ethanol coupling reactions on CuMgAl mixed metal oxides. Appl. Catal. A 2013, 455, 234–246. [Google Scholar] [CrossRef]
  25. Yang, C.; Meng, Z.Y. Bimolecular condensation of ethanol to 1-butanol catalyzed by Alkali Cation Zeolites. J. Catal. 1993, 142, 37–44. [Google Scholar] [CrossRef]
  26. Ndou, A.S.; Plint, N.; Coville, N.J. Dimerisation of ethanol to butanol over solid-base catalysts. Appl. Catal. A 2003, 251, 337–345. [Google Scholar] [CrossRef]
  27. Gautam, M.; Martin, D.W. Combustion characteristics of higher-alcohol/gasoline blends. Proc. Inst. Mech. Eng. 2000, 214, 497–511. [Google Scholar] [CrossRef]
  28. Herman, R.G. Advances in catalytic synthesis and utilization of higher alcohols. Catal. Today 2000, 55, 233–245. [Google Scholar] [CrossRef]
  29. Ndaba, B.; Chiyanzu, I.; Marx, S. n-Butanol derived from biochemical and chemical routes: A review. Biotechnol. Rep. 2015, 8, 1–9. [Google Scholar] [CrossRef] [PubMed] [Green Version]
  30. Colley, S.W.; Fawcett, C.R.; Rathmell, C.; Tuck, M.W. Process for the Preparation of Ethylacetate. Patent USOO68092.17B1, 26 October 2004. [Google Scholar]
  31. Matthey, J. Davy Technologies. Available online: http://www.davyprotech.com/ (accessed on 15 November 2020).
  32. Duan, X.; Evans, D.G. Layered Double Hydroxides; Springer: Berlin, Germany; New York, NY, USA, 2005. [Google Scholar]
  33. Debek, R.; Zubek, K.; Motak, M.; Costa, P.D.; Grzybek, T. Effect of nickel incorporation into hydrotalcite-based catalyst systems for dry reforming of methane. Res. Chem. Intermed. 2015, 41, 9485–9495. [Google Scholar] [CrossRef]
  34. Bhattacharyya, A.; Chang, V.W.; Schumacher, D.J. CO2 reforming of methane to syngas I: Evaluation of hydrotalcite clay-derived catalysts. Appl. Clay Sci. 1998, 13, 317–328. [Google Scholar] [CrossRef]
  35. Koo, K.Y.; Lee, J.H.; Jung, U.H.; Kim, S.H.; Yoon, W.L. Combined H2O and CO2 reforming of coke oven gas over Ca-promoted Ni/MgAl2O4 catalyst for direct reduced iron production. Fuel 2015, 153, 303–309. [Google Scholar] [CrossRef]
  36. Koo, K.Y.; Lee, S.H.; Jung, U.H.; Roh, H.S.; Yoon, W.L. Syngas production via combined steam and carbon dioxide reforming of methane over Ni-Ce/MgAl2O4 catalysts with enhanced coke resistance. Fuel Process. Technol. 2014, 119, 151–157. [Google Scholar] [CrossRef]
  37. Jang, W.-J.; Jeong, D.-W.; Shim, J.-O.; Kim, H.-M.; Roh, H.-S.; Son, I.H.; Lee, S.J. Combined steam and carbon dioxide reforming of methane and side reactions: Thermodynamic equilibrium analysis and experimental application. Appl. Energy 2016, 173, 80–91. [Google Scholar] [CrossRef]
  38. Frost, R.L.; Palmer, S.J.; Theiss, F. Synthesis and Raman spectroscopic characterisation of hydrotalcites based on the formula Ca6Al2(CO3)(OH)16 4H2O. J. Raman Spectrosc. 2011, 42, 1163–1167. [Google Scholar] [CrossRef] [Green Version]
  39. Jabbour, K.; Massiani, P.; Davidson, A.; Casale, S.; Hassan, N.E. Ordered mesoporous “one-pot” synthesized Ni-Mg(Ca)-Al2O3 as effective and remarkably stable catalysts for combined steam and dry reforming of methane (CSDRM). Appl. Catal. B Environ. 2017, 201, 527–542. [Google Scholar] [CrossRef] [Green Version]
  40. Kong, X.; Zheng, R.; Zhu, Y.; Ding, G.; Zhu, Y.; Li, Y.W. Rational design of Ni-based catalysts derived from hydrotalcite for selective hydrogenation of 5-hydroxymethylfurfural. Green Chem. 2015, 17, 2504–2514. [Google Scholar] [CrossRef]
  41. Lin, X.; Li, R.; Lu, M.; Chen, C.; Li, D.; Zhan, Y.; Jiang, L. Carbon dioxide reforming of methane over Ni catalysts prepared from Ni-Mg-Al layered double hydroxides: Influence of Ni loadings. Fuel 2015, 162, 271–280. [Google Scholar] [CrossRef]
  42. Villegas, J.C.; Giraldo, O.H.; Laubernds, K.; Suib, S.L. New layered double hydroxides containing intercalated manganese oxide species: Synthesis and characterization. Inorg. Chem. 2003, 42, 5621–5631. [Google Scholar] [CrossRef] [PubMed]
  43. Yu, X.; Wang, N.; Chu, W.; Liu, M. Carbon dioxide reforming of methane for syngas production over La-promoted NiMgAl catalysts derived from hydrotalcites. Chem. Eng. J. 2012, 209, 623–632. [Google Scholar] [CrossRef]
  44. Zhang, J.; Zhao, N.; Wei, W.; Sun, Y. Partial oxidation of methane over Ni/Mg/Al/La mixed oxides prepared from layered double hydrotalcites. Int. J. Hydrog. Energy 2010, 35, 11776–11786. [Google Scholar] [CrossRef]
  45. GSTC. Technology: Downstream Conversion Processes; Gasification & Syngas Technologies Council: Arlington, VA, USA, 2016; Available online: http://www.gasification-syngas.org/technology/downstream-conversion-processes/ (accessed on 15 November 2020).
  46. Hernández, W.Y.; Lauwaert, J.; van der Voort, P.; Verberckmoes, A. Recent advances on the utilization of layered double hydroxides (LDHs) and related heterogeneous catalysts in a lignocellulosic-feedstock biorefinery scheme. Green Chem. 2017, 19, 5269–5302. [Google Scholar] [CrossRef] [Green Version]
  47. Serrano-Lotina, A.; Rodríguez, L.; Muñoz, G.; Martin, A.J.; Folgado, M.A.; Daza, L. Biogas reforming over La-NiMgAl catalysts derived from hydrotalcite-like structure: Influence of calcination temperature. Catal. Commun. 2011, 12, 961–967. [Google Scholar] [CrossRef]
  48. Olszówka, J.E.; Karcz, R.; Michalik-Zym, A.; Napruszewska, B.D.; Bielańska, E.; Kryściak-Czerwenka, J.; Socha, R.P.; Nattich-Rak, M.; Krzan, M.; Klimek, A.; et al. Effect of grinding on the physico-chemical properties of Mg-Al hydrotalcite and its performance as a catalyst for Baeyer-Villiger oxidation of cyclohexanone. Catal. Today 2019, 33, 147–153. [Google Scholar] [CrossRef]
  49. Michalik, A.; Napruszewska, B.D.; Walczyk, A.; Krysciak-Czerwenka, J.; Duraczynska, D.; Serwicka, E.M. Synthesis of Nanocrystalline Mg-Al Hydrotalcites in the Presence of Starch-the Effect on Structure and Composition. Materials 2020, 13, 602. [Google Scholar] [CrossRef] [Green Version]
  50. Napruszewska, B.D.; Michalik-Zym, A.; Dula, R.; Bielanska, E.; Rojek, W.; Machej, T.; Socha, R.P.; Litynska-Dobrzynska, L.; Bahranowski, K.; Serwicka, E.M. Composites derived from exfoliated Laponite and Mn-Al hydrotalcite prepared in inverse microemulsion: A new strategy for design of robust VOCs combustion catalysts. Appl. Cat. B 2017, 211, 46–56. [Google Scholar] [CrossRef]
  51. Napruszewska, B.D.; Michalik-Zym, A.; Dula, R.; Duraczyńska, D.; Rojek, W.; Socha, W.; Lityńska-Dobrzyńska, L.; Bahranowski, K.; Serwicka, E.M. VOCs combustion catalysts based on composites of exfoliated organo-Laponite and multimetallic (Mn, Al, Zr, Ce) hydrotalcites prepared by inverse microemulsion. Catal. Today 2019, 333, 182–189. [Google Scholar] [CrossRef]
  52. Yamaguchi, K.; Ebitani, K.; Yoshida, T.; Yoshida, H.; Kaneda, K. Mg-Al Mixed Oxides as Highly Active Acid-BaseCatalysts for Cycloaddition of Carbon Dioxide to Epoxides. J. Am. Chem. Soc. 1999, 121, 4526–4527. [Google Scholar] [CrossRef]
  53. Costantino, U.; Marmottini, F.; Nocchetti, M.; Vivani, R. New Synthetic Routes to Hydrotalcite-Like Compounds− Characterisation and Properties of the Obtained Materials. Eur. J. Inorg. Chem. 1998, 10, 1439–1446. [Google Scholar] [CrossRef]
  54. Galvita, V.; Siddiqi, G.; Sun, P.; Bell, A.T. Ethane dehydrogenation on Pt/Mg(Al)O and PtSn/Mg(Al)O catalysts. J. Catal. 2010, 271, 209–219. [Google Scholar] [CrossRef]
  55. Cavani, F.; Trifiro, F.; Vaccari, A. Hydrotalcite-type anionic clays: Preparation, properties and applications. Catal. Today 1991, 11, 173–301. [Google Scholar] [CrossRef]
  56. NIST. Available online: https://www.nist.gov/pml/productsservices/physical-reference-data (accessed on 17 November 2020).
  57. Konopacka-Łyskawa, D. Synthesis Methods and Favorable Conditions forSpherical Vaterite Precipitation: A Review. Crystals 2019, 9, 223–239. [Google Scholar] [CrossRef] [Green Version]
  58. Popescu, M.A.; Isopescu, R.; Matei, C.; Fagarasan, G.; Plesu, V. Thermal decomposition of calcium carbonate polymorphs precipitatedin the presence of ammonia and alkylamines. Adv. Powder Technol. 2015, 25, 500–507. [Google Scholar] [CrossRef]
  59. ’Cabrera, M.M.; Granados, M.L.; Fierro, J.L.G. Thermal decomposition of a hydrotalcite-containing Cu–Zn–Alprecursor: Thermal methods combined with anin situDRIFT study. Phys. Chem. Chem. Phys. 2002, 4, 3122–3127. [Google Scholar] [CrossRef]
  60. Turco, M.; Bagnasco, G.; Costantino, U.; Marmottini, F.; Montanari, T.; Ramis, G.; Buscac, G. Production of hydrogen from oxidative steam reforming of methanol I. Preparation and characterization of Cu/ZnO/Al2O3 catalysts from a hydrotalcite-like LDH precursor. J. Catal. 2004, 228, 43–55. [Google Scholar] [CrossRef]
  61. Rives, V.; Kannan, S. Layered double hydroxides with the hydrotalcite-type structurecontaining Cu2z, Ni2z and Al3z J. Mater. Chem. 2000, 10, 489–495. [Google Scholar] [CrossRef]
  62. Tamri, S.; Sta, I.; Jlassi, M.; Hajji, M.; Ezzaouia, H. Fabrication of ZnO-NiO nanocomposite thin films and experimental study of the effect of the NiO, ZnO concentration on its physical properties. Mat. Sci. Semicond. Process. 2017, 71, 310–320. [Google Scholar] [CrossRef]
  63. Wang, W.; Liu, Y.; Xua, C.; Zheng, C.; Wang, G. Synthesis of NiOnanorods by a novel simple precursor thermal decomposition approach. Chem. Phys. Lett. 2002, 362, 119–122. [Google Scholar] [CrossRef]
  64. Jang, M.; Yoon, M.; Lee, S.; Kim, H.; Onodera, A.; Kojima, S. A study on the Raman spectra of Al-doped and Ga-doped ZnO ceramics. Curr. Appl. Phys. 2009, 9, 651–657. [Google Scholar] [CrossRef]
  65. Pieta, I.S.; Rathi, A.; Pieta, P.; Nowakowski, R.; Hołdynski, M.; Pisarek, M.; Kaminska, A.; Gawande, M.B.; Zboril, R. Electrocatalytic methanol oxidation over Cu, Ni and bimetallic Cu-Ni nanoparticles supported on graphitic carbon nitride. Appl. Catal. B 2019, 244, 272–283. [Google Scholar] [CrossRef]
  66. Lewalska-Graczyk, A.; Pieta, P.; Garbarino, G.; Busca, G.; Holdynski, M.; Kalisz, G.; Sroka-Bartnicka, A.; Nowakowski, R.; Naushad, M.; Gawande, M.B.; et al. Graphitic Carbon Nitride–Nickel Catalyst: From Material Characterization to Efficient Ethanol Electrooxidation. ACS Sustain. Chem. Eng. 2020, 18, 7244–7255. [Google Scholar] [CrossRef]
  67. Kouketsu, Y.; Mizukami, T.; Mori, H.; Endo, S.; Aoya, M.; Hara, H.; Nakamura, D.; Wallis, A. A new approach to develop the Raman carbonaceous materialgeothermometer for low-grade metamorphism using peak width. Isl. Arc. 2014, 23, 33–50. [Google Scholar] [CrossRef]
  68. di Cosimo, J.I.; Díez, V.K.; Xu, M.; Iglesia, E.; Apesteguía, C.R. Structure and surface and catalytic properties of Mg-Al basic oxides. J. Catal. 1998, 178, 499–510. [Google Scholar] [CrossRef] [Green Version]
  69. Di Cosimo, J.I.; Apesteguía, C.R.; Ginés, M.J.L.; Iglesia, E. Structural requirements and reaction pathways in condensation reactions of alcohols on MgyAlOx catalysts. J. Catal. 2000, 190, 261–275. [Google Scholar] [CrossRef] [Green Version]
  70. Gabriels, D.; Hernández, W.Y.; Sels, B.; van der Voort, P.; Verberckmoes, A. Review of catalytic systems and thermodynamics for the Guerbet condensation reaction and challenges for biomass valorization. Catal. Sci. Technol. 2015, 5, 3876–3902. [Google Scholar] [CrossRef] [Green Version]
  71. Chistyakov, A.V.; Nikolaev, S.A.; Zharova, P.A.; Tsodikov, M.V.; Manenti, F. Linear α-alcohols production from supercritical ethanol over Cu/Al2O3 catalyst. Energy 2019, 166, 569–576. [Google Scholar] [CrossRef]
  72. Gallo, J.M.R.; Bueno, J.M.C.; Schuchardt, U. Catalytic Transformations of Ethanol for Biorefineries. J. Braz. Chem. Soc. 2014, 25, 2229–2243. [Google Scholar] [CrossRef]
  73. Hu, X.X.; Wang, G.; Qin, C.; Xie, X.; Zhang, C.; Xu, W.; Liu, Y. Ligandless nickel-catalyzed transfer hydrogenation of alkenes and alkynes using water as the hydrogen donor. Org. Chem. Front. 2019, 6, 2619–2623. [Google Scholar] [CrossRef]
  74. Zhang, J.; Shi, K.; An, Z.; Zhu, Y.; Shu, X.; Song, H.; Xiang, X.; He, J. Acid-Base Promoted Dehydrogenation Coupling of Ethanol on Supported Ag Particles. Ind. Eng. Chem. Res. 2020, 59, 3342–3350. [Google Scholar] [CrossRef]
Figure 1. XRD patterns of the (A) as prepared, (B) calcined, and (C) after-reaction samples.
Catalysts 11 00660 g001
Figure 2. SEM images of the calcined catalysts WP-1–WP-5 with corresponding TEM images of WP-1’–WP-5’; and SEM images of the spent catalysts WP-1AR–WP-5AR.
Catalysts 11 00660 g002
Figure 3. DRIFT spectra of the calcined WP catalysts.
Catalysts 11 00660 g003
Figure 4. Raman spectra of the (A) calcined and (B) after-reaction WP catalysts.
Catalysts 11 00660 g004
Figure 5. Ethanol conversion and stability of catalysts. Conversion and selectivity were obtained at 100 min; reaction conditions: 250 °C, 0.1 MPa in steady state. (Other products include acetaldehyde, ethyl acetate, butanal, butyl acetate, ethyl butyrate, hexanal, n-hexanol, ethyl 2-ethyl butyrate, butyl butyrate, ethyl caproate, etc., and also CO/CO2 (if any).)
Catalysts 11 00660 g005
Figure 6. Mechanism of ethanol coupling with the proposed pathway of bimolecular dehydration to DEE. Based on [71,72].
Catalysts 11 00660 g006
Figure 7. Deconvoluted Raman spectra of the WP1 (A) before and (B) after the reaction. (C) Raman maps with the distribution of selected WP1 bands (top row) before and (bottom row) after the reaction. Red spectra correspond to the cumulative spectrum consisting of the deconvoluted bands. Other colors of spectra correspond to the single deconvoluted bands.
Catalysts 11 00660 g007
Figure 8. Deconvoluted Raman spectra of the WP2 (A) before and (B) after the reaction. (C) Raman maps with the distribution of selected WP2 bands (top row) before and (bottom row) after the reaction. Red spectra correspond to the cumulative spectrum consisting of the deconvoluted bands. Other colors of spectra correspond to the single deconvoluted bands.
Catalysts 11 00660 g008
Figure 9. Deconvoluted Raman spectra of the WP4 (A) before and (B) after the reaction. (C) Raman maps with the distribution of selected WP4 bands (top row) before and (bottom row) after the reaction. Red spectra correspond to the cumulative spectrum consisting of the deconvoluted bands. Other colors of spectra correspond to the single deconvoluted bands.
Catalysts 11 00660 g009
Table 1. Catalysts and atomic ratios of structural elements relative to Al content.
CatalystAtomic Ratios from Synthesis (Measured by EDS)
NiMgCaMnCrZrAl
WP-1: Ni0.35Al-CO30.35
(0.44)
-----1.00 (1.0)
WP-2: Ni0.35Mg0.13 Al-CO30.35
(0.51)
0.13
(0.15)
----1.00 (1.0)
WP-3: Ni0.35Mg0.13 Mn0.0018 Cr0.0017 Zr0.0054 Al-CO30.35
(0.41)
0.13
(0.22)
-0.0018 (0.0098)0.0017 (0.0088)0.0054 (0.0062)1.00 (1.0)
WP-4: Ni0.35Ca0.13 Al-CO30.35
(0.43)
-0.13
(0.14)
---1.00 (1.0)
WP-5: Ni0.35Ca0.13 Mn0.0018 Cr0.0017 Zr0.0054 Al-CO30.35
(0.41)
-0.13
(0.22)
0.0018 (0.0098)0.0017 (0.0088)0.0054 (0.0062)1.00 (1.0)
Table 2. Ionic radii of the selected elements [56].
ElementIonic Radii, pm (Ion Coordination)
CrystalEffective
Mg86 (+2)72 (+2)
Ca114 (+2)100 (+2)
Al67.5 (+2)53.5 (+2)
Ni83 (+2), 70 (+3)69 (+2), 56 (+3)
Cr87 (+2), 75.5 (+3), 69 (+4)73 (+2), 61.5 (+3), 55 (+4)
Zr86 (+4)72 (+4)
Mn81 (+2), 72 (+3), 67 (+4)67 (+2), 58 (+3), 53 (+4)
Table 3. The physicochemical characterization and activity data.
CatalystSelectivity, mol%
ABET, m2g−1Conv, %Ethyl Ethern-BuOHOthers 1C Balance, mol%
WP-1: Ni0.35Al-CO322397.532.116.351.793.4
WP-2: Ni0.35Mg0.13 Al-CO32169.526.145.728.295.1
WP-3: Ni0.35Mg0.13 Mn0.0018 Cr0.0017 Zr0.0054 Al-CO323012.853.731.115.294.2
WP-4: Ni0.35Ca0.13 Al-CO32075.119.934.745.484.1
WP-5: Ni0.35Ca0.13 Mn0.0018 Cr0.0017 Zr0.0054 Al-CO321210.331.928.839.280.2
1 Other products include acetaldehyde, ethyl acetate, butanal, butyl acetate, ethyl butyrate, 2-ethyl-butanal, hexanal, n-hexanol, butyl butyrate, ethyl caproate, etc., and also CO/CO2 (if any).
Publisher’s Note: MDPI stays neutral with regard to jurisdictional claims in published maps and institutional affiliations.

