Article

In Situ Conditioning of CO2-Rich Syngas during the Synthesis of Methanol

1
Grupo de Energía y Química Sostenibles, Instituto de Catálisis y Petroleoquímica, CSIC, C/Marie Curie 2, 28049 Madrid, Spain
2
Instituto de Catálisis y Petroleoquímica, CSIC, C/Marie Curie 2, 28049 Madrid, Spain
3
Sustainable Technologies for Industrial Processes, TNO Energy Transition, P.O. Box 15, 1755 ZG Petten, The Netherlands
*
Author to whom correspondence should be addressed.
Catalysts 2021, 11(5), 534; https://doi.org/10.3390/catal11050534
Submission received: 29 March 2021 / Revised: 16 April 2021 / Accepted: 16 April 2021 / Published: 21 April 2021
(This article belongs to the Special Issue CO and CO2 Conversion over Heterogeneous Catalysts)

Abstract

:
The synthesis of methanol from biomass-derived syngas can be challenging because of the high CO2 content in the bio-syngas, resulting in lower kinetics and higher catalyst deactivation. This work explores the in situ pre-treatment of a CO2-rich syngas with a CO2/CO ratio equal to 1.9 through the reverse-water gas shift reaction with the aim of adjusting this ratio to a more favorable one for the synthesis of methanol with Cu-based catalysts. Both reactions take place in two catalytic beds placed in the same reactor, thus intensifying the methanol process. The water produced during syngas conditioning is removed by means of a sorbent zeolite to prevent the methanol catalyst deactivation and to shift the equilibrium towards the methanol formation. The combination of the CO2 shifting and the water sorption strategies lead to higher productivities of the catalytic bed and, under certain reaction conditions, to higher methanol productions.

Graphical Abstract

1. Introduction

Methanol production from natural gas or coal-derived syngas is a well-established technology. The central step of this process is the catalytic conversion of syngas into methanol, which is carried out over Cu/ZnO/Al2O3 (CZA) catalysts [1,2,3]. These kinds of catalysts are highly optimized for the production of methanol from CO2-poor syngas, and in the past decades, no substantial changes have been produced regarding catalyst formulation. The process is carried out at 220–300 °C, usually 230 °C, and between 50 and 100 bar [1,2,3], parting from a syngas with a content in CO2 of 2–5% [3,4,5]. The reactions that take part in this system are represented by Equations (1)–(3), which correspond to the CO hydrogenation, CO2 hydrogenation and water-gas shift (WGS) reactions, respectively.
CO + 2H2 Catalysts 11 00534 i001 CH3OH        ∆H0 = −90.6 kJ/mol
CO2 + 3H2 Catalysts 11 00534 i001 CH3OH + H2O   ∆H0 = −49.5 kJ/mol
CO + H2O Catalysts 11 00534 i001 CO2 + H2       ∆H0 = −41.1 kJ/mol
The presence of a small amount of CO2 in the reacting syngas has been proven to enhance methanol productivity, and in fact syngas compositions either with no CO2 [5,6] or higher CO2 contents result in lower performances [4,7]. Indeed, an optimum content in CO2 of 2.4% has been proposed in the literature [8].
In the current energy scenario, it is imperative to decrease CO2 emissions. As for the synthesis of methanol, this can be achieved by shifting the source of syngas from non-renewable sources such as coal or natural gas to renewable sources such as biomass. While obtaining syngas form biomass is possible, it is costly to meet the optimal syngas composition that maximizes the productivity of methanol. Gasification is a key technology for producing biomass-derived syngas [9,10], but the composition of the final product through this process is highly dependent on the type of biomass, the type of gasifier and the reaction conditions [11,12]. Certain flexible technologies allow to modify the final composition of the syngas [13,14], but, in general terms, biomass-derived syngas, or bio-syngas, is known to be rich in CO2 [15,16]. In fact, the concentration of CO2 in the biomass-derived syngas can be as high as that of CO when the feedstock used is palm oil wastes, or even twice as high when the bio-syngas is produced from empty fruit bunch, α-cellulose or municipal solid waste [12,17]. The latter has been demonstrated to produce a syngas with a CO2/CO ratio of 1.9 when subjected to sorption-enhanced gasification [17]. The high CO2 content in the syngas obtained from biomass represents a drawback in the use of bio-syngas as feedstock for the production of methanol. Therefore, strategies to cope with the high amount of CO2 in the biomass-derived syngas must be developed to maintaining high methanol productivity.
Thermodynamically, the increase in the CO2 content in the syngas is unfavorable for methanol production, as will be verified in the experimental section. This is a direct consequence of the fact that the CO equilibrium conversion is much higher than that of CO2, at least under the most relevant reaction conditions for the synthesis of methanol. However, thermodynamics are not the only factor hampering the production of methanol from CO2-rich syngas. The performance of the state-of-the-art catalysts for this process, i.e., Cu/ZnO/Al2O3 (CZA), is strongly affected by the CO2 content in the syngas. As demonstrated by in situ EXAFS analyses of Cu-ZnO samples, the structure of the copper particles is dependent on the syngas compositions to which they are exposed, as well as on the presence of water [18,19]. For instance, a flattening of the metallic particles with the increase of the reductive potential of the treatment gas was observed [19]. These variations lead to changes in the quantity of the surface metallic copper in the catalyst [19], which is directly related to the production of methanol [2]. Additionally, the increase of CO2 in the syngas promotes the partial pressure of water in the reacting system, either through the reverse-WGS (Equation (3) reversed) or through the direct hydrogenation of CO2, which has been reported to occur at the most typical reaction conditions of methanol production [8,20]. It is well documented that increasing the concentration of water in the reaction medium results in the sintering of the copper particles, hence resulting in catalyst deactivation [21,22,23].
In view of this, decreasing the CO2/CO ratio in the bio-syngas is desirable when intended for methanol production. Shifting the CO2/CO ratio to obtain a syngas richer in CO can be achieved through the reverse-WGS (r-WGS), which is an endothermic reaction, and is hence favored at high temperature. The CO2/CO ratio of a bio-syngas produced from municipal solid waste could be lowered from 1.9 to 1.6 at 240 °C or 1.47 at 270 °C through a r-WGS stage, which could act as a pre-treatment to condition the syngas prior to the methanol synthesis reaction. The low-temperature r-WGS is catalyzed by CZA catalysts [24,25], similar to those used for the synthesis of methanol. Specifically, CZA materials are catalytically active for the low-temperature (LT) WGS reaction, and, as a matter of fact, are used as the standard industrial catalyst [26]. The LT-WGS is carried out between 190 and 250 °C and at 30 bar, considering the dew point of the water at the reaction pressure the lower limit of the temperature. Low temperatures are preferred for the WGS process in order to increase the CO equilibrium conversion, but the activity of the catalyst increases with the temperature [27]. Thus, the temperature at which the CZA catalysts are active for the (r-)WGS reaction is similar to that of the methanol synthesis reaction over CZA materials. An example of this strategy is the CAMERE process [28], in which methanol is produced via CO2 hydrogenation. They developed and evaluated the use of a r-WGS reactor serially aligned to a methanol synthesis reactor using a separator to remove the water produced in the r-WGS reaction and a compressor to inject the syngas to the methanol reactor.
In this work, the combination of a pre-treatment stage, based on the r-WGS reaction, and a methanol synthesis stage, in the same reactor, has been proposed to intensify the methanol production from CO2-rich syngas. The objective is to discern whether employing a fraction of the CZA catalyst for the in situ conditioning of a CO2-rich syngas by r-WGS is positive for the synthesis of methanol over CZA. Reducing the CO2 content in the syngas is expected to result in superior performance of the methanol synthesis catalyst. Additionally, a lower CO2 content in the syngas that enters to the methanol synthesis stage would increase the methanol concentration at the equilibrium, provided that the water produced in the pre-treatment is removed between stages (and only in this case). For this reason, the incorporation of a sorbent material between the r-WGS reaction and the methanol synthesis has been considered during the design of the proposed configurations of dual catalytic beds.

2. Results and Discussion

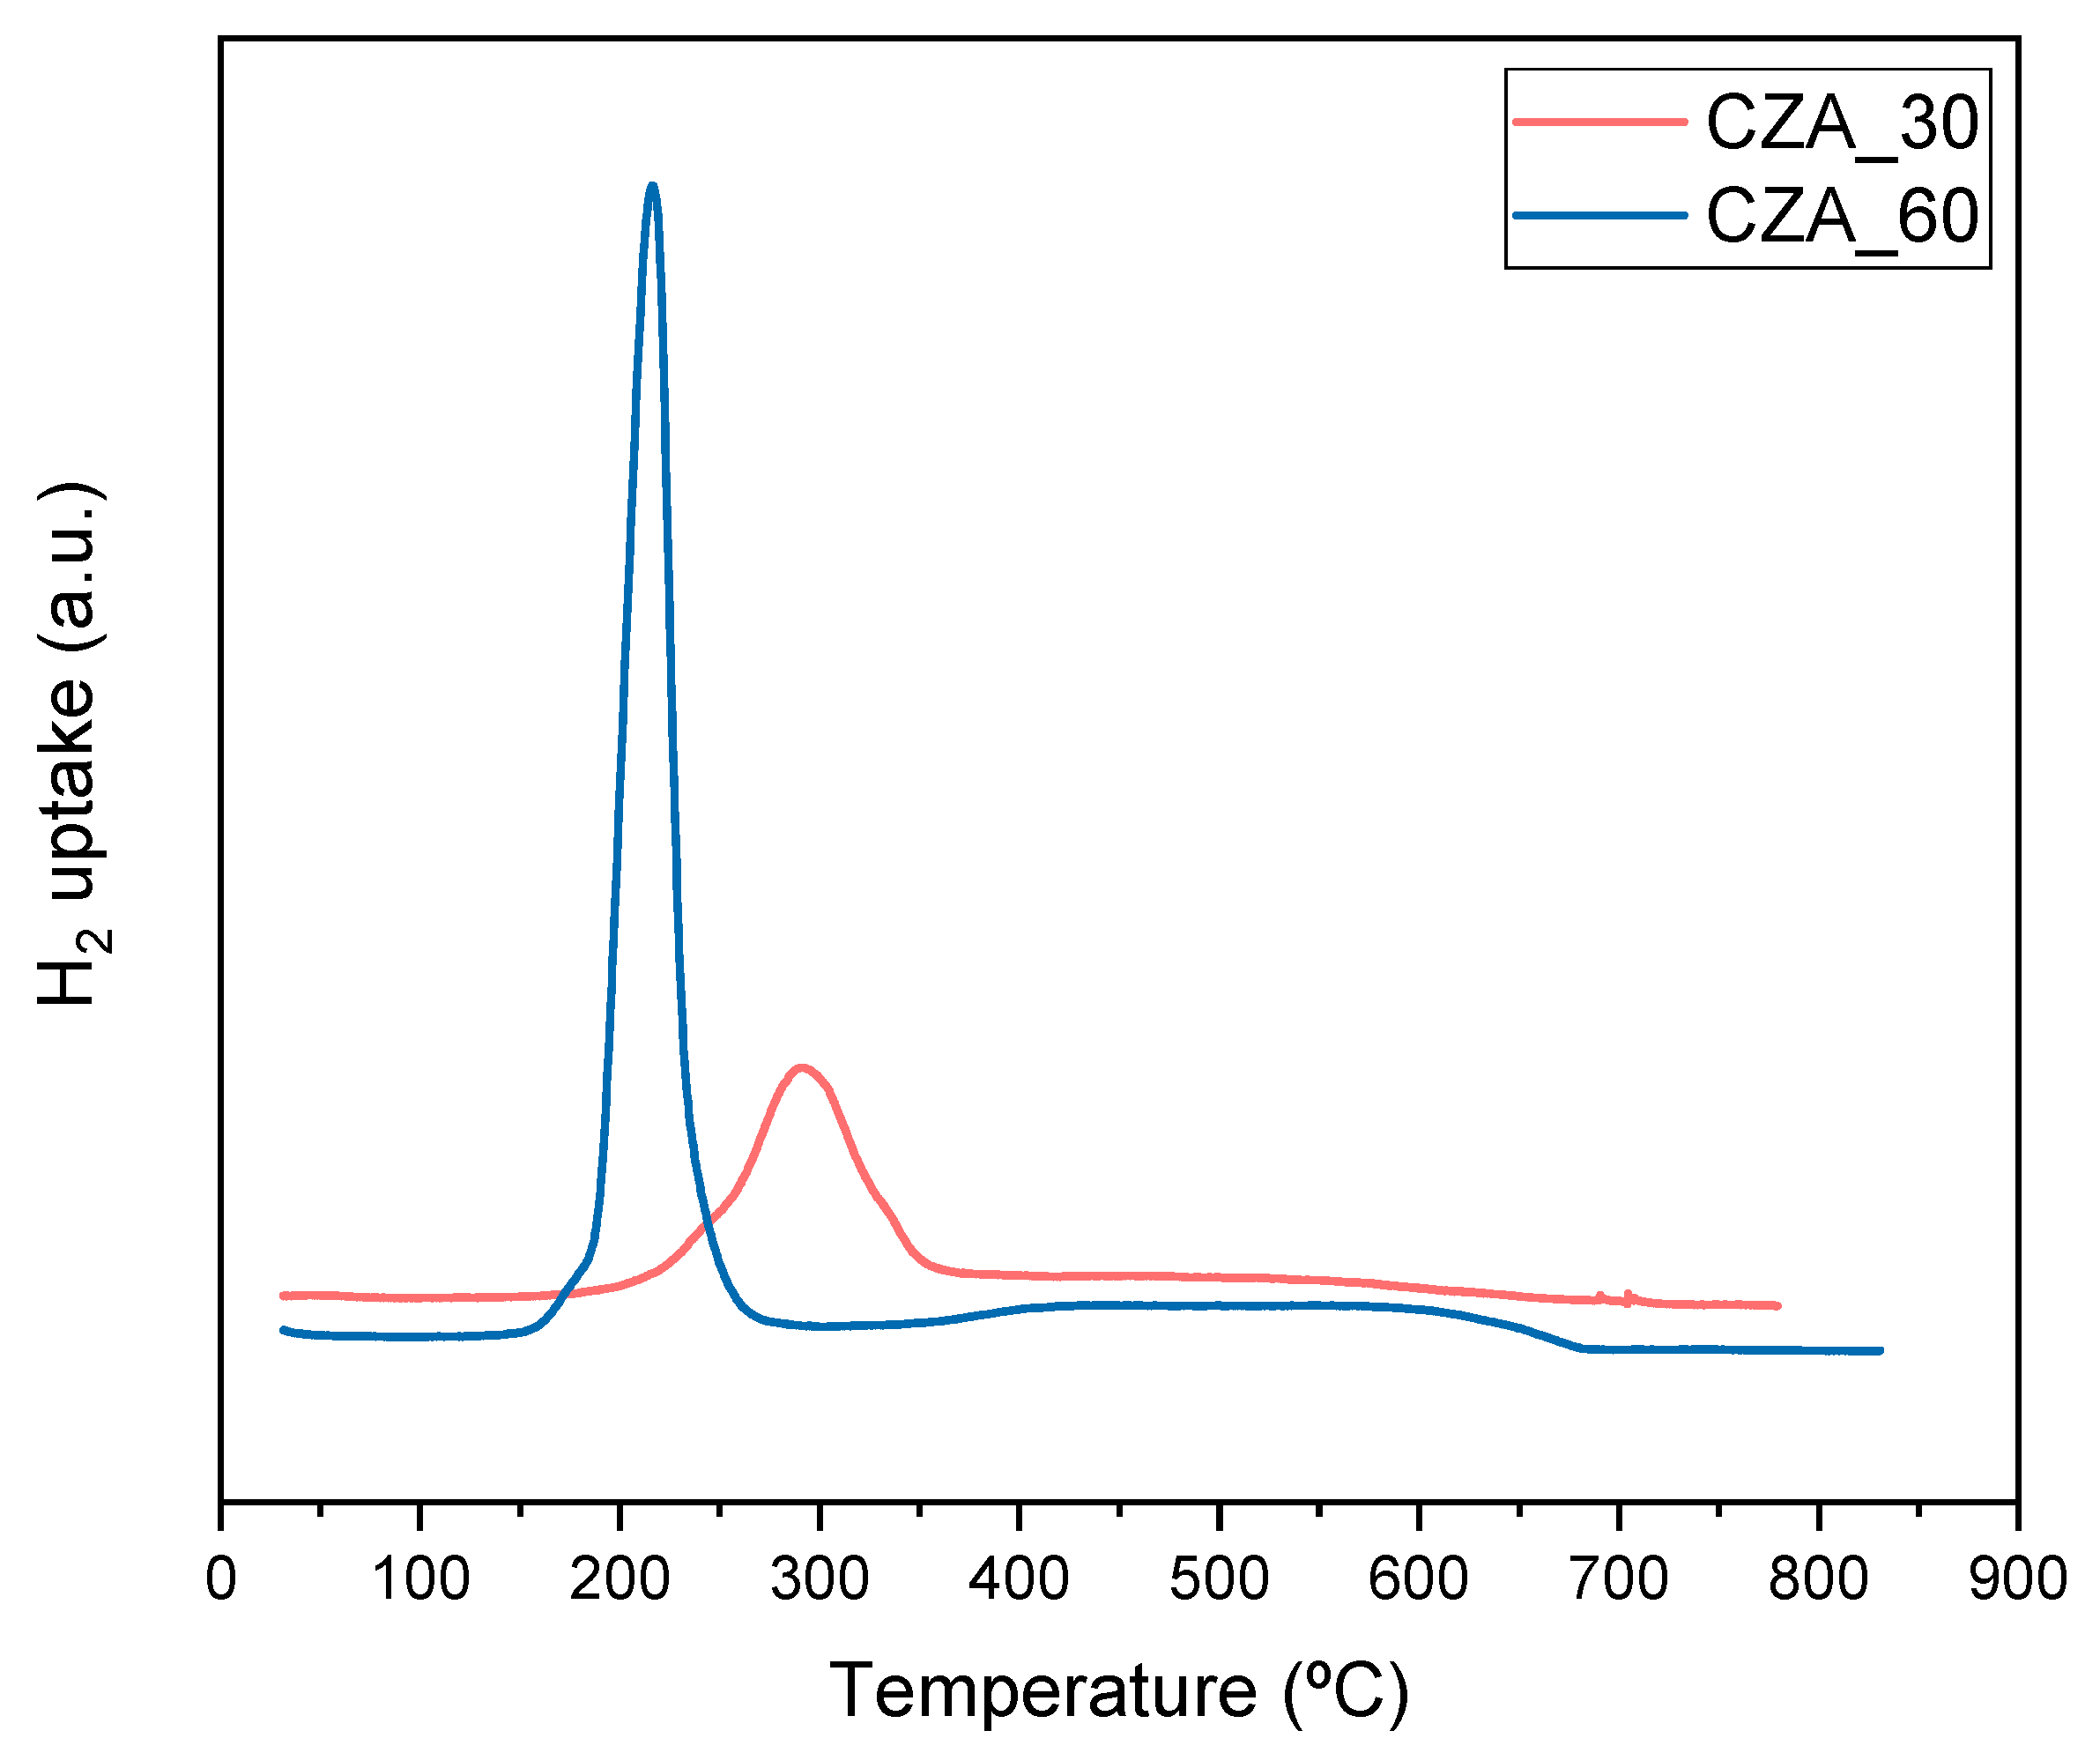
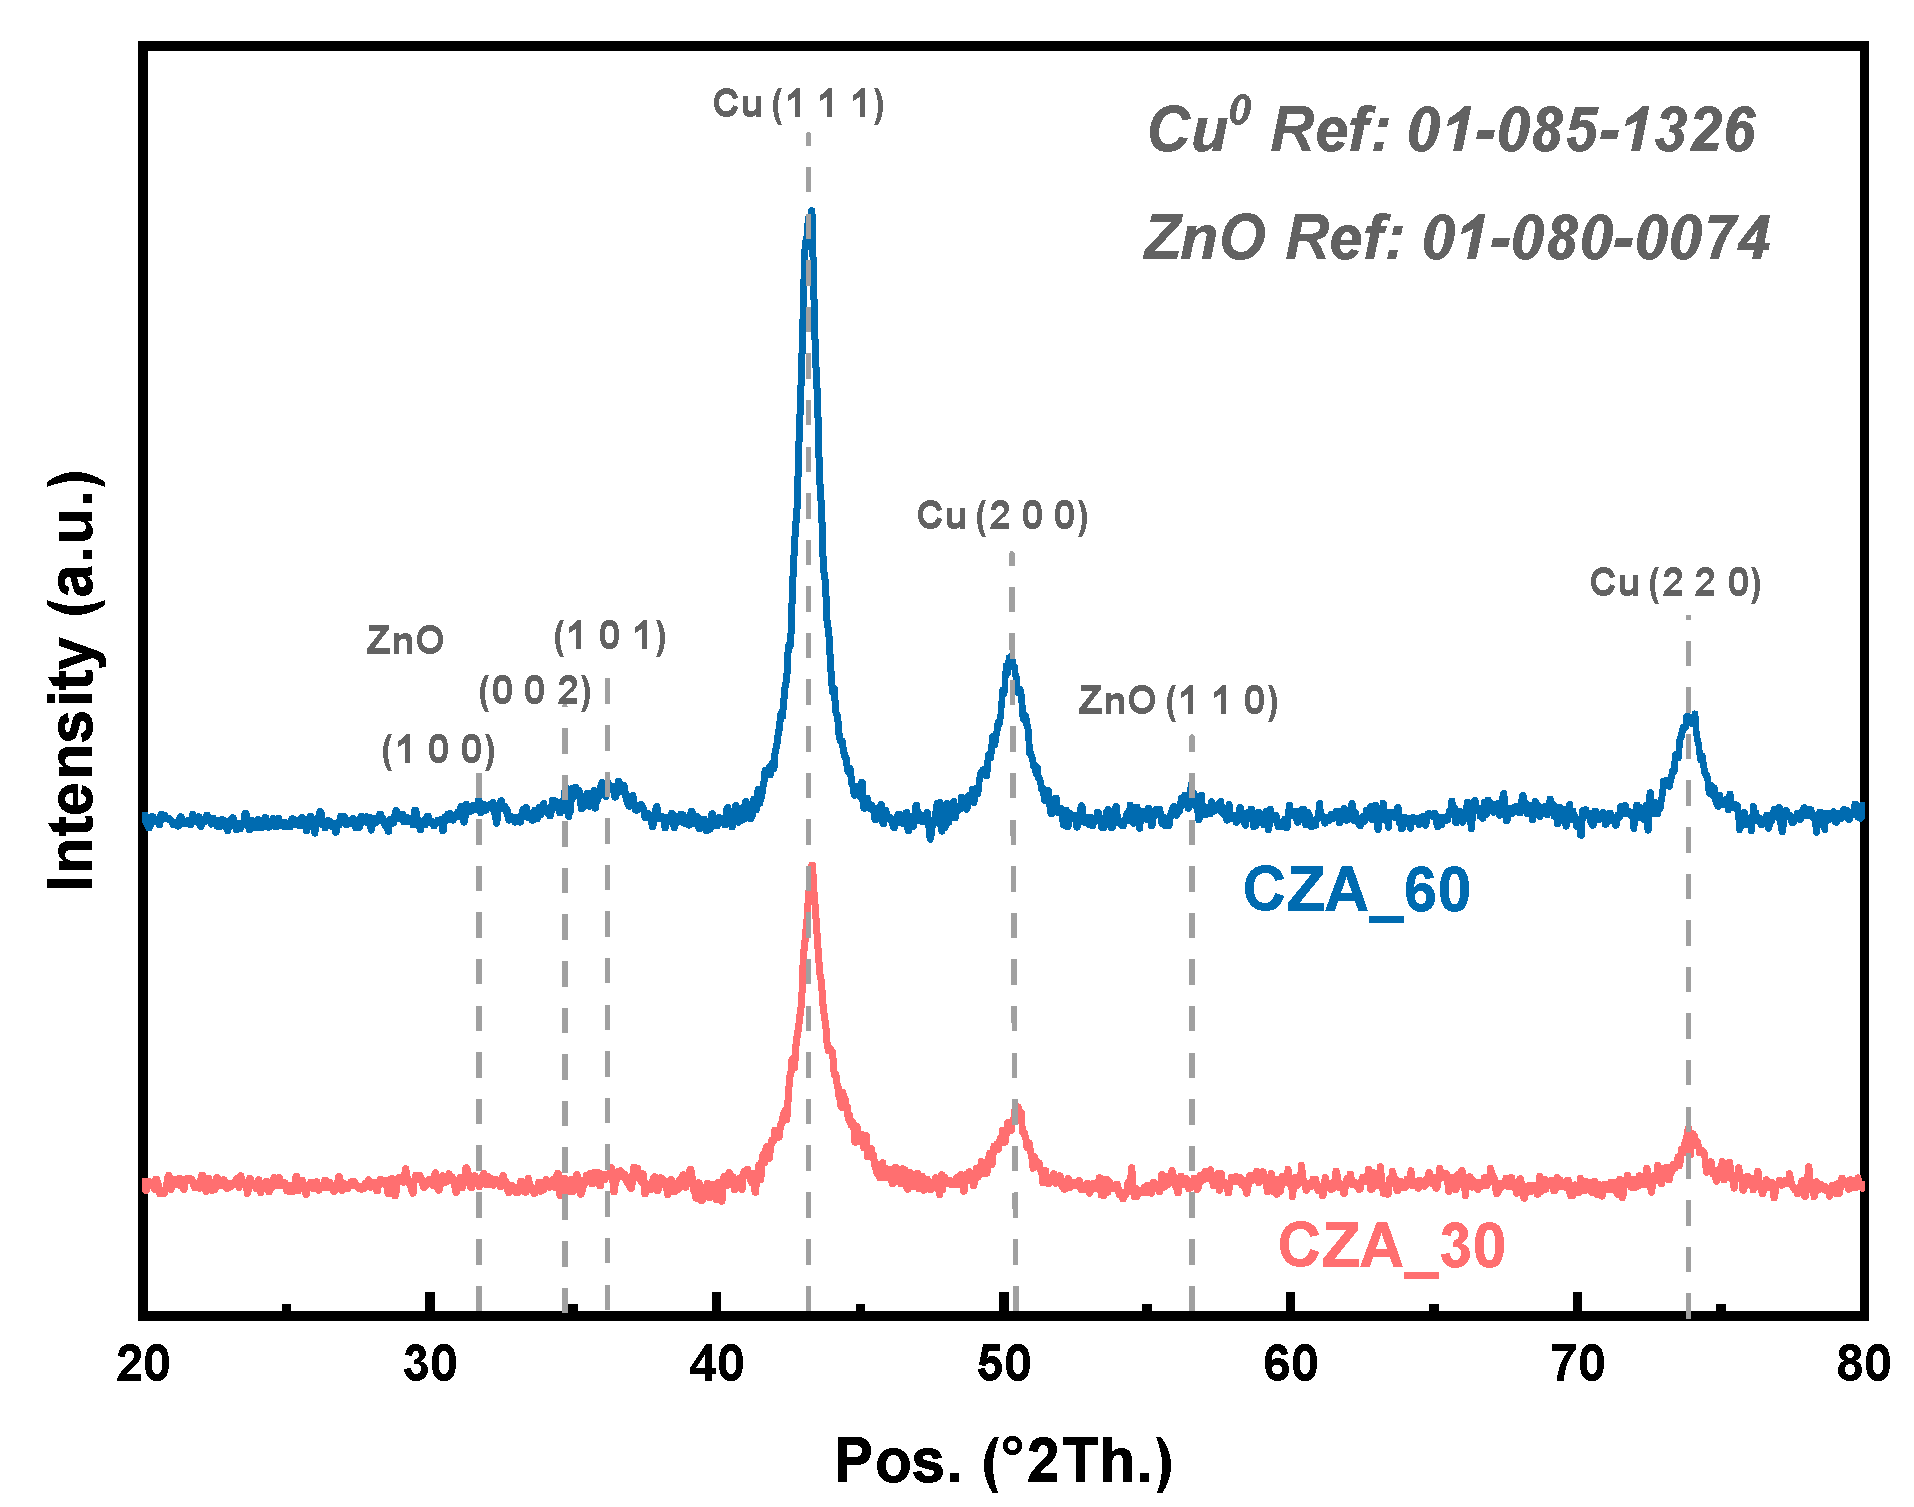
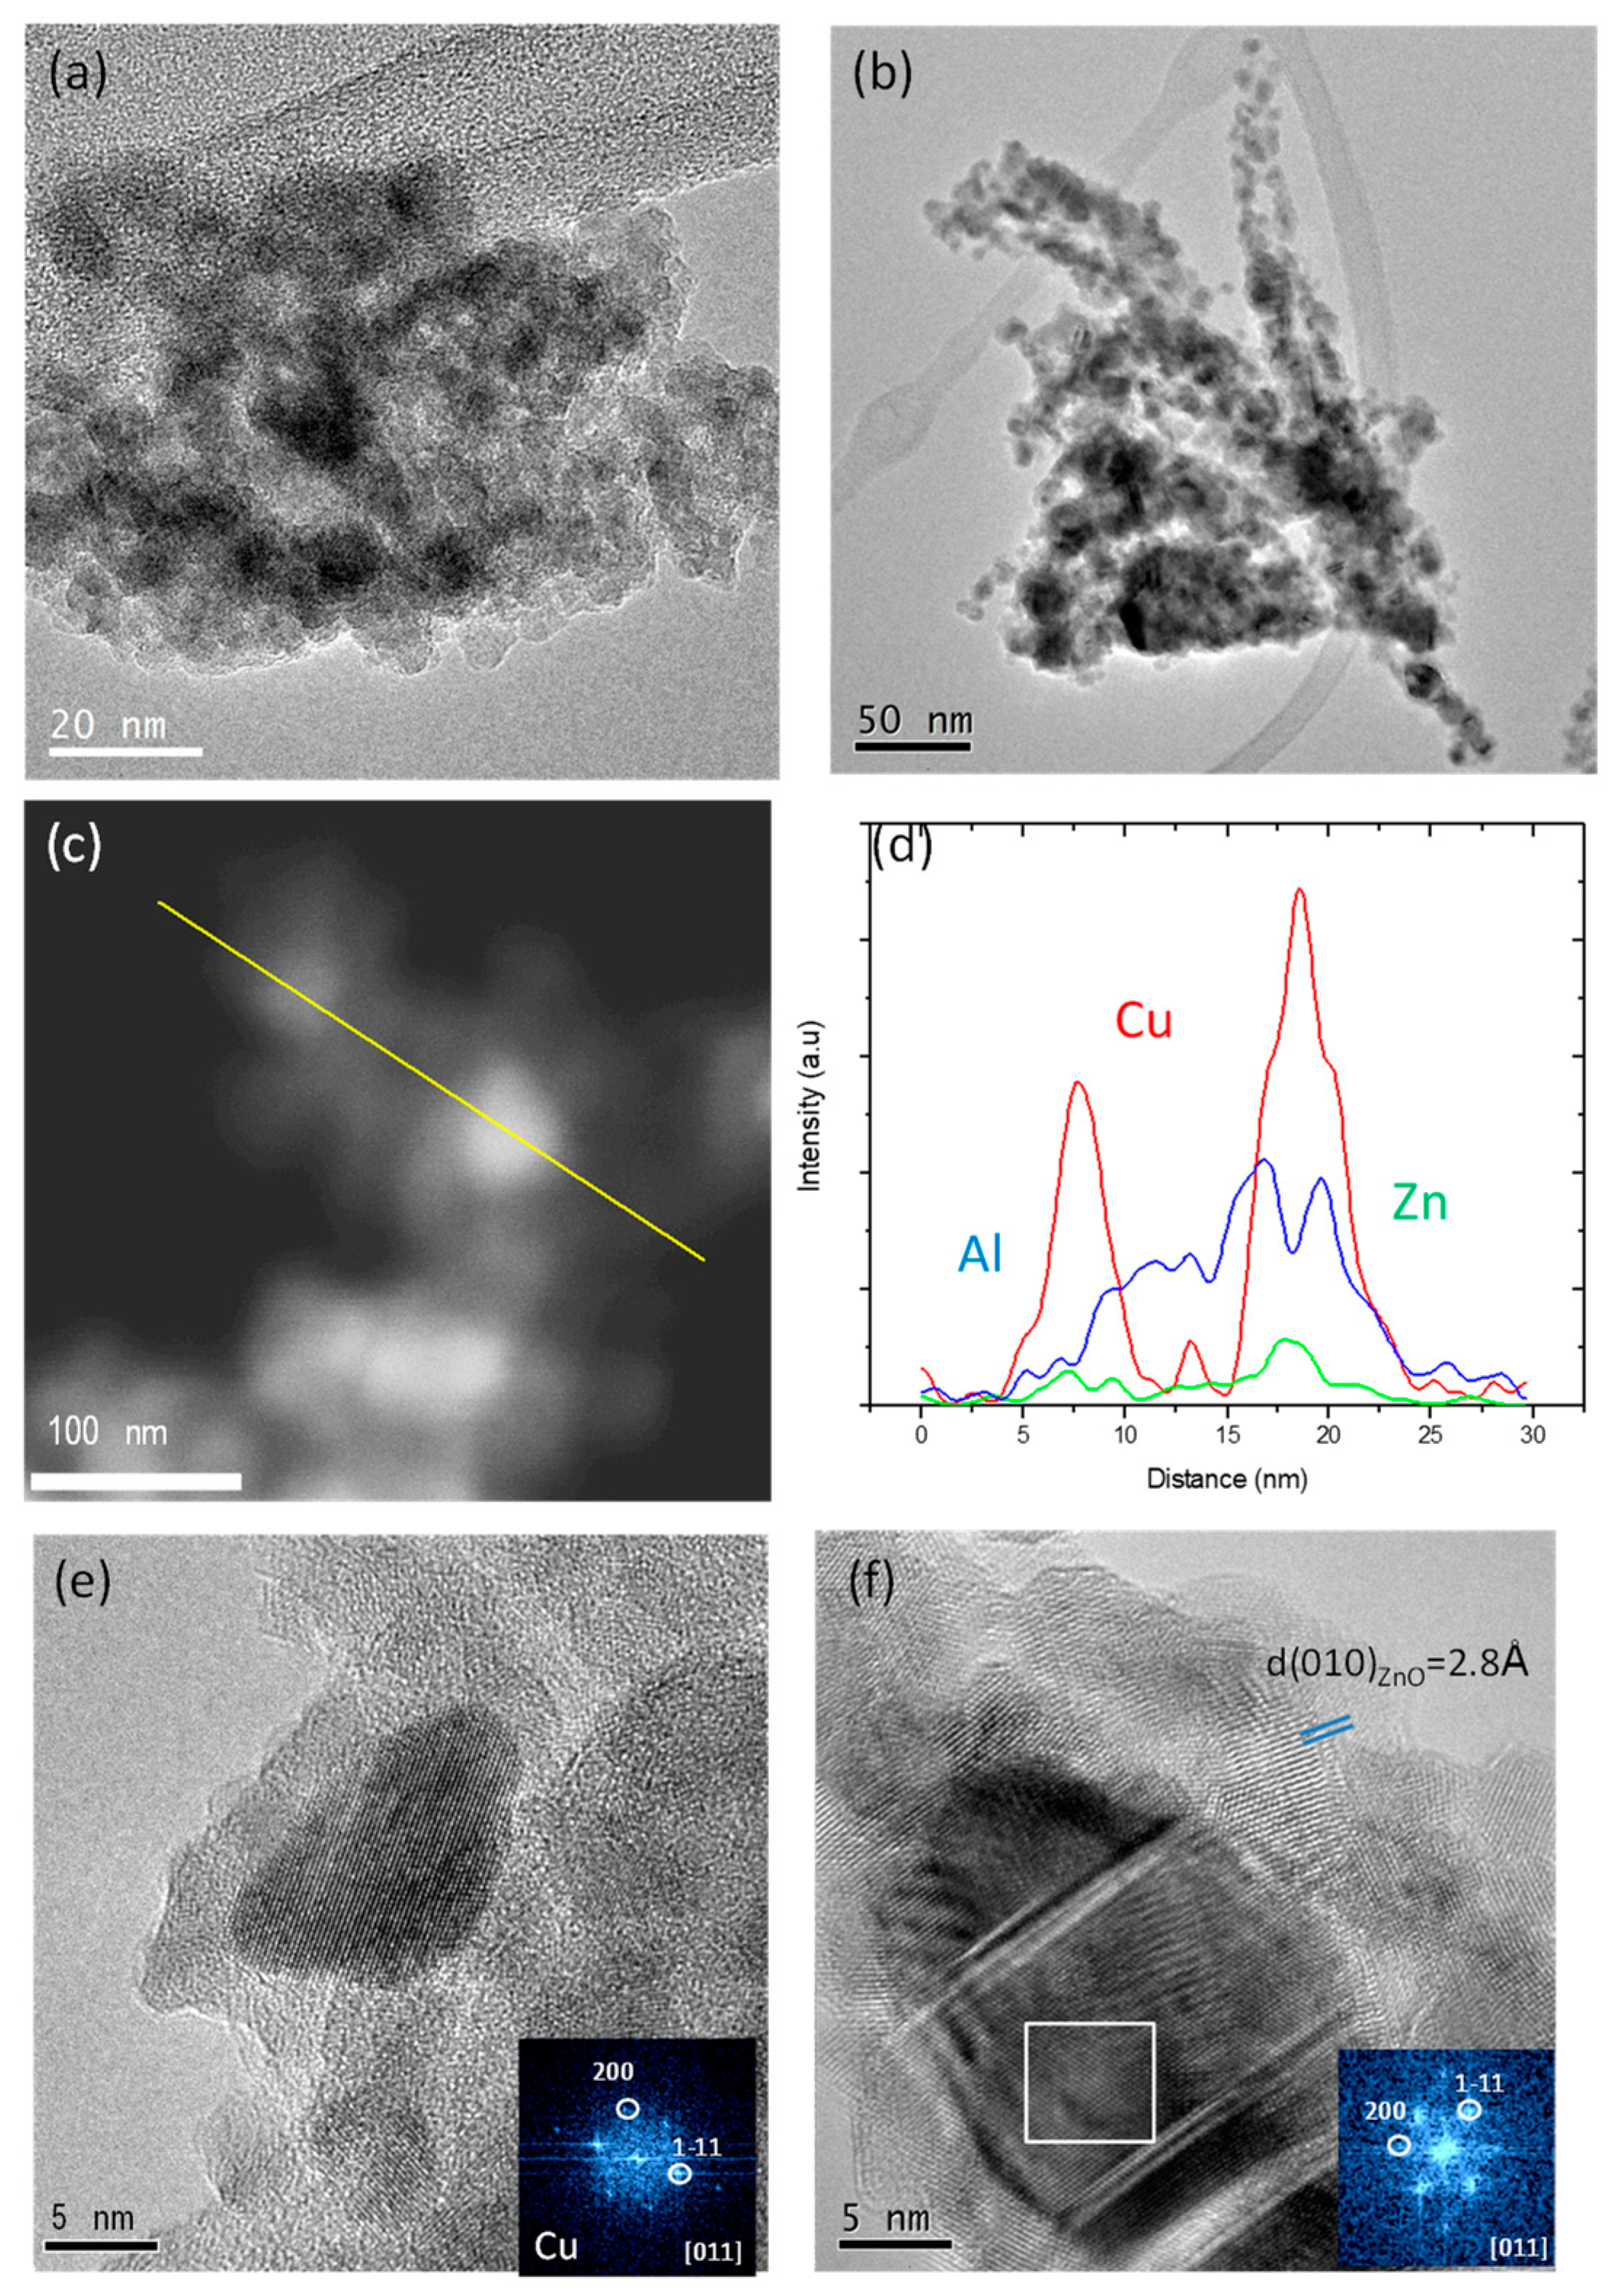
2.1. Characterization Results

Table 1 shows the expected and actual compositions of the synthesized catalysts, as well as their surface area.
The ICP-OES results indicate that the composition of the catalysts obtained by coprecipitation of the precursors is in good agreement with the targeted values. The BET area of CZA_30 is ca. 3 times higher than that of CZA_60, which is not surprising due to the higher content of Al2O3 in the former catalyst. Copper dispersion in CZA_60 is lower than that of the CZA_30 but, due to the higher Cu loading, its Cu surface area is higher.
The temperature programmed reduction (TPR) profiles of the catalysts are shown in Figure 1. The reduction profile of CZA_60 displays a broad peak between 150 and 275 °C, shifting to higher temperatures (between 200 and 350 °C) in CZA_30. This peak characterizes the reduction processes of the CuO particles. The shifting of the reduction peaks to higher temperatures has been ascribed to a lower reducibility of copper by strong interaction with Al2O3, forming a Cu-Al spinel at higher alumina content [29].
The surface composition of the reduced catalysts (30 min at 250 °C under 20% H2 in N2, ramp 2 °C/min) was analyzed by X-ray photoelectron spectra (XPS). The spectra of both catalysts display peaks of Cu, Zn, Al and O. The binding energy of the Cu 2p3/2 core-level at 932.5 eV is consistent with the presence of metallic Cu, although the presence of a weak shake-up satellite at 944 eV indicates that at least part of the copper was oxidized to CuO during the transfer to the XPS pre-chamber. The relative atomic surface composition of the catalyst, calculated from the integration of the Cu 2p3/2, Zn 2p3/2 and Al 2p core-levels (using a Shirley background) of the reduced samples obtained by XPS are summarized in Table 2.
The Cu/ZnO ratios obtained from the XPS analysis for both samples are close to 1, which is half of what is expected from ICP-OES analysis. This could indicate sintering of copper during the reduction process. On the other hand, the content of alumina on the surface is much higher than expected (see Table 1), showing an important segregation of dispersed Al2O3 (see X-ray diffraction (XRD) results below). This segregation is relatively higher in the CA_60 catalyst, with a lower content of alumina.
Figure 2 shows the XRD patterns of the reduced catalysts, CZA_60 and CZA_30. The diffractograms display the set of diffractions that can be ascribed to the cubic-phase Cu0 (Ref. Pattern 01-085-1326, space group Fm3m). Please note that the catalysts are treated in situ under H2 atmosphere at 250 °C, which is the reduction temperature of the catalysts in the reactor. The diffractogram for CZA_60 also displays a set of diffraction lines that can be ascribed to the hexagonal-phase ZnO (Ref. Pattern 01-080-0074, space group P63mc). The diffractograms lack of diffraction lines that can be ascribed to Al2O3, which suggests the formation of an amorphous Al2O3 phase. The Cu0 crystalline size was determined by the Scherrer equation using the Cu (1 1 1) reflection. Values of 10.3 and 9.5 nm were obtained for the CZA_60 and CZA_30 catalysts, respectively. These values are consistent with the dispersion values obtained from the N2O chemisorption experiments, as reported in Table 1.
Figure 3a,b show representative conventional Transmission Electron Microscopy (TEM) micrographs of samples CZA_30 and CZA_60, respectively. As observed, both samples are composed of agglomerates of smaller particles. The agglomerates in CZA_30 are more compact, while in the CZA_60 they have needle shape. More detailed analyses through STEM-HAADF (Scanning Transmission Electron Microscopy–High Angle Annular Dark Field) and EDX (Energy Dispersive X-ray Spectroscopy) line profile are shown in Figure 3c,d. As observed, the Cu particles appear embedded (or surrounded) by the ZnO and Al2O3 phases. This is evident in the HRTEM (High Resolution–TEM) images of Figure 3e,f. In both cases, a Cu particle oriented down the [010] zone axis and surrounded by ZnO and Al2O3 is displayed. In the case of CZA_30 (Figure 3e), the particle displays a smaller particle size and the ZnO and Al2O3 phases present also smaller sizes and more disorder than in the case of CZA_60 (Figure 3f), where Cu particles clearly show the presence of crystalline defects such as stacking faults. In the latter, ZnO can be clearly identified by the 2.8 A interplanar distance attributable to the (010) plane of the P63mc space group.
Figure 4a,b show the elemental distribution of Cu, Zn, and Al from EDX maps, pointing out a heterogeneous dispersion of the three phases in both samples.

2.2. Performance of CZA_30 for the WGS

The aim of this work is to study the effect of modifying the CO2/CO ratio in the syngas feed used for the synthesis of methanol from syngas via in situ r-WGS reaction. Therefore, we first tested performance of CZA_30. We observed that under the conditions studied in this work, CZA_30 only displayed activity for the r-WGS reaction. CO2 and CO (H2O and H2 are not detected in our analytical setup) are the only products detected at the outlet of the reactor. The outlet CO2/CO ratios at different conditions studied in this work are shown in Table 3. The CO2/CO thermodynamic equilibrium ratios are also shown for comparison.
Although the different methanol synthesis processes proposed in this work were tested at a total GHSV of 7500 mLsyngas/h/mLcatalytic bed (henceforth, h−1) to compare reactors with a similar size operating with similar feed flows, the r-WGS reaction was tested at 15,000 h−1. This decision is based on the assumption that the real GHSV of the syngas along the CZA_30 in the combined beds would be about 15,000 h−1. By testing the r-WGS catalyst at this GHSV, we obtained a better estimation of the composition of the gas that enters the methanol catalyst in the combined beds after being pre-treated.
The results in Table 3 indicate that the CZA_30 catalyst effectively provides a decrease of the CO2/CO ratio, which at 270 °C reaches a value close to that of the equilibrium at 25 and 50 bar, respectively. The decrease in this ratio is less evident at 240 °C, from 1.9 to 1.8, showing that the temperature has a major effect on the catalytic activity of CZA_30. Also, the CO2 conversion at the equilibrium decreases with the decreasing temperature, as reflected by the higher CO2/CO conversion at the equilibrium at 240 °C. These results anticipate the importance of the process conditions, especially the temperature, when trying to increase the methanol production using the r-WGS pre-treatment.

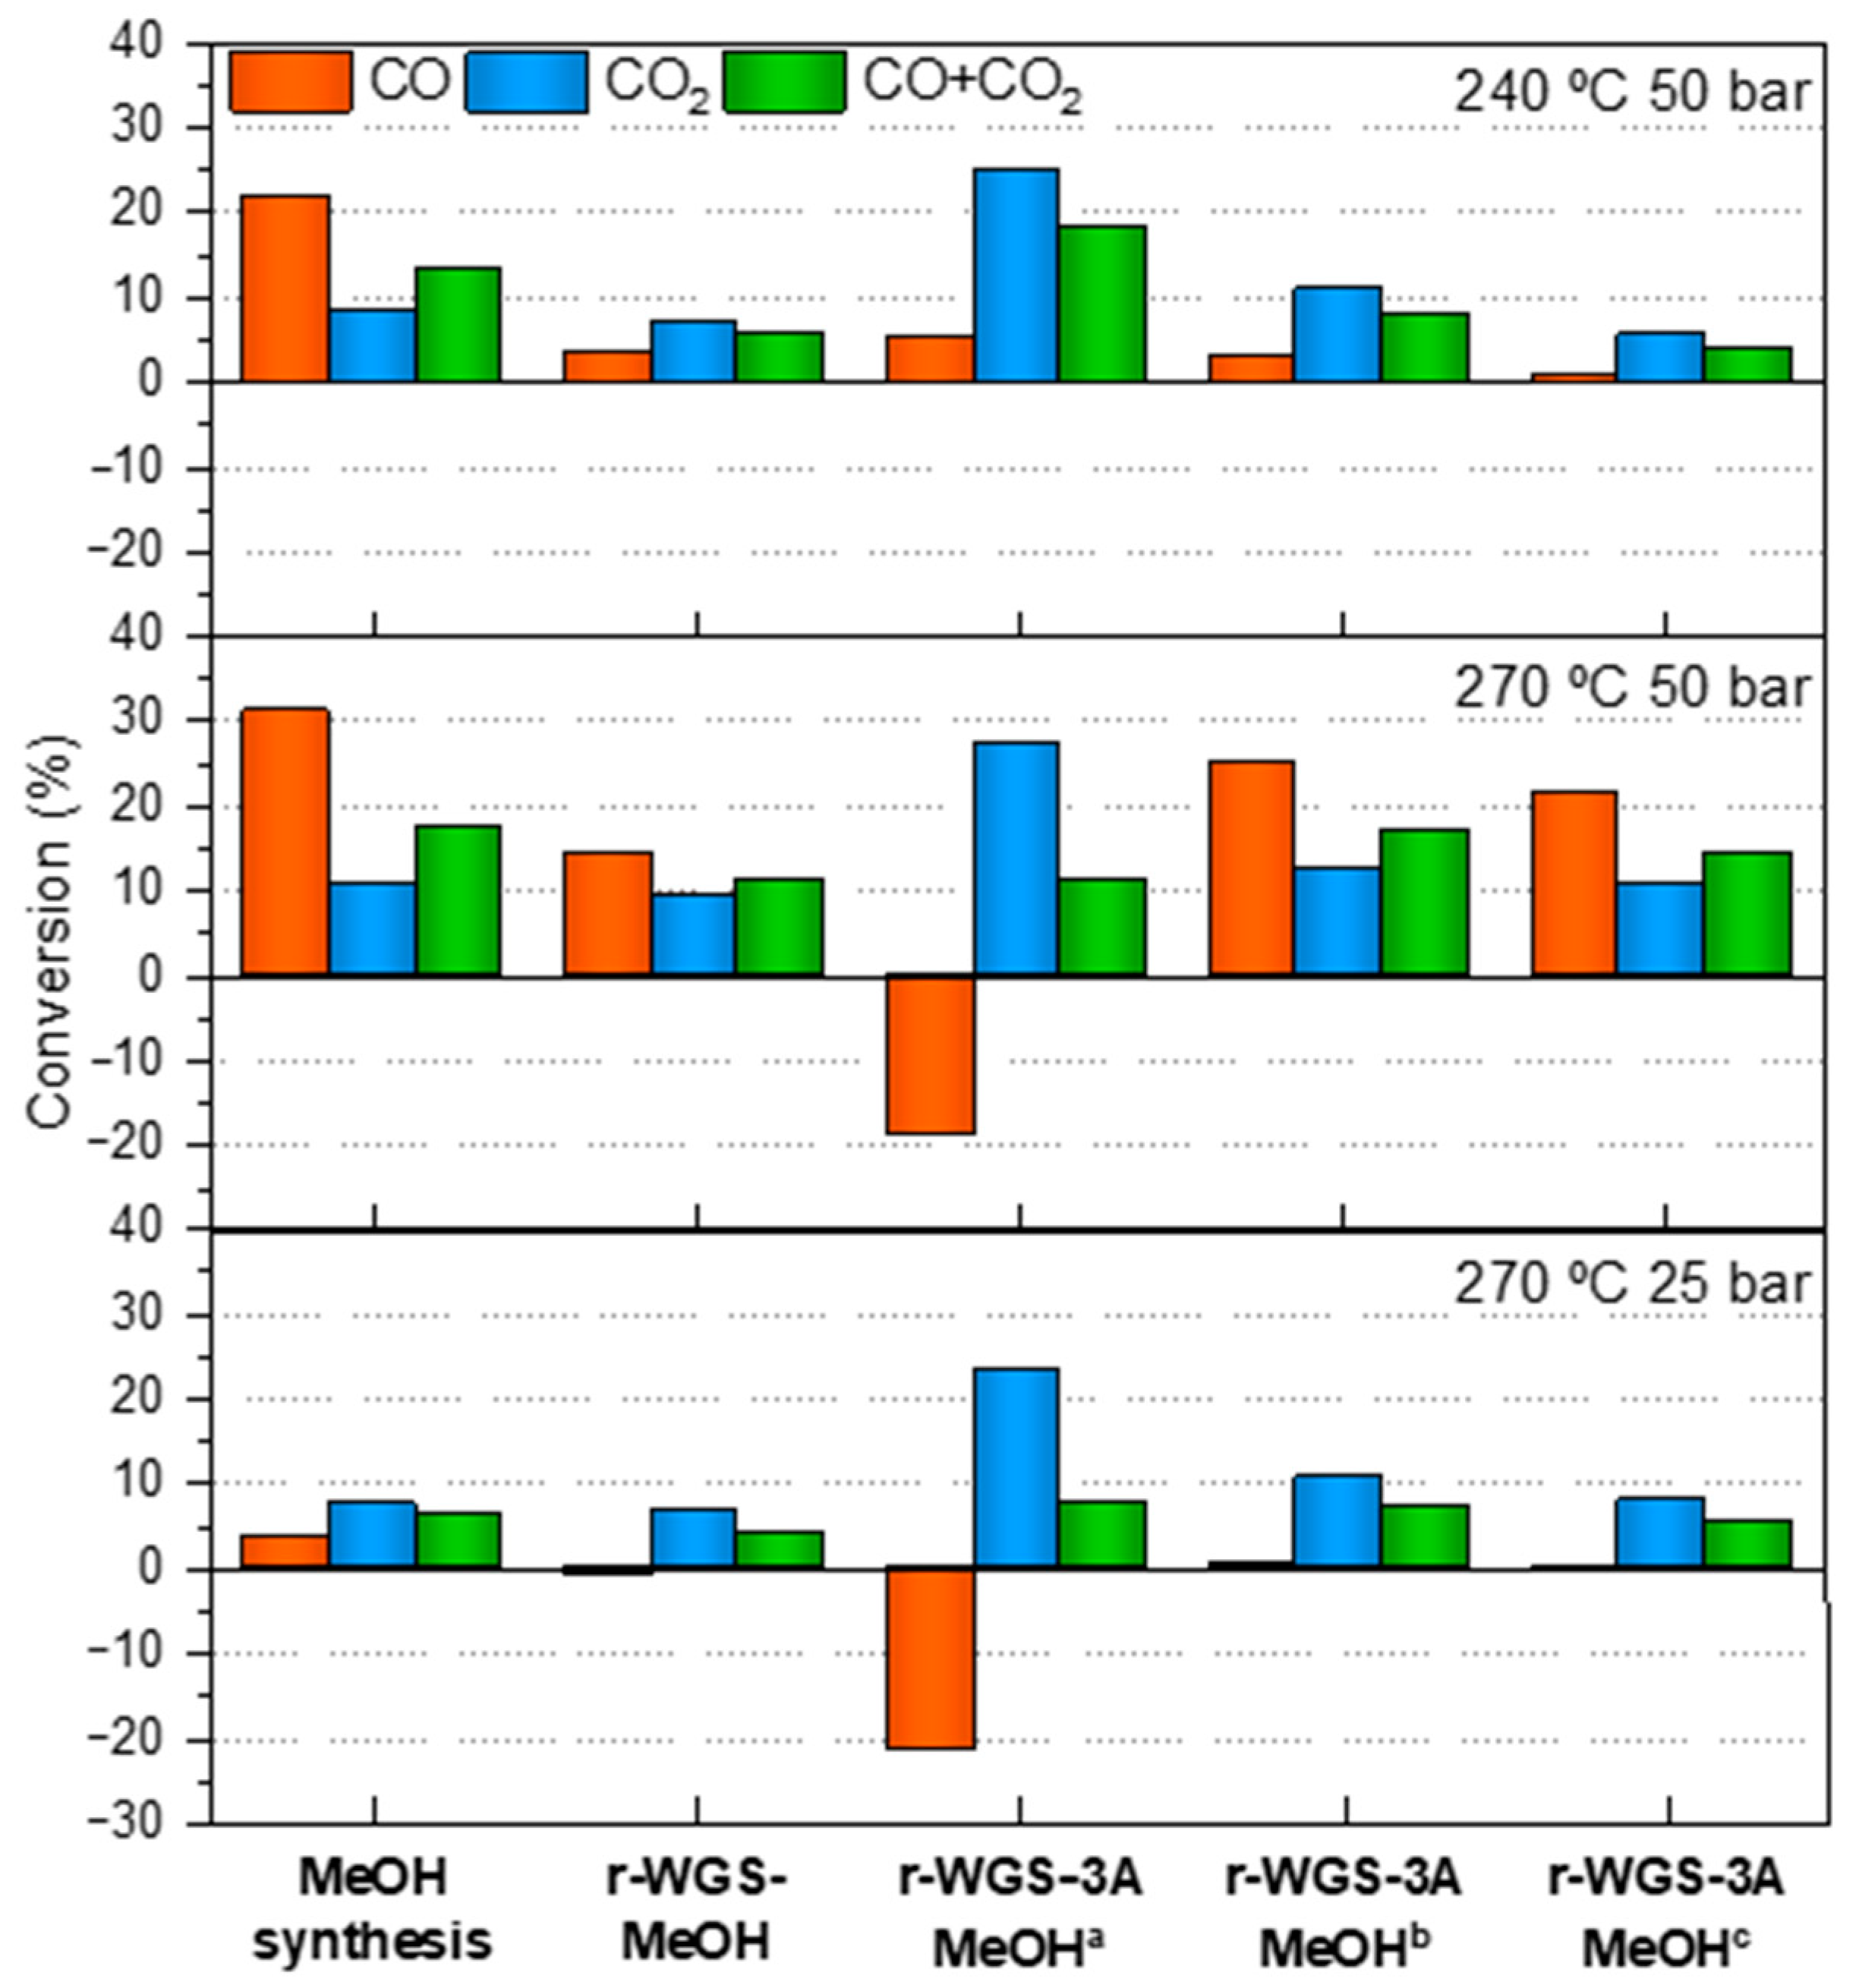
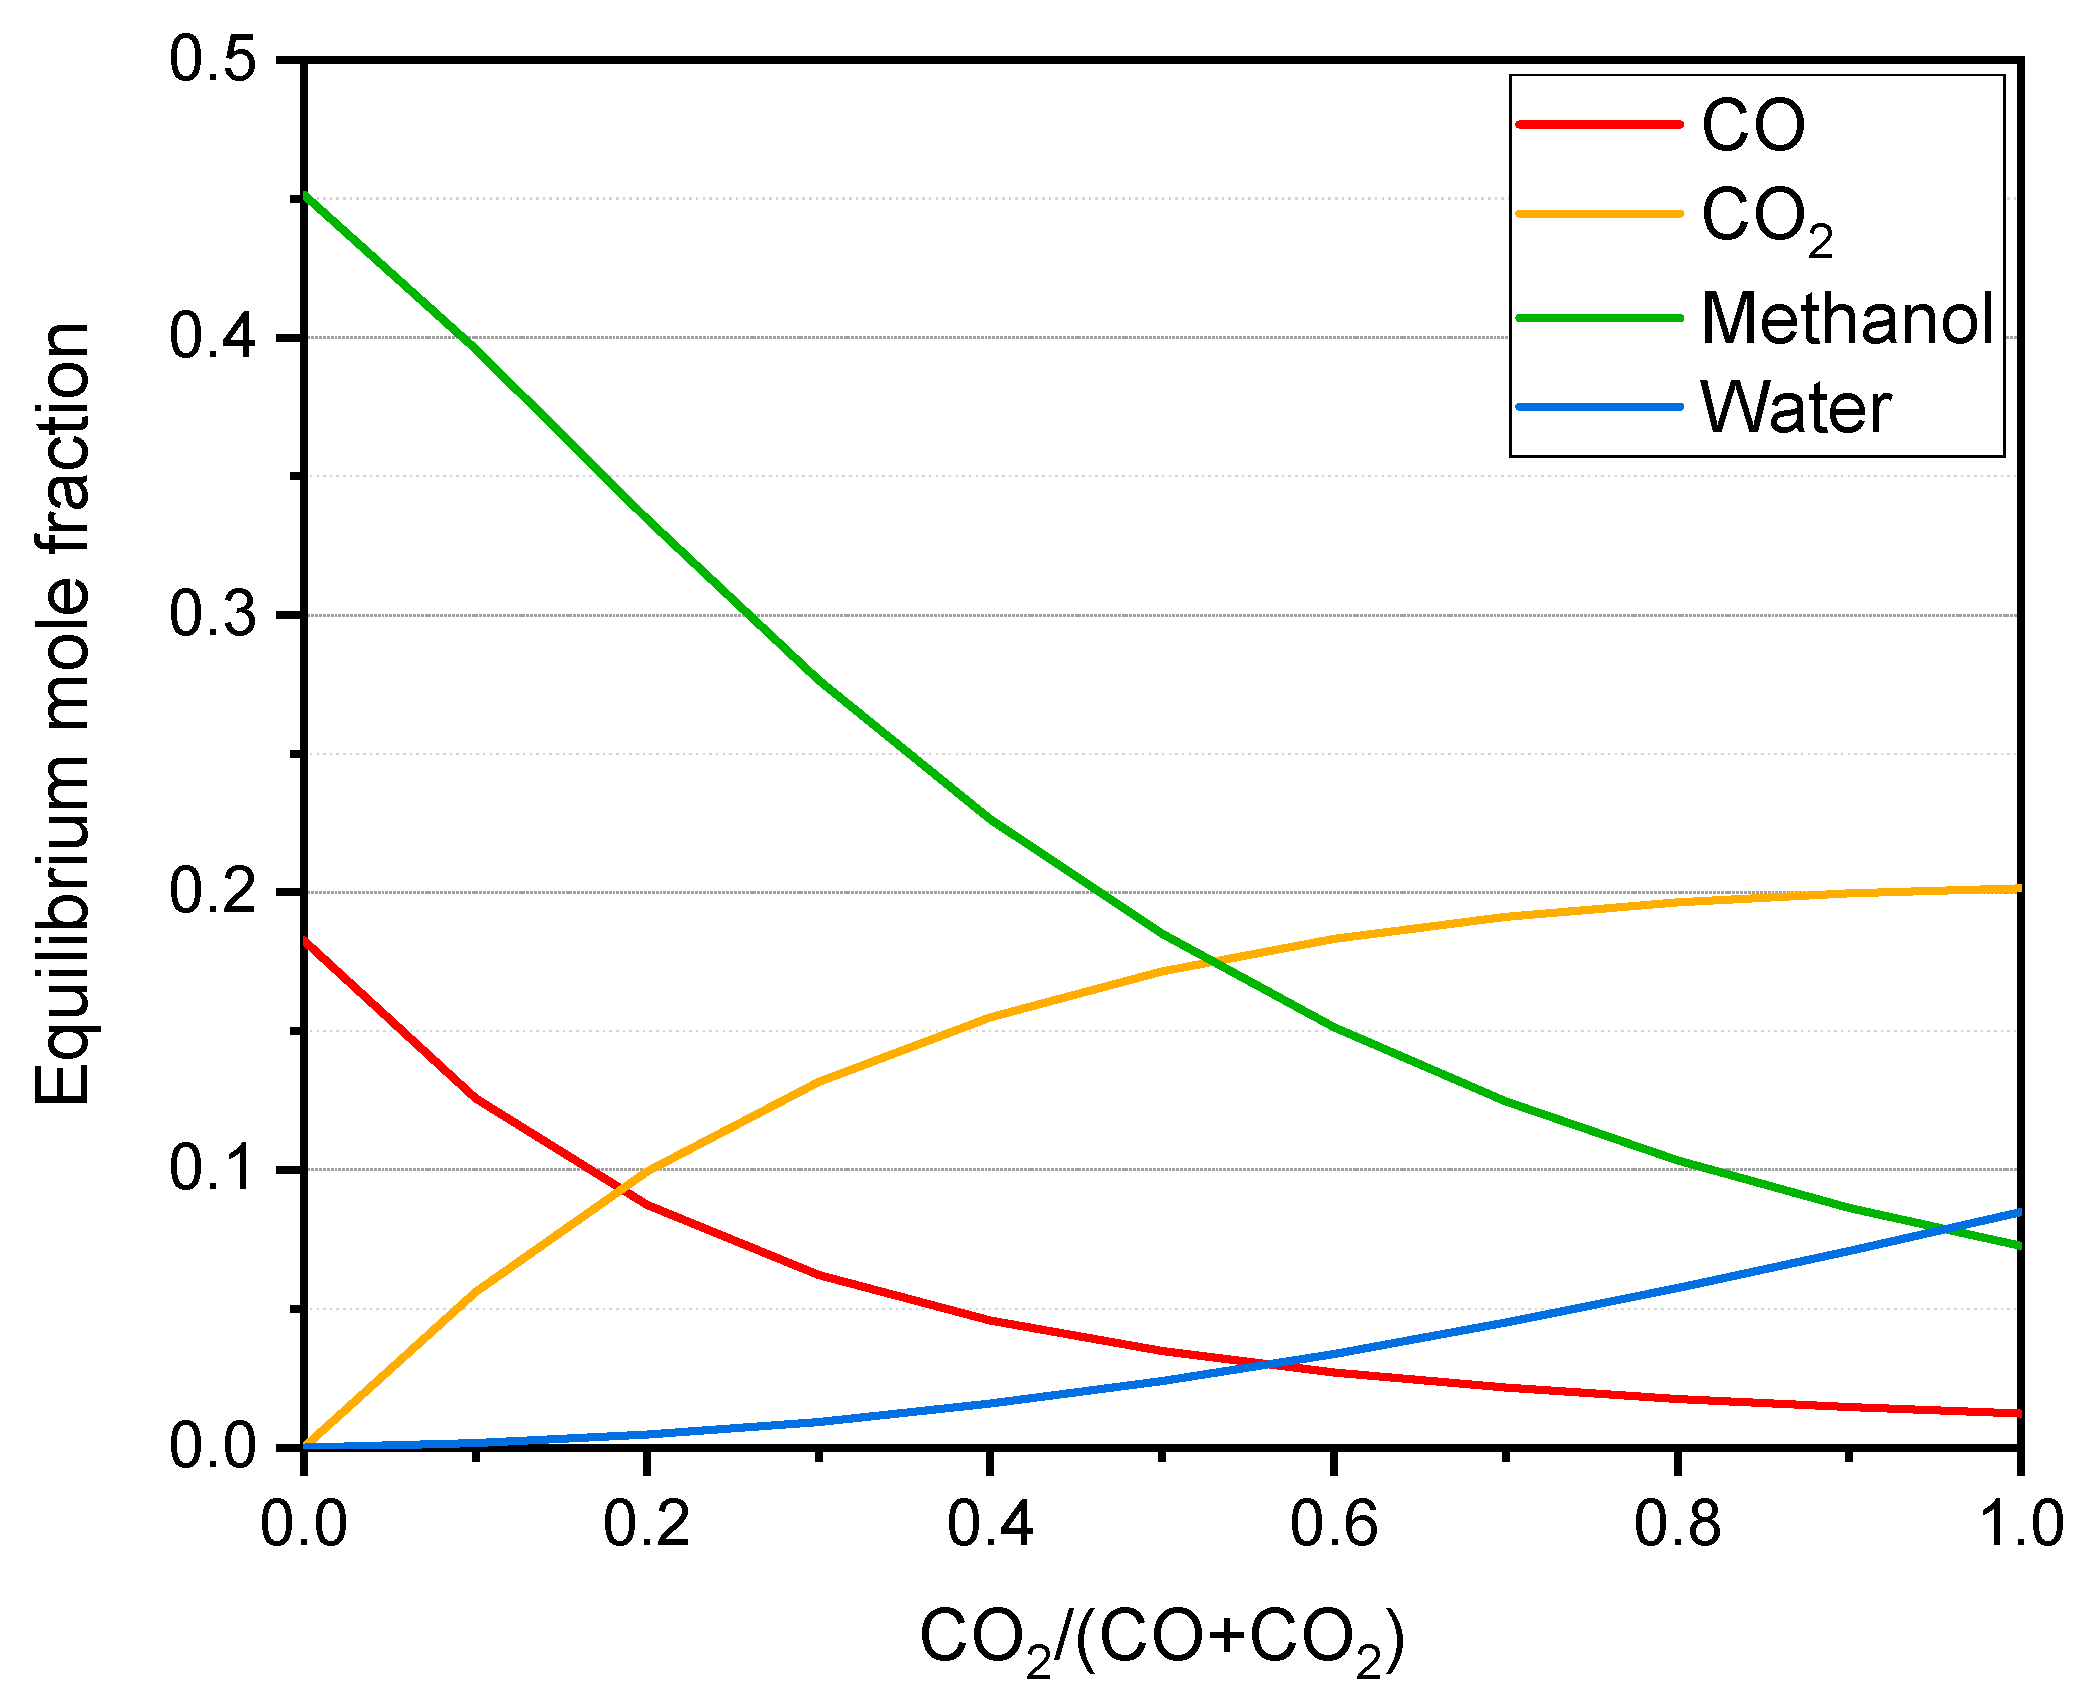
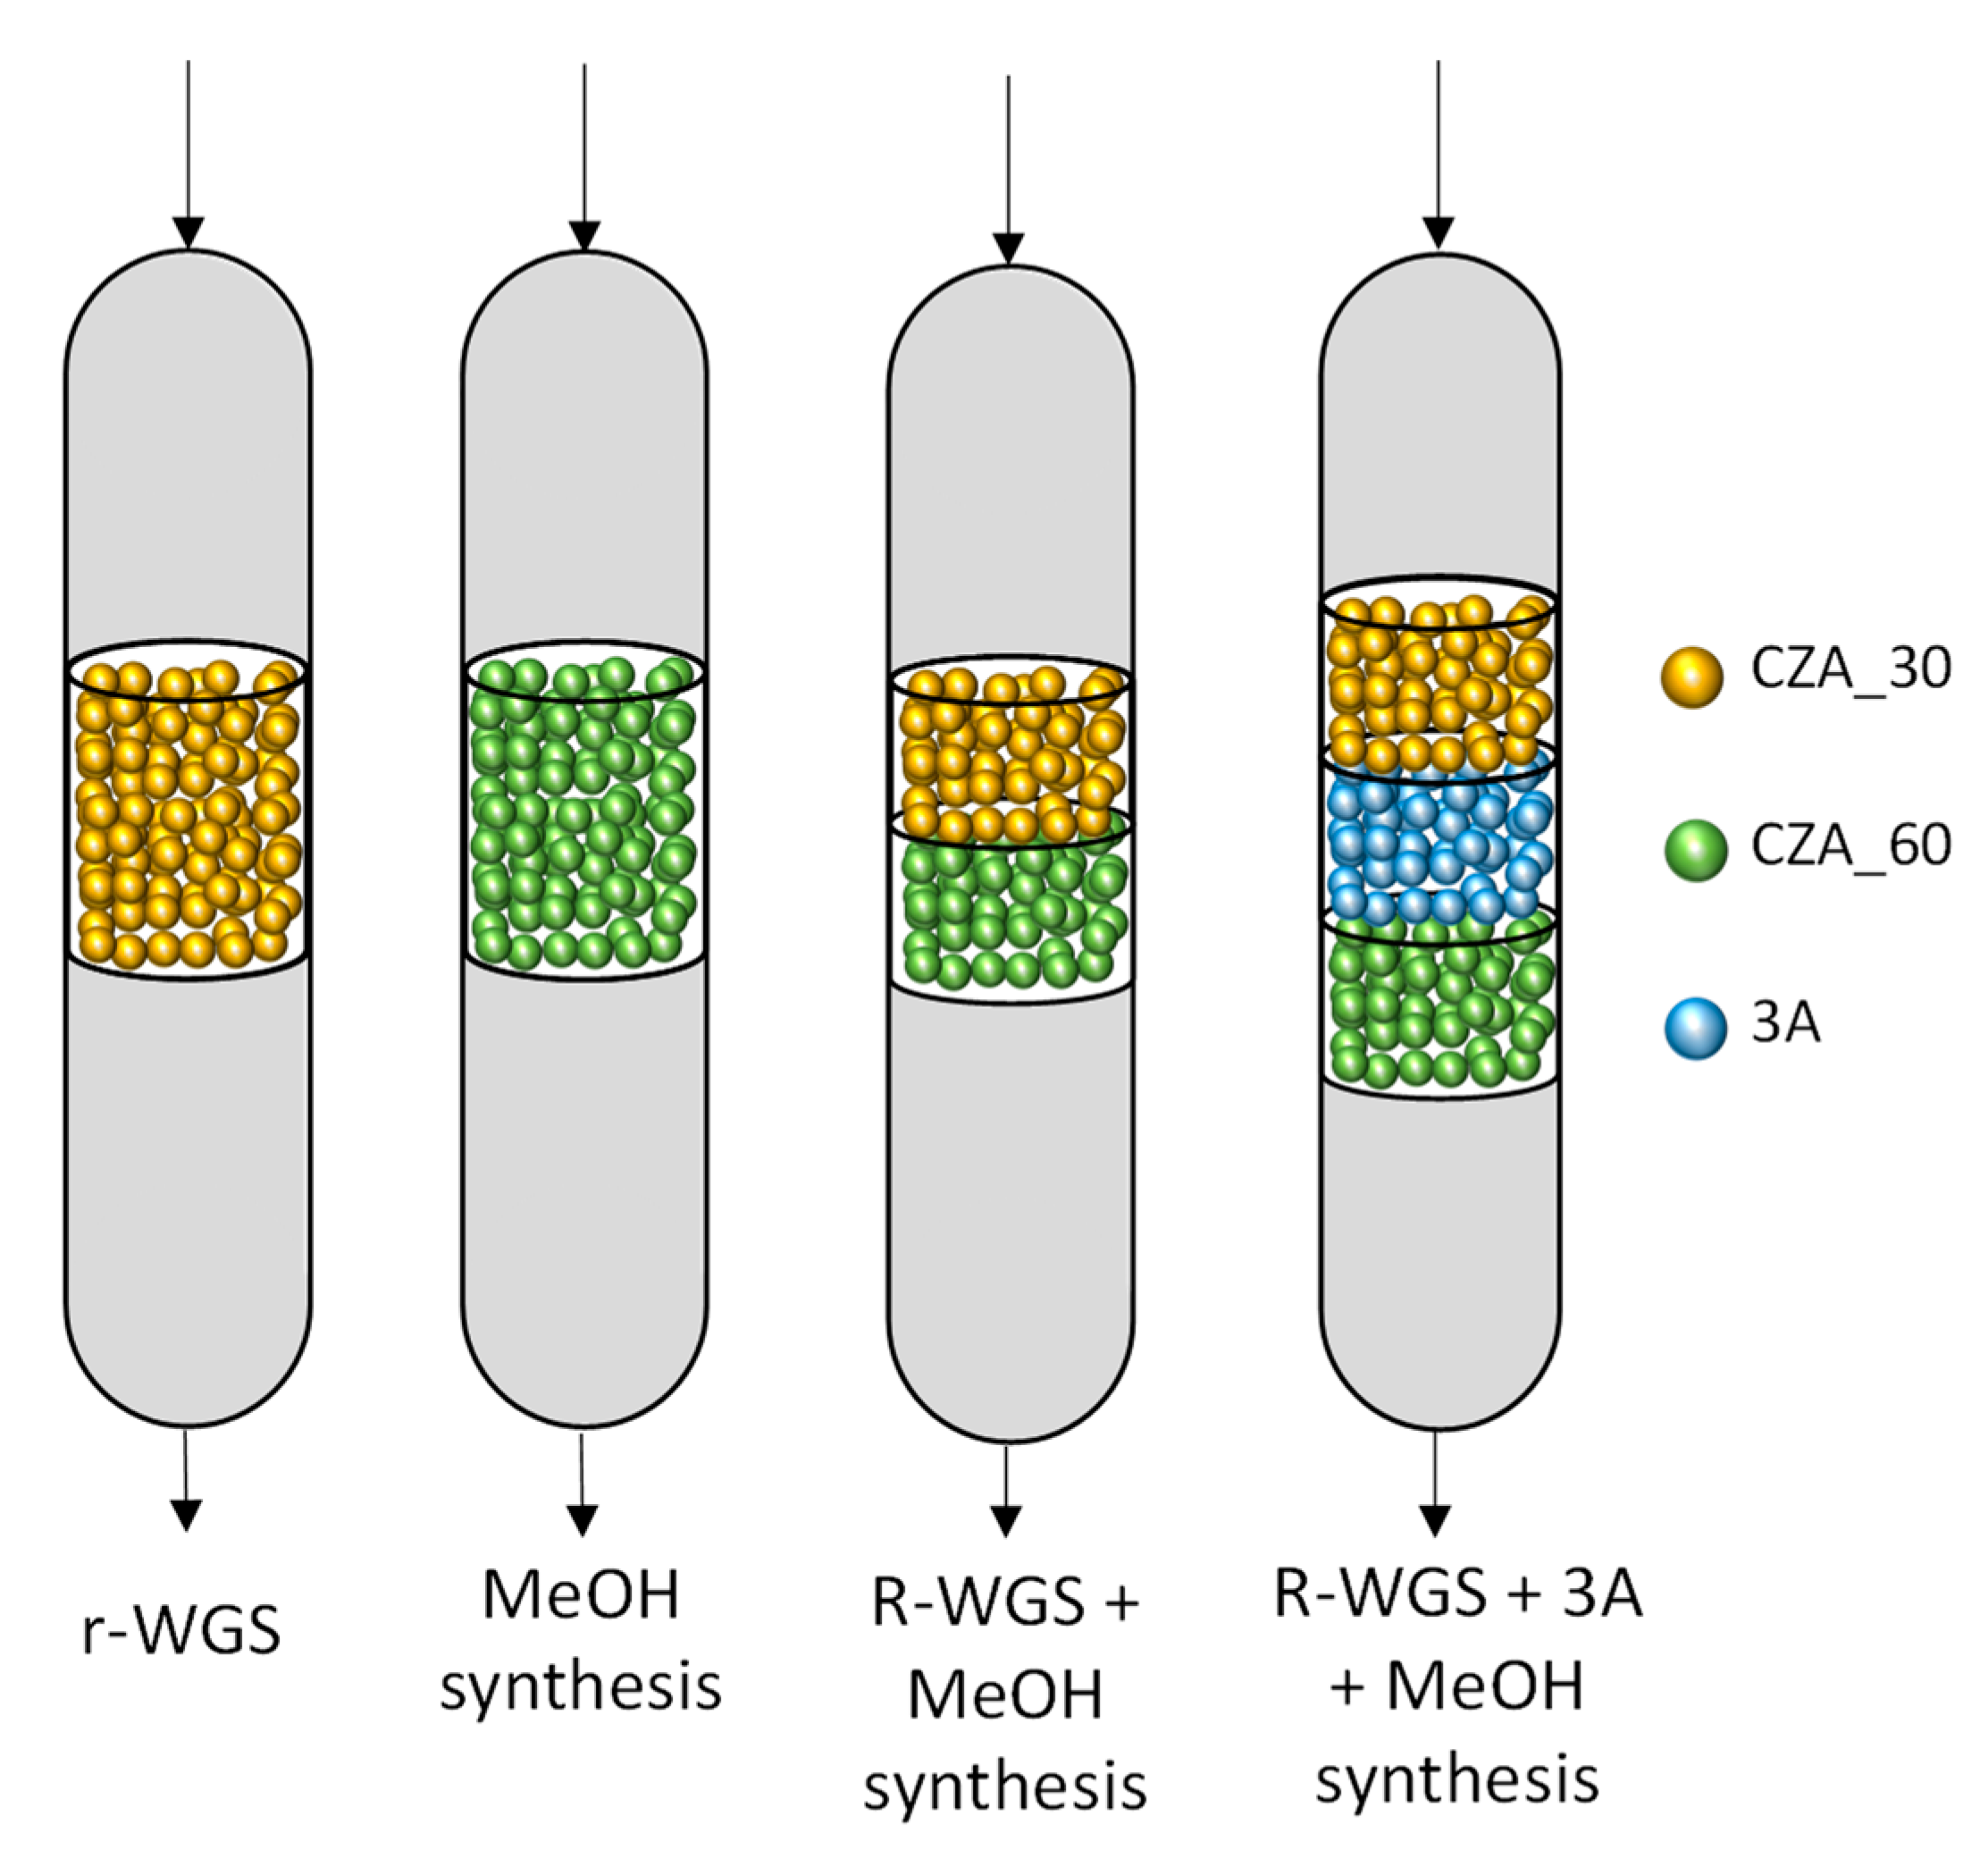
2.3. Synthesis of Methanol in a Single Catalytic Bed

Figure 5 compares the three methanol production processes considered in this work (MeOH, r-WGS-MeOH and r-WGS-3A-MeOH productions), in terms of CO, CO2 and total carbon conversion at different reaction conditions of pressure and temperature, including the stages 1, 2 and 3 of the r-WGS-3A-MeOH synthesis process (Stage 1—First collected data set of the experiment (TOS near to 0). Stage 2—Value at TOS near to 2, within the dynamic state. Stage 3—Value after the stationary state was reached (saturation of the sorbent)). The methanol synthesis experiments demonstrated that CZA_60 catalyst is active for this reaction, yielding higher CO and CO2 conversions at increasing pressures and temperatures. The increase in CO and CO2 conversions at 50 bar and 270 °C with respect to those at 25 bar and the same temperature can be explained, at least partly, from the thermodynamics of the system. The equilibrium conversions for CO and CO2 increase from 6.6 and 10.4%, respectively, to 39.4 and 13.9% by increasing reaction pressure from 25 to 50 bar. Conversely, the drop in the conversion values from 270 °C to 240 °C at 50 bar is an effect of the catalytic activity, which decreases at lower temperatures. The equilibrium conversion values at 240 °C and 50 bar are 73.3% for CO and 14.8% for CO2, meaning that the methanol production is thermodynamically more favored at 240 °C than at 270 °C at 50 bar. Thus, the worse results at 240 °C respond not to a thermodynamic but to a catalytic limitation.
As mentioned before, the CO2 content also has an impact in the thermodynamics of the system. Figure 6 illustrates the change in the equilibrium composition of the methanol synthesis for different inlet compositions under typical industrial conditions.
As observed, the methanol concentration in the equilibrium drops drastically with the content in CO2 in the syngas, and this trend is the same for all the conditions considered in this work. Theoretically, a higher methanol production could be expected when converting CO2 into CO prior to the methanol synthesis. In the following section, we discuss the experimental results of the proposed strategy.

2.4. Synthesis of Methanol in the Double Catalytic Beds

The effect of the in situ conditioning of the syngas via the r-WGS reaction was studied with a catalytic bed containing two catalysts, CZA_30 and CZA_60, which display r-WGS and methanol synthesis activity, respectively. The results are shown in Figure 5. Noticeably, the total carbon conversion, the CO conversion, and the methanol production obtained in the double-bed configuration are smaller than the ones obtained in the single-bed reactor using CZA_60. By contrast, similar CO2 conversions are obtained in both experiments. None of these conversions is limited by the thermodynamics; note that the equilibrium conversion for the MeOH synthesis and the r-WGS-MeOH experiments are the same, and the experimental conversions for the latter are lower than for the former. These results should be taken cautiously, since the amount of CZA_60 used in the double-bed configuration is half of that used in the single-bed process. Please note that CZA_30 is not active for the production of methanol. In practice, this results in two times higher GHSV in the double-bed experiment than in the single-bed one, since the mass of methanol activity catalyst in the double-bed performance is the half than that in the single-bed one, which is actually consistent with the observed decreasing of methanol production. In addition, although the r-WGS has no effect in the M module of the syngas, it actually produces water, which is known to have negative impact in the performance of CZA catalysts for methanol production [22,23,30].
To avoid the negative impact of H2O production during the r-WGS step in the performance of CZA_60 for the production of methanol the experiments were also conducted by placing a water sorbent (zeolite 3A) between the CZA_30 and CZA_60 catalysts under the same reaction conditions (240 and 270 °C, 25 and 50 bar). Figure 6 shows the evolution of CO, CO2 and CO+CO2 conversions with the time-on-stream (TOS) for the experiments of combined r-WGS-methanol catalytic bed with 3A. These results are discussed by considering three regimens: (i) low TOS, lower than 2 h, when the sorption capacity of the zeolite is maximum, (ii) TOS around 2–4 h, when the zeolite has lost part of its capacity, but still absorbs H2O, and (iii) TOS higher than 4 h, when the zeolite is fully saturated and the stationary state has been reached (this regime is akin to the experiments conducted with the double catalytic bed without H2O removal shown above). Please note that, based on recent isotherm measurements [30], a capacity of 0.1 mmol/g may be expected under these conditions leading to a breakthrough time of around 4 h.
As observed in Figure 5 and Figure 7, the CO2 conversion obtained at low times on stream (TOS < 4 h) of ca. 25% is significantly higher than that obtained in either of the single-bed configurations or in the double-bed configuration without the sorbent under the same reaction conditions. The CO conversion follows the opposite trend and a high amount of CO is produced at TOS < 2 h in the reactions conducted at 270 °C. CO conversion increases with TOS, especially at 270 °C. This phenomenon can be associated with an increase in the water partial pressure in the inlet of the CZA_60, thus hampering the r-WGS over this catalyst by means of Le Châtelier’s principle. The more saturated the zeolite, the higher the water content at the inlet of the methanol production stage.
In contrast, at 240 °C, CO conversions are always positive, but decrease with TOS. The striking difference between the initial (TOS < 2h) CO conversions with temperature (positive at 240 °C but negative at 270 °C) can be attributed to the fact that the r-WGS is less thermodynamically favored at lower temperatures. The lower CO2 conversion into CO and the consequent lower production of water favors the net disappearance of CO and the total conversion of carbon, which leads to a higher methanol production.
The production of methanol over the different configurations was assessed from the total carbon (CO + CO2) conversion since, besides CO an CO2, methanol is the only reaction product observed. Higher methanol productions were obtained with the double-bed configuration containing 3A, especially at lower TOS. Thus, total carbon conversion in the presence of the water sorbent at 240 ° and 50 bar increases by a 37% when compared with that obtained in the single-bed configuration (C conversion from 13.3% to 18.2%), and by 214% when compared with that obtained in the double-bed configuration without the water sorbent (C conversion from 5.8% to 18.2%). Similar trends were observed under the other reaction conditions studied in this work, see Figure 5. It should be noted that the effect of the water sorbent is only observed at TOS < 4 h, since at higher TOS the zeolite becomes saturated.
Given that the total amount of catalyst in the catalytic bed was kept constant in all experiments, and that CZA_60 is the only catalyst with activity for the methanol production, the methanol production has not occurred at the same GHSV in all configurations studied in this work. Thus, the values of conversion might be deceptive for the identification of the best configuration to maximize the use of the catalysts. For this reason, we studied the methanol productivity of each catalytic bed in more detail. Figure 8 shows a comparison of the methanol produced over each catalytic bed normalized to the total amount of copper in the catalytic bed (mmol of methanol/grCu·s), and the TOF for the CZA_60 in each catalytic bed. In this way, the productivities obtained can be regarded as a measure of how copper would be used better in a catalytic bed: just as CZA_60 or as a combination of CZA_30 and CZA_60.
As shown in Figure 8, methanol productivity in the single-bed configuration (CZA_60) is higher than in the double-bed configuration (CZA_30 + CZA_60) at every condition studied in this work. Although the presence of CZA_30 in the catalytic bed allows optimizing the CO2/CO ratio in the syngas, this effect does not result in higher methanol productivity over CZA_60. This effect can be ascribed to the negative impact of the higher partial pressure of water in the double-bed configuration due to the r-WGS reaction, that would negatively impact the performance of CZA_60 for the production of methanol. In situ water removal from the double-bed configuration actually results in higher methanol productivities at every reaction condition. Please note that this effect is only observed during low TOS (<4 h), when the sorbent ability of the zeolite is operative. For instance, the methanol productivity at 240 °C and 50 bar over the 3A-containing bed is ca. 80% higher than that of single-bed process. This behavior, which is also observed at other reaction conditions (see Figure 8, indicates that copper in the catalytic beds may be better exploited when divided between a catalyst of r-WGS and a catalyst of methanol, provided the water produced in the shift reaction is removed between stages.
It is striking that once the enhancement of the productivity is attained it lasts longer at 270 °C than at 240 °C. Thus, at 240 °C methanol productivity drops below that recorded in the single-bed configuration at some point between 0 and 2 h. This effect is observed at 270 °C only after 7–9 h on stream. This observation can be explained by the different environments during the r-WGS-3A-MeOH experiments at 240 °C and 270 °C, in particular regarding the ratio of oxidizing (H2O, CO2) to reducing (H2, CO) species. Please note that at 270 °C the fraction of CO2 is lower than at 240 °C (due to the enhancement of the r-WGS) and in both cases the water is removed from the reaction environment due to the 3A zeolite. Therefore, the oxidation of surface copper is more severe at 240 °C than at 270 °C, resulting in a lower faction of metallic copper sites during the reaction at 240 °C. When the syngas fed to the CZA_60 presents a lower CO2/CO ratio, this decrease of the metallic copper sites could be slower, and the methanol catalyst remains active for longer. Several observations found in related literature support this explanation. For instance, changes in the surface copper in CZA catalysts depending on the composition of the gas that passes through it (CO, CO2 or syngas) were reported previously by Wilmer and Hinrichsen [31]. Chinchen et al. determined that the oxygen coverage of copper catalysts during the synthesis of methanol from syngas depended directly on the CO2/CO ratio of the syngas. In this work, the apparent copper areas measured after reaction were notable lower than those measured before reaction [32]. Later, Martin et al. also observed a slower methanol production over CZA when pre-treated with CO2/H2 than when pre-treated with CO/H2 [8].
Figure 8 also shows that the TOF (moleculesCH3OH/s/siteCu,cza_60) values obtained in the experiments using a double-bed configuration are higher than the ones obtained in the single-bed experiments at all the experimental conditions studied in this work. Thus, the TOF recorded in the water-sorbent double-bed experiment at 240 °C and 50 bar is 2.7 times higher than with the single-bed containing only CZA_60 under the same reaction conditions. A similar trend is observed in the experiments at 270 °C. The increasing TOF values obtained with the double-bed experiments supports the idea that in situ decreasing of the CO2/CO ratio of the syngas has a positive impact in the intrinsic activity of the methanol catalyst, even if water is not removed from the system (note that TOF increasing was observed in the double-bed experiments, with and without the water sorbent). Nevertheless, the combination of both strategies results in the highest methanol catalyst activities.
TOF values of around 1.6·10−2 s−1 at 50 bar and 240–250 °C and CO2/CO ratios of 0.3–1.3 can be found in the literature [32,33]. This TOF value is ca. 2.5 times higher than the TOFs reported in our work in the single-bed experiments. The main reason of this difference is the initial composition of the syngas, which in our case displays a significantly higher CO2/CO ratio of 1.9. As explained above, this high value is detrimental for the production of methanol. Higher CO2/CO ratios increase the oxygen coverage of the copper surface, decreasing the fraction of available metallic copper sites. Nonetheless, in the experiments with r-WGS pre-treatment and water removal, the obtained TOF value is very similar to that reported in bibliography at least at low TOS, reaching a value of 1.7 s−1 at 240 °C with the fresh zeolite.
In parallel with the methanol productivity, the evolution of the TOF with time-on-stream at the different reaction conditions can be explained by the results obtained for the r-WGS in Table 3. As the CO2 conversion in the pre-treatment is higher, the enhancing effect of the pre-treatment is visible for a longer time. Thus, at 270 °C, at which the CO2/CO decrease is more pronounced, the CZA_30-CZA_60 beds, irrespective of whether they included 3A or not, always provided a TOF higher than that provided by the bed containing only CZA_60. On the other hand, the experiments at 240 °C only showed an enhancement in the TOF when combining the r-WGS pre-treatment and the water sorption, and this enhancement only lasted for a TOS between 1.4 and 3.5 h. Again, the more oxidizing nature of the syngas with a higher CO2/CO ratio seems to be accountable for the trend observed in the results.

3. Materials and Methods

3.1. Catalyst Synthesis

The catalysts for the WGS reaction and the methanol synthesis were prepared by the co-precipitation method, using a 2 M aqueous solution of copper, zinc and aluminum nitrates (Cu(NO3)2·3H2O (99.5 %, Merck KGaA, Darmstadt, Germany), Zn(NO3)2·6H2O (98 %, Sigma-Adrich) and Al(NO3)3·9H2O (98 %, Sigma-Aldrich, St. Louis, MO, USA) in the desired proportion for each catalyst. The Cu/ZnO ratio was maintained constant for all catalysts, to a value of 1.9 wt./wt. The solutions were precipitated at 65 °C by using a 1.6 M aqueous solution of Na2CO3 (98%, Alfa-Aesar, Kandel, Germany) at pH equal to 8, under continuous stirring. The precipitate was aged for 60 min under the same conditions. Next, a solid was recovered by filtration under vacuum and washed with de-ionized water until the obtained filtrate had a pH around 7. Then, the precipitate was dried overnight and calcined at 325 °C for 2.5 h under static air (ramp 10 °C). The catalysts obtained were labelled as CZA_X, where X indicates the nominal content of copper in the sample expressed as wt.%. CZA_30 (with a 30 wt. % of Cu) was used as the r-WGS catalyst and CZA_60 (60 wt. % of Cu) was used as the methanol catalyst.

3.2. Characterization

Inductively coupled plasma-optical emission spectrometry (ICP-OES) was used to determine the actual composition of the catalysts, using an ICP-OES Optima 3300 DV Perkin Elmer spectrometer. The alkaline digestion of the samples was performed in a Fluxy 30 Claisse.
N2 adsorption-desorption isotherms were collected in an Asap2020 Micromeritics. Samples were degassed in a VacPrep 061 LB Micromeritics. Parting from these isotherms, the BET areas and the pore sizes of the catalysts were calculated.
Temperature programmed reduction (TPR) analyses were performed in a TPD/TPR 2900 equipped with a thermal conductivity detector (TCD) to study the reducibility of the catalysts. Prior to each analysis, the samples were dried in situ at 100 °C for 30 min under flowing N2.
N2O chemisorption analyses were carried out in the TPD/TPR 2900. First, the sample is pre-treated at 100 °C under He for 1 h. Then, a temperature program reduction (TPRs) is recorded while flowing H2 through the sample from r.t. to 250 °C, until total reduction of CuO, with a heating rate of 2 °C/min. The curve obtained is referred to as TPRb. Once cooled to r.t. under He flow, the chemisorption was carried out by flowing through the sample a 5% vol. N2O in Ar flow for 15 min. After flushing with He for 5 min, a second TPR was carried out, heating up to 250 ° C at 10 °C/min, TPRs. The area of the first TPR curve, TPRb, accounts to the hydrogen consumed for the complete reduction of Cu particles, both surface and bulk, in the sample. The area under TPRs account to the hydrogen consumption during the reduction of the surface Cu2O, formed during the N2O chemisorption. Copper dispersion (DCu), the surface area of copper (SareaCu,) in m2 per gram of catalyst), and the amount of surface Cu0 sites in the catalyst, in moles of Cu0 per gram of catalyst, were calculated from Equtions (4)–(6).
DCu (%) = (2·TPRs H2 consumption)/(TPRb H2 consumption)·100
Cu0 sites = (Cu content·DCu)/(at wt.Cu·10000)
Sarea_Cu = Cu0 sites·NA·Atarea_Cu
In Equtions (5) and (6), Cu content is the mass percent content of copper in the catalyst, NA is the Avogadro’s constant, At areaCu is the area occupied by a surface atom of copper (6.85 A2 [34]) and at wtCu is the atomic weight of copper.
The XRD patterns were collected in a powder X-ray Polycristal X’Pert Pro PANalytical with a configuration θ–2θ, equipped with a reaction chamber Anton Paar XRK900, using CuKα radiation. The data were collected over a 2θ range of 4–90, accumulating 20 s with a step size of 0.040, after in situ treatment under a 20/80 vol. H2/N2 atmosphere at 250 °C, with a heating ramp of 2 °C/min. The crystal size of the Cu particles (dCu) was determined by the Scherrer equation as follows:
dCu = Kλ/βcosθ
where K = 0.94, assuming a cubic symmetry of the Cu particles, λ is the wavelength of the X-ray source (0.15418 nm), β is the full width at half maximum (FWHM) of the peak at position θ.
A JEOL 2100F transmission electronic microscope operated at 200 KV with a field emission gun, obtaining a point resolution of 0.19 nm was used to obtain the TEM images. Samples were reduced in a H2/N2 ex situ treatment under a 20/80 vol. H2/N2 atmosphere at 250 °C, with a heating ramp of 2 °C/min. Ethanol dispersions of the reduced samples were prepared and sonicated for 5 min. One drop of the suspensions was deposited on a conventional Au grid for TEM measurements.
XPS were recorded with a VG Escalab200R electron spectrometer equipped with a Mg-Kα (hν=1253.6 eV) X-ray source. Powdered samples were reduced in a H2/N2 ex situ treatment under a 20/80 vol. H2/N2 atmosphere at 250 °C, with a heating ramp of 2 °C/min, and outgassed at room temperature under a residual pressure of 10−6 mbar for 1 h. Then, the samples were transferred into the analysis chamber and analysis begun when the residual pressure reached 10−8 mbar. The Zn 2p3/2 peak from ZnO was set at 1021.7 eV and used as reference. Peak intensities were estimated by calculating the integral of each peak after subtraction of a Shirley-shaped background and fitting the experimental peaks to a combination of Lorentzian and Gaussian lines.

3.3. Catalytic Activity Tests

The catalytic tests were performed in a tubular fixed-bed stainless-steel reactor with an inner diameter of 0.9 cm. The temperature of the reactor is controlled by a thermocouple placed in the middle of the catalytic bed and a furnace in which the reactor is placed connected in a closed loop system. Likewise, a pressure sensor and an automatic pressure valve at the outlet of the reactor control the pressure in the reactor. Three different mass flows control the hydrogen, nitrogen and syngas flows fed into the reactor. Four different bed configurations were tested: two single beds with 200 mg of CZA_30 or CZA_60 diluted with SiC (Cat:SiC = 1:3 vol.), and two double beds combining the 100 mg of each catalyst in series, with the same Cat:SiC ratio than the separated beds, which represents a volume of 0.8 mLcatalytic_bed. The latter two configurations were built in such a manner that the syngas passes firstly through the CZA_30 bed, and then through the CZA_60 one. In one of the double bed configurations, a layer of 800 mg of a water sorbent zeolite (Molsieve Type 3A) was loaded between the CZA_30 and the CZA_60 catalysts, obtaining a catalytic bed volume of 2.0 mL. All the particles involved in the different bed configurations were sieved at 250–300 m. Figure 9 provides a diagram to clarify the configurations of the different catalytic beds. The total mass of catalyst or catalysts in the reactor was maintained constant, as well as the GHSV during the reactions. Prior to the beginning of each reaction, the catalysts were pre-treated in situ at 250 °C for 2.5 h, heating rate of 2 °C/min, in a flow of H2/N2 20/80 vol. Next, the gas feed was switched to N2, the reactor was cooled at 100 °C and then pressurized with syngas (CO/CO2/H2/N2; vol. percent composition of 8.5/16.1/65.4/10) up to the reaction pressure. When the targeted pressure is reached, the reactor was heated to the reaction temperature. Catalytic tests were carried out at 240 and 270 °C, 25 and 50 bar and 7500 h−1 for every configuration except for the single r-WGS bed, which was tested at 15,000 h−1 to obtain more accurate information on the syngas that reached the methanol catalyst after the pre-treatment.
Reaction outlet gases were led to an on-line Varian CP-3800 gas chromatograph equipped with a Hayesep Q packed column connected to a thermal conductivity detector (TCD) and a Rtx-1 capillary column connected to a flame ionization detector (FID), where inorganic gases and produced methanol were analyzed, respectively. Due to the change of number of moles during the reaction, N2 was used as internal reference for the calculations of CO and CO2 conversions. The composition of the initial gas feed (before and after the catalytic reactions) was analyzed by GC; the values obtained were used to determine CO and CO2 conversions. Methanol was the only reaction product detected during the GC analyses, so the methanol production was calculated from the CO+CO2 conversions.
Percent conversions of CO, CO2 and carbon were calculated using Eq. 8, where the flows are expressed in mole per second and i is the corresponding compound or compounds (CO, CO2 or CO+CO2). Productivities in moles of methanol per gram of copper in the catalytic bed per second and turnover frequencies (TOF) were calculated as indicated in Equations (9) and (10). In these Equations, mi is the mass of the corresponding catalyst in grams.
Xi = (Inlet flowi-Outlet flowi)/(Inlet flowi)·100
Productivity = (X(CO+CO2)·Inlet flow(CO+CO2))/((Cu content(CZA_30)·m (CZA_30) + Cu content(CZA_60)·m(CZA_60))/100)
TOF = (X(CO+CO2)·Inlet flow(CO+CO2))/(Cu0sites(CZA_60)·m(CZA_60))

4. Conclusions

The conclusions drawn from the present work are the following:
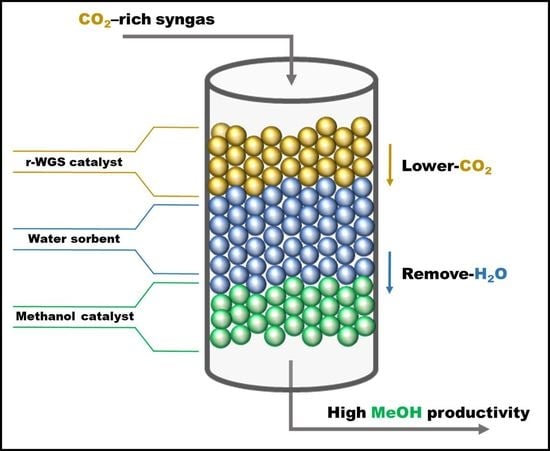
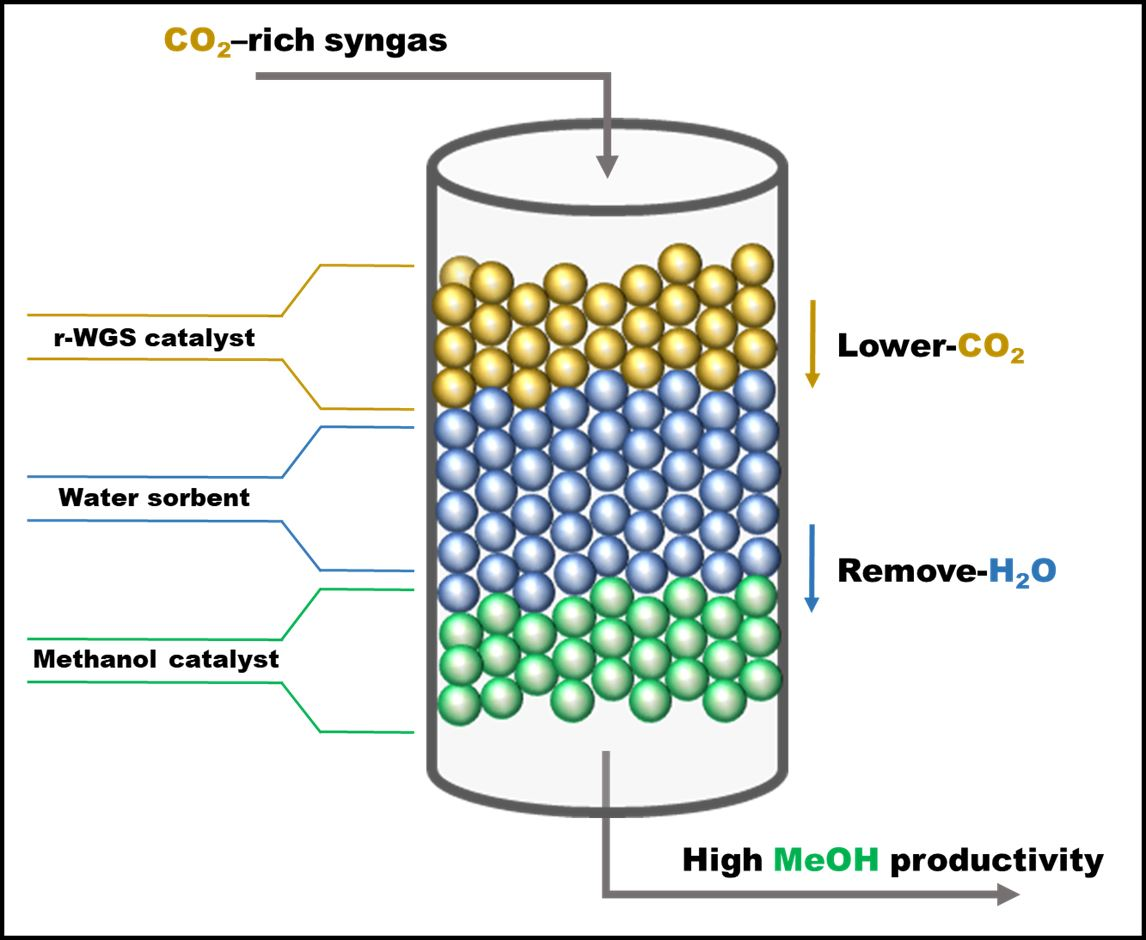
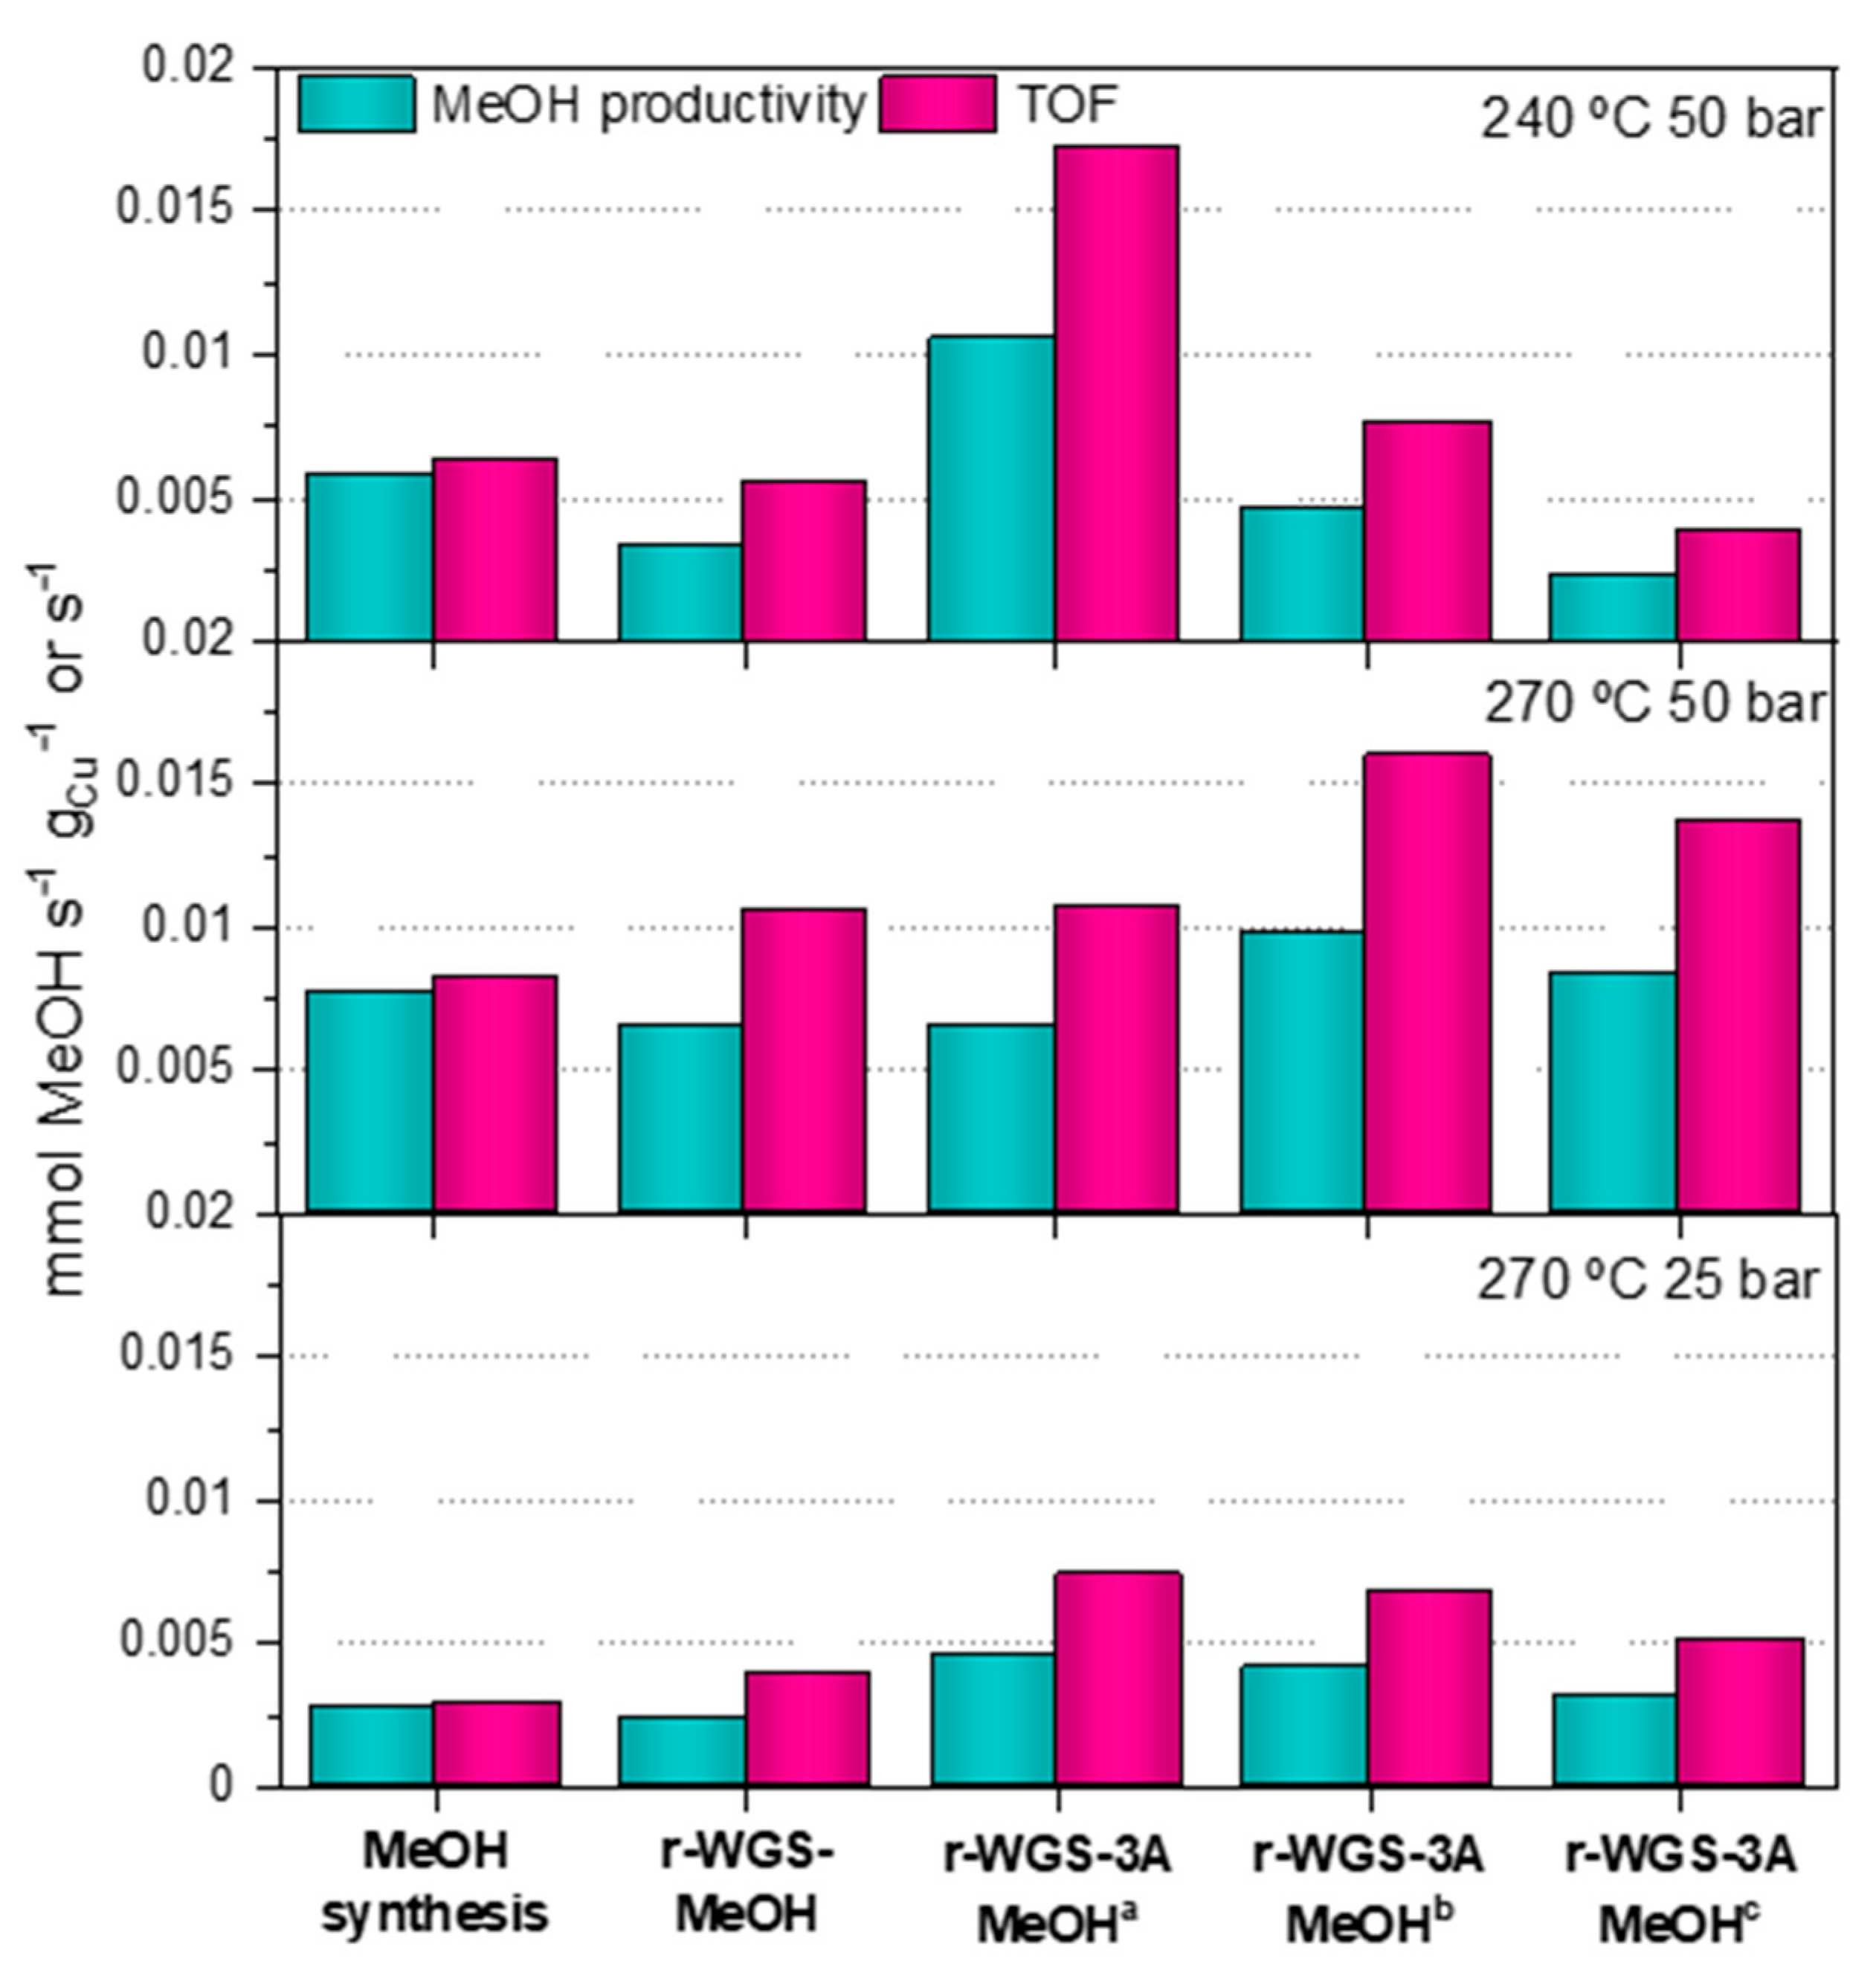
  • In general terms, the methanol productivity and TOF can be effectively enhanced when applying the combination of the r-WGS pre-treatment and water sorption strategies in the methanol synthesis from CO2-rich syngas in a single reactor.
  • If the CO2/CO ratio after the r-GWS process is of ca. 1.6 or lower, the increase in the TOF is also visible even without the water removal.
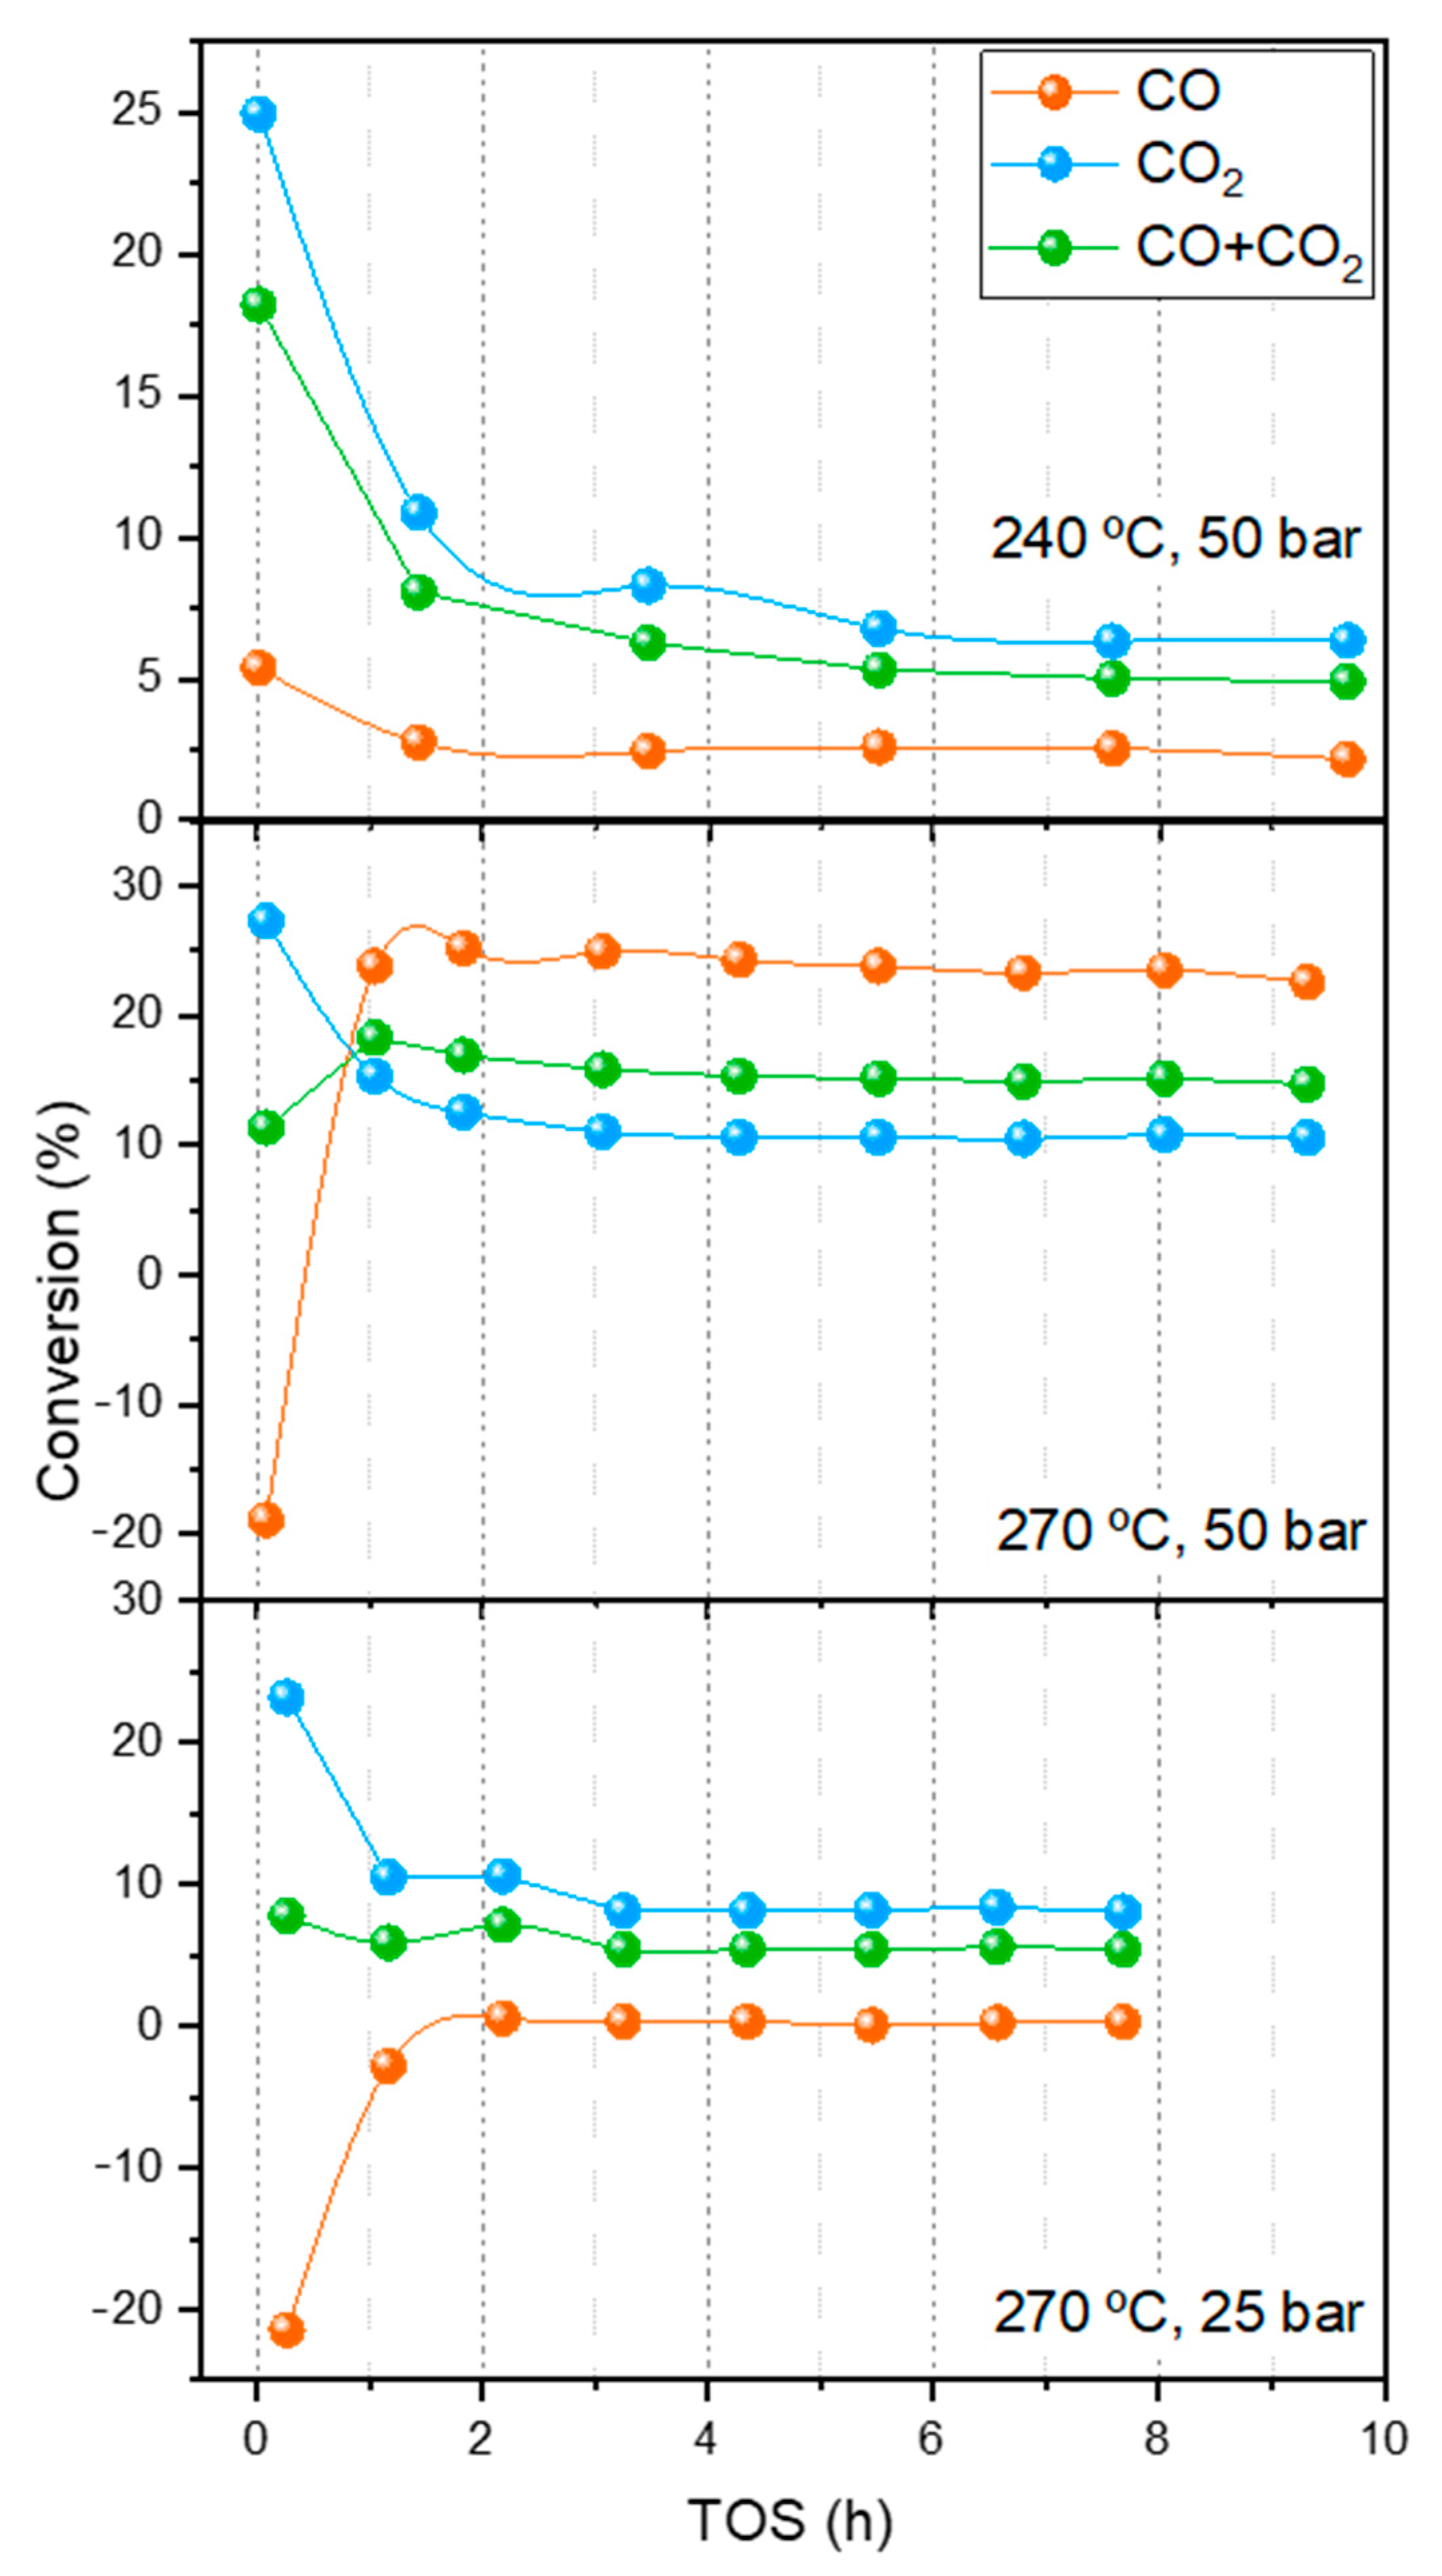
  • The duration of the period until the zeolite saturates, i.e., when the stationary state is reached, increases with the extent of the r-WGS.

Author Contributions

Conceptualization, S.R. and J.B.; methodology, C.P., D.L., L.P. and A.S.; formal analysis, M.A.P., S.R., J.B., L.P. and C.P.; investigation, S.R., M.A.P. and J.B.; data curation, M.A.P., C.P., D.L., L.P. and A.S.; writing—original draft preparation, C.P. and D.L.; writing—review and editing, C.P., D.L., L.P., M.A.P., J.B. and S.R.; supervision, S.R.; project administration, S.R. and M.A.P.; funding acquisition, S.R. and J.B. All authors have read and agreed to the published version of the manuscript.

Funding

This research was funded by the European H2020 project FLEDGED that has received funding from the European Union’s Horizon 2020 research and innovation Programme under Grant Agreement No. 727600.

Institutional Review Board Statement

Not applicable.

Informed Consent Statement

Not applicable.

Data Availability Statement

The data presented in this study are available online.

Acknowledgments

This work has been developed in the framework of European H2020 project FLEDGED that has received funding from the European Union’s Horizon 2020 research and innovation Programme under Grant Agreement No. 727600. Cristina Peinado acknowledges funds from Programa Garantía Juvenil 2016 from CAM. We acknowledge support of the publication fee by the CSIC Open Access Publication Support Initiative through its Unit of Information Resources for Research (URICI).

Conflicts of Interest

The authors declare no conflict of interest. The funders had no role in the design of the study; in the collection, analyses, or interpretation of data; in the writing of the manuscript, or in the decision to publish the results.

References

  1. Chinchen, G.C.; Denny, P.J.; Jennings, J.R.; Spencer, M.S.; Waugh, K.C. Review—Synthesis of Methanol. Appl. Catal. 1988, 36, 1–65. [Google Scholar] [CrossRef]
  2. Waugh, K.C. Methanol synthesis. Catal. Lett. 2012, 142, 1153–1166. [Google Scholar] [CrossRef]
  3. Ott, J.; Gronemann, V.; Pontzen, F.; Fiedler, E.; Grossmann, G.; Kersebohm, D.B.; Weiss, G.; Witte, C. Methanol. In Ullmann’s Encyclopedia of Industrial Chemistry; Wiley-VCH: Weinheim, Germany, 2012. [Google Scholar]
  4. Nestler, F.; Krüger, M.; Full, J.; Hadrich, M.J.; White, R.J.; Schaadt, A. Methanol Synthesis—Industrial Challenges within a Changing Raw Material Landscape. Chemie-Ingenieur-Technik 2018, 90, 1409–1418. [Google Scholar] [CrossRef]
  5. Klier, K.; Chatikavanij, V.; Herman, R.G.; Simmons, G.W. Catalytic synthesis of methanol from COH2: IV. The effects of carbon dioxide. J. Catal. 1982, 74, 343–360. [Google Scholar] [CrossRef]
  6. Herman, R.G.; Klier, K.; Simmons, G.W.; Finn, B.P.; Bulko, J.B.; Kobylinski, T.P. Catalytic synthesis of methanol from COH2: I. Phase composition, electronic properties, and activities of the Cu/ZnO/M2O3 catalysts. J. Catal. 1979, 56, 407–429. [Google Scholar] [CrossRef]
  7. Martin, O.; Pérez-Ramírez, J. New and revisited insights into the promotion of methanol synthesis catalysts by CO2. Catal. Sci. Technol. 2013, 3, 3343–3352. [Google Scholar] [CrossRef]
  8. Martin, O.; Mondelli, C.; Cervellino, A.; Ferri, D.; Curulla-Ferré, D.; Pérez-Ramírez, J. Operando Synchrotron X-ray Powder Diffraction and Modulated-Excitation Infrared Spectroscopy Elucidate the CO2Promotion on a Commercial Methanol Synthesis Catalyst. Angew. Chemie Int. Ed. 2016, 55, 11031–11036. [Google Scholar] [CrossRef] [PubMed]
  9. Göransson, K.; Söderlind, U.; He, J.; Zhang, W. Review of syngas production via biomass DFBGs. Renew. Sustain. Energy Rev. 2011, 15, 482–492. [Google Scholar] [CrossRef]
  10. Swain, P.K.; Das, L.M.; Naik, S.N. Biomass to liquid: A prospective challenge to research and development in 21st century. Renew. Sustain. Energy Rev. 2011, 15, 4917–4933. [Google Scholar] [CrossRef]
  11. Mondal, P.; Dang, G.S.; Garg, M.O. Syngas production through gasification and cleanup for downstream applications—Recent developments. Fuel Process. Technol. 2011, 92, 1395–1410. [Google Scholar] [CrossRef]
  12. Molino, A.; Larocca, V.; Chianese, S.; Musmarra, D. Biofuels production by biomass gasification: A review. Energies 2018, 11, 811. [Google Scholar] [CrossRef] [Green Version]
  13. Martínez, I.; Kulakova, V.; Grasa, G.; Murillo, R. Experimental investigation on sorption enhanced gasification (SEG) of biomass in a fluidized bed reactor for producing a tailored syngas. Fuel 2020, 259, 116252. [Google Scholar] [CrossRef]
  14. Martínez, I.; Romano, M.C. Flexible sorption enhanced gasification (SEG) of biomass for the production of synthetic natural gas (SNG) and liquid biofuels: Process assessment of stand-alone and power-to-gas plant schemes for SNG production. Energy 2016, 113, 615–630. [Google Scholar] [CrossRef]
  15. Bae, J.W.; Potdar, H.S.; Kang, S.H.; Jun, K.W. Coproduction of methanol and dimethyl ether from biomass-derived syngas on a Cu-ZnO-Al2O3/γ-A2O3 hybrid catalyst. Energy Fuels 2008, 22, 223–230. [Google Scholar] [CrossRef]
  16. Jung, J.W.; Lee, Y.J.; Um, S.H.; Yoo, P.J.; Lee, D.H.; Jun, K.W.; Bae, J.W. Effect of copper surface area and acidic sites to intrinsic catalytic activity for dimethyl ether synthesis from biomass-derived syngas. Appl. Catal. B Environ. 2012, 126, 1–8. [Google Scholar] [CrossRef]
  17. Martínez, I.; Grasa, G.; Callén, M.S.; López, J.M.; Murillo, R. Optimised production of tailored syngas from municipal solid waste (MSW) by sorption-enhanced gasification. Chem. Eng. J. 2020, 401, 126067. [Google Scholar] [CrossRef]
  18. Clausen, B.S.; Schiøtz, J.; Gråbæk, L.; Ovesen, C.V.; Jacobsen, K.W.; Nørskov, J.K.; Topsøe, H. Wetting/ non-wetting phenomena during catalysis: Evidence from in situ on-line EXAFS studies of Cu-based catalysts. Top. Catal. 1994, 1, 367–376. [Google Scholar] [CrossRef]
  19. Khassin, A.A.; Minyukova, T.P.; Yurieva, T.M. Genesis of catalysts for methanol synthesis. Mendeleev Commun. 2014, 24, 67–74. [Google Scholar] [CrossRef]
  20. Gaikwad, R.; Reymond, H.; Phongprueksathat, N.; Rudolf Von Rohr, P.; Urakawa, A. From CO or CO2?: Space-resolved insights into high-pressure CO2 hydrogenation to methanol over Cu/ZnO/Al2O3. Catal. Sci. Technol. 2020, 10, 2763–2768. [Google Scholar] [CrossRef] [Green Version]
  21. Prašnikar, A.; Pavlišič, A.; Ruiz-Zepeda, F.; Kovač, J.; Likozar, B. Mechanisms of Copper-Based Catalyst Deactivation during CO2 Reduction to Methanol. Ind. Eng. Chem. Res. 2019. [Google Scholar] [CrossRef] [Green Version]
  22. Wu, J.; Saito, M.; Takeuchi, M.; Watanabe, T. The stability of Cu/ZnO-based catalysts in methanol synthesis from a CO2-rich feed and from a CO-rich feed. Appl. Catal. A Gen. 2001, 218, 235–240. [Google Scholar] [CrossRef]
  23. Fichtl, M.B.; Schlereth, D.; Jacobsen, N.; Kasatkin, I.; Schumann, J.; Behrens, M.; Schlögl, R.; Hinrichsen, O. Kinetics of deactivation on Cu/ZnO/Al2O3 methanol synthesis catalysts. Appl. Catal. A Gen. 2015, 502, 262–270. [Google Scholar] [CrossRef]
  24. Chinchen, G.C.; Spencer, M.S. Sensitive and insensitive reactions on copper catalysts: The water-gas shift reaction and methanol synthesis from carbon dioxide. Catal. Today 1991, 10, 293–301. [Google Scholar] [CrossRef]
  25. Hadden, R.A.; Lambert, P.J.; Ranson, C. Relationship between the copper surface area and the activity of CuO/ZnO/Al2O3 water-gas shift catalysts. Appl. Catal. A Gen. 1995, 122, L1. [Google Scholar] [CrossRef]
  26. Ratnasamy, C.; Wagner, J. Water gas shift catalysis. Catal. Rev. Sci. Eng. 2009, 51, 325–440. [Google Scholar] [CrossRef]
  27. Kowalik, P.; Próchniak, W.; Konkol, M.; Borowiecki, T. The quantitative description of the effects of cesium doping on the activity and properties of Cu/ZnO/Al2O3 catalyst in low-temperature water-gas shift. Appl. Catal. A Gen. 2012, 423–424, 15–20. [Google Scholar] [CrossRef]
  28. Joo, O.-S.; Jung, K.-D.; Moon, I.; Rozovskii, A.Y.; Lin, G.I.; Han, S.-H.; Uhm, S.-J. Carbon Dioxide Hydrogenation To Form Methanol via a Reverse-Water-Gas-Shift Reaction (the CAMERE Process). Ind. Eng. Chem. Res. 1999, 38, 1808–1812. [Google Scholar] [CrossRef]
  29. Velu, S.; Suzuki, K.; Okazaki, M.; Kapoor, M.P.; Osaki, T.; Ohashi, F. Oxidative steam reforming of methanol over CuZnAl(Zr)-oxide catalysts for the selective production of hydrogen for fuel cells: Catalyst characterization and performance evaluation. J. Catal. 2000, 194, 373–384. [Google Scholar] [CrossRef]
  30. van Kampen, J.; Boon, J.; van Sint Annaland, M. Steam adsorption on molecular sieve 3A for sorption enhanced reaction processes. Adsorption 2020. [Google Scholar] [CrossRef]
  31. Wilmer, H.; Hinrichsen, O. Dynamical Changes in Cu/ZnO/Al2O3 Catalysts. Catal. Lett. 2002, 82, 117–122. [Google Scholar] [CrossRef]
  32. Chinchen, G.C.; Waugh, K.C.; Whan, D.A. The activity and state of the copper surface in methanol synthesis catalysts. Appl. Catal. 1986, 25, 101–107. [Google Scholar] [CrossRef]
  33. Pan, W.X.; Cao, R.; Roberts, D.L.; Griffin, G.L. Methanol synthesis activity of Cu ZnO catalysts. J. Catal. 1988, 114, 440–446. [Google Scholar] [CrossRef]
  34. Ertl, G.; Knözinger, H.; Weitkamp, J. Handbook of Heterogeneous Catalysis; Wiley-VCH: Weinheim, Germany, 2008; Volume 1, ISBN 9783527619474. [Google Scholar]
Figure 1. Temperature reduction profiles for CZA_60 (blue line) and CZA_30 (red line).
Catalysts 11 00534 g001
Figure 2. X-ray diffractograms of the reduced catalysts. Catalysts were reduced in situ under an H2 flow at 250 °C (2 °C/min).
Catalysts 11 00534 g002
Figure 3. TEM micrographs of CZA_30 (a) and CZA_60 (b); TEM-HAADF micrograph of the CZA_30 sample (c) and EDX line profile (d). HRTEM images of a Cu particle and its corresponding FFT (fast Fourier Transform) in the inset of CZA_30 (e) and CZA_60 (f).
Catalysts 11 00534 g003
Figure 4. EDX compositional maps of Cu, Zn, and Al in CZA_30 (a) and CZA_60 (b).
Catalysts 11 00534 g004
Figure 5. CO, CO2 and CO + CO2 conversions obtained with the single-step methanol synthesis reactor (MeOH synthesis), the double bed of r-WGS and methanol synthesis reactor (r-WGS-MeOH) and the combined bed of r-WGS, water sorption and methanol synthesis (r-WGS-3A-MeOH). a First collected data set of the experiment (TOS near to 0). b Value at TOS near to 2, within the dynamic state. c Value after the stationary state was reached (saturation of the sorbent).
Catalysts 11 00534 g005
Figure 6. Equilibrium composition for the methanol synthesis reaction depending on the syngas composition at 230 °C and 50 bar. M module ([H2 − CO2]/[CO + CO2]) equal to 2. Calculated using Aspen Plus software (Aspen Plus V11, Aspen Technology, Inc., Bedford, MA, USA, 2019).
Catalysts 11 00534 g006
Figure 7. Evolution of conversion results with TOS in the r-WGS-3A-MeOH configuration at different conditions. GHSV = 7500 h−1.
Catalysts 11 00534 g007
Figure 8. Methanol productivities and TOF obtained with the different bed configurations at different conditions of pressure and temperature: 240 °C—50 bar, 270 °C—50 bar and 270 °C—25 bar. a First collected data set of the experiment (TOS near to 0). b Value at TOS near to 2, within the dynamic state. c Value after the stationary state was reached (saturation of the sorbent).
Catalysts 11 00534 g008
Figure 9. Studied configurations of the catalytic bed.
Catalysts 11 00534 g009
Table 1. Composition (ICP-OES), surface area (BET), Cu dispersion, and copper surface area (N2O chemisorption) of the catalysts.
CatalystComposition, Actual (Expected)Surface AreaAverage Pore SizeDCuCu Surface Area
CuZnOAl2O3m2/gcatnm%m2Cu/gcat
wt. %wt. %wt. %
CZA_6067.8 (62)28.7 (33)3.5 (5)39105.926
CZA_3032.9 (33)13.1 (17)54.0 (50)10778.717
Table 2. Binding Energy and surface atomic elemental compositions of the reduced catalysts obtained by XPS.
B.E. (eV)Surface Composition (wt. %)
Cu 2p3/2CuZnOAl2O3
CZA-60932.4201961
CZA-30932.59883
Table 3. CO2 conversion and outlet CO2/CO ratio obtained with the CZA_30 catalysts at different reaction conditions at 15,000 h−1. Initial CO2/CO mole ratio equal to 1.9. The CO2/CO ratios at the equilibrium are indicated for comparison.
PressureTemperatureFinal CO2/COEq. CO2/CO
bar°Cmolemole
252701.61.5
502701.61.5
502401.81.6
Publisher’s Note: MDPI stays neutral with regard to jurisdictional claims in published maps and institutional affiliations.

