Article

Influence of Cs Loading on Pt/m-ZrO2 Water–Gas Shift Catalysts

1
Department of Biomedical Engineering and Chemical Engineering, University of Texas at San Antonio, One UTSA Circle, San Antonio, TX 78249, USA
2
University of Kentucky Center for Applied Energy Research, 2540 Research Park Drive, Lexington, KY 40511, USA
3
Argonne National Laboratory, Argonne, IL 60439, USA
4
Department of Mechanical Engineering, University of Texas at San Antonio, One UTSA Circle, San Antonio, TX 78249, USA
*
Author to whom correspondence should be addressed.
Catalysts 2021, 11(5), 570; https://doi.org/10.3390/catal11050570
Submission received: 1 April 2021 / Revised: 25 April 2021 / Accepted: 27 April 2021 / Published: 29 April 2021
(This article belongs to the Special Issue CO and CO2 Conversion over Heterogeneous Catalysts)

Abstract

:
Certain alkali metals (Na, K) at targeted loadings have been shown in recent decades to significantly promote the LT-WGS reaction. This occurs at alkali doping levels where a redshift in the C-H band of formate occurs, indicating electronic weakening of the bond. The C-H bond breaking of formate is the proposed rate-limiting step of the formate associative mechanism, lending support to the occurrence of this mechanism in H2-rich environments of the LT-WGS stage of fuel processors. Continuing in this vein of research, 2%Pt/m-ZrO2 was promoted with various levels of Cs in order to explore its influence on the rate of formate intermediate decomposition, as well as that of LT-WGS in a fixed bed reactor. In situ DRIFTS experiments revealed that Cs promoter loadings of 3.87% to 7.22% resulted in significant acceleration of the forward formate decomposition in steam at 130 °C. Of all of the alkali metals tested to date, the redshift in the formate ν(CH) band with the incorporation of Cs was the greatest. XANES difference experiments at the Pt L2 and L3 edges indicated that the electronic effect was not likely due to an enrichment of electronic density on Pt. CO2 TPD experiments revealed that, unlike Na and K promoters, Cs behaves more like Rb in that the decomposition of the second intermediate in LT-WGS, carbonate species, is hindered due to (1) increased basicity of Cs, (2) the tendency of Cs to cover Pt sites that facilitate CO2 decomposition, and (3) the tendency of Cs to increase Pt particle size as shown by EXAFS results, resulting in fewer Pt sites that facilitate CO2 decomposition. As such, the LT-WGS rate was hindered overall and the rate-limiting step shifted to carbonate decomposition (CO2 removal). Like its Rb counterpart, low levels of added Cs (e.g., 0.72%Cs) were found to improve the stability of the catalyst relative to the unpromoted catalyst; the stability comparison was made at similar CO conversion level as well as similar space velocity.

1. Introduction

Because of the high energy density per unit mass of H2, not only is this diatomic element necessary for many refineries and industrial chemical plants as a major feedstock, but it has also become a possible energy solution deemed to have the highest potential for the future. Hydrogen can be produced by several routes, such as electrochemical, thermochemical, photochemical, photocatalytic, or photoelectrochemical processes [1].
Among these methods, the thermochemical method plays an important role in commercial H2 production. Currently, one of the most adopted technologies for producing H2 is steam methane reforming (SMR), in which steam reacts with hydrocarbon fuels to produce H2 at high temperature. Other thermochemical methods, such as partial oxidation, autothermal reforming, and methane thermo-catalytic decomposition, are also important for producing hydrogen. CO from many of these processes is then converted through reaction with H2O to produce additional H2 in the water–gas shift (WGS) reaction. When high-purity H2 is needed, due to thermodynamic considerations, WGS proceeds in stages, including high-temperature shift followed by low-temperature shift [2,3,4,5].
The WGS reaction is a reversible, mildly exothermic reaction [6]:
CO + H 2 O CO 2 + H 2   ( Δ H ° = 41   kJ / mol )
There are two classifications for the WGS reaction. The first is non-catalytic WGS, which is driven in certain environments such as supercritical water. The second classification is the catalytic WGS reaction which occurs in the presence of a catalyst [7]. Because of the existence of an activation energy barrier, the reaction will not proceed at a low temperature due to kinetic restrictions. In this case, a catalyst is necessary in order to overcome the activation energy barrier by lowering the activation energy. Based on the reaction temperature, reaction, the type of catalyst is classified either as a low-temperature (LT) shift catalyst or a high-temperature (HT) shift catalyst. Because WGS is exothermic, the equilibrium conversion becomes more limited with increasing temperature. Therefore, HT shift is first conducted to take advantage of the more rapid kinetics, achieving close to equilibrium conversion (which is limited). LT shift is carried out next to take advantage of the higher equilibrium conversion [8,9]. However, in order to achieve a more rapid approach to this favorable equilibrium conversion at LT, a suitably active catalyst is required.
To find a suitably active catalyst, many groups have turned to formulations consisting of a noble metal (e.g., Au, Pt, Pd) supported on a partially reducible oxide (PRO) (e.g., CeO2, ZrO2, CeαZr1-αO2, TiO2, HfO2, and ThO2) [10,11]. Because of the greater stability of noble metal-based catalysts during start-up/shut-down cycles, they are attractive for low-temperature water–gas shift (LT-WGS). There are two mechanism explanations provided for LT-WGS over these catalysts: (1) a reactant-promoted associative mechanism, where the key intermediate is either formate or carboxyl species [6] or (2) a support-mediated redox mechanism, wherein the support is reduced by CO and subsequently oxidized by H2O [12]. By addition of promoters or modifying supports, the WGS rates of catalysts can be increased [13]. For example, doping alkali to Pt/CeO2, Pt/TiO2, Pt/ZrO2 and Pt/Al2O3 led to increases in the WGS rate. There are two explanations proposed for the increasing WGS rate by adding alkali promotion. One such explanation is the formation of positively charged Pt sites in close contact with the alkali. The role of the alkali here is then to assist in providing OH groups in close proximity to metal sites. Another proposed explanation is an enhancement in the decomposition rate of the formate intermediate [13,14,15,16,17].
Figueiredo et al. [18] studied the effects of 1 wt.% Li, K, Rb, and Cs on Cu/ZnO/Al2O3 (CZA) in LT-WGS. Their studies showed that the addition of alkali promoter prevented methanol production at 220 °C. The reason for this effect was proposed to be the weakening of the C-H bond of the formate intermediate. Komarov et al. [19] studied the alkali promotion of CZA during WGS. Alkali promotion of 3 and 5% K, Rb, and Cs decreased the concentration of undesirable organic byproducts by up to 90%, from 21.04 to 2.0 mg L−1. However, it had only a small effect on catalyst activity (rate constant 54.6–58.1 cm3 g−1 s−1, at 220 °C). In addition, they showed that the selectivity increases by increasing atomic number of the alkali (K < Rb < Cs). That is, the unwanted byproducts in the condensate (methanol, methyl formate, methyl acetate, acetaldehyde, 1-butanol, 1-propanol) decreased from 21.04% for the unpromoted catalyst to 2.96/3.46% for 3%/5% K-promoted, 1.80/2.38% for 3%/5% Rb-promoted, and 1.65/1.73% for 3%/5%Cs-promoted.
Gao et al. [20] showed that 2%Pt/SiO2 doped with light alkali (Li, Na, K) alkali promoters in amounts that were atomically equivalent to 2.5 wt.%Na on SiO2-supported Pt catalysts displayed much higher WGS activity (e.g., at 250 °C, 37.5 times for Li, 31.4 times for Na, and 2.5 times for K). Mechanistic results were consistent with a weakening of the formate C-H bond by the alkali. The studies showed that while the heavier alkali (especially Rb and Cs) increased carbonate stability, suppressing the WGS rate, the lighter alkali (Li, Na, and K) improved the WGS rate.
In 2005, Honda USA, Inc. [21,22], reported a remarkable improvement in activity and selectivity caused by the addition of 2.5 wt.% sodium to the Pt/ZrO2 catalyst. Their studies, in collaboration with researchers from the Univ. of Kentucky Center for Applied Energy Research, showed that the addition of Li, Na, or K weakens the C-H bond of formate, significantly improving the rate of formate decomposition in steam. Evin et al. [23] studied Li, Na, K, Rb and Cs alkali promoters in both low-loading atomic amounts and high-loading atomic amounts on Pt/CeO2. Among these low-loading catalysts were 4.3%K-2%Pt/CeO2 and 0.9%K-2%Pt/CeO2, respectively. Their results showed that although a promoting effect could be obtained at lower loadings with lighter alkali metals (e.g., Na and K), increasing alkalinity (loading and basicity of the alkali) led to higher stability of the second intermediate, carbonate. The results showed that the promoting effect of the alkali was to weaken the formate C-H bond, increasing the rate of formate dehydrogenation in the rate-limiting step. Additional studies have also shown promotional effects of alkali metals on WGS catalyst. The general consensus is that the promotional effect is related to the electronic nature of the alkali promoter or due to an increase in the basicity of the catalyst surface. Moreover, it is possible that the alkali interacts with adsorbed intermediates by charge transfer or via the electrostatic force [24,25]. These studies are more focused on the use of Na and K as promoters, while there are few studies of the effects of Cs.
The present work is aimed at studying the effect of Cs on Pt/m-ZrO2 in LT-WGS and, if possible, to determine the optimal Cs loading for activity and/or stability. The influence of Cs is discussed in terms of (1) its ability to facilitate formate dehydrogenation, (2) its ability to release CO2 due to its basicity, (3) the potential for electron transfer from Cs to Pt, and (4) geometric arguments such as the proximity of Cs to Pt as well as Pt cluster size. The novelty of the work is that, in comparison to Na, which was found by Honda Researchers to greatly destabilize the formate intermediate (causing a redshift in the CH bond), accelerate the forward formate decomposition rate, and significantly accelerate the WGS rate, Cs is expected to destabilize formate even more than Na. Although this is indeed found to be the case, the basicity of Cs at all loadings causes CO2 product inhibition. There is a change in the rate-limiting step from formate C-H bond breaking to CO2 desorption. Future work on Cs should be aimed at improving CO2 desorption such that the promoting effect of Cs on formate decomposition can be advantageously applied.

2. Results and Discussion

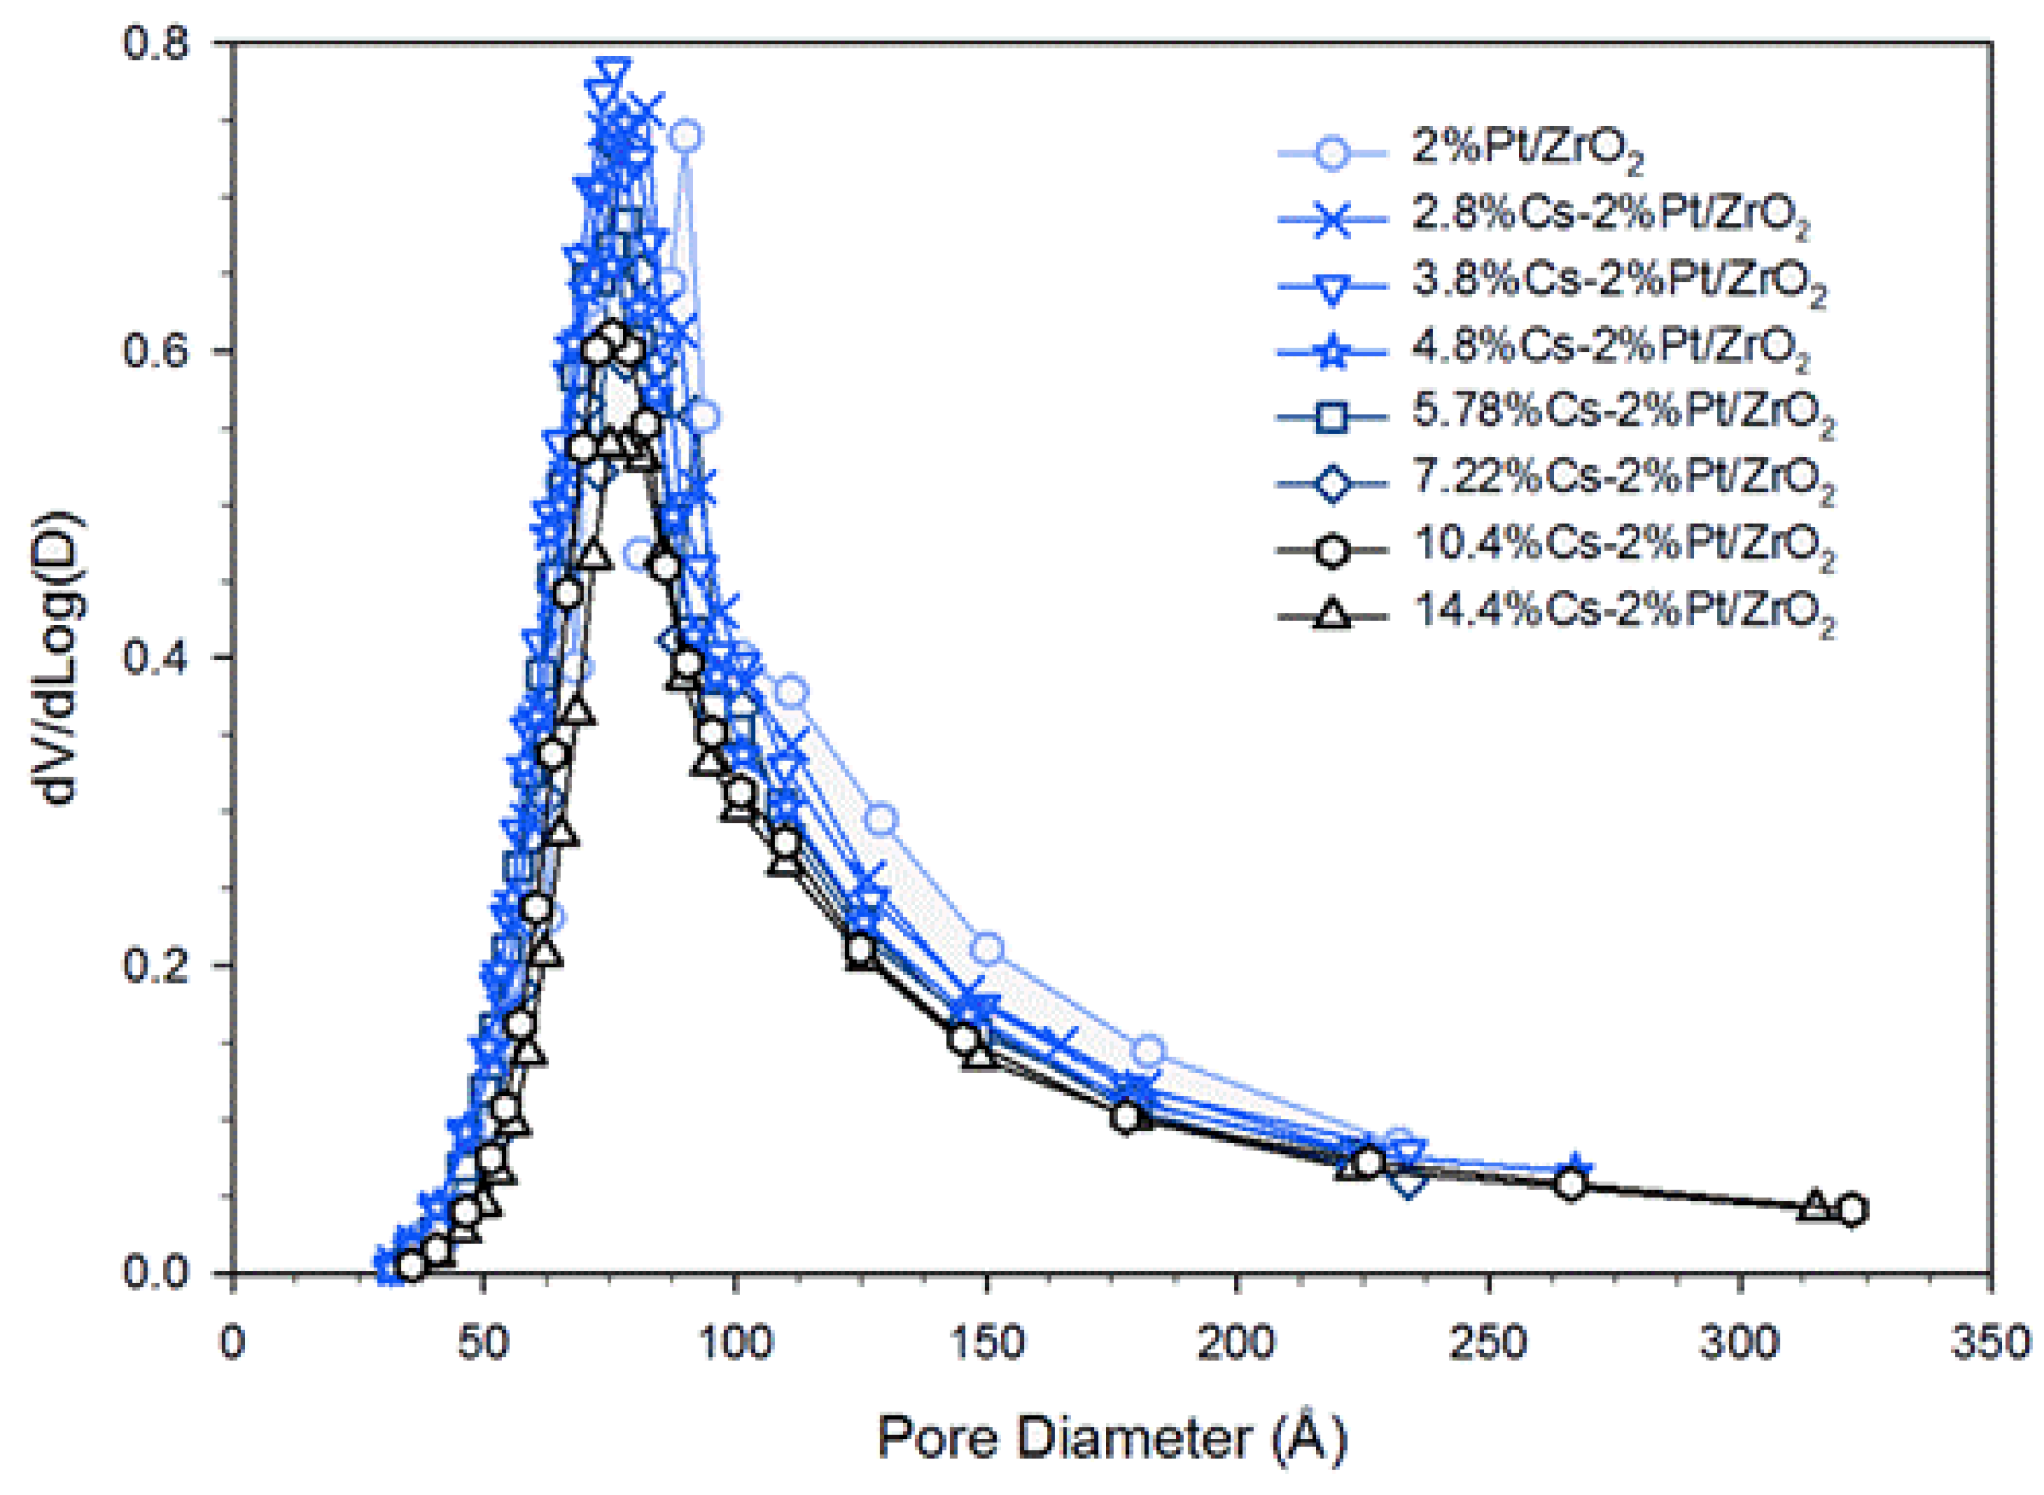
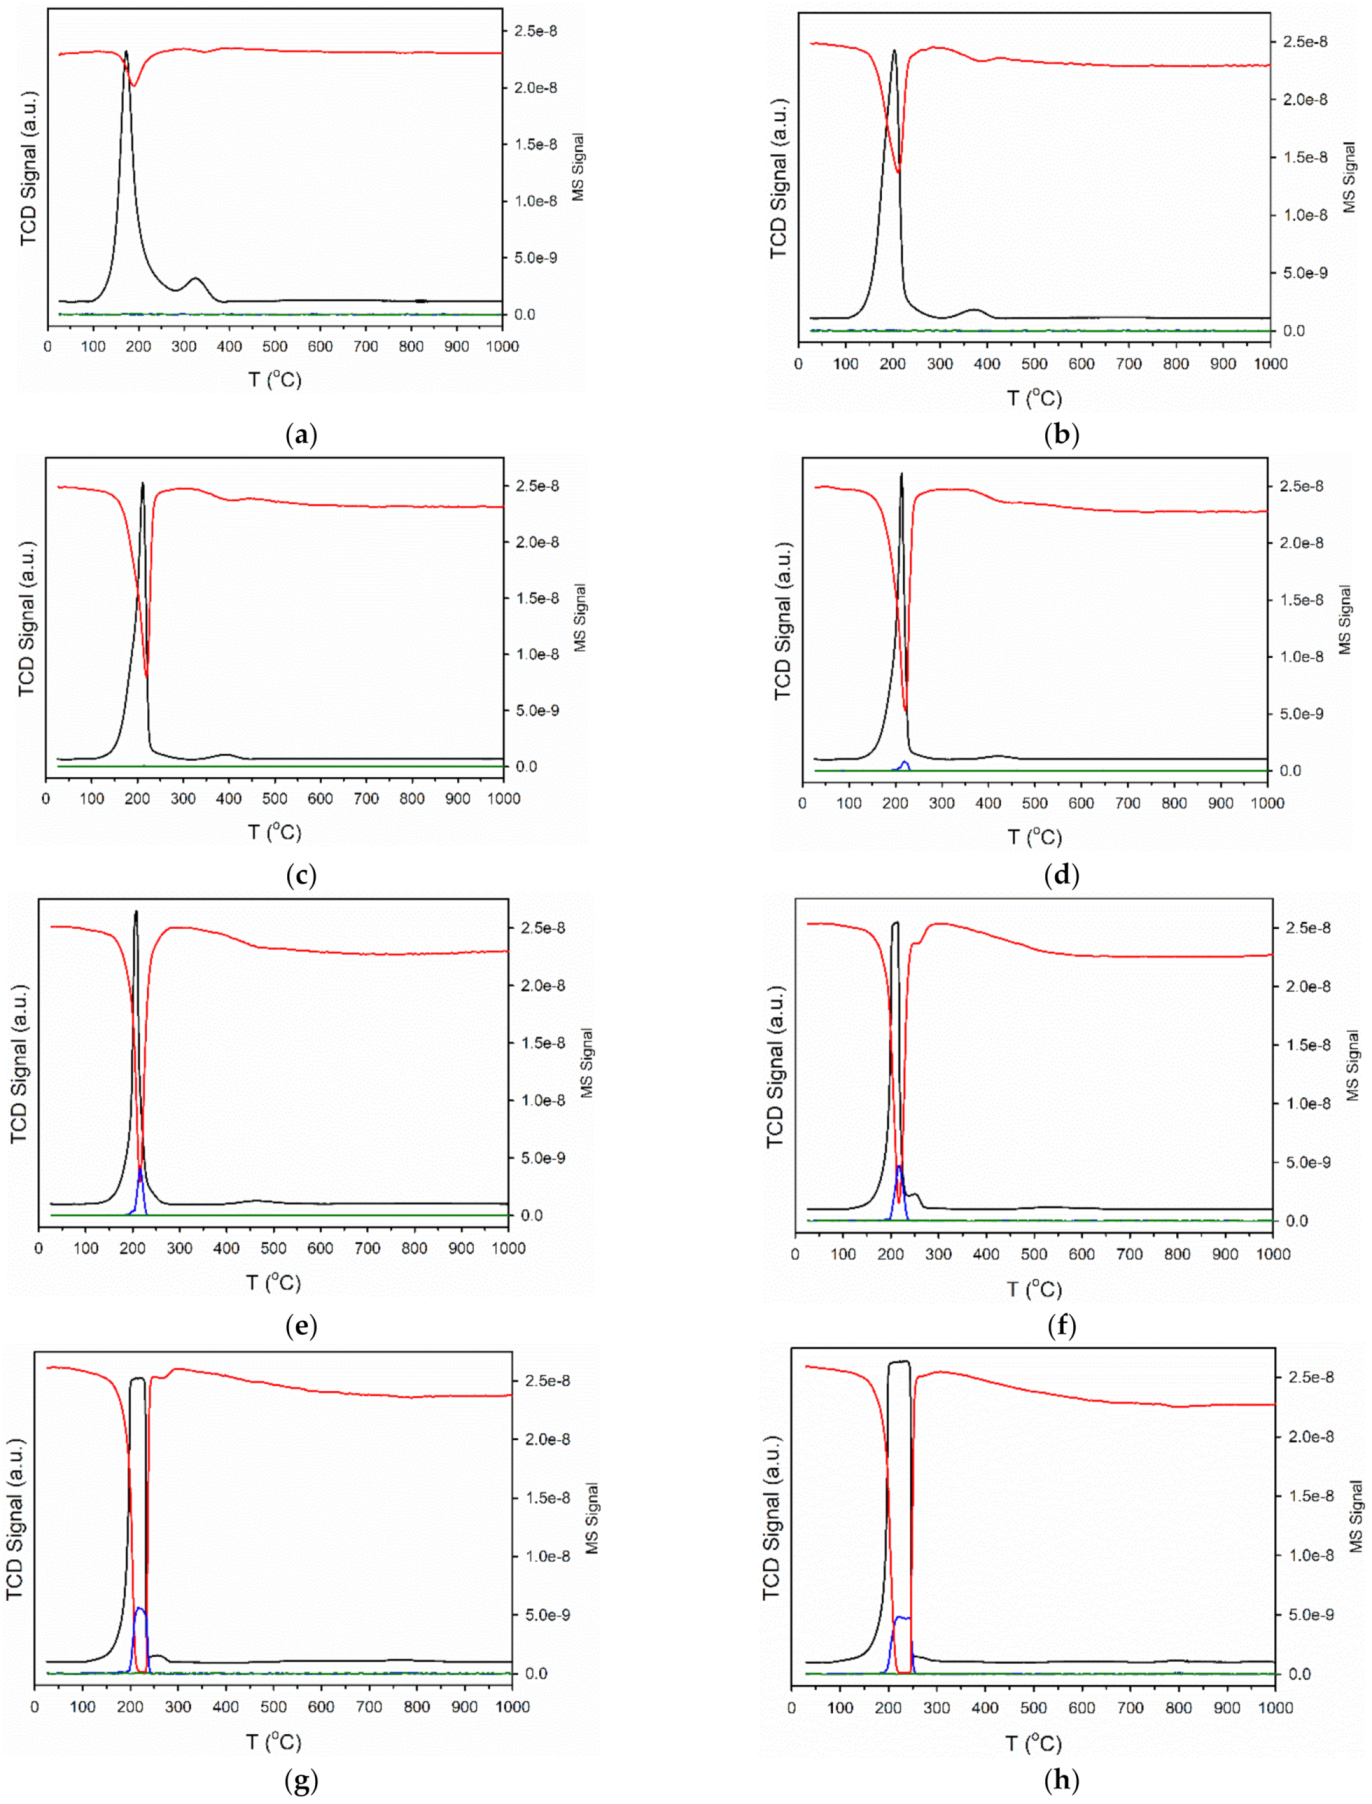
2.1. Catalyst Characterization

Table 1 provides the BET surface area, BJH pore volume, and average pore diameter for the catalysts studied. If Pt nanoparticles do not contribute significantly to the surface area, the addition of platinum would be expected to lower the catalyst surface area from 95.4 to 93.2 m2/g assuming the addition of PtO2 mass. However, Pt addition decreased the surface area to 89.6 m2/g, indicating that some pore blocking did occur. The addition of Cs further decreases the specific surface area and, as shown in Table 1, this decrease in surface area is larger than would be expected if Cs solely increased catalyst mass without contributing surface area. Moreover, the difference between expected and measured values of surface area increases with alkali loading, indicating that increasing Cs content increases the degree of pore blocking.
Pore volume decreased as expected with increasing Cs loading. The average pore diameters were similar (ranging from 89–97 angstroms). They started at 95 angstroms for the unpromoted catalyst, reached a minimum of 89 angstroms at 3.8–4.8%Cs loading and then increased to 97 angstroms at the highest loading of 14.4%Cs. This may indicate preferential pore filling of the wider pores by Cs at lower loadings; pore size distributions are presented in Figure 1.
H2 temperature-programmed reduction (TPR) profiles are provided in Figure 2. For Pt/CeO2, Pt/ZrO2, and related systems, Jacobs et al. and Chenu et al. [26,27] found that Pt facilitates surface carbonate decomposition during activation while forming bridging hydroxyl groups [28]. With increasing loading of Cs, TPR profiles display an increased TCD signal intensity, suggesting a higher surface coverage of adsorbed carbonate prior to reduction. This is due to the basicity of the Cs promoter; in fact, moving down Group 1 of the periodic table, alkali basicity increases from Li to Cs. CO2 is an acidic molecule and thus, increasing the Cs content increases the surface concentration of adsorbed CO2, present as surface carbonates. The mass spectrometer signals for H2, CO, and CO2 during TPR are shown in Figure 3 for a number of the catalysts. In the most heavily loaded Cs-promoted catalysts, the CO signal is clearly visible, while that of CO2 remains low. This result, along with the observation during catalyst activation in DRIFTS that the Pt-CO signal first increases and then decreases, indicates carbonate decomposition via decarbonylation. DRIFTS difference spectra before and after catalyst activation in H2 show significant decomposition of carbonate (Figure 4).
The mass spectrometer signal for CO2 is provided in Figure 5 during TPD of adsorbed CO2, where CO2 serves as an acidic probe molecule that tests for surface basicity. With increasing loading of Cs, CO2 desorption becomes increasingly hindered, with the profile shifting towards higher temperatures. Not only does the surface become more basic with increasing Cs content, but DRIFTS results to be discussed show that the Pt surface becomes increasingly covered with Cs. Further hampering Pt-catalyzed desorption of CO2 is the fact that Cs promotes Pt growth, also to be discussed.
The CO2 TPD patterns were able to be well fitted with a minimum of seven Gaussian peaks in the temperature range from 50 to 500 °C. These Gaussian peaks were color coded by temperature range, including where (green) Tmax of the Gaussian peaks were below 250 °C, (blue) Tmax was between 250 and 400 °C, and (red) Tmax was above 400 °C. As shown in the sub-table provided in Figure 5, over 60% of the CO2 desorption peaks were below 250 °C for the undoped 2%Pt/m-ZrO2 catalyst. Adding just 0.72%Cs resulted in a 4.8% (relative basis) decrease in the fraction of low-temperature peaks. Moreover, the peaks in the moderate temperature range (between 250 and 400 °C) also decreased slightly, while the fraction of peaks above 400 °C increased from 10.8% to 15.8% (absolute basis). Further increases in Cs content resulted in a systematic decreasing trend in the fraction of low-temperature peaks and increases in percentages of both the moderate- and high-temperate peaks. This has important consequences on the overall catalytic cycle. As will be shown in the DRIFTS discussion to follow, although forward decomposition of the formate inter mediate is accelerated even more than with Na (i.e., the alkali found by Honda Research USA, Inc. to improve the WGS rate), CO2 product desorption becomes problematic. The Cs loadings that significantly improved the formate decomposition rate were 3.87%–7.22%Cs. As shown in the sub-table of Figure 5, this Cs loading range corresponded to 22%–38% decreases (relative basis) in the fraction of low temperature (i.e., <250 °C) peaks, and increases in the fractions of moderate (~5%–7.5%, absolute basis) and high-temperature peaks (~9%–16.5%). This result indicates that in order to take advantage of the promoting effect of Cs on formate decomposition, CO2 product inhibition must, in the future, be relieved.

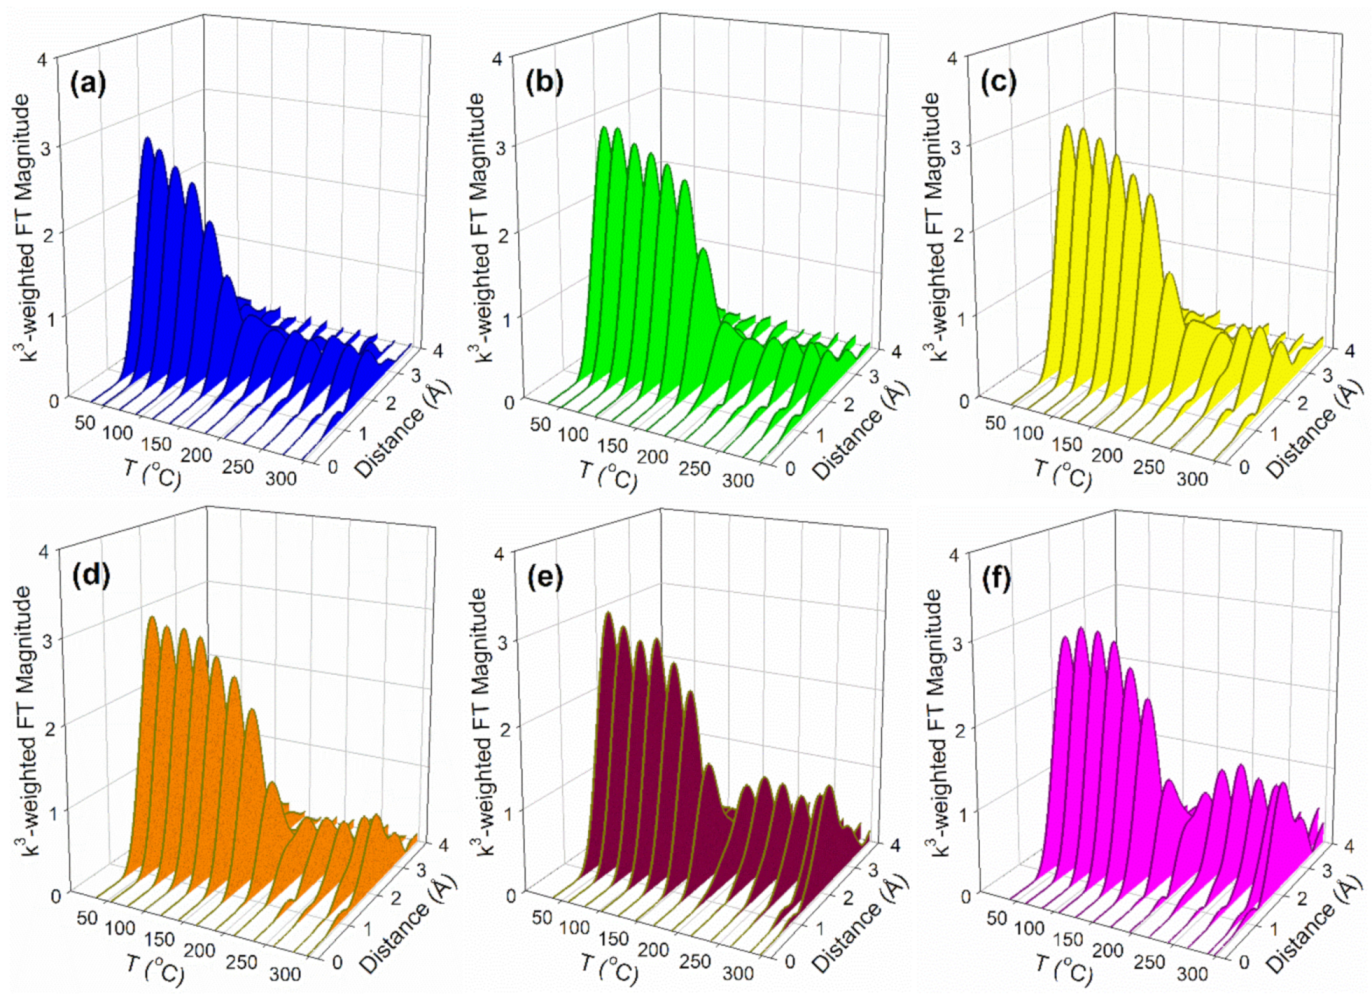
2.2. X-ray Absorption Spectroscopy
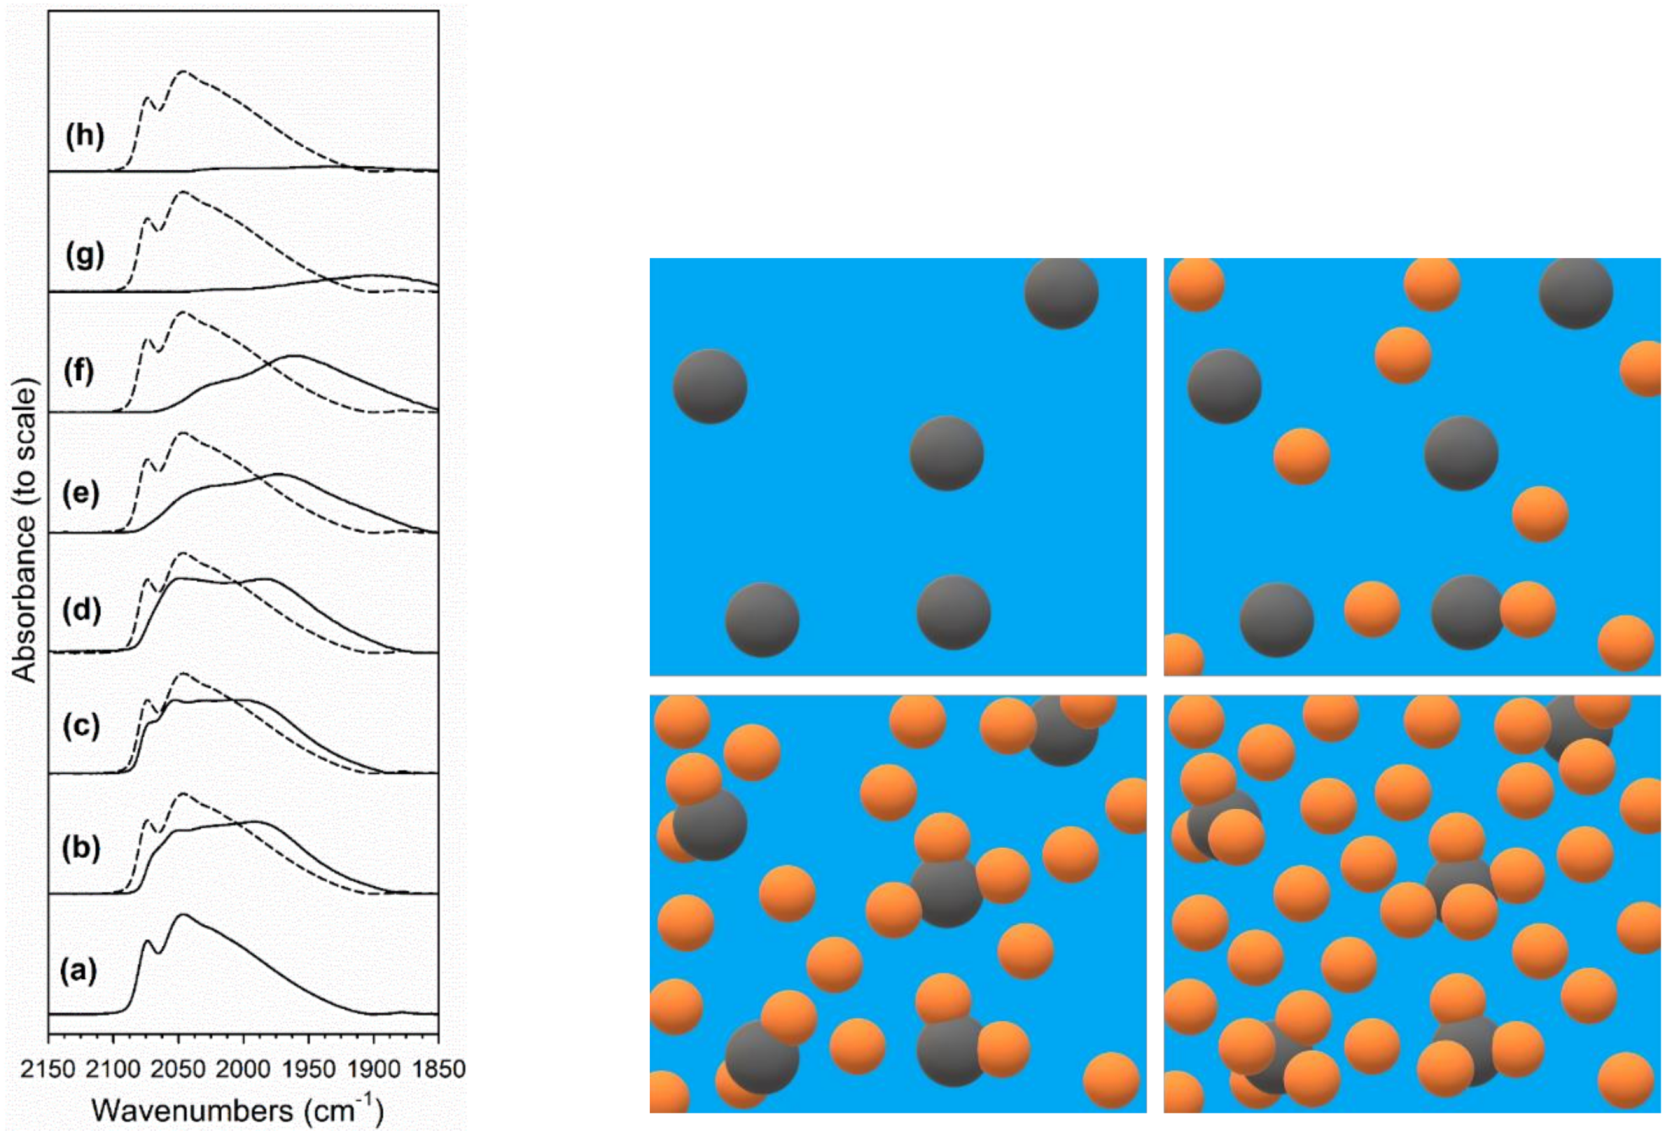
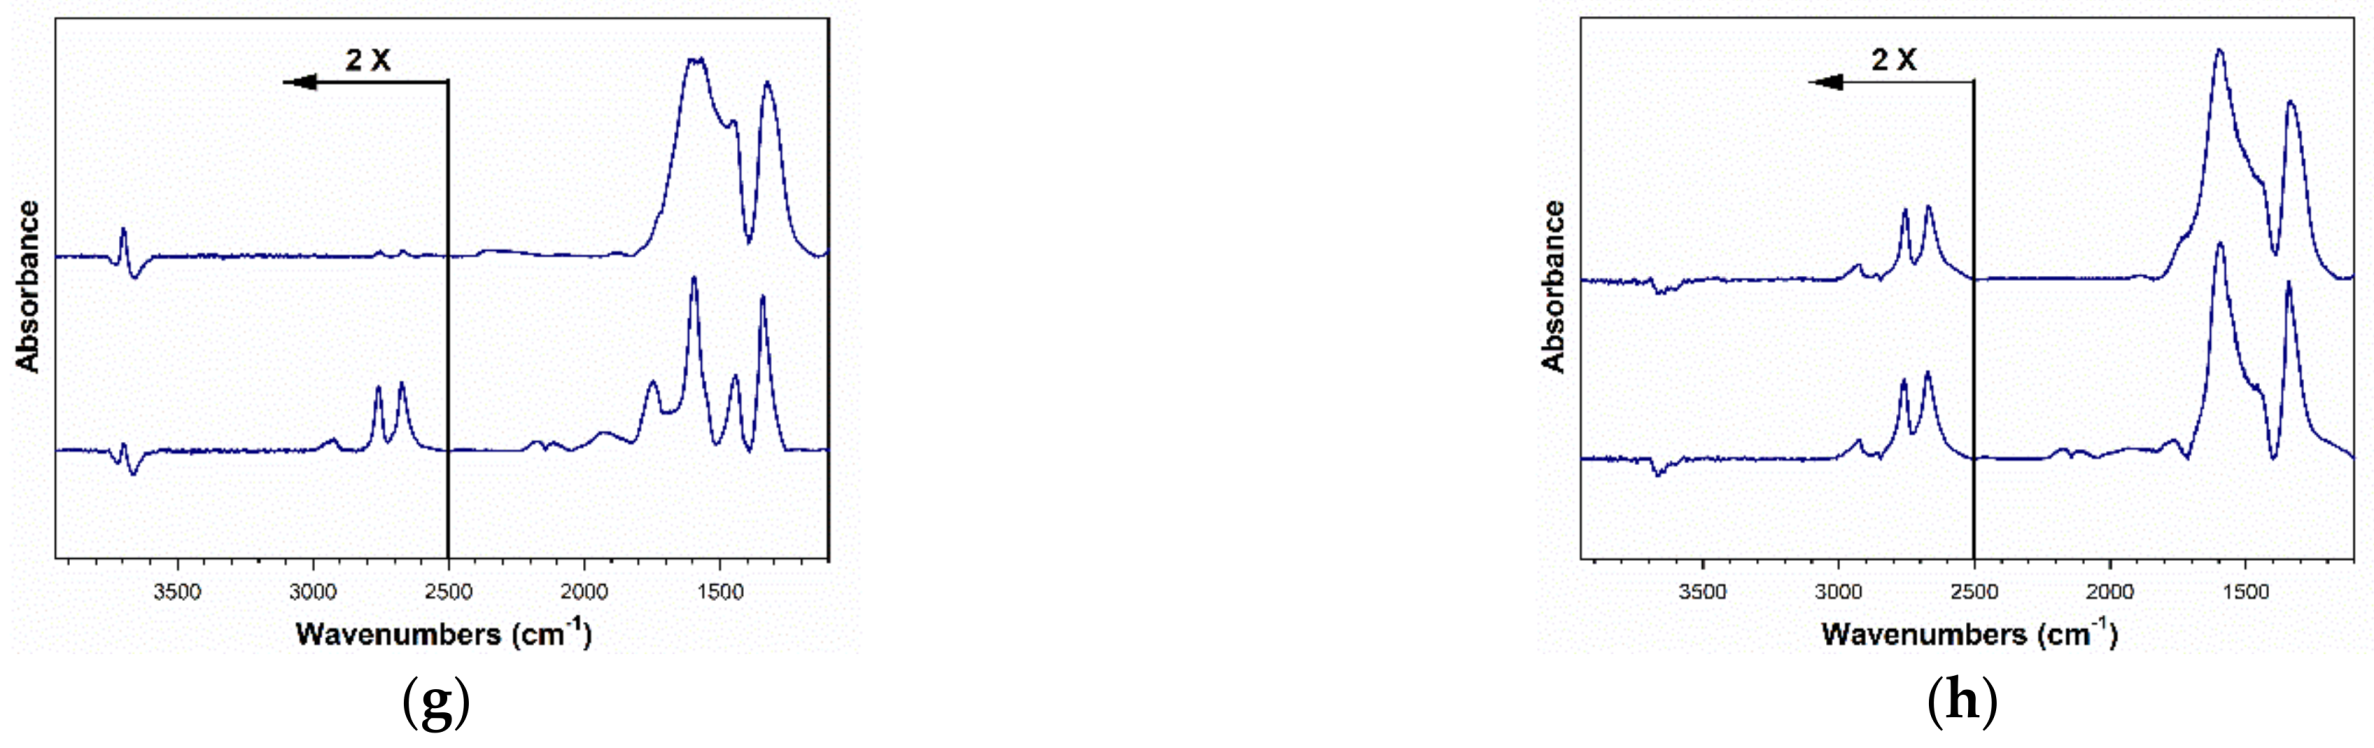
The results of fittings of EXAFS data taken at the L3-edge of Pt for a Pt0 foil, undoped 2%Pt/m-ZrO2, and Cs-promoted 2%Pt/m-ZrO2 catalysts are tabulated in Table 2 and Figure 6. Average Pt particle size was calculated from the methods of Jentys [29] and Marinkovic et al. [30] using the first atomic shell Pt-Pt coordination number (i.e., NPt-Pt) and assuming a near spherical morphology. Average Pt0 particle diameter increases with Cs loading from approximately 0.8 nm for the unpromoted 2%Pt/ZrO2 to 1.4 nm for 14.45%Cs-2%Pt/ZrO2. As such, the dispersion, which is defined as % Pt atoms exposed to the surface, decreases systematically from 92% for the unpromoted catalyst to 77% for the catalyst promoted with 14.45%Cs. This tendency for Cs to promote Pt growth complicates the analysis of the alkali effect, since WGS mechanisms are generally proposed to occur at the metal/support interface.
Electronic effects can be in part elucidated by examining the difference between the L-3 and L-2 edge spectra, which isolates the valence band and helps eliminate the Pt particle size effect on the white line. L-3 and L-2 XANES spectra, as well as the spectral difference, are provided in Figure 7. Cs being the most basic alkali is expected to have the greatest likelihood of promoting charge transfer.
However, as shown in Figure 7, Pt L3-L2 XANES difference spectra increase in mag nitude with added Cs in comparison to the unpromoted catalyst. If Cs were donating e density to Pt, enriching Pt particles, the white line would be expected to decrease with increasing loading, and this is not observed.
Cs and Pt are in direct contact, as confirmed by the TPR-XANES and TPR-EXAFS provided in Figure 8 and Figure 9. In Figure 8 (TPR-XANES), there are differences in how the white line intensity trends with temperature; the white line of Pt(IV)oxide diminishes faster for unpromoted Pt/zirconia, while doping Cs hinders the reduction rate. In Figure 9 (TPR-EXAFS), the peak for Pt-O coordination at a lower distance diminishes faster (while that of Pt-Pt in the metal at higher distance forms more rapidly) for the catalyst without Cs, while once again Cs hinders the reduction rate. This is due to the presence of Cs on the surface of Pt particles, as confirmed in DRIFTS measurements to be discussed.

2.3. DRIFTS Studies

To generate Table 3, assignments of bands to vibrational modes were taken from our earlier work on Na-doping [31] as well as those of Binet et al. [32] for the related CeO2 system. In the formate associative mechanism of LT-WGS, formate forms through the insertion of CO at bridging OH groups, which are equivalent to dissociated H2O at O-vacancies in the partially reducible oxide support. In our prior work exploring the Na-doping effect [33], both forward formate decomposition in steam and the WGS rate were accelerated [31], steam-assisted formate decomposition was accelerated and methanol selectivity to dehydrogenation/decarboxylation improved [33], and ethanol selectivity favored the demethanation of acetate in the case of ethanol steam reforming [34] in the range of 1.8–2.5%Na. The formate ν(CH) band from the reaction of CO with bridging OH groups, depicted in Figure 10, demonstrates that at loadings as low as 2.89%Cs, which is atomically equivalent to 0.5%Na, a minor redshift occurs (Δ of 19 cm−1 from 2868 to 2849 cm−1), while a major redshift occurs at 5.78%Cs (Δ of 120 cm−1 from 2868 to 2748 cm−1) as compared to the reference catalyst. This is an even larger redshift than the maximum redshift observed with Rb promoter in our previous investigation (Δ of 114 cm−1 from 2870 to 2756 cm−1). The results clearly demonstrate that Cs electronically weakens the formate C-H bond. From the seminal work of Shido and Iwasawa [35], scission of the formate C-H bond is the rate-determining step during the LT-WGS of unpromoted catalysts; this was also observed to be the case with Na-doped catalysts of optimal loading [31]. The Cs dopant accelerates the rate of formate decomposition as long as there is sufficient metal present at the metal/support interface to assist in this dehydrogenation step. In Figure 11, which shows the decomposition of formate through the monitoring of the ν(CH) band in steam at 130 °C, the forward formate decomposition rate increases with Cs loading until a maximum rate is achieved at 4.80% or 5.78%Cs, where the redshift is pronounced (2811 cm−1 with Δ = 57 cm−1 for 4.80%Cs and 2748 cm−1 with Δ = 120 cm−1 for 5.78%Cs relative to the undoped catalyst of 2868 cm−1, respectively). The formate decomposition rate decreases at Cs loadings higher than 5.78%Cs. Insight into this deceleration is found by inspecting the Pt-CO bands from 2100 to 1850 cm−1.
Figure 12 (left) shows the Pt-CO bands for the adsorption of CO at 130 °C, where the dashed line spectra show the profile of the undoped 2%Pt/m-ZrO2 reference catalyst. Clearly, the Pt-CO band has lower intensity with increasing Cs loading. From the EXAFS fittings (Table 2 and Figure 6), part of this decrease is due to a larger Pt particle size, such that less Pt is exposed on the surface. However, Table 4 shows that the Pt-CO band intensity decreases more than dispersion, revealing that Cs plays a role in blocking Pt surface sites, especially at high Cs loadings. Above 5.78%Cs, the Pt surface becomes progressively diminished in capacity, such that the formate decomposition rate becomes increasingly inhibited due to a lack of available Pt sites, which provide a porthole for H2 removal [28]. The effect is illustrated in Figure 12 (right).
The Pt-carbonyl bands also display a redshift with increasing Cs doping levels, with the main ν(CO) band moving from 2050 cm−1 for the undoped catalyst to 1995 cm−1 (2.89%Cs), 1960 cm−1 (7.22%Cs), and 1900 cm−1 (10.41%Cs). This effect is typically ascribed to electronic enrichment of Pt by the alkali, with increased backdonation to CO 2π* anti bonding molecular orbitals, an effect that was not confirmed by XANES difference analy sis. Another possibility is that the presence of the alkali has a geometric effect that disrupts the dipole-dipole couple of adsorbed CO.
The evolution of gas-phase CO2 at ~2350 cm−1, formed from the forward decompos tion of formate, is provided for several Cs-promoted catalysts in Figure 13. For undoped, Na-doped, and K-doped Pt/ZrO2 catalysts to date, CO2 formation generally becomes at tenuated when formate has completely decomposed, and that is true even when Pt-CO bands remain present at high intensity [21,33,34], as shown in Figure 14. This finding tends to favor an associative formate mechanism in contrast to the redox mechanism, where Pt-CO serves as an intermediate. In the current series of catalysts, CO2 evolution follows this trend for the unpromoted catalyst, but it does not do so with Cs-doped catalysts, especially at higher loading. Instead, the CO2 continues to slowly evolve. This result suggests that while formate does indeed become accelerated, and, in fact, Cs is remarkably good at accelerating formate decomposition, the problem is that the second intermediate in the mechanism—carbonate species—becomes hindered from decomposing. This finding is in good agreement with the CO2 TPD trends observed previously in Figure 5. The consequence of this is a shift in the rate-limiting step from formate decomposition to car bonate decomposition. Figure 15 shows DRIFTS spectra before and after formate decom position in steam. Save for the 14.45%Cs doped catalyst, formate decomposes completely during the 60 min experiment, as evidenced by the complete loss in intensity of the for mate ν(CH) band. Following formate decomposition, residual carbonate, which is the pre cursor to CO2 formation, remains as ν(OCO) bands are evident while the ν(CH) band of formate is no longer visible. Table 3 provides band assignments of formates/carbonates.
As demonstrated by Shido and Iwasawa in their original work [6,35], co-adsorbed H2O also plays a critical role in formate decomposition, impacting both rate and selectivity (i.e., favoring forward decomposition to H2 and carbonate). In Figure 16, unpromoted and 5.78%Cs-promoted catalysts were tested for formate decomposition in the absence of H2O at 130 °C. Both catalysts exhibited very slow formate decomposition rates in the absence of H2O as compared to their counterparts with H2O (Figure 11). Even in the absence of H2O, a more rapid formate decomposition rate was observed for the Cs-promoted catalyst, whereas almost no decrease in the intensity of the ν(CH) band was found in the case of the unpromoted catalyst at 130 °C.
Additional evidence of the acceleration of formate decomposition came from TP-re action profiles of formate decomposition in H2O. The evolution of H2 during formate de composition in the presence of co-adsorbed H2O is provided in Figure 17. The H2 produc tion peak from forward formate decomposition gradually moves to a lower temperature from 300 °C for the unpromoted catalyst to 290 °C for the 2.89%Cs-doped catalyst, reaching a minimum temperature of 230 °C (shoulder at 270 °C) at 5.78%Cs (the optimum for formate decomposition from DRIFTS). At higher loadings of Cs, the H2 evolution peak then begins to shift upward in temperature, first to 250 °C (with a shoulder at 280 °C) for the 7.22%Cs loading and then to 290 and 320 °C for the 10.41 and 14.45%Cs-doped catalysts. Once again, the catalyst loaded with 5.78%Cs accelerated formate decomposition the most, while adding higher loadings of Cs blocked Pt sites hindering Pt-catalyzed for mate decomposition.

2.4. Reactor Testing

CO conversion vs. time on stream (T.o.S.) is presented in Figure 18 for catalysts with different amounts of cesium promotion, whereas the CO conversion and CO2 selectivity at steady-state conditions for each catalyst tested are summarized in Table 5. All promoted catalysts show lower conversion than the reference catalyst. The CO conversion progressively decreases by increasing the Cs loading. For example, at steady-state conditions (300 °C), the unpromoted catalyst had a conversion of 83.1%, whereas it was 63.9% and 51.1% for 0.72% and 2.17%Cs-promoted catalysts, respectively. The CO conversion drops to a value lower than 20% when the Cs loading is higher than 5.87%. After Cs promotion, the activity performance of the catalyst is no longer consistent with the rate-limiting step being the C-H bond breaking of formate. In fact, DRIFTS results showed an improvement in the forward formate decomposition rate with Cs loading until a maximum rate in the range of 4.80%–5.78%Cs. This indicates that the rate-limiting step shifts from formate decomposition (i.e., in the case of unpromoted and earlier Na [36,37] and K-promoted [38] catalysts) to CO2 desorption. This explains the decrease in activity with increasing Cs loading despite the fact that the rate of formate decomposition reaches a maximum for the catalyst promoted with 5.78%Cs. As was seen in CO2 TPD results, loading Cs increases catalyst basicity and stabilizes intermediate carbonate, preventing CO2 desorption. Cs, especially at higher loadings, also binds with Pt sites, blocking H-transfer reactions.
Among all the catalysts, 0.72%Cs showed greater stability in comparison with the reference catalyst (Figure 19). The performance for the unpromoted catalyst was compared to the catalyst with 0.72%Cs catalyst for a long time on-stream of 18 h by testing at the same initial CO conversion by adjusting the SV of the 0.72%Cs catalyst to 121,057 Ncc/h∙gcat. The results show that cesium promotion is able to enhance catalyst stability relative to the reference catalyst and achieve better steady-state CO conversion. Indeed, the loss of activity after 18 h was just 11.9% for the 0.72%Cs promoted catalyst, while it was 17.1% for the unpromoted catalyst.

3. Materials and Methods

3.1. Catalyst Preparation

Unpromoted and cesium-doped 2%Pt/m-ZrO2 catalysts were prepared with diverse loadings (0.72%, 1.45%, 2.17%, 2.89%, 3.87%, 4.80%, 5.78%, 7.22%, 10.41% or 14.45% by weight) of Cs. Monoclinic phase zirconia (63–125 μm) (No. 43815, Alfa Aesar, Haverhill, MA, USA) was impregnated with 2% Pt using aqueous Pt(NH3)4(NO3)2 (No. 88960, Alfa Aesar, Haverhill, MA, USA) by incipient wetness impregnation (IWI). After calcination for 4 h in a muffle furnace at 350 °C, the catalyst was divided into several portions and was promoted by aqueous CsNO3 (No. 12884, Alfa Aesar, Haverhill, MA, USA) by IWI. Impregnation was followed by drying and re-calcining at 350 °C for four hours using a muffle furnace.

3.2. Characterization

3.2.1. BET Surface Area

Catalysts were first outgassed in vacuum at 160 °C to below 6.7 Pa. Each catalyst was cooled to cryogenic temperatures under vacuum, and a Micrometrics (Norcross, GA, USA) 3-Flex system was used to determine porosity and surface area parameters using BJH and BET methods by physisorption of N2 (American Welding & Gas, UHP, Lexington, KY, USA).

3.2.2. Temperature-Programmed Reduction/Mass Spectrometry

Temperature-programmed reduction (TPR) was conducted on the catalysts utilizing an Altamira AMI-300R (Pittsburgh, PA, USA) instrument coupled to a mass spectrometer from Hiden Analytical (Warrington, UK). The procedure entailed flowing 10% H2/He at 30 cm3/min (Airgas, San Antonio, TX, USA) while ramping temperature from 50 to 1000 °C at a heating rate of 10 °C/min. Samples were first pretreated in flowing He (30 ccm) at 300 °C (1 °C/min ramp rate) prior to TPR to remove H2O.

3.2.3. Temperature-Programmed Reaction and Desorption

Temperature-programmed reaction/desorption (TP-reaction/TPD) experiments were conducted on an Altimira (Pittsburgh, PA, USA) AMI-300. Following catalyst reduction at 300 °C using 33%H2/He (Airgas, San Antonio, TX, USA) at 30 cm3/min, each catalyst was cooled to 225 °C in flowing H2. 50 cm3/min of He was then bubbled through a saturator at 31 °C containing water and passed through the reaction tube for 15 min. The catalyst was contacted with reducing gas for another 15 min, and then the catalyst was purged with 50 cm3/min He. This treatment formed Type II surface OH groups at O-vacancy sites. Formate and Pt-CO species formed on the catalyst surface by contacting the catalyst with flowing 4%CO/He at 25 cm3/min. Following cooling to 50 °C, water was adsorbed to the catalyst surface by bubbling 50 cm3/min He through the saturator for 15 min. The reaction tube containing catalyst was then heated slowly to 400 °C to react H2O and formate. m/z of 2 was followed. For TPD of adsorbed CO2, following pretreatment of the catalyst as described above, TPD of adsorbed CO2 (Airgas, San Antonio, TX, USA) in flowing He (30 cm3/min) was conducted to assess catalyst basicity. m/z of 44 was followed.

3.2.4. EXAFS

The Materials Research Collaborative Access Team (MR-CAT) beamline at the Advanced Photon Source in Argonne National Laboratory was used to conduct in situ H2-EXAFS experiments. Incident energies were selected via a Si (1 1 1) monochromator in conjunction with a Rh-coated mirror to remove non-fundamental harmonics of the beam energy. Jacoby describes an experimental setup similar to that used in this work [39]. In situ TPR was conducted on six samples simultaneously using a multi-sample holder (3 mm i.d. channels) made of stainless steel. Self-supporting wafers were loaded into each channel using roughly 6 mg of catalyst, an amount optimized for the Pt LIII edge on a ZrO2 support. The multi-sample holder was placed inside a clamshell furnace mounted on the positioning table. The quartz tube is outfitted with Kapton view ports and ports for gas and a thermocouple. Samples were aligned with the beam with 20 μm precision for repeat scans. After positioning, the quartz tube was purged with 100 mL/min He for at least 5 min. Afterward, 100 mL/min pure hydrogen was flowed, and the temperature was increased to 350 °C at a rate of 1.0 °C/min. Spectra at the Pt L-3 edge were taken in transmission made with Pt0 foil serving as a reference for energy calibration. EXAFS spectra were analyzed using WinXAS [40]. Fitting of EXAFS Spectra was carried out with WinXAS [40], Atoms [41], FEFF [42] and FEFFIT [42] using spectra from the end of the TPR (after the temperature had been ramped to 350 °C and subsequently cooled in flowing H2). Fittings were performed from 3 Å−1 to 10 Å−1 in k-space. The inner Pt-Pt coordination shell was isolated by applying a Hanning window of the Fourier-transformed spectra and subsequently performing the inverse Fourier transform. Fittings were performed from 1.85 Å to 3.25 Å in R space.

3.2.5. DRIFTS

A Nicolet iS-10 FTIR spectrometer was employed to carry out LT-WGS DRIFTS experiments in transient mode. To activate each catalyst, 1:1 H2:He was passed through the catalytic reaction cell (Harrick Scientific, Pleasantville, NY, USA) at 300 °C for 1 h. After activation of the catalyst, the cell was cooled to 225 °C in H2, and 75 cm3/min He was bubbled through water and passed through the cell for 8 min. After this step, which ensured Type II bridging OH group formation, 100 cm3/min H2 was flowed for 15 min, and then the cell was purged in 100 cm3/min of flowing helium. After these activation steps, formate species and Pt-carbonyl species were formed on the surface as 4%CO/He was flowed at 50 cm3/min through the cell. A scan was taken at 130 °C to obtain the maximum formate/Pt-CO band intensities. Helium was bubbled through a water bath at 31 °C, and saturated vapor (4.4% H2O/He) was passed through the cell at 75 cm3/min to decompose the formate and Pt-CO species.

3.2.6. Reaction Testing

Reactor tests were performed on a tubular reactor with a fixed bed (0.44 in i.d.). The catalyst samples were sieved to 63–106 μm and diluted using 3:1 glass beads (borosilicate): catalyst. For each run, the reactor was loaded with 1 g of diluted catalyst. Each catalyst was activated in hydrogen (100 ccm/min) for 60 min while the temperature was raised to 350 °C at a constant rate. The activity tests were performed at ambient pressure and 265–300 °C (space velocity (SV) = 167,638 sccm/h·gcat). The stability test was carried out at 300 °C and atmospheric pressure, while the similar initial CO conversion was obtained by adjusting the SV. The feed gas consisted of 2.9% CO, 2.61 % H2O, 29.9% H2, 36.8% He, and 27.79% N2 in each test. The effluent passed through a flash drum at 0 °C, and the vapor portion was analyzed on an SRI 8610 gas chromatograph (GC). The SRI 8610 GC is equipped with two columns: one containing molecular sieves and the other containing silica. Additionally, the SRI 8610 GC contains a TCD, methanizer, and flame ionization detector.

4. Conclusions

The influence of Cs, an alkali dopant, on the decomposition rates of WGS intermediates was examined, and the results were compared to reaction testing experiments. The electronic and geometric properties of the catalysts were also investigated. Cs behaved much like Rb from our earlier investigation. Only the catalyst with low Cs loading (0.72%) showed an improvement in performance, and that was for the stability of the catalyst during steady-state LT-WGS. Cs addition tended to diminish surface area and pore volume. In infrared red spectroscopy of adsorbed CO, it displayed the greatest redshift of all the alkalis tested to date in the ν(CH) band of formate, ~120 cm−1 lower than the unpromoted catalyst at 5.78%Cs. This pointed to a profound weakening of the formate C-H bond, facilitating its scission. For undoped, Na-doped, and K-doped catalyst, this is the proposed rate-limiting step of the formate associative mechanism. Cs-addition also resulted in a remarkable improvement in the steam-assisted formate decomposition rate, as monitored by both DRIFTS and TP-reaction with MS. The most rapid rate was obtained at 5.78%Cs, consistent with the greatest redshift observed in the ν(CH) band of formate. At higher loadings of Cs, Pt nanoparticles become covered by Cs, obstructing the catalytic function of Pt to assist in dehydrogenating formate.
Contact between Cs and Pt nanoparticles was demonstrated by the attenuation of the Pt-CO band in DRIFTS. This attenuation was demonstrated to be due in part to Cs covering Pt, but also due to a role that Cs plays in facilitating Pt particle agglomeration, as measured by EXAFS; a systematic increase in Pt diameter was measured by EXAFS with increasing Cs loading from 0.8 to 1.4 nm. Utilizing a XANES L3-L2 edge difference procedure, no direct evidence for transfer of electron density from Cs to Pt was detected to explain the electronic modification of the formate C-H bond. Unfortunately, a greatly improved formate decomposition rate did not translate to an improved steady-state LT-WGS rate. TPD-MS of adsorbed CO2 showed that Cs addition significantly increased catalyst basicity, to the point that product inhibition became problematic. Thus, the rate-limiting step switches from steam-assisted formate decomposition (which is certainly promoted by Cs) to CO2 desorption (i.e., carbonate decomposition). Recall that CO2 is an acidic molecule, and increasing the basicity of the catalyst too much stabilizes CO2. The remarkable promoting effect of Cs on formate decomposition has important implications for potentially improving the H2-selectivities in methanol/ethanol steam reforming and related reactions.

Author Contributions

Conceptualization, catalyst preparation, catalyst characterization, formal analysis, supervision, writing, G.J. Catalyst characterization, formal analysis, supervision, writing, Z.R. Catalyst preparation, catalyst characterization, formal analysis, writing, C.D.W. Reaction testing, characterization, formal analysis, conceptualization, writing, M.M. Catalyst preparation, supervision, resources, D.C.C. Catalyst characterization, data curation, resources, supervision, A.J.K. All authors have read and agreed to the published version of the manuscript.

Funding

Caleb D. Watson would like to acknowledge support from the Undergraduate NSF Research Program, supported by the National Science Foundation through grant award #1832388.

Data Availability Statement

Not applicable.

Acknowledgments

Argonne’s research was supported in part by the U.S. Department of Energy (DOE), Office of Fossil Energy, National Energy Technology Laboratory (NETL). Advanced photon source was supported by the U.S. Department of Energy, Office of Science, Office of Basic Energy Sciences, under contract number DE-AC02-06CH11357. MRCAT operations are supported by the Department of Energy and the MRCAT member institutions. CAER research was supported by the Commonwealth of Kentucky. Caleb D. Watson would like to acknowledge funding from a UTSA College of Engineering Scholarship. Gary Jacobs would like to thank UTSA and the State of Texas for financial support through startup funds.

Conflicts of Interest

The authors declare no conflict of interest.

References

  1. Midilli, A.; Ay, M.; Dincer, I.; Rosen, M.A. On hydrogen and hydrogen energy strategies: I: Current status and needs. Renew. Sustain. Energy Rev. 2005, 9, 255–271. [Google Scholar] [CrossRef]
  2. Nikolaidis, P.; Poullikkas, A. A comparative overview of hydrogen production processes. Renew. Sustain. Energy Rev. 2017, 67, 597–611. [Google Scholar] [CrossRef]
  3. Bethoux, O. Hydrogen Fuel Cell Road Vehicles and Their Infrastructure: An Option towards an Environmentally Friendly Energy Transition. Energies 2020, 13, 6132. [Google Scholar] [CrossRef]
  4. Bhat, S.A.; Sadhukhan, J. Process intensification aspects for steam methane reforming: An overview. AIChE J. 2009, 55, 408–422. [Google Scholar] [CrossRef]
  5. Assabumrungrat, S.; Phromprasit, J. Fuel processing technologies for hydrogen production from methane. Eng. J. 2012, 16, 1–4. [Google Scholar] [CrossRef]
  6. Shido, T.; Iwasawa, Y. Reactant-promoted reaction mechanism for water-gas shift reaction on Rh-doped CeO2. J. Catal. 1993, 141, 71–78. [Google Scholar] [CrossRef]
  7. Vignatti, C.; Avila, M.S.; Apesteguia, C.R.; Garetto, T.F. Catalytic and DRIFTS study of the WGS reaction on Pt-based catalysts. Int. J. Hydrogen Energy 2010, 35, 7302–7312. [Google Scholar] [CrossRef]
  8. Jacobs, G.; Ricote, S.; Graham, U.M.; Patterson, P.M.; Davis, B.H. Low temperature water gas shift: Type and loading of metal impacts forward decomposition of pseudo-stabilized formate over metal/ceria catalysts. Catal. Today 2005, 106, 259–264. [Google Scholar] [CrossRef]
  9. Kauppinen, M.M.; Melander, M.M.; Marko, M.; Bazhenov, A.S.; Honkala, K. Unraveling the Role of the Rh–ZrO2 Interface in the Water–Gas-Shift Reaction via a First-Principles Microkinetic Study. ACS Catal. 2018, 8, 11633–11647. [Google Scholar] [CrossRef] [Green Version]
  10. Ratnasamy, C.; Wagner, J.P. Water gas shift catalysis. Catal. Rev. 2009, 51, 325–440. [Google Scholar] [CrossRef]
  11. Panagiotopoulou, P.; Kondarides, D.I. Effect of the nature of the support on the catalytic performance of noble metal catalysts for the water–gas shift reaction. Catal. Today 2006, 112, 49–52. [Google Scholar] [CrossRef]
  12. Wang, Y.X.; Wang, G.C. A systematic theoretical study of the water gas shift reaction on the Pt/ZrO2 interface and Pt (111) face: Key role of a potassium additive. Catal. Sci. Technol. 2020, 10, 876–892. [Google Scholar] [CrossRef]
  13. Wang, X.; Gorte, R.J. The effect of Fe and other promoters on the activity of Pd/ceria for the water-gas shift reaction. Appl. Catal. A Gen. 2003, 247, 157–162. [Google Scholar] [CrossRef] [Green Version]
  14. Song, W.; Hensen, E.J. Mechanistic aspects of the water–gas shift reaction on isolated and clustered Au atoms on CeO2 (110): A density functional theory study. ACS Catal. 2014, 4, 1885–1892. [Google Scholar] [CrossRef]
  15. Sun, K.; Kohyama, M.; Tanaka, S.; Takeda, S. Reaction mechanism of the low-temperature water–gas shift reaction on Au/TiO2 catalysts. J. Phys. Chem. C 2017, 121, 12178–12187. [Google Scholar] [CrossRef]
  16. Kalamaras, C.M.; Panagiotopoulou, P.; Kondarides, D.I.; Efstathiou, A.M. Kinetic and mechanistic studies of the water–gas shift reaction on Pt/TiO2 catalyst. J. Catal. 2009, 264, 117–129. [Google Scholar] [CrossRef]
  17. Petallidou, K.C.; Polychronopoulou, K.; Boghosian, S.; Garcia-Rodriguez, S.; Efstathiou, A.M. Water–Gas shift reaction on Pt/Ce1–xTix O2− δ: The effect of Ce/Ti ratio. J. Phys. Chem. C 2013, 117, 25467–25477. [Google Scholar] [CrossRef]
  18. Figueiredo, R.T.; Santos, M.S.; Andrade, H.M.C.; Fierro, J.L.G. Effect of alkali cations on the CuZnOAl2O3 low temperature water gas-shift catalyst. Catal. Today 2011, 172, 166–170. [Google Scholar] [CrossRef]
  19. Komarov, Y.M.; Il’in, A.A.; Smirnov, N.N.; Il’in, A.P.; Babaikin, D.B. Effect of alkali metal oxides on the selectivity of carbon monoxide conversion to give hydrogen on copper-containing catalysts. Russ. J. Appl. Chem. 2013, 86, 27–31. [Google Scholar] [CrossRef]
  20. Gao, P.; Graham, U.M.; Shafer, W.D.; Linganiso, L.Z.; Jacobs, G.; Davis, B.H. Nanostructure and kinetic isotope effect of alkali-doped Pt/silica catalysts for water-gas shift and steam-assisted formic acid decomposition. Catal. Today 2016, 272, 42–48. [Google Scholar] [CrossRef]
  21. Pigos, J.M.; Brooks, C.J.; Jacobs, G.; Davis, B.H. Low temperature water-gas shift: Characterization of Pt-based ZrO2 catalyst promoted with Na discovered by combinatorial methods. Appl. Catal. A Gen. 2007, 319, 47–57. [Google Scholar] [CrossRef]
  22. Pigos, J.M.; Brooks, C.J.; Jacobs, G.; Davis, B.H. Low temperature water–gas shift: The effect of alkali doping on the CH bond of formate over Pt/ZrO2 catalysts. Appl. Catal. A Gen. 2007, 328, 14–26. [Google Scholar] [CrossRef]
  23. Evin, H.N.; Jacobs, G.; Ruiz-Martinez, J.; Graham, U.M.; Dozier, A.; Thomas, G.; Davis, B.H. Low temperature water–gas shift/methanol steam reforming: Alkali doping to facilitate the scission of formate and methoxy C–H bonds over Pt/ceria catalyst. Catal. Lett. 2008, 122, 9–19. [Google Scholar] [CrossRef]
  24. González-Cobos, J.; Valverde, J.L.; de Lucas-Consuegra, A. Electrochemical vs. chemical promotion in the H2 production catalytic reactions. Int. J. Hydrogen Energy 2017, 42, 13712–13723. [Google Scholar] [CrossRef]
  25. Kusche, M.; Bustillo, K.; Agel, F.; Wasserscheid, P. Highly Effective Pt-Based Water–Gas Shift Catalysts by Surface Modification with Alkali Hydroxide Salts. ChemCatChem 2015, 7, 766–775. [Google Scholar] [CrossRef] [Green Version]
  26. Jacobs, G.; Williams, L.; Graham, U.; Thomas, G.A.; Sparks, D.E.; Davis, B.H. Low temperature water–gas shift: In situ DRIFTS-reaction study of ceria surface area on the evolution of formates on Pt/CeO2 fuel processing catalysts for fuel cell applications. Appl. Catal. A Gen. 2003, 252, 107–118. [Google Scholar] [CrossRef]
  27. Chenu, E.; Jacobs, G.; Crawford, A.C.; Keogh, R.A.; Patterson, P.M.; Sparks, D.E.; Davis, B.H. Water-gas shift: An examination of Pt promoted MgO and tetragonal and monoclinic ZrO2 by in situ drifts. Appl. Catal. B Environ. 2005, 59, 45–56. [Google Scholar] [CrossRef]
  28. Jacobs, G.; Graham, U.M.; Chenu, E.; Patterson, P.M.; Dozier, A.; Davis, B.H. Low-temperature water–gas shift: Impact of Pt promoter loading on the partial reduction of ceria and consequences for catalyst design. J. Catal. 2005, 229, 499–512. [Google Scholar] [CrossRef]
  29. Jentys, A. Estimation of mean size and shape of small metal particles by EXAFS. Phys. Chem. Chem. Phys. 1999, 1, 4059–4063. [Google Scholar] [CrossRef]
  30. Marinković, N.S.; Sasaki, K.; Adzic, R.R. Nanoparticle size evaluation of catalysts by EXAFS: Advantages and limitations. Zaštita Mater. 2016, 57, 101–109. [Google Scholar] [CrossRef] [Green Version]
  31. Pigos, J.M.; Brooks, C.J.; Jacobs, G.; Davis, B.H. Low temprature water-gas shift: Assessing formates as potential intermediates over Pt/ZrO2 and Na doped Pt/ZrO2 catalysts employing the SSITKA-DRIFTS technique. In Advances in Fischer Tropsch Synthesis: Catalysts and Catalysis; Davis, B.H., Occelli, M., Eds.; Taylor & Francis: Boca Raton, FL, USA, 2010; pp. 365–394. [Google Scholar]
  32. Binet, C.; Daturi, M.; Lavalley, J.C. IR study of polycrystalline ceria properties in oxidised and reduced states. Catal. Today 1999, 50, 207–225. [Google Scholar] [CrossRef]
  33. Martinelli, M.; Jacobs, G.; Shafer, W.D.; Davis, B.H. Effect of alkali on C-H bond scission over Pt/YSZ catalyst during water-gas shift, steam-assisted formic acid decomposition and methanol steam reforming. Catal. Today 2017, 291, 29–35. [Google Scholar] [CrossRef]
  34. Martinelli, M.; Castro, J.D.; Alhraki, N.; Matamoros, M.E.; Kropf, A.J.; Cronauer, D.C.; Jacobs, G. Effect of sodium loading on Pt/ZrO2 during ethanol steam reforming. Appl. Catal. 2021, 610, 117947. [Google Scholar] [CrossRef]
  35. Iwasawa, Y. Surface Catalytic Reactions Assisted by Gas Phase Molecules. Accts. Chem. Res. 1997, 30, 103–109. [Google Scholar] [CrossRef]
  36. Martinelli, M.; Watson, C.D.; Jacobs, G. Sodium doping of Pt/m-ZrO2 promotes C-C scission and decarboxylation during ethanol steam reforming. Int. J. Hydrogen Energy 2020, 45, 18490–18501. [Google Scholar] [CrossRef]
  37. Martinelli, M.; Alhraki, N.; Castro, J.D.; Matamoros, M.E.; Jacobs, G. Water-Gas Shift: Effect of Na Loading on Pt/m-zirconia Catalysts for Low-Temperature Shift for the Production and Purification of Hydrogen. New Dimensions in Production and Utilization of Hydrogen; Elsevier: Amsterdam, The Netherlands, 2020; pp. 143–160. [Google Scholar]
  38. Watson, C.D.; Martinelli, M.; Cronauer, D.C.; Kropf, A.J.; Marshall, C.L.; Jacobs, G. Low temperature water-gas shift: Optimi zation of K loading on Pt/m-ZrO2 for enhancing CO conversion. Appl. Catal. A Gen. 2020, 598, 117572. [Google Scholar] [CrossRef]
  39. Jacoby, M. X-ray absorption spectroscopy. Chem. Eng. News 2001, 79, 33. [Google Scholar] [CrossRef]
  40. Ressler, T. WinXAS: A program for X-ray absorption spectroscopy data analysis under MS-Windows. J. Synchrotron Radiat. 1998, 5, 118. [Google Scholar] [CrossRef]
  41. Ravel, B. ATOMS: Crystallography for the X-ray absorption spectroscopist. J. Synchrotron Radiat. 2001, 8, 314–316. [Google Scholar] [CrossRef] [Green Version]
  42. Newville, M.; Ravel, B.; Haskel, D.; Rehr, J.J.; Stern, E.A.; Yacoby, Y. Analysis of multiple-scattering XAFS data using theoretical standards. Phys. B Condens. Matter 1995, 208, 154–156. [Google Scholar] [CrossRef]
Figure 1. Pore size distribution (PSD) at different loadings of Cs.
Catalysts 11 00570 g001
Figure 2. TPR profiles of (a) 2%Pt/ZrO2, (b) 2.89%Cs-2%PtZrO2, (c) 3.87%Cs-2%Pt/ZrO2, (d) 4.80%Cs-2%Pt/ZrO2, (e) 5.78%Cs-2%Pt/ZrO2, (f) 7.22%Cs-2%Pt/ZrO2, (g) 10.41%Cs-2%Pt/ZrO2 and (h) 14.45%Cs-2%Pt/ZrO2.
Catalysts 11 00570 g002
Figure 3. TCD signal (black) and MS signals of (red) H2, (blue) CO, and (green) CO2 during temperature-programmed reduction in 10%H2/Ar for (a) 2%Pt/ZrO2, (b) 2.89%Cs-2%Pt/ZrO2, (c) 3.87%Cs-2%Pt/ZrO2, (d) 4.80%Cs-2%Pt/ZrO2, (e) 5.78%Cs-2%Pt/ZrO2, (f) 7.22%Cs-2%Pt/ZrO2, (g) 10.41%Cs-2%Pt/ZrO2 and (h) 14.45%Cs-2%Pt/ZrO2.
Catalysts 11 00570 g003
Figure 4. DRIFTS spectra of carbonate decomposition during activation for (a) 2%Pt/ZrO2, (b) 2.89%Cs-2%Pt/ZrO2, (c) 3.87%Cs-2%Pt/ZrO2, (d) 4.80%Cs-2%Pt/ZrO2, (e) 5.78%Cs-2%Pt/ZrO2, (f) 7.22%Cs-2%Pt/ZrO2, (g) 10.41%Cs-2%Pt/ZrO2 and (h) 14.45%Cs-2%Pt/ZrO2.
Catalysts 11 00570 g004
Figure 5. (left) Tabulated values of the % of Gaussian fitting peaks in low, moderate, and high temperature ranges. TPD-MS profiles of adsorbed CO2 (m/z = 44) and fittings with seven Gaussian peaks, including (a) 2%Pt/ZrO2, (b) 2.89%Cs-2%Pt/ZrO2, (c) 3.87%Cs-2%Pt/ZrO2, (d) 4.80%Cs-2%Pt/ZrO2, (e) 5.78%Cs-2%Pt/ZrO2, (f) 7.22%Cs-2%Pt/ZrO2, (g) 10.41%Cs-2%Pt/ZrO2 and (h) 14.45%Cs-2%Pt/ZrO2.
Catalysts 11 00570 g005
Figure 6. EXAFS fittings, including (a) raw k1-weighted χ(k) data, (b) (solid line) filtered k1-weighted χ(k) data and (filled circles) results of the fittings, (c) raw and (d) filtered k1-weighted Fourier transform magnitude (solid line) data and (filled circles) results of the fittings for (I) Pt0 foil, (II) 2%Pt/m-ZrO2, and 2%Pt/m-ZrO2 with (III) 2.89%Cs, (IV) 4.80%Cs, (V) 5.78%Cs (VI) 10.41%Cs and (VII) 14.45%Cs.
Catalysts 11 00570 g006
Figure 7. XANES spectra at the Pt (solid line) L-3 edge and (dashed) line L-2 edge, as well as (dash-dotted line) the L3–L2 difference spectra of (a) 2%Pt/ZrO2, (b) 2.89%Cs-2%Pt/ZrO2, (c) 4.80%Cs-2%Pt/ZrO2, (d) 5.78%Cs-2%Pt/ZrO2, (e) 10.41%Cs-2%Pt/ZrO2, (f) 14.45%Cs-2%Pt/ZrO2, and (g) overlays of L3–L2 difference spectra, showing an increase in intensity with Cs loading. No evidence for e transfer to Pt from Cs was found, which should result in an opposite trend.
Catalysts 11 00570 g007
Figure 8. H2-TPR-XANES spectra in 100 mL/min H2 flow at the Pt L-3 edge (11,564 eV) of (a) 2%Pt/ZrO2, (b) 2.89%Cs-2%Pt/ZrO2, (c) 4.80%Cs-2%Pt/ZrO2, (d) 5.78%Cs-2%Pt/ZrO2, (e) 10.41%Cs-2%Pt/ZrO2, and (f) 14.45%Cs-2%Pt/ZrO2.
Catalysts 11 00570 g008
Figure 9. H2-TPR-EXAFS spectra in 100 mL/min H2 flow at the Pt L-3 edge (11,564 eV) of (a) 2%Pt/ZrO2, (b) 2.89%Cs-2%Pt/ZrO2, (c) 4.80%Cs-2%Pt/ZrO2, (d) 5.78%Cs-2%Pt/ZrO2, (e) 10.41%Cs-2%Pt/ZrO2, and (f) 14.45%Cs-2%Pt/ZrO2.
Catalysts 11 00570 g009
Figure 10. Absorbance of the formate ν(CH) band region normalized to height of band on 2%Pt/ZrO2, including: (a) 2%Pt/ZrO2, (b) 2.89%Cs-2%PtZrO2, (c) 3.87%Cs-2%Pt/ZrO2, (d) 4.80%Cs-2%Pt/ZrO2, (e) 5.78%Cs-2%Pt/ZrO2, (f) 7.22%Cs-2%Pt/ZrO2, (g) 10.41%Cs-2%Pt/ZrO2 and (h) 14.45%Cs-2%Pt/ZrO2.
Catalysts 11 00570 g010
Figure 11. Formate decomposition in steam at 130 °C, including (gray) 2%Pt/ZrO2, (cyan) 2.89%Cs-2%PtZrO2, (green) 3.87%Cs-2%Pt/ZrO2, (purple) 4.80%Cs-2%Pt/ZrO2 (pink) 5.78%Cs-2%Pt/ZrO2, (red) 7.22%Cs-2%Pt/ZrO2, (orange) 10.41%Cs-2%Pt/ZrO2, and (yellow) 14.45%Cs-2%Pt/ZrO2.
Catalysts 11 00570 g011
Figure 12. (left) Absorbance of the ν(CO) on the Pt surface band region, including: (a) 2%Pt/ZrO2, (b) 2.89%Cs-2%PtZrO2, (c) 3.87%Cs-2%Pt/ZrO2, (d) 4.80%Cs-2%Pt/ZrO2, (e) 5.78%Cs-2%Pt/ZrO2, (f) 7.22%Cs-2%Pt/ZrO2, (g) 10.41%Cs-2%Pt/ZrO2 and (h) 14.45%Cs-2%Pt/ZrO2. (Right) Cesium (orange) distribution near platinum (dark gray) on the catalyst surface (blue) depending on the loading: (top left) no alkali, (top right) low cesium loading, (bottom left) optimal cesium loading, and (bottom right) excessive cesium loading.
Catalysts 11 00570 g012
Figure 13. Response of the CO2 gas phase band in steam at 130 °C, including (gray) 2%Pt/ZrO2, (cyan) 2.89%Cs-2%Pt/ZrO2, and (pink) 5.78%Cs-2%Pt/ZrO2.
Catalysts 11 00570 g013
Figure 14. Response of the Pt-CO band in steam at 130 °C, including (gray) 2%Pt/ZrO2, (cyan) 2.89%Cs-2%PtZrO2, (green) 3.87%Cs-2%Pt/ZrO2, (purple) 4.80%Cs-2%Pt/ZrO2 (pink) 5.78%Cs-2%Pt/ZrO2, (red) 7.22%Cs-2%Pt/ZrO2, (orange) 10.41%Cs-2%Pt/ZrO2, and (yellow) 14.45%Cs-2%Pt/ZrO2.
Catalysts 11 00570 g014aCatalysts 11 00570 g014b
Figure 15. DRIFTS spectra taken (bottom) before and (top) after formate decomposition in steam, including (a) 2%Pt/ZrO2, (b) 2.89%Cs-2%PtZrO2, (c) 3.87%Cs-2%Pt/ZrO2, (d) 4.80%Cs-2%Pt/ZrO2, (e) 5.78%Cs-2%Pt/ZrO2, (f) 7.22%Cs-2%Pt/ZrO2, (g) 10.41%Cs-2%Pt/ZrO2 and (h) 14.45%Cs-2%Pt/ZrO2.
Catalysts 11 00570 g015aCatalysts 11 00570 g015b
Figure 16. Response of the (left) formate ν(CH) band region, (middle) ν(CO) stretching bands of the Pt-CO region, and (right) the ν(OCO) region of formates/carbonates in dry helium flow at 130 °C, including (a, gray) 2%Pt/ZrO2 and (b, pink) 5.78%Cs-2%Pt/ZrO2. In the right portion of the figure, upper lines show DRIFTS after dry helium flow, while lower lines show DRIFTS prior to dry helium flow. H2O, excluded from many DFT studies, clearly impacts both the rate and selectivity of the formate decomposition step.
Catalysts 11 00570 g016
Figure 17. TPD-MS profiles of H2 (m/z = 2) evolved from formate decomposition in co-adsorbed water, including (a) 2%Pt/ZrO2, (b) 2.89%Cs-2%PtZrO2, (c) 3.87%Cs-2%Pt/ZrO2, (d) 4.80%Cs-2%Pt/ZrO2, (e) 5.78%Cs-2%Pt/ZrO2, (f) 7.22%Cs-2%Pt/ZrO2, (g) 10.41%Cs-2%Pt/ZrO2 and (h) 14.45%Cs-2%Pt/ZrO2.
Catalysts 11 00570 g017
Figure 18. CO conversion vs. time on stream during LT-WGS for the prepared catalysts (26.1%H2O, 2.9%CO, 29.9%H2, 4.3%N2, 36.8% He, P = 1 atm, SV = 167,638 Ncc/h∙gcat).
Catalysts 11 00570 g018
Figure 19. Stability test on 0.72%Cs-promoted and unpromoted Pt/ZrO2 at similar CO conversion (T = 300 °C, P = 1 atm, 26.1%H2O, 2.9%CO, 29.9%H2, 4.3%N2, 36.8% He).
Catalysts 11 00570 g019
Table 1. Surface area, porosity, and average pore diameter for prepared catalysts.
Sample IDExpected AS
Assuming No Pore Blocking
[m2/g]
Measured
AS (BET)
[m2/g]
Difference between Expected & Measured
[m2/g]
VP (BJH Des)
[cm3/g]
DP (BJH Des)
[Å]
ZrO2 95.4 0.28995
2%Pt/ZrO293.289.63.60.27296
0.72%Cs-2%Pt/ZrO292.588.54.00.25993
1.45%Cs-2%Pt/ZrO291.784.67.10.24992
2.17%Cs-2%Pt/ZrO291.085.35.70.24692
2.89%Cs-2%Pt/ZrO290.386.63.70.25191
3.87%Cs-2%Pt/ZrO289.386.82.50.25689
4.80%Cs-2%Pt/ZrO288.378.79.60.23889
5.78%Cs-2%Pt/ZrO287.374.113.20.22991
7.22%Cs-2%Pt/ZrO285.969.116.80.21193
10.41%Cs-2%Pt/ZrO282.762.120.60.19794
14.45%Cs-2%Pt/ZrO278.654.923.70.17797
Table 2. EXAFS fittings* for Pt L-3 edge data for catalysts following reduction in 100% flowing H2 (100 mL/min) at 350 °C for 2 h (1 °C/min ramp rate) and cooling. Ranges: Δk = 3–10 Å−1; ΔR = 1.85–3.25 Å. S02 was fixed at 0.90 as a first approximation.
Sample DescriptionN
Pt-Pt
Metal
R
Pt-Pt (Å)
Metal
e0
(eV)
σ2
2)
r-FactorEst.
Number of Atoms *
Est. Diam. (nm) */**Est. % Disp. (%)
Pt0 foil122.7668.990.005370.0094---
(fixed)(0.0061)(0.657)(0.00045)
2%Pt/m-ZrO25.22.6814.700.0100.0062130.86
0.78
92
(0.44)(0.0090)(0.612)(0.00143)
2.89%Cs-2%Pt/m-ZrO25.32.7096.150.009050.0041130.87
0.79
92
(0.36)(0.0069)(0.471)(0.00110)
4.80%Cs-2%Pt/m-ZrO26.32.7256.550.007970.0031221.0
0.93
87
(0.36)(0.0057)(0.397)(0.00090)
5.78%Cs-2%Pt/m-ZrO26.92.7427.110.006600.0054311.1
1.0
84
(0.51)(0.0070)(0.507)(0.00110)
10.41%Cs-2%Pt/m-ZrO28.22.7558.320.004740.00089821.5
1.4
73
(0.24)(0.0026)(0.200)(0.00041)
14.45%Cs-2%Pt/m-ZrO28.02.7547.380.005940.0067681.4
1.3
77
(0.67)(0.0076)(0.560)(0.00119)
* Estimated from Jentys [29] assuming a spherical cluster morphology. ** Estimated from Marinkovic et al. [30].
Table 3. Formate ν(CH) band region and other relevant vibrational positions upon CO adsorption using the assignments of Binet et al. [32]. Note that ν(OH) are negative bands and that carbonate bands were obtained after formate decomposition. Bold indicates strong bands, while shoulders and weak bands are included in parentheses.
CatalystBand Position (cm−1)
ν(CH)δ(CH) + νs(OCO)2δ(CH)ν(OCO) Formateν(OCO) Carbonateν(OH)
2%Pt/ZrO2 (reference)28682973, (2961), 2931(2752) 2742
2732
sy 1386, 1360
asy 1577 (1550)
(1613), 1562, 1471, 1437; (1387), 1350(3758), 3727, 3674, (3650)
2.89%Cs-2%Pt/ZrO22849 28162972 2935, (2921)2763
2720
2686
sy 1372, 1341, 1330, 1286
asy (1640, 1611) 1590
1642, (1620, 1567, 1525, 1475); (1331), 1321, (1285)(3718), 3669
3.87%Cs-2%Pt/ZrO22829
2839
2848
2973, 29342762
2724
2683
sy (1374) 1341, (1328, 1278)
asy 1641, (1612, 1595)
(1677), 1643, (1587, 1565), (1512–1476); (1378) 1337, 1278(3755), 3725, (3678), 3665
4.80%Cs-2%Pt/ZrO22811
(2837)
29302748
2704
2663
sy (1377, 1363) 1345 (1331)
asy (1658, 1640) 1634, 1592
(1681, 1661), 1648, (1639), (1580), 1573, (1566–1538), (1498–1436); 1351, 1342 (1330, 1318), (1284) 1276, (1265)(3722), 3673, 3655
5.78%Cs-2%Pt/ZrO2274829272702
2664
sy (1359) 1343, (1308, 1297) 1287, (1254)
asy 1630, (1619, 1604, 1562)
(1679) 1638, (1572, 1477) (1347) 1334, (1316), 1287(3714), 3664
7.22%Cs-2%Pt/ZrO227582947, 29252706
2670
sy (1358), 1344, (1321–1296)
asy (1621), 1596, (1567–1540)
1631, 1572, 1553, (1538, 1514–1441); (1344, 1335), 1330, (1313, 1303, 1293, 1286, 1280) (3760), 3730, 3660, (3630)
10.41%Cs-2%Pt/ZrO2275829252706
2673
sy (1347), 1342, (1320–1280)
asy (1607, 1599), 1594, (1548)
16131565, 1450, (1341, 1331), 1325, (1312, 1304, 1291)(3735), 3716, 3663, (3635)
14.45%Cs-2%Pt/ZrO2(2858)
(2829)
2760
2925, (2907)(2709) 2673sy 1337 (1291)
asy 1596, (1550–1450)
-(3681), 3665, (3602)
Table 4. Dispersion and initial Pt-CO band magnitude relative to 2%Pt/ZrO2.
Sample IDDispersion Relative to 2%Pt/ZrO2 Calculated from EXAFS FittingsInitial Pt-CO Magnitude Relative to 2%Pt/ZrO2
2%Pt/ZrO211
2.89%Cs-2%Pt/ZrO210.96
3.87%Cs-2%Pt/ZrO2-1.00
4.80%Cs-2%Pt/ZrO20.951.11
5.78%Cs-2%Pt/ZrO20.910.82
7.22%Cs-2%Pt/ZrO2-0.71
10.41%Cs-2%Pt/ZrO20.790.19
14.45%Cs-2%Pt/ZrO20.840.06
Table 5. CO conversion and CO2 selectivity at steady-state condition for the tested catalysts.
Sample IDT.o.S.
(h)
Temperature
(°C)
CO Conversion
(%)
CO2 Selectivity
(%)
2%Pt/ZrO26.330083.1100
12.628556.6100
19.626032.0100
0.72%Cs-2%Pt/ZrO25.930063.9100
12.228547.2100
19.226025.3100
1.45%Cs-2%Pt/ZrO25.930062.7100
12.628544.4100
19.226024.1100
2.17%Cs-2%Pt/ZrO25.930051.1100
12.228535.5100
18.926018.5100
2.89%Cs-2%Pt/ZrO25.9530035.7100
11.928523.7100
18.226012.7100
3.87%Cs-2%Pt/ZrO26.330030.4100
12.628522.2100
19.926012.6100
5.78%Cs-2%Pt/ZrO25.630021.8100
12.628515.8100
17.92608.7100
10.41%Cs-2%Pt/ZrO25.9530019.6100
12.228517.8100
18.92609.1100
14.45%Cs-2%Pt/ZrO25.930015.6100
12.628512.6100
18.92606.0100
Publisher’s Note: MDPI stays neutral with regard to jurisdictional claims in published maps and institutional affiliations.

